Article

Study on the Influence of Temperature Distribution in Thermite Plugging Abandoned Well Technology

1
State Key Laboratory of Oil and Gas Reservoir Geology and Exploitation, Southwest Petroleum University, Chengdu 610500, China
2
Petroleum Engineering School, Southwest Petroleum University, Chengdu 610500, China
3
China Oilfield Services Limited, Tianjin 300459, China
*
Author to whom correspondence should be addressed.
Energies 2025, 18(11), 2941; https://doi.org/10.3390/en18112941
Submission received: 11 May 2025 / Revised: 26 May 2025 / Accepted: 27 May 2025 / Published: 3 June 2025
(This article belongs to the Section H1: Petroleum Engineering)

Abstract

:
With the intensive development of oil and gas resources leading to a rapid increase in abandoned wells, sealing failures may cause oil and gas leakage and environmental pollution. Systematically investigating the temperature distribution patterns of thermite melting in open-hole abandoned wells under various factors is critical for effective plugging. This study overcomes the limitations of traditional single heat conduction models by integrating thermite reaction kinetics, phase change latent heat, and thermal–fluid–solid multi-field coupling effects, establishing a thermal–fluid–solid coupling model for thermite melting in open-hole abandoned wells. This model provides theoretical guidance for the effectiveness of plugging operations and temperature control during operations. The model was validated through thermite melting experiments: the simulated expansion of the sandstone borehole diameter was 9.8 mm, with a 5.5% error compared to the experimental value of 9.29 mm; and the simulated axial extension at the well bottom was 18.9 mm, with a 4.7% error compared to the experimental value of 17.19 mm, confirming the model’s accuracy. The influence of different lithologies and initial downhole temperatures on the temperature distribution in the open-hole section of abandoned wells under identical conditions was analyzed. The results show that the ultimate melting thicknesses of dolomite, limestone, and granite are 0.0354 m, 0.0350 m, and 0.0234 m, respectively, indicating superior plugging effects in dolomite and limestone. In the initial reaction stage (stage a), the phase change thickness of limestone exceeded that of dolomite by 59.78%, demonstrating better thermite melting and sealing efficacy in limestone. Additionally, model analysis reveals that the initial downhole temperature has a minimal impact on the temperature distribution of thermite melting in open-hole abandoned wells.

1. Introduction

In recent years, with national development, the increasing demand for energy has led to intensified extraction efforts, resulting in numerous wells reaching their production and economic life limits. To prevent oil and gas leakage from polluting the ecological environment, wells without oil and gas indications require Plug and Abandonment (P&A) operations [1,2]. P&A operations for abandoned wells represent the final stage in the life cycle of oil and gas well construction, production, and decommissioning [3,4]. As shown in Figure 1, in terms of environmental safety risks, if the sealing is improper or the sealing system fails, the oil and gas in the abandoned well will continuously accumulate and contaminate the surrounding ecosystem along the failure interface, causing irreversible harm [5].
Plug and Abandonment (P&A) operations for abandoned wells often employ Portland cement and mechanical bridge plugs as sealing materials. However, these materials exhibit multiple limitations, and leakage has already occurred in some sealed abandoned wells. For instance, Carroll et al. [6] validated the mechanical integrity of cement plugs by injecting CO2 into sealed abandoned wells over extended periods. After 30 years of CO2 injection, core samples extracted by Carey et al. revealed leakage channels in the casing cement, casing–cement interfaces, and annular cement, as illustrated in Figure 2. Concurrently, failed well-plugging incidents have also been observed in China’s Bohai Oilfield, attributed to a high sulfur content and annular pressure [2,7]. To address the limitations of existing P&A technologies, thermite-based plugging and abandonment (TP&A) technology has been proposed in this field [8]. Regarding TP&A research, Vrålstad et al. [9] emphasized solutions for establishing permanent well barriers, conducted comparative analyses of Portland cement and other potential sealing materials, and highlighted thermite-based well abandonment as a novel research direction. Souza et al. [10] modeled and simulated ordinary hematite–thermite reactions to predict temperature profiles and radial combustion velocities in centrally ignited thin discs. They solved species balance and energy conservation equations in one-dimensional space using the finite difference method, considering no species migration and a single-step mechanism. Pena et al. [11,12] investigated thermite-based heat transfer by defining spatially and temporally dependent thermal flux distributions to validate casing and cement melting capabilities and further established a numerical model integrating thermite reaction kinetics and phase change dynamics to optimize production tubing melting efficiency through strategic mixture compaction and alumina dilution. Magalhães et al. [13] introduced an advanced seven-point finite difference scheme to evaluate the feasibility of thermite-induced thermal fields in melting multi-layered geometric configurations. de Souza et al. [14] conducted a kinetic investigation of the Fe2O3-Al thermite reaction using differential scanning calorimetry (DSC) across multiple heating rates, identifying two distinct exothermic stages and analyzing activation energy variations to propose multi-step reaction mechanisms. de Andrade et al. [15,16] proposed a homogenized finite integral transform framework to analyze transient heat conduction in thermal plug and abandonment (TP&A), demonstrating that thermite-driven melting of production tubing satisfies critical thresholds for cement sealing, while a hybrid analytical–numerical approach integrating the Separation of Variables Method and Duhamel’s theorem simulated transient heat transfer in P&A operations, validated for reliability through commercial software. In summary, existing TP&A studies worldwide have neglected analyses of temperature distribution characteristics and influencing factors in abandoned wellbores under phase change reactions during heat transfer and the thermal–fluid–solid coupling effects of downhole materials. Additionally, the mathematical and physical models employed ignore the dependence of phase change material latent heat on temperature and phase transitions, while overlooking fluid–solid heat loss during thermal conduction by exclusively adopting solid heat conduction models. Consequently, current research on thermite melting mechanisms in TP&A technology lacks practical relevance and accuracy. Therefore, theoretical investigations into temperature dynamics during thermite reactions in abandoned wellbores are imperative.
According to the principle of TP&A technology, this technology first utilizes the heat transfer released by the aluminothermic reaction in the abandoned wellbore to cause phase transformation in the downhole materials. The materials after phase transformation may invade the materials with cracks and pore defects, or the substances of the phase transformation materials may interpenetrate each other. After cooling and consolidation, they form materials with composite structures or composite materials, forming sealing materials with long-term integrity to complete P&A operations.
Existing models often fail to simultaneously consider the variation in phase change latent heat with temperature and fluid–solid heat loss. To address this, this study first constructs a transient thermal–fluid–solid coupled model for open-hole abandoned wellbores based on the interaction between thermite reaction kinetics and phase change latent heat, integrated with the coupling mechanism of fluid–solid heat loss. Subsequently, the finite difference method was applied to spatially and temporally discretize and solve the system of partial differential equations governing the temperature distribution models of individual computational units. Then, exploratory experiments on thermite melting were conducted to validate the accuracy of the adopted thermite melting temperature model. Finally, the effects of different lithologies and initial downhole temperatures on the temperature distribution in the open-hole section of abandoned wells under identical conditions were investigated. This study provides guiding and referential significance for the application of thermite-based plugging and abandonment (TP&A) technology.

2. Aluminum Hot-Melt Model for Plugging Abandoned Wells

2.1. Basic Assumption Conditions

In establishing the transient thermal–fluid–solid coupled model for abandoned wellbores, the following fundamental assumptions have been formulated based on thermite reaction characteristics and wellbore heat transfer mechanisms, with simplifications made to facilitate this study:
(1)
The initial mixture consists of reactants Al and Fe2O3 along with air, where air is considered an inert gas occupying void spaces within the formed porous medium;
(2)
The reactant mixture is considered homogeneous, and upon Al melting, the mixture becomes compacted, with any porosity eliminated;
(3)
Fe2O3 is the reactant controlling the reaction, and all Fe2O3 is fully consumed;
(4)
Thermal contact resistance at interfaces is neglected;
(5)
The upper and lower boundaries of the computational domain are adiabatic, while lateral boundaries remain unaffected by heat conduction;
(6)
The position of the packer in the study domain will not slide or shift over time.

2.2. Heat Transfer Physical Model

The principle of thermite plugging and abandonment (TP&A) technology involves utilizing heat released by exothermic reactions to melt materials in the target zone. The subsequent cooling and solidification process achieves the sealing of the abandoned well. To ensure sealing quality and maximize phase transitions in downhole materials, the heat transfer process is modeled as a closed system. A thermite melting heat transfer physical model for open-hole section abandoned wells has been established based on heat conduction principles.
Open-hole abandoned wells refer to those that maintain the formation’s original condition without casing installation or cementing operations [17]. The thermite agent acts at the top of the open-hole section and reacts with surrounding rock formations, with its heat transfer mechanism illustrated in Figure 3.
In Figure 3, Labels 1 and 2 represent the thermal conduction and convective heat transfer mechanisms occurring between molten thermite and the formation, and Labels 3, 4, 5, and 6 represent thermal conduction within the formation along the axial direction. The Al-Fe2O3 thermite initiates an exothermic reaction upon reaching its activation temperature. This process involves intricate interactions between reaction kinetics, phase transitions, and heat transfer principles, forming a complex physicochemical process that collectively governs the evolution and distribution of temperature fields in open-hole abandoned wells. Manifestations include the following:
(1)
Intense exothermic reactions of Al-Fe2O3 in the open-hole section release substantial heat under reaction kinetics;
(2)
The released heat, governed by thermodynamic principles, first elevates the internal temperature of the Al-Fe2O3 thermite mixture, inducing phase transitions, while simultaneously initiating heat exchange with the surrounding formation;
(3)
During the exothermic reaction process, the Al-Fe2O3 thermite before and after the phase change continuously exchanges heat with the surrounding strata. Meanwhile, there are also conditions for phase change in the surrounding strata, thereby interacting with the surrounding materials.

2.3. Governing Equations of the Model

This study follows the first law of thermodynamics, which states that the change in system energy per unit time equals the energy entering the system [18]. The transient behavior of reaction temperature can be simulated by solving energy equations for heat transfer in two-dimensional radial and axial domains [19,20,21,22]. The fundamental equation is expressed as
2 T ( x , y , t ) + 1 k g ( x , y , t ) = 1 α T T ( x , y , t ) t
where
T(x,y,t): Temperature function, °C;
k: Thermal conductivity, W/(m·K);
ρ: Density, kg/m3;
c: Specific heat capacity, J/(kg·K);
αT: Thermal diffusivity, αT = k/ρc, m2/s;
2: Laplacian operator in Cartesian coordinates;
G(x, y, t): Heat source term, J/(m3·s).

2.3.1. Thermite Reaction Kinetic Equation

For the internal heat source term in the open-hole section of abandoned wells, considering that the energy generated by the reaction leads to heat losses through convective heat transfer and radiation with the surrounding wellbore walls, the internal heat source term can be determined as
g ( x , y , t ) = Q reac r k U sa T T sa 0 + 2 σ ε T 4 T sa 0 4 / r 0
where
Qreac: Heat released per 1 kg of Fe2O3 reacting with 0.33792 kg of Al, J/kg;
rk: Chemical reaction rate of Fe2O3, mol·L−1·s−1;
Usa: Convective heat transfer coefficient at the sandstone surface, J/(m2·s·°C);
σ: Stefan–Boltzmann constant, σ = 1.380649 × 10⁻²³ J/K;
ε: Emissivity of sandstone (dimensionless, 0–1);
Tsa0: Initial temperature of sandstone, °C;
r0: Wellbore radius of the open-hole abandoned well section, m.
The consumption rate of Fe2O3 is expressed as
r k = W A 0 Ψ A A F e E A / R T ( 1 η )
where
WA0: Initial mass concentration of Fe2O3, 0.7474 kg/m3;
ΨA0: Stoichiometric coefficient of Fe2O3 mass, −1;
R: Ideal gas constant, 8.314462618 J/(mol·K);
AF: Pre-exponential factor, 2.2 × 10⁶ s−1;
EA: Activation energy, 158 kJ/mol;
η: Extent of chemical reaction based on Fe2O3 consumption (dimensionless, 0–1).
The heat released by the reaction system is
Q reac = H reac Δ h s
where
hs: Sensible enthalpy change in products from standard temperature to product temperature, J/kg;
Hreac: Enthalpy of combustion for consumed Fe2O3 under standard conditions, Hreac = 5,323,911.03 J/kg.

2.3.2. Heat Conduction Equation with Phase Change

The phase change process in the fluid–solid coupling model is implemented using the enthalpy–porosity method, where the volume fraction of the liquid phase in grid cells is represented by the “liquid fraction”. The phase change mechanism is associated with all computational cells within the domain rather than being restricted exclusively to the melting interface [23]. Based on the above assumptions, it can be concluded that when the material solidifies, it will become compacted, and the porosity will be 0. Therefore, the energy equation governing transient heat conduction in sandstone, incorporating phase change, can be formulated as [24,25]
t ( ρ sa H sa ) = ( k sa T sa )
H sa = h sa + Δ H sa
where
ρsa: Density of sandstone, kg/m3;
t: Time, s;
ksa: Thermal conductivity of sandstone, W/(m·K);
Tsa: Temperature function dependent on time and position, °C;
Hsa: Total enthalpy of sandstone material, J/kg;
hsa: Sensible enthalpy of sandstone, J/kg.
Sensible enthalpy and latent heat can be expressed as
h sa = h sa , r e f + T sa T sa , r e f c ( T sa ) d T
Δ H sa = β sa L sa , c
where
hsa,ref: Standard formation enthalpy of sandstone, J/kg;
Tsa,ref: Temperature of sandstone under standard conditions, °C;
c(Tsa): Temperature-dependent specific heat capacity of sandstone, J/(kg·K);
βsa: Liquid-phase volume fraction of sandstone (dimensionless, 0–1);
Lsa,c: Latent heat of sandstone, J/kg.
The liquid-phase volume fraction can be expressed as
β sa = Δ H sa L sa , c = 0 , T sa < T sa , solidus Δ H sa L sa , c = 1 , T sa > T sa , liquidus Δ H sa L sa , c = T sa T sa , solidus T sa , liquidus T sa , solidus , T sa , solidus < T sa < T sa , liquidus
where
Tsa,solidus: Solidus temperature of sandstone (limiting temperature for solid phase), °C;
Tsa,liquidus: Liquidus temperature of sandstone (limiting temperature for liquid phase), °C.
When βsa = 0 and βsa = 1, the sandstone is in the solid and liquid phases, respectively. Specifically,
Solid phase: Tsa < Tsa,solidus;
Liquid phase: Tsa > Tsa,liquidus;
Mixed solid–liquid phase: Tsa,solidus < Tsa < Tsa,liquidus.
Combining Equations (5)–(8) yields:
  ρ sa t ( c sa T sa ) = ( k sa T sa ) ρ sa L sa , c β sa t
The above equation describes energy conduction incorporating static phase changes, without considering motion induced by the liquid phase.

2.3.3. Thermal–Fluid–Solid Coupling Heat Conduction Equation

The temperature distribution in the thermite melting model for the open-hole section of abandoned wells is primarily influenced by the following factors: (1) energy or heat released by the thermite reaction system; (2) thermal conduction within the formation; and (3) heat loss from convective heat transfer between thermite melt products and the formation. Therefore, the thermal–fluid–solid coupled heat conduction equation for the open-hole section of abandoned wells incorporating phase changes is
2 T ( x , y , t ) x 2 + 2 T ( x , y , t ) y 2 + [ 1 k l Q reac r k U sa T T sa 0 / k l r 0 3 σ ε sa T 4 T sa 0 4 / k l r 0 ] l = 1 α T , l T ( x , y , t ) t
where
l: Represents different materials, such as thermite and sandstone;
σ: Stefan–Boltzmann constant, σ = 5.67 · 10−8 w/(m2·K4);
Usa: Convective heat transfer coefficient at the sandstone surface, W(m2·K);
εsa: Emissivity of the thermite mixture (dimensionless, 0–1).

2.3.4. Auxiliary Equations

(1)
Thermochemical Properties of Thermite Mixture
The thermochemical properties of the Al/Fe2O3 mixture—including heat capacity (cthermite), density (ρthermite), thermal conductivity (kthermite), and emissivity (εthermite) at constant pressure—are calculated using mixing rules [20].
c thermite = i w i c i
ρ thermite = i v i ρ i
ε thermite = i v i ε i
k thermite = i k i v i + i v i k i 2
k Air , serial = k Air + 4 σ ε Air T 3 v Air Δ r
where
i: Material properties;
w: Mass fraction;
v: Volume fraction;
cthermite: Specific heat capacity of the Al/Fe2O3 mixture at constant pressure, J/(kg·°C);
ρthermite: Density of the Al/Fe2O3 mixture, kg/m3;
kthermite: Thermal conductivity of the Al/Fe2O3 mixture, W/(m·°C);
KAir,serial: Equivalent thermal conductivity of air, accounting for radiation, W/(m·°C).
The model adopts the air volume fraction vAir = 0.39 obtained through measurements by Durães et al. [26], which is incorporated into the simulation. However, because the mass fraction of air is negligible compared to other components in the mixture, its impact on the overall heat capacity remains insignificant. Therefore, the heat capacity of air is disregarded in the heat capacity calculations [27].
(2)
Thermite Melting Phase Change Model
The phase change process of thermite is simulated using the apparent heat capacity method proposed by Bonacina and Comini. This approach modifies the specific heat capacity as a function of temperature to represent phase change enthalpy, thereby deriving the apparent heat capacity [19]. When the phase change material enters its phase transition range, the latent heat is incorporated into the specific heat capacity. However, as the thermite requires melting at a specific phase transition temperature TF for this model to apply to phase changes [26], it is necessary to define a temperature range as follows:
T F Δ T T F T F + Δ T ( Δ T = 5 K )
The apparent specific heat capacity of each component in the thermite mixture can be simulated using the following equations:
c i ( apparent ) = c i ( T ) T < T F Δ T / T > T F + Δ T c i ( T ) + L 2 Δ T T F Δ T T T F + Δ T
where
ci(apparent): Apparent specific heat capacity of component i in the thermite mixture, J/(kg·°C);
L: Phase change enthalpy, kJ·mol−1;
T: Temperature range over which phase change occurs, K;
ci(T): Specific heat capacity of component i at temperature T, J/(kg·°C).

3. Solution Method for Thermite Melting Model

3.1. Initial and Boundary Conditions

Based on the model assumptions, the initial temperature field is considered uniformly distributed and solely influenced by the geothermal gradient. Therefore, the initial conditions applied to the study domain in the open-hole section can be defined as
T sa ( x , y , 0 ) = T s + G f y
where
Ts: Surface temperature, °C;
Gf: Geothermal gradient, 2 °C/100 m.
To enhance the realism of the computational results, boundary conditions for a semi-infinite solid are applied at the domain boundaries as follows:
lim x T sa ( x , y , 0 ) = T s + G f y
lim y T sa ( x , y , 0 ) = T s + G f y
In this study, the computational domain is modeled as a semi-infinite medium, though the actual case remains bounded. To mitigate errors arising from this approximation, energy balance conditions are applied across all boundaries:
λ T sa n n = λ T sa n n + d n
where n represents the x, y coordinates (m).
In the thermite melting model for abandoned wells, the activation of the reaction system is assumed to propagate spontaneously from a single point in a top-down manner. The activation mechanisms under actual operational conditions remain to be investigated in this study. Based on the assumption that the activation temperature of the Fe2O3-Al reaction system is 1200 °C, the initial conditions for the reaction system can be defined as
lim x 0 + lim y 0 + T thermite ( x , y , 0 ) = 1200
Thermal insulation material is placed at the upper boundary of the study domain, thereby defining the initial conditions for the thermal insulation material:
T insu ( x , y , t ) = T s + G f y
The model employed in this study is two-dimensional axisymmetric, thereby establishing the symmetry equations as
T x = 0

3.2. Mesh Generation and Model Solution

Non-uniform two-dimensional mesh discretization was employed in the computational simulations. The mesh configuration comprises 2818 domain elements and 185 boundary elements, as illustrated in Figure 4.
The thermite melting model for open-hole abandoned wells can be simulated and solved using a nonlinear two-dimensional heat diffusion equation incorporating enthalpy functions. Based on the aforementioned assumptions, a single heat diffusion equation is applied to the entire study domain, where thermal contact resistance between materials and existing internal heat sources are not considered. Considering the different material types, each region is modeled using their respective thermal properties. Thus, the partial differential equation is formulated as
x [ ( k l T x ) ] + y [ ( k l T y ) ] + g ( x , y , t ) = ρ l H t
where
T: Temperature function dependent on time and space, °C;
H: Enthalpy function, J/kg.
The enthalpy functions for different materials within the study domain are as shown in Equation (27):
H = ( 1 β l ) 0 T c s o l d T + β l T l , f T c l i q d T + β l L l
where
csol: Solid-phase specific heat capacity of a material, J/(kg·K);
cliq: Liquid-phase specific heat capacity of a material, J/(kg·K);
Tl,f: Melting temperature of a material, °C.
To enable finite difference method solutions for temperature distribution problems, the two aforementioned equations are consolidated into the following unified formulation:
2 T x 2 + 2 T y 2 + g l ( x , y , t ) k l = 1 α l T t + ω l β l t 1 k l k l T [ ( T x ) 2 + ( T y ) 2 ]
ω l = ρ l L l k l
The finite difference formulation of Equation (28) is
a w T i 1 , j n + 1 + a e T i + 1 , j n + 1 + a s T i , j 1 n + 1 + a n T i , j + 1 n + 1 a p T i , j n + 1 = b i , j
a w = a e = 1 Δ x 2
a n = a s = 1 Δ y 2
a p = a w + a e + a n + a s + 1 α l Δ t
b i , j = 1 Δ t [ T i , j n α l + ω l β i , j n + 1 β i , j n ] 1 k l k l T X i , j n + 1
X i , j p + 1 = ( T i + 1 , j , k n + 1 T i 1 , j n + 1 2 Δ x ) 2 + ( T i , j + 1 n + 1 T i , j 1 n + 1 2 Δ x ) 2
where
αw, αe, αs, αn, αp: Dimensional coefficients in the equation;
b: Source term;
Superscript n: Denotes the time step;
Subscripts i, j: Indicate Cartesian x, y coordinate grid nodes, respectively.
Voller and Shadabi [28] proposed an iterative method to determine the liquid mass fraction at each point in a one-dimensional domain. Applying this method to the two-dimensional study domain yields
a w T i 1 , j n + 1 + a e T i + 1 , j n + 1 + a s T i , j 1 n + 1 + a n T i , j + 1 n + 1 = Y i , j
C i , j = b i , j ω l Δ t f i , j n + 1
Therefore, the following formulation can be derived:
Y i , j = a p T i , j n + 1 = C i , j + ω l Δ t β i , j n + 1
The variation in the liquid mass fraction is
β i , j n + 1 = β i , j g + ξ × Z i , j , k
where
g: Interaction mass fraction index;
ξ: Relaxation factor;
Z: Correction coefficient.
The solution of nonlinear heat conduction equations shares similarities with approaches used for phase change problems:
a w T i 1 , j , k p + 1 + a e T i + 1 , j , k p + 1 + a s T i , j 1 , k p + 1 + a n T i , j + 1 , k p + 1 a p T i , j , k p + 1 = Y i , j , k
C i , j = 1 Δ t [ T i , j n α l + ω l β i , j n + 1 β i , j n ]
Substituting Equation (36) yields
Y i , j = C i , j 1 k i k i T X i , j n + 1
X i , j h + 1 = X i , j h + ς × Z i , j
Computation is terminated when the following convergence criteria are met:
X i , j h + 1 X i , j h < + ς = 10 5

4. Thermite Melting Experiments and Model Validation

The thermite melting experiment is based on the Al-Fe2O3 reaction system, where energy released by this exothermic reaction melts surrounding sandstone to form sealing material. To simulate actual wellbore dimensions, experimental sample parameters are provided in Table 1. Given the pressure buildup during the thermite reaction and experimental setup constraints, semi-confined containment and reinforcement measures were implemented on the samples to achieve optimal experimental outcomes. Prior to conducting the experimental procedure, a high-speed camera was positioned approximately 5 m away from the experimental setup. At the initiation of the experiment, it was employed to remotely record the combustion process, as illustrated in Figure 5.
From Figure 5, it can be observed that pressure variations generated by the Al-Fe2O3 reaction system under semi-confined conditions caused damage to the surrounding sandstone. Because the research focus lies on temperature field distribution, detailed variations in the pressure mechanism are not elaborated here. To examine the melting effects of the Al-Fe2O3 reaction system on sandstone boreholes, the experimental samples were sectioned. Adhered products on the inner walls of the boreholes were subsequently removed, allowing observation of radial and axial dimensional changes in the central boreholes of the sandstone. As shown in Figure 6 and Figure 7, the measurements reveal that under semi-confined conditions, the sandstone borehole diameter expanded by approximately 9.29 mm, with an axial extension of about 17.19 mm. This demonstrates that the energy released by the Al-Fe2O3 reaction system is sufficient to induce phase changes in a portion of the sandstone, enabling the mutual bonding of the materials participating in the phase transition process and forming a sealing plug within the borehole.
By establishing an exploratory experimental thermite melting physical model with environmental and physicochemical parameters identical to the experimental conditions, a computational analysis of temperature variation behavior was performed using the model’s governing equations, as shown in Figure 8 and Figure 9.
As shown in Figure 9, the simulated radial and axial melting extents of the borehole reached 4.9 mm and 18.9 mm, respectively. Because a two-dimensional axisymmetric model was employed in the simulation, the radial and axial melting extents of the borehole across the entire cross-section reached 9.8 mm and 18.9 mm, respectively. A comparison between the computational results and experimental data revealed errors of 5.5% and 4.7%, respectively. Given the non-fully-confined experimental setup and heat dissipation considerations, these errors are deemed negligible. This validates the accuracy of the temperature model established in this study.

5. Analysis of Factors Influencing Temperature Distribution in Thermite Melting

Based on the established thermite reaction equations and associated heat conduction equations, it is necessary to analyze the factors influencing temperature distribution patterns within the open-hole section of abandoned wells. This analysis aims to evaluate the effectiveness of thermite melting under varying operational parameters. The basic physical property parameters of the materials are listed in Table 2 and Table 3, while the simulated well parameters are provided in Table 4.

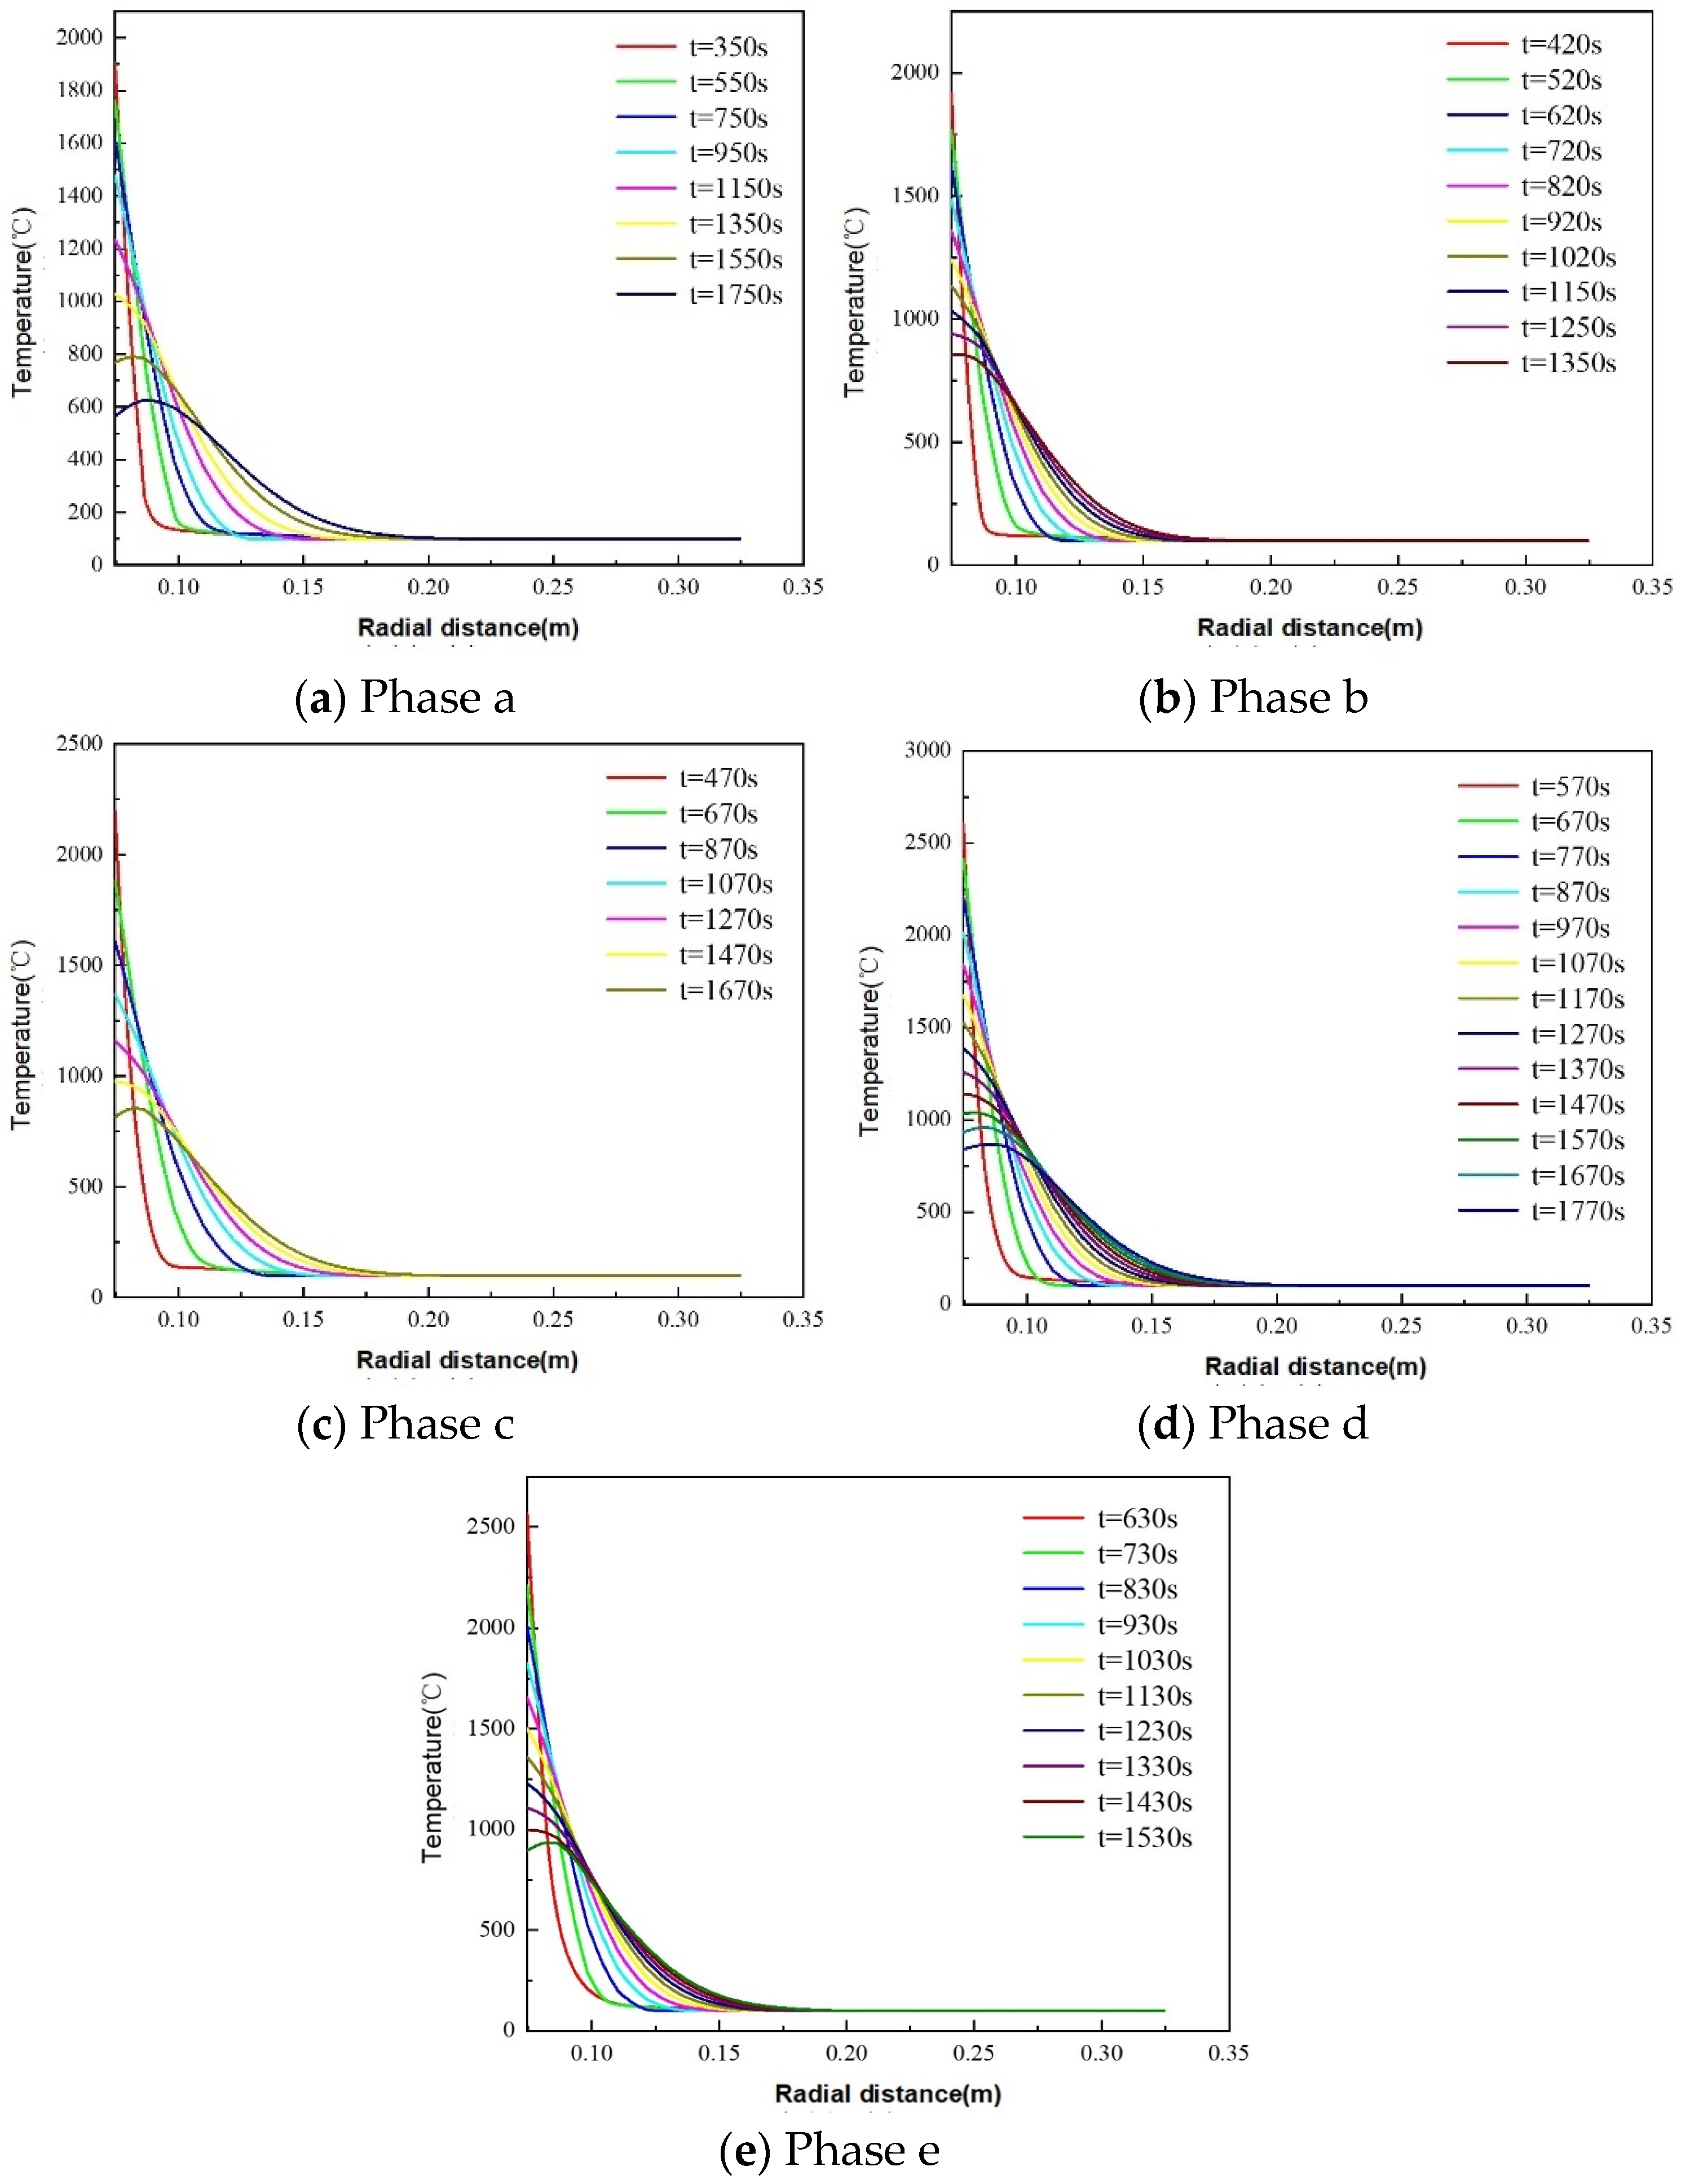
5.1. Impact of Lithology on Temperature Distribution Patterns in Thermite Melting

To investigate the impact of different rock types on thermite melting effects, three lithologies—specifically, dolomite, limestone, and granite—were selected for analysis in this section. By performing temperature calculations at various time nodes and radial distances, the temperature distribution patterns in the open-hole section of the abandoned wells were derived, enabling evaluation of thermite melting effectiveness under different variable conditions.

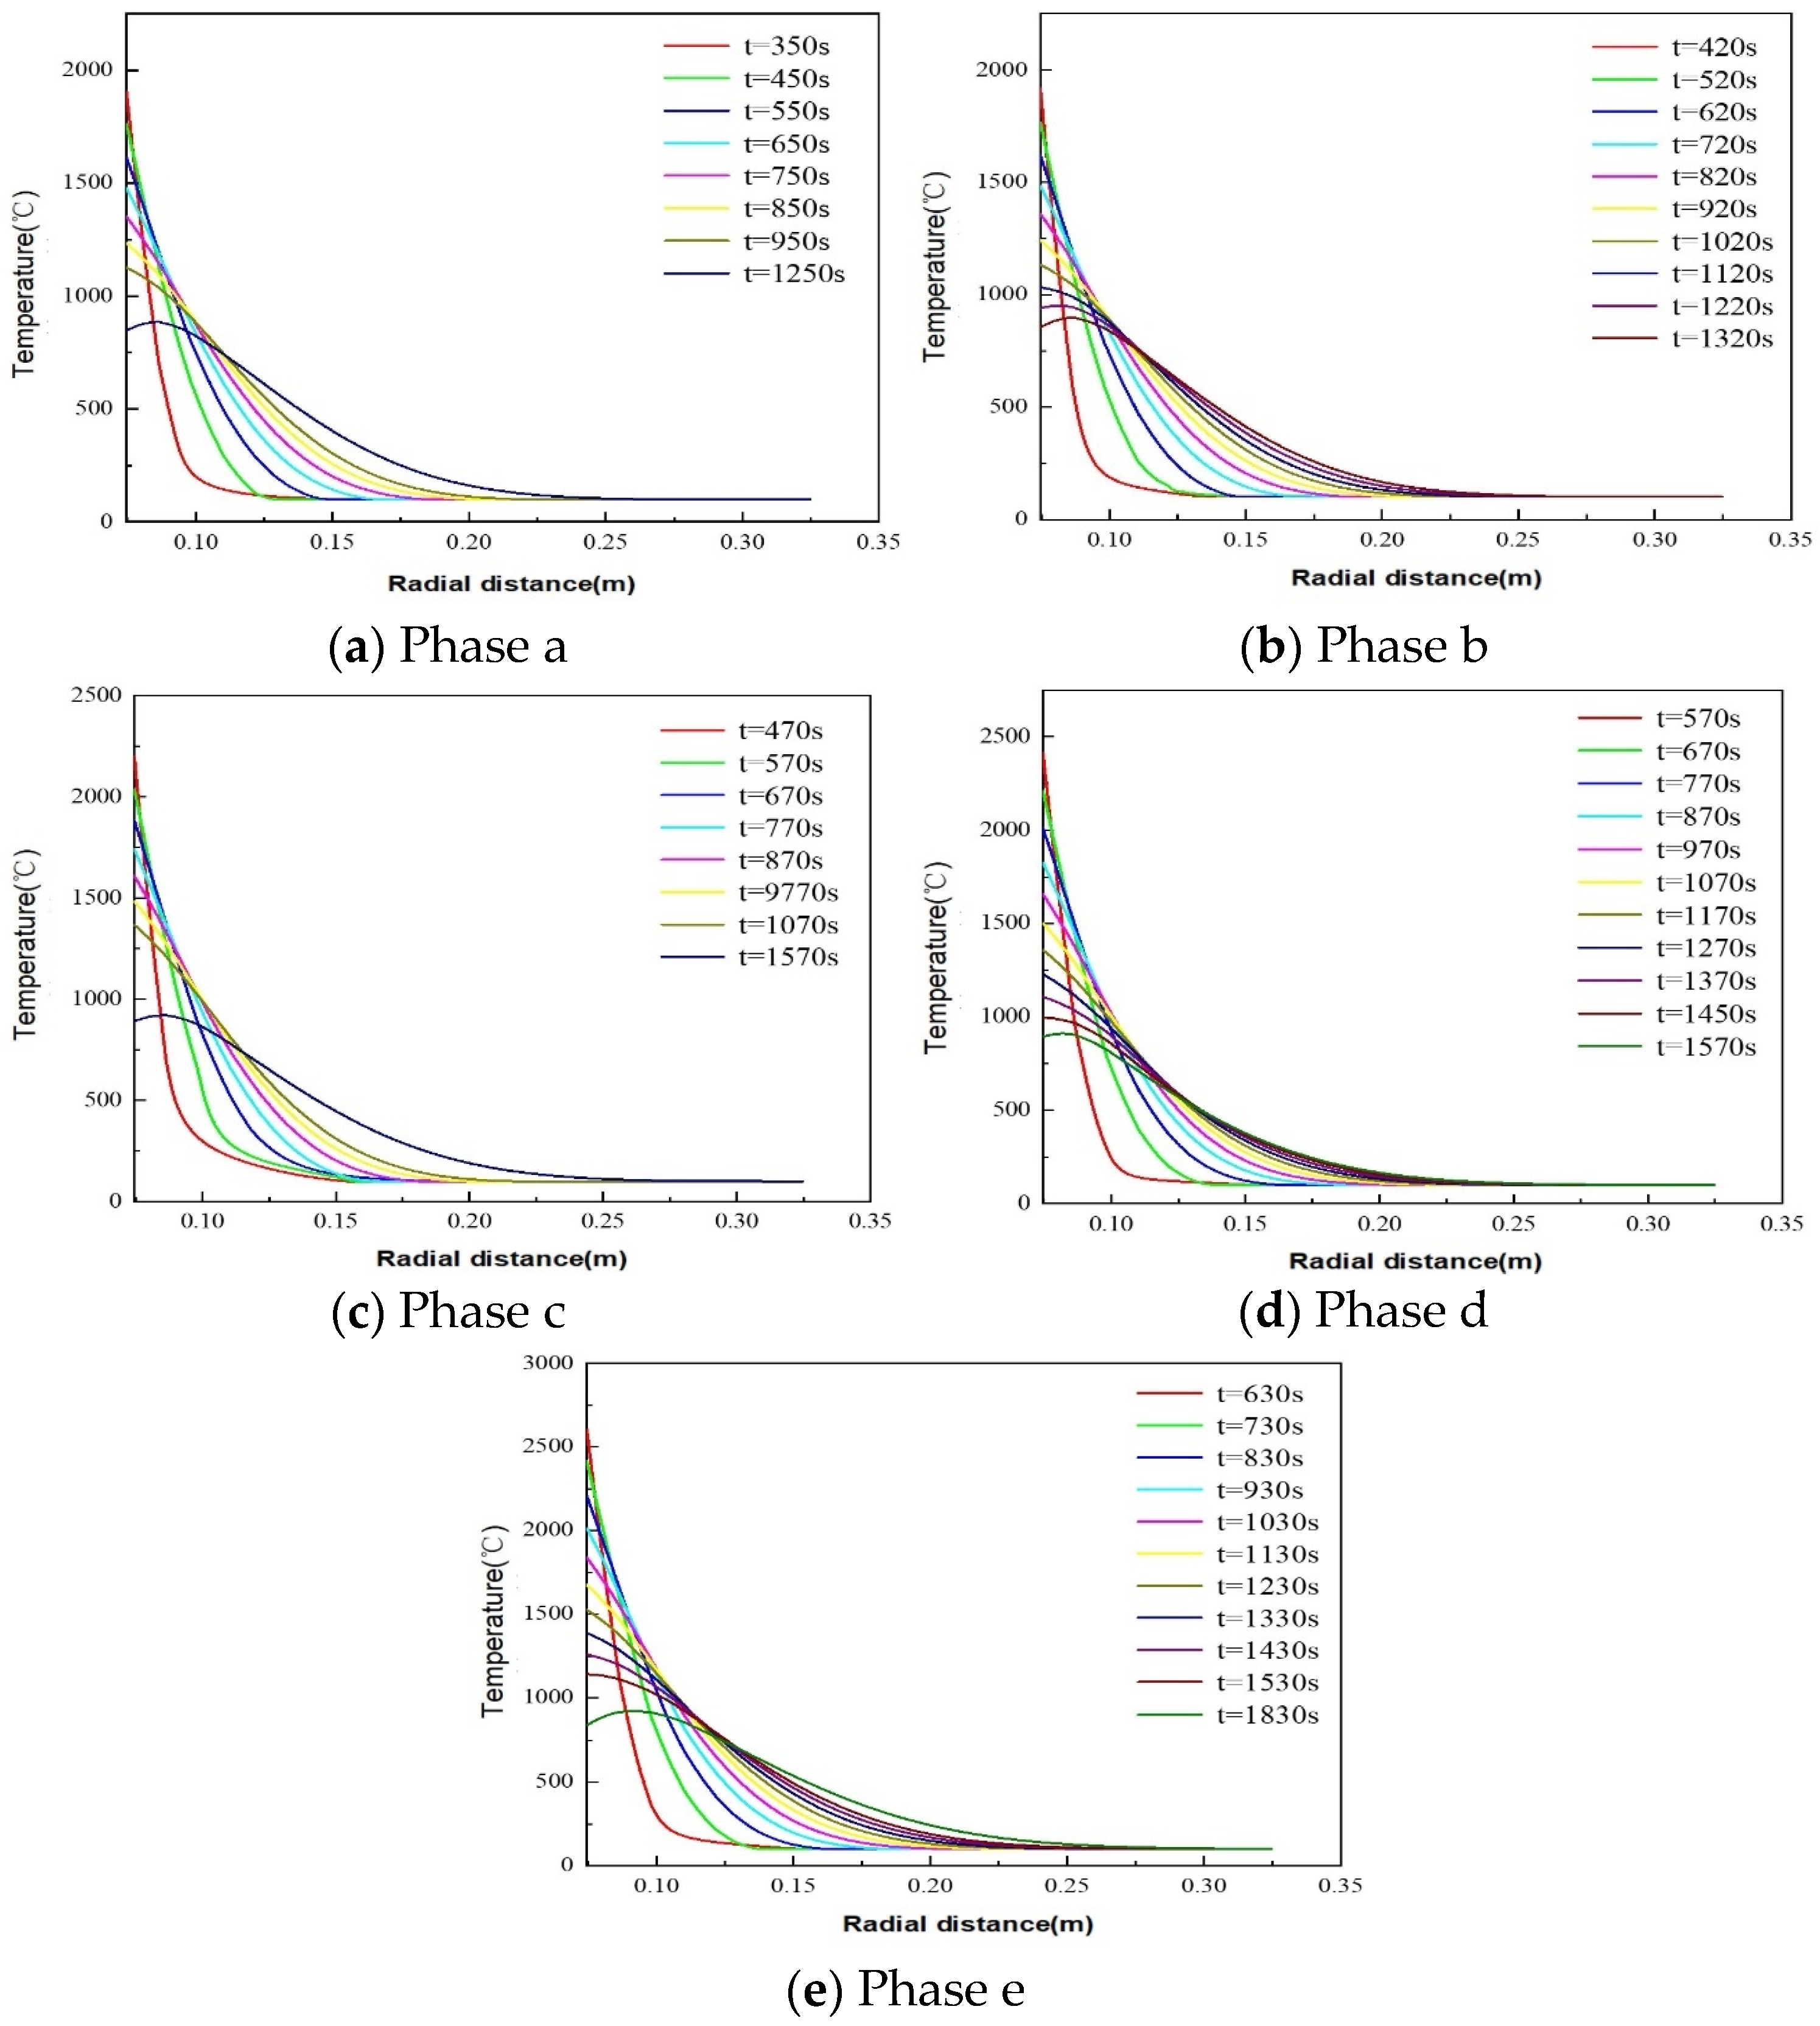
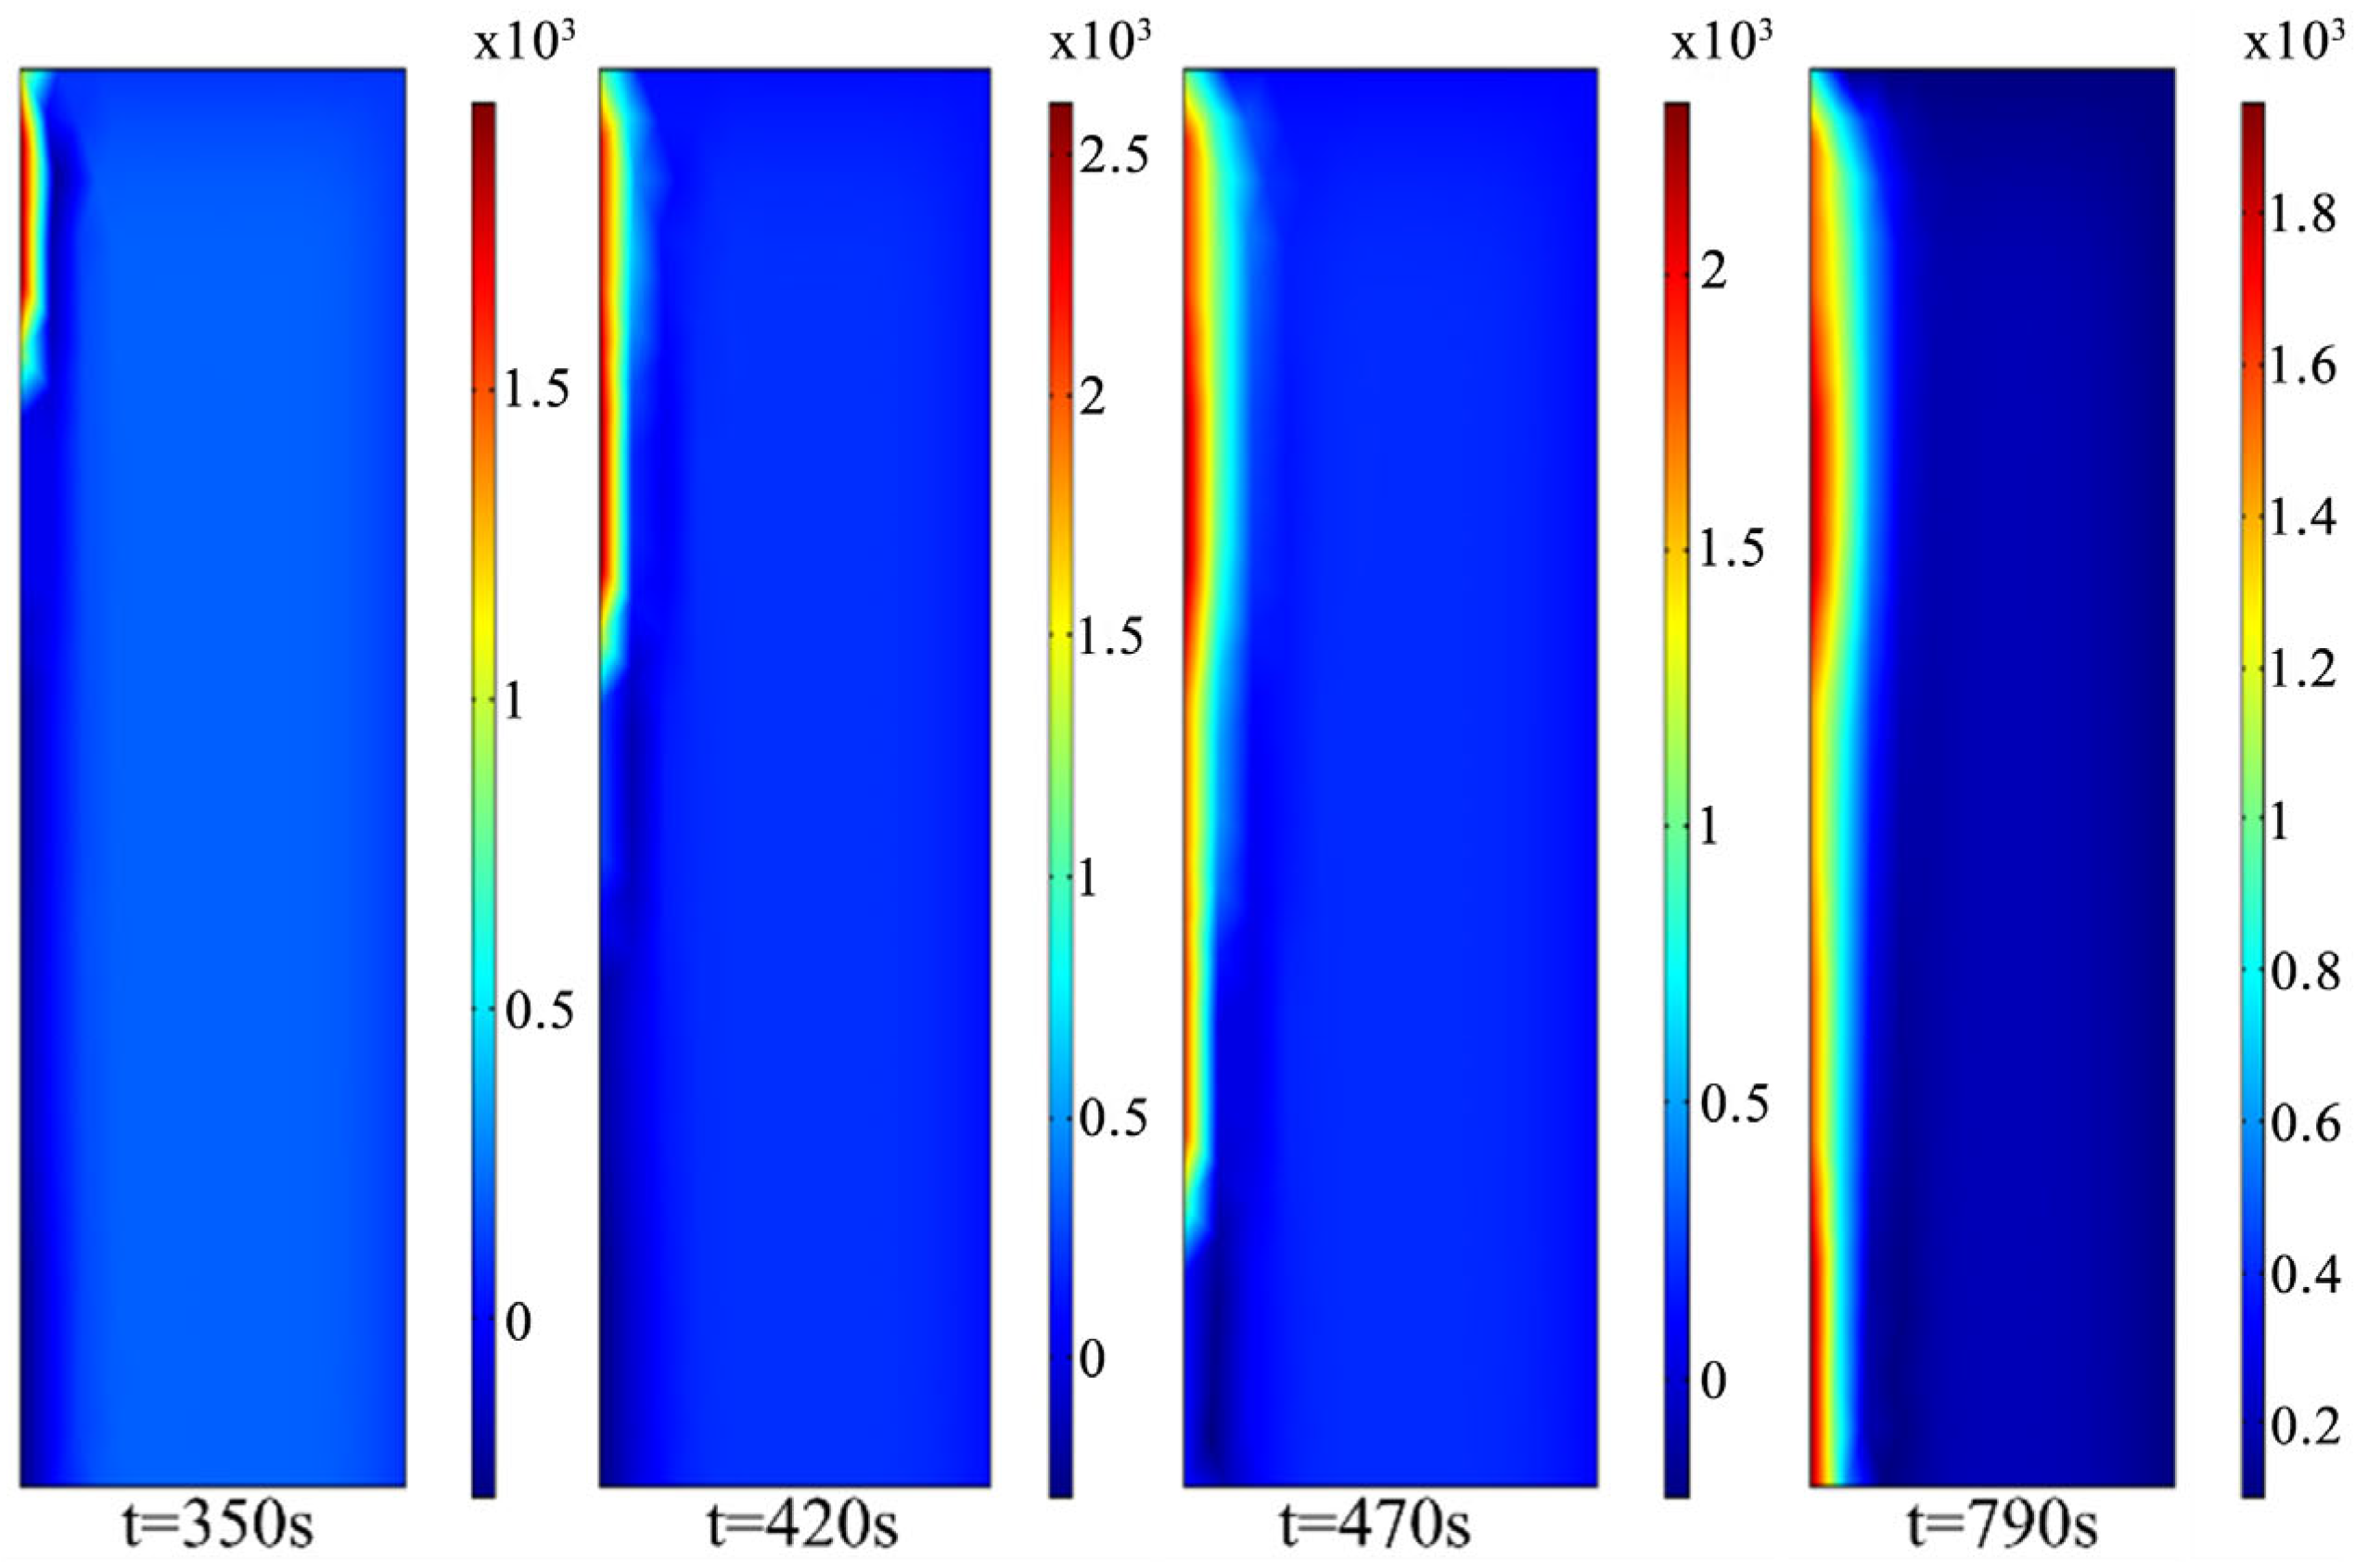
5.1.1. Thermite–Dolomite TP&A System Temperature Distribution Patterns

To thoroughly investigate the influence of lithology on thermite melting effectiveness, it is essential to analyze not only axial temperature distributions but also radial temperature profiles at varying heights within the simulated section. Therefore, five equidistantly spaced axial positions (labeled a, b, c, d, and e) were selected for radial distribution analysis, corresponding to the sequential progression of thermite reactions within the borehole.
Figure 10 and Figure 11 show the temperature distribution of dolomite in the open-hole section during thermite melting. In Figure 10 and Figure 11, the thermite melting study domain is divided into five axial sections in this section, with a positioned at the top and b, c, d, e arranged sequentially at equal intervals. In Figure 11a, the thermite melting system reaches a peak temperature of 1905 °C at 350 s. This behavior arises from constraints imposed by the thermite agent’s cross-sectional area and accumulation height within the borehole, combined with the reaction activation temperature threshold, necessitating sustained heating until reaction initiation. The temperature decline rate between distinct time intervals decreases from 1.89 °C/s to 1.51 °C/s. During this stage, the thermite reaction product Al2O3 remained in a molten state without undergoing phase transitions. This may be attributed to either the thermal insulation material placed at the top of the thermite melting study domain or the heat absorption by unactivated thermite agents and non-phase-transitioned surrounding materials during the initial reaction stage, leading to significant heat loss in phase a. Fe initiates the solidification and consolidation process around 650 s, while dolomite undergoing phase transitions begins its solidification and consolidation process at 1050 s. During this stage, the maximum phase transition thickness in dolomite measures 0.0184 m, while the maximum radial heat transfer propagation distance reaches 0.227 m.
In phase b, the peak temperature reached 1916 °C at 420 s, showing an increase of 11 °C compared to phase a, with the difference not being significant. This is primarily due to the initiated cooling and solidification of the thermite-melted Fe, while its elevated density under gravitational influence exerted negligible effects on the thermite melting efficacy in phase b. The temperature decline rate during this stage decreased from 1.5 °C/s to 0.87 °C/s. Fe initiates the solidification and consolidation process around 720 s, while dolomite undergoing phase transitions begins its solidification and consolidation process at 1120 s. During this stage, the maximum phase transition thickness in dolomite measures 0.0194 m, representing a 5% increase compared to the maximum phase transition thickness of 0.0184 m in phase a, while the maximum radial heat transfer propagation distance reaches 0.232 m.
As shown in Figure 11c, 50 s after phase b, the peak temperature in phase c reaches 2198 °C, representing a 14.72% increase compared to the preceding stage. This may be attributed to the continuous heat transfer from gravity-affected molten products in the aforementioned stages to both the molten materials and non-phase-transitioned substances in this phase, thereby enhancing the thermite melting effectiveness. The temperature decline rate during this stage decreased from 1.61 °C/s to 0.83 °C/s. Al2O3 initiates the solidification and consolidation process, while Fe begins this process around 890 s, and dolomite undergoing phase transitions starts solidification and consolidation at 1370 s. During this stage, the maximum phase transition thickness in dolomite measures 0.0254 m, representing a 30.93% increase compared to the 0.0194 m maximum phase transition thickness in phase b, while the maximum radial heat transfer propagation distance reaches 0.25 m.
As shown in Figure 11d, the peak temperature released by the reaction reaches 2413 °C at 570 s. In phase d, the temperature decline rate peaks at 2.03 °C/s and progressively decreases over time to 1.02 °C/s by 1570 s. In contrast to the temperature decline rate of dolomite at the wellbore center over time, phase d exhibits a higher temperature decline rate. This is attributed to phase d’s location within the central thermite melting zone, where heat transfer involves both phase-transitioned and non-phase-transitioned thermite agents and the wellbore wall. The elevated metal content in materials before and after phase transitions, coupled with their superior thermal conductivity, further amplifies this effect. As the reaction progresses, the phase-transitioned dolomite thickness in the radial direction measures 0.0274 m. During this phase, the molten thermite agents persist until approximately 770 s, after which Al2O3 initiates the solidification and consolidation process first, followed by Fe at 1070 s, and, finally, the phase-transitioned dolomite begins solidification and consolidation at 1450 s. Temperature distribution curves along the radial direction at different time intervals all exhibit an initially steep followed by a gradual trend. Over time, the temperature gradient near the wellbore gradually approaches zero. With 770 s as the demarcation point, a distinct reduction in the temperature gradient near the wellbore and an increase in the temperature gradient within the dolomite farther from the wellbore are observed between 770 s and 1570 s. This occurs as the heat exchange between the phase-transitioned materials within the borehole and the near-wellbore region gradually equilibrates, establishing a “stable heat source” for dolomite sections distant from the wellbore. Thermal propagation ultimately reaches its limit at 0.225 m.
At 60 s after the completion of phase d, the temperature released in the phase e system reaches a peak of 2603 °C, representing a 7.87% increase compared to phase d. This is attributed to the molten thermite in phase d at 420 s, coexisting with partially molten dolomite. Under gravitational influence, settling occurs, resulting in additional heat input to the thermite melting system in phase e. Under these conditions, phase-transitioned Al2O3 initiates the solidification and consolidation process around 720 s, while Fe begins this process at 1020 s. Molten dolomite, in turn, starts undergoing phase transitions again at 1420 s. Compared to phase d, phase e maintains the molten state for 100 s longer. This prolonged duration further enhances heat/temperature transfer within the system and enlarges the thermite melting zone. During phase e, the temperature decline rate of peak values decreased from an initial 1.91 °C/s to 1.0 °C/s by 1620 s. The phase transition thickness of dolomite in the radial direction measures 0.0354 m, representing a 29.20% increase compared to phase d, while the maximum heat transfer propagation distance reaches 0.2625 m, showing a 16.67% improvement over phase d.
In summary, within the thermite melting system, the phase transition thickness of dolomite in the radial direction ranges from a maximum of 0.0354 m to a minimum of 0.0184 m, with the maximum value nearly doubling the minimum. During phase e, the heat input from the settling of molten thermite agents further enhances both the peak temperature and phase transition thickness, accompanied by a significant extension of the maximum heat transfer propagation distance, which indicates that the heat transfer efficiency in the later reaction stages plays a critical role in expanding the plugging range.

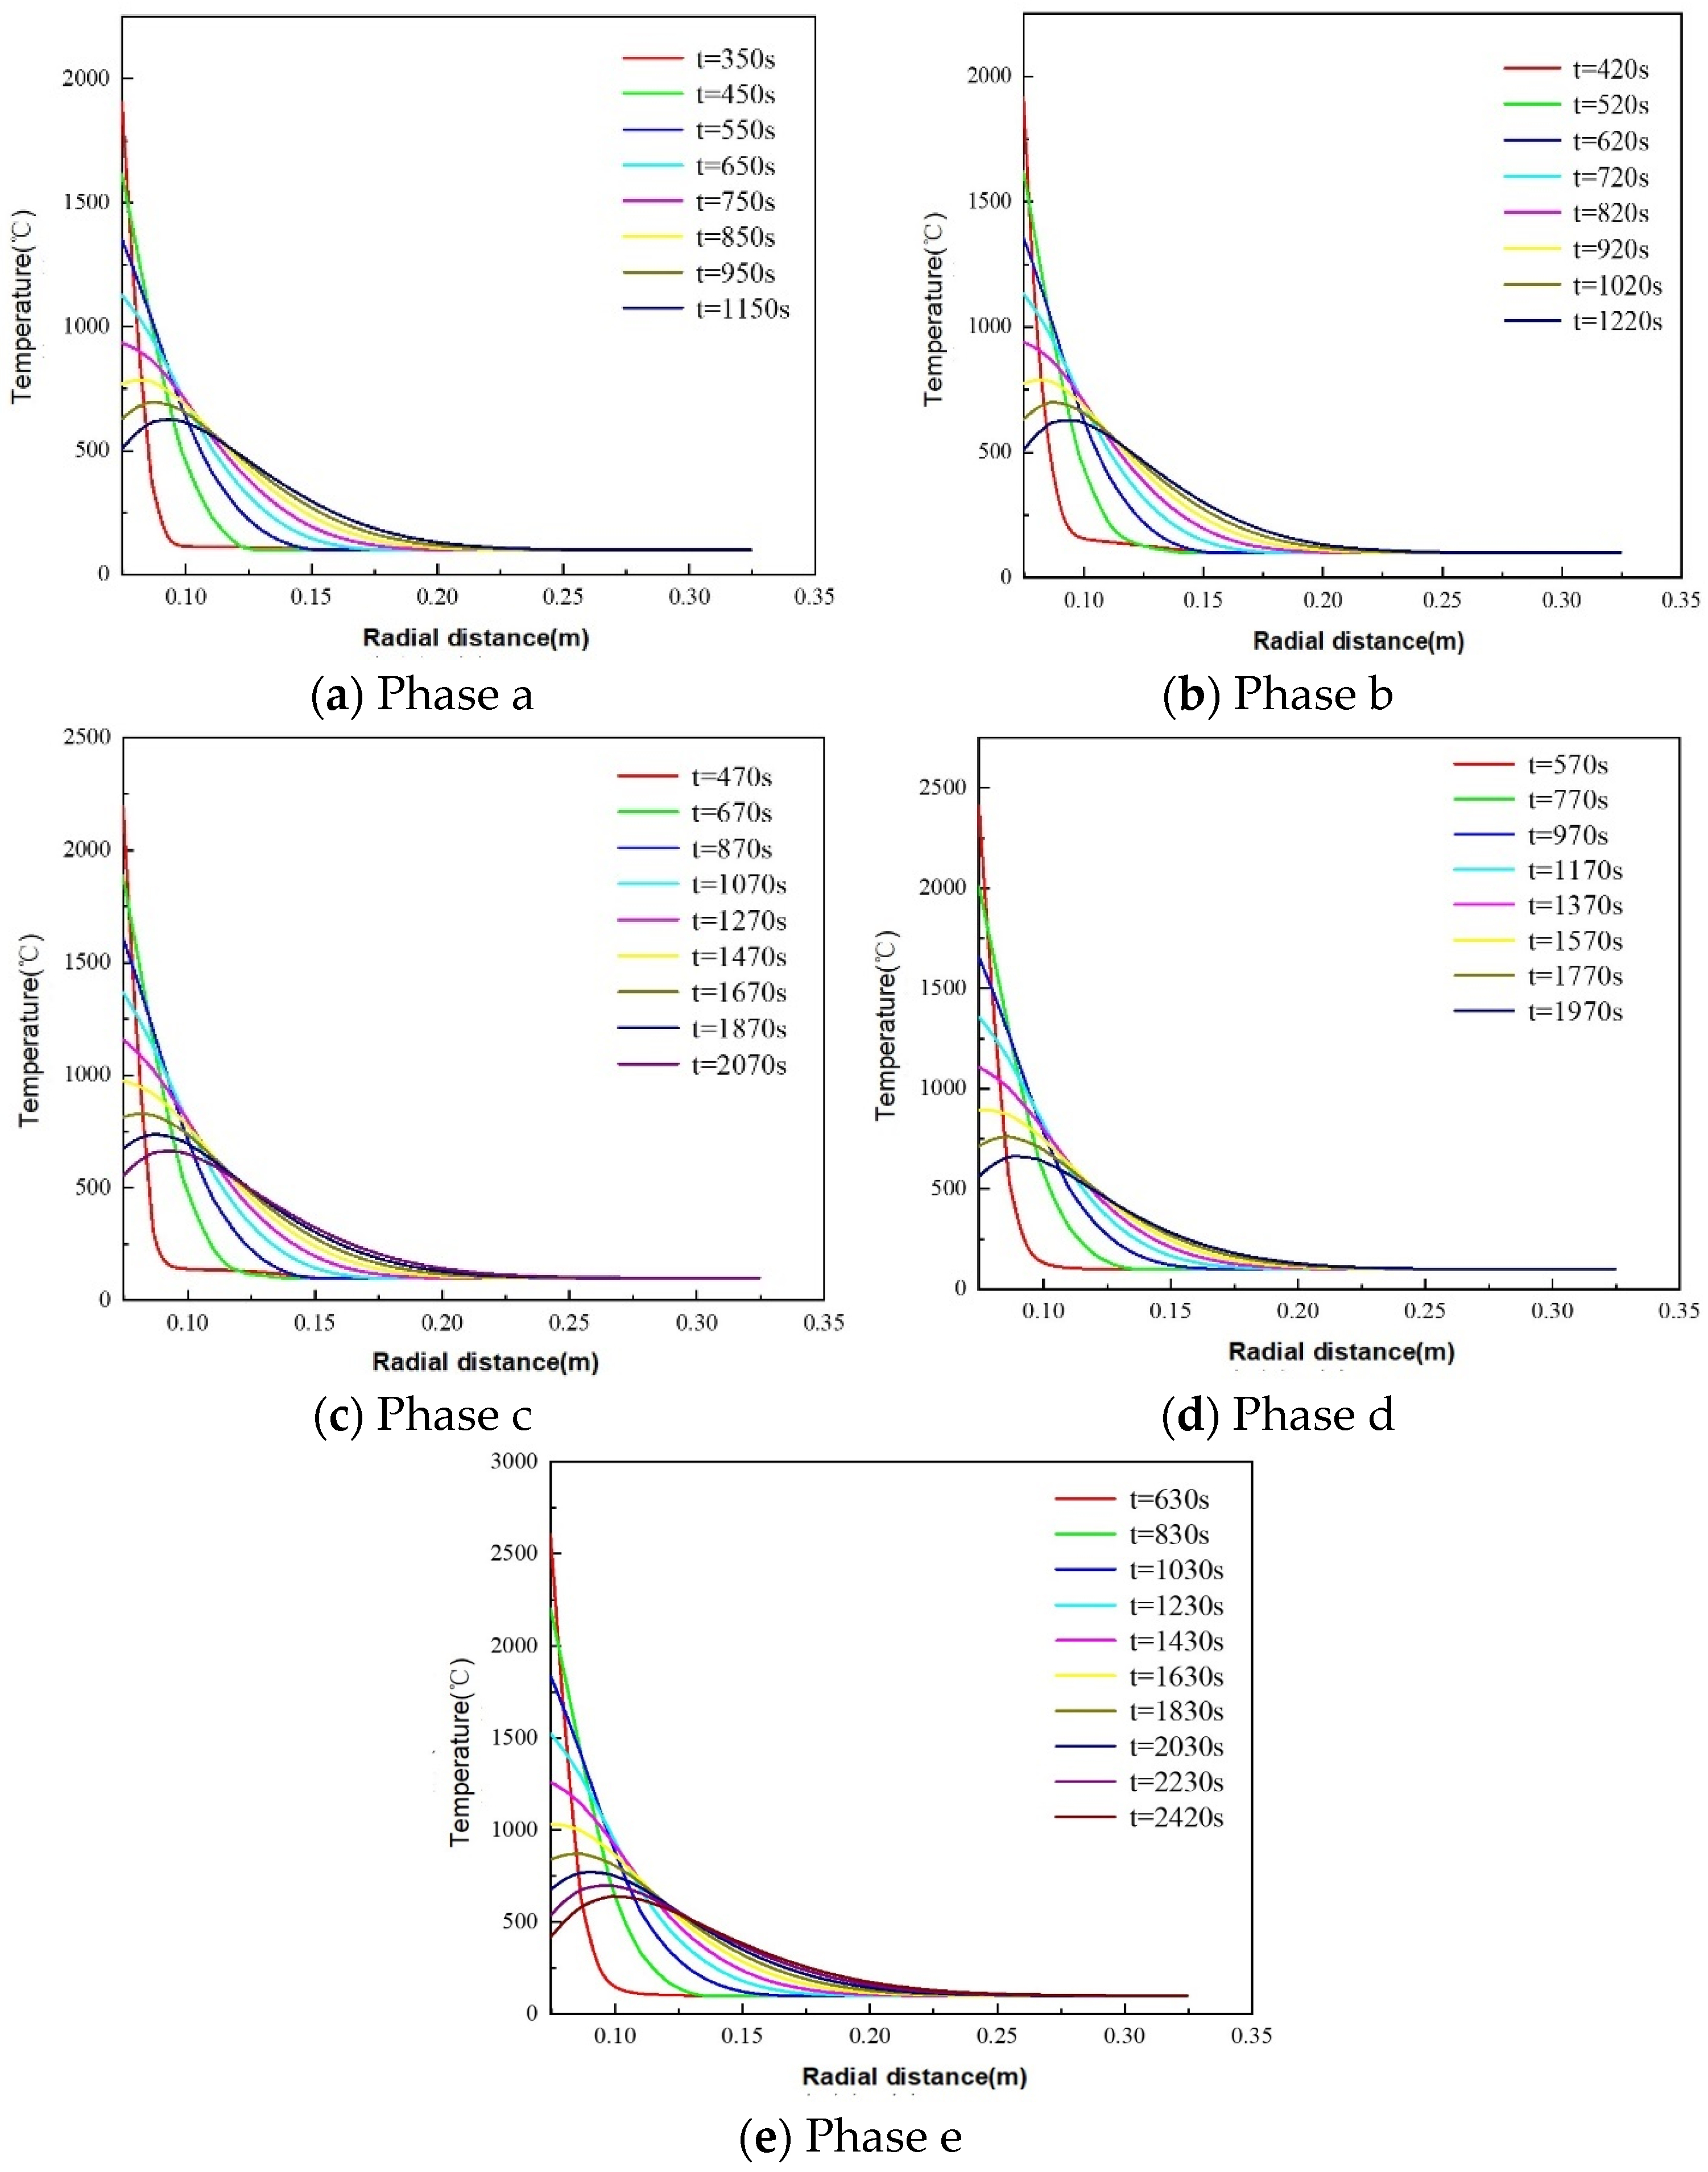
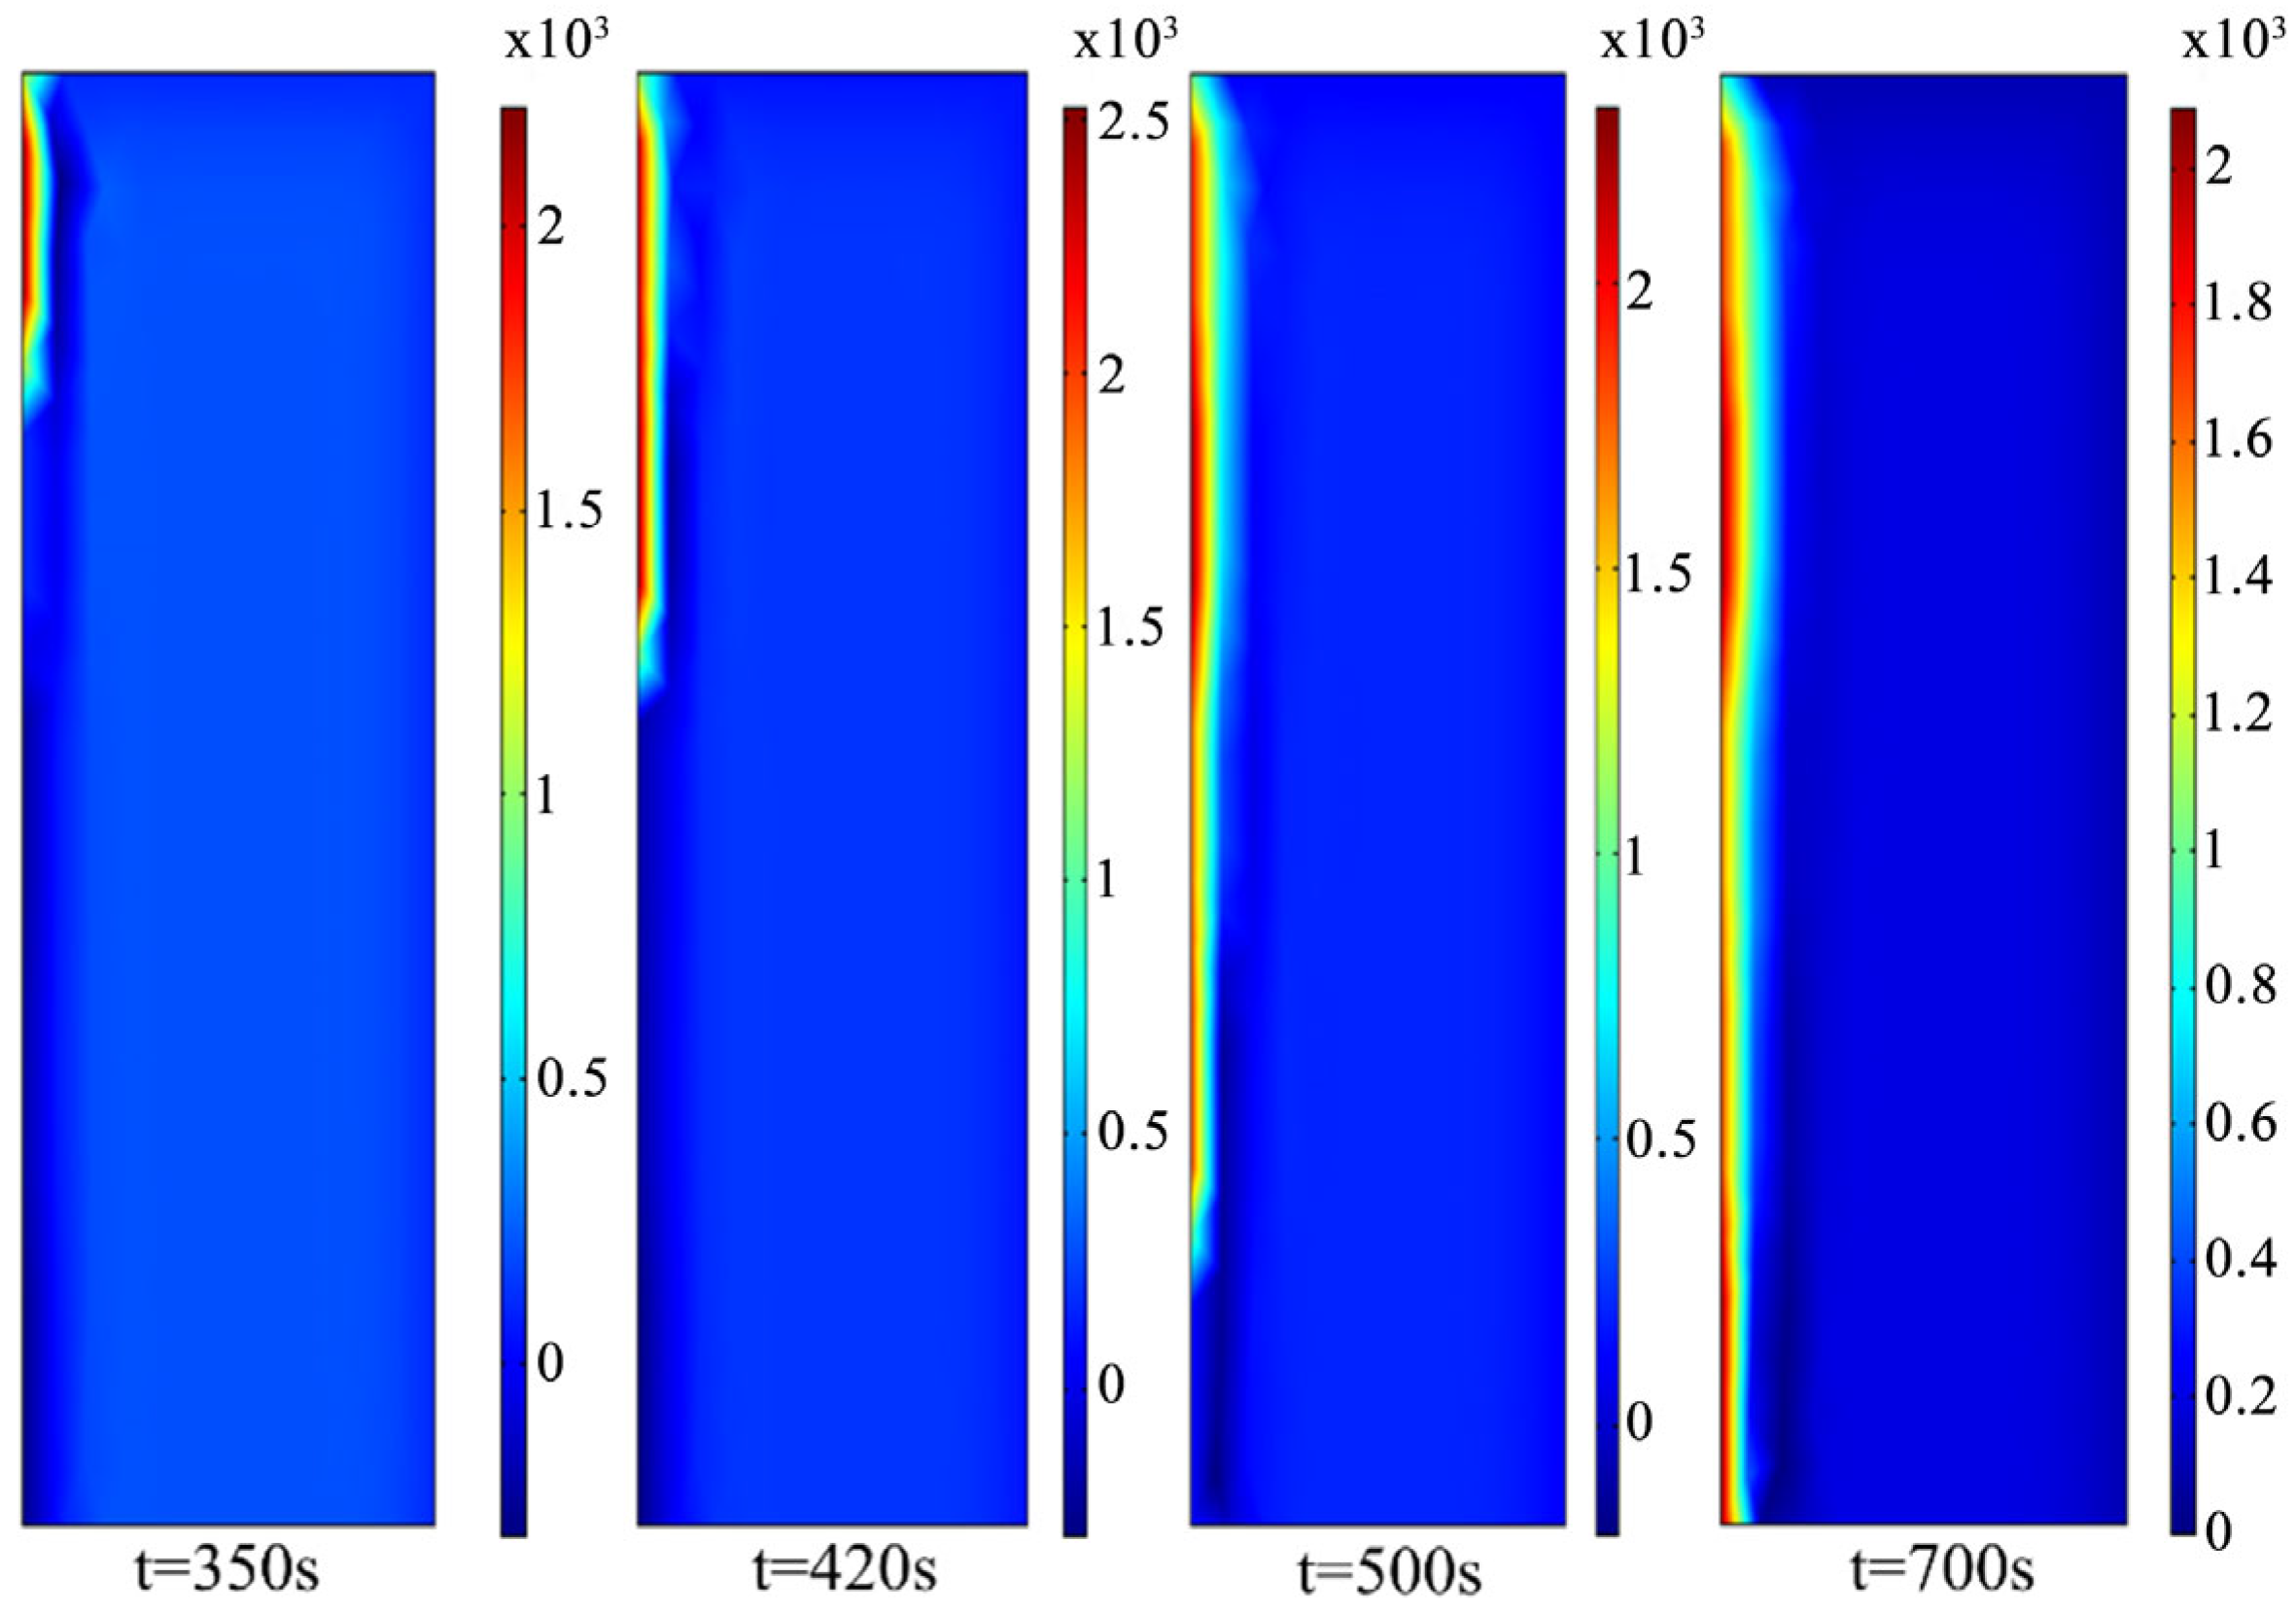
5.1.2. Thermite–Limestone TP&A System Temperature Distribution Patterns

Figure 12 and Figure 13 show the temperature distribution of limestone in the open-hole section during thermite melting. In Figure 13a, the thermite melting system reaches a peak temperature of 1905 °C at 350 s. This temperature peak matches the observations in the dolomite, as the heat or temperature released by the thermite reaction itself during phase a remains unaffected by variations in the surrounding materials. Additionally, the boundaries of the study domain correspond to the wellbore wall; therefore, the peak temperature at the wellbore wall equals that of the reaction process itself. In Figure 13a, the temperature decline rates between different time intervals show a 57.3% increase in maximum value and a 19.87% reduction in minimum value compared to dolomite. This is due to limestone’s lower thermal conductivity coefficient relative to dolomite, resulting in larger temperature differentials in limestone’s temperature distribution across time intervals. Compared to dolomite, Fe initiates the solidification and consolidation process around 500 s, while phase-transitioned limestone begins this process at 950 s. In this phase, the maximum phase transition thickness of limestone measures 0.0294 m, and the maximum radial heat transfer propagation distance reaches 0.258 m. These values represent 59.78% and 13.66% increases, respectively, compared to the maximum phase transition thickness and heat transfer propagation distance observed in dolomite.
In phase b, the peak temperature reaches 1918 °C at 420 s, showing an increase of 13 °C compared to phase a. This is similar to the dolomite scenario. Moreover, as observed in Figure 12, the temperature distribution changes in phase a predominantly occur radially near the wellbore, with minimal axial influence. Compared to the temperature gradients in phase b of dolomite across different time intervals, those in limestone exhibit a 99% higher maximum value and a 28.74% lower minimum value. This discrepancy arises because limestone possesses superior heat storage capacity compared to dolomite, coupled with its higher latent heat requirement for phase transitions. These properties lead to more heterogeneous temperature distributions in limestone. In phase b, Fe initiates the solidification and consolidation process around 850 s, while phase-transitioned dolomite begins this process at approximately 1670 s. In this phase, the maximum phase transition thickness of limestone measures 0.0294 m, representing a 51.55% increase compared to dolomite in the same phase, while the maximum radial heat transfer propagation distance reaches 0.262 m.
As shown in Figure 13c, the peak temperature in phase c reaches 2196 °C, representing a 14.5% increase compared to the preceding stage. This aligns with the same underlying factors as those observed in the dolomite at this phase. During this phase, the temperature gradient across different time intervals decreases from 1.56 °C/s to 0.61 °C/s, exhibiting minimal variation compared to the same phase in dolomite. This is due to the progressive accumulation of heat released by the reaction and molten products as the process advances. Al2O3 initiates the solidification and consolidation process around 550 s, while Fe begins this process at approximately 970 s, and phase-transitioned limestone starts solidification and consolidation around 1870 s. In this phase, the maximum phase transition thickness of limestone measures 0.0344 m, representing a 17% increase compared to the 0.0294 m maximum phase transition thickness in phase b, while the maximum radial heat transfer propagation distance reaches 0.269 m.
Therefore, as shown in Figure 13d, the temperature released by the reaction reaches a peak of 2411 °C at 570 s, with the temperature decline rate in phase d ranging from 2 °C/s (maximum) to 0.76 °C/s (minimum). The phase transition thickness of limestone in the radial direction measures 0.0345 m, representing a 25.91% increase compared to the maximum phase transition thickness of dolomite in the same phase. During this phase, the molten thermite agents persist until approximately 750 s, after which Al2O3, Fe, and the phase-transitioned limestone sequentially initiate the solidification and consolidation process. Temperature distribution curves along the radial direction at different time intervals all exhibit an initially steep followed by gradual trend until reaching the maximum heat transfer propagation distance of 0.225 m, with temperature gradients across time intervals gradually approaching zero.
As shown in Figure 13e, the temperature released in the phase e system reaches a peak of 2604 °C, showing minimal deviation compared to the dolomite scenario under the same phase. Phase-transitioned Al2O3 and Fe initiate the solidification and consolidation process at 900 s and 1330 s, respectively, while molten limestone undergoes phase transitions again starting at 2130 s. In phase e, the temperature decline rate of the peak values decreases from an initial 1.99 °C/s to 0.6 °C/s over time. The phase transition thickness of limestone in the radial direction measures 0.0350 m, representing a minimal increase of 0.0005 m compared to phase d, while the maximum heat transfer propagation distance reaches 0.3 m, showing a 33.33% improvement compared to phase d.
The phase transition thickness of limestone continuously increases as the reaction progresses, where its low thermal conductivity and high latent heat synergistically delay heat dissipation, enabling stable expansion of the melting range. In comparison with dolomite, the phase transition thickness of limestone exhibits greater uniformity, with a difference of less than 20% between the maximum and minimum values. Throughout the thermite melting process, the most pronounced disparity between limestone and dolomite occurs in phase a, where the phase transition thickness of limestone exceeds that of dolomite by 59.78%, demonstrating superior melting efficacy in limestone during the initial reaction stage.

5.1.3. Thermite–Granite TP&A System Temperature Distribution Characteristics

Figure 14 and Figure 15 show the temperature distribution of the granite open-hole section during thermite melting. In Figure 15a, the peak temperature in the thermite melting system at 350 s matches those observed in the previous two lithologies. The temperature decline rate at the wellbore wall across different time intervals measures 0.715 °C/s, representing reductions of 75.43% and 62.17% compared to the temperature decline rates in dolomite and limestone under equivalent phase conditions, respectively. This is because granite, compared to dolomite and limestone, exhibits superior heat storage capacity and higher energy requirements for phase transitions, thereby reducing heat loss and thermal conduction. Fe initiates the solidification and consolidation process around 850 s, while phase-transitioned limestone begins this process at 1450 s. The maximum phase transition thickness of granite in this phase measures 0.0134 m, representing reductions of 21.17% and 54.42% compared to the maximum phase transition thicknesses of dolomite and limestone, respectively. Similarly, the maximum radial heat transfer propagation distance measures only 0.214 m, representing reductions of 5.7% and 18.3% compared to dolomite and limestone under equivalent phase conditions, respectively.
In phase b, the peak temperature at 420 s matches that of limestone. The temperature gradient during this phase exhibits a decrease from 1.52 °C/s to 0.87 °C/s across different time intervals, showing minimal deviation compared to the maximum temperature gradient in dolomite under the same phase. However, this represents a 49.16% reduction compared to the maximum value observed in limestone. Fe initiates the solidification and consolidation process around 720 s, while phase-transitioned granite begins this process at 1200 s. In this phase, the maximum phase transition thickness of granite measures 0.0134 m, representing reductions of 47.24% and 54.42% compared to dolomite and limestone under equivalent phase conditions, respectively. The maximum radial heat transfer propagation distance reaches 0.188 m.
As shown in Figure 15c, the peak temperature in phase c reaches 2195 °C, representing a 14.5% increase compared to the preceding stage. This is similarly attributed to enhanced heat transfer processes between molten products and non-phase-transitioned materials in phases a and b, which amplify the thermite melting efficacy in this phase. During this phase, the temperature gradient across different time intervals decreases from 1.56 °C/s to 0.8 °C/s, showing minimal variation compared to dolomite and limestone under equivalent phase conditions. Al2O3 initiates the solidification and consolidation process at 500 s, while Fe begins this process at 970 s, and phase-transitioned granite starts solidification and consolidation at 1470 s. In this phase, the maximum phase transition thickness of granite measures 0.0134 m, while the maximum radial heat transfer propagation distance reaches 0.269 m. This is due to granite’s superior heat storage capacity compared to dolomite and limestone, higher latent heat requirement for phase transitions, and lower thermal conductivity coefficient. These properties collectively result in relatively hindered heat transfer during the initial three stages of granite’s thermal response.
Therefore, as shown in Figure 15d, the peak temperature released by the reaction reaches 2567 °C at 570 s, with the temperature decline rate in phase d ranging from 3.57 °C/s (maximum) to 1.02 °C/s (minimum). The phase transition thickness of granite in the radial direction measures 0.0234 m, representing reductions of 14.60% and 32.17% compared to the maximum phase transition thicknesses of dolomite and limestone under equivalent phase conditions, respectively. During this phase, the molten thermite agents persist until approximately 830 s, after which Al2O3 completes cooling and solidification first, followed by Fe at 1050 s, and, finally, the phase-transitioned granite initiates the solidification and consolidation process at 1770 s. Thermal propagation ultimately reaches its limit at 0.203 m.
As shown in Figure 15e, the temperature released in the phase e system reaches a peak of 2603 °C, which is essentially identical to the values observed in dolomite and limestone. This represents an increase of 36.64% compared to phase a. Phase-transitioned Al2O3 begins solidification around 870 s, while Fe initiates solidification at 1250 s, and molten granite undergoes phase transition again at 1670 s. In phase e, the temperature decline rate of peak values decreased from an initial 1.91 °C/s to 0.92 °C/s over time. The phase transition thickness of granite in the radial direction is 0.0234 m, and the maximum heat transfer propagation distance is 0.236 m.
As shown in Figure 14 and Figure 15, the maximum phase transition propagation distances for phases a, b, c, d, and e are 0.088 m, 0.088 m, 0.088 m, 0.098 m, and 0.095 m, respectively. Thus, the maximum phase transition thicknesses of granite are 0.0134 m, 0.0134 m, 0.0134 m, 0.0234 m, and 0.0231 m, respectively. Among the different lithologies, dolomite and limestone exhibit approximately 50% higher maximum phase transition thicknesses compared to granite. This demonstrates that the thermite melting efficacy in granite is relatively limited, requiring measures such as increasing reaction heat to enhance plugging capability.

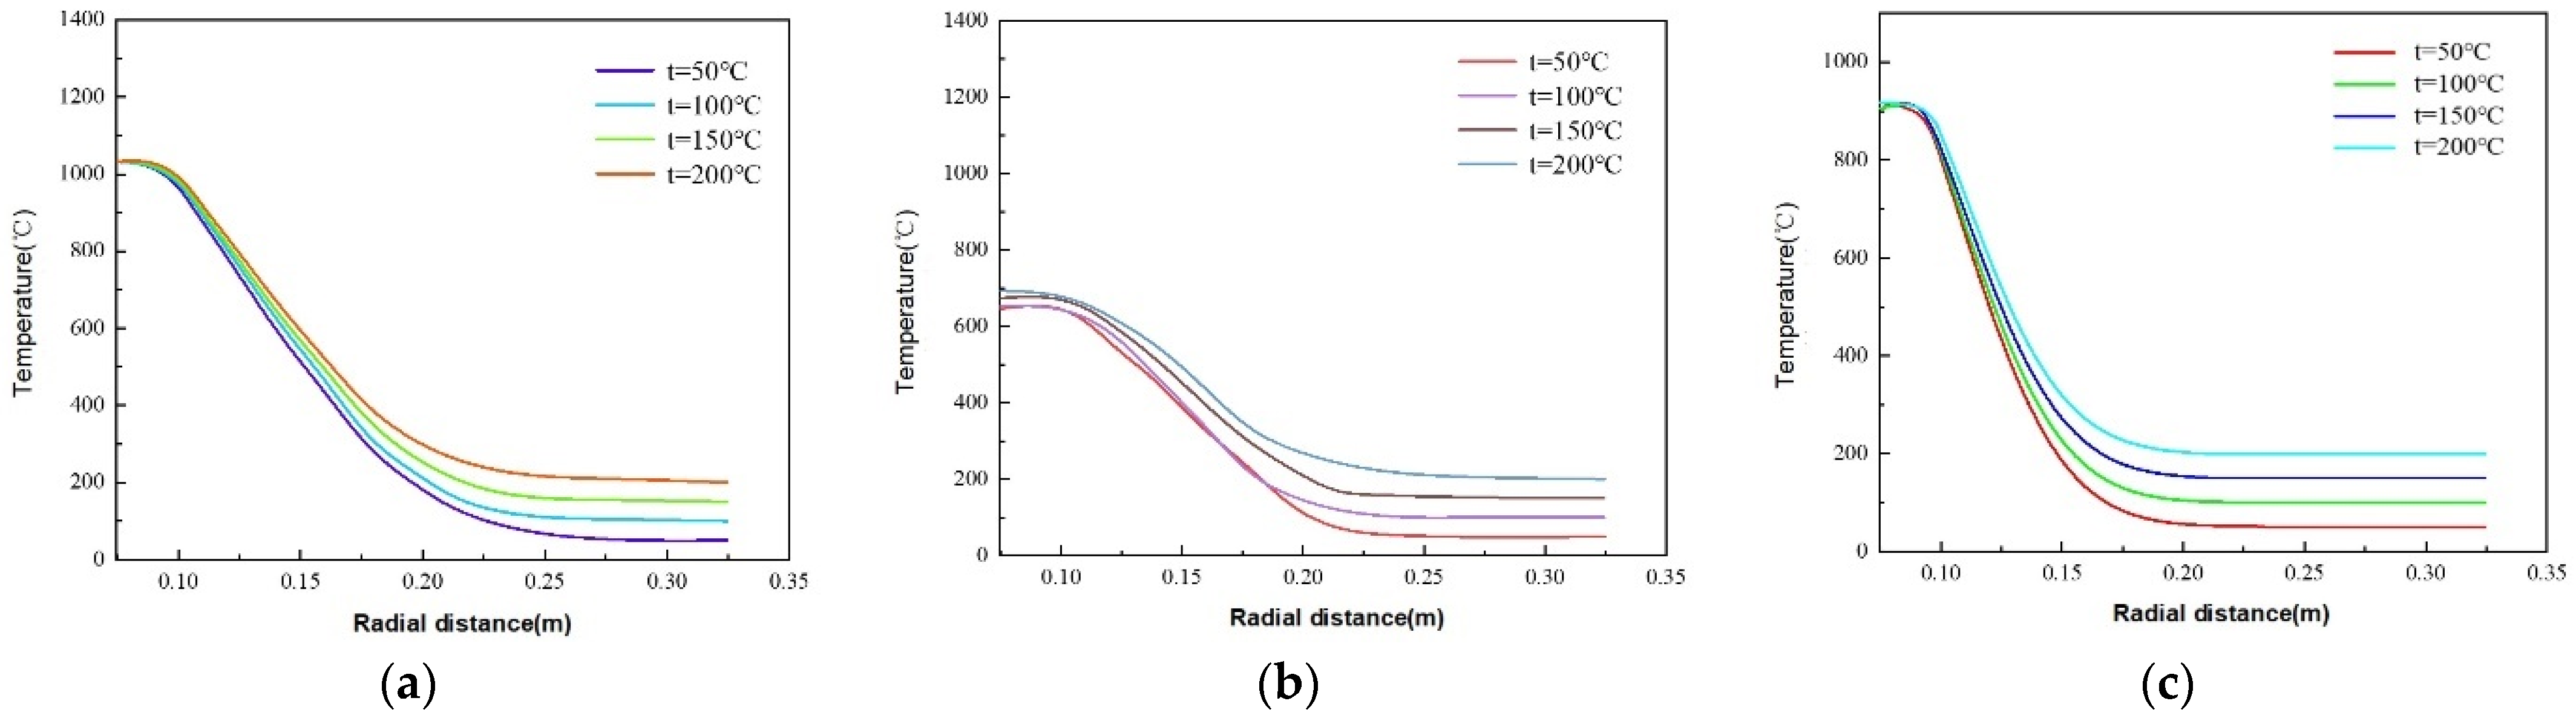
5.2. Effects of Downhole Initial Temperature on Thermite Melt Temperature Distribution Patterns

Prior to initiating the thermite melting reaction, the influence of downhole initial temperature warrants investigation. The following analysis examines the maximum phase transition propagation distances under temperature effects across different lithologies, as shown in Figure 16.
The maximum phase transition propagation distances for dolomite, limestone, and granite are 0.11 m, 0.1096 m, and 0.098 m, respectively. As shown in Figure 16, within the range of 0.0746–0.11 m, variations in downhole initial temperature exhibit minimal impact on the thermal transfer behavior of rock segments within the thermite melting system. The observed temperature fluctuation ranges are 6–30 °C, 8–44 °C, and 5–63 °C, respectively. This indicates that the propagation of high temperatures released by the thermite reaction through the formation is minimally influenced by the downhole initial temperature, remaining negligible compared to the overall temperature levels generated during the thermite melting process.

6. Conclusions

(1)
Unlike conventional approaches that solely employ solid heat conduction models, this study establishes a transient thermal–fluid–solid coupled model for open-hole abandoned wellbores, incorporating phase change reactions during heat transfer and integrating the kinetic equations of thermite reactions.
(2)
Exploratory experiments on thermite melting were conducted, demonstrating that under semi-confined conditions, the sandstone borehole diameter expanded by approximately 9.29 mm, with an axial extension of about 17.19 mm at the well bottom. In simulation studies, these values reached 9.8 mm and 18.9 mm, respectively, corresponding to error margins of 5.5% and 4.7%. These results validate the accuracy of the temperature model established in this study.
(3)
The maximum phase transition thicknesses for dolomite, limestone, and granite are 0.0354 m, 0.0350 m, and 0.0234 m, respectively. Thus, dolomite and limestone exhibit superior plugging efficacy. In the initial stage of the thermite reaction (stage a), limestone demonstrates enhanced thermite melting effectiveness, with its phase transition thickness exceeding that of dolomite by 59.78%. The influence of downhole initial temperature on temperature distribution in open-hole abandoned wells during thermite melting is negligible.

Author Contributions

Conceptualization, H.L. and R.S.; Methodology, H.L. and J.Z. (Jie Zhang); Software, H.L.; Validation, H.L. and J.Z. (Jiazheng Zhou); Formal analysis, H.L. and J.Y.; Investigation, X.L.; Writing—original draft, R.S.; Writing—review and editing, H.L.; Supervision, J.Z. (Jie Zhang) All authors have read and agreed to the published version of the manuscript.

Funding

This work was financially supported by the National Key R&D Program of China (No. 2018YFC0310202), the National Natural Science Foundation of China (No. 51274168), and the Southwest Petroleum University Graduate Research and Innovation Fund Key Program (No. 2020CXZD30).

Data Availability Statement

All data, models, and sources used during the study appear in the submitted article.

Conflicts of Interest

Author Ruitao Sun was employed by China Oilfield Services Limited. The remaining authors declare that the research was conducted in the absence of any commercial or financial relationships that could be construed as a potential conflict of interest.

References

  1. Li, J.S.; Xiao, N.W. Technical Research on Ecological Risk Assessment of Onshore Oil Exploitation; China Environmental Science Press: Beijing, China, 2013. [Google Scholar]
  2. Zhu, M.Y.; Cheng, T.; Li, S.F.; Pang, H.L.; Liu, C.Y. Research progress of abandonment technology in Bohai Oilfield. China Offshore Plat. 2022, 37, 92–96. [Google Scholar]
  3. Jiang, J.W.; Li, J.; Liu, G.H.; Lian, W.; Yang, H.W. Numerical simulation of cohesive cement-casing interface bonding failure based on cohesive unit method in abandoned wells. Drill. Complet. Fluids 2020, 37, 351–357. [Google Scholar]
  4. Yang, Y.B. Offshore platform abandonment technology and market prospect forecast. China Offshore Plat. 2013, 28, 4–7. [Google Scholar]
  5. Jia, Q.Z. Exploration and application of permanent plugging technology for abandoned oil and gas wells. Chem. Eng. Equip. 2017, 241, 165–166. [Google Scholar]
  6. Carroll, S.; Carey, J.W.; Dzombak, D.; Huerta, N.J.; Li, L.; Richard, T.; Um, W.; Walsh, S.D.; Zhang, L. Role of chemistry, mechanics, and transport on well integrity in CO2 storage environments. Int. J. Greenh. Gas Control 2016, 49, 149–160. [Google Scholar] [CrossRef]
  7. Li, Z.J.; Han, C.; Wei, A.C.; Liu, X.Y.; Yang, Y.H. Cement plug technology for abandonment of offshore UHTP exploration wells. Drill. Fluid Complet. Fluid 2019, 36, 617–621. [Google Scholar]
  8. Stein, A.F. Verification of barriers in a suspension or abandonment phase. In Proceedings of the SPE Norway One Day Seminar, Bergen, Norway, 18 April 2018; p. 191301. [Google Scholar]
  9. Vrålstad, T.; Saasen, A.; Fjær, E.; Øia, T.; Ytrehus, J.D.; Khalifeh, M. Plug & abandonment of offshore wells: Ensuring long-term well integrity and cost-efficiency. J. Pet. Sci. Eng. 2019, 173, 478–491. [Google Scholar]
  10. de Souza, K.M.; de Lemos, M.J. Detailed numerical modeling and simulation of Fe2O3−Al thermite reaction. Propellants Explos. Pyrotech. 2021, 46, 806–824. [Google Scholar] [CrossRef]
  11. Pena, F.J.C.; de Lemos, M.J.S. Unsteady heat conduction with phase change applied to a novel thermal plug and abandonment process. Int. J. Therm. Sci. 2021, 170, 107155. [Google Scholar] [CrossRef]
  12. Pena, F.J.C.; de Lemos, M.J.S. Numerical investigation of an innovative through-tubing solution to thermal plug and abandonment of oil wells with thermite reactions. Appl. Therm. Eng. 2024, 254, 123874. [Google Scholar] [CrossRef]
  13. Magalhães, E.S.; de Lemos, M.J.S. A thermal study of a new oil well plugging & abandonment operation. Int. J. Therm. Sci. 2020, 155, 106421. [Google Scholar]
  14. de Souza, K.M.; de Lemos, M.J.S.; Ribeiro, R.R.; Marin, A.M.G. Advanced isoconversional kinetic analysis of Fe2O3-2Al thermite reaction for plug and abandonment of oil wells. Chem. Eng. J. 2023, 455, 140725. [Google Scholar] [CrossRef]
  15. de Andrade, G.S.; Nascimento, E.J.G.; de Lemos, M.J.S. Finite integral transform with homogenized boundary conditions solution of transient heat conduction applied to thermal plug and abandonment of oil wells. Geoenergy Sci. Eng. 2024, 233, 212530. [Google Scholar] [CrossRef]
  16. de Andrade, G.S.; Pena, F.J.C.; de Lemos, M.J.S. A new analytical method for transient heat conduction in composite disks applied to thermal plug and abandonment of oil wells. Int. Commun. Heat Mass Transf. 2024, 155, 107465. [Google Scholar] [CrossRef]
  17. He, L.; Chen, L.G.; Zheng, Q.C.; Song, W.J.; Wang, Y.J. Treatment Method of Abandoned Open Hole in Coal Mining Area. China Patent CN103590768B, 15 February 2017. [Google Scholar]
  18. Shen, W.D.; Jiang, Z.M. Engineering Thermodynamics; Higher Education Press: Beijing, China, 1982. [Google Scholar]
  19. Eckert, E.R.G.; Goldstein, R.J.; Ibele, W.E.; Simon, T.W.; Kuehn, T.H.; Strykowski, P.J.; Tamma, K.K.; Bar-Cohen, A.; Heberlein, J.V.R.; Davidson, J.H.; et al. Heat transfer—A review of 1996 literature. Int. J. Heat Mass Transf. 2000, 43, 1273–1371. [Google Scholar]
  20. Pei, H.B. Study on Reaction Mechanism and Energy Release Law of Aluminum Powder in Aluminum-Containing Explosive. Ph.D. Thesis, School of Mechanical and Electrical Engineering, Beijing Institute of Technology, Beijing, China, 2015. [Google Scholar]
  21. Zhao, C. Study on Energy Release Law of Nano-Thermite. Ph.D. Thesis, School of Mechanical and Electrical Engineering, Beijing Institute of Technology, Beijing, China, 2014. [Google Scholar]
  22. Mei, J.; Halldearn, R.D.; Xiao, P. Mechanisms of the aluminum-iron oxide thermite reaction. Scr. Mater. 1991, 41, 541–548. [Google Scholar] [CrossRef]
  23. Durães, L.; Campos, J.; Portugal, A. Radial combustion propagation in iron (III) oxide/aluminum thermite mixtures. Propellants Explos. Pyrotech. 2007, 31, 42–49. [Google Scholar] [CrossRef]
  24. Sahoo, S.K.; Danali, S.M.; Arya, P.R. Ignition behavior of Al/Fe2O3 metastable intermolecular composites. Int. J. Eng. Res. Sci. 2017, 3, 2395–6992. [Google Scholar] [CrossRef]
  25. Franceschi, K.; Lugo, L.; Páez, G.; Magarelli, D. Development of a software for solving problems applied to thermodynamics. Ing. UC 2016, 23, 138–152. [Google Scholar]
  26. Durães, L.; Brito, P.; Campos, J.; Portugal, A. Modelling and simulation of Fe2O3/Aluminum thermite combustion: Experimental validation. Comput. Aided Chem. Eng. 2006, 21, 365–370. [Google Scholar]
  27. de Souza, K.M.; de Lemos, M.J.S. A new hybrid analytical/numerical method for transient heat conduction in composite hollow cylinders applied to plug and abandonment of oil wells. Int. J. Therm. Sci. 2021, 46, 106981. [Google Scholar]
  28. Voller, V.R.; Shadabi, L. Enthalpy methods for tracking a phase-change boundary in 2 dimensions. Int. Commun. Heat Mass Transf. 1984, 11, 239–249. [Google Scholar] [CrossRef]
Figure 1. Schematic diagram of leakage hazard of abandoned well.
Energies 18 02941 g001
Figure 2. Diagram of potential leakage path of abandoned well.
Energies 18 02941 g002
Figure 3. Physical model of thermite melting heat transfer in open-hole section of abandoned well.
Energies 18 02941 g003
Figure 4. Meshing of thermite melting model in open-hole section of abandoned well.
Energies 18 02941 g004
Figure 5. Photos of thermite melting experiment ((a) is before the experiment, (b,c) are during the experiment, (d) is after the experiment).
Energies 18 02941 g005
Figure 6. Hole diameter before and after the experiment ((a) is before the experiment, (b) is after the experiment).
Energies 18 02941 g006
Figure 7. The height difference of the bottom of the hole before and after the experiment.
Energies 18 02941 g007
Figure 8. Experimental simulation of physical models.
Energies 18 02941 g008
Figure 9. Radial and axial temperature propagation curves ((a) is in the radial direction, (b) is in the axial direction).
Energies 18 02941 g009
Figure 10. Cloud image of wellbore wall temperature variation during TP&A in dolomite formation.
Energies 18 02941 g010
Figure 11. Radial temperature change at central point during TP&A in dolomite formation of abandoned well.
Energies 18 02941 g011
Figure 12. Cloud image of wellbore wall temperature variation during TP&A in limestone formation.
Energies 18 02941 g012
Figure 13. Radial temperature change at central point during TP&A in limestone formation of abandoned well.
Energies 18 02941 g013
Figure 14. Cloud image of wellbore wall temperature variation during TP&A in granite formation.
Energies 18 02941 g014
Figure 15. Radial temperature change at central point during TP&A in granite formation of abandoned well.
Energies 18 02941 g015
Figure 16. Effect of bottom-hole temperature on temperature distribution in abandoned wells ((a) is dolomite, (b) is limestone, (c) is granite).
Energies 18 02941 g016
Table 1. Experimental data on thermite melting.
Rock SampleRock Dimensions
(mm × mm × mm)
Central Borehole
(mm)
Central Borehole Depth (mm)Al-Fe2O3
Mass
(g)
Melting Point (°C)Experimental Containment Measures
Sandstone500 × 500 × 500117.830025001000Semi-Confined
Table 2. Rock physical property parameters.
Rock TypeRadius
(mm)
Density
(kg/m3)
Thermal Conductivity
(W/m·°C)
Specific Heat Capacity
(J/kg·°C)
Latent Heat
(J/kg)
Melting Point
(°C)
Porosity
(%)
Dolomite0.324628605.5846250,00010000.21
Limestone0.324626202.82878.64360,0006500.34
Granite0.324623502.51380396,0009000.36
Table 3. Physical property parameters of thermite.
Thermite MaterialOpen-Hole Section Radius (mm)Density
(kg/m3)
Thermal Conductivity Coefficient
(W/m·°C)
Specific Heat Capacity (J/kg·°C)Melting Point (°C)
Al0.07462710237875624
Fe2O30.074652701511001662
Table 4. Basic parameters of simulated well.
Well IDWell TypeGeothermal Gradient
(°C/m)
Well Depth
(m)
Borehole Size
(mm)
Simulated Section Length
(m)
XX1Vertical Well2.52000149.20.5
Disclaimer/Publisher’s Note: The statements, opinions and data contained in all publications are solely those of the individual author(s) and contributor(s) and not of MDPI and/or the editor(s). MDPI and/or the editor(s) disclaim responsibility for any injury to people or property resulting from any ideas, methods, instructions or products referred to in the content.

