1. Introduction
Under the significant pressures of energy shortages, environmental pollution, and climate change, the transformation and upgrading of the automobile industry have reached a strategic level [
1,
2]. Among these changes, new energy vehicles (NEVs) have emerged as the dominant force in the global automotive industry’s transformation and development owing to their energy-efficient and environmentally friendly characteristics [
3]. However, the growth of NEVs is hindered by several shortcomings, including the limited battery range and inadequate charging infrastructure, which primarily arises from issues related to power. Batteries are a core component of NEVs, and they present significant end-of-life challenges for power batteries. The situation has now become critical. It is predicted that by 2025, 780,000 tons of automotive power will be required.
With the rapid development of the global NEV industry, the demand for power batteries is increasing daily. When batteries reach the end of their useful life, improper disposal will not only result in the waste of rare metals but may also cause irreversible pollution of the soil and the atmospheric environment [
4]. Therefore, it is essential to implement effective recycling processes for used power batteries. Generally speaking, when a battery’s capacity declines to less than 80% of its rated capacity, it is no longer considered viable for use. The management of waste batteries used in NEVs is crucial. First, gradient utilization can be implemented, allowing for waste batteries to be repurposed in applications with lower energy density requirements, such as small energy storage cabinets and streetlights. This process involves inspection, classification, disassembly, reorganization, and various treatments. Secondly, regeneration and utilization can occur after dismantling, crushing, sorting, and smelting waste batteries. This enables the extraction and reuse of valuable metal materials, such as lithium and cobalt. It is essential to study the closed-loop supply chain management of NEVs to improve the recycling of power batteries, particularly in the context of lithium and nickel used in battery recycling.
In order to achieve the goal of reducing carbon emissions, many countries have developed regulations and policies aimed at minimizing these emissions [
5]. This strategy to combat climate change, that is, carbon trading policies that regulate and manage greenhouse gas emissions allowances, is based on a foundation of this market. Companies are allocated a specific number of carbon emission allowances, which can be traded in the market. If a company exceeds its carbon emission quota, it must purchase additional allowances from other companies to compensate for the surplus. Conversely, if a company’s carbon emissions are lower than its allocated quota, it can transfer its remaining carbon emission allowances to other enterprises, thereby gaining economic benefits under the dual guidance of the national dual-carbon target and carbon trading policy. NEV enterprises have invested in carbon emission reduction initiatives. The most fundamental approach to achieving carbon emission reductions for NEVs is through investment in and innovation of carbon reduction technologies [
6,
7]. We can make significant progress in addressing climate change. Balancing the benefits of carbon emission reduction with the goal of maximizing profits is critical.
The low-carbon transition is already in full swing in key sectors such as agriculture and transport [
8]. Promoting carbon abatement technologies to reduce carbon emissions is also considered the most effective way to reduce carbon pollution [
9]. Against the backdrop of climate neutrality, NEV manufacturers are actively investing in energy-saving and emission-reduction technologies. Concurrently, third-party battery recycling companies are intensifying their recycling efforts through green initiatives, which contribute to a decrease in carbon emissions during the production process [
10]. Although these initiatives may incur higher costs in the short term, reducing carbon emissions and promoting environmentally friendly practices can enhance consumer acceptance and goodwill [
11]. This, in turn, directly or indirectly influences market demand for NEVs and the volume of recycled power batteries. Consequently, NEV manufacturers can enhance their profits by increasing investments in carbon reduction technologies, while third-party battery recycling companies can also improve their profitability through expanded green marketing initiatives.
In practice, carbon emission reduction and green technology investment are both long-term, multi-period strategies. Carbon emission reduction in the NEV industry involves battery technology iteration, charging infrastructure construction, production process innovation, and other aspects, which not only require sustained capital investment, but also face the challenges of a long technology research and development cycle and dynamic changes in the market environment. For example, it often takes 5–10 years from development to commercial application of power batteries, and during this period, policy guidance, consumer preferences, and technological breakthroughs can change significantly. Therefore, it is more relevant to study the carbon reduction strategy of NEVs from a long-term and dynamic perspective. Although some relevant papers in the literature have reported on the operation and coordination of supply chains in low-carbon environments, most of the literature is based on a static game to study the optimization of supply chain members’ decision-making in a single period [
12,
13,
14]. This static research approach finds it difficult to reflect the complex dynamic environment faced by firms in reality and ignores the inter-period impact of decision-making. For example, an enterprise’s increased investment in green technology in a certain period may reduce current profits, but in the long run, it can enhance brand image and seize market opportunities. In addition, the game relationship between supply chain members will change over time, and the co-operation strategy in the early stage may affect the trust base and decision-making choices in the later stage. Therefore, it is necessary to adopt a long-term and dynamic research perspective to comprehensively consider the interconnectedness of decision-making at each stage so as to provide a more practically valuable guidance for enterprises to formulate carbon emission reduction strategies. Using differential game model, we explore the green investment, carbon emission reduction strategy and coordination contract of the NEV supply chain from a long-term and dynamic perspective, and we try to explore the following issues: (i) how the implementation of a carbon trading policy affects technology investment decisions and system equilibrium in the NEV supply chain. (ii) What is the impact of the price per unit of carbon permit traded on technical cooperation between the NEV manufacturer and the third-party power battery recycler company? (iii) How do unilateral and bilateral cost-sharing contracts impact equilibrium strategies and coordination within the NEV supply chain?
Therefore, this work contributes in the following ways. Firstly, considering the intertemporal effects of green investment and carbon emission reduction in a low-carbon environment, this study used a differential game model for the first time to study the long-run equilibrium strategy of the NEV supply chain under the carbon trading policy. Second, both green promotion and emission reduction efforts affect the level of carbon emission reduction, and the number of the remaining carbon emission permits also has a positive impact on carbon emission reduction, features that have not been considered in the previous literature. Thirdly, this study analyzes the impacts of fundamental elements on long-term decisions and benefits, and designs a bilateral cost-sharing contract to coordinate the NEV supply chain, thus providing a theoretical basis for improving the economic and environmental benefits in the supply chain’s long-term operation.
The structure of this paper is organized as follows.
Section 2 reviews the literature relevant to this study.
Section 3 describes the problem and hypotheses.
Section 4 analyzes the theoretical results of the centralized and decentralized decision-making models of the NEV supply chain, and it designs and compares the coordination effects of a unilateral cost-sharing contract and a bilateral cost-sharing contract. In
Section 5, numerical experiments are conducted to validate the theoretical models and gain additional managerial insights. In
Section 6, conclusions and future research directions are provided.
2. Literature Review
In this section, we categorize the previous literature related to our study into three parts: (i) business decision-making under carbon trading policy, (ii) NEV supply chain operation and management, and (iii) differential game model.
2.1. Business Decision-Making Problems Under Carbon Trading Policy
A large body of research has examined operational decisions that are subject to carbon trading policy, and these decisions have primarily examined static supply chain operational decisions. These decisions include inventory, pricing, and technology investment decisions. Drake et al. [
15] revealed how two carbon policies affect firm capacity decisions and technology options. The results showed that compared to carbon tax regulations, a firm’s expected profit is more subject to cap-and-trade regulations. Xu et al. [
16] developed a two-tier supply chain consisting of a single manufacturer and a retailer under a carbon trading policy in which the manufacturer sells two alternative products to the retailer, price-sensitive demands for the two products are developed, and the optimal business decisions of the manufacturer and the retailer are analyzed. Bai et al. [
17] incorporated carbon emission reduction into carbon trading policy and constructed a model to analyze supply chain members’ profit and optimal operation decisions under decentralized and centralized decision-making. Under carbon trading policy, Mishra et al. [
18] built a closed-loop supply chain consisting of a single manufacturer, a single retailer, and a third party, where the manufacturer distributes new products and finished products to retailers under a single-set multiple-delivery strategy, and the third party collects end-of-life products from customers, and after two stages of testing, delivers perfect remanufacturable products to the manufacturer and disposes of the rest in a landfill. The model was validated to save a certain percentage of costs. Under a carbon tax, cap-and-trade policy, Sarkar et al. [
19] proposed a fully emission-controlled variable production system covered by green technology investments, which was verified to provide 8.76 per cent more profit than a conventional production system. Bai et al. [
20] investigated manufacturers’ energy efficiency investments and their impact on endogenous supply chain structure under a carbon trading policy, and also proposed a generalized two-part tolling contract to coordinate supply chain and energy efficiency investments. For manufacturing firms facing carbon-sensitive demand in a cap-and-trade regulated market, Yang et al. [
21] developed a two-period green technology investment model to explore ways to reduce carbon emissions under a cap-and-trade policy. Furthermore, Feng and Cao [
22] introduced the carbon trading module in detail in the “carbon trading” model and included the carbon trading cost in the production module of the elasticity of substitution function, and the research results proved that carbon trading policy can effectively promote the reduction of carbon emissions, but the impact on the economy is relatively moderate. Mridha et al. [
23] focused on the differences within the three carbon reduction regulatory strategies, variable delivery times, and controllable flexible rates, and they mitigated the impact of carbon emissions by building three models to minimize carbon emissions. The study found that finite carbon emissions were 59.67% and 59.68% higher than carbon taxes and cap-and-trade regulation, respectively. The results of the above studies show that carbon trading policies play an important role in carbon emission reduction strategies, and the above literature is all about static single-period models and does not deal with dynamic decision-making. However, the corporate carbon emission reduction process is usually dynamic and long-term rather than single-period, so it is more realistic to study low-carbon decision-making from a dynamic and long-term perspective.
With the development of a low-carbon economy, some scholars have applied different models to analyze the effectiveness of the policy. Duan et al. [
24] constructed a two-end dynamic game model inquiry to study the impact of carbon emission reduction policies on the steel industry. Wang et al. [
25] combined carbon trading policies and consumer low-carbon preferences to construct a differential game model to explore supply chain members’ emission reduction decisions in non-cooperative and cooperative scenarios. Rong et al. [
26] used the joint modeling of estimated bus departure schedules and travel times to estimate bus waiting times at any stop in the city. Xu et al. [
27] developed a mediated effects model to verify that smart city pilot policies can effectively promote green technology innovation. Pu et al. [
14] constructed a dynamic optimal control model in the framework of carbon trading and carbon subsidy policies and found that the two policies exhibit cross impacts on firms’ returns and these two inputs. Luo et al. [
28] proposed a deep neural network-based auxiliary decision-making model for financial risk prediction in the carbon trading market to explore the dynamic risk spillover effects in the domestic and international carbon trading markets. Ma et al. [
29] constructed a staggered double-difference model to verify that the implementation of the policy significantly increased the amount of municipal domestic waste removed and the capacity of environmentally sound treatment.
However, few studies have simultaneously considered the impact of power battery recycling and carbon reduction on the demand for NEVs. In particular, the technical decision-making issues of the NEV manufacturer and the third-party power battery recycler are studied from a long-term and dynamic perspective. In our study, we consider consumer preferences for carbon emission reduction in the carbon trading policy environment and further address the challenge of inter-period coordination between NEV manufacturers and power battery recyclers in a dynamic environment.
2.2. NEV Supply Chain Operation and Management
Numerous scholars have studied the supply chain operation and management of NEVs [
30]. More scholars’ research on NEVs mainly focuses on the evaluation of the effectiveness of the policy. In order to explore the channels for NEVs to obtain points, Li et al. [
31] constructed a game-theoretic model to explore the optimal production decisions of duo-oligopoly enterprises under three typical channel strategies. Sengor et al. [
32] developed a model to explore EV car parks offering/tendering for the day-ahead and secondary reserve markets to minimize total costs. The results of the study showed a significant increase in profitability from participation in the reserve market compared to participation in the day-ahead market only. Lou et al. [
33] constructed a model of the diffusion of technology research and development of automobile enterprises considering the effect of technology spillover based on the evolutionary game theory of complex networks and explored the dynamic impact of adjusting the parameters of the double-integral policy on the diffusion of technology research and development diffusion of automobile enterprises. Zhou et al. [
34] considered a two-phase market with strategic consumers and studied the optimal single-rollover strategy, double rollover, and pricing scheme of a monopolistic NEV manufacturer under the NEV dual credit policy calculation criteria. The above research was carried out in the context of the double-points policy, which verifies the positive effect of the mandatory industrial policy on the promotion of NEVs. In addition, there are also scholars who have conducted research on carbon trading policies; for example, Tang et al. [
35] proposed reward and punishment mechanisms and policies and utilized a model based on Staklberg’s game theory to test the impact of reward and punishment mechanisms and policies on power battery recycling. Zhang et al. [
36] investigated the impact of low carbon emission reduction on the choice of battery laddering and recycling modes in the power battery supply chain under a carbon cap-and-trade policy. The above literature is in the static model; however, the decision-making of NEVs in terms of policy implementation and operation is long-term and dynamic rather than single-period. Therefore, it is more realistic to analyze the effectiveness of the policy from a dynamic perspective.
During the last 20 years, the recycling of power batteries has been of great concern for scholars. Through research on lithium batteries, Diekmann et al. [
37] discovered a safe and ecological recycling process that can result in a 75% recycled material rate. Yi et al. [
38] introduced blockchain technology and the prevention of information leakage into an NEV supply chain and investigated the long-term profits of members of the supply chain in four scenarios. In addition, some scholars have studied the power battery recycling strategy in the NEV supply chain. Zhu et al. [
39] derived battery capacity allocation strategies for electric vehicles by constructing a game optimization model under different channel structures in a closed-loop supply chain for NEVs. Gu et al. [
40] focused on the impact of government subsidies on the recyclability of power batteries, and Zhou et al. [
41] constructed a competitive closed-loop supply chain consisting of an electric vehicle manufacturer, an automotive retailer, and a third-party recycler, and they analyzed and compared the scenarios in which the manufacturer and the retailer have a channel power position. From the perspective of an NEV manufacturer, Li et al. [
42] considered a closed-loop supply chain consisting of a power battery supplier, an NEV manufacturer, and a third-party recycler, and they solved the mixed-power battery recycling strategy under different alliance approaches of the system’s members. In addition to this, more scholars have conducted numerous studies on the technological innovation of NEV charging stations [
43].
In the area of research related to electric vehicles and batteries, more research has focused on manufacturers, retailers, and third-party recyclers in the supply chain. Currently, there is very little research dealing with battery recycling and carbon trading policy. Therefore, unlike the existing studies, we investigate the inter-period co-ordination of the NEV supply chain under the battery recycling and carbon trading policy, which are explored in a dynamic and long-term environments.
2.3. Differential Game Model
Recently, several papers have used differential game models to observe the operational decisions of supply chain members. For example, using differential game models, Jørgensen et al. [
44] studied the dynamic cooperative advertising problem in a two-member channel. De Giovanni [
45] constructed differential game models in cooperative and non-cooperative scenarios in a supply chain consisting of a single manufacturer and a retailer, and they investigated the conditions under which a manufacturer shifts from an operational strategy to a marketing strategy in order to adequately face the trade-offs that arise when investing in quality improvement. In addition, Bertinelli et al. [
46] used a differential game approach to study the strategic behaviors of two countries facing transboundary CO
2 pollution. Liu et al. [
47] incorporated reference quality into a dynamic supply chain and constructed a differential game model to explore the impact of reference quality on product quality and pricing strategy as well as the profits of both members. De Giovanni et al. [
48] considered a dynamic closed-loop supply chain consisting of a manufacturer and a retailer, both of which invest in a product take-back program to increase the return on previously purchased products. The study proves that a coordinated solution can be achieved through the use of incentive strategies. Lu et al. [
49] incorporated reference prices into a differential game model and studied the joint pricing and advertising problem of monopolistic firms considering reference price effects, and they concluded that dynamic strategies outperform static strategies. In a low-carbon environment, Zhou and Ye [
50] constructed a differential game model to study the optimal equilibrium strategies of centralized and decentralized dual-channel supply chains. Kennedy et al. [
51] proposed a differential game model to evaluate the value of distributors in the dynamic stochastic cooperative advertising supply chain. In this supply chain, manufacturers wholesale their products to distributors, who, in turn, sell them to retailers. In this study, a system of coupled algebraic equations is used to characterize the feedback Starkerberg equilibrium and prove that it has a unique solution. Considering the perishable characteristics of the cold chain, Ma et al. [
52] constructed a differential game model to explore the investment in preservation technology and carbon emission reduction of cold chain members. Kuchesfehani et al. [
53] constructed a closed-loop supply chain that uses a stochastic dynamic game to explore the intertemporal nature of the payoffs from selling products for remanufacturing, describing and comparing solutions in two scenarios. Zhao et al. [
54] incorporated the consumer reference freshness effect into a differential game model to explore the optimal sales strategies under dual-channel and omni-channel modes. Liu et al. [
55] explored the operation of the sales model of an e-platform in the recycling problem by incorporating product goodwill into a differential game model in a supply chain consisting of a single manufacturer and an e-platform.
The above studies show that differential game models are suitable for solving long-term dynamic decision-making problems in low-carbon supply chains. However, none of the above studies have addressed the low-carbon operation of NEV supply chains, especially the research on technology investment strategies in the context of carbon trading policy. In summary, this study differs from previous research in several ways. Firstly, for supply chains under carbon trading policy, most of the previous studies have neglected to analyze carbon emission reduction investments in a dynamic environment. In this study, the impacts of carbon trading policies and battery recycling on the demand for NEVs are both considered within the dynamic NEV supply chain, and the impacts of the unit carbon emission trading price on carbon emission reduction investments and green promotion initiatives are analyzed. Second, compared with the existing research literature on the NEV supply chain, this paper incorporates power battery recycling into the NEV supply chain system. Thirdly, most of the existing studies consider static decision-making and coordination of the supply chain. This paper examines the operational management of NEV supply chains from a dynamic perspective rather than adopting a static perspective. Since both carbon emission reduction and green promotion are intertemporal, it is necessary to address this issue in a dynamic way. Therefore, this study employs a differential game model to study the carbon emission reduction investment and green promotion decisions of the NEV supply chain, and it designs an effective dynamic coordination contract. The results of this study provide a foundation for long-term cooperation among members of the NEV supply chain under carbon trading policy.
3. Problem Description and Basic Assumption
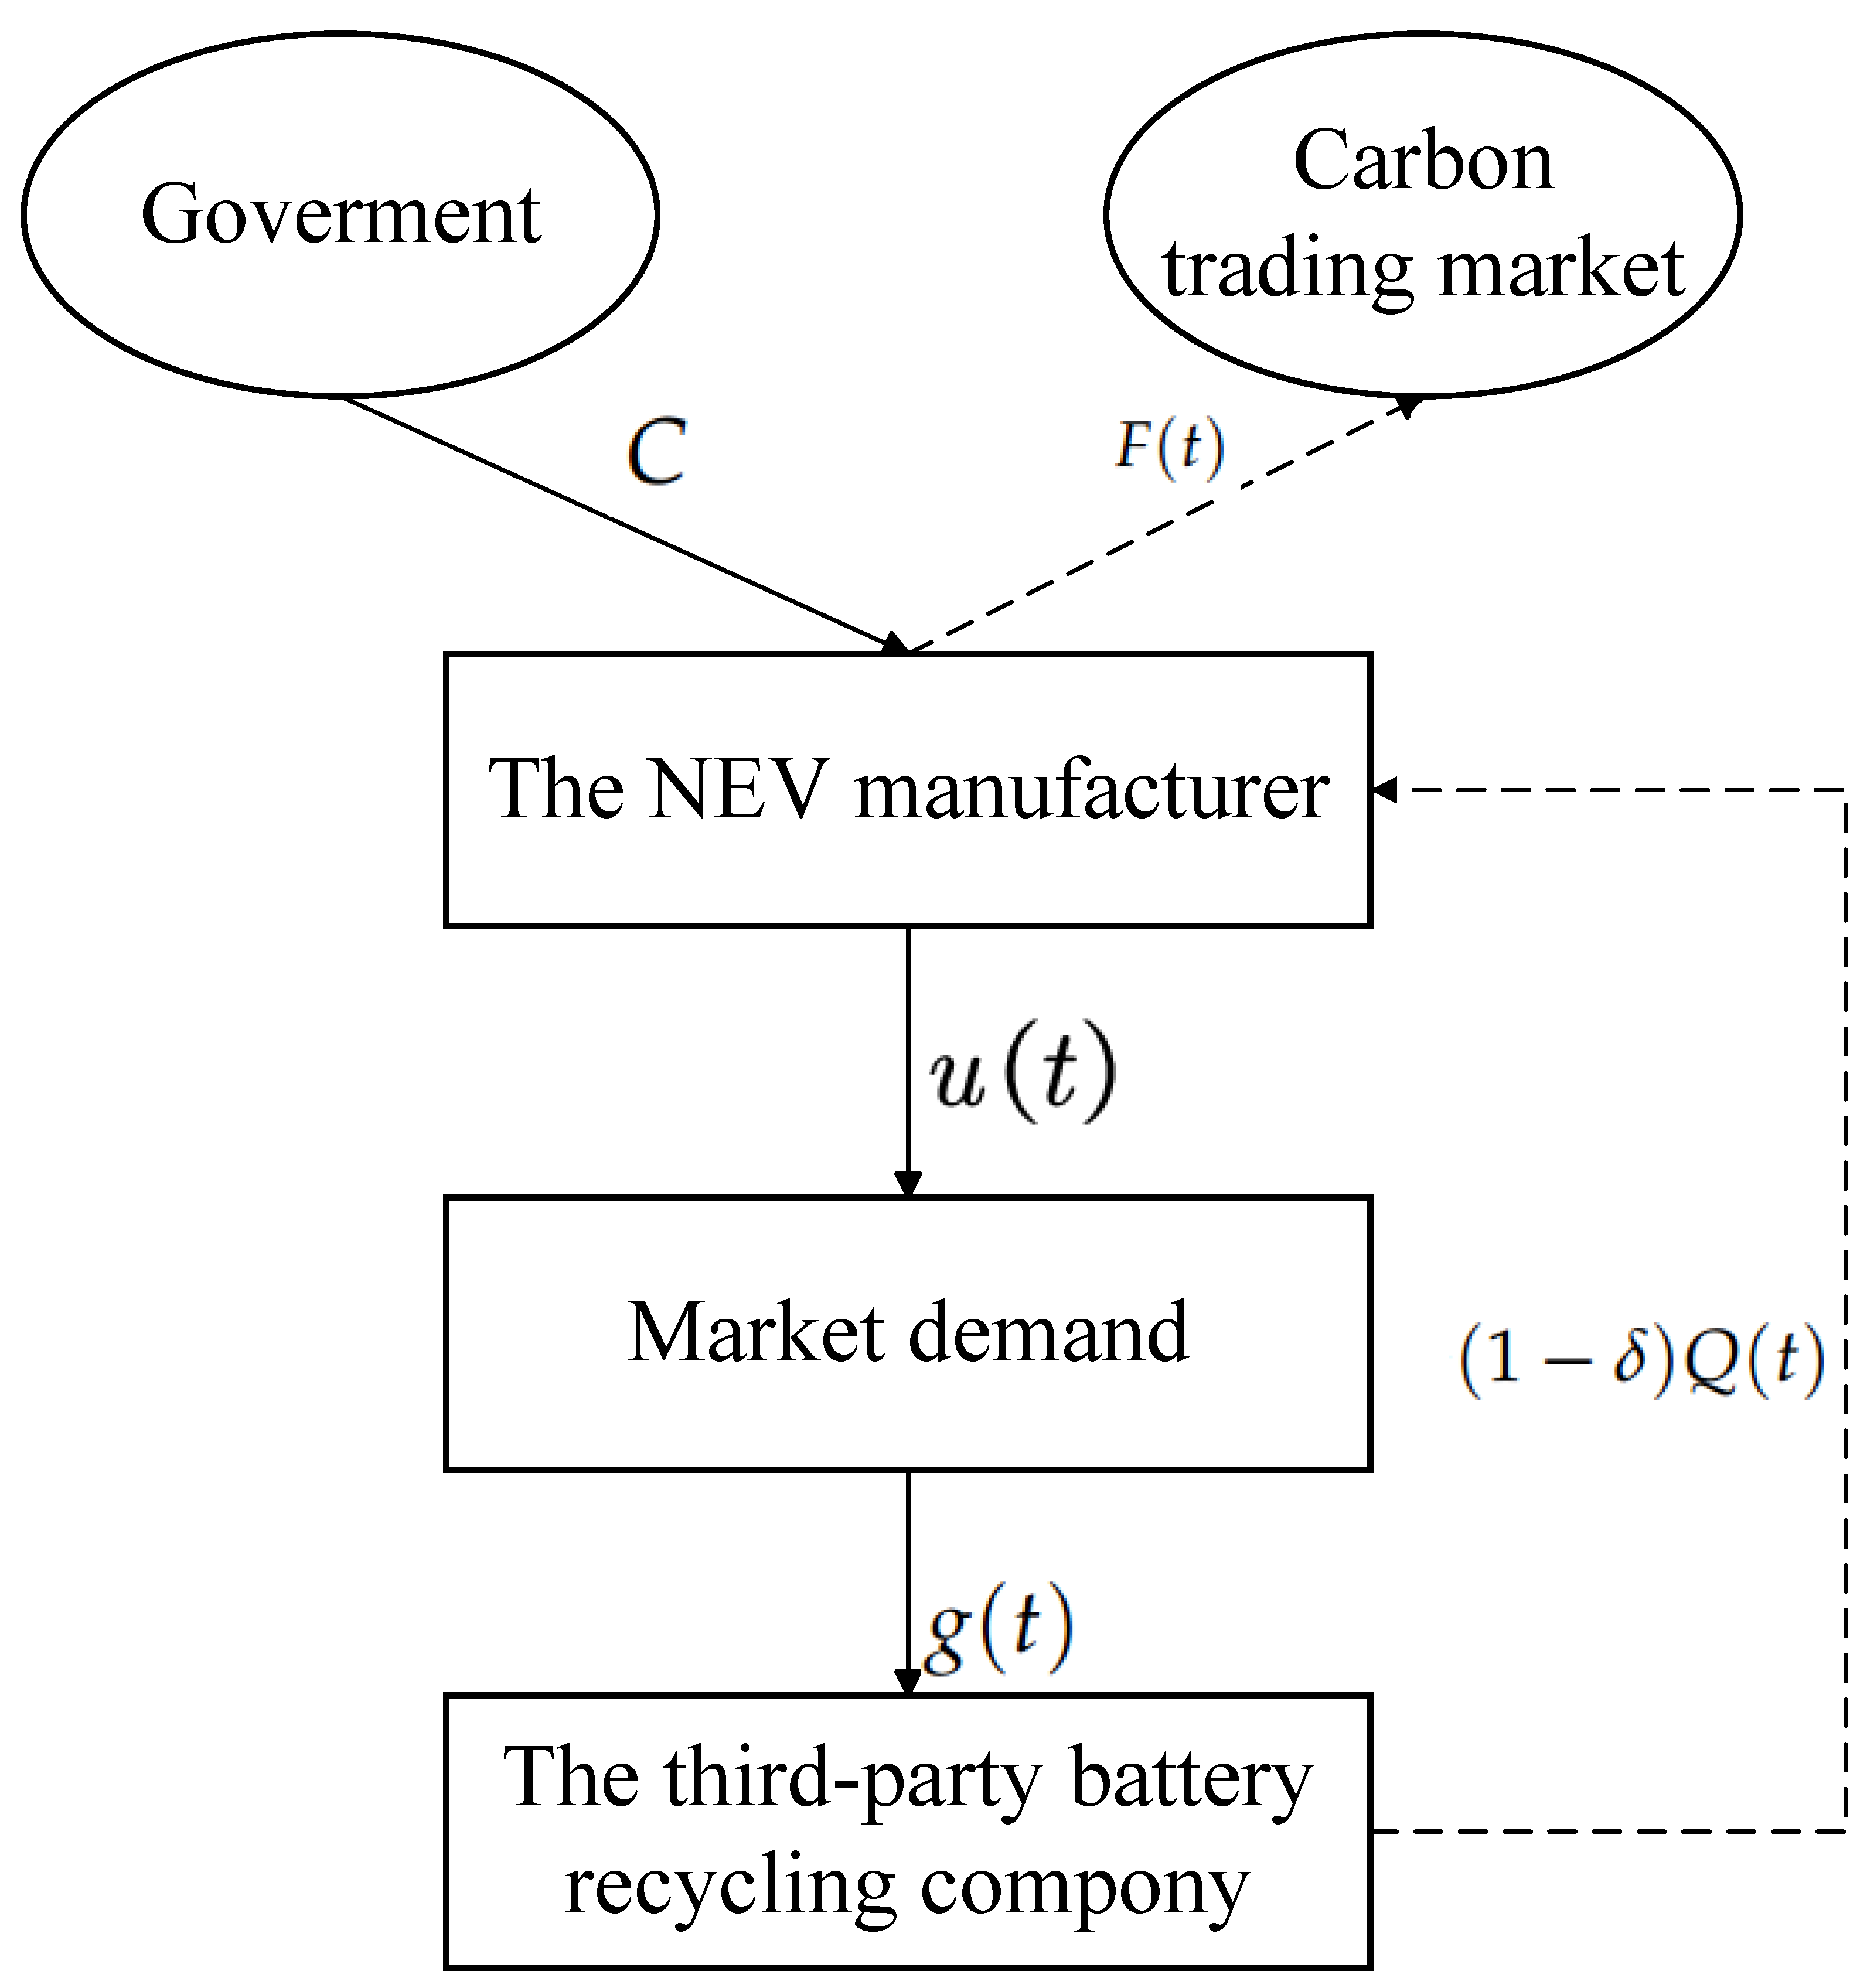
Under the government’s carbon trading policy, assume a secondary supply chain consisting of an NEV manufacturer and a third-party battery recycling company that sells NEVs using make-to-order: the government issues a certain amount of carbon quota
C to the NEV manufacturer, who are responsible for producing NEVs and power batteries, reducing carbon emissions by investing in carbon emission reduction technologies
, and using the remaining carbon quota
to trade at a profit. The third-party power battery recycling company collects decommissioned batteries for graded treatment (gradient utilization
or dismantling to extract material
for resale to the manufacturer), and at the same time carries out green promotion
. Both parties make dynamic decisions based on the Stackelberg game—the NEV manufacturer prioritizes emission reduction inputs, and the third-party power battery recycling company then develops a green promotion strategy, both aiming to maximize profits. Recycled materials are reintroduced into the production process, forming a closed loop of “production–recycling–regeneration”, where carbon trading and the recycling supply chain synergize to drive the low-carbon transition. The specific decision-making in the proposed NEV chain is presented in
Figure 1.
The variables and parameters involved in the model are defined as shown in
Table 1. Based on the investigation of the NEV supply chain practices and referring to existing related studies, we make the following assumptions.
Assumption 1. According to Wei et al. [56], Wang et al. [25], and Song et al. [57], we assume that the carbon abatement cost and the green promotion cost are quadratic functions of the carbon abatement effort and the green promotion effort , respectively. Then, the carbon abatement cost for the NEV manufacturer at time t is , and the green promotion cost of the third-party battery recycling company at time t is , where , , are the cost coefficients for low carbon emission reduction for the NEV manufacturer and the cost coefficients of green promotion for the third-party battery recycling company, respectively. Assumption 2. The goodwill of NEVs will positively affect the market demand for NEVs. Therefore, the market demand for NEVs at time t is represented aswhere denotes the potential market size of NEVs without considering goodwill, denotes the coefficient of the impact of goodwill on the market demand for NEVs, and denotes the goodwill of NEVs. Assumption 3. The goodwill associated with NEVs enhances the recycling of power batteries. Simultaneously, the green promotion contributes to the increase in power battery recycling [25]. Therefore, the recycling function of power batteries at time t iswhere represents the impact coefficient of NEV goodwill on the power battery recovery function, and signifies the impact coefficient of green promotion on the power battery recovery function. Assumption 4. Following from Zhu et al. (2024) [58], under a carbon trading policy, the price at which the NEV manufacturer sells a unit of carbon emission permit is , and the government allocates carbon allowances C to the NEV manufacturer at the beginning of the implementation of the carbon trading. Then, the remaining carbon emission permits of the NEV manufacturer at time t are Among these variables, represents the market demand for NEVs at time t, indicates the proportion of recycled materials given to the NEV manufacturer after dismantling by the third-party battery recycling company, denotes the carbon emissions per unit of NEV production, represents the carbon emissions per unit of NEVs using recycled materials, and indicates the carbon emissions saved in the process of remanufacturing power NEVs. To guarantee a positive solution, should satisfy .
Assumption 5. This study adopts the classical model of Nerlove and Arrow [59] to explain the dynamic effects of the goodwill of NEVs. The increase in residual carbon permits increases goodwill [60], and the green promotion of the third-party battery recycling company increases the goodwill of NEVs [39]. In addition, the goodwill of NEVs is a dynamic process over time; therefore, there will be a natural decay of goodwill [61]; Then, the goodwill of NEVs at time t iswhere denotes the impact coefficient of the remaining carbon emission permits on the goodwill of NEVs, denotes the impact coefficient of green promotion on the goodwill of NEVs, and denotes the natural decay coefficient of goodwill over time. Based on the above assumptions, the target generalized functions of the NEV manufacturer and the third-party battery recycling company during the whole operation period are
where
denotes the discount rate for the NEV manufacturer and the third-party battery recycling company over an infinite time interval.
4. Methods and Techniques of the Study
The study of differential games originated in the 1940s and was initially applied to the problem of fugitive pursuit by both sides in military confrontations. Since then, differential game models have been widely used to study conflict problems arising in different disciplines such as operations management, marketing, and economics. And we mainly explore the application of differential game models in dynamic supply chains. Initially, differential game models were mainly constructed in the case of duopoly to obtain Nash equilibrium. Later, differential game models became mainly found in hierarchical or sequential decision-making situations in supply chains and marketing channels, and they mainly study the conflict and coordination problems related to inventory, production, wholesale, and retail pricing strategies.
Differential game models in dynamic supply chains are characterized by the following features: (i) the state of the dynamic system at any time
t is characterized by a set of variables called state variables. Typical state variables are market share, sales, inventory, goodwill, etc. (ii) There are decision variables called control variables that are chosen by the game player: e.g., order quantity, pricing, advertising, and shelf space decisions. (iii) The evolution of the state variables over time is described by a set of differential equations containing the state and control variables. (iv) Each participant has an objective function (e.g., the present value of the profit stream over time), which it tries to maximize by making choice decisions. (v) Strategies are either finite or infinite in continuous time. The specific steps for solving the differential game model are shown in
Figure 2.
5. Model Construction and Solution
Both carbon emission reduction technologies and green promotion initiatives are long-term dynamic processes with intertemporal effects. In this context, both the NEV manufacturers and the third-party battery recycling company seek to maximize their cumulative profits over the long term. Consequently, we introduce a dynamic framework to examine the strategies for carbon emission reduction and green promotion strategies within the NEV supply chain.
This chapter first analyzes and compares the equilibrium strategies, goodwill trajectories, and economic benefits of the NEV supply chain under centralized and decentralized decision-making models. It then compares the coordination effects of two different contracts, i.e., the unilateral cost-sharing contract and the bilateral cost-sharing contract.
5.1. Centralized Decision-Making Model
Under centralized decision-making, the members of the decentralized supply chain work collaboratively to maximize the overall profit of the supply chain system. They make joint decisions on the carbon emission reduction effort and the green promotion effort. At this time, the decision-making objective for the entire NEV supply chain system is
Long-term cumulative profit consists of vehicle sales revenue from the NEV manufacturer (), cost savings from the NEV manufacturer using recycled materials to produce battery products (), revenue from the sale of carbon emission permits (), revenue from the sale of battery components and recycled materials by the third-party power battery recycling company (), carbon emission reduction investment costs of the NEV manufacturer (), and green promotion costs of the third-party power battery recycling company ().
Proposition 1. Equilibrium results of centralized decision-making:
(i) The optimal carbon reduction efforts of the NEV manufacturer and the optimal green promotion effort of the third-party battery recycling company arewhere . (ii) The optimal trajectory and steady state value of goodwill for NEVs are (iii) The optimal profit of the NEV supply chain system iswhere , , and are in Appendix A. Proposition 1 shows that in the centralized decision-making scenario, the optimal decision of the NEV manufacturer on the carbon reduction technology effort, and the optimal decision of the third-party battery recycling company on the green promotion effort are time-independent. All efforts increase as the marginal profit of power battery recycling and the marginal profit of power battery secondary utilization increase. Proposition 1 also shows that the equilibrium profit of the NEV supply chain is increasing in goodwill.
Corollary 1. Under centralized decision-making, the optimal technology investment and optimal goodwill of the NEV supply chain members vary with relevant parameters as follows:
(i) The optimal carbon emission reduction effort of the NEV manufacturer varies with the trading price of the unit carbon emission permit, which is ; the optimal green promotion effort of the third-party battery recycling company varies with the trading price of the unit carbon emission permit, which is when ; and when .
(ii) The optimal level of goodwill for NEVs varies with the trading price per unit of carbon emission permit as follows: when , ; when , .
(iii) The optimal carbon reduction effort of the NEV manufacturer varies with consumers’ goodwill preference as when ; and when . The optimal green promotion effort of the third-party battery recycling company varies with consumers’ goodwill preference as when ; and when .
According to Corollary 1(i), the trading price per unit of carbon emission permits has a positive impact on the carbon emission reduction efforts of the NEV manufacturer. This suggests that when the trading price per unit of carbon emission permits increases, the NEV manufacturer should increase their investment in carbon emission reduction technology and produce greener NEVs to promote consumer purchases. When consumers’ green information sensitivity is higher than the threshold , the trading price per unit of carbon emission trading permits has a positive effect on the green promotion efforts of the third-party battery recycling company. Corollary 1(ii) shows that the trading price per unit of carbon emission trading permits has a positive impact on the goodwill of NEVs when the investment cost coefficient of the NEV manufacturer’s carbon abatement technology is higher than the threshold value . The price per unit of carbon emission trading permits has a positive impact on the goodwill of NEVs. Corollary 1(iii) illustrates that the sensitivity coefficient of goodwill to demand () positively affects the carbon reduction efforts of the NEV manufacturer and the green promotion effort of the third-party battery recycling company when the proportion of waste power batteries used for recycling () is small. The sensitivity coefficient of goodwill to demand () has a negative impact on the carbon reduction efforts of the NEV manufacturer and the green promotion effort of the third-party battery recycling company when the proportion of waste power batteries used for recycling utilization () is large.
5.2. Decentralized Decision-Making Model
In this scenario, the NEV manufacturer and the third-party battery recycling company engage in the Stackelberg differential game, making decisions based on their respective efforts to maximize profits. The sequence of decisions is as follows: first, the NEV manufacturer decides its optimal carbon reduction effort
, and then the third-party battery recycling company decides its optimal green promotion effort
. The decision objectives of the NEV manufacturer and the third-party battery recycling company are
The long-term cumulative profit of the NEV manufacturer consists of revenues from the sale of NEVs (), profits from savings from the use of recycled materials (), revenues from the sale of carbon permits (), and the cost of investment in carbon abatement technologies (). The long-term cumulative profit of the third-party battery recycling company consists of revenues from the sale of battery components and recycled materials (), as well as the cost of investment in green promotion technologies ().
Proposition 2. Equilibrium outcomes of decentralized decision-making:
(i) The optimal carbon reduction effort of the NEV manufacturer and the optimal green promotion effort of the third-party battery recycling company are (ii) The optimal trajectory and steady state value of goodwill for NEVs are (iii) The optimal profit for the NEV manufacturer and the third-party battery recycling company areThe optimal profit of a two-tier NEV supply chain iswhere , , , , and are in Appendix C. Proposition 2 suggests that in the decentralized scenario, the optimal decision of the NEV manufacturer regarding carbon reduction efforts is independent of the marginal profit from power battery recycling and the marginal profit from a power battery. Additionally, Proposition 2 indicates that the equilibrium profits of both the NEV manufacturer and the third-party battery recycling company increase with goodwill.
Corollary 2. Under decentralized decision-making, the optimal technology investment and optimal goodwill of the NEV supply chain members vary with the relevant parameters as follows:
(i) The optimal carbon emission reduction effort of the NEV manufacturer varies with the trading price per unit of carbon emission permit as ; the optimal green promotion effort of the third-party battery recycling company varies with the trading price per unit of carbon emission permit as .
(ii) The changing pattern of the optimal goodwill of NEVs with the trading price per unit of carbon emission permit is .
(iii) The optimal carbon reduction effort of the NEV manufacturer varies with the consumer’s goodwill preference when , ; and when , ; the optimal green promotion effort of the third-party battery recycling company varies with the consumer’s goodwill preference when .
In decentralized decision-making, Corollary 2(i) reveals that the optimal carbon reduction effort of the NEV manufacturer monotonically increases with the trading price of carbon emission permits per unit, for the same reason as Corollary 1(i). The trading price of unit carbon emission permits has no effect on the green promotion investment of the third-party battery recycling company. Corollary 2(ii) states that the trading price per unit of carbon emission trading permits has a positive effect on the goodwill of NEVs. Corollary 2(iii) shows that the sensitivity coefficient of goodwill to demand () has a positive impact on the carbon emission reduction level of the NEV manufacturer when the proportion of waste power batteries used for recycling () is small, and the sensitivity coefficient of goodwill to demand () has a negative impact on the carbon emission reduction efforts of the NEV manufacturer when the proportion of waste power batteries used for recycling () is large. The sensitivity coefficient of goodwill to demand () has a negative impact on the green promotion of the third-party battery recycling company.
Corollary 3. , , , , , , .
Corollary 3 indicates that the optimal carbon reduction effort, green promotion effort, steady-state goodwill, goodwill, market demand, recycling volume, and total profit of the NEV supply chain under centralized decision-making are better than those under decentralized decision-making. This study suggests that centralized decision-making can enhance the goodwill and market demand for NEVs while improving the efficiency of the NEV supply chain. Additionally, it facilitates the recycling of power batteries. Therefore, coordinating the decentralized supply chain is essential for members of the NEV supply chain.
5.3. A Decentralized Decision-Making Model with Unilateral Cost Allocation
To realize the coordination within the NEV supply chain, we first study the coordination effect of unilateral cost-sharing contracts on NEVs. In the unilateral cost-sharing contract, the NEV manufacturer shares the green promotion cost with the third-party recycling company, thereby encouraging the third-party battery recycling company to enhance its promotional efforts for the power battery recycling of NEVs. Let
be the proportion of green promotion costs shared by the NEV manufacturer for the third-party battery recycling company (
); then, the decision problems of the NEV manufacturer and the third-party battery recycling company are as follows:
where
is the green promotion cost shared by the NEV manufacturer for the third-party battery recycling company.
In this scenario, the optimal feedback equilibrium strategies of the NEV manufacturer and the third-party battery recycling company as well as the optimal state trajectory of the goodwill of the NEV are shown in Proposition 3.
Proposition 3. Equilibrium outcomes under a decentralized decision-making model with unilateral cost allocation:
(i) The optimal equilibrium strategy for the carbon reduction effort of the NEV manufacturer, the green promotion effort of the third-party battery recycling company, and the cost-sharing ratio of green promotion are (ii) The optimal trajectory and steady state value of goodwill for NEVs are (iii) The optimal profit for the NEV manufacturer and the third-party battery recycling company areThe optimal profit of a two-tier NEV supply chain iswhere , , , , and are in Appendix F. Proposition 3 demonstrates that under a decentralized decision-making model with unilateral cost allocation, the NEV manufacturer shares the green promotion costs of the third-party battery recycling company only when the condition is satisfied.
Corollary 4. When , , , , , , , , , .
Corollary 4 suggests that if the NEV manufacturer shares the green promotion costs of the third-party battery recycling company, the decisions of the NEV manufacturer on carbon reduction effort remain unchanged. In addition, the green promotion effort of the third-party battery recycling company is enhanced, which, in turn, boosts market demand for NEVs and increases the volume of power batteries recycled. Consequently, the long-term benefits for the NEV manufacturer and the third-party battery recycling company grow as their respective demands rise. However, under a unilateral cost-sharing contract, even if the condition that the price per unit of carbon emission permit is above a certain threshold is satisfied, the optimal decision-making of the carbon emission reduction efforts by the NEV manufacturer, the green promotion efforts of the third-party battery recycling company, and the overall trajectory of goodwill for NEVs, as well as total profit, cannot achieve optimal levels under centralized decision-making.
5.4. Bilateral Cost Sharing Contract
In this section, we first examine the impact of bilateral cost-sharing contracts on the coordination of the two-tier NEV supply chain. Under the bilateral cost-sharing contract, the NEV manufacturer shares the green promotion costs with the third-party battery recycling company, thereby encouraging the recycling company to enhance its promotional efforts. Simultaneously, the NEV manufacturer requests that the third-party battery recycling company contribute to the costs associated with carbon emission reduction. Assume that
is the proportion of green promotion cost shared by the the NEV manufacturer for the third-party battery recycling company (
) and
is the carbon emission reduction cost shared by the third-party battery recycling company for the the NEV manufacturer manufacturer (
). The decision problems of the NEV manufacturer and the third-party battery recycling company are expressed as follows:
where
is the carbon reduction cost shared by the third-party battery recycling company for the NEV manufacturer.
The optimal feedback equilibrium strategies of the NEV manufacturer and the third-party battery recycling company, as well as the optimal state trajectory of goodwill in the decentralized decision-making based on the bilateral cost-sharing contract, are shown in Proposition 4.
Proposition 4. Equilibrium outcomes under bilateral cost-sharing contracts:
(i) The optimal equilibrium strategies for the carbon emission reduction effort of the NEV manufacturer, the green promotion effort of the third-party battery recycling company, the carbon emission reduction cost-sharing ratio, and the green promotion cost-sharing ratio are (ii) The optimal trajectory and steady state value of goodwill for NEVs are (iii) The optimal profits for the NEV manufacturer and the third-party battery recycling company areThe optimal profit of a two-tier NEV supply chain iswhere , , , , and are in Appendix H. Proposition 4 suggests that under the bilateral cost-sharing contract, the decisions of both the NEV manufacturer and the third-party battery recycling company reach the level of centralized decision-making, and the optimal trajectory of goodwill is the same as that under centralized decision-making.
Corollary 5. , , , , , , .
Corollary 5 depicts that the bilateral cost-sharing contract can effectively improve the optimal strategy under decentralized decision-making, so that the systematic decision-making of the two-tier supply chain of NEVs in the decentralized decision-making model, the trajectory of goodwill, the demand for NEVs, and the recycling of power batteries can reach the level of the centralized decision-making scenario.
When there is no coordination of independent decision-making by members of the NEV supply chain, the policy environment is more relaxed, and there is no mandatory cooperation requirement, members of the NEV supply chain prefer decentralized decision-making. When the decision-making of supply chain members is unified by the central agency, enterprises may adopt centralized decision-making. Unilateral cost-sharing contracts are mainly found when there is a clearly dominant enterprise in the supply chain. Bilateral cost-sharing pacts, on the other hand, require both parties to share costs, emphasize risk sharing and benefit sharing, and require a high level of trust and a long-term cooperative relationship to promote the green transformation of the entire NEV supply chain.
6. Numerical Experiments
In order to be able to more intuitively analyze the impact of basic parameters on the goodwill of the NEV manufacturer, the carbon emission reduction effort, the green promotion effort, and profits of supply chain members, this chapter reports on the use of Matlab software to carry out example analyses for each of the above four differential game decision models. Yang et al. [
62] and Zhu et al. [
58] assigned values to the parameters in the model as follows:
,
,
,
,
,
,
,
,
,
,
,
,
,
,
,
,
,
,
. Meanwhile, according to Corollary 4, it can be seen that the above parameter settings satisfy
, so the analysis of this algorithm is carried out on the premise that the third-party battery recycling company are willing to cooperate with the the NEV manufacturer.
6.1. Effects of Time t
The development and production cycle of NEVs is usually 5–10 years, so the simulation time t is set to 5 years or longer, so as to cover the complete dynamic process of the closed loop of technology investment and recovery. In addition, the impact of carbon trading policy needs to be reflected in the medium and long term and cannot be reflected in the short term, so the time horizon needs to meet the observation requirements of the policy transmission effect, and finally, it needs to be verified whether the model converges to the steady-state equilibrium. Therefore, the time range selected in this paper is [0, 1.4] (the unit of t is 10 years).
According to the optimal solution of Equations (
10), (
16), (
25), and (
35) for the goodwill of NEVs, the optimal trajectory of the goodwill of NEVs over time is obtained by replicating the parameters of
,
, and
, respectively, with
t as the independent variable (
Figure 3). As can be seen from
Figure 3, the goodwill of NEVs over time has three trends: first, when the initial value of the goodwill of NEV is lower than the steady-state value, the goodwill of NEVs increases over time and gradually tends to stabilize; second, when the initial value of the goodwill of NEVs is higher than the steady-state value, the goodwill of NEVs decreases over time and gradually tends to stabilize; third, when the initial value of the goodwill of NEVs is equal to the steady-state value, the goodwill of NEVs remains unchanged over time. Therefore, the time trajectory of goodwill in NEVs is related to the initial and steady-state values of goodwill, and the steady-state value of goodwill is not related to the initial value of goodwill but only to the operation mode chosen by NEV companies. Regardless of the initial value of goodwill for NEVs, at a steady state, goodwill in the centralized scenario increases by 15% compared to the decentralized scenario, and the unilateral cost-sharing covenant increases by 3.8% compared to the decentralized scenario.
Choose
= 20 and keep all other parameters unchanged. As illustrated in
Figure 4a,b, under the three different decisions, both the demand for NEVs and the quantity of power battery recycling gradually increase to the steady state. At the steady state, for the demand for NEVs, the centralized scenario shows an increase of 14.5% compared to the decentralized scenario, and the unilateral cost-sharing pact increases by 5.2% compared to the decentralized scenario. For the power battery recycling volume, the centralized scenario shows a 14.4% increase compared to the decentralized scenario, and the unilateral cost-sharing pact shows an increase of 3.1% compared to the decentralized scenario. This trend occurs because, in the centralized decision-making model, the NEV manufacturer exerts the greatest effort in carbon reduction, while the third-party battery recycling company demonstrates the strongest commitment to green initiatives, resulting in the highest market demand for NEVs. To meet this demand, manufacturers must increase NEV production, which, in turn, further promotes the recycling of power batteries. As shown in
Figure 4c, the number of remaining carbon permits gradually decreases over time, reaching a steady-state level under three different decision-making approaches. At the steady state, for the remaining carbon permits, there is a 9.9% increase in the centralized scenario compared to the decentralized scenario, and a 4.3% increase in the unilateral cost-sharing compact compared to the decentralized scenario. This trend is attributed to the increased demand for NEVs, which stimulates the recycling of power batteries. This recycling process reduces carbon emissions during remanufacturing, thereby decreasing the number of carbon permits required.
As can be seen from
Figure 5a, the total profit of the NEV supply chain exhibits an initial increase followed by a decline across all three decision-making scenarios. Notably, the profit generated under the centralized decision-making model is the highest. When
, for the NEV supply chain, the centralized scenario shows an increase of 45.2% compared to the decentralized scenario, and the unilateral cost-sharing pact shows an increase of 20.5% compared to the decentralized scenario. Further analysis in
Figure 5b,c reveals that, under the unilateral cost-sharing contract, both the NEV manufacturer and the third-party battery recycling company achieve significantly higher profits compared to the decentralized decision. When
, for the NEV manufacturer, the centralized scenario shows an increase of 36.3% compared to the decentralized scenario, and the unilateral cost-sharing pact shows an increase of 8.4% compared to the decentralized scenario. When
, for the third-party power battery recycling company, the centralized scenario grows by 49.7% compared to the decentralized scenario, and the unilateral cost-sharing pact grows by 12.9% compared to the decentralized scenario. This can be attributed to the fact that the unilateral cost-sharing agreement fosters greater trust between the two members of the NEV supply chain. Consequently, both the NEV manufacturer and the third-party battery recycling company are motivated to enhance their efforts in improving the overall profitability of the supply chain, which, in turn, boosts the efficiency and risk resilience of the entire system.
6.2. Effects of and
Figure 6 and
Figure 7 analyze the sensitivity coefficient of goodwill to demand (
) for NEVs and the proportion of waste power batteries used for recycling (
) in relation to carbon emission reduction efforts, green promotion initiatives, goodwill, and the economic benefits for supply chain members across three scenarios within the NEV supply chain. To improve the clarity of this comparison, we use t = 1 as a case study for our experimental analysis.
Figure 6a indicates that the increase in the sensitivity coefficient of goodwill to demand (
) for NEVs and the proportion of waste power batteries used for recycling utilization (
) leads to an increase in the carbon reduction effort of the NEV manufacturer, and that the carbon reduction effort is the highest under centralized decision-making, and the second highest and the same under decentralized decision-making and the unilateral cost-sharing contract.
Figure 6b shows that the increase in the goodwill-to-demand sensitivity factor (
) for NEVs and the proportion of waste power batteries used for recycling utilization (
) leads to an increase in the green promotion effort of the third-party battery recycling company and is highest under centralized decision-making, second highest under unilateral cost-sharing pacts, and lowest under decentralized decision-making, and that
(
) and
(
) increase with
when
is given.
Figure 6c suggests that goodwill increases with the increase in the goodwill-to-demand sensitivity factor (
) for NEVs. When
is small, goodwill increases with the increase in
. The change in goodwill under decentralized decision-making is the most pronounced, and the change in goodwill under the unilateral cost-sharing contract is smoother. When
is large, goodwill decreases with an increase in
.
Figure 7 shows the sensitivity coefficient of goodwill to demand (
) for NEVs and the proportion of waste power batteries used for recycling utilization (
) on the profits of the NEV supply chain, the NEV manufacturer, and the third-party battery recycling company.
Figure 7a depicts the optimal profit change rule of the NEV supply chain system under three kinds of decisions. With the increase in the proportion of waste power batteries used for recycling utilization
and the sensitivity coefficient of goodwill to demand
, the profit of the supply chain increases, and the profit of the supply chain always satisfies
. Among them, the profit of the supply chain under the centralized decision-making increases most significantly with the increase in the proportion of waste power batteries used for recycling utilization
. And when
is given,
(
) is always greater than
(
).
Figure 7b depicts the optimal profit change pattern of the NEV manufacturer under the three decisions. As the proportion of waste power batteries used for recycling (
) and the sensitivity coefficient of goodwill to demand (
) increase, the profit of the NEV manufacturer increases, and
is always satisfied.
Figure 7c depicts the optimal profit change law of the third-party battery recycling company under the three decisions. As the proportion of waste power batteries used for recycling utilization (
) and the sensitivity coefficient of goodwill to demand (
) increase, the profit of the third-party battery recycling company increases and always satisfies
. Among them, the difference in the profit of the third-party battery recycling company under the centralized decision-making and the unilateral cost-sharing contract is more pronounced as
increases.
As can be seen from
Figure 6 and
Figure 7, to achieve sustainable development and effective emission reduction in the NEV supply chain, we should try to promote centralized decision-making (bilateral Cost Sharing Contract) or a decentralized decision-making model with unilateral cost allocation, strengthen cooperation and coordination among supply chain members, improve resource utilization efficiency, and reduce carbon emissions, and at the same time, increase support for the green promotion technology of third-party power battery recycling companies to promote the whole supply chain’s green transformation.
Table 2 demonstrates the impact of the proportion of batteries recycled (
) on the cost-sharing rate in a bilateral cost-sharing contract. As shown in
Table 2, as
decreases, the NEV manufacturer should increase the green promotion cost share of the third-party battery recycling company. Similarly, as
increases, the third-party battery recycling company should increase its share of the NEV manufacturer’s carbon abatement costs and residual carbon permit profits.
All in all, for the NEV manufacturer, carbon emissions should be strictly managed, and they should be required to adopt environmentally friendly production processes to reduce carbon emissions in the production process, while the NEV manufacturer should be encouraged to carry out carbon reduction innovations. Third-party power battery recycling enterprises should be encouraged to carry out green promotion and achieve supply chain synergy efficiency. A perfect power battery recovery and reuse system should be established to achieve the recycling of battery resources. The contribution of NEVs in reducing carbon emissions should be demonstrated through publicity and educational activities, e.g., demonstrating the contribution of NEVs in reducing carbon emissions, which, in turn, raises consumers’ awareness of the low-carbon and environmentally friendly nature of NEVs and guides them to choose low-carbon travel.
7. Conclusions
As the production process of NEV manufacturers consumes relatively large amounts of energy and generates large quantities of carbon emissions, research on power battery recycling has received much attention in recent years. However, as most of the studies have used static models to optimize the low-carbon operation of the NEV supply chain [
11,
20,
22,
63], the long-term carbon emission reduction technology investment and green promotion strategies for supply chain members have not yet been tested. Therefore, this paper proposes a differential game model to study the optimal carbon emission reduction and green promotion strategies and coordination mechanisms of an NEV supply chain considering power battery recycling under a carbon trading policy. We examine and compare long-term carbon reduction efforts, green promotion efforts, and goodwill and supply chain profits under four different scenarios, and we set the time so that short-term changes and long-term patterns can be clearly analyzed when comparing the four scenarios. Unlike Che et al. [
64], we also design a bilateral cost-sharing contract to coordinate the supply chain. Finally, we conducted numerical experiments to illustrate the theoretical results and performed sensitivity analyses on certain basic parameters. Through this study, we found several interesting results.
(i) There are three trends in the optimal trajectory of goodwill for NEVs, all determined by the relationship between the size of the initial and steady state values of goodwill. Compared with the decentralized scenario, the recycling volume of used batteries in the centralized scenario increased by 14.4%, and the recycling volume of used batteries under the unilateral cost-sharing pact increased by 5.2%. It also helps to improve the carbon reduction level of the NEV manufacturer and the green promotion level of third-party battery recycling company. At the same time, it increases economic benefits for the supply chain and its members. Both the carbon emission reduction efforts of the NEV manufacturer and the green promotion efforts of the third-party battery recycling company are time-independent.
(ii) Through the differential game model, it is revealed that the unit carbon trading price reaches a critical threshold, which is a prerequisite for the NEV manufacturer to start technical cooperation with the battery recycling company. Only when the trading price of the remaining carbon emission permits meets certain conditions will the NEV manufacturer choose to cooperate with the third-party battery recycling company, and the cooperation can achieve the double dividend of “emission reduction and efficiency” of the supply chain and help the recycling of used power batteries. The existence of a carbon trading policy will make the conditions of cooperation between members of the NEV supply chain more stringent.
(iii) The centralized decision-making model significantly outperforms the two decentralized decision-making models. As Song et al. [
65] points out, the unilateral cost-sharing contract model can achieve Pareto improvement, but not full coordination. This paper extends the model so that, compared to the unilateral cost-sharing contract, the bilateral cost-sharing contract can fully coordinate NEV supply chains under certain conditions.
The above findings break through the limitations of the traditional supply chain that only focuses on cost-effectiveness and internalize the dynamic price of the carbon market as an important factor for enterprise cooperation, which opens up new ideas for the research on the NEV supply chain game.
8. Practical Implications and Limitations
For the NEV manufacturer, when the unit carbon trading price exceeds a certain threshold, they should give preference to signing a two-way cost contract with a third-party power battery recycling company rather than building their own recycling system. For the third-party power battery recycling company, they should take the initiative to cooperate with the NEV manufacturer, attracting them to co-invest in green promotion technologies and stimulating corporate cooperation to reduce emissions.
This paper explores the optimal decision-making and benefits of the secondary supply chain of NEVs in the context of carbon trading policy. Related to the NEV industry is also the double-points policy; particularly, the synergistic mechanism between the carbon trading policy and the dual credit policy still exists as a research gap. Future research can focus on exploring the combination of the two types of policies to produce a better policy combination scheme for the low-carbon transformation of the NEV industry. In addition, the model only considers a supply chain consisting of a single NEV manufacturer and a third-party battery recycling company, and it does not involve power battery ladder utilization companies, whereas the actual NEV supply chain usually consists of multiple members with far more complex partnerships, so we can consider expanding this area in the future.


