
Navigating Energy Efficiency and Mould Risk in Australian Low-Rise Homes: A Comparative Analysis of Nine External Wall Systems in Southeast Australia


Abstract
:1. Introduction
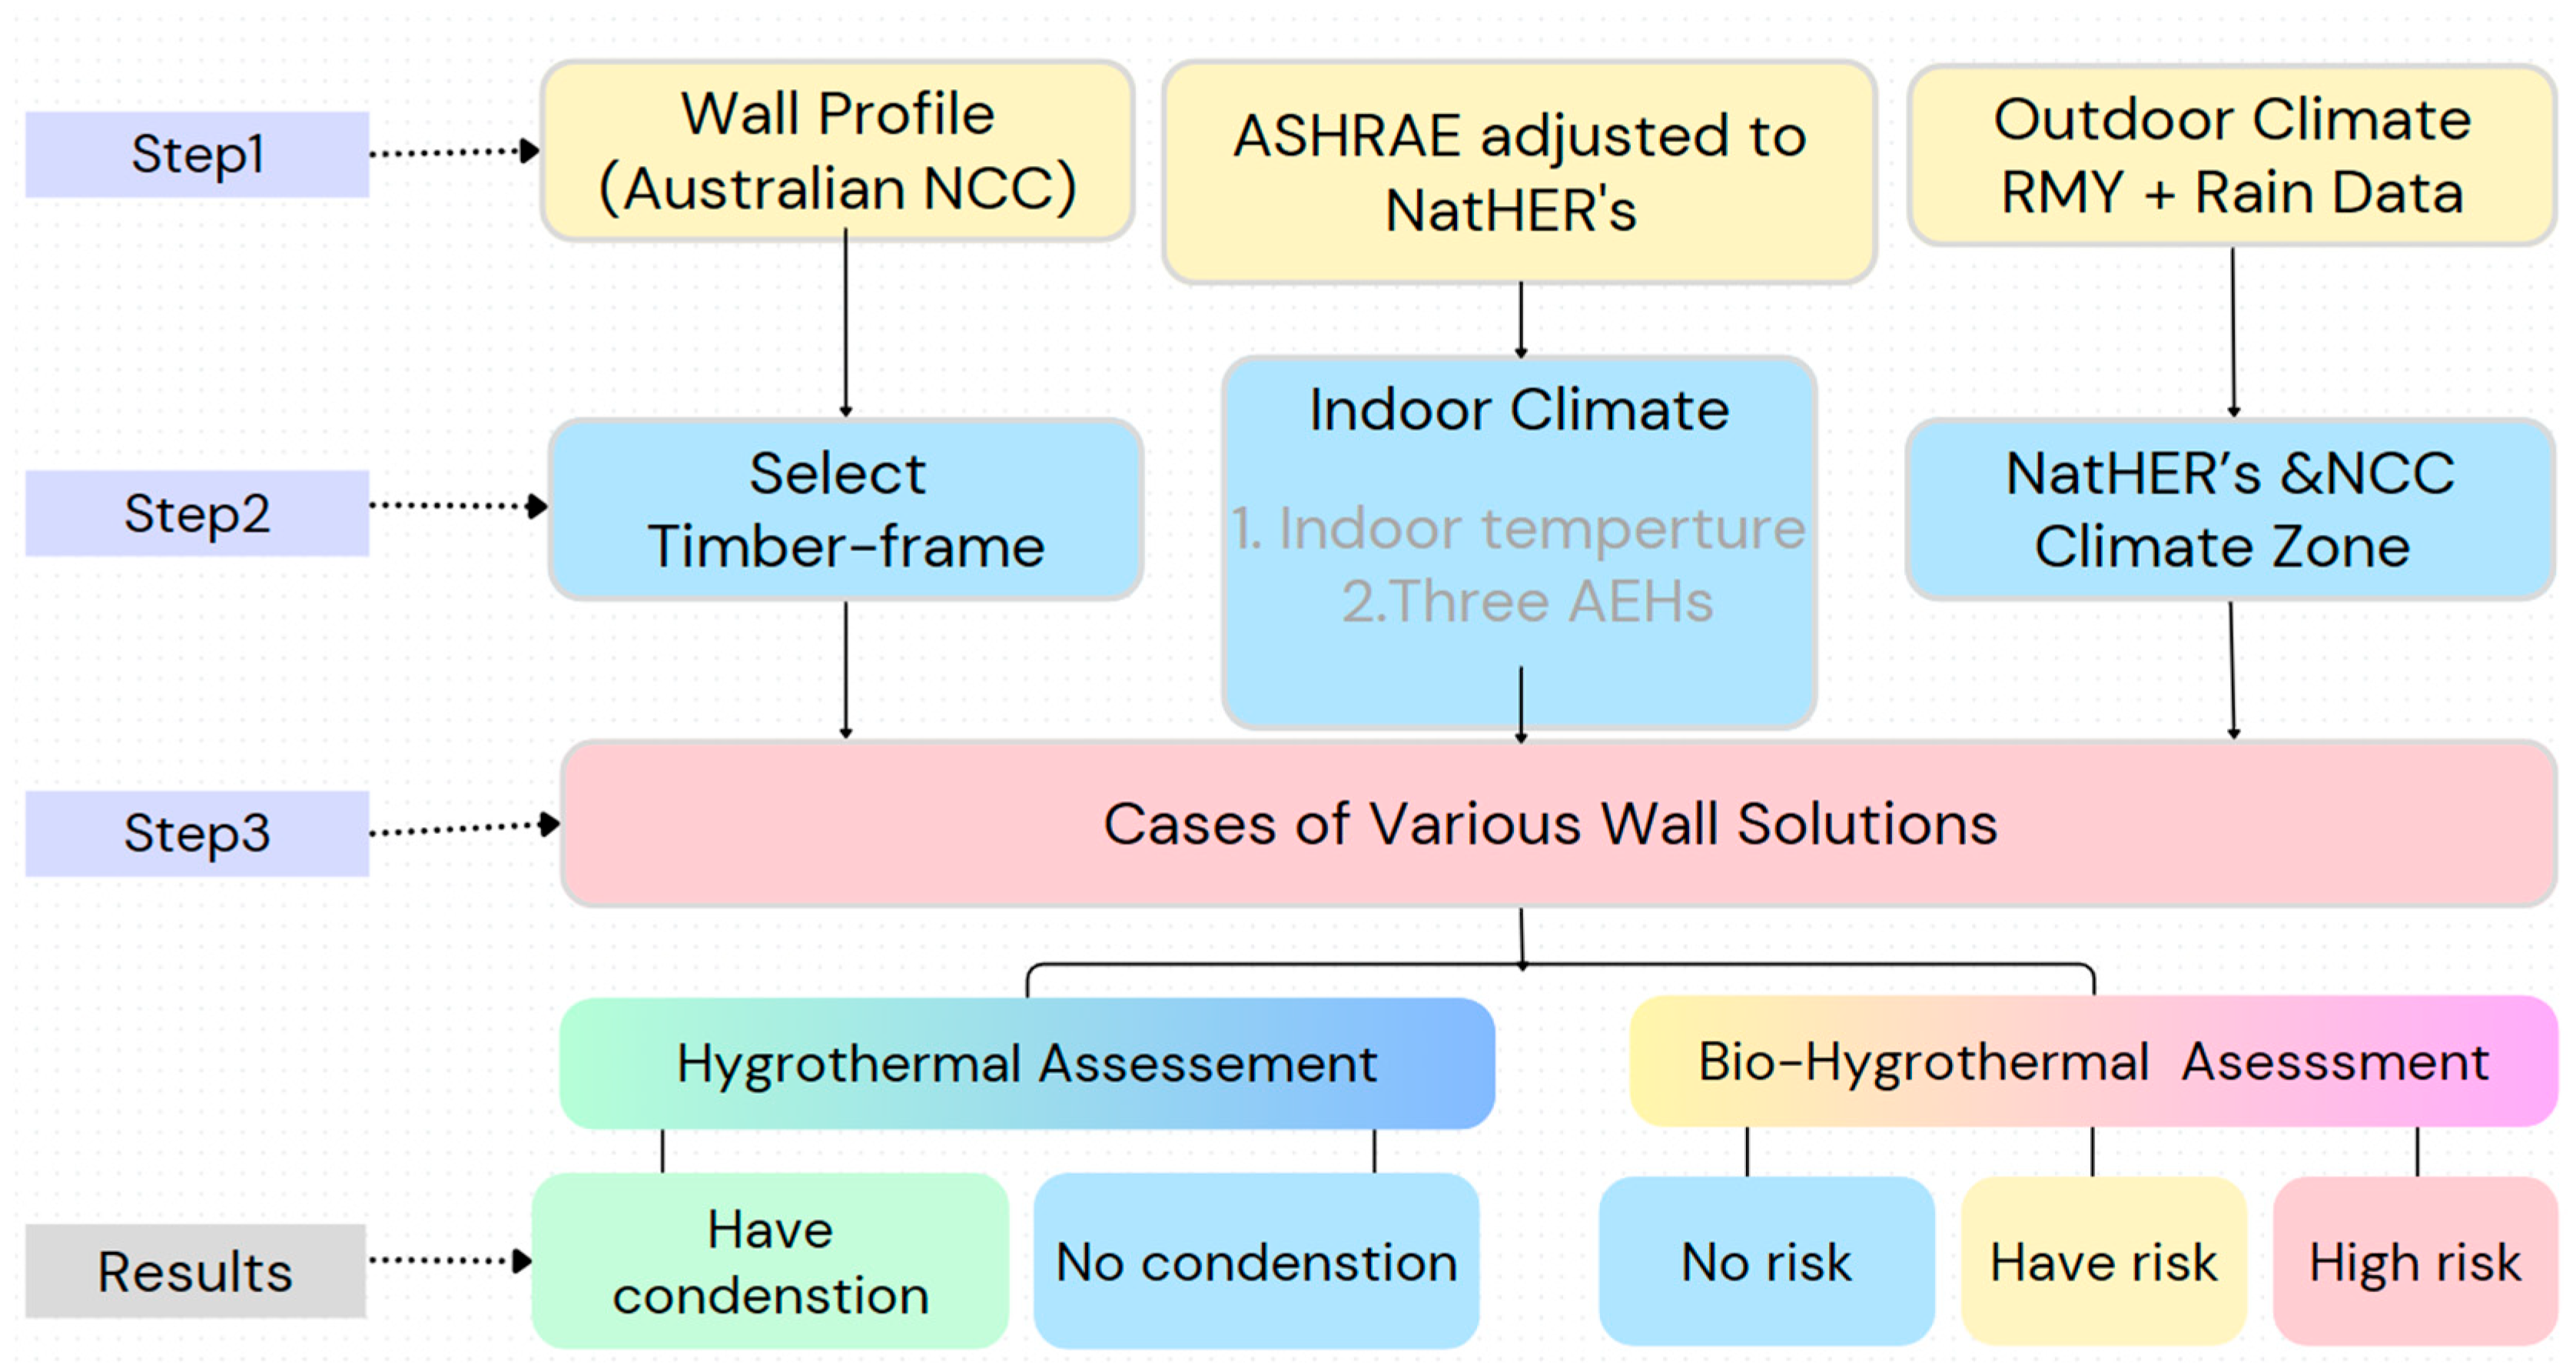
2. Research Method
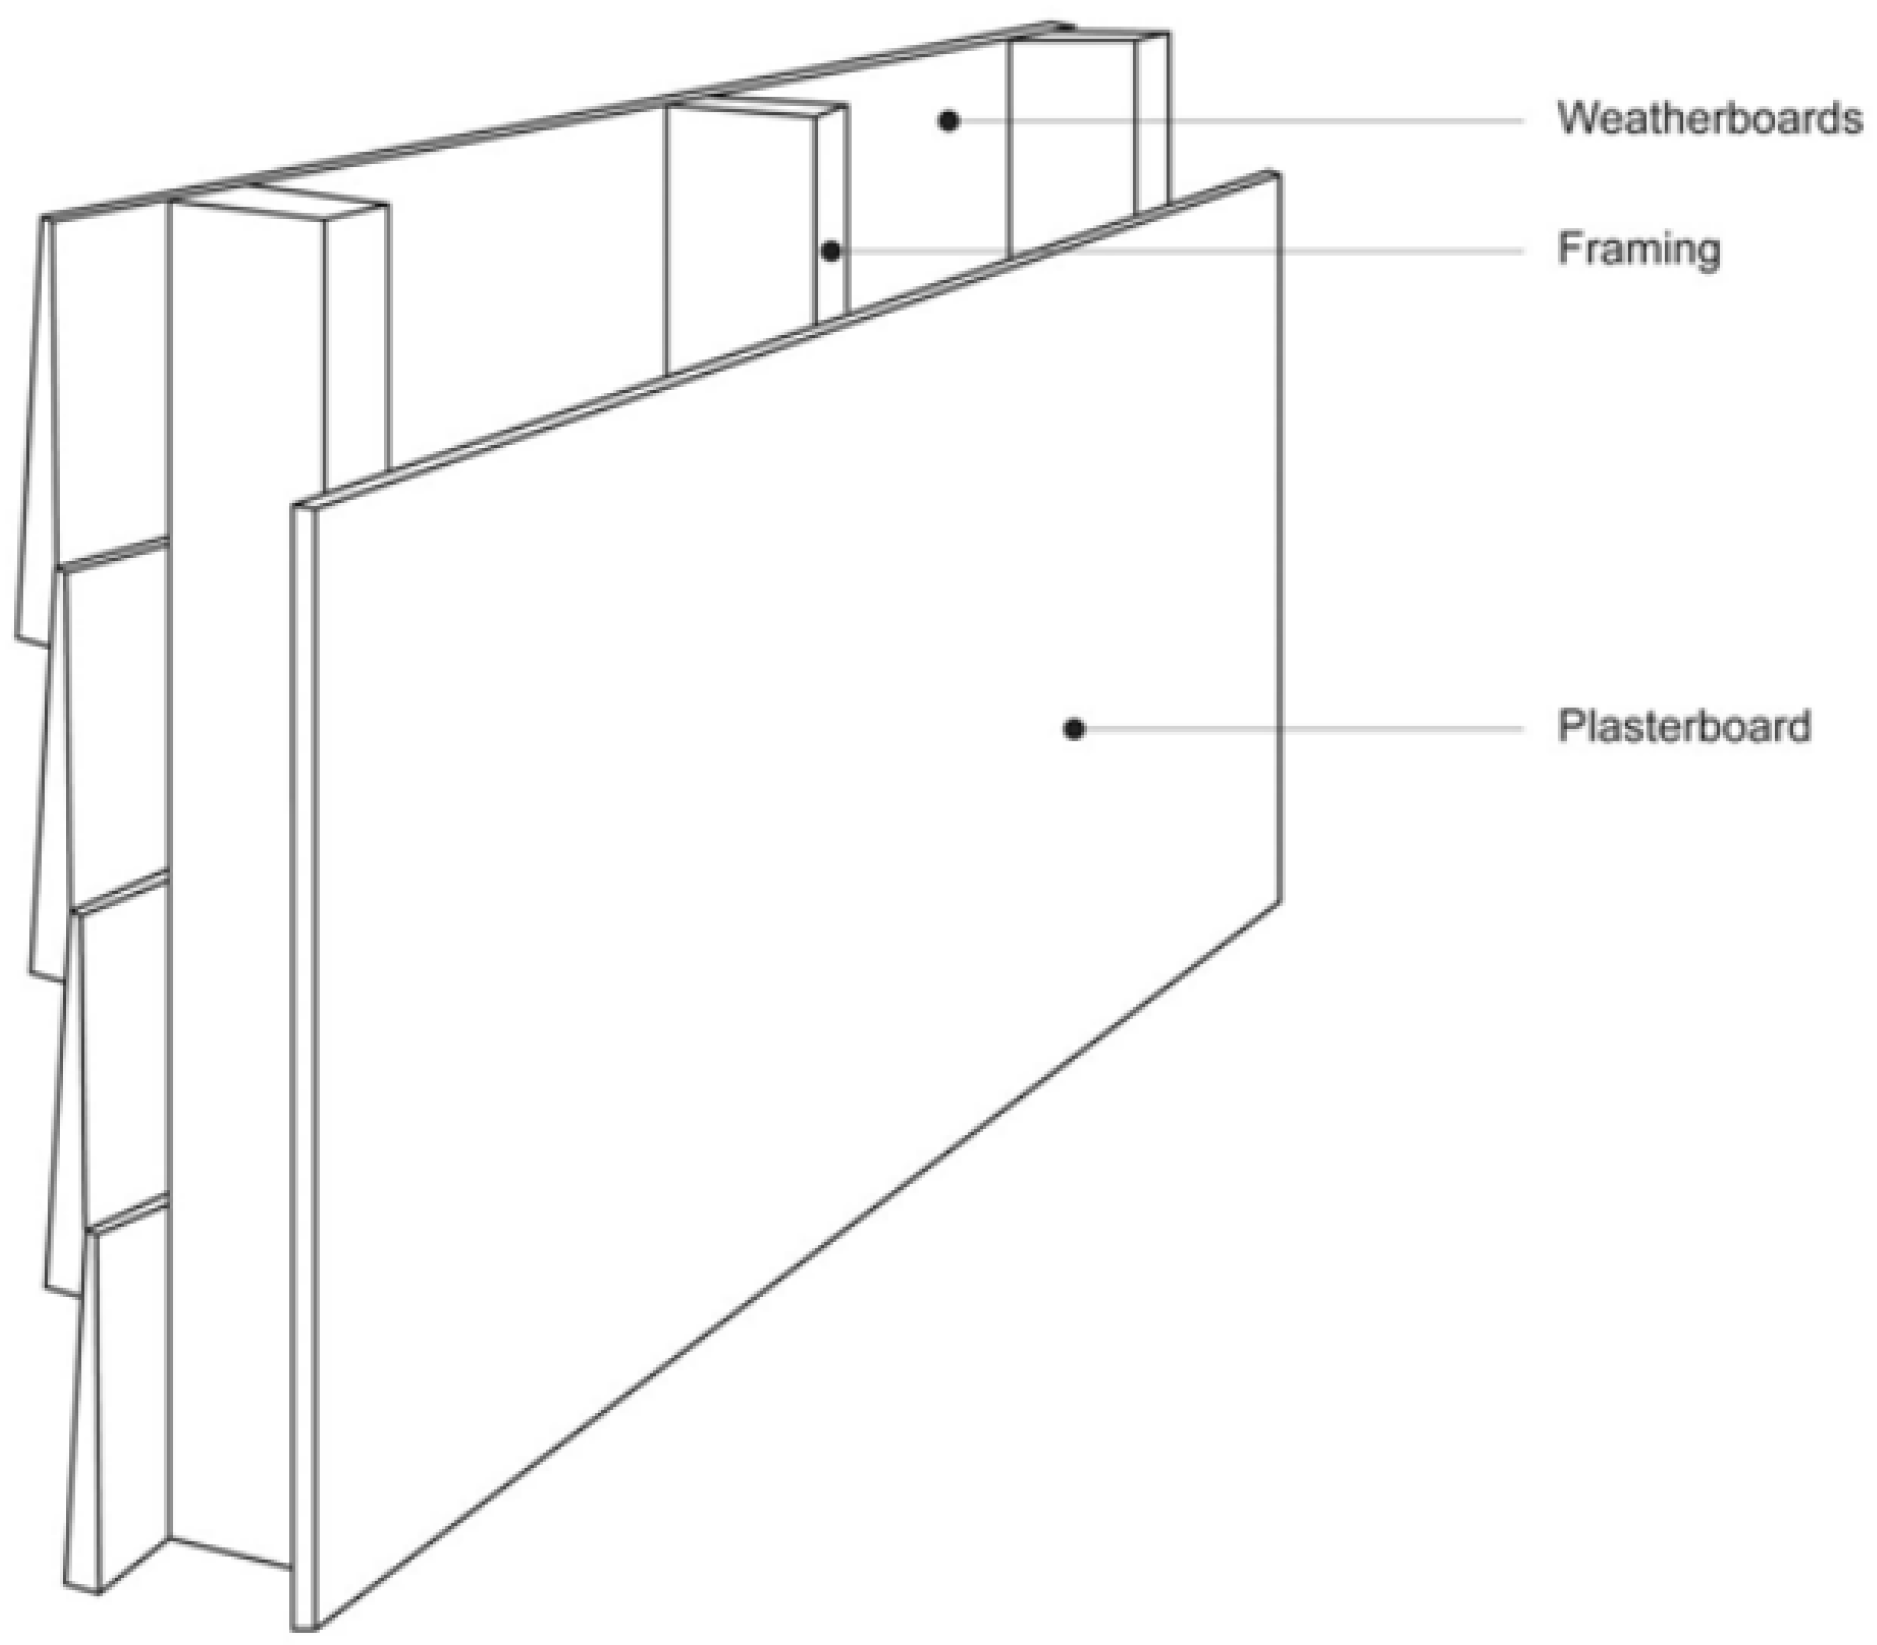
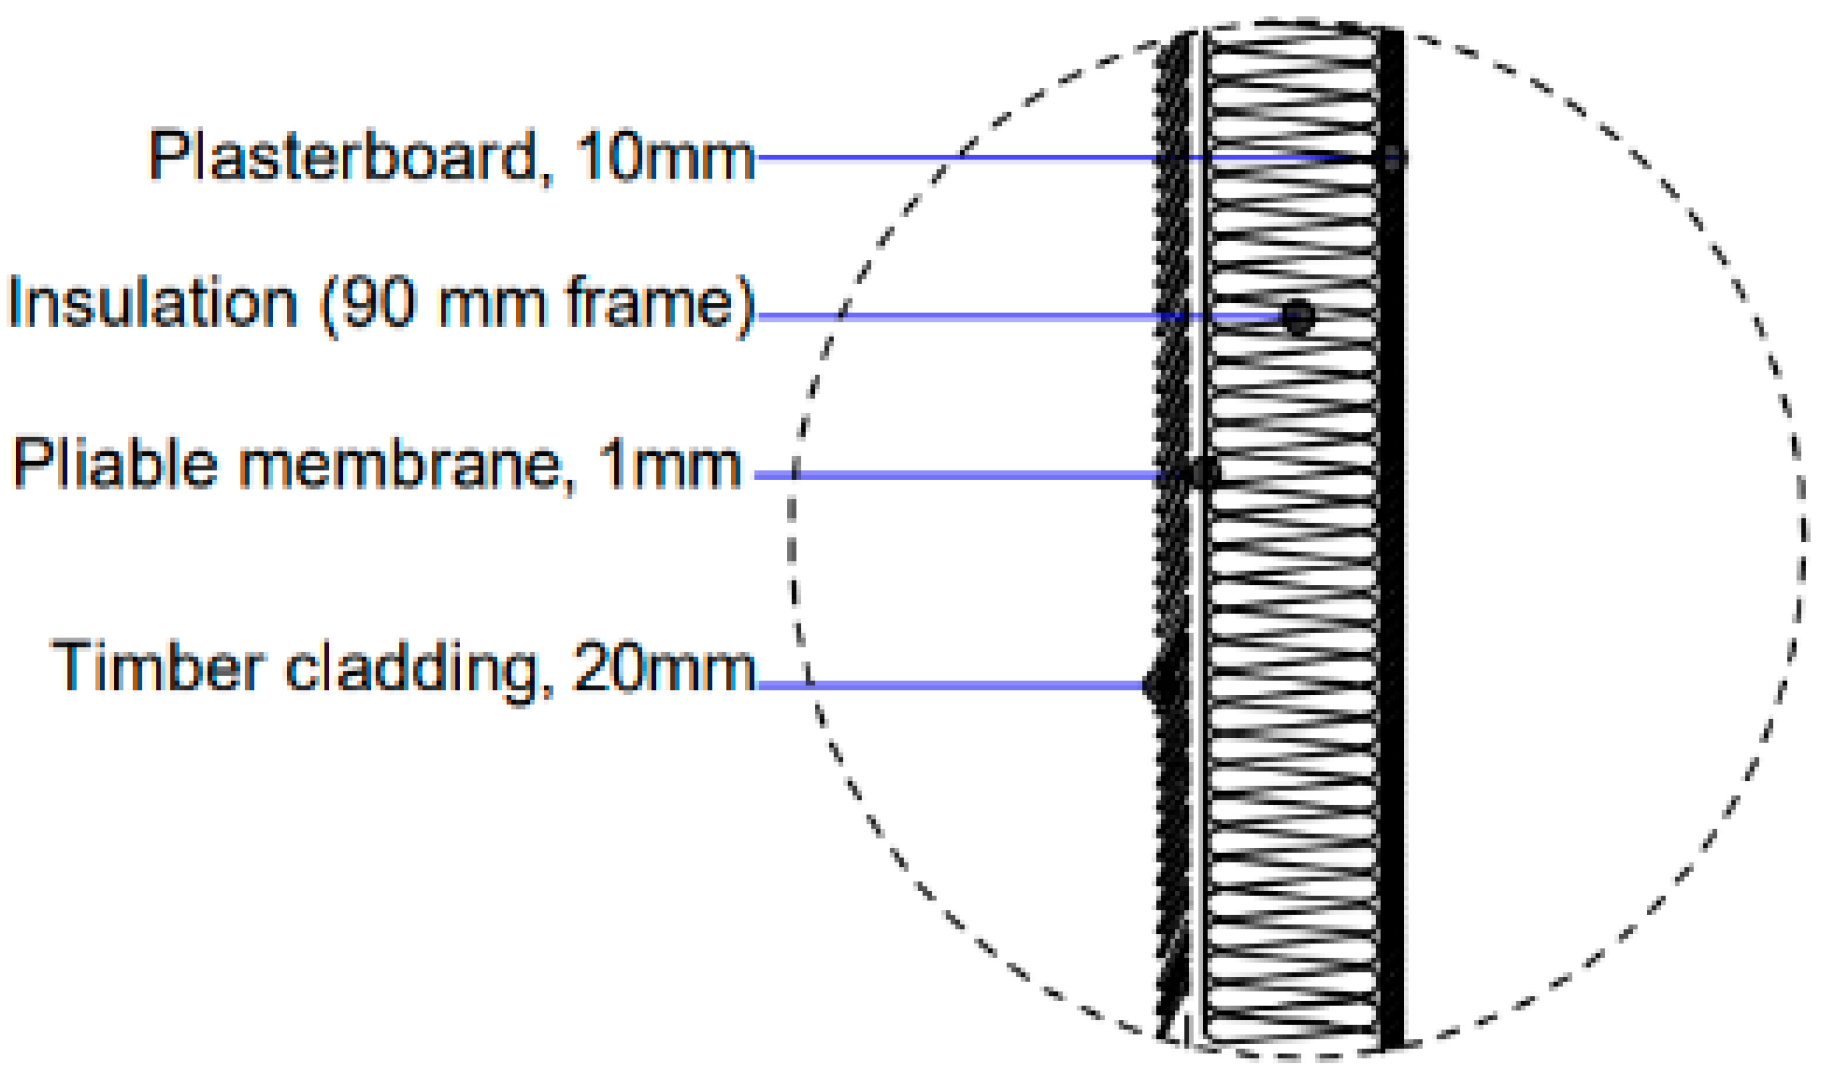
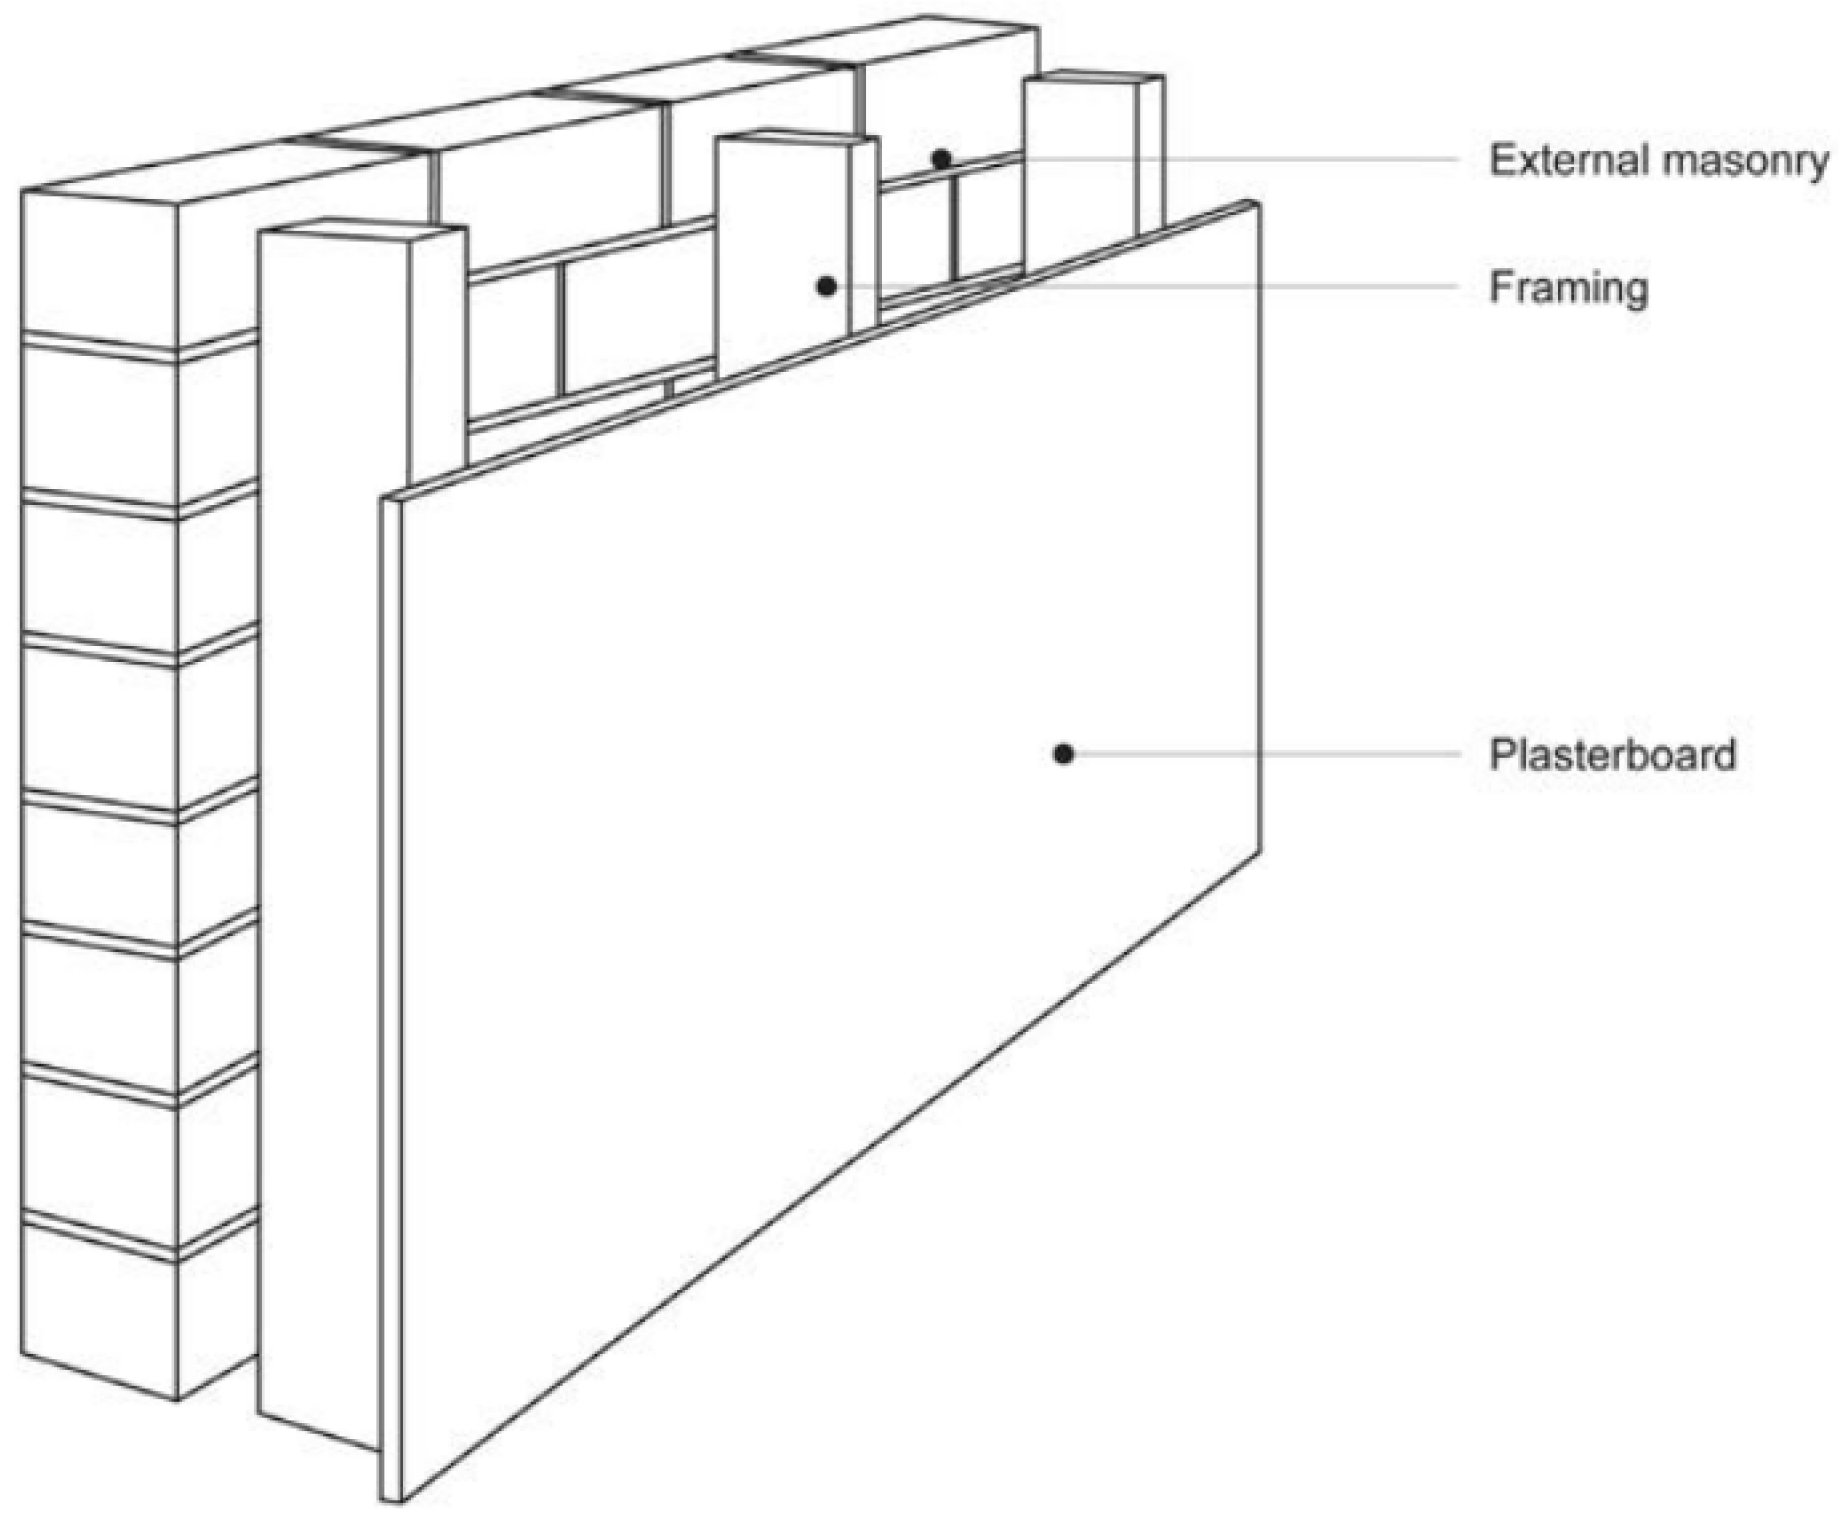
2.1. Timber-Framed External Wall Envelop Assemblies
- -
- inside and outside surface of plaster board;
- -
- interior and exterior surface of the glass-wool batt insulation;
- -
- interior and exterior surfaces of pliable membranes;
- -
- interior and exterior surface of clay brick.
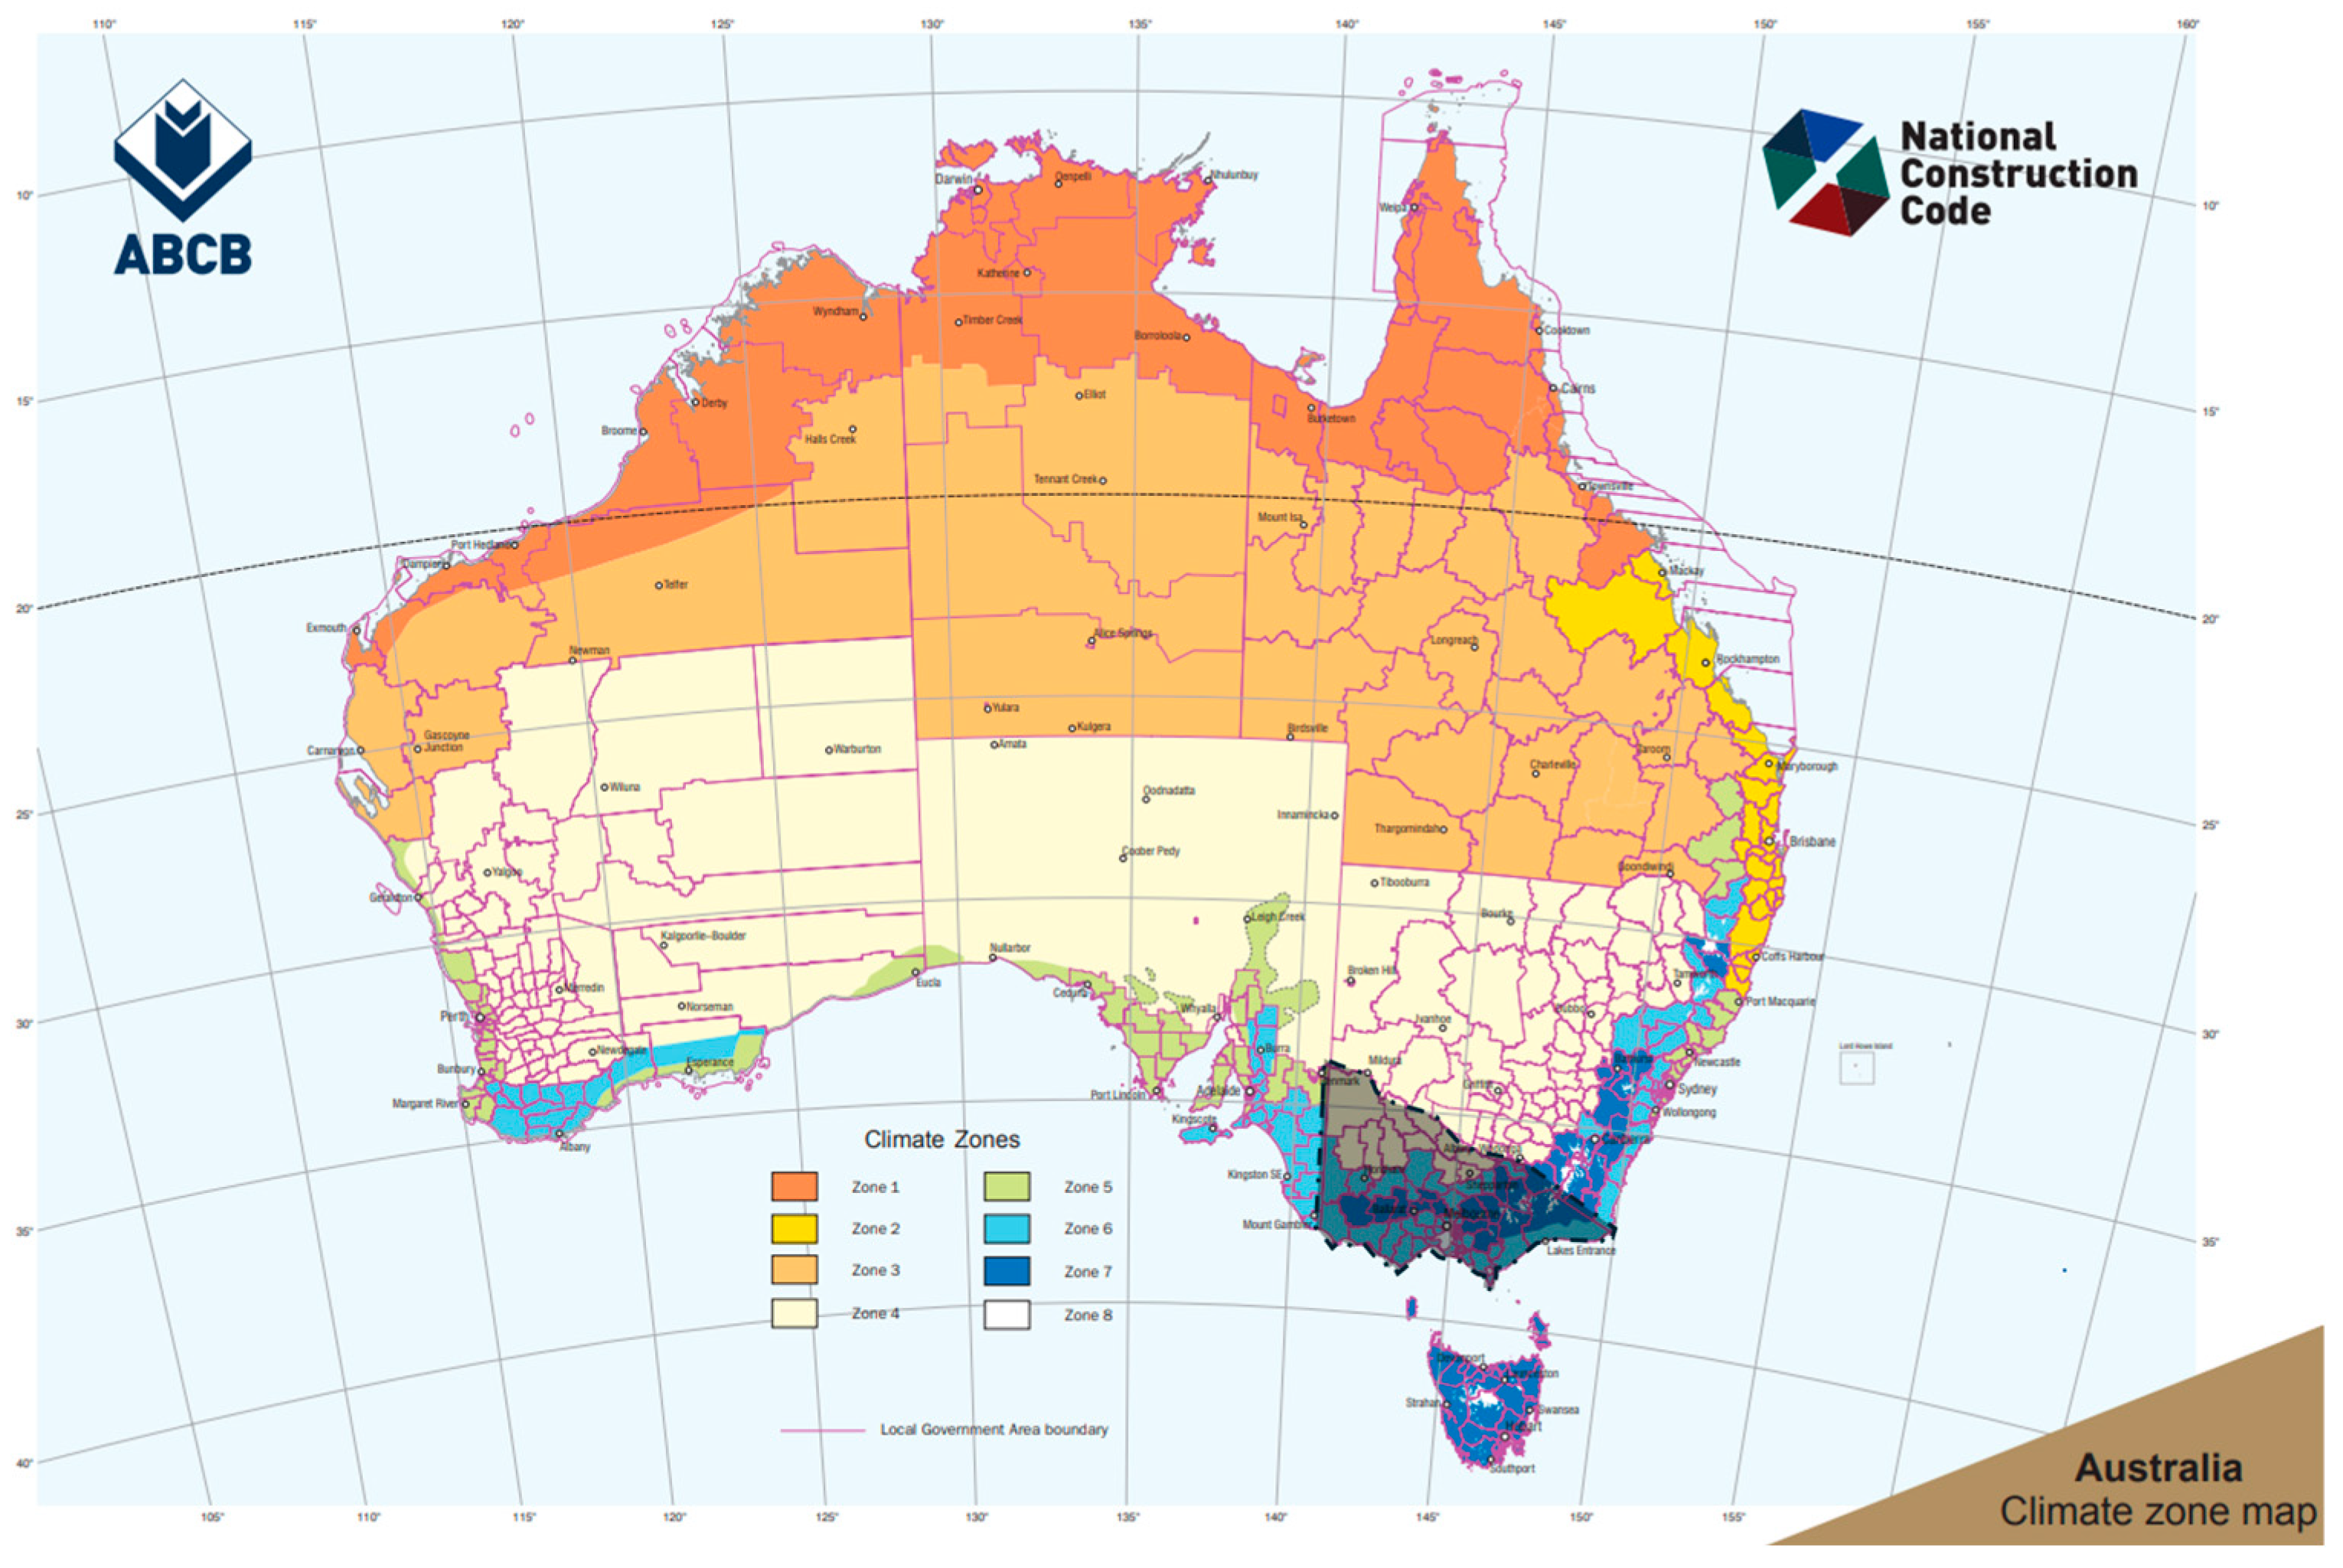
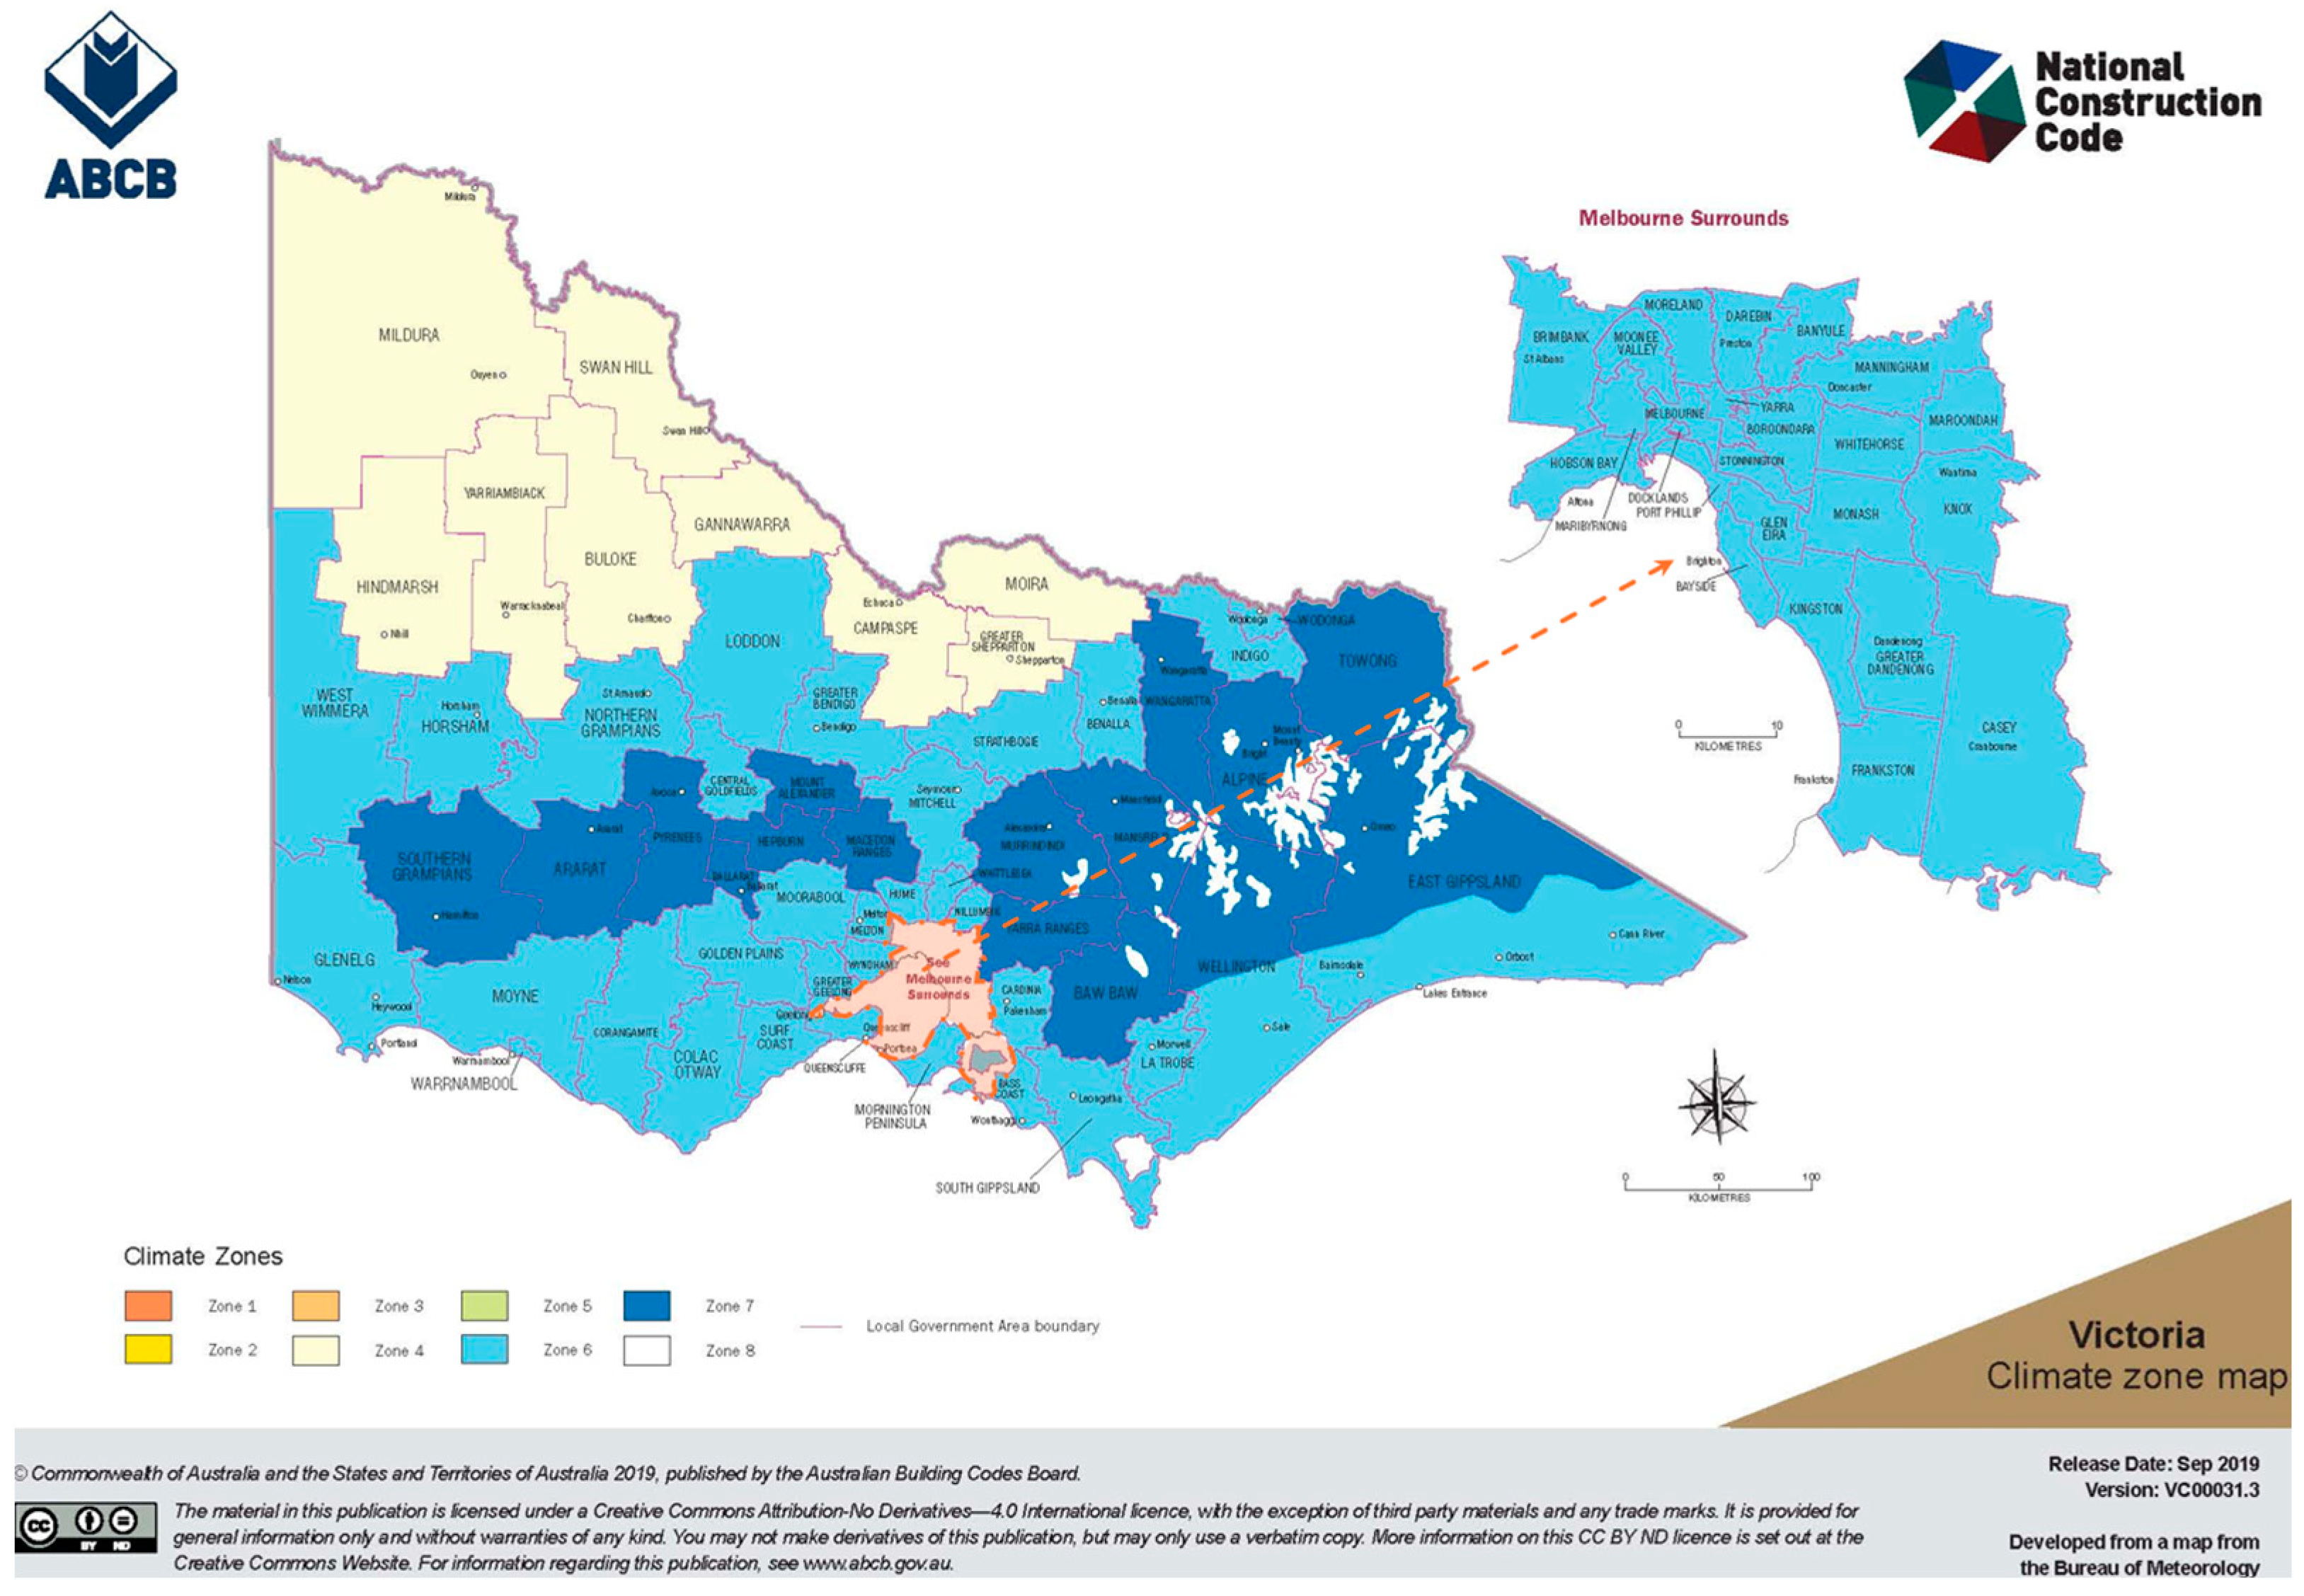
2.2. Outdoor Climate Data
2.3. The Indoor Climate: ASHRAE160 Adjusted with NatHERS
2.4. Hygrothermal and Bio-Hydrothermal Analysis
- To minimise mould growth, limit indoor relative humidity to 70%.
- The initial value of mould index shall be zero, the predicted mould growth and mould index shall be accumulated for each hour such that the Mould Index shall not exceed a value of three (3.0).
- The analysis should be predicted on loads that exceeded 90% of the time.
- MI <1 is suitable to construct if the MI does not increase.
- MI 1≤ and <3 is not ideal and should be investigated further.
- MI ≥ 3 does not achieve the minimum performance requirements.
3. Results of 6-and 7-Star External Wall Systems
3.1. Hygrothermal Assessment: Moisture Accumulation and Condensation
3.2. Bio-Hygrothermal Assessment Results
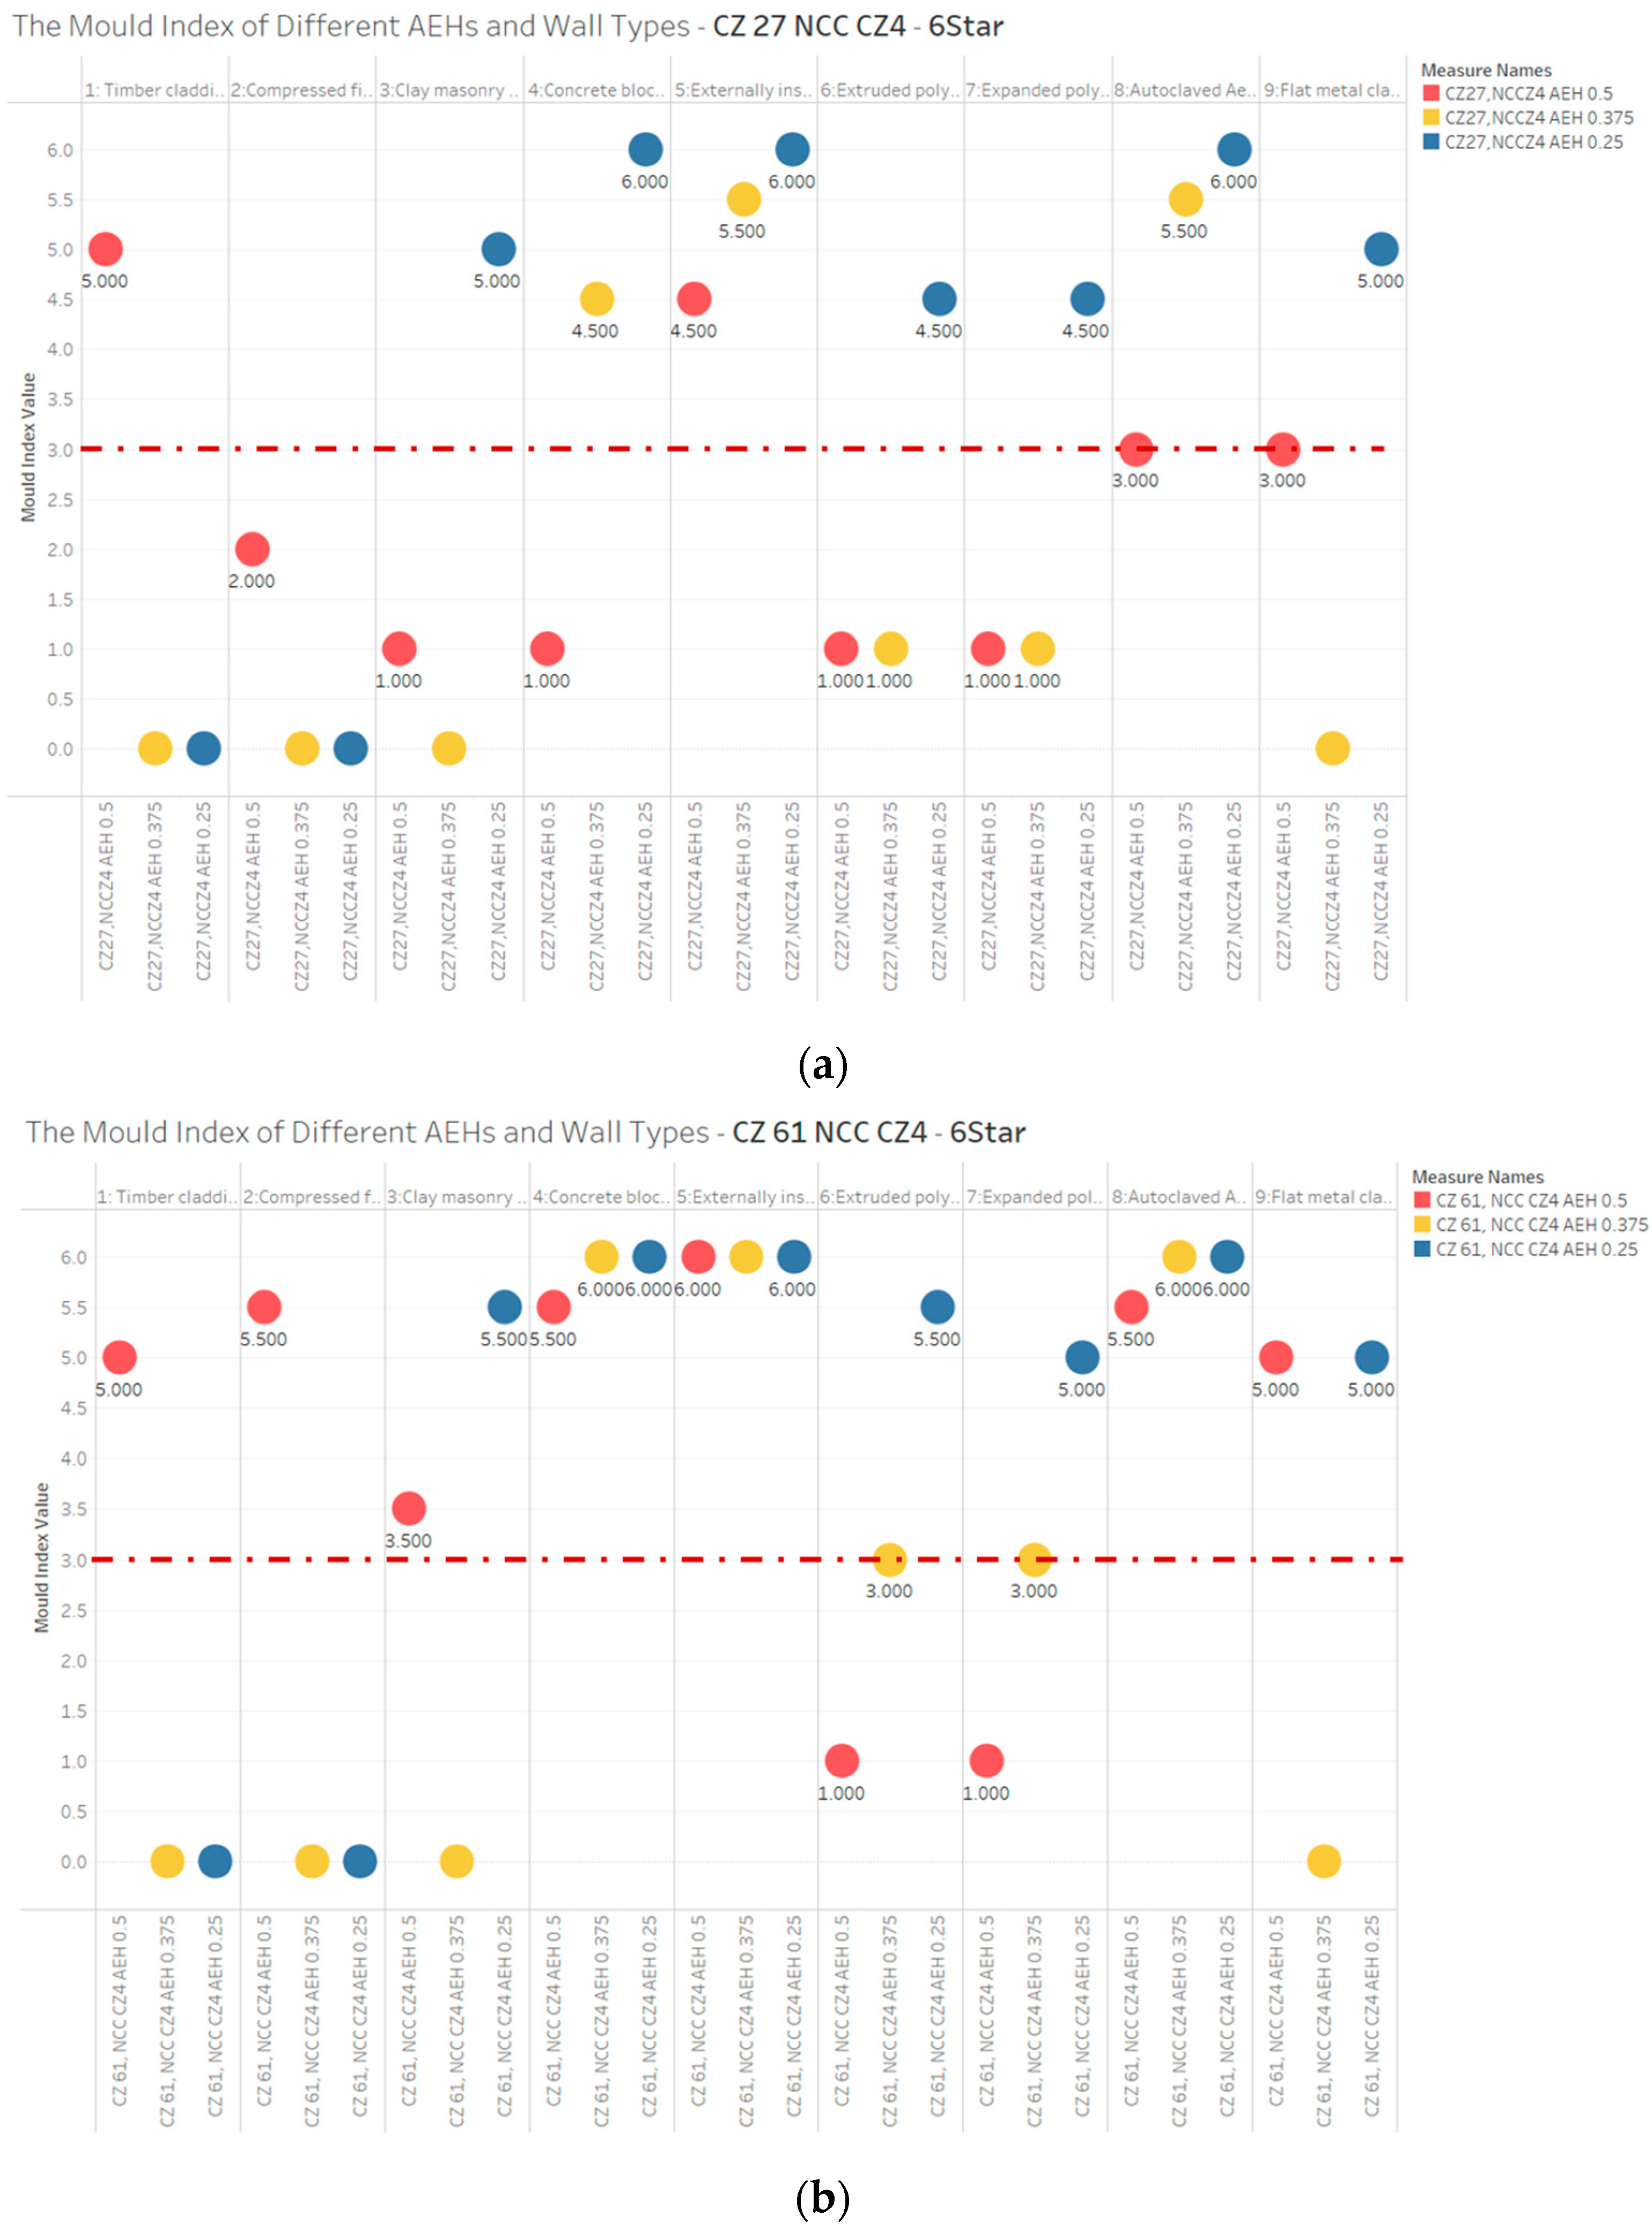
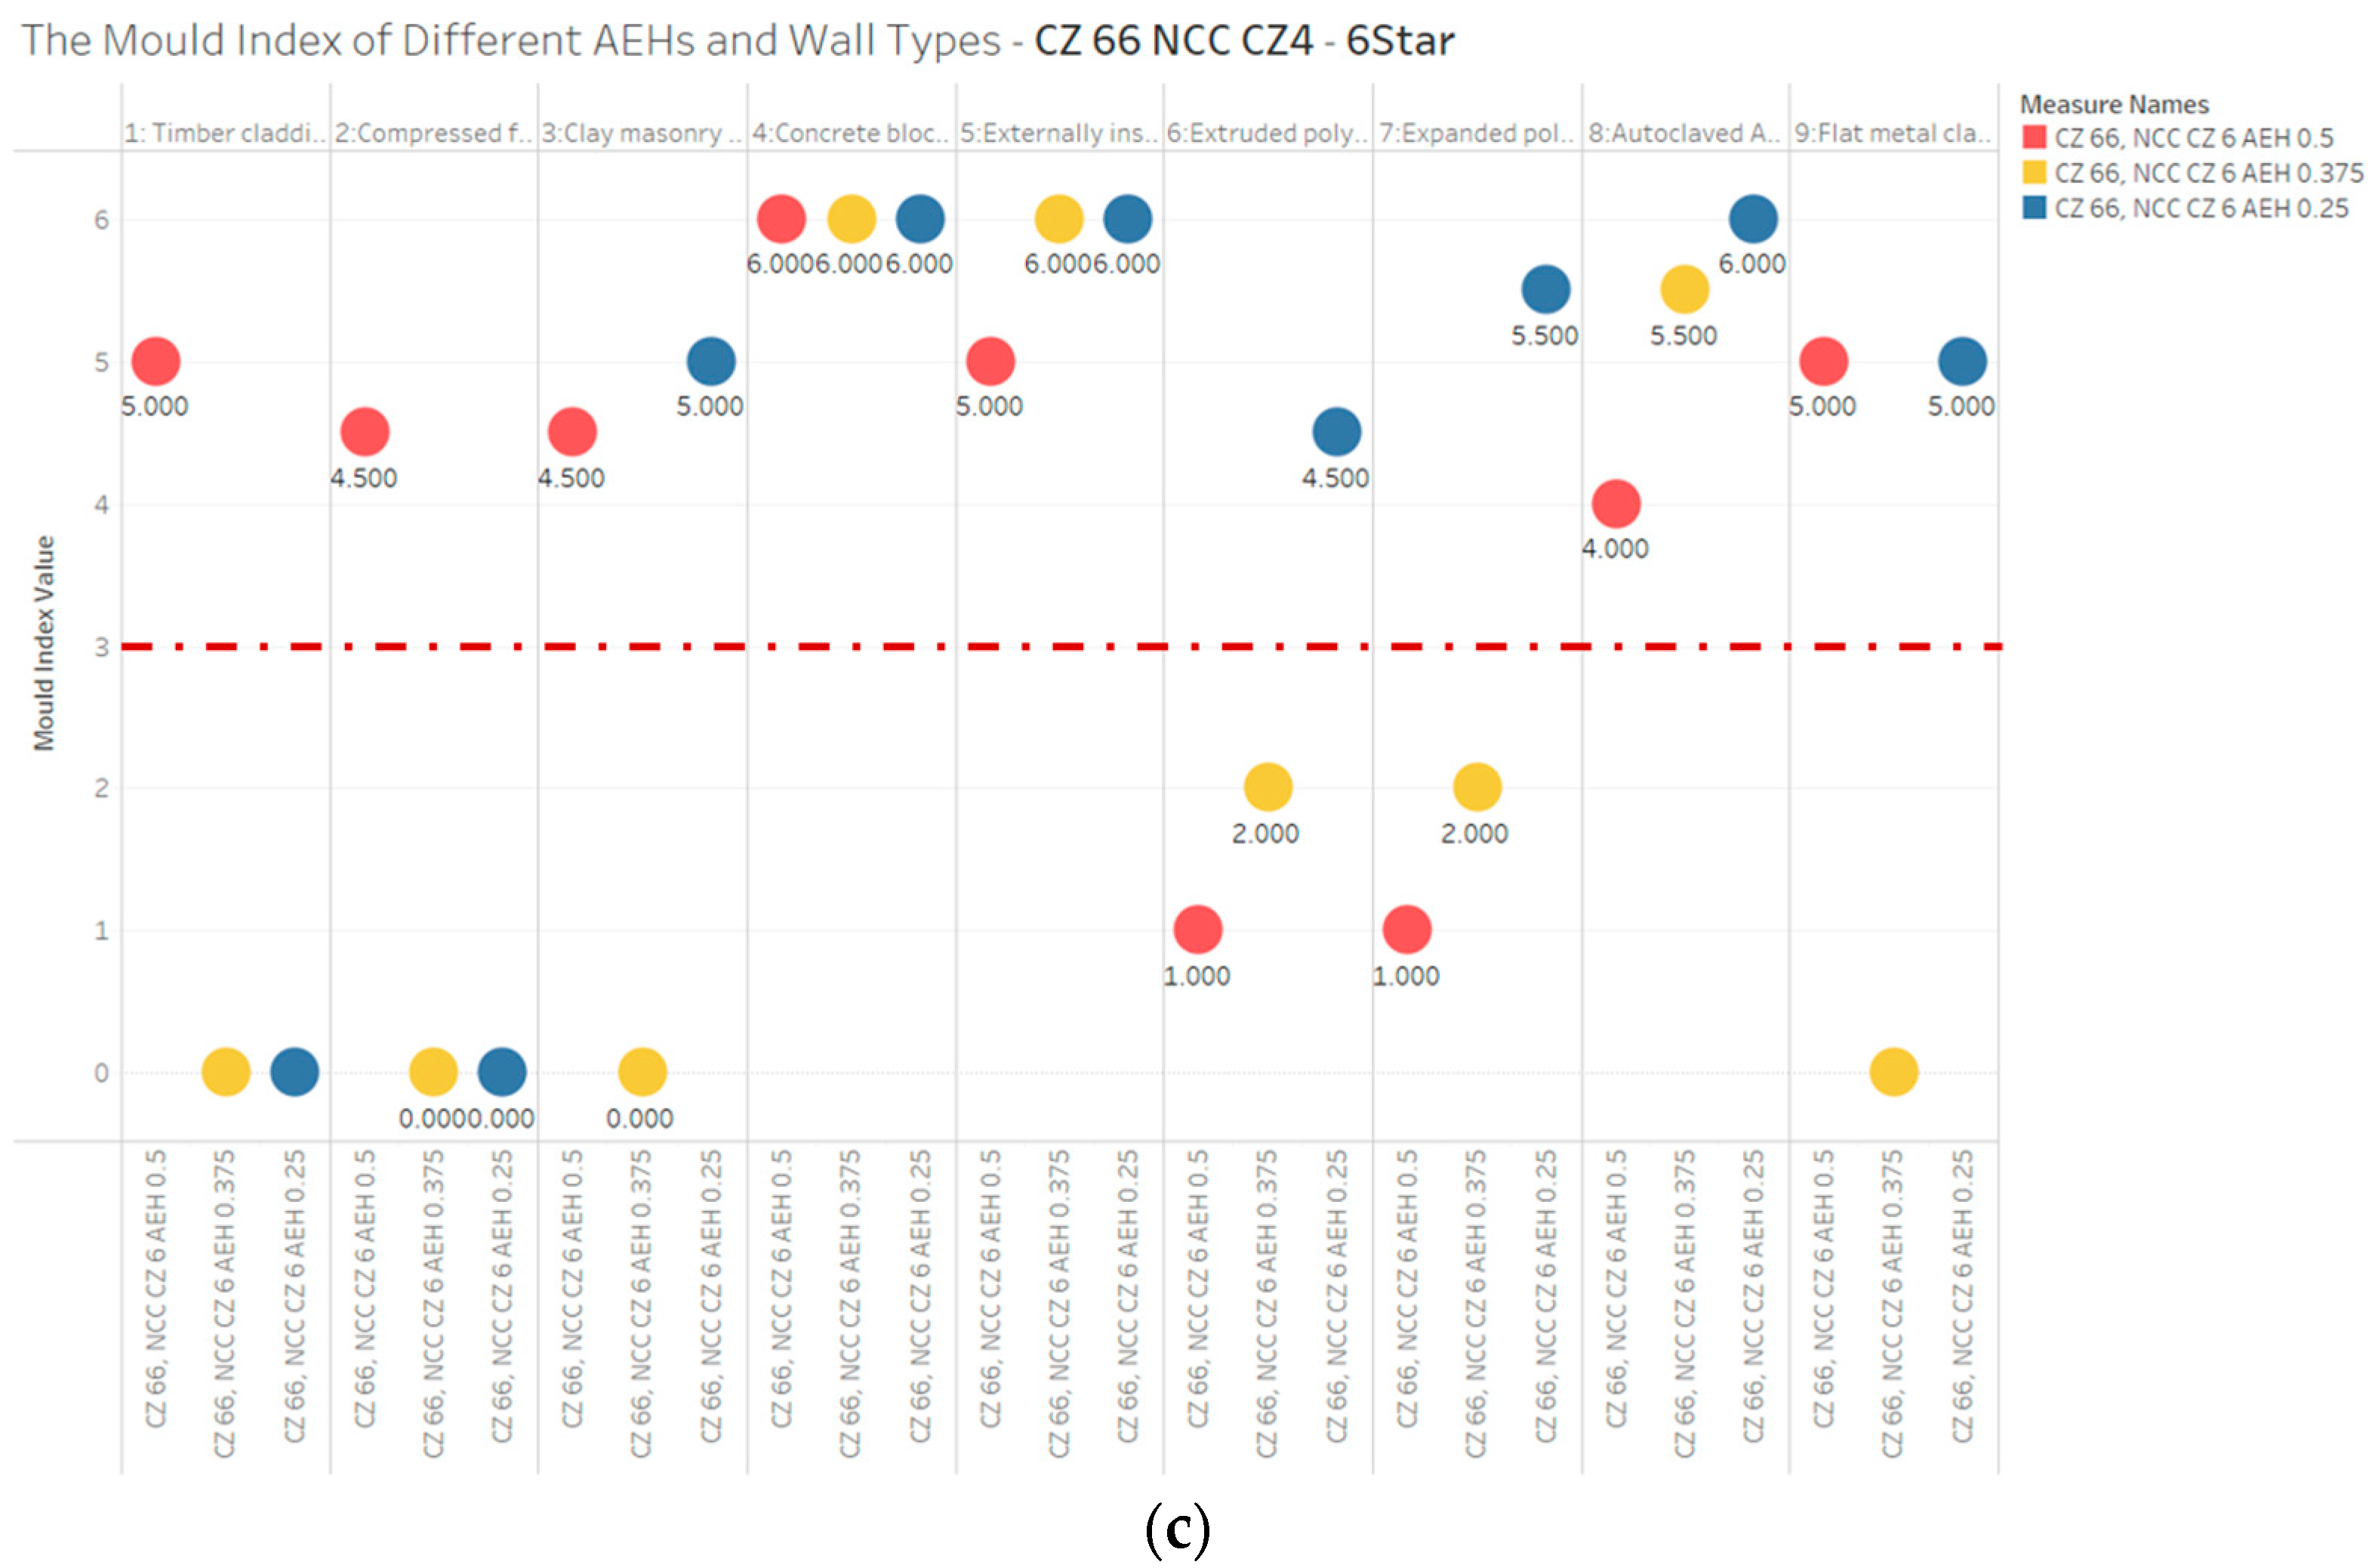
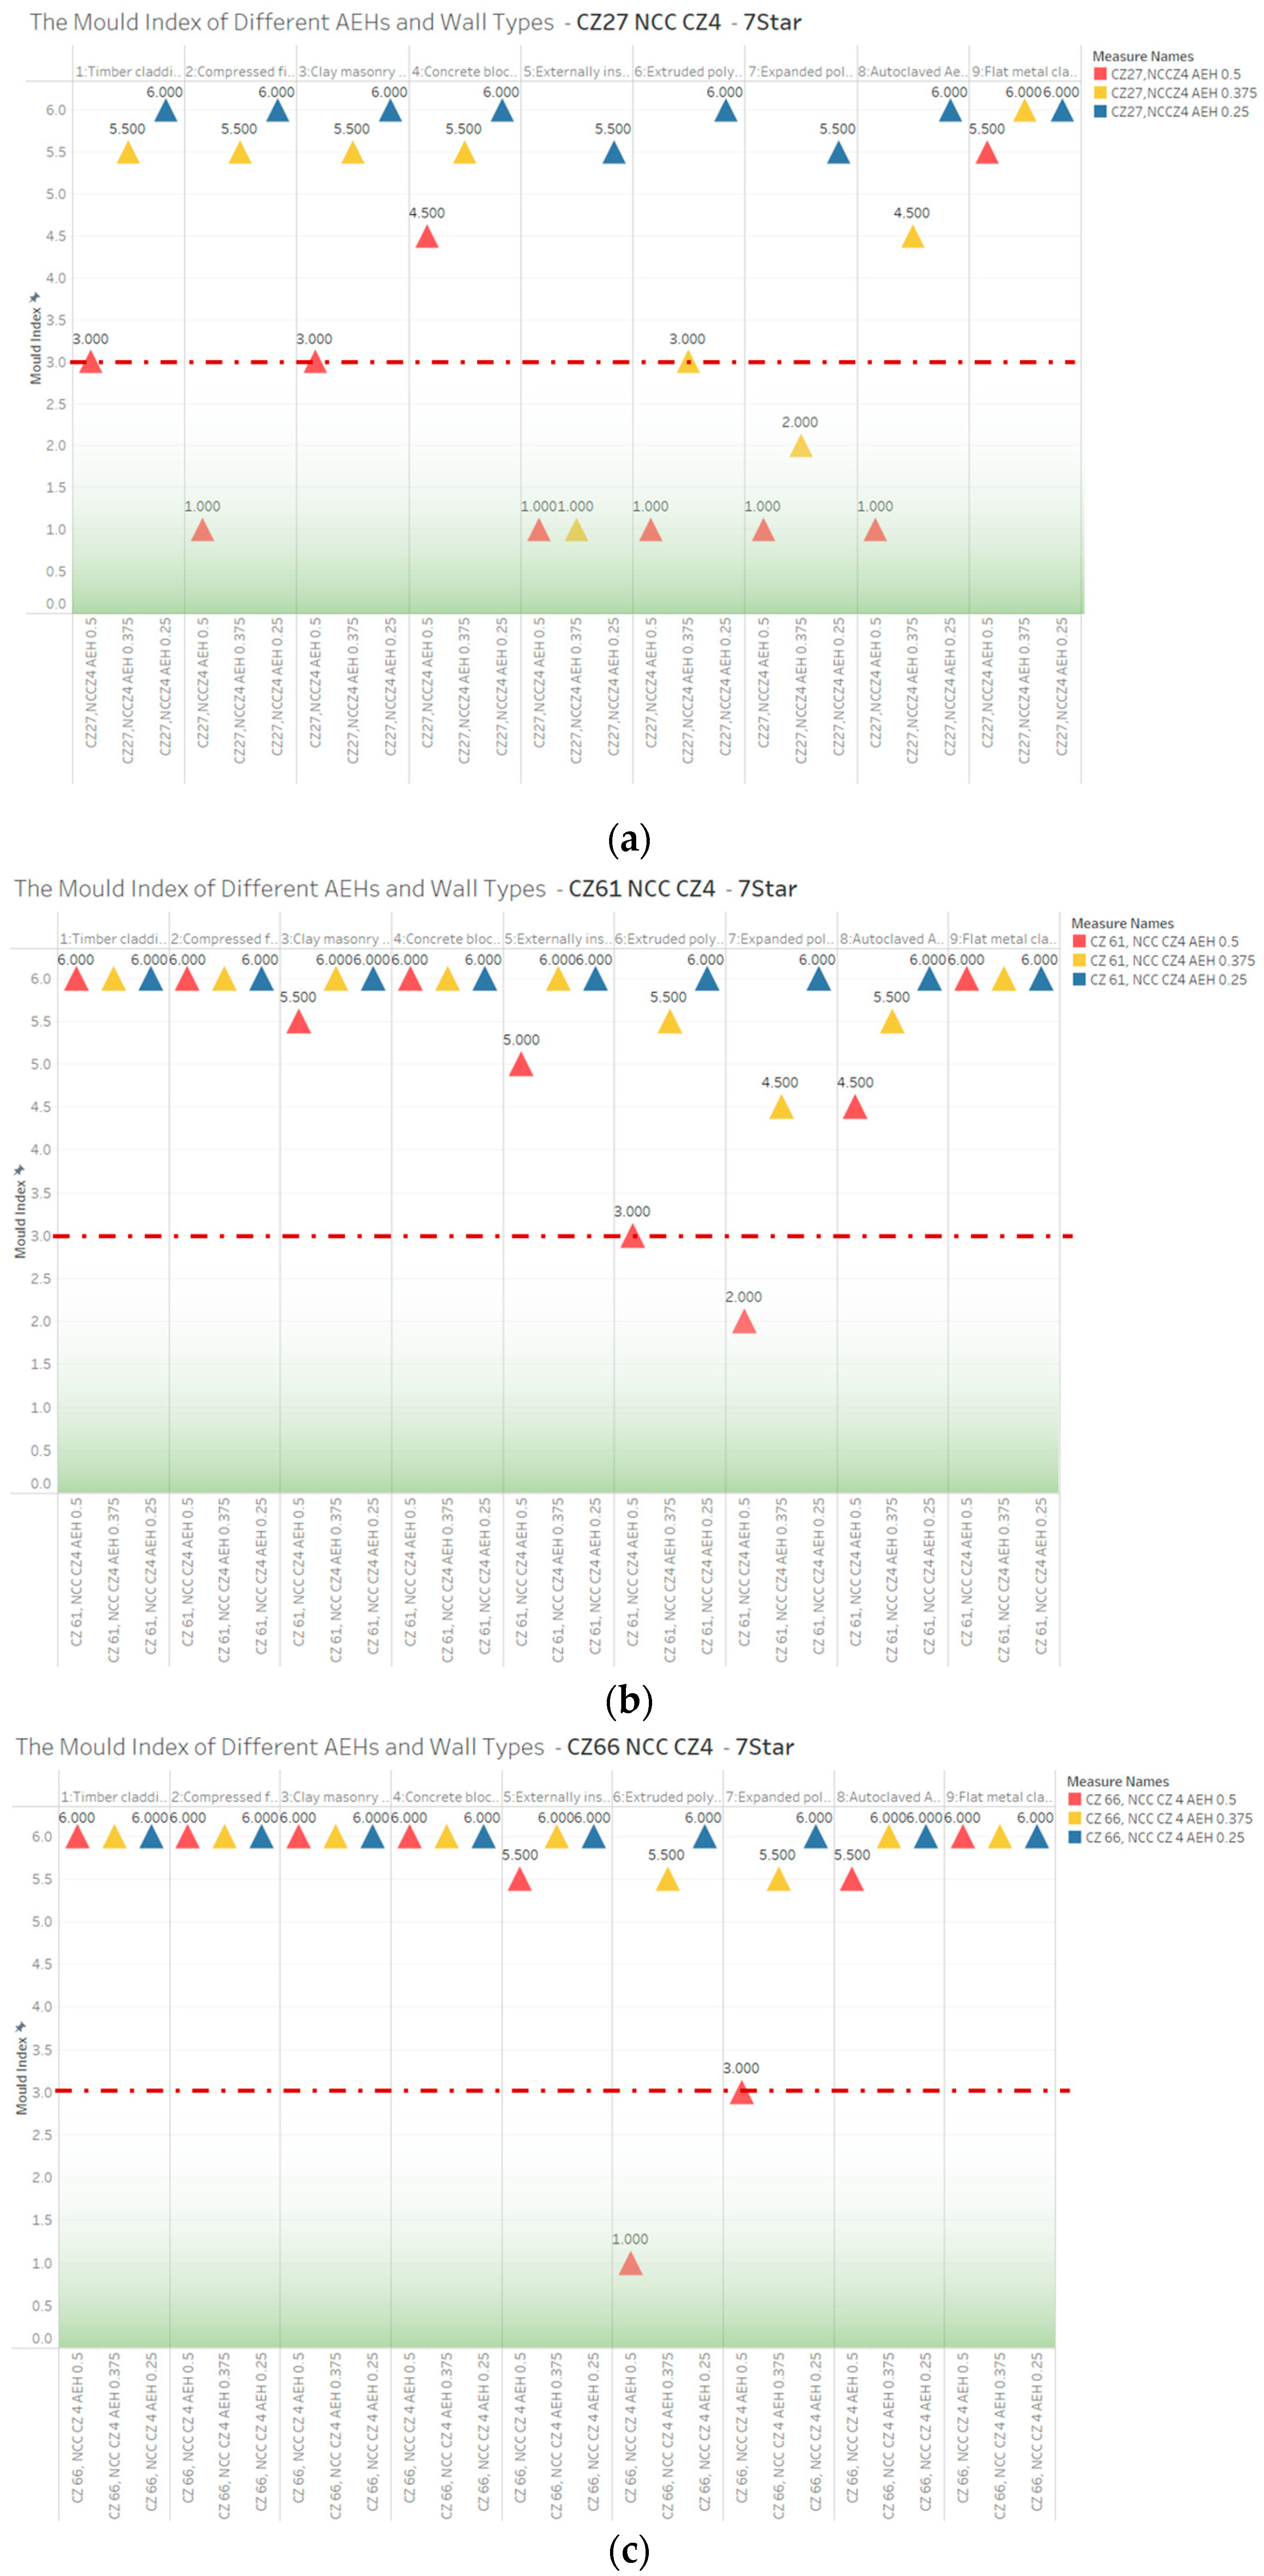
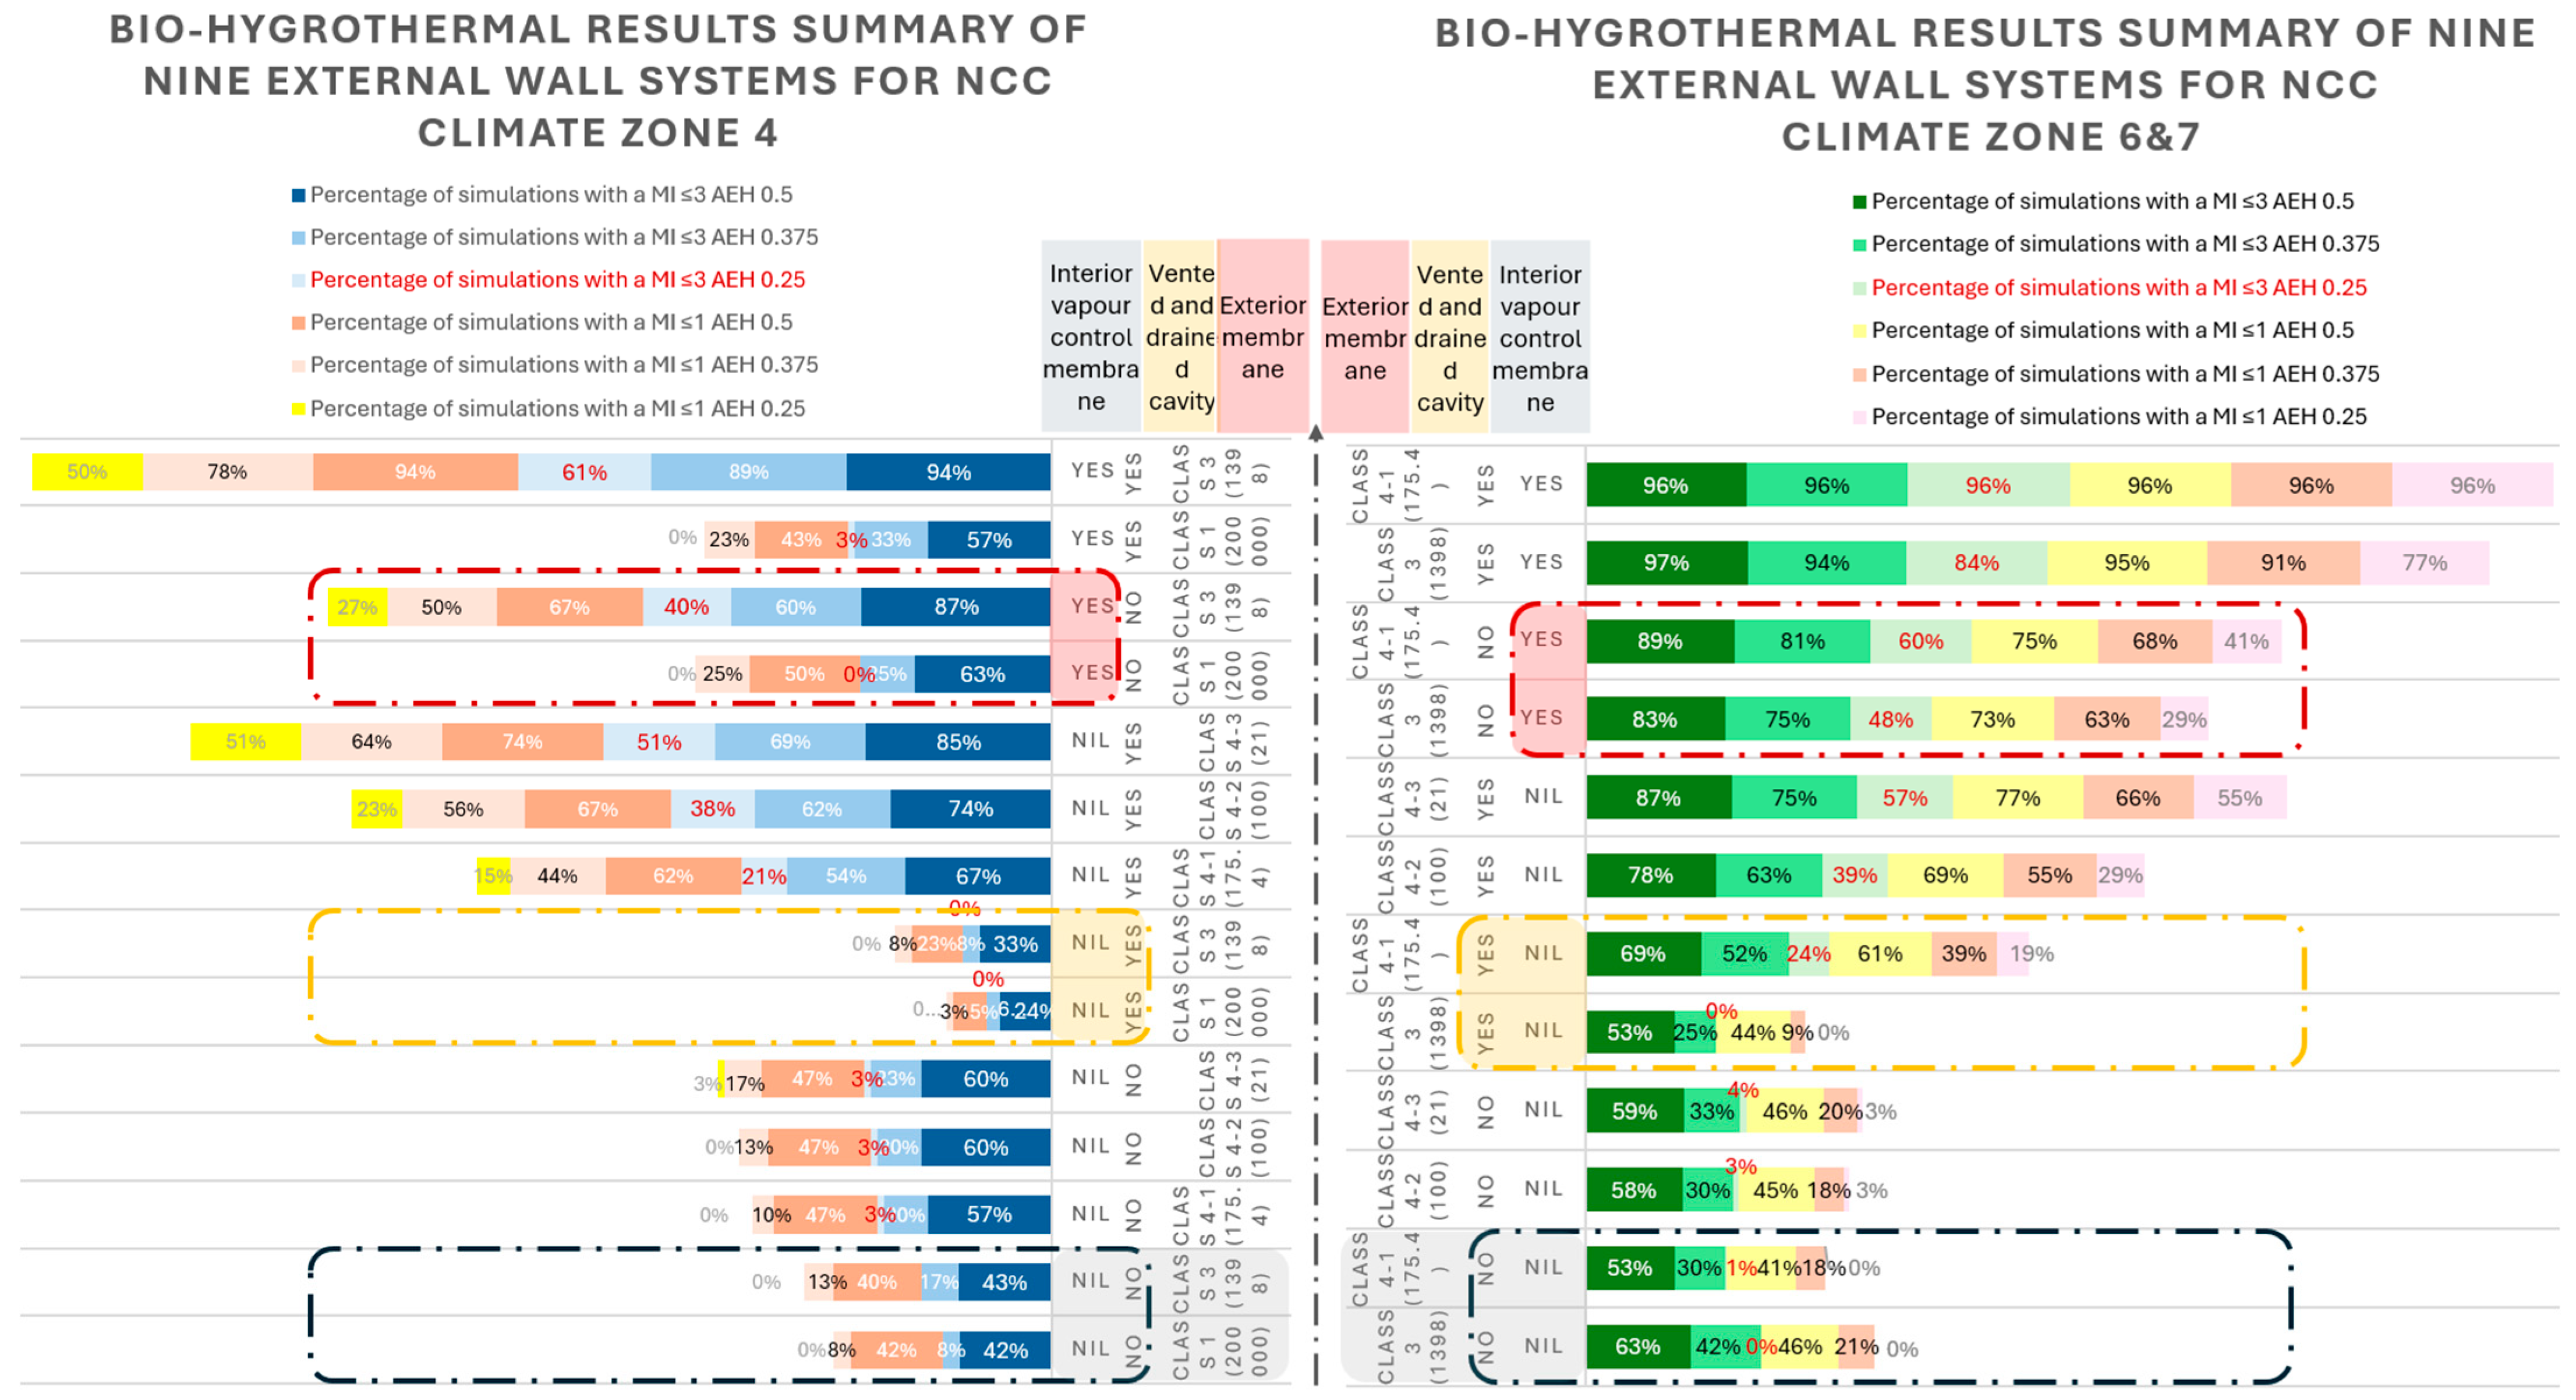
3.2.1. NCC Climate Zone 4
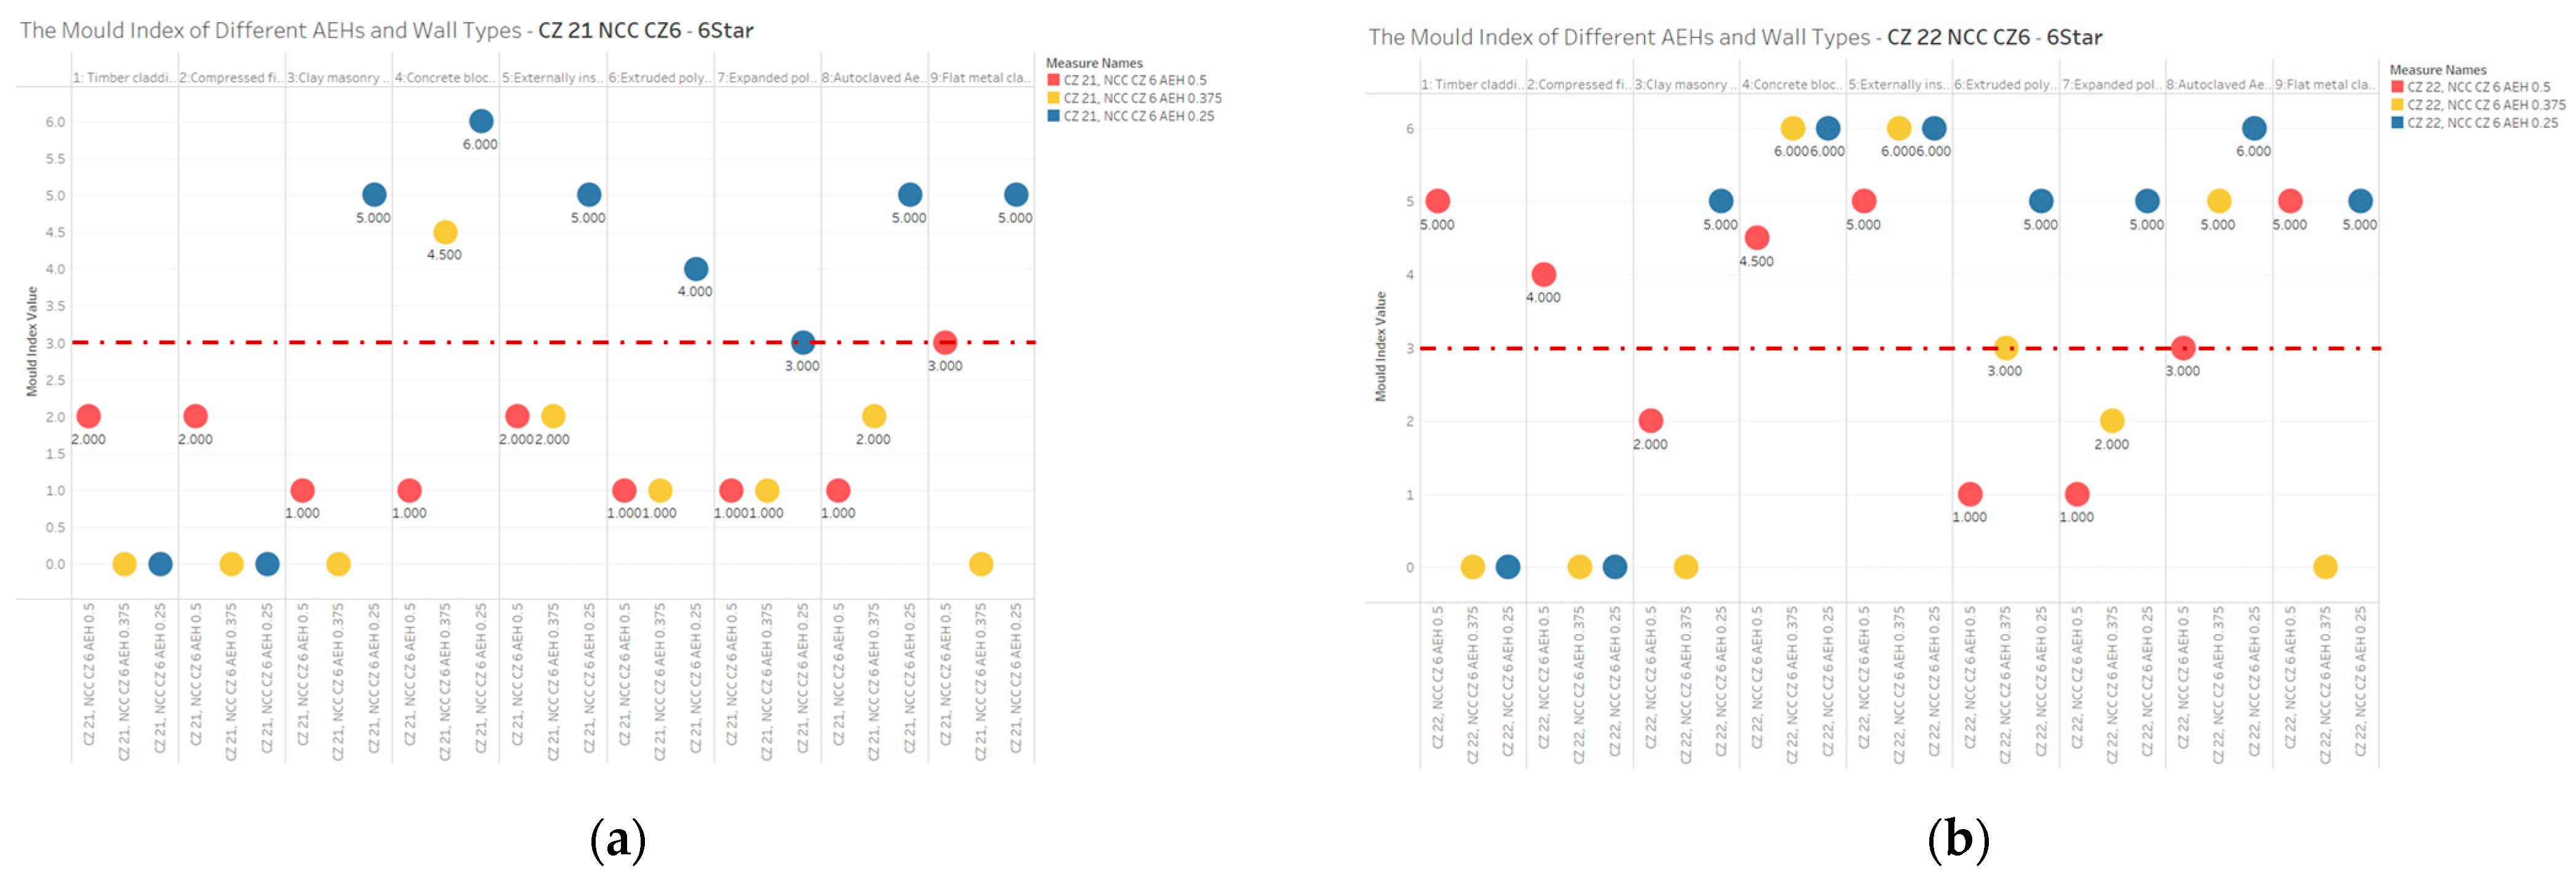
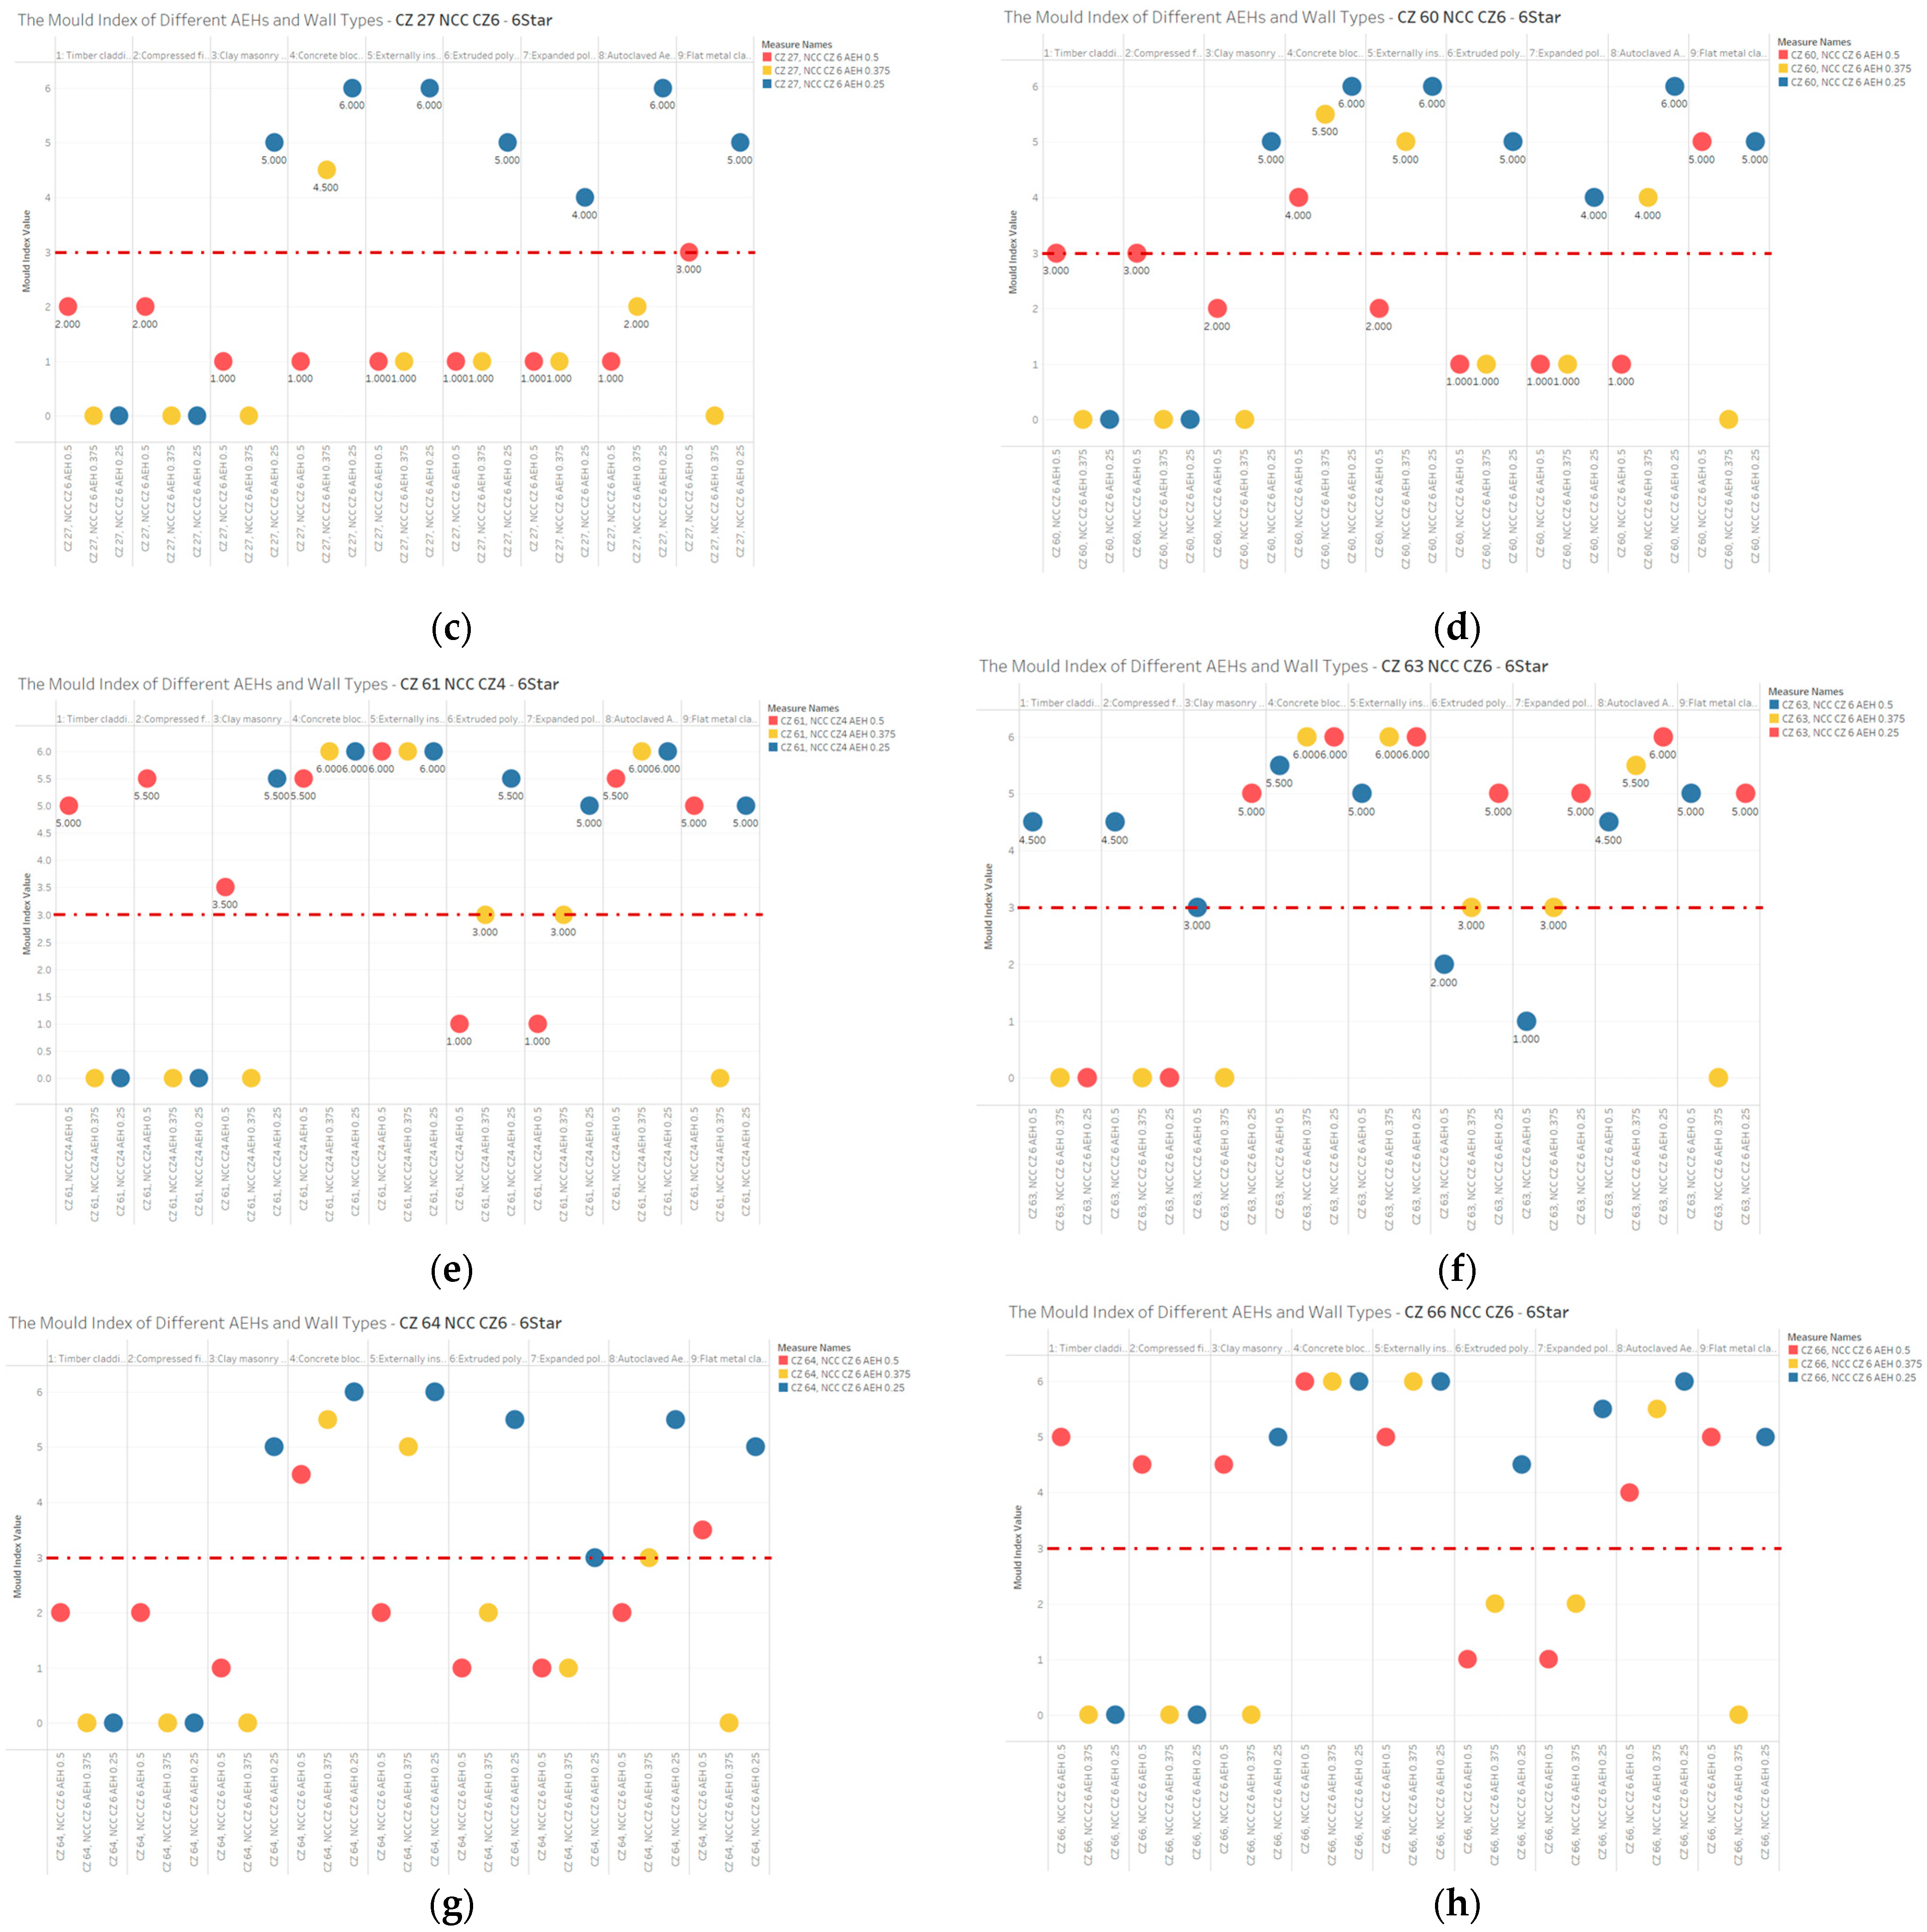
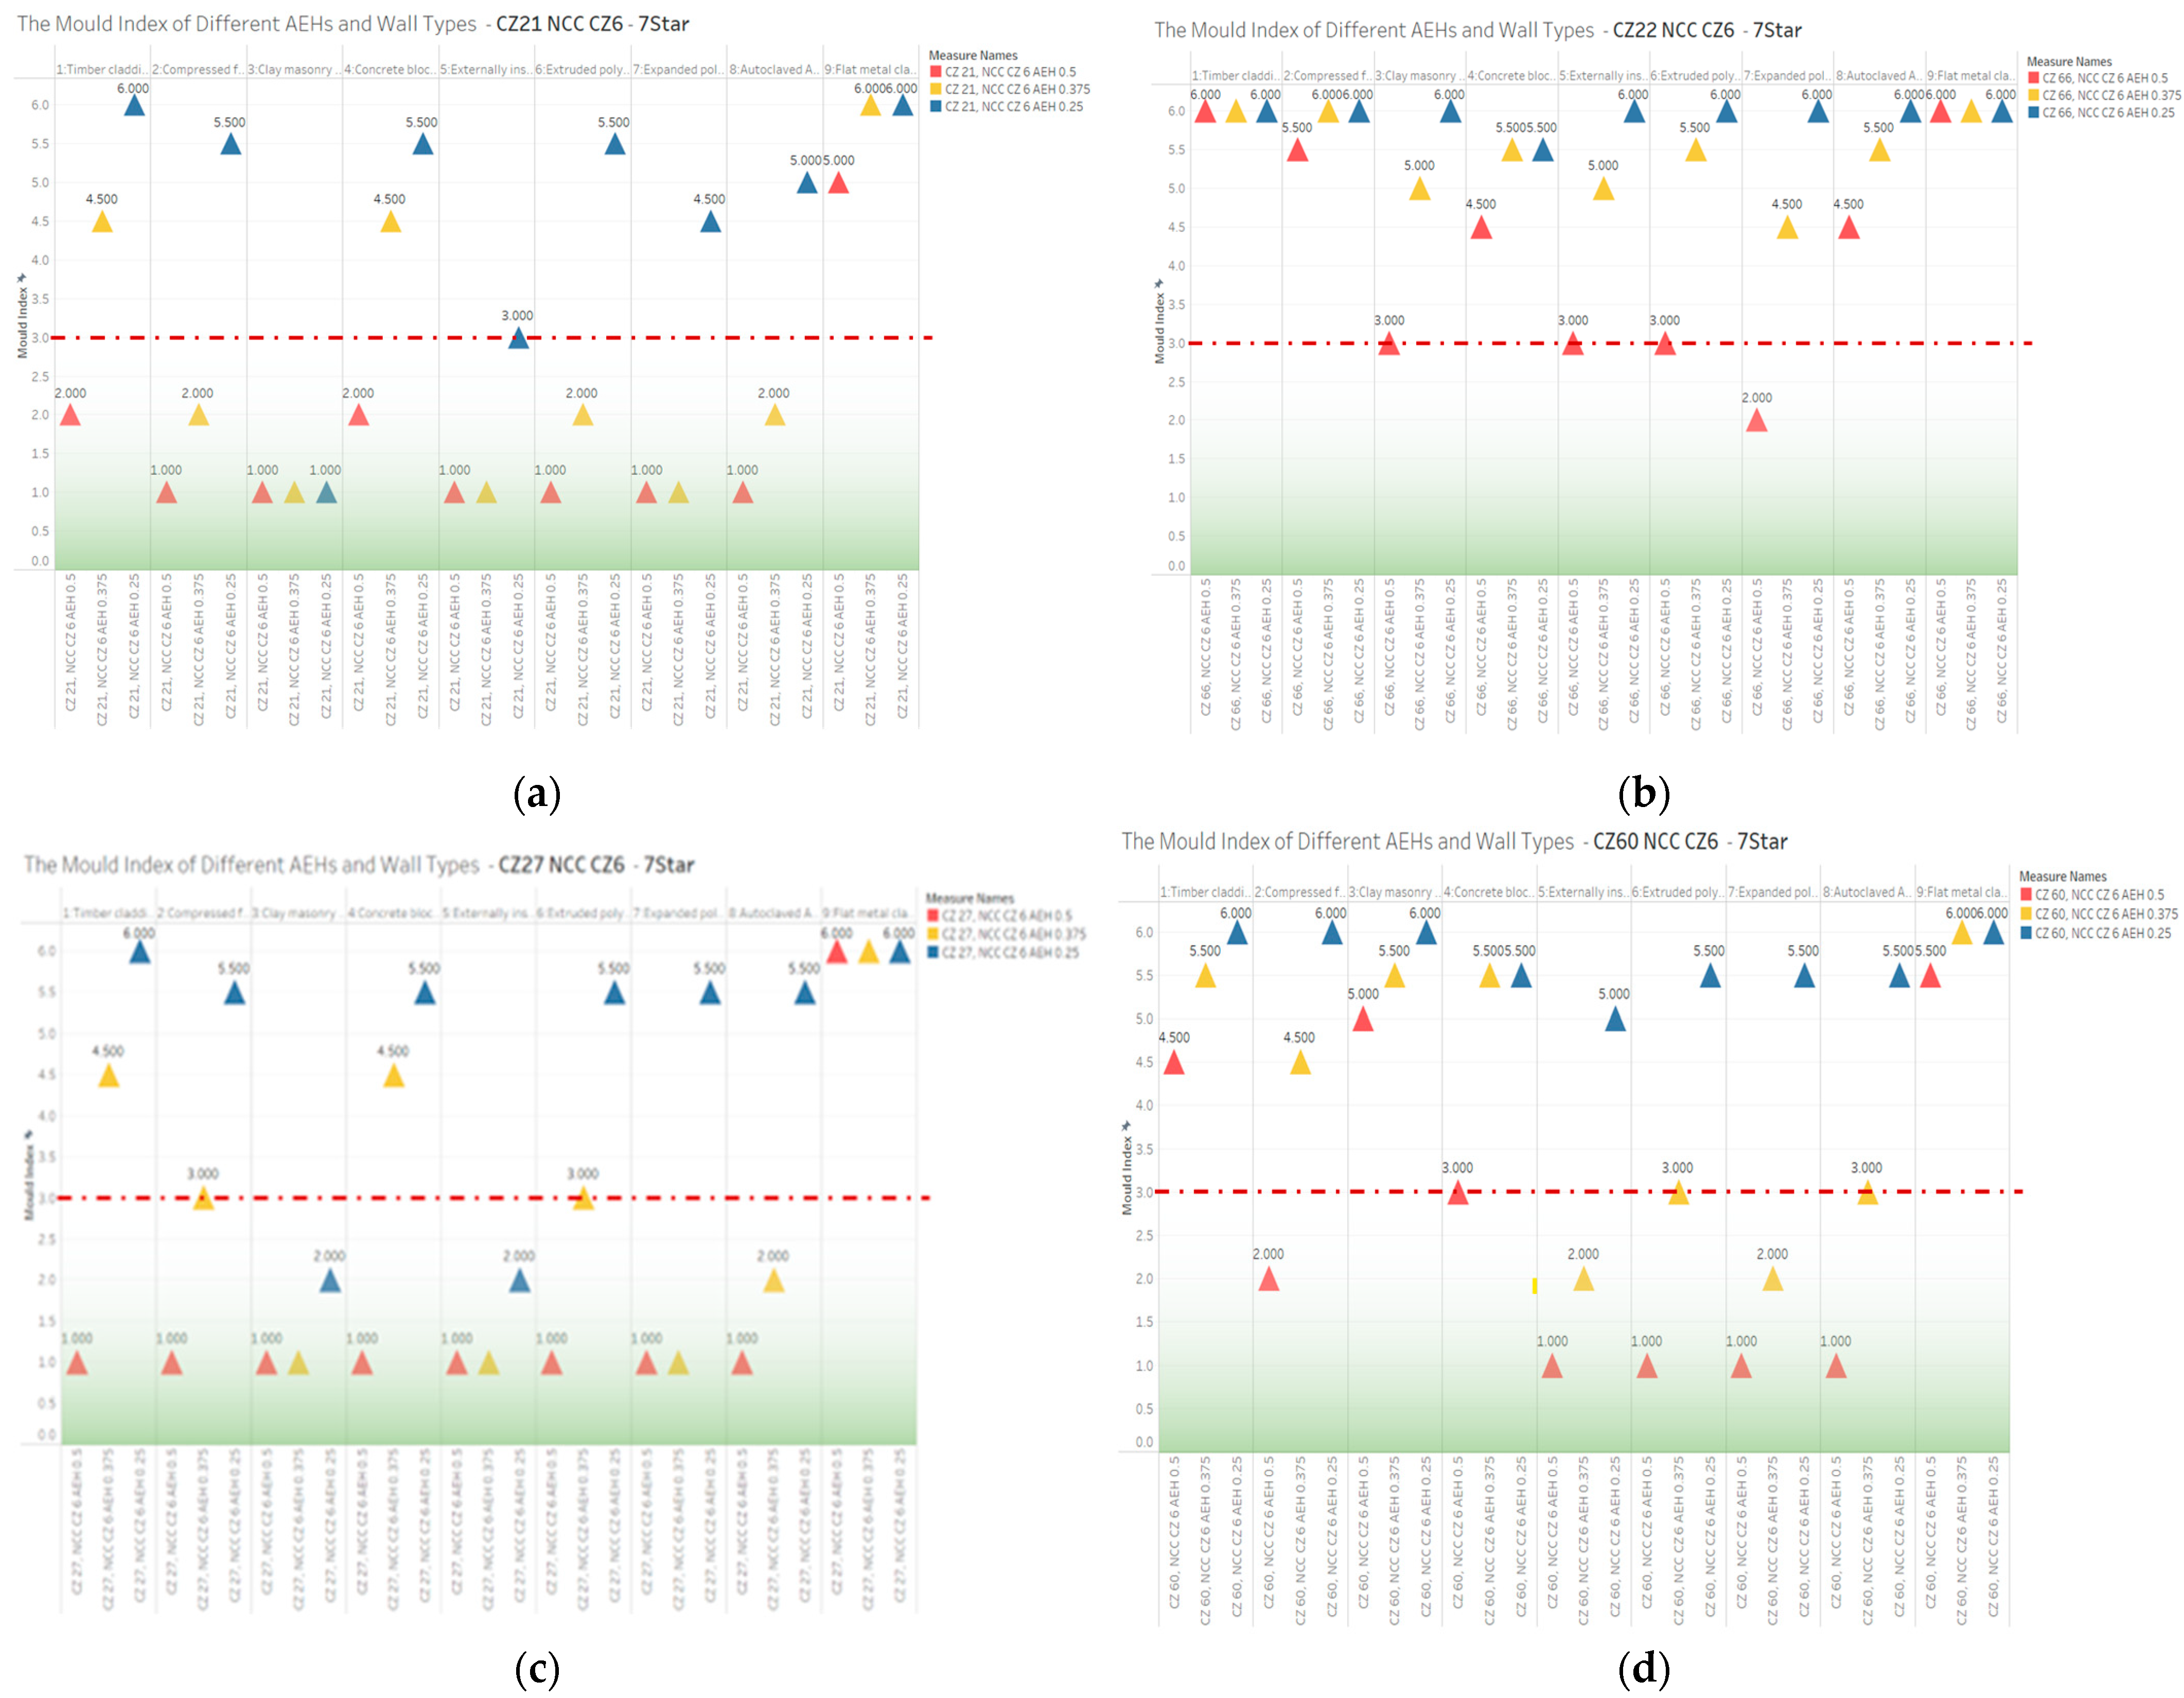
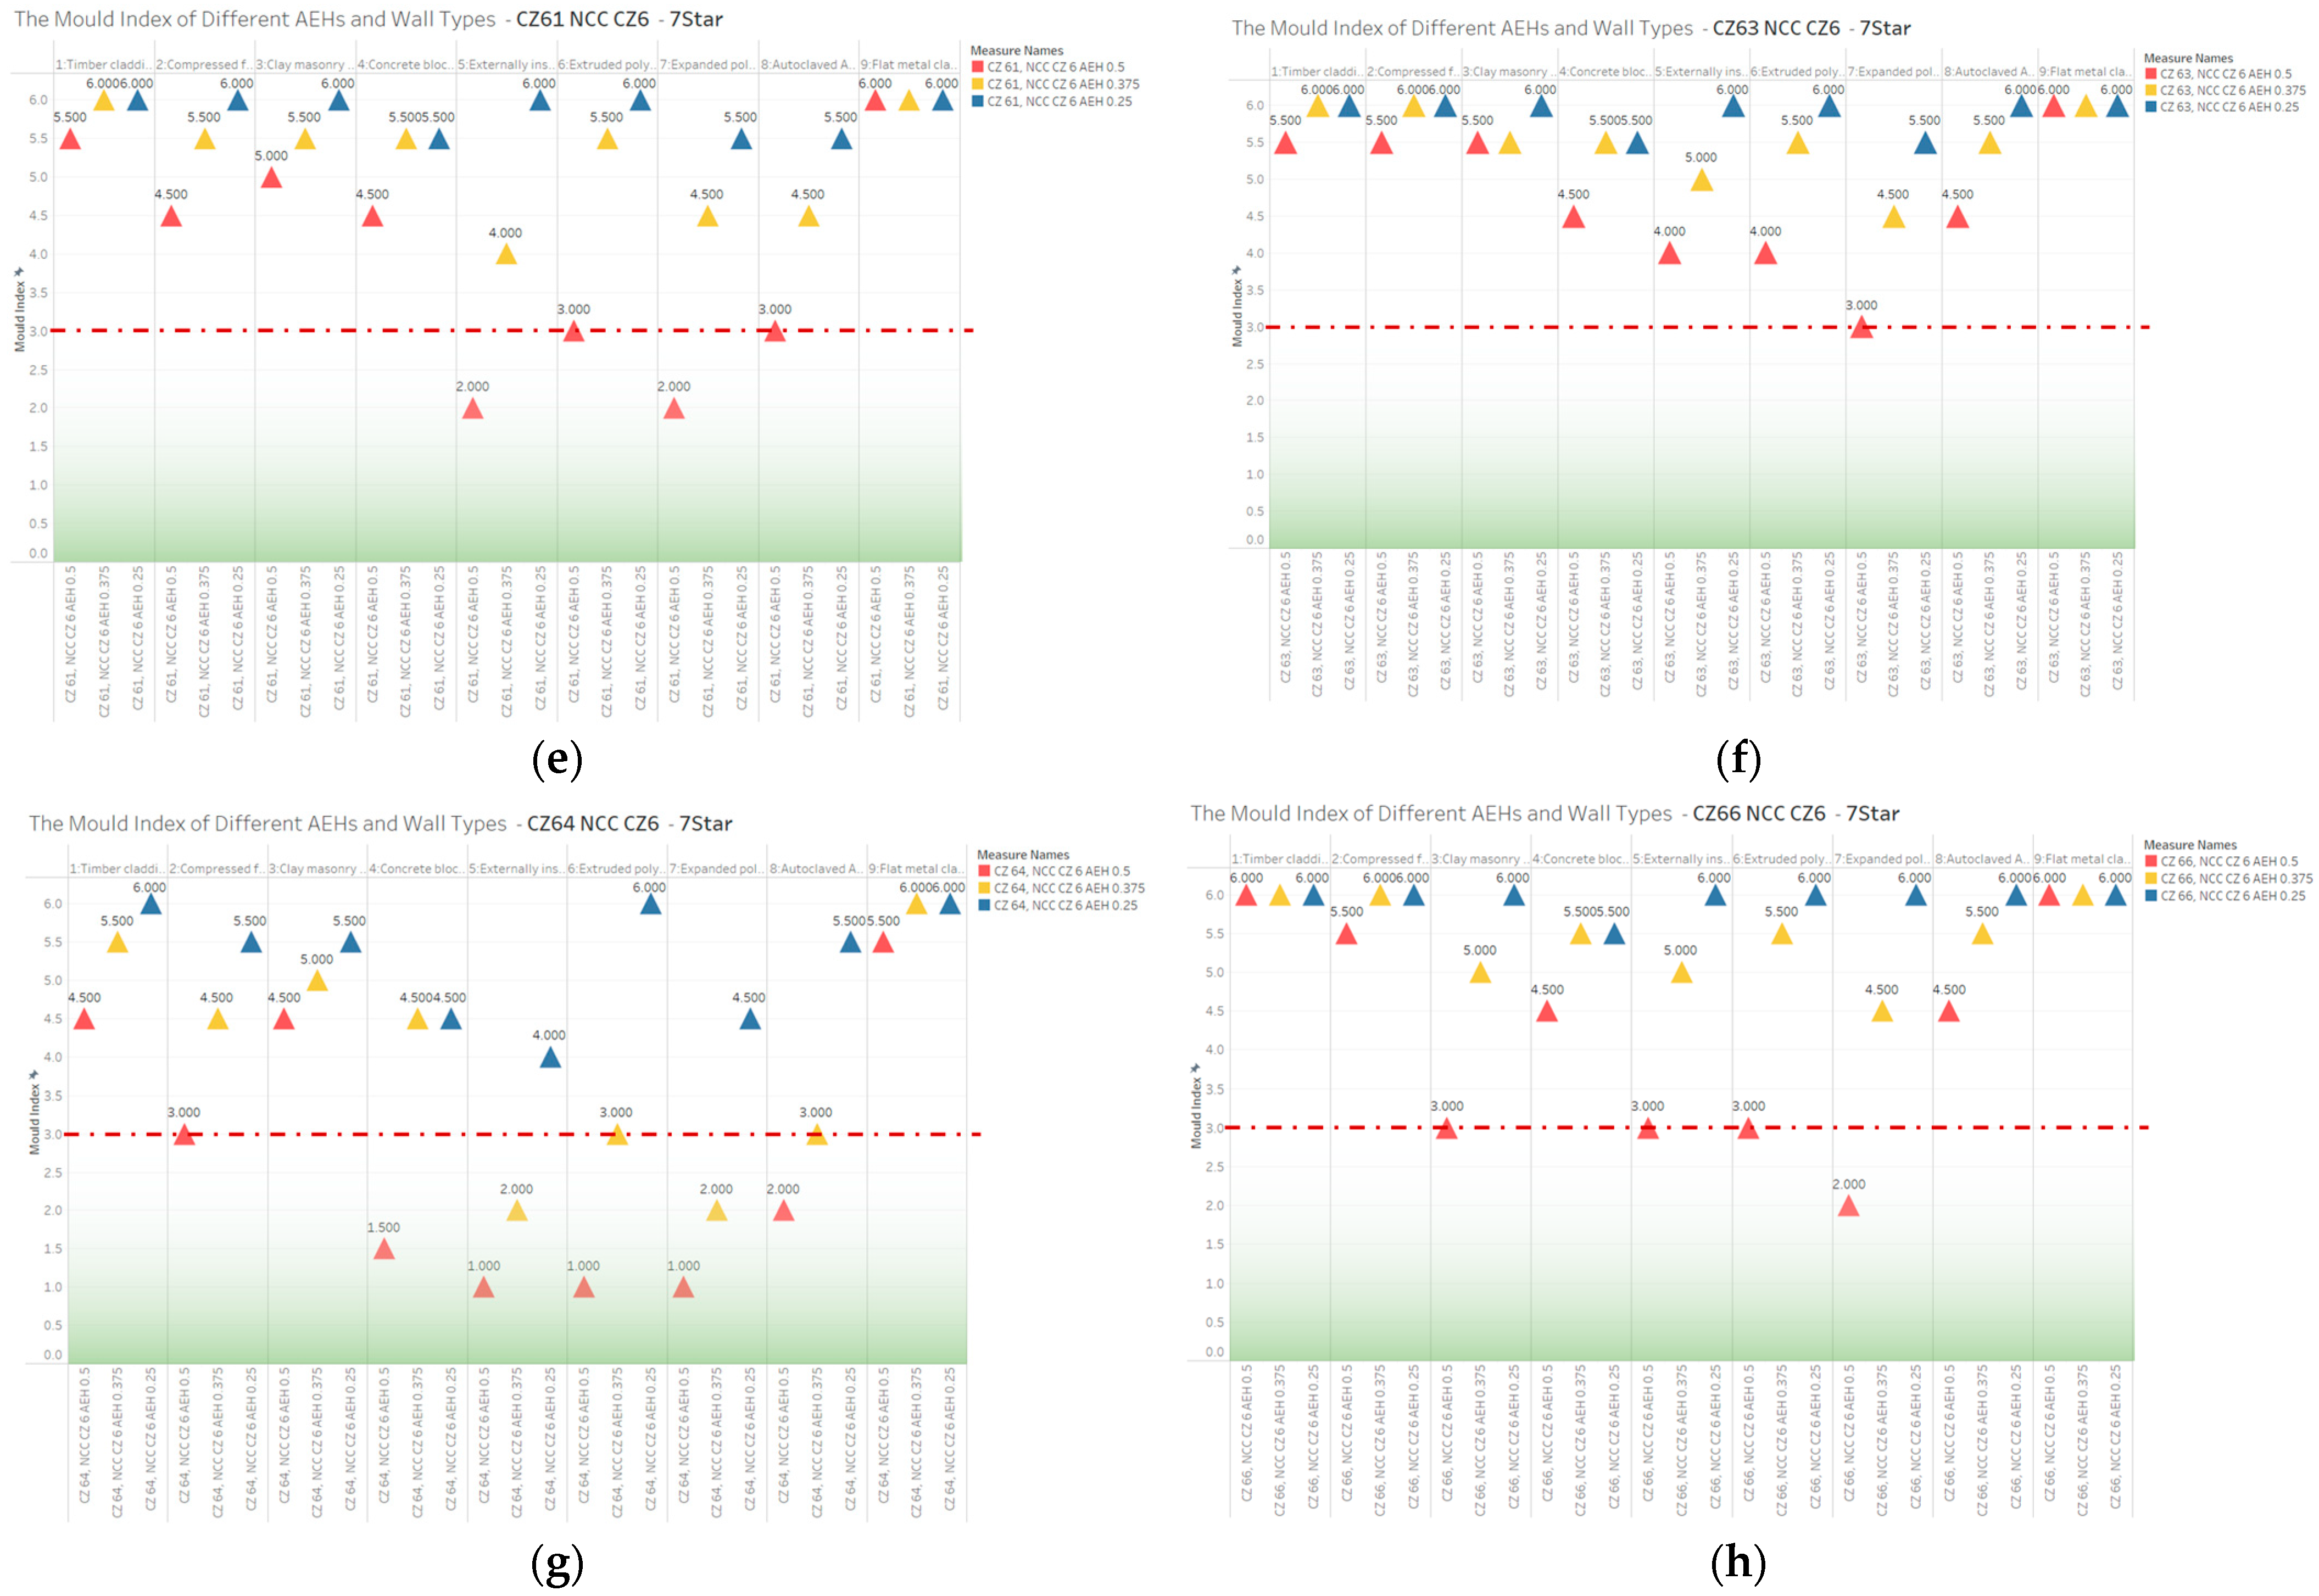
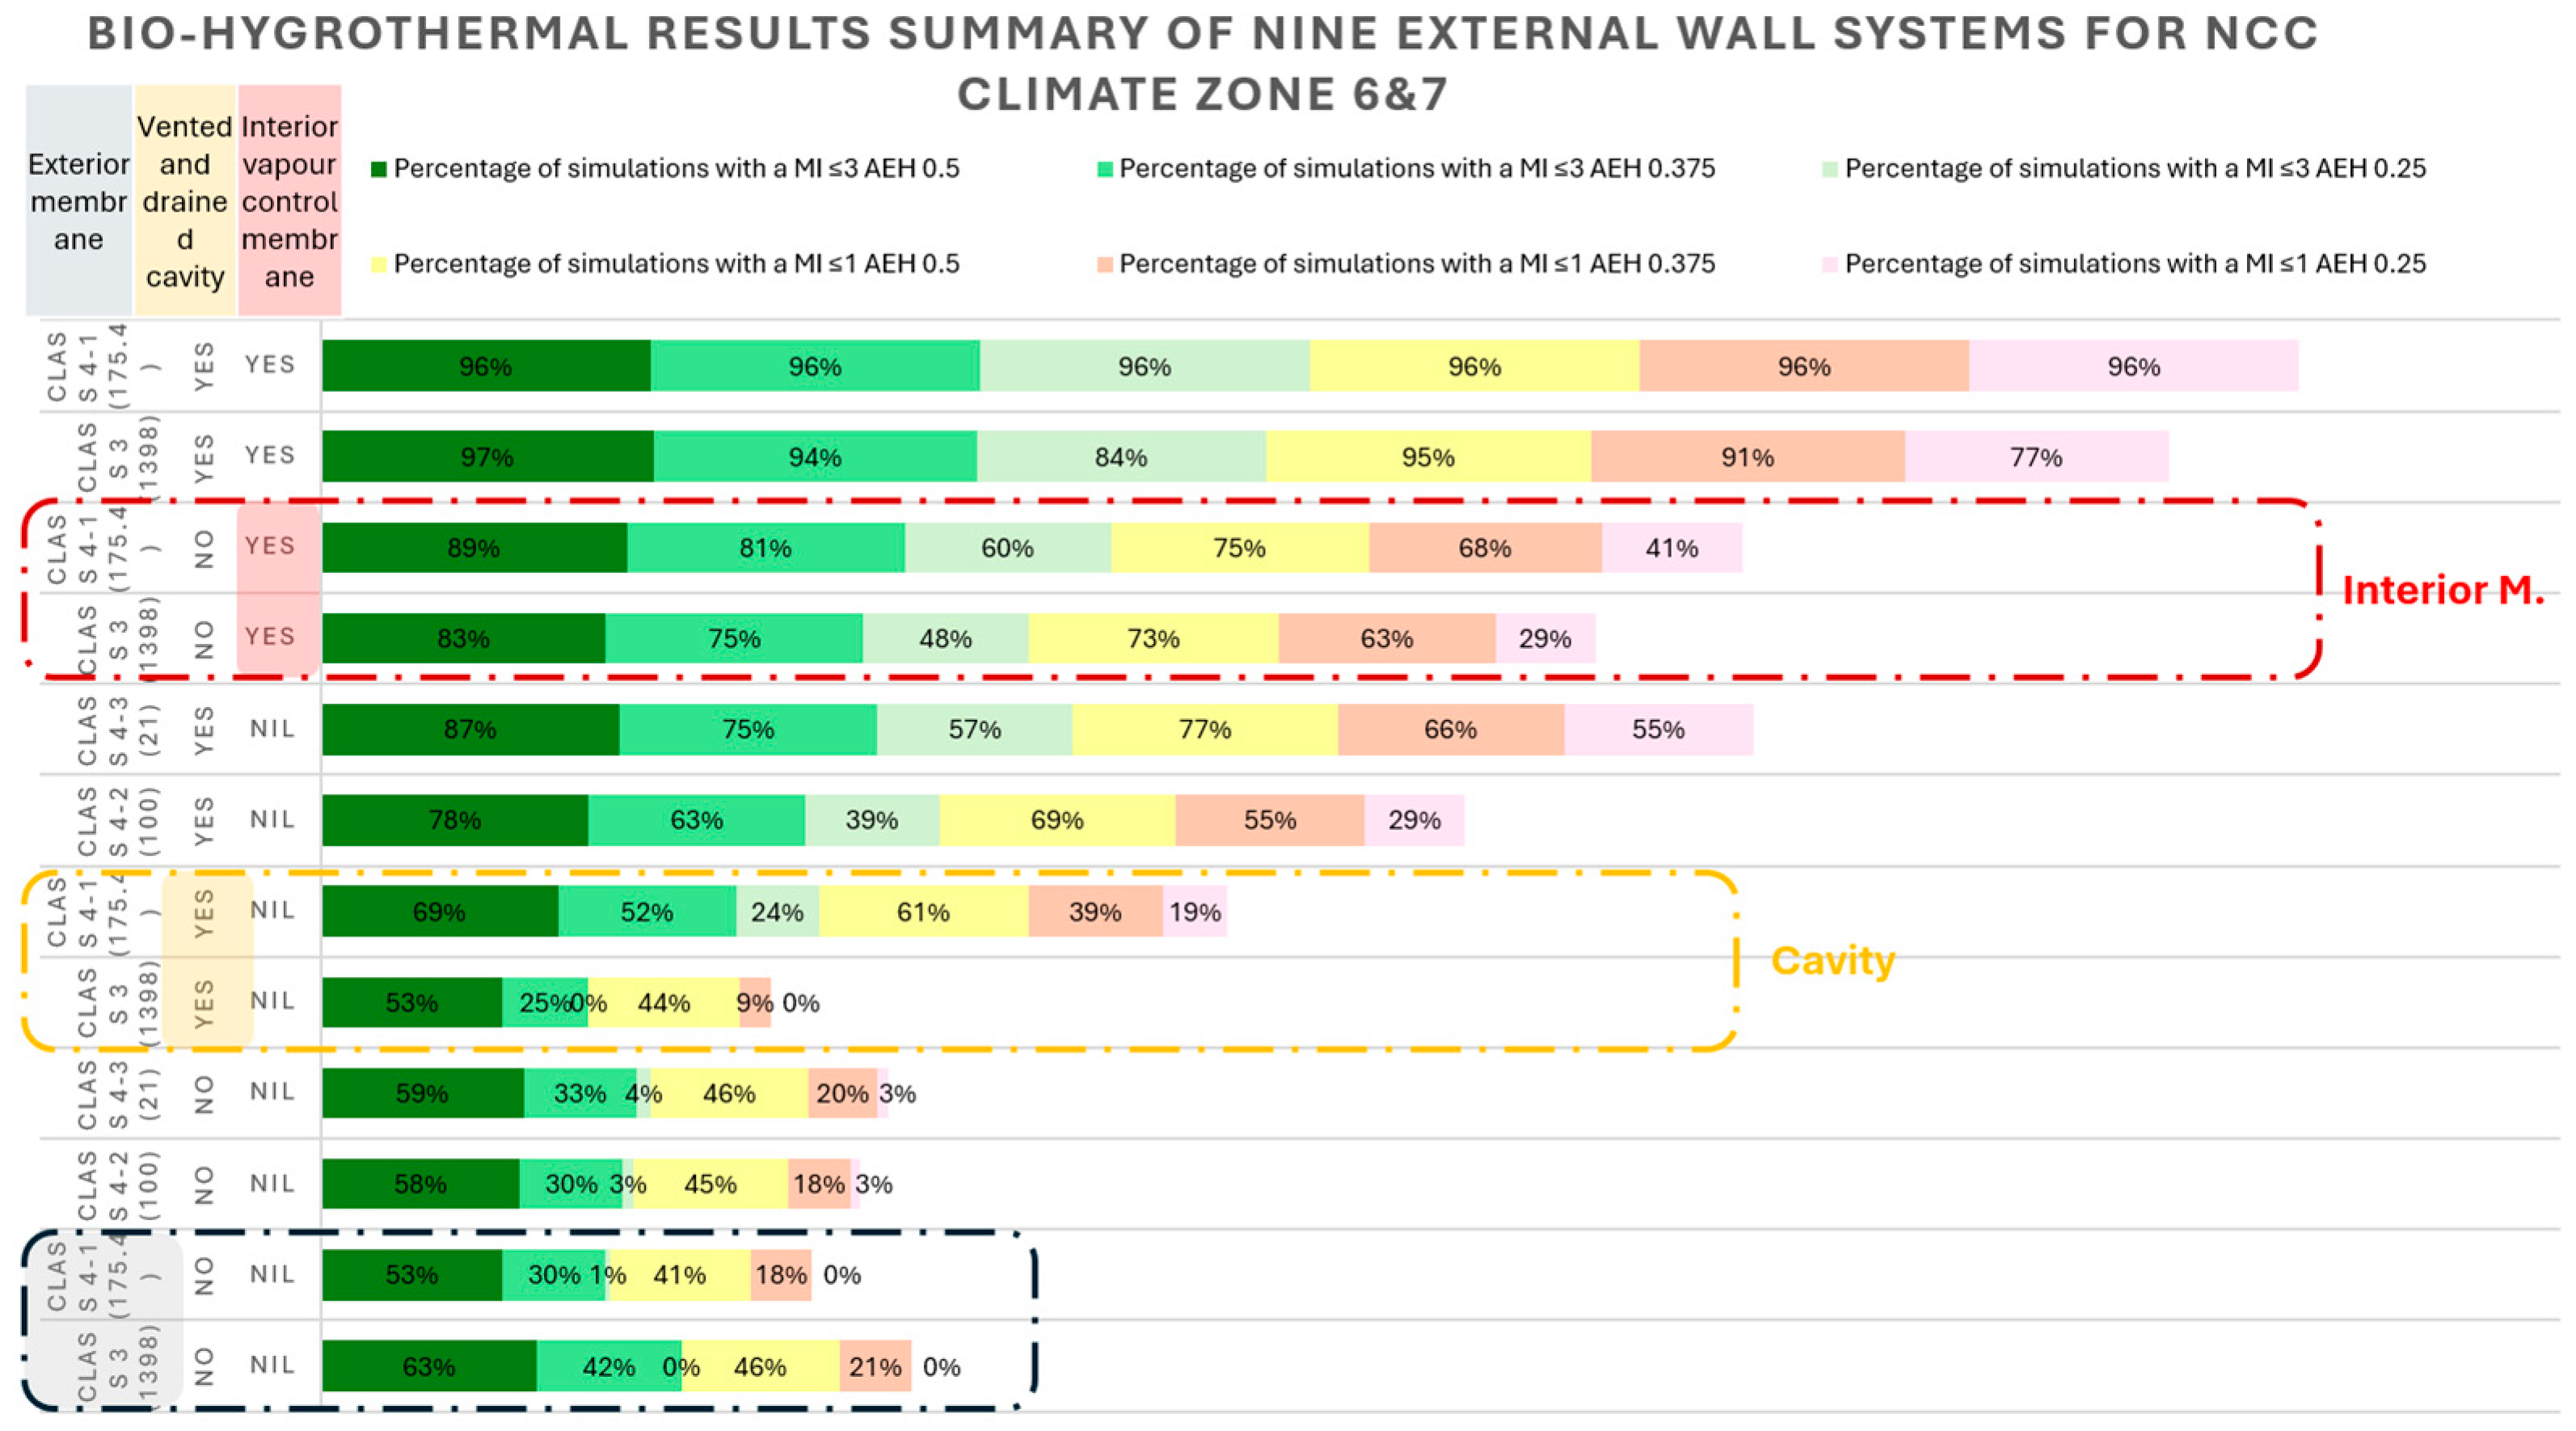
3.2.2. NCC Climate Zone 6 and 7
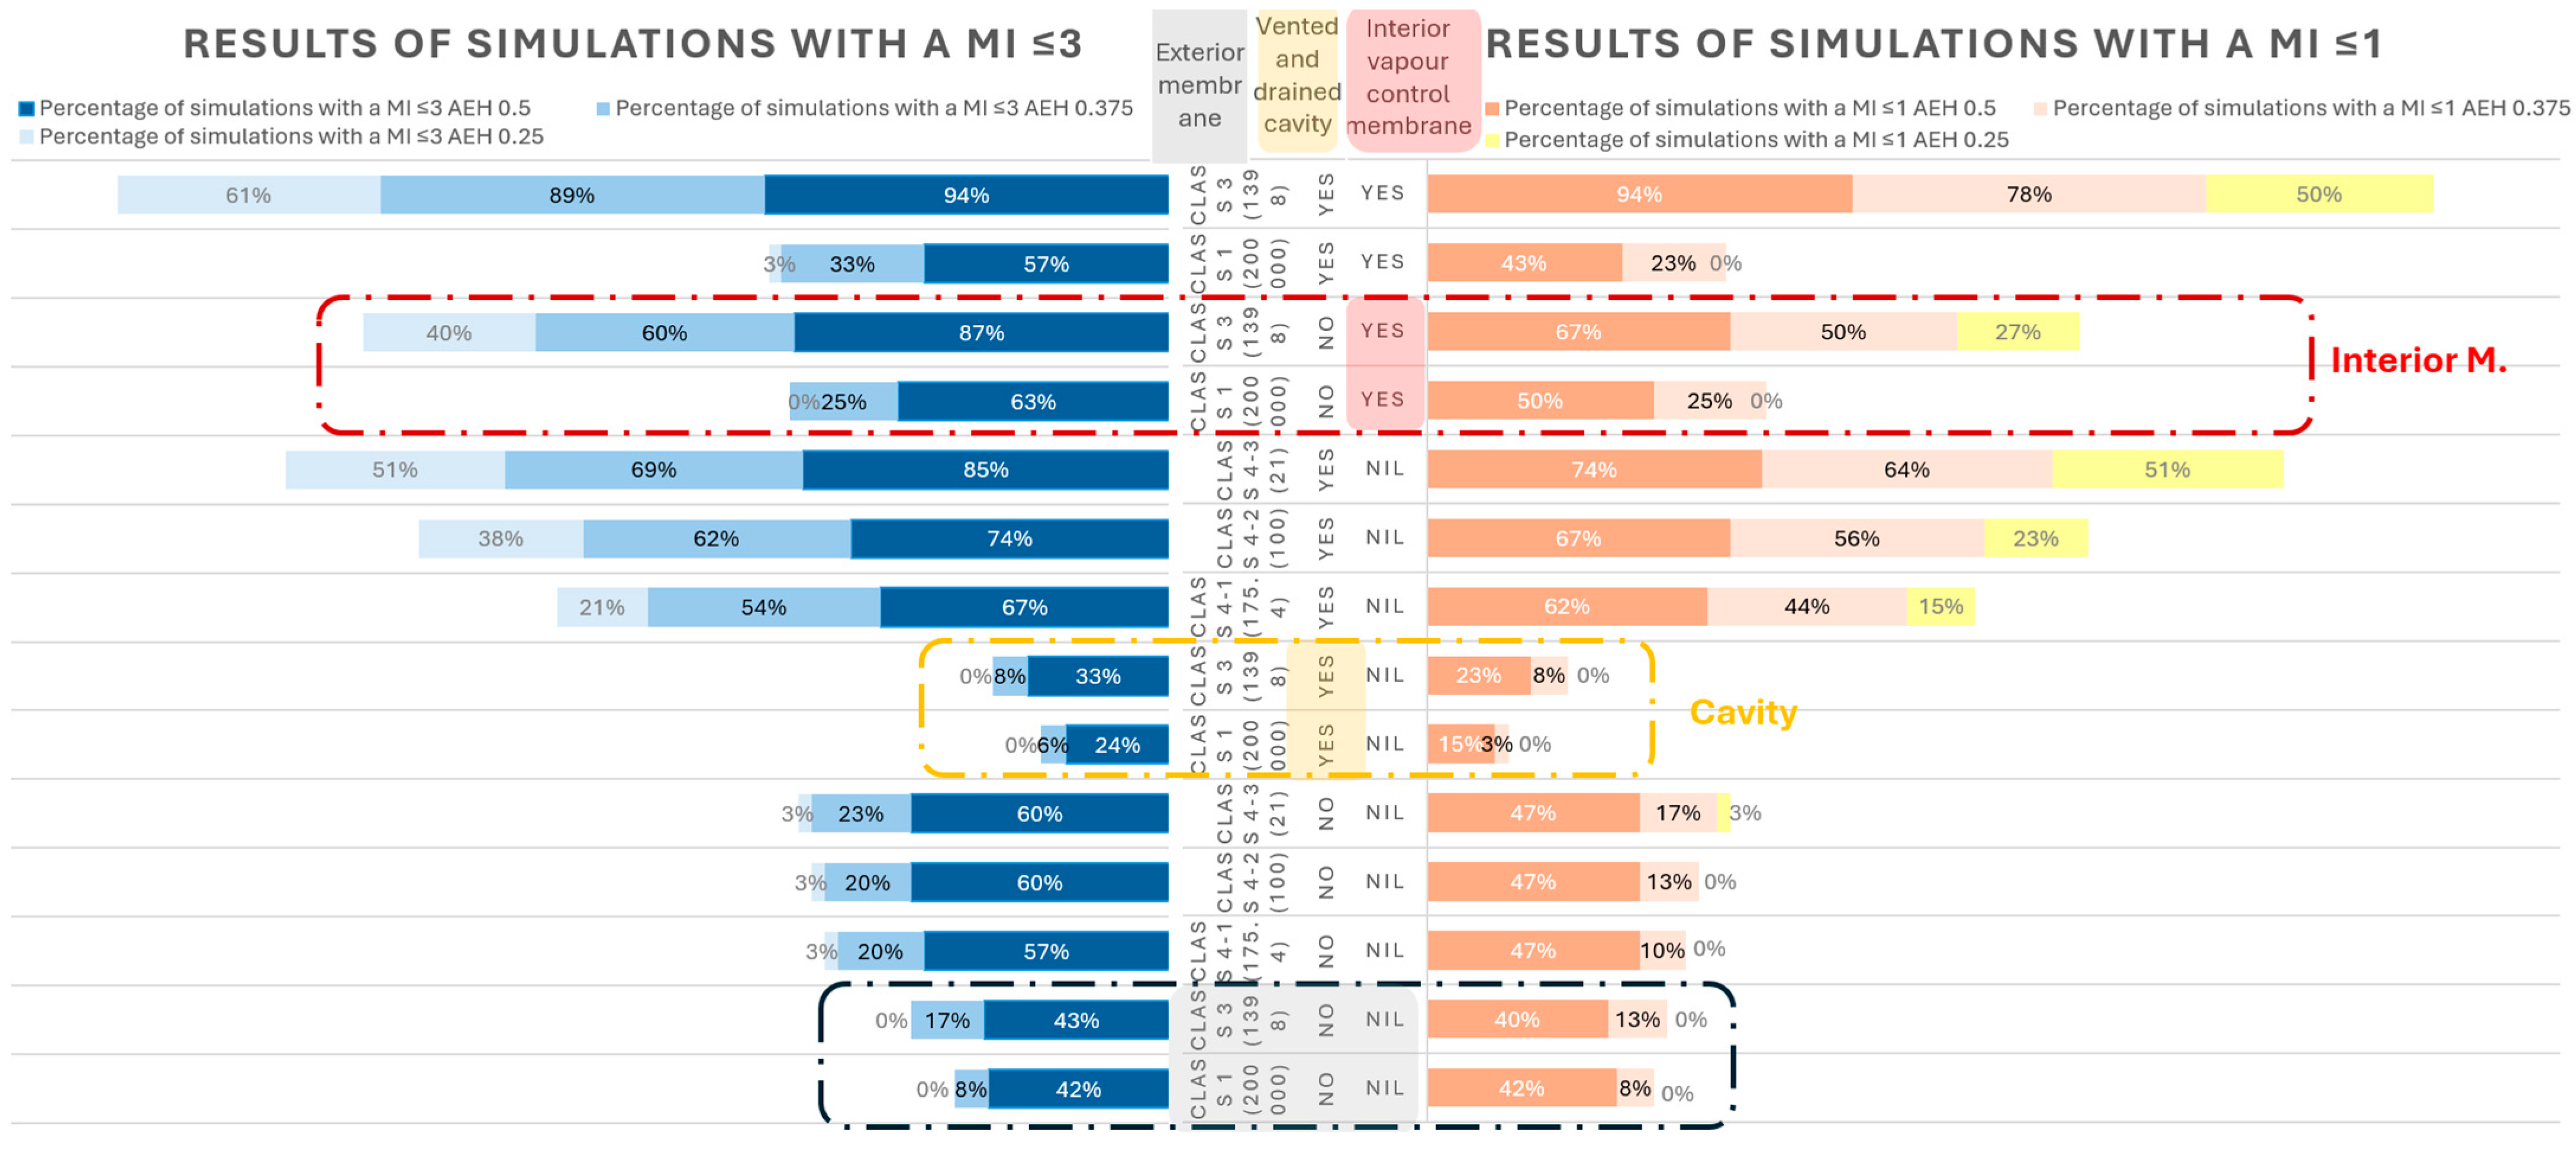
3.3. Air Change Rates: Impact on Bio-Hygrothermal Performance
4. Discussion
5. Conclusions
Author Contributions
Funding
Data Availability Statement
Conflicts of Interest
References
- AGO. Senate Environment, Communications, Information Technology and the Arts Reference Committee Inquiry into Australia’s Response to Global Warming; The Commonwealth Government, Australian Greenhouse Office: Parkes, Australia, 1999.
- Dewsbury, M. The Empirical Validation of House Energy Rating (HER) Software for Lightweight Housing in Cool Temperate Climates. Ph.D. Thesis, University of Tasmania, Hobart, Australia, 2015. [Google Scholar]
- AGO. The National Greenhouse Strategy: Strategic Response for Advancing Australia’s Greenhouse Response; Australian Greenhouse Office: Parkes, Australia, 1998. [Google Scholar]
- International Energy Agency CO2 Emissions in 2022—Analysis. Available online: https://www.iea.org/reports/co2-emissions-in-2022 (accessed on 18 March 2024).
- Bertoldi, P.; Rezessy, S.; Vine, E. Energy Service Companies in European Countries: Current Status and a Strategy to Foster Their Development. Energy Policy 2006, 34, 1818–1832. [Google Scholar] [CrossRef]
- ABCB Building Code of Australia 1996 Amendment 13|NCC. Available online: https://ncc.abcb.gov.au/editions/bca-1996-a13 (accessed on 7 May 2025).
- Ionescu, C.; Baracu, T.; Vlad, G.-E.; Necula, H.; Badea, A. The Historical Evolution of the Energy Efficient Buildings. Renew. Sustain. Energy Rev. 2015, 49, 243–253. [Google Scholar] [CrossRef]
- Hall, A.; Horta, A.; Khan, M.R.; Crabbe, R.A. Spatial Analysis of Outdoor Wet Bulb Globe Temperature under RCP4.5 and RCP8.5 Scenarios for 2041–2080 across a Range of Temperate to Hot Climates. Weather. Clim. Extrem. 2022, 35, 100420. [Google Scholar] [CrossRef]
- European Commission Policy Measure Fact Sheet of France, Heating Regulation 2012, Thematic Objective 3; Ministry of Ecology, Sustainable Development and Energy: Paris, France; Internal Market, Industry, Entrepreneurship and SMEs: Brussels, Belgium, 2016; p. 4.
- ABCB Australian Building Codes Board. Available online: https://www.abcb.gov.au/ (accessed on 31 January 2025).
- Anthony, W. CSRIO: A Short History of Energy-Efficient Housing in Australia. Available online: https://ahd.csiro.au/modern-green-homes/ (accessed on 15 November 2023).
- NatHERS Nationwide House Energy Rating Scheme. Available online: https://www.nathers.gov.au/ (accessed on 25 September 2023).
- Nationwide House Energy Rating Scheme Climate Zone Map Nationwide House Energy Rating Scheme. Available online: https://public.tableau.com/views/nathersclimateaverages3/Climate?:embed=y&:showVizHome=no&:host_url=https%3A%2F%2Fpublic.tableau.com%2F&:embed_code_version=3&:tabs=no&:toolbar=yes&:animate_transition=yes&:display_static_image=no&:display_spinner=no&:display_overlay=yes&:display_count=yes&:language=en-GB&publish=yes&:loadOrderID=0 (accessed on 6 August 2024).
- NCC Climates. Available online: https://ahd.csiro.au/dashboards/energy-rating/ncc-climates/ (accessed on 20 March 2024).
- NatHERS Climate Zones. Available online: https://ahd.csiro.au/dashboards/energy-rating/climate-zones/ (accessed on 20 March 2024).
- Gill Armstrong, A.P. 7-Star Housing Is a Step Towards Zero Carbon—But There’s Much More to Do, Starting with Existing Homes. Available online: https://ahd.csiro.au/7-star-housing-is-a-step-towards-zero-carbon-but-theres-much-more-to-do-starting-with-existing-homes/ (accessed on 8 November 2023).
- Australian Building Codes Board. National Construction Code of Australia (NCC) 2022. Volume 1.2.3. Available online: https://ncc.abcb.gov.au/editions/ncc-2022 (accessed on 29 January 2025).
- Pollentier, M. The Development of an Hourly Thermal Simulation Program for Use in the Australian Nationwide House Energy Rating Scheme. Available online: https://www.aivc.org/sites/default/files/members_area/medias/pdf/Inive/clima2000/1997/P354.pdf (accessed on 24 March 2024).
- Ballinger, J.A.; Cassell, D. Solar Efficient Housing and NatHERS: An Important Marketing Tool; U.S. Department of Energy, Office of Scientific and Technical Information: Oak Ridge, TN, USA, 1994.
- Tucker, S. Greenhouse Efficient Design: Report for Australian Greenhouse Office; AGO, CSIRO. 2002. Available online: https://figshare.swinburne.edu.au/articles/report/AGO-CSIRO_greenhouse_efficient_design_report_for_Australian_Greenhouse_Office/26290765 (accessed on 11 December 2023).
- ABCB The Building Code of Australia; Australian Building Codes Board (ABCB). 2004; Section 3.12. Available online: https://ncc.abcb.gov.au/editions-national-construction-code (accessed on 5 November 2023).
- NatHERS Nationwide House Energy Rating Scheme Software Accreditation Protocol; Canberra. 2019. Available online: https://www.nathers.gov.au/nathers-accredited-software/software-protocol (accessed on 5 July 2024).
- ABCB Protocol For House Energy Rating Software V2005.1; Australian Building Codes Board. 2005. Available online: https://ncc.abcb.gov.au/editions-national-construction-code (accessed on 5 July 2024).
- ABCB Protocol For House Energy Rating Software V2006.1. 2006. Australian Building Codes Board. 2006. Available online: https://ncc.abcb.gov.au/editions-national-construction-code (accessed on 5 July 2024).
- Drogemuller, R.; Delsante, A.; Moller, S.; Sharpe, R.; Blackmore, J.; Oakes, S. Scoping Study of Minimum Energy Performance Requirements for Incorporation into the Building Code of Australia; Australian Greenhouse Office: Canberra, Australia, 1999. [Google Scholar]
- ABCB. National Construction Code: Volume 2—Building Code of Australia; Australian Building Codes Board: Canberra, Australia, 2022. [Google Scholar]
- Law, T.; Dewsbury, M. The Unintended Consequence of Building Sustainably in Australia. In Sustainable Development Research in the Asia-Pacific Region: Education, Cities, Infrastructure and Buildings; Leal Filho, W., Rogers, J., Iyer-Raniga, U., Eds.; World Sustainability Series; Springer International Publishing: Cham, Switzerland, 2018; pp. 525–547. ISBN 978-3-319-73293-0. [Google Scholar]
- Guan, L.; Dewsbury, M.; Louise, W. Hygrothermal and Bio-Hygrothermal Risks to Architecture: Moisture Accumulation, Indoor Mould Growth, and Energy Efficiency; Launceston, Tasmania. 2023. Available online: https://archscience.org/paper/hygrothermal-and-bio-hygrothermal-risks-to-architecture-moisture-accumulation-indoor-mould-growth-and-energy-efficiency/ (accessed on 28 June 2024).
- Singh, J.; Yu, C.W.F.; Kim, J.T. Building Pathology, Investigation of Sick Buildings—Toxic Moulds. Indoor Built Environ. 2010, 19, 40–47. [Google Scholar] [CrossRef]
- Australian Building Codes Board (ABCB). Summary of Changes Energy Efficiency and Condensation Management; NCC 2022 public comment draft (stage 2); Australian Building Codes Board (ABCB): Canberra, Australia, 2021; p. 31.
- CSIRO Unfriendly Fungi: Dealing with a Mouldy House. Available online: https://www.csiro.au/en/news/All/Articles/2020/August/dealing-with-mouldy-houses (accessed on 10 July 2024).
- Grün, G.; Urlaub, S.; Galiotto, N.; Foldbjerg, P.; Sedlbauer, K.P. Impact of Mould and Dampness on the Prevalence of Having Asthma in European Homes. In Proceedings of the Healthy Build. Europe; International Society of Indoor Air Quality and Climate, Lublin, Poland, 2–5 July 2017. [Google Scholar]
- Valavanidis, A. Indoor Air Pollution Causes Around 4 Million Premature Deaths Worldwide per Year Health Studies Have Established That Indoor Air Quality Affects Human Health and Well-Being. 2023, Volume 1, pp. 1–27. Available online: https://www.researchgate.net/publication/368881818_Indoor_Air_Pollution_Causes_Around_4_Million_Premature_Deaths_Worldwide_per_Year_Health_studies_have_established_that_indoor_air_quality_affects_human_health_and_well-being (accessed on 28 July 2023).
- Sjöberg, A. Mould in Building Envelope May Cause Bad Health, a Case Study. In Proceedings of the International Conference and Exhibition on Healthy Buildings 2009, New York, NY, USA, 13–17 September 2009. [Google Scholar]
- WHO World Health Organisation. Global Air Quality Guidelines.Particulate Matter(PM2.5 and PM10), Nitrogen Dioxide, Sulfur Dioxide and Carbon Monoxide. 2021. Available online: https://www.who.int/publications/i/item/9789240034228 (accessed on 20 July 2023).
- Mariotti, T. Mold Statistics. 2024. Available online: https://www.rubyhome.com/blog/mold-stats/ (accessed on 19 March 2024).
- Mike, F. Book Review—Peter Dyer’s Rottenomics: The Story of New Zealand’s Leaky Buildings Disaster. Building Today 2020. Available online: https://buildingtoday.co.nz/2020/04/23/book-review-peter-dyers-rottenomics-the-story-of-new-zealands-leaky-buildings-disaster/ (accessed on 10 January 2025).
- Dewsbury, M.; Law, T. Recent Increases in the Occurrence of Condensation and Mould within New Tasmanian Housing; University of Tasmania: Hobart, Australia, 2016; ISBN 978-0-9923835-3-4. [Google Scholar]
- Kuenzel, H.; Dewsbury, M. Moisture Control Design Has to Respond to All Relevant Hygrothermal Loads. UCL Open Environ. 2022, 4, e037. [Google Scholar] [CrossRef]
- ASHRAE Standard Project Committee ANSI/ASH RAE Standard 160; Criteria for Moisture-Control Design Analysis in Buildings. ASHRAE: Peachtree Corners, GA, USA, 2016.
- ISO 13788; Hygrothermal Performance of Building Components and Building Elements—Internal Surface Temperature to Avoid Critical Surface Humidity and Interstitial Condensation—Calculation Methods. ISO: Geneva, Switzerland, 2012.
- Kuenzel, H. Simultaneous Heat and Moisture Transport in Building Components. One- and Two-Dimensional Calculation Using Simple Parameters; Fraunhofer IBP: Stuttgart, Germany, 1995. [Google Scholar]
- Australian Forest Products Association Timber Framing—The Ultimate RenewableTM. Available online: https://ausfpa.com.au/timber-framing-the-ultimate-renewable/ (accessed on 27 June 2024).
- NCC 2022 Standards Spotlight: Residential Timber-Framed Construction—Standards Australia 2023. Available online: https://www.standards.org.au/blog/ncc-2022-standards-spotlight-residential-timber-framed-construction (accessed on 2 March 2025).
- Hansen, T.; Wallentén, P. Investigation of the Mould Resistance Design (MRD) Model for Mould Growth in Attics. In Proceedings of the E3S Web Conference, Semarang, Indonesia, 12–13 August 2020; Kurnitski, J., Kalamees, T., Eds.; EDP Sciences: Les Ulis, France, 2020; Volume 172. [Google Scholar]
- Imken, A.A.P.; Brischke, C.; Kögel, S.; Krause, K.C.; Mai, C. Resistance of Different Wood-Based Materials against Mould Fungi: A Comparison of Methods. Eur. J. Wood Wood Prod. 2020, 78, 661–671. [Google Scholar] [CrossRef]
- VBA Examining Indoor Mould and Moisture Damage in Victorian Residential Buildings. Available online: https://www.vba.vic.gov.au/about/research/examining-indoor-mould-and-moisture-damage-in-victorian-residential-buildings (accessed on 20 July 2023).
- Ott, S.; Tietze, A.; Winter, S. Wind Driven Rain and Moisture Safety of Tall Timber Houses—Evaluation of Simulation Methods. Wood Mater. Sci. Eng. 2015, 10, 300–311. [Google Scholar] [CrossRef]
- AS4200 Standards Australia; AS4200.1: Pliable Building Membranes and Underlays. Standards Australia: Sydney, Australia, 2017.
- Olaoye, T.S.; Dewsbury, M.; Künzel, H. Empirical Investigation of the Hygrothermal Diffusion Properties of Permeable Building Membranes Subjected to Variable Relative Humidity Condition. Energies 2021, 14, 4053. [Google Scholar] [CrossRef]
- Viitanen, H.; Krus, M.; Ojanen, T.; Eitner, V.; Zirkelbach, D. Mold Risk Classification Based on Comparative Evaluation of Two Established Growth Models. Energy Procedia 2015, 78, 1425–1430. [Google Scholar] [CrossRef]
- Nath, S.; Dewsbury, M.; Watson, P.; Lovell, H.; Kuenzel, H. A Bio-Hygrothermal Analysis of Typical Australian Residential Wall Systems. 2020. Available online: https://archscience.org/wp-content/uploads/2021/03/1-A-bio-hygrothermal-mould-growth-analysis-of-typical-Australian-residential-wall-systems.pdf (accessed on 1 April 2024).
- Statista Research Department Australia Australia: External Wall Types by Construction Material 2023. Available online: https://www.statista.com/statistics/1230246/australia-external-wall-type-construction-material/ (accessed on 8 May 2024).
- Building Approvals, Australia, March 2024|Australian Bureau of Statistics. Available online: https://www.abs.gov.au/statistics/industry/building-and-construction/building-approvals-australia/latest-release (accessed on 8 May 2024).
- BS5250 Code of Practice for Control of Condensation in Buildings. Available online: https://1library.net/document/qovgeljz-code-practice-control-condensation-buildings.html (accessed on 4 February 2025).
- Michael Ambrose The Average Air Change Rate of Measued Homes in Australia By2024. Available online: https://ahd.csiro.au/wp-content/uploads/air-infiltration-of-new-dwellings-final-report.pdf (accessed on 25 June 2024).


| Climate No. | Location | NatHERS Stars | ||||||||||
|---|---|---|---|---|---|---|---|---|---|---|---|---|
| Star-Band | 0.5 | 1 | 2 | 3 | 4 | 5 | 6 | 7 | 8 | 9 | 10 | |
| 1 | Darwin (NT) | 809 | 741 | 626 | 535 | 462 | 399 | 340 | 298 | 257 | 219 | 190 |
| 21 | Melbourne | 523 | 430 | 290 | 199 | 143 | 107 | 81 | 62 | 44 | 25 | 11 |
| 22 | East Sale | 808 | 655 | 441 | 310 | 228 | 172 | 131 | 100 | 69 | 40 | 15 |
| 27 | Mildura | 616 | 530 | 379 | 263 | 185 | 136 | 103 | 79 | 55 | 32 | 14 |
| 33 | Broome (WA) | 711 | 636 | 519 | 438 | 378 | 328 | 280 | 250 | 219 | 191 | 170 |
| 60 | Tullamarine | 790 | 628 | 405 | 279 | 210 | 167 | 131 | 99 | 69 | 41 | 17 |
| 61 | Mt Gambier | 860 | 695 | 461 | 319 | 234 | 180 | 140 | 106 | 73 | 41 | 15 |
| 62 | Moorabbin | 668 | 548 | 373 | 262 | 192 | 146 | 112 | 85 | 59 | 34 | 13 |
| 63 | Warrnambool | 880 | 688 | 433 | 296 | 226 | 184 | 147 | 112 | 78 | 45 | 19 |
| 64 | Cape Otway | 680 | 570 | 401 | 285 | 207 | 155 | 116 | 88 | 62 | 37 | 16 |
| 66 | Ballarat | 1111 | 909 | 622 | 446 | 338 | 266 | 207 | 161 | 117 | 75 | 41 |
| No. | The Exterior Wall Types Examined |
|---|---|
| 1 | Timber cladding, with glass-wool batt insulated timber structural frame |
| 2 | Compressed fibre cement sheet (CFCS)cladding, with glass-wool batt insulated timber structural frame |
| 3 | Clay masonry veneer, with glass-wool batt insulated timber structural frame |
| 4 | Concrete blockwork masonry, with glass-wool batt insulated timber structural frame |
| 5 | Externally insulated clay masonry, with glass-wool batt insulated timber structural frame |
| 6 | Extruded polystyrene (XPS) cladding, with glass-wool batt insulated timber structural frame |
| 7 | Expanded polystyrene (EPS) cladding, with glass-wool batt insulated timber structural frame |
| 8 | Autoclaved aerated concrete (AAC) masonry cladding, with glass-wool batt insulated timber structural frame |
| 9 | Flat sheet-metal cladding, with glass-wool batt insulated timber structural frame |
| NatHERS Climate Zone | NCC Climate Zone | Location of Weather Station | New Houses Built in This Climate (Percentage) |
|---|---|---|---|
| 21 | 6 | Melbourne | 6% |
| 22 | 6 | East Sale | 12% |
| 27 | 4 and 6 | Mildura | 9% |
| 60 | 6 | Tullamarine | 12% |
| 61 | 4 and 6 | Mt Gambier | 2% |
| 63 | 6 | Warrnambool | 4% |
| 64 (+62) | 6 | Cape Otway (+Moorabbin) | 25% |
| 66 | 4 and 6 | Ballarat | 30% |
| TOTAL | 100% |
| NCC | Energy Rating | NCC Climate Zone 1–3 | NCC Climate Zone 4–5 | NCC Climate Zone 6–8 |
|---|---|---|---|---|
| NCC 2019 | 6-Star | No requirements | No requirements (Class 1 applied in this study) | Min Class 3, AS4200 (Class 3 applied in this study) |
| NCC 2022 | 7-Star | No requirements | Min Class 3, AS4200 (Class 3 applied in this study) | Min Class 4, AS4200 (Class 4 applied in this study) |
| Min ≥ (µg/N. s) | Max < (µg/N. s) | Corresponding Water Vapour Diffusion Resistance Factor | |
|---|---|---|---|
| Class 1 | 0.0000 | 0.0022 | ≥90,909.0909 to infinite |
| Class 2 | 0.0022 | 0.1429 | ≥1399.5801 to <90,909.0909 |
| Class 3 | 0.1429 | 1.1403 | ≥175.4078 to <1399.5801 |
| Class 4 | 1.1403 | No Max | 0.0000 to <175.4078 |
| NatHERS Climate Zones | NCC Climate Zones | Moisture Accumulation Results |
|---|---|---|
| 27 | 4–5 | Nil |
| 61 | Moisture accumulation | |
| 66 | Nil | |
| 21 | 6, 7 and 8 4.6 | Moisture accumulation |
| 22 | Nil | |
| 27 | Nil | |
| 60 | Moisture accumulation | |
| 61 | Moisture accumulation | |
| 63 | Moisture accumulation | |
| 64 | Moisture accumulation | |
| 66 | Moisture accumulation |
Disclaimer/Publisher’s Note: The statements, opinions and data contained in all publications are solely those of the individual author(s) and contributor(s) and not of MDPI and/or the editor(s). MDPI and/or the editor(s) disclaim responsibility for any injury to people or property resulting from any ideas, methods, instructions or products referred to in the content. |
© 2025 by the authors. Licensee MDPI, Basel, Switzerland. This article is an open access article distributed under the terms and conditions of the Creative Commons Attribution (CC BY) license (https://creativecommons.org/licenses/by/4.0/).
Share and Cite
Guan, L.; Dewsbury, M.; Wallis, L.; Kuenzel, H. Navigating Energy Efficiency and Mould Risk in Australian Low-Rise Homes: A Comparative Analysis of Nine External Wall Systems in Southeast Australia. Energies 2025, 18, 2843. https://doi.org/10.3390/en18112843
Guan L, Dewsbury M, Wallis L, Kuenzel H. Navigating Energy Efficiency and Mould Risk in Australian Low-Rise Homes: A Comparative Analysis of Nine External Wall Systems in Southeast Australia. Energies. 2025; 18(11):2843. https://doi.org/10.3390/en18112843
Chicago/Turabian StyleGuan, Liqun, Mark Dewsbury, Louise Wallis, and Hartwig Kuenzel. 2025. "Navigating Energy Efficiency and Mould Risk in Australian Low-Rise Homes: A Comparative Analysis of Nine External Wall Systems in Southeast Australia" Energies 18, no. 11: 2843. https://doi.org/10.3390/en18112843
APA StyleGuan, L., Dewsbury, M., Wallis, L., & Kuenzel, H. (2025). Navigating Energy Efficiency and Mould Risk in Australian Low-Rise Homes: A Comparative Analysis of Nine External Wall Systems in Southeast Australia. Energies, 18(11), 2843. https://doi.org/10.3390/en18112843