Article

A Topology Identification Strategy of Low-Voltage Distribution Grids Based on Feature-Enhanced Graph Attention Network

1
Power Science Research Institute of State Grid Hubei Electric Power Co., Wuhan 430048, China
2
School of Electrical Engineering, Southeast University, Nanjing 211102, China
3
Power Science Research Institute of State Grid Shanxi Electric Power Co., Taiyuan 030021, China
*
Author to whom correspondence should be addressed.
Energies 2025, 18(11), 2821; https://doi.org/10.3390/en18112821
Submission received: 19 March 2025 / Revised: 5 May 2025 / Accepted: 9 May 2025 / Published: 29 May 2025

Abstract

:
Accurate topological connectivity is critical for the safe operation and management of low-voltage distribution grids (LVDGs). However, due to the complexity of the structure and the lack of measurement equipment, obtaining and maintaining these topological connections has become a challenge. This paper proposes a topology identification strategy for LVDGs based on a feature-enhanced graph attention network (F-GAT). First, the topology of the LVDG is represented as a graph structure using measurement data collected from intelligent terminals, with a feature matrix encoding the basic information of each entity. Secondly, the meta-path form of the heterogeneous graph is designed according to the connection characteristics of the LVDG, and the walking sequence is enhanced using a heterogeneous skip-gram model to obtain an embedded representation of the structural characteristics of each node. Then, the F-GAT model is used to learn potential association patterns and structural information in the graph topology, achieving a joint low-dimensional representation of electrical attributes and graph semantics. Finally, case studies on five urban LVDGs in the Wuhan region are conducted to validate the effectiveness and practicality of the proposed F-GAT model.

1. Introduction

1.1. Motivation

The distribution grid represents vital public infrastructure, underpinning social progress and economic operations. Low-voltage distribution grids (LVDGs) are complex and connect a large number of dispersed users [1,2]. Economic development and the growth of electricity demand make the line extension and network topology of LVDGs increasingly complex. When a power company records topological structure information, it often causes errors or omissions due to delayed information updates, abnormal terminal data, manual line inspection and so on. Furthermore, LVDGs only cover user and transformer node data, and intermediate node measurement equipment is lacking [3,4]. Consequently, how to update and maintain the topology information of LVDGs efficiently based on the data collected by intelligent terminals has become one of the most important challenges faced by power companies.

1.2. Literature Review and Research Gaps

Currently, the methods to solve the problem of topology identification of LVDGs are divided into manual verification, signal transmission and data analysis. The manual verification method relies on the operator to inspect the record line on site, which is inefficient and costly. The signal transmission method identifies physical connections by injecting signals and tracking the flow of signals between devices [5,6,7]. Ge et al. [5] proposed a topology identification method for low-voltage overhead lines based on high-frequency signal injection. The method is based on delay measurement and reflection feature analysis to achieve line length estimation. The effectiveness of the method was verified by MATLAB simulation. Ref. [6] proposed a novel power transformer and phase identification system based on data communication technology. The system identifies live lines in distribution grids by injecting low-power, high-frequency signals, and its effectiveness was validated in large-scale commercial buildings. In [7], scholars conducted a phase shift analysis and phase recognition under a three-phase unbalanced constant current load in a distribution grid. By constructing a line-phase analytic theoretical model and Simulink modeling, the influence of load unbalance degree on phase detection was quantitatively evaluated.
Although the aforementioned signal transmission method achieves high recognition accuracy, it demands significant investment and operational costs. With the widespread use of advanced metering infrastructure (AMI), topology identification methods based on data analysis have become a popular research direction.
Topology identification methods based on data analysis mainly include those based on correlation and clustering [8,9,10,11], planning [12,13,14,15] and neural networks [16,17,18,19,20]. By characterizing the correlation of the electrical volume (e.g., voltage, current, active power) between each node and device in the LVDG, the connection is determined based on the correlation and clustering method.
Considering the need for accuracy and efficiency in LVDG topology verification, ref. [8] proposed an LVDG topology verification algorithm based on the k-means clustering algorithm. Based on the correlation of voltage curves, the algorithm uses the k-means clustering algorithm to cluster them to improve the accuracy of user connection anomaly detection in the platform area. In [9], Song et al. proposed a voltage feature classification algorithm based on unsupervised learning, which identifies the transformer user physical connection relationship of LVDGs through smart meter data and solves the compliance verification problem of inconsistency between user data and physical topology. An unsupervised identification method combining t-SNE dimension reduction and balanced iterative reducing and clustering using hierarchies clustering was proposed in ref. [10], which uses load data characteristics to achieve accurate judgment of the user phase and meter box access relationship in a low-voltage distribution area. This method can significantly reduce the cost of manual investigation. Ref. [11] designed an LVDG topology identification framework based on density-based spatial clustering of applications with noise density clustering and t-SNE dimensionality reduction. The effectiveness and engineering practicality of this method for the reconstruction of the node network topology were verified through an actual case in Dongguan.
However, in LVDGs with concentrated urban loads, the electrical distance between users is notably reduced, leading to minimal similarity variations. Moreover, the efficacy of the aforementioned methods predominantly relies on comprehensive and precise measurement data, as well as power flow information, which significantly limits their applicability in LVDGs where advanced metering infrastructure is scarce.
Zhuang et al. [12] proposed a topology identification model based on mixed integer quadratic programming. This method finds the topology structure by the weighted least square method of the measured residuals and verifies the effectiveness of the proposed method through the IEEE-33 bus system. Ref. [13] established a mixed-integer programming (MIP) model based on a structural equation model. By integrating phasor measurement unit data and auxiliary variables, the model addresses feasible regional constraints. Its topology identification capability was validated through node constraint modeling in the IEEE-123 bus system. Aiming at the limitation of the measurement capability of non-contact current sensors, ref. [14] proposed a new algorithm based on the measurements of a small number of line current sensors and a pseudo-measurement of node power injection. The topology identification problem was expressed in the form of mixed-integer nonlinear programming, and the application scenarios were extended through topology observability analysis and actual feeder testing. In ref. [15], an MIP method driven by compressed sensing was designed. It utilizes Markov’s prior information to improve the topological identification under the condition of low data volume. The robustness of this method under the condition of 30% data has been verified in the IEEE-37 bus system.
Nevertheless, planning-based methods are highly dependent on data quality and sensors. The absence of data or the presence of noise may affect the identification results. To address this issue, some scholars have introduced neural-network-based methods to further enhance the robustness of topology identification.
Ref. [16] proposed a two-stage data-driven framework based on split expectation maximization and neural network classifiers. By using mixed topology identification of historical batch data, dynamic perception of distribution grid topology and large-scale partition expansion optimization are achieved. Li et al. [17] developed a neural-network-based method for topology identification and power flow partitioning with retrospective impedance estimation. By integrating the physical model of distribution transformer–user connections and feature extraction from smart meter data, the method effectively addresses the challenges of dynamic topology and online impedance identification in LVDGs with distributed energy integration. Ref. [18] proposed a hybrid data-driven framework for distribution grid topology identification, integrating deep belief networks (DBN) and random forests (RF) for initial screening. The framework addresses physical structural uncertainties through an MIP model. Its robustness and structural adaptability were validated using the IEEE-33 bus system. In ref. [19], scholars developed a deep convolutional time series clustering model. By jointly optimizing the embedding of voltage features through a convolutional autoencoder and the clustering layer, the model enables the identification of multi-dimensional topological relationships, such as user–transformer and user–phase connections in LVDGs. In [20], an adversarial generation mechanism was used to solve the identification problem of a radial structure in the scenario of limited measurements and missing data, and a grid topology generative adversarial network based on topological retention was constructed, which verifies the multi-scale topological generalization ability of this model in the IEEE-118 bus system.
In recent years, graph learning-based methods have gradually attracted attention. Graph learning methods are inherently suitable for the structure of the distribution grid. They can directly utilize the graph structure information of the distribution grid (such as nodes and edges) and transform the topology identification problem into a graph structure learning problem.
Ref. [21] proposed a two-stage topology identification method for state estimation driven by graph theory. Based on the optimization of the minimum objective function, it screens out the optimal topology that is consistent with the measurements. Its robustness to high-noise data and computational efficiency in the IEEE-123 bus system have been verified. Ref. [22] designed a four-level topology analysis framework of LVDGs, combining unsupervised learning and graph theory. Based on the tSNE–DBSCAN–LLE hybrid algorithm, topological-level feature extraction and graph structure generation are realized. It solves the core defect of the insufficient real-time performance of traditional methods. In ref. [23], Flynn et al. proposed an improved radial distribution grid topology estimation method based on a recursive grouping algorithm. By utilizing graph learning algorithms and fault detection techniques, the accuracy of radial distribution grid topology estimation has been significantly improved.
In summary, prior studies have made substantial contributions to the topology identification of LVDGs. However, two notable limitations remain evident in the existing references.
(1)
The effectiveness of the aforementioned topology identification methods in practical LVDGs is predominantly constrained by measurement device reliability and data quality. Notably, there are quite a few hidden nodes without installed measuring devices in LVDGs. Moreover, due to equipment aging, communication interference or environmental factors, the measurement data may contain noise or errors, which poses a challenge to the performance of the model.
(2)
In the existing research on the topology recognition of the LVDG, the network is often merely regarded as a simple homogeneous graph or only relies on the correlations of traditional electrical quantities (such as voltage and current). As a result, critical information, such as the hierarchical relationships within distribution areas and the diversity of equipment types, is often overlooked. In addition, the existing methods lack deep modeling of graph structure features (such as node neighbor relationship and path dependence), making it difficult to capture the complex interaction patterns among devices.

1.3. Contributions

To solve the problems above, a new feature-enhanced graph attention network (GAT) is proposed to solve the topology identification problem of LVDGs. Based on a meta-path random walk, the features of different types of nodes in the distribution area are enhanced, and the embedded representation of the structural characteristics of each node is obtained, which is fused with the basic information of the nodes. The GAT is used to learn the low-dimensional representation of topological nodes. Finally, the positive and negative judgment of node connection is carried out to achieve topology recognition strategy, incorporating offline deep training and online rapid response. This paper makes contributions in the following three aspects:
(1)
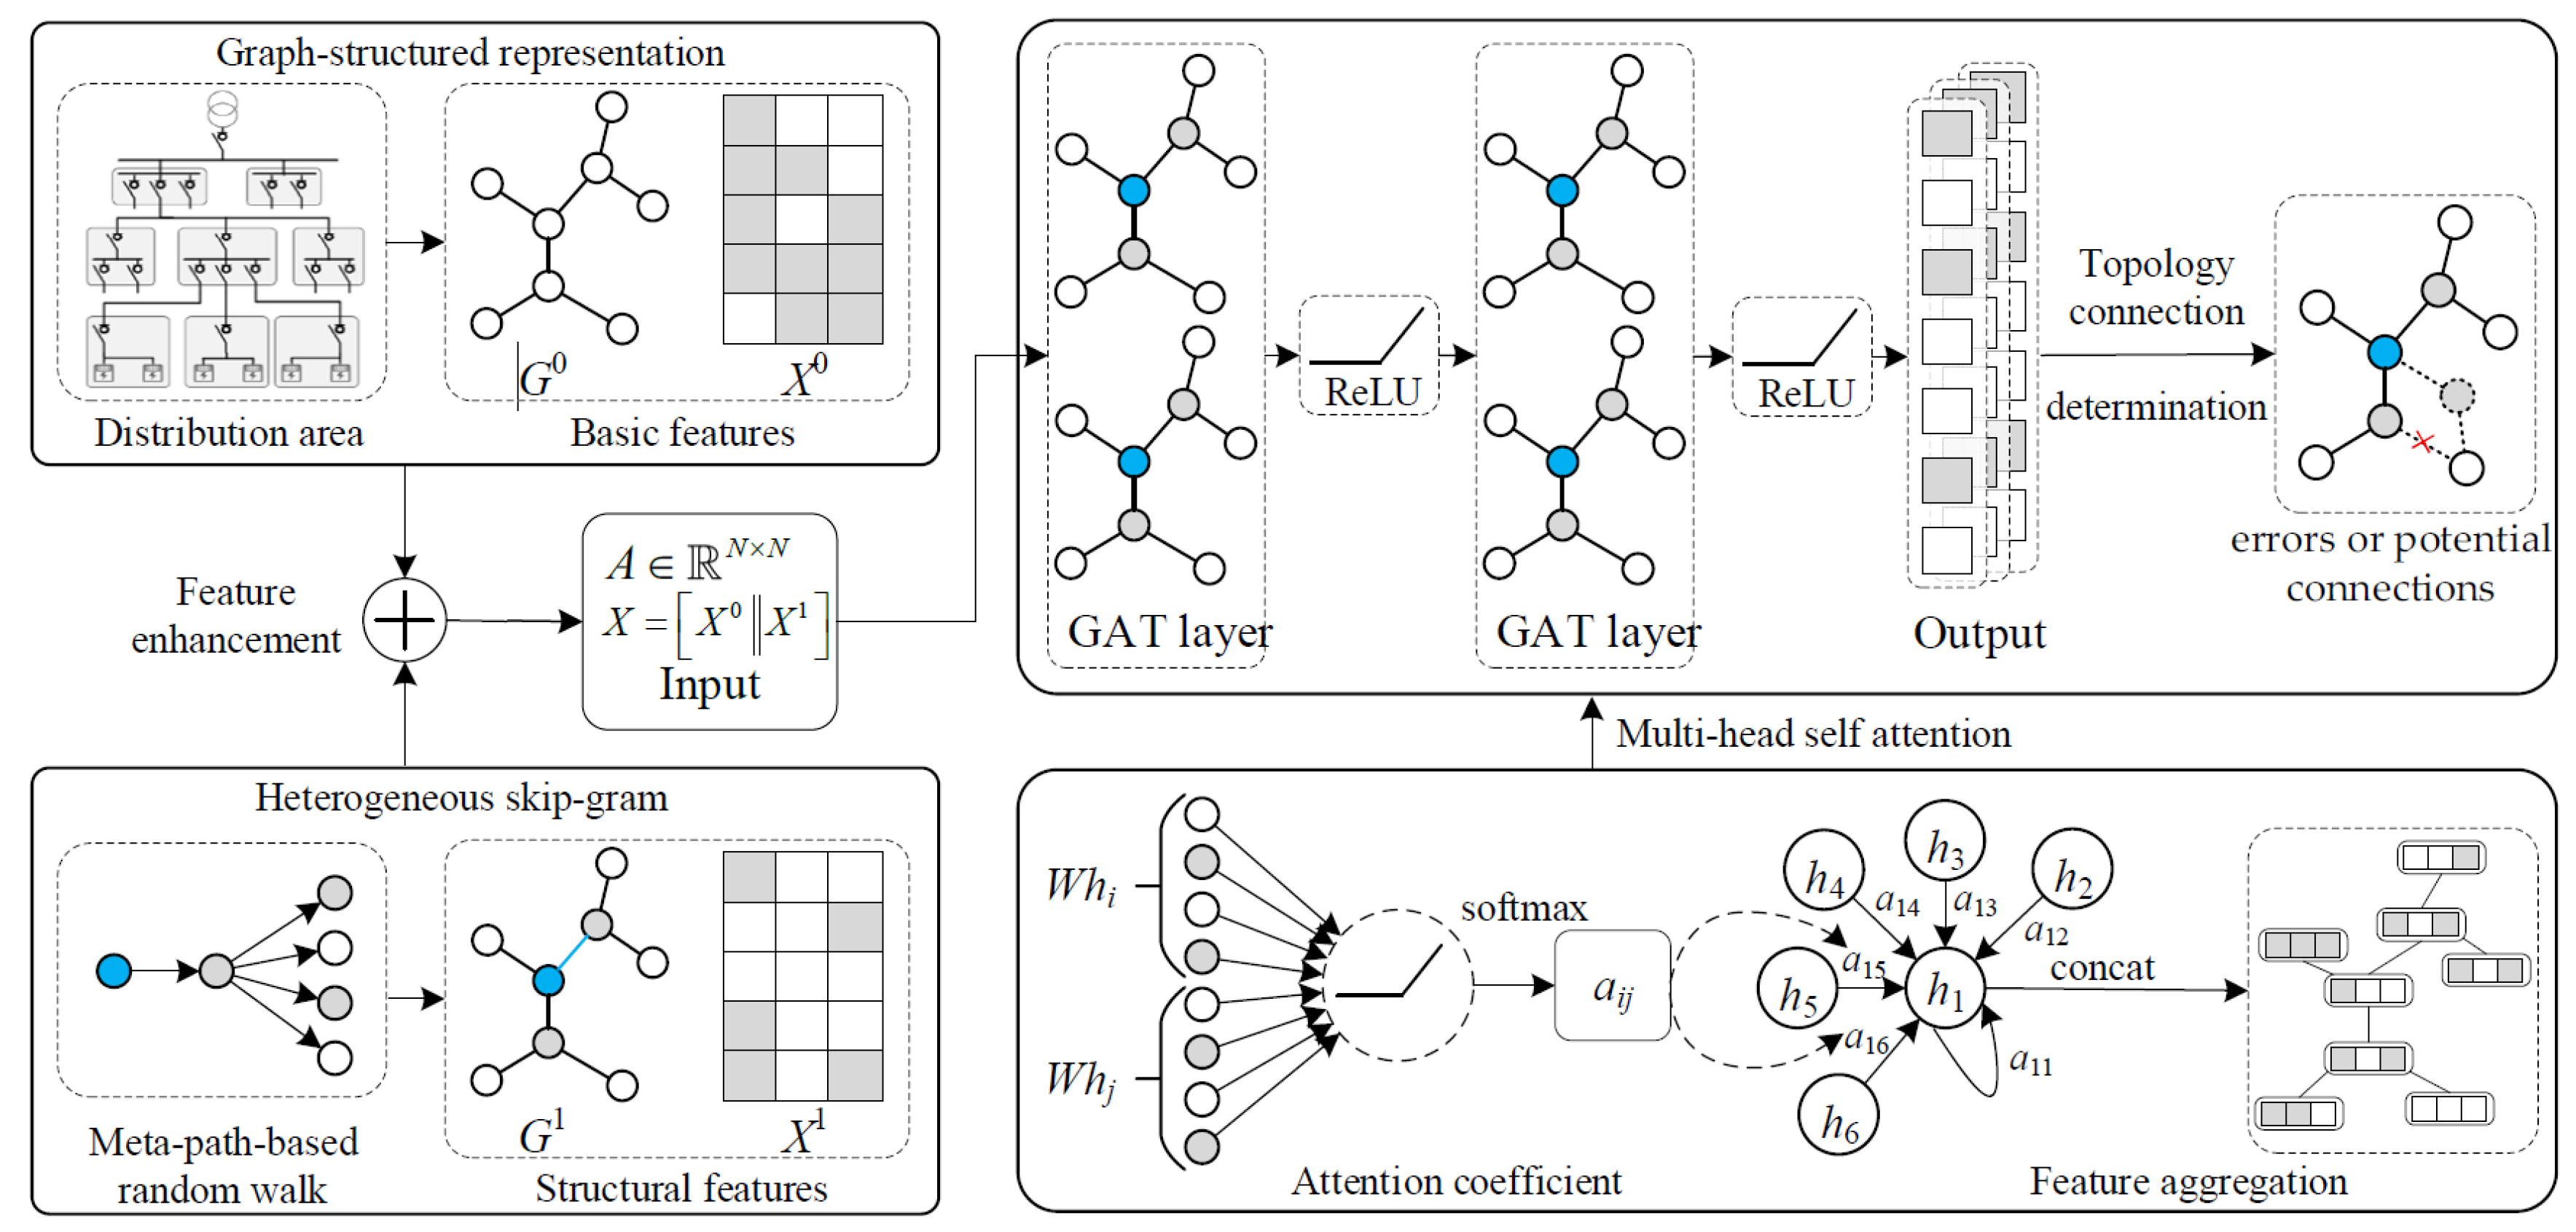
A topology identification architecture based on F-GAT, which integrates basic information and structural characteristics of LVDGs, is proposed to realize topology identification by graph learning to represent the relationship between measurement data and topology connection. The proposed topology recognition strategy achieves topology identification based on existing AMI system data without requiring additional measurement devices, effectively addressing current challenges in low-voltage distribution grids, such as insufficient data collection capabilities and untimely record updates, thereby demonstrating significant engineering practicality.
(2)
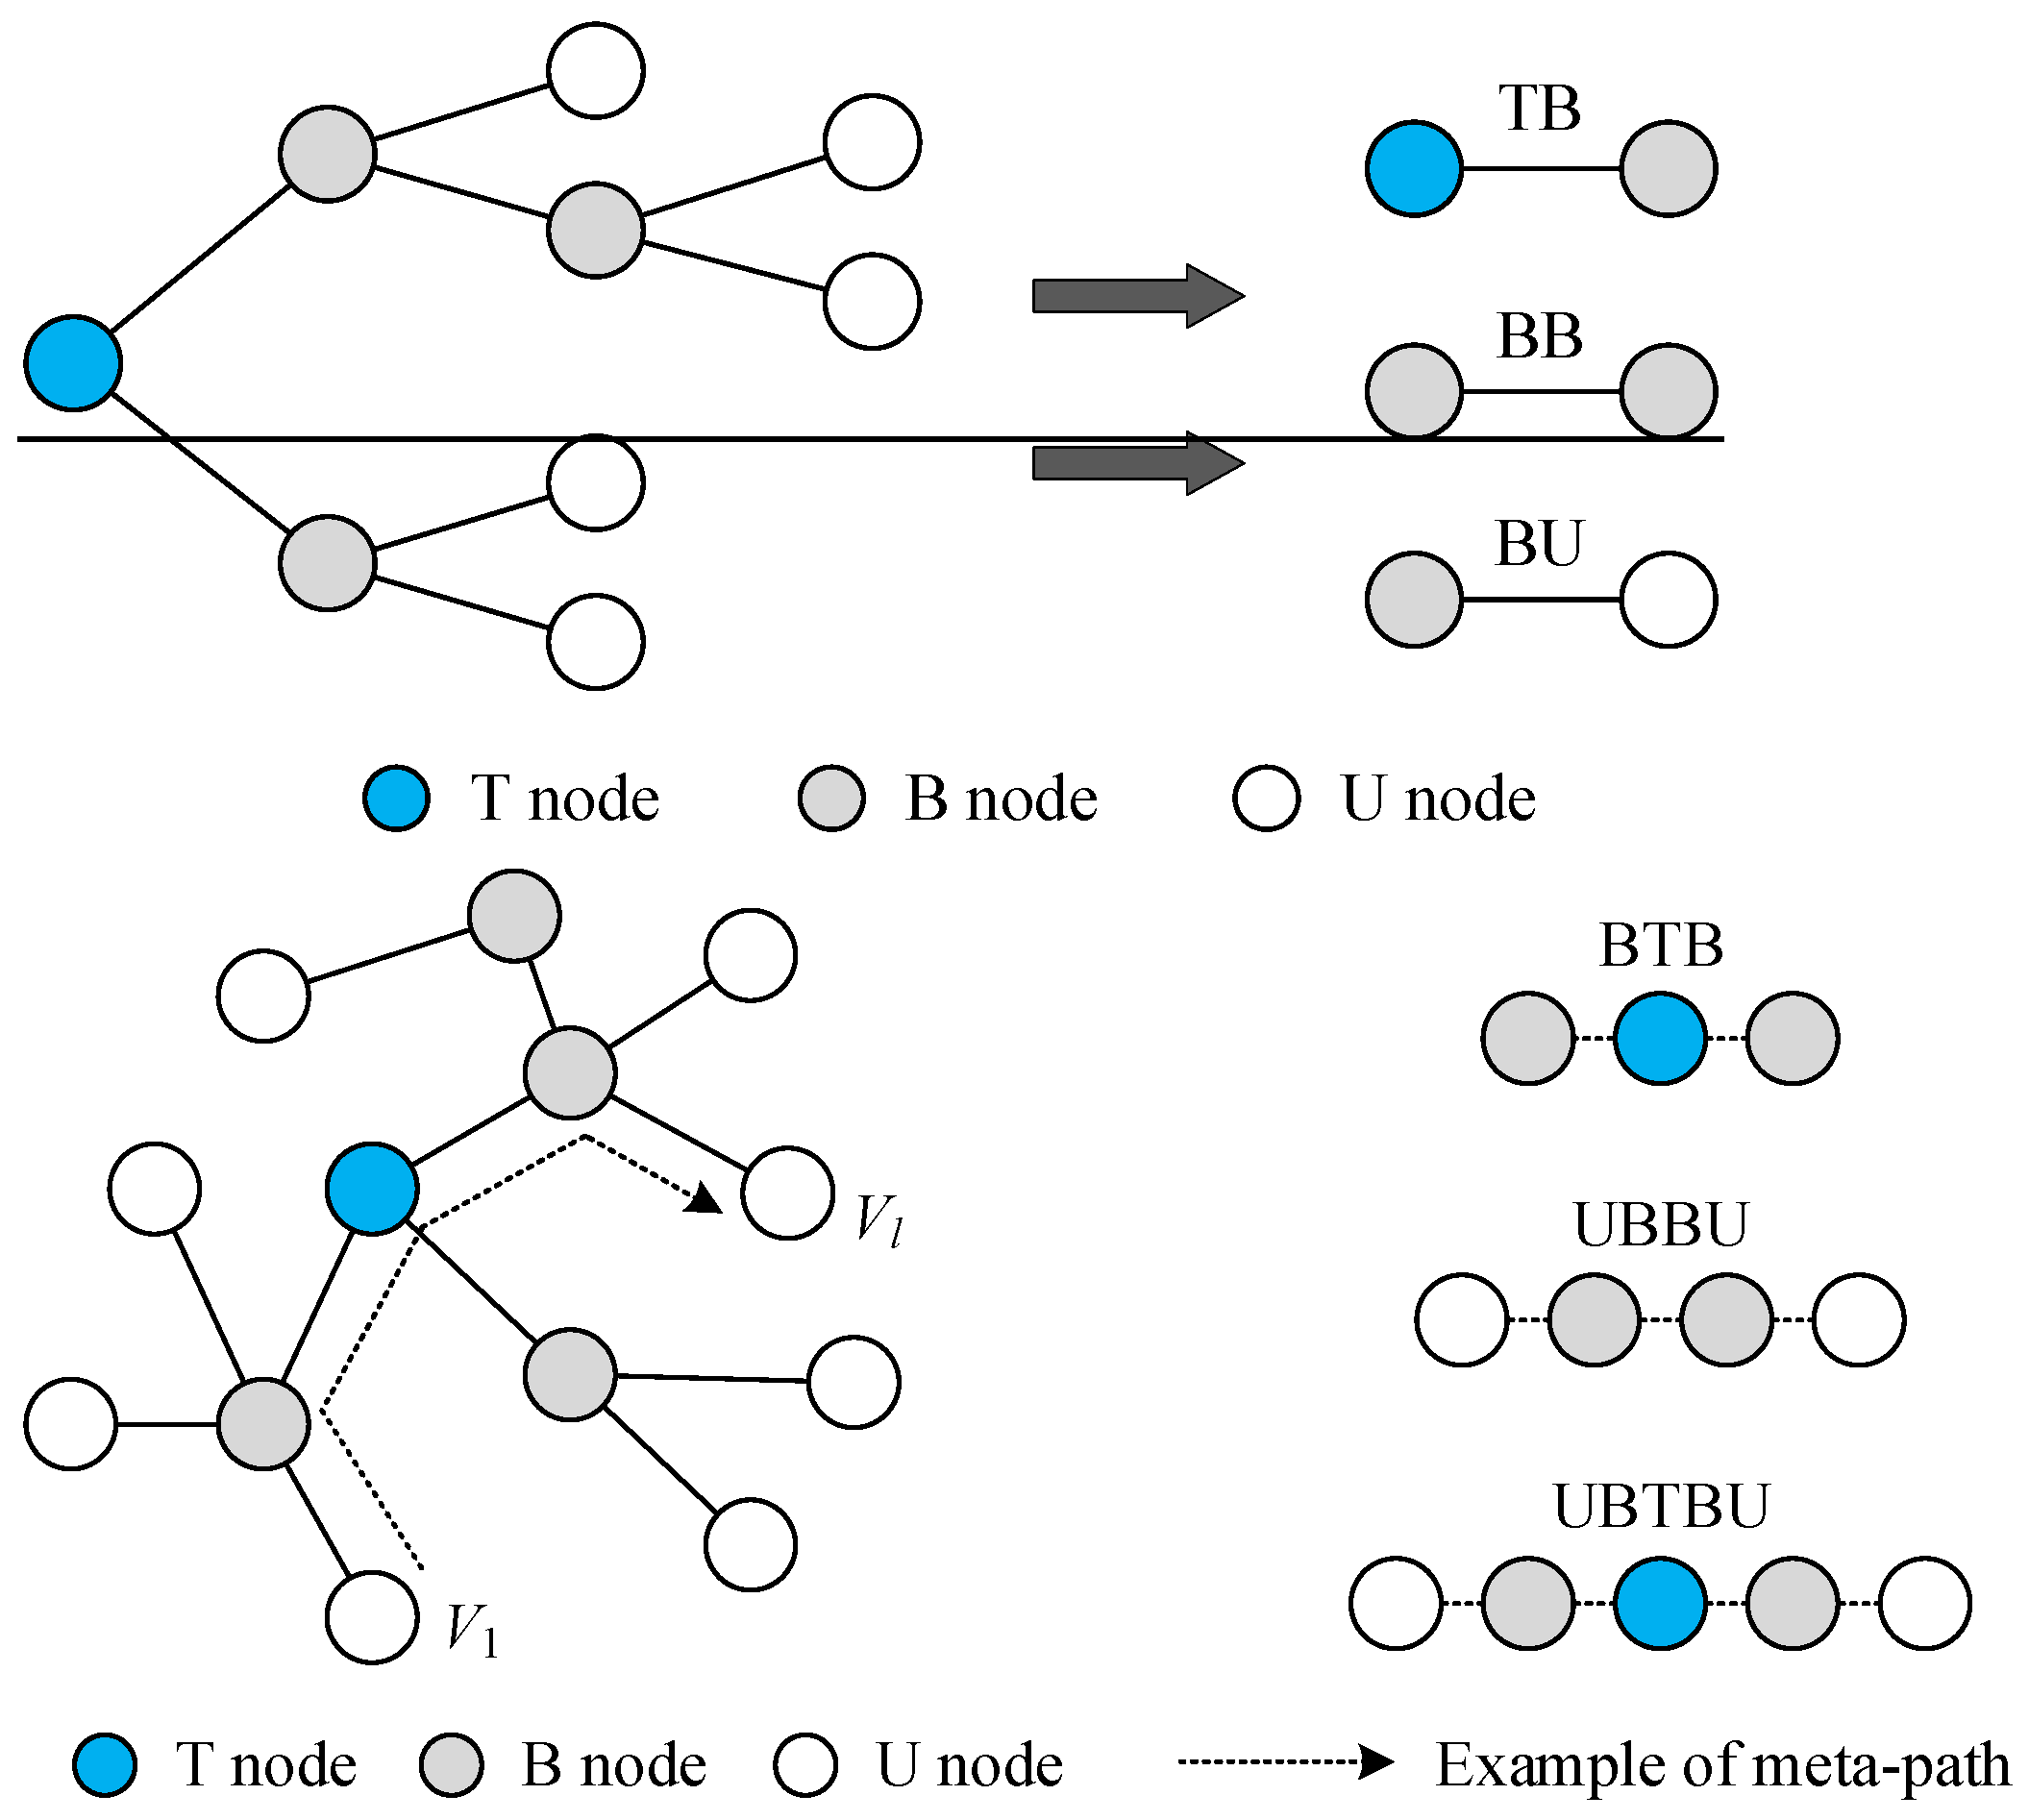
A meta-path random walk node enhancement model for LVDGs is proposed. According to the connection characteristics of LVDGs, the meta-path form is designed, and the node type and connection mode are explicitly distinguished to avoid the information loss caused by the homogenous graph assumption. A heterogeneous skip-gram model was employed to derive embedding representations of node-specific structural characteristics, which significantly enhances the model’s feature extraction and mining capabilities.
(3)
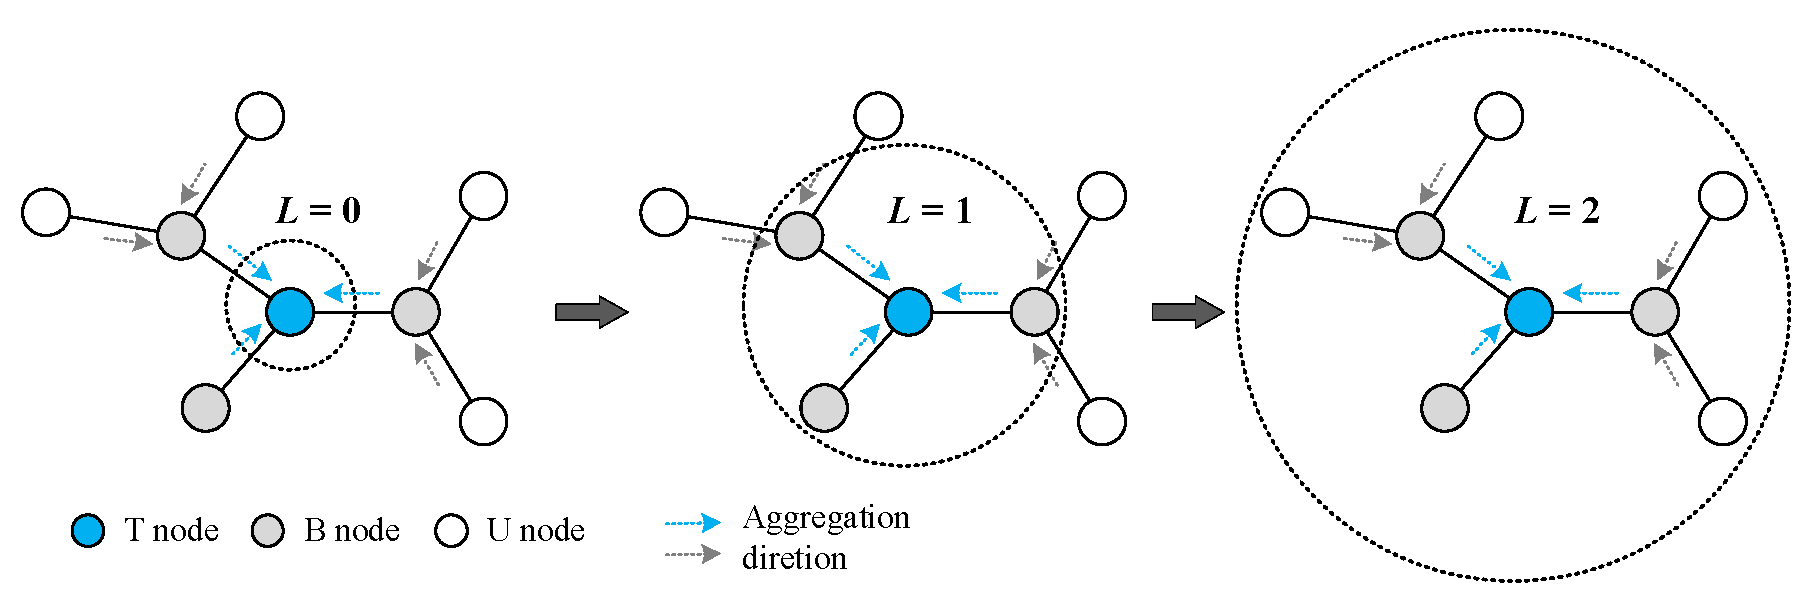
A GAT with an attention mechanism is adopted to learn the low-dimensional representations of topological nodes and to excavate the potential association patterns and structural information in the graph structure topology. The accuracy of topology recognition has been enhanced through joint representation of electrical properties and graph-structural semantics.
The remainder of this paper is organized as follows. Section 2 introduces the topology identification architecture of LVDGs. Section 3 describes the modeling process for the distribution grid topology identification method. Then, our solution is presented in Section 4. Case studies are reported in Section 5 to assess our proposed methodology. Finally, Section 6 summarizes the paper.

2. Topology Identification Architecture of LVDGs Based on F-GAT

Figure 1 illustrates the topology identification model architecture of LVDGs based on F-GAT.
Firstly, as shown in the upper-left section of the figure, the topology of the low-voltage distribution area is structured into a graph representation using existing data collected by smart terminals. The feature matrix X 0 is employed to capture the fundamental attributes of each entity, such as voltage and power.
Secondly, feature enhancement for different node types in the distribution area is achieved through a meta-path random walk, as depicted in the lower-left section of the figure. The meta-path design incorporates the operational characteristics of the low-voltage distribution area, and a heterogeneous skip-gram model is applied to enhance the feature representation of the walk sequences, generating embedded representations of the structural properties X 1 of each node.
Thirdly, the node basic information matrix X 0 is concatenated with the feature-enhanced node embedding matrix X 1 . The proposed F-GAT model is used to learn the low-dimensional representation of topological nodes, and the potential correlation pattern and structural information in the graph structure topology are extracted.
Finally, according to the output of the F-GAT model, the positive and negative judgments of node connection are carried out to realize the topology identification of the low-voltage distribution area of the distribution grid.

3. Problem Modeling

3.1. Graph-Structured Representation of the Distribution Grid Topology

Graph-structured representation aims to transform the entities in distribution grid topology (e.g., transformers, branch boxes, users) and their relationships into graph models. It serves as the foundation for achieving feature perception and mining of the LVDG. The specific mathematical description process is as follows:
The graph model is represented as G 0 = { V , E } , where V = { v 1 , v 1 , , v N } is the node set of the diagram, namely, the distribution grid node. N is the number of nodes. E = { ( v i , v j ) | v i , v j V } is the set of edges of the graph, which is the distribution connection line.
On this basis, the adjacency matrix A N × N is constructed to represent the connection relationship between nodes:
A = 0 1 1 1 0 0 1 0 0
where A i j = 1 indicates that nodes i and j are connected. Otherwise, they are not connected.
Further, the basic information of distribution grid nodes is represented by the feature matrix X 0 N × M , where M is the feature dimension.
X 0 = P 1 , t Q 1 , t V 1 , t I 1 , t P 2 , t Q 2 , t V 1 , t I 1 , t P N , t Q N , t V N , t I 1 , t   ,   t [ 0 , T ]
where T is the duration of the sample sequence. P i , t ,   Q i , t and V i , t are the active power, reactive power and voltage amplitude of node i at time t.

3.2. Feature Enhancement Based on Meta-Path Random Walk

Low-voltage cable branch boxes play a crucial role in the low-voltage distribution areas of the distribution grid. They are mainly used for the branching and transfer of cables, and at the same time ensure the safety and stability of the power supply. However, most branch boxes cannot collect electricity consumption data. To enhance the state perception capability of the distribution area, this paper defines the low-voltage distribution area as a heterogeneous network comprising multiple node and edge types. Additionally, a meta-path random walk is introduced to better capture the intricate structural relationships within the low-voltage distribution area model. Compared to fully random walks, meta-path random walks can more frequently traverse branch box nodes, thereby uncovering the structural characteristics of different node types [24,25].
(1)
Definition of meta-path transition probability
The heterogeneous network is represented by G 1 = { V , E , T } , where V, E and T represent the set of nodes, the set of edges and the type set of nodes and edges, respectively. Further, each node v and edge e in the graph model has a corresponding type mapping function ϕ ( v ) : V T V and ϕ ( e ) : E T E . The two sets of T V and T E satisfy T V + T E > 2 , that is, the sum of the number of types of nodes and edges is greater than 2.
Further, the meta-path scheme is defined through the connection relationship between different types of nodes:
V 1 R 1 V 2 R 2 V t R t V t + 1 R l 1 V l
where V i is the node type, that is, the transformer node, the branch box node and the user meter box node. R i is the connection relationship between the nodes. In the path evolution shown in Equation (3), the transition probability p ( v i + 1 | v t i , P ) at the ith step is expressed as follows:
p ( v i + 1 | v t i , P ) = 1 N t + 1 ( v t i )   ,   ( v i + 1 , v t i ) E , ϕ ( v i + 1 ) = t + 1 0      , ( v i + 1 , v t i ) E , ϕ ( v i + 1 ) t + 1 0      , ( v i + 1 , v t i ) E
where v t i V t , v i + 1 is the node to be selected at the i + 1th step. N t + 1 ( v t i ) is the set of neighborhood nodes belonging to the type V t + 1 of node v t i . ( v i + 1 , v t i ) E indicates that there is an edge between the nodes v i + 1 and v t i . ϕ ( v i + 1 ) = t + 1 is the type of the next node, which is consistent with the scheme definition of a meta-path.
(2)
Meta-path form design
To capture the structural features of different types of nodes, this paper defines three types of nodes in combination with the typical structure of the distribution grid area: the transformer node is of type T, the branch box node is of type B and the user meter box node is of type U. Correspondingly, three basic forms of meta-paths are defined as shown in Figure 2.
In Figure 2, TB denotes the connection relationship between distribution transformers and branch boxes, BB represents interconnections between cable branch boxes and BU specifies the linkage between branch boxes and the power user’s meter box. Through systematic combination and extension of these three connection patterns across various distribution grid configurations, three fundamental meta-paths are designed: BTB, UBBU and UBTBU. Specifically, BTB directs random walks to focus on localized transformer–branch box relationships; UBBU captures daisy-chained path features through serially connected branch boxes; and UBTBU establishes global topological features by connecting users through both branch boxes and transformers.
(3)
Feature enhancement scheme based on heterogeneous skip-gram
After obtaining the node’s walk sequence, a heterogeneous skip-gram model is used to enhance the features, resulting in the embedding representation of each node. The goal of the skip-gram model is to maximize the local structure probability of the network, which is expressed as follows:
arg   max θ v V t T V c t N t ( v ) log p ( c t | v ; θ )
where θ is the model parameter. p ( c t | v ; θ ) is the probability of the existence of context node c t when node v is known in the model. It is usually calculated using the softmax function:
p ( c t | v ; θ ) = e X c t · X v u t t V t e X u t · X v
where X v and X c t represent the feature embedding vectors of node v and context node c t , respectively.
As can be seen from Equation (6), each update of the model requires softmax calculation on all the nodes. To improve the training efficiency of the model, the heterogeneous skip-gram model introduces the negative sampling strategy to calculate the loss function. The optimization objective is represented as follows:
log σ ( X c t · X v ) + m = 1 M E u t m ~ p t ( u t ) [ log σ ( X u t m · X v ) ]
where σ ( ) is the sigmoid function. p t ( u t ) is the probability distribution of the sample in the negative sample.
The node sequence containing topological structure information is obtained based on the meta-path random walk. Then, this sequence is input into the heterogeneous skip-gram model for training and testing. Finally, the node-embedding vector matrix X 1 with enhanced features is obtained.

3.3. Feature Fusion Based on F-GAT

After obtaining the node basic information matrix X 0 and the node-embedding vector matrix X 1 with enhanced features, this study adopted the GAT model [26] to learn the low-dimensional representation of topological nodes. The node feature aggregation process is shown in Figure 3. Based on the multi-head attention mechanism, the importance weights of different neighbor nodes to the current node are evaluated dynamically, and the node neighborhood information is aggregated. This results in a low-dimensional representation that integrates the node’s intrinsic attributes with the structural properties of the graph. This is used to excavate the potential association patterns and structural information in the graph structure topology.
For the adjacency matrix A N × N and the coupled feature matrix X = X 0 X 1 , to ensure that the nodes retain their own features during information aggregation, self-cyclic transformation is introduced to the original adjacency matrix, and symmetric normalization is applied to eliminate the scale deviation of feature vectors caused by the difference of node degrees.
A = A + I
A = D 1 2 A D 1 2
where A is the adjacency matrix after adding self-loops. I is the identity matrix. A represents the normalized adjacency matrix. D is the degree matrix.
After the graph convolution operation is carried out on the normalized adjacency matrix A layer by layer, the output of each convolution layer is obtained as shown in Equation (10).
H i + 1 = σ ( A H i W i )   ,   i = 0 , 1 , , N L
where H i is the output of the ith layer convolution. H 0 = X is the input feature information. H N L = Z is the final output feature matrix. N L is the number of convolution layers in the graph. W i is the weight coefficient of the ith layer graph convolution.
To measure the feature similarity and the strength of topological correlation and to focus on the important structural information in the graph topology, the multi-head attention mechanism is introduced to dynamically adjust the weight coefficient α i j .
α i j = exp LeakyReLU a [ W h i W h j ] k N i exp LeakyReLU a [ W h i W h k ]
where LeakyReLU ( ) is the activation function. W is the weight parameter matrix. a is the learnable attention parameter matrix. || is the concatenation operation.
Further, by splicing the output results of multiple attention heads, a new feature vector h i for each node is obtained:
h i = d = 1 D σ j N i α i j d W d h j
where K is the number of attention heads. Thanks to feature enhancement and multi-head attention mechanisms, the model can learn to automatically reduce the weight of irrelevant neighbors, even when the adjacency matrix contains noise (e.g., misconnecting edges).
Finally, the node connection is determined based on the higher-order feature Z obtained by the F-GAT aggregation operation. For node pairs (i, j), the cosine similarity is calculated based on the higher-order feature output of the model, as shown in Equation (13), and then the cross-entropy loss function is used for training to realize the identification of errors or potential connections in the topology of the low-voltage distribution area.
φ i j = z i z j z i z j
where z i is the higher-order feature vector of node i, that is, the ith row of matrix Z. φ i j represents the cosine similarity of the feature vectors of node pairs (i, j). || || is the module of the vector. L is the loss function. y is the true label value (1 when node i is connected to j; otherwise, 0). y ^ is the predicted connection probability.

4. Proposed Solution Based on F-GAT

The proposed solution based on F-GAT is shown in Algorithm 1.
Algorithm 1: Proposed solution based on F-GAT
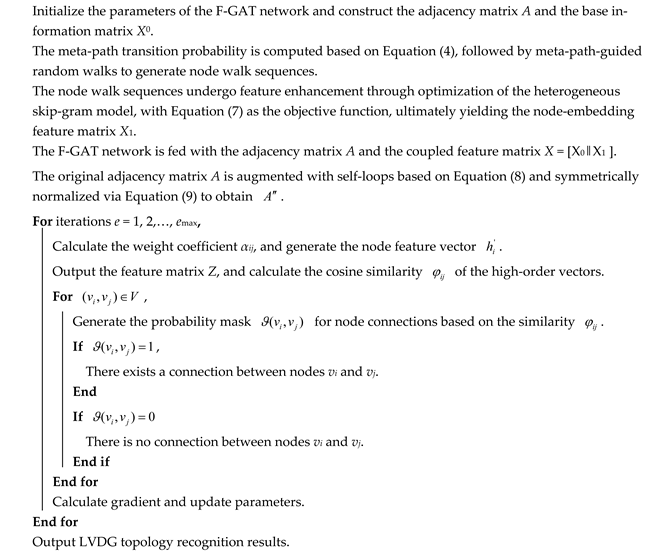
Energies 18 02821 i001
Firstly, the parameters of the F-GAT network are initialized, and the graph structure representation of G0 and basic information matrix X0 of distribution grid topology are constructed.
Secondly, the node sequence is generated based on a meta-path random walk, and the embedded feature matrix X1 is obtained using a heterogeneous skip-gram model.
Then, the F-GAT network is subsequently fed with adjacency matrix A and coupled matrix X = [ X 1 X 2 ] , where the adjacency matrix A undergoes transformation operations as detailed in Step 7 (note potential numbering adjustments post-reindexing). The proposed F-GAT model is then employed for simultaneous node feature aggregation and graph structural learning within low-voltage distribution transformer areas, ultimately yielding the higher-order feature matrix Z.
Finally, node connectivity determination is performed based on the higher-order information output from the F-GAT. A probabilistic mask function ϑ ( v i , v j ) is constructed using node-wise higher-order vector cosine similarity φ i j , which outputs binary classification results regarding nodal connection states. This process iterates through Steps 10–21 until reaching the maximum training epoch emax, ultimately yielding the topological identification results for the low-voltage distribution network.

5. Case Studies

5.1. Case Study Setup

To verify the effectiveness of the proposed LVDG topology identification algorithm based on F-GAT, five urban LVDG areas with different node scales in the Wuhan region of China were selected for case studies. The topological configurations of the low-voltage distribution transformer areas across five cities are detailed in Table 1. The data sampling interval was set to 15 min. The dataset was divided into training, validation and test sets with proportions of 80%, 10% and 10%, respectively. Both positive and negative samples account for 50% of the dataset. The computing environment was configured with CPU i5-14600kF, GPU RTX4070s, RAM 32 GB and simulation platform Matlab 2021b and TensorFlow 2.10.0. In the F-GAT model, the number of hidden layers is 2, the number of hidden layer units is 128, the output feature dimension is 16, the learning rate is 0.001, the optimizer is Adam and the output probability threshold is 0.5. To improve the robustness and generalization ability of the model, Gaussian noise obeying N(0, 0.032) was injected into the original measurement dataset.
Further, to accurately and intuitively evaluate the performance of the proposed model, accuracy (ACC) was selected to evaluate the performance of the topology identification model [27]. Additionally, to comprehensively reflect the performance of the model in reducing false positives and false negatives, the F1 score was introduced as an auxiliary evaluation indicator.
A C C = T P + T N T P + T N + F P + F N
F 1 = 2 × P × R P + R
where TP is the number of actually connected samples predicted as connected samples. TN is the number of actual unconnected samples that are predicted to be unconnected. FP indicates the number of actual unconnected samples that are predicted to be connected. FN is the number of actually connected samples that are predicted to be unconnected. P = TP/(TP + FP), indicating precision. R = TP/(TP + FN), which stands for recall.

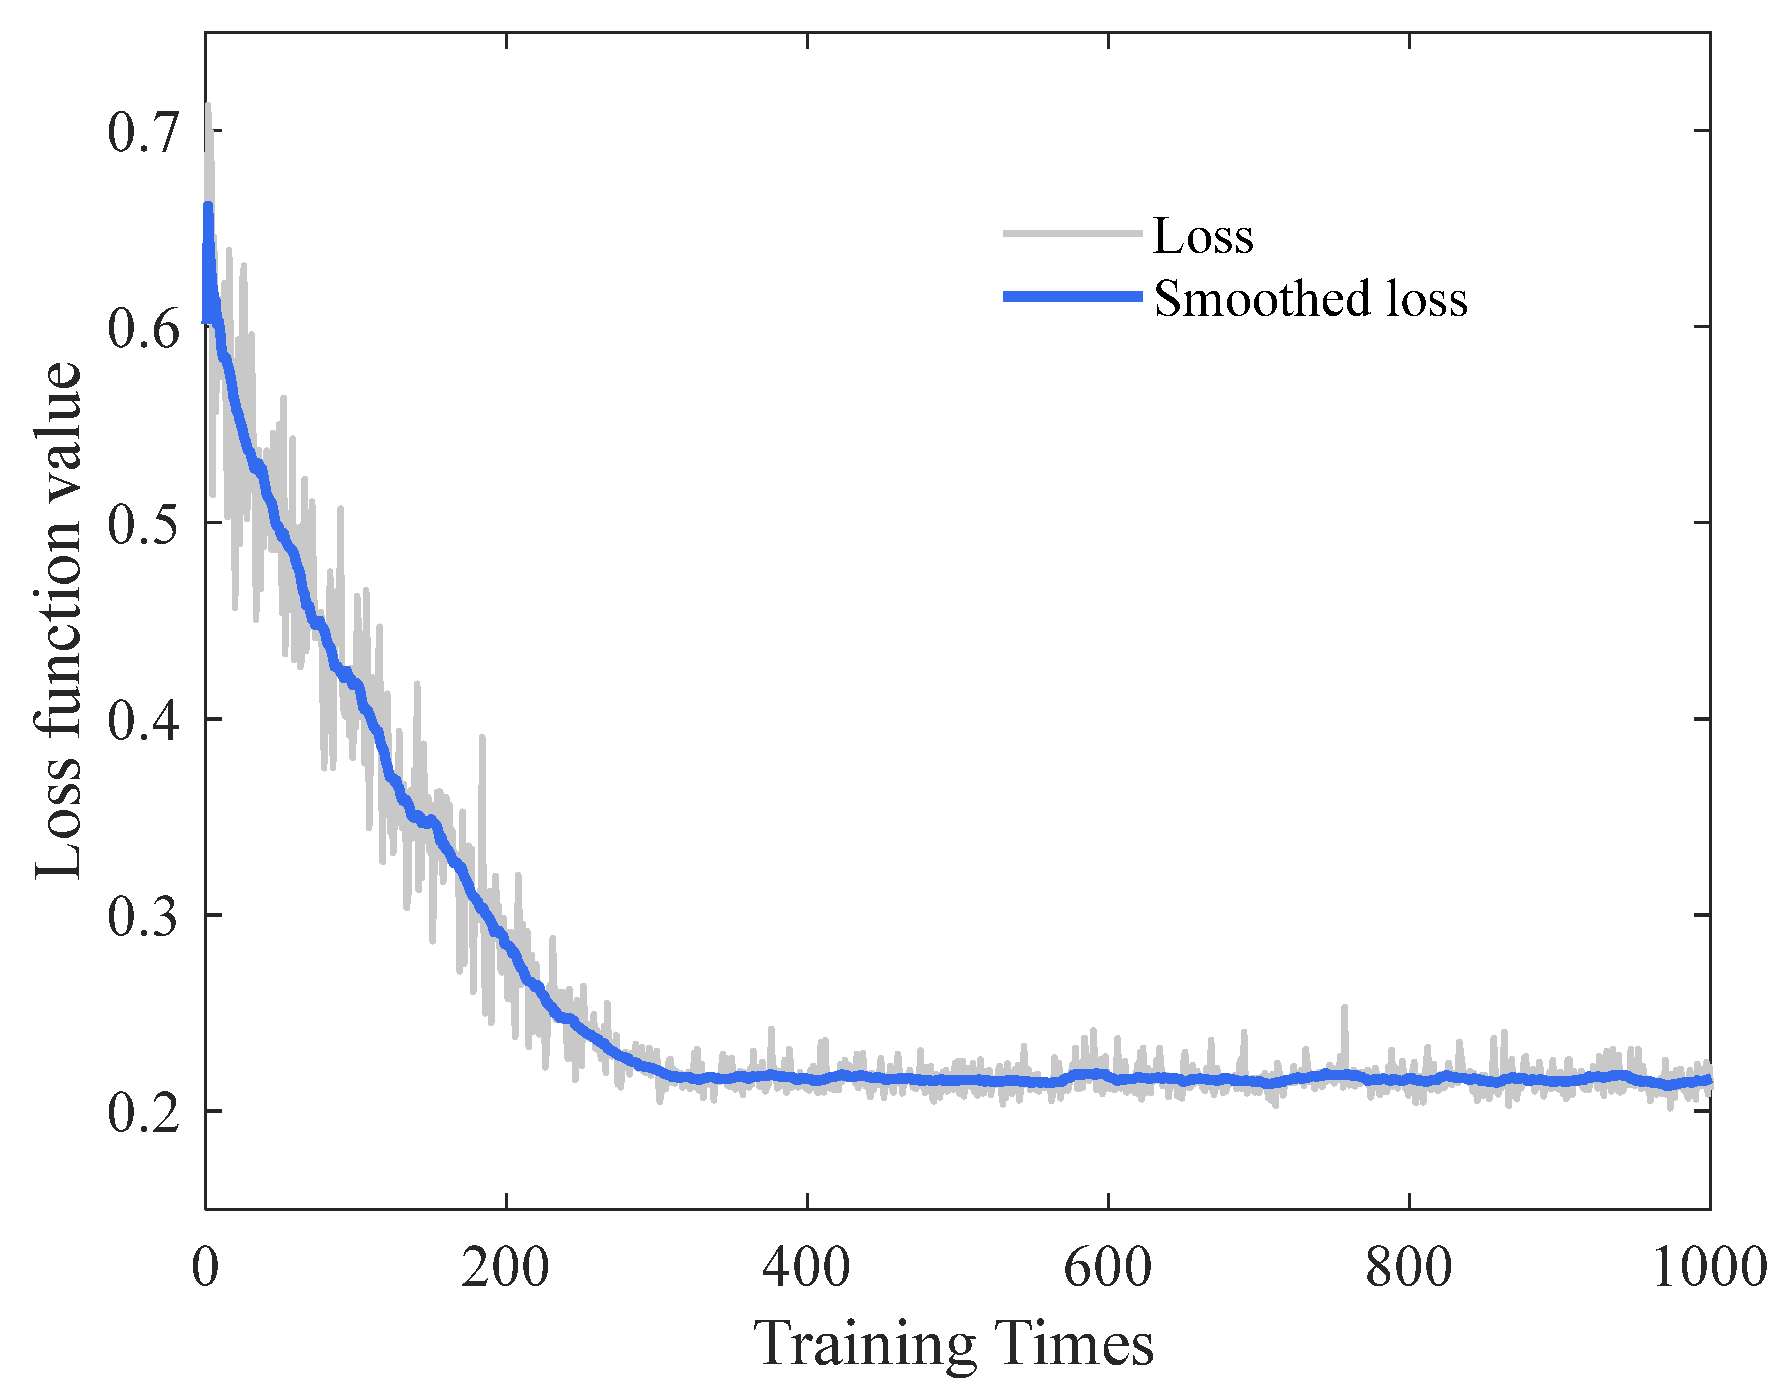
5.2. Analysis of the Model Training Process

With the number of iterations set to 1000, the training loss function curve of the model is illustrated in Figure 4. As observed, the loss function curve decreased rapidly and stabilized after approximately 300 iterations. During the first 300 iterations, due to the uncertainty caused by the random initialization of the model parameters, the loss values exhibited significant fluctuations, indicating that the model was in the exploration phase of learning the topological features of the LVDG.
However, the model loss value gradually decreased in the early stage of training. This is because the meta-path random walk effectively modeled multi-modal relationships, such as electrical connection and load similarity, in the heterogeneous model of the low-voltage distribution area. Moreover, the multi-head attention mechanism dynamically evaluated and adjusted the importance of neighbor nodes.
After approximately 300 iterations, the loss value of the model tended to converge, with an average of about 0.22. This validates the effectiveness of the proposed feature enhancement mechanism, which integrates basic information with node embeddings, and demonstrates the strong feature extraction capability and learning efficiency of the F-GAT model.

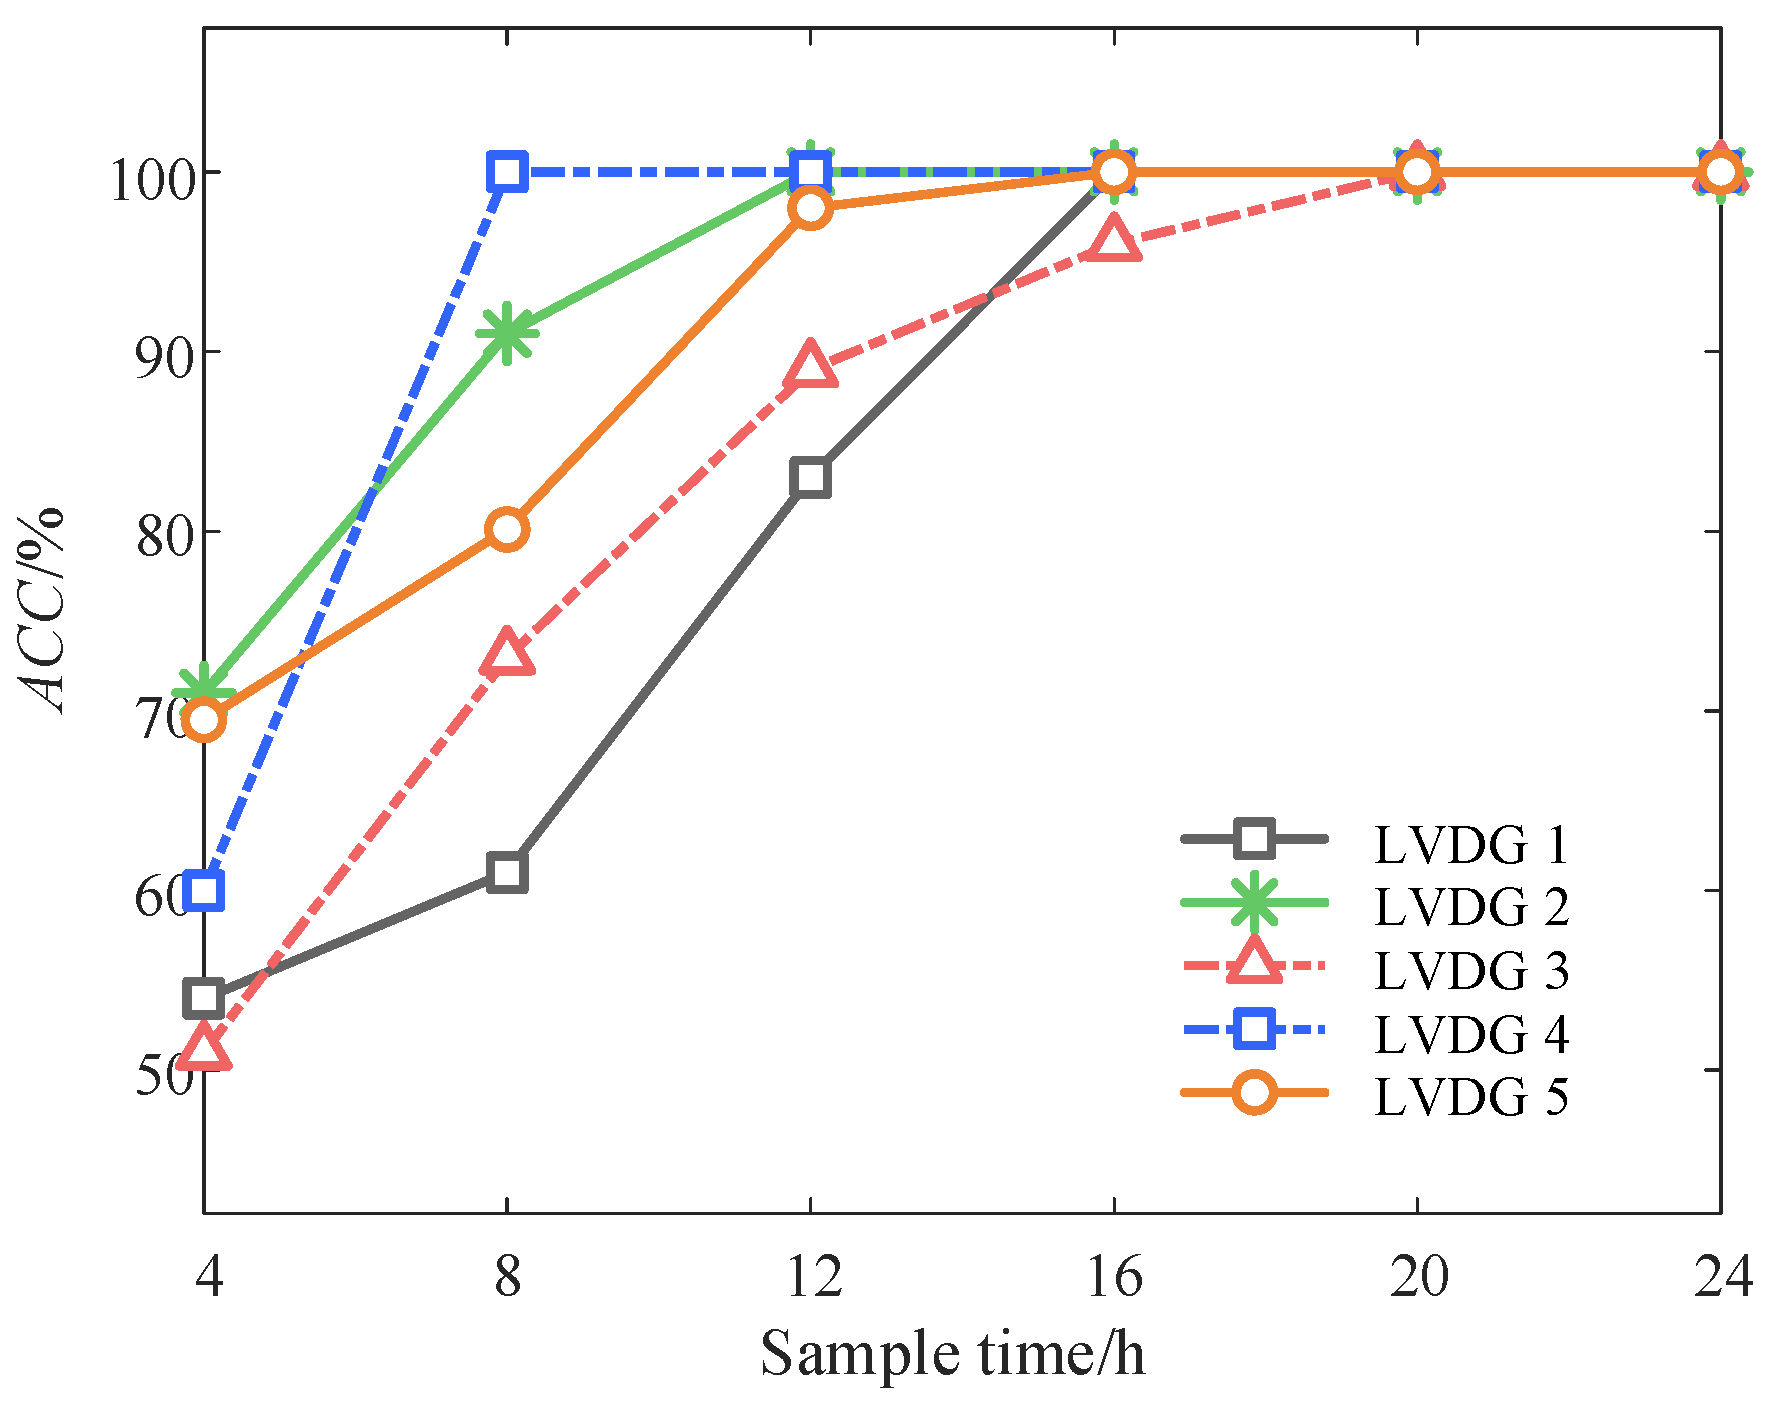
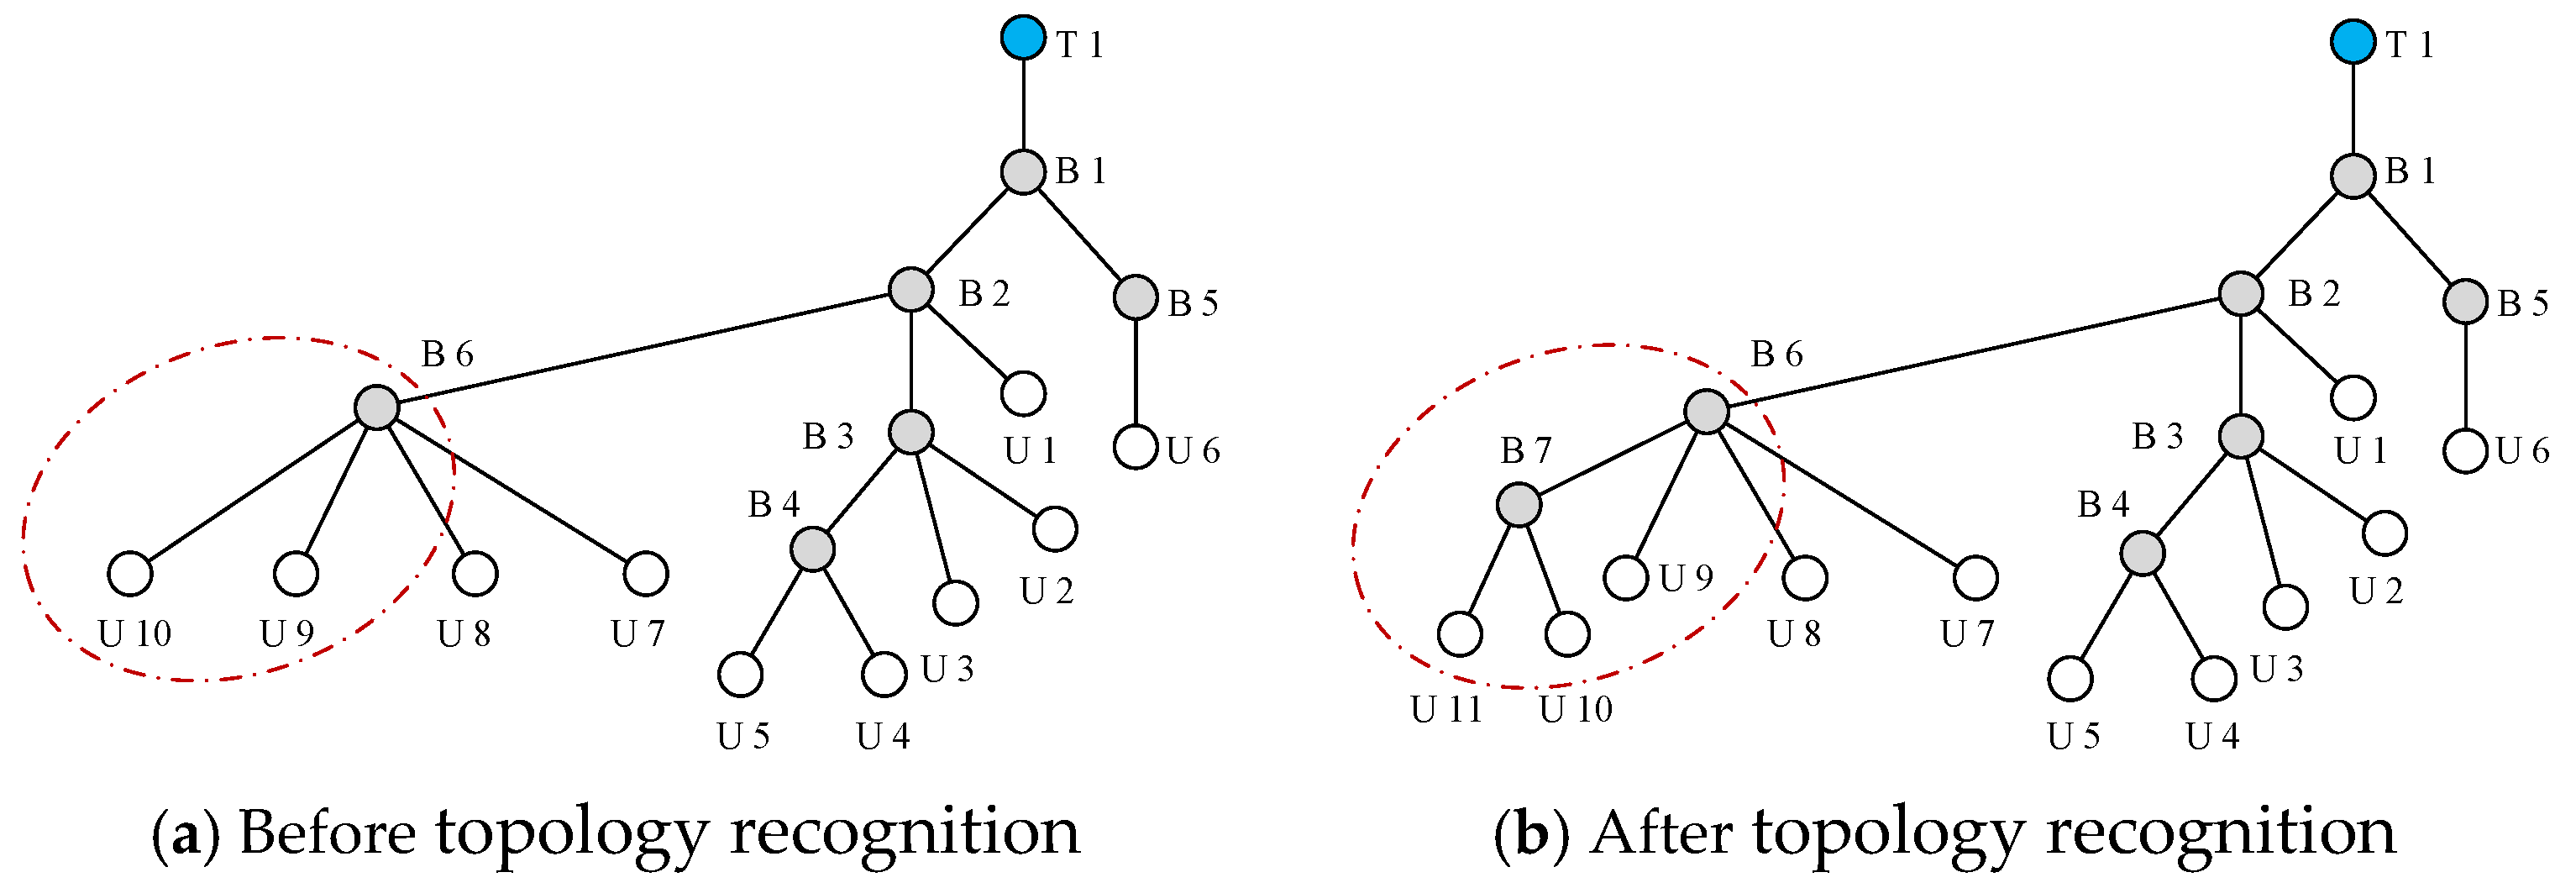
5.3. Analysis of the Topology Identification Result

The accuracy of the distribution area topology identification under different sampling durations is shown in Figure 5. As can be seen from the figure, the topology identification accuracy of the five distribution areas all reached 100% when the sample duration was 20 h (80 data points), indicating that the proposed strategy does not have strict requirements for the sampling duration. Among them, the topological structure and user load pattern of Distribution Area 4 were relatively simple. The topological identification ACC reached 100% when the sample duration was 8 h. The required sample segment duration for Distribution Area 3 was the longest, which was 20 h. The identification results prove the effectiveness of the proposed F-GAT-based distribution area topology identification algorithm.
Figure 6 presents a comparison of the topological structures in Distribution Transformer Area 2 before and after topology recognition. In the diagram, the blue nodes represent transformer nodes, gray nodes indicate branch box nodes and white nodes denote user nodes. As shown in Figure 6a, the original topology records indicate that Branch Node B6 was connected to four user load nodes downstream. However, a post-identification analysis revealed that due to engineering modifications, including newly installed user meters and low-voltage cable reconfigurations, the area’s archival information was not updated promptly. The recognized topology demonstrates that the load quantity at Branch Node 6 has been reduced to three, with partial user loads being transferred to the newly added Branch Node 7. This demonstrates that the proposed F-GAT model can establish dynamic topological mapping relationships for LVDGs, overcoming the time delay limitations of traditional manual inspections and achieving precise correction of archival errors.
To further evaluate the robustness and reliability of the proposed model under data anomaly scenarios, a complex testing environment was intentionally designed using 100 sample datasets from Distribution Area 1. Specifically, for the model’s input adjacency matrix A, each sample dataset underwent simulation of low-voltage topology errors by randomly disconnecting two lines in the topology, emulating scenarios including consumer account termination and archival information discrepancies in the distribution areas. Concurrently, for the input feature matrix X0, erroneous data were injected into six randomly selected lines, intentionally conflicting with the actual line states, to simulate feature data anomalies arising from measurement device failures, communication delays or manual entry errors. Figure 7 presents the robustness test results for Distribution Area 1, where the red markers indicate disconnected lines, and blue markers denote lines with conflicting information. The results demonstrate that the proposed F-GAT strategy accurately identified all six anomalous lines and two disconnected lines across all 100 test samples, highlighting its exceptional topology identification capability under data anomaly conditions.

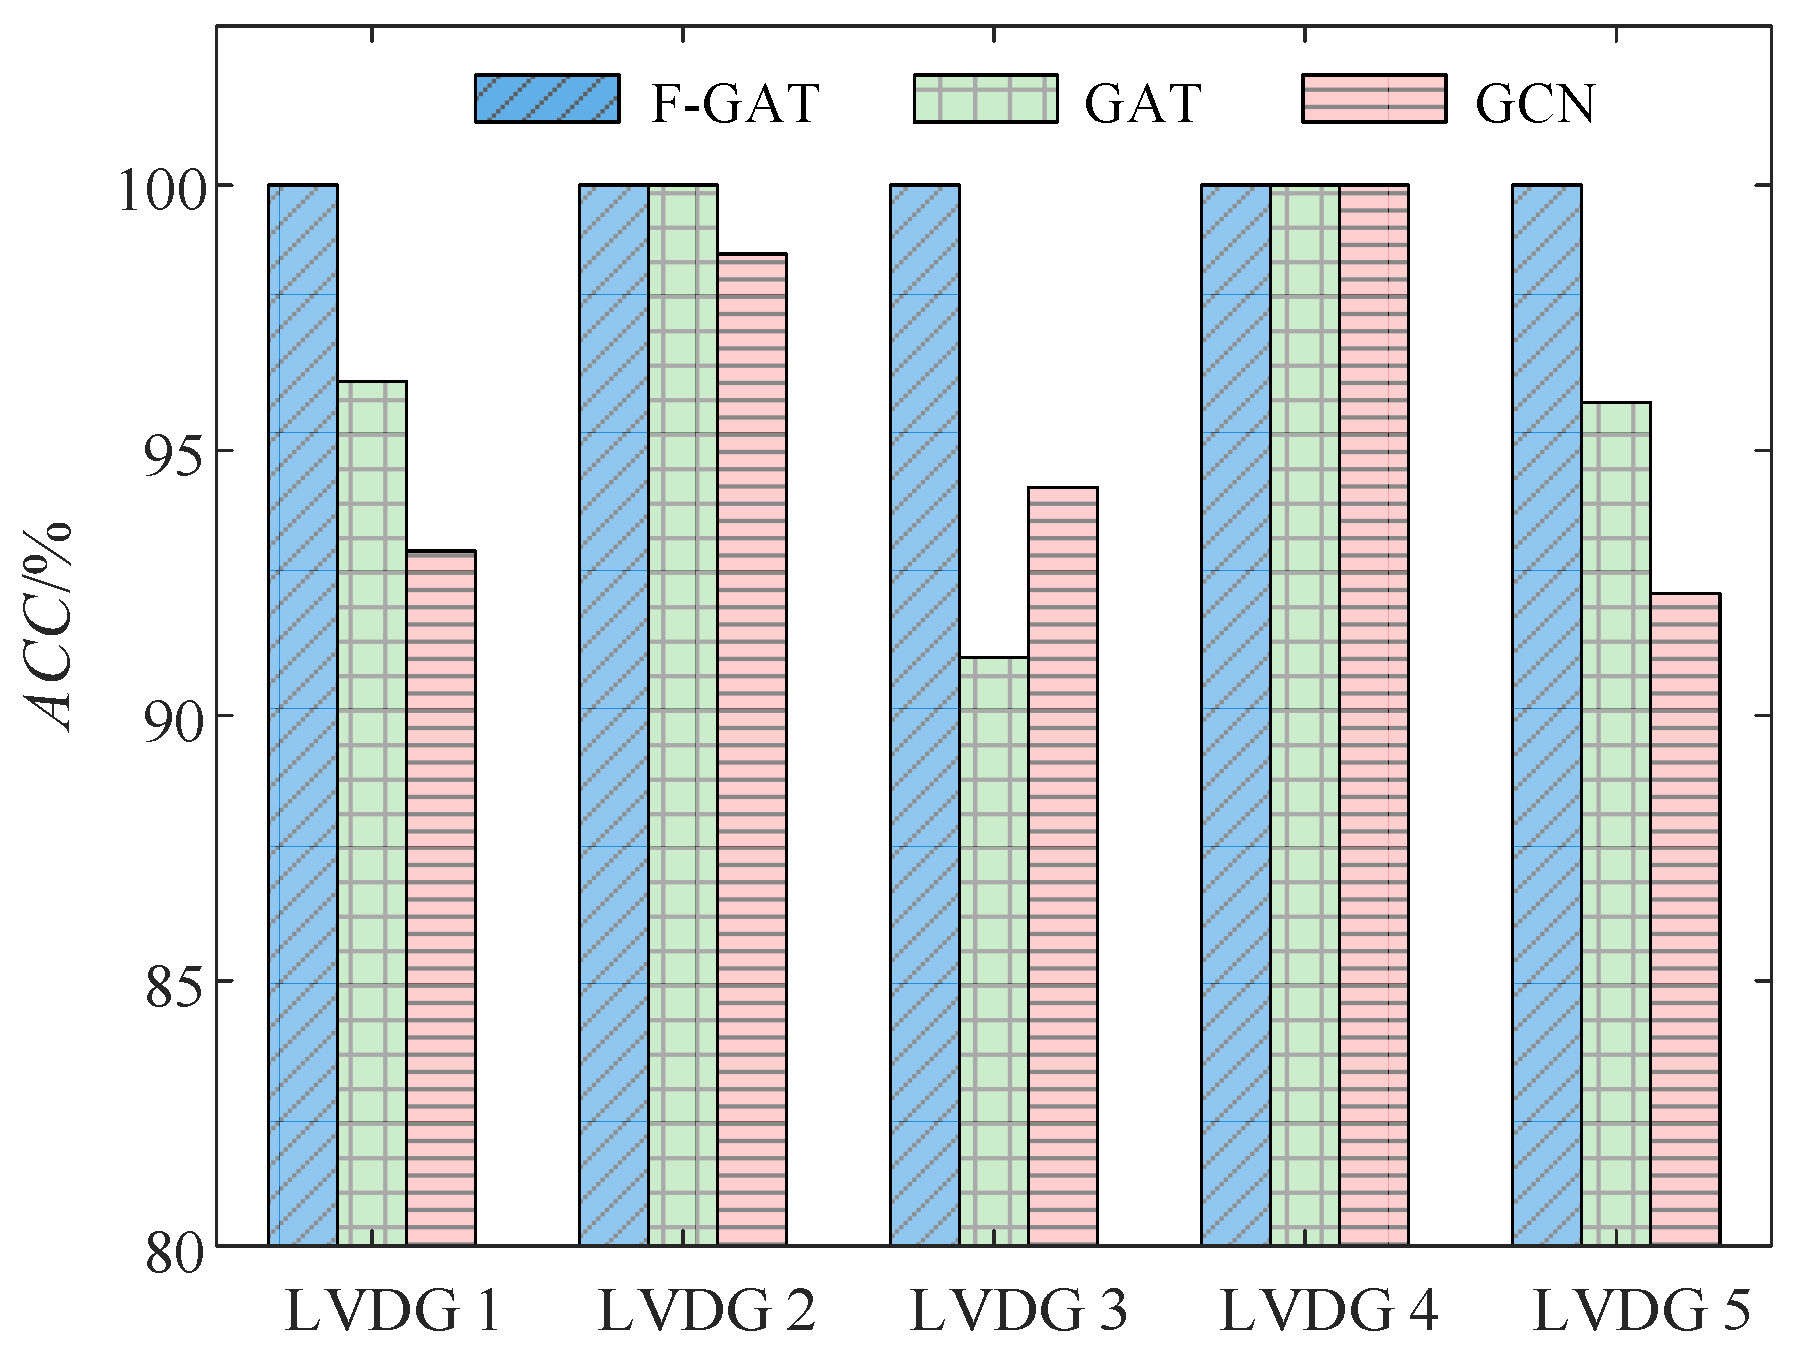
5.4. Comparison of Different Algorithms

To verify the superiority of the improved mechanism of the proposed F-GAT algorithm, the ACC results of the three algorithms, GCN, GAT and F-GAT, for different distribution areas are compared in Figure 8. The detailed hyperparameters of the GCN and GAT models are summarized in Table A1 and Table A2 of Appendix A. The average experimental results and computational complexity of the three algorithms in the five distribution areas are listed in Table 2.
The GCN model is limited by the fixed neighborhood aggregation mode, and its performance was poor in the distribution area with complex structures. The average ACC of the test results in the five distribution areas is only 95.68%, there are many missed reports and the recall rate is only 97.14%. Despite this, GCN still shows its effectiveness and potential in dealing with the problem of distribution area identification. By introducing the attention mechanism, GAT realizes the dynamic evaluation of the importance of neighbor nodes. The topology recognition performance of most distribution areas is better than that of GCN, and the average ACC of the test results is 96.66%.
However, the performance of Distribution Area 3 was poor, which shows that there are some shortcomings in its stability. The proposed F-GAT model obtained the embedded representation of node structural features based on the meta-path random walk, which enhanced the model’s feature perception and mining ability in the low-voltage distribution area. ACC reaches 100% in the test of the five distribution areas, which is 4.32% and 3.34% higher than the GCN and GAT algorithms, respectively. The superiority of the improved mechanism of the F-GAT algorithm is verified.

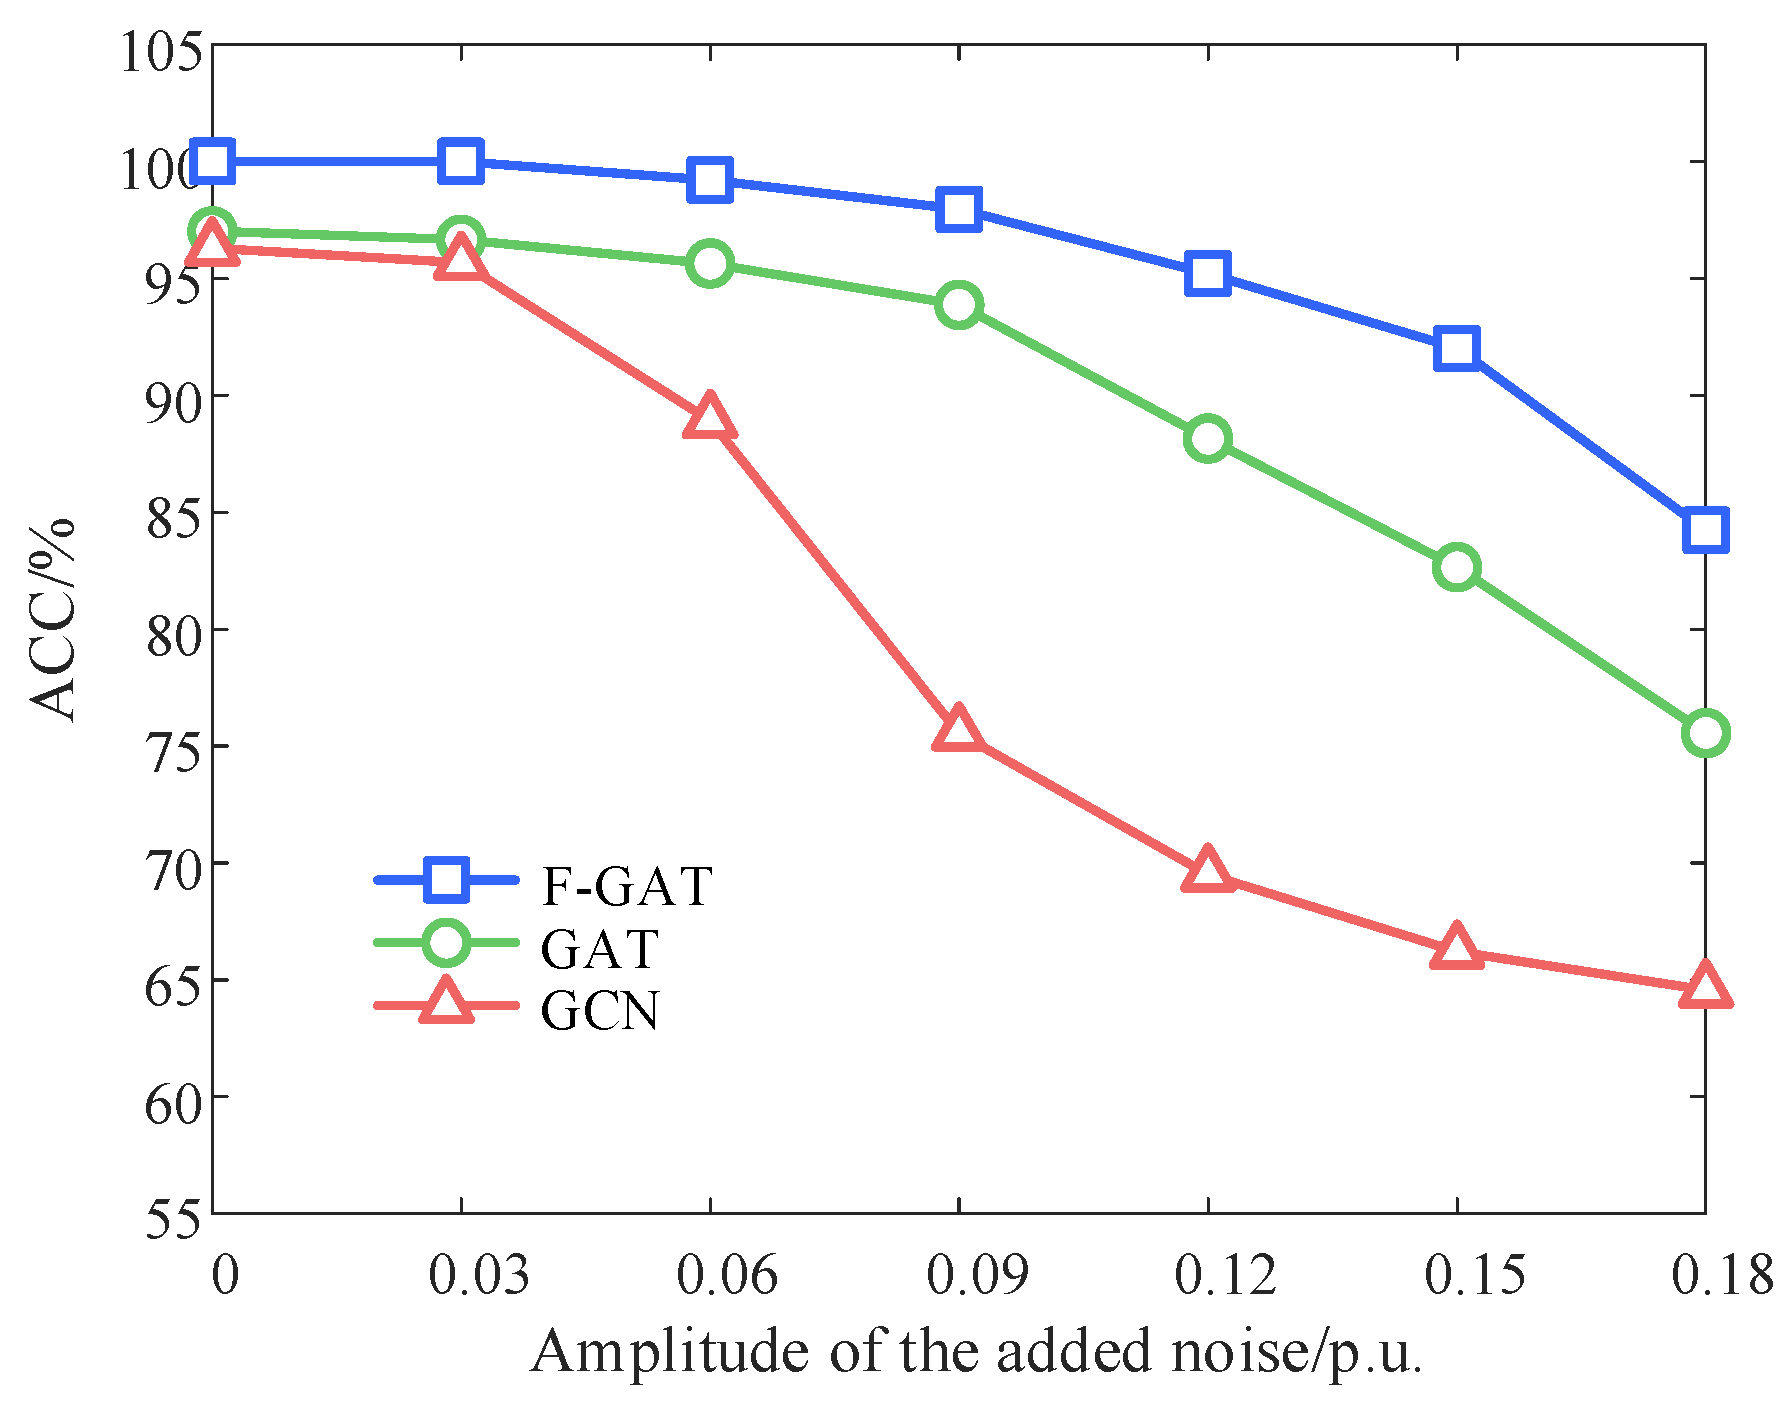
5.5. Analysis of the Model Anti-Noise Performance

Finally, to explore the anti-noise performance of the model under different noise amplitudes, Figure 9 shows the ACC of the GCN, GAT and F-GAT algorithms under different noise amplitudes. As can be seen from the figure, the ACC of the three algorithms decreased with the increase in noise amplitude.
Specifically, the performance of the GCN model was significantly limited when the noise amplitude was greater than 0.03 p.u. This is mainly due to its fixed neighborhood aggregation mechanism, which makes it difficult to effectively distinguish the noise features from the real topological features. Thanks to the dynamic weighting ability of the attention mechanism to key features, the GAT model performed better than GCN at different amplitudes. When the noise amplitude increased by 0.03 p.u., the topology identification result in ACC decreased by 3.58%.
The proposed F-GAT model reduces the cumulative effect of noise during propagation by guiding the feature aggregation process. Even in a high-noise scenario with a noise amplitude of 0.18 p.u., it can still maintain a high feature expression ability, and the ACC of the topology identification result is 84.24%. This provides a strong guarantee for its engineering application in the actual distribution grid. It can effectively deal with the noise interference in the measurement data and improve the accuracy and reliability of topology identification.

6. Conclusions

This paper proposes an LVDG topology identification model based on F-GAT. It enhances the node features by using meta-path random walks, combines the embedding of structural characteristics with basic information, learns low-dimensional representations through a GAT and excavates the topological correlation information. Through case studies based on sample datasets from five distinct distribution areas, the following conclusions are obtained:
(1)
The topology identification model of LVDGs based on F-GAT is used to obtain the embedded representation of node structure characteristics by means of a meta-path random walk and to judge node connections by means of GAT. Case studies across five distribution transformer areas of varying scales demonstrate that the proposed F-GAT model establishes dynamic topological mapping relationships for LVDGs, overcomes the time latency inherent in conventional manual inspections and achieves precision correction of archival errors.
(2)
The GAT with multi-head attention automatically adjusts neighboring node weights, accurately identifying six abnormal and two disconnected lines in 100 test samples, enhancing robustness in abnormal scenarios.
(3)
Compared with graph structure learning algorithms, such as GCN and GAT, the proposed F-GAT model utilizes meta-path random walks to generate embedded representations of node structural features, which are then fused with basic node information for enhanced feature perception and mining capabilities. The F-GAT algorithm achieves 4.32% and 3.34% improvements in the ACC index compared to GCN and GAT, respectively.
Nonetheless, due to limited space, this paper only verifies the performance of the LVDG topology identification strategy based on F-GAT in the relatively complete data environment. In the practical project, there are problems such as missing or sparse data. In future work, we will further explore how to improve the identification ability of the model through transfer learning, data enhancement and other technologies under the environment of low data volume. Further scalability testing of the model will be conducted in large-scale or high-density power grids to enhance its engineering applicability.

Author Contributions

Conceptualization, Validation, Y.L.; Methodology, Investigation, F.Y.; Resources, Supervision, Software, Formal analysis, Y.F.; Data curation, Writing—original draft, W.H.; Writing—review \& editing, Visualization, Y.C. All authors have read and agreed to the published version of the manuscript.

Funding

This work was supported by Technology Project of State Grid Corporation (5400-202322566A-3-2-ZN).

Data Availability Statement

The original contributions presented in the study are included in the article, further inquiries can be directed to the corresponding author.

Conflicts of Interest

Authors Yang Lei, Fan Yang and Wei Hu were employed by the company Power Science Research Institute of State Grid Hubei Electric Power Co. Author Yinzhang Cheng was employed by the company Power Science Research Institute of State Grid Shanxi Electric Power Co. The remaining authors declare that the research was conducted in the absence of any commercial or financial relationships that could be construed as a potential conflict of interest.

Appendix A

Table A1. Parameter settings of the GAT algorithm.
ParametersValue
Number of hidden units (evaluation network){128, 128}
Output feature dimension16
Number of attention heads4
Learning rate0.001
Dropout rate0.4
OptimizerAdam
Table A2. Parameter settings of the GCN algorithm.
ParametersValue
Number of hidden units (evaluation network){128, 128}
Output feature dimension64
Number of attention heads/
Learning rate0.001
Dropout rate0.4
OptimizerAdam

References

  1. García, S.; Mora-Merchán, J.M.; Larios, D.F.; Personal, E.; Parejo, A.; León, C. Phase topology identification in low-voltage distribution networks: A Bayesian approach. Int. J. Electr. Power Energy Syst. 2023, 144, 108525. [Google Scholar] [CrossRef]
  2. Wang, L.; Chiang, H.D. Group-based line switching for enhancing contingency-constrained static voltage stability. IEEE Trans. Power Syst. 2019, 35, 1489–1498. [Google Scholar] [CrossRef]
  3. Zhang, J.; Wang, Y.; Weng, Y.; Zhang, N. Topology identification and line parameter estimation for non-PMU distribution network: A numerical method. IEEE Trans. Smart Grid 2020, 11, 4440–4453. [Google Scholar] [CrossRef]
  4. Athanasiadis, C.L.; Papadopoulos, T.A.; Kryonidis, G.C.; Doukas, D.I. A review of distribution network applications based on smart meter data analytics. Renew. Sustain. Energy Rev. 2024, 191, 114151. [Google Scholar] [CrossRef]
  5. Ge, H.; Xu, B.; Zhang, X.; Bi, Y. Low-voltage overhead lines topology identification method based on high-frequency signal injection. Arch. Electr. Eng. 2021, 70, 791–800. [Google Scholar]
  6. Byun, H.J.; Zheng, Y.P.; Choi, S.J.; Shon, S.G. New identification method for power transformer and phase in distribution systems. Appl. Mech. Mater. 2018, 878, 291–295. [Google Scholar] [CrossRef]
  7. Byun, H.J.; Shon, S. Phase shift analysis and phase identification for distribution system with 3-phase unbalanced constant current loads. J. Electr. Eng. Technol. 2013, 8, 729–736. [Google Scholar] [CrossRef]
  8. Wang, J.; Ji, X.; Li, K.; Sun, Q. Topology verification of low voltage distribution network based on k-means clustering algorithm. IOP Conf. Ser. Mater. Sci. Eng. 2019, 569, 052096. [Google Scholar] [CrossRef]
  9. Al Khafaf, N.; Song, H.; McGrath, B.; Jalili, M. Identification of low voltage distribution transformer–customer connectivity based on unsupervised learning. Energy Rep. 2023, 9, 72–79. [Google Scholar] [CrossRef]
  10. Lian, Z.; Yao, L.; Liu, S.; Yu, Y.; Tang, X. Phase and meter box identification for single-phase users based on t-SNE dimension reduction and BIRCH clustering. Autom. Electr. Power Syst. 2020, 44, 176–184. [Google Scholar]
  11. Jiao, F.; Li, Z.; Ai, J.; Yang, H.; Deng, Y.; Li, D.; Gao, W.; Lai, Z.; Fu, X. Topology Identification Method for Low-Voltage Distribution Node Networks Based on Density Clustering Using Smart Meter Real-time Measurement Data. IEEE Access 2024, 12, 83600–83610. [Google Scholar] [CrossRef]
  12. Tian, Z.; Wu, W.; Zhang, B. A mixed integer quadratic programming model for topology identification in distribution network. IEEE Trans. Power Syst. 2015, 31, 823–824. [Google Scholar] [CrossRef]
  13. Liu, B.; Chen, J.; Li, J. Distribution network topology identification method based on state estimation with mixed integer programming and structural equation model. Int. J. Electr. Power Energy Syst. 2024, 162, 110251. [Google Scholar] [CrossRef]
  14. Farajollahi, M.; Shahsavari, A.; Mohsenian-Rad, H. Topology identification in distribution systems using line current sensors: An MILP approach. IEEE Trans. Smart Grid 2019, 11, 1159–1170. [Google Scholar] [CrossRef]
  15. Karimi, H.S.; Natarajan, B. Joint topology identification and state estimation in unobservable distribution grids. IEEE Trans. Smart Grid 2021, 12, 5299–5309. [Google Scholar] [CrossRef]
  16. Ma, L.; Wang, L.; Liu, Z. Topology identification of distribution networks using a split-EM based data-driven approach. IEEE Trans. Power Syst. 2021, 37, 2019–2031. [Google Scholar] [CrossRef]
  17. Tong, L.; Chai, W.; Wu, D. Topology and impedance identification method of low-voltage distribution network based on smart meter measurements. Front. Energy Res. 2022, 10, 895397. [Google Scholar] [CrossRef]
  18. Xu, D.; Wu, Z.; Xu, J.; Hu, Q. A data-model hybrid driven topology identification framework for distribution networks. CSEE J. Power Energy Syst. 2023, 10, 1478–1490. [Google Scholar]
  19. Ni, Q.; Jiang, H. Topology identification of low-voltage distribution network based on deep convolutional time-series clustering. Energies 2023, 16, 4274. [Google Scholar] [CrossRef]
  20. Wu, H.; Xu, Z.; Zhao, J.; Chai, S. Gridtopo-GAN for distribution system topology identification. IEEE Trans. Ind. Inform. 2022, 19, 5356–5366. [Google Scholar] [CrossRef]
  21. Poudel, S.; Ramachandran, T.; Veeramany, A.; Francis, C.; Reiman, A.P. Topology identification using graph theory informed state estimation-based model selection for power distribution systems. IEEE Trans. Ind. Inform. 2023, 20, 3563–3573. [Google Scholar] [CrossRef]
  22. Li, H.; Liang, W.; Liang, Y.; Li, Z.; Wang, G. Topology identification method for residential areas in low-voltage distribution networks based on unsupervised learning and graph theory. Electr. Power Syst. Res. 2023, 215, 108969. [Google Scholar] [CrossRef]
  23. Flynn, C.; Pengwah, A.B.; Razzaghi, R.; Andrew, L.L. An improved algorithm for topology identification of distribution networks using smart meter data and its application for fault detection. IEEE Trans. Smart Grid 2023, 14, 3850–3861. [Google Scholar] [CrossRef]
  24. Dong, Y.; Chawla, N.V.; Swami, A. metapath2vec: Scalable representation learning for heterogeneous networks. In Proceedings of the 23rd ACM SIGKDD International Conference on Knowledge Discovery and Data Mining, Halifax, NS, Canada, 13–17 August 2017; pp. 135–144. [Google Scholar]
  25. Huang, C.; Fang, Y.; Lin, X.; Cao, X.; Zhang, W. ABLE: Meta-path prediction in heterogeneous information networks. ACM Trans. Knowl. Discov. Data (TKDD) 2022, 16, 1–21. [Google Scholar] [CrossRef]
  26. Veličković, P.; Cucurull, G.; Casanova, A.; Romero, A.; Lio, P.; Bengio, Y. Graph attention networks. arXiv 2017, arXiv:1710.10903. [Google Scholar]
  27. Vujović, Ž. Classification model evaluation metrics. Int. J. Adv. Comput. Sci. Appl. 2021, 12, 599–606. [Google Scholar] [CrossRef]
Figure 1. Topology identification model architecture of LVDG based on F-GAT.
Energies 18 02821 g001
Figure 2. Three basic meta-path forms.
Energies 18 02821 g002
Figure 3. Diagram of node feature aggregation process based on F-GAT.
Energies 18 02821 g003
Figure 4. Training loss function curve of the proposed F-GAT model.
Energies 18 02821 g004
Figure 5. Topology identification ACC of distribution areas under different sampling durations.
Energies 18 02821 g005
Figure 6. Comparative analysis of LVDG 2 topology before and after recognition.
Energies 18 02821 g006
Figure 7. Test results of topology identification robustness of Distribution Area 1.
Energies 18 02821 g007
Figure 8. ACC comparison of identification results of GCN, GAT and F-GAT algorithms for different distribution areas.
Energies 18 02821 g008
Figure 9. ACC of GCN, GAT and F-GAT algorithms under different noise amplitudes.
Energies 18 02821 g009
Table 1. Topological configurations of five urban LVDG areas.
LVDG 1LVDG 2LVDG 3LVDG 4LVDG 5
Number of branch nodes19728510
Number of user nodes6211511228
Number of all nodes8119791839
Table 2. Comparison of average identification results of GCN, GAT and F-GAT algorithms.
Computational ComplexityTime Consumption/sACC/%P/%R/%F1/%
GCN O N M F + E F 0.5895.6898.3997.1497.76
GAT O K N M F + E F 0.5896.6698.4298.1198.26
F-GAT O K N ( M + M ) F + E F 0.61100100100100
Disclaimer/Publisher’s Note: The statements, opinions and data contained in all publications are solely those of the individual author(s) and contributor(s) and not of MDPI and/or the editor(s). MDPI and/or the editor(s) disclaim responsibility for any injury to people or property resulting from any ideas, methods, instructions or products referred to in the content.

