Article

A Modeling Study on the Impact of Coal Power in Wind–Solar–Thermal Storage System

1
State Key Laboratory of Coal Conversion, Institute of Engineering Thermophysics, Chinese Academy of Sciences, Beijing 100190, China
2
University of Chinese Academy of Sciences, Beijing 100049, China
3
Inner Mongolia Power (Group) Co., Ltd., Hohhot 010010, China
*
Author to whom correspondence should be addressed.
Energies 2025, 18(11), 2819; https://doi.org/10.3390/en18112819
Submission received: 27 April 2025 / Revised: 24 May 2025 / Accepted: 26 May 2025 / Published: 28 May 2025
(This article belongs to the Section B: Energy and Environment)

Abstract

:
To further quantify the role of coal-fired power units in a wind–solar–thermal storage system and improve the construction of clean energy bases, this study examined the temporal production characteristics of wind and solar power and established an operational model for coal-fired power units within a wind–solar–thermal storage system. This approach ensured a stable electricity supply on the basis of power balance. The findings indicate that the correlation between the installed capacity of coal-fired power and the daily power supply capability of energy storage that meets various scheduled power demands can be obtained via the model. As the proportion of wind and solar power in the output power decreases, the influence of the minimum operational load of the coal-fired power units on the curtailment rate intensifies. Notably, the operational cost savings from reducing this minimum operational load surpass those obtained by either downsizing the installed capacity of coal-fired power units or energy storage devices. Among the parameters of this study, the lowest operational cost for the system was observed when wind and solar power generation constituted 76% of the total. This scenario, which ensured stable power output for 95% of the days in a year, had a wind and solar power curtailment rate of 11.3%. Additionally, the energy supplied by storage devices amounted to 1000 MWh, with the ratio of the installed capacity of coal-fired power to the total installed capacities of wind and solar power remaining at 25%. When the ratio of wind and solar power generation to output power was 91%, 76%, and 58%, a 1% reduction in coal consumption by coal-fired units during low-load operation resulted in a decrease in total system operating costs of 0.012%, 0.093%, and 0.089%, respectively. These findings provide valuable data support for the development of clean energy infrastructures.

1. Introduction

The intensification of greenhouse effects profoundly impacts global ecosystems, necessitating an immediate reduction in greenhouse gas emissions, especially carbon dioxide (CO2) [1,2]. In an attempt to curtail CO2 emissions, many nations have ardently embarked on the cultivation of renewable energy resources, primarily wind and solar power [3,4]. Nevertheless, wind and solar power generation are intrinsically characterized by their intermittency, volatility, and randomness. This inherent variability poses a substantial challenge in maintaining a consistent and reliable electricity supply [5,6]. Consequently, flexible regulation capacity is required to smooth these fluctuations [7,8]. Coal-fired power units and energy storage devices provide flexible regulation capacity [9,10]. In the foreseeable future, coal-fired power units are expected to remain the main energy source for load regulation, especially in China. Kahrl et al. [11] noted that coal generation will be the main source of China’s electricity system until 2050 due to the limited scalability of hydropower, nuclear, and natural gas generation and the economic feasibility of carbon capture and storage. Coal-fired power can provide flexible adjustment capacity to power systems and ensure the security and stability of the power supply [12,13]. Coal-fired power is also an important part of multi-energy coupling systems [14,15,16].
In the study of multi-energy system composition optimization, researchers have focused more on the installed capacity and technical selection of energy storage devices, in which coal-fired power units are often set as a fixed input value. Masenga et al. [17] conducted a comprehensive analysis of the design and development process for wind–solar hybrid power systems, using compressed air energy storage to regulate the voltage and frequency within these systems. Zhou et al. [18] developed a multi-energy complementary optimization model that integrates wind, solar, and fire energy sources. The authors analyzed the potential installed capacity of wind and solar power when they are combined with a fixed thermal power capacity of 4800 MW, as well as the capacity of the transmission channel. Wang et al. [19] conducted a comparative analysis of load dispatch schemes for wind power, solar power, and coal-fired power with fixed installed capacities and obtained the scheduling strategy with the lowest operational cost and carbon emission cost. Economic dispatch is another important research issue in power systems and multi-energy coupling systems [20,21]. The economy, power supply reliability, and stability are commonly used as optimization objectives. Al-falahi et al. [22] analyzed recent size optimization methodologies for hybrid renewable energy systems. The purpose of optimal sizing research is to obtain a reliable supply at a low cost for these systems. On the basis of a comprehensive consideration of the operational economy throughout the entire lifecycle of the system and the economic efficiency within each scheduling period, An et al. [23] proposed an optimized scheduling strategy for a wind–solar–water storage complementary power generation system.
The literature generally reports that optimizing the design and operation of coupled energy systems can result in increased energy efficiency and reduced carbon emissions. Significant research on the coupling of coal-fired power units with renewable sources, the flexible operation of these coal-fired power units, and the optimization of wind–solar–thermal storage systems [24,25] has been undertaken. However, within wind–solar–thermal storage systems, the influence of the installed capacity and flexible operation level of coal power as a source for ensuring power safety for wind and solar power absorption, as well as the operation cost of the energy system, has not been thoroughly explored. As the proportion of wind and solar power generation in the power system increases, coal power shifts from being the primary electricity source to being a flexible adjustment source. Thus, determining how to allocate the capacity of coal-fired units and energy storage devices consistent with wind power, solar power, and load demand is becoming increasingly crucial.
The energy base typifies a scenario of multi-energy coupling. This approach can effectively address the discrepancy between the geographical distribution of energy resources and electricity load [26]. In the development of large clean energy bases, wind and solar power installation capacity is substantial. To ensure a stable and safe electricity supply, the allocation of coal-fired power units must be calculated on the basis of the power balance generated via wind and solar time series. Furthermore, the flexible operation capability of coal-fired power units needs to align more accurately with the actual development and operation of coal power.
In a coal-fired power unit with limited flexible operation capacity, a high minimum achievable operating load prevails. As a result, a significant portion of wind and solar energy remains untapped. On the other hand, power units with robust, flexible operation capabilities have a low minimum achievable operating load. These units, however, experience reduced efficiency at lower loads, resulting in increased fuel consumption per kilowatt-hour. This study examines the role of coal power in high-penetration renewable energy systems. Three scenarios were established: actual, ideal, and extreme, based on the ratio of wind and solar power generation to actual demand. The characteristics of wind and solar power generation, as well as their regulation requirements, were analyzed. An operational model for coal-fired power units within a wind–solar–thermal storage system was then developed. Grounded in the fundamental principles of ensuring a safe and stable electricity supply and maximizing consumption, strategies for constructing coal-fired units in clean energy bases were proposed, i.e., regions that boast significant wind and solar power generation. These strategies detailed the installed capacity, flexible operational level, and the demand for supporting energy storage device capacity. The findings from this study can provide valuable data to support the progression of wind and solar power, ultimately encouraging further research and application within wind–solar–thermal storage power systems.

2. Materials and Methods

2.1. System Description

This study analyzed the operational curves of wind and solar power in a specific region in Inner Mongolia, China. The installed capacities of these sources are predetermined at 4000 MW and 8000 MW, respectively. The annual utilization hours of wind and solar power are 2900 h and 1800 h, respectively. Data were collected at 5 min intervals over a period of 364 days. Figure 1 presents a schematic diagram illustrating the wind–solar–thermal storage system. In this system, wind and solar power constitute the principal sources of electricity. Coal-fired power units serve as the primary mechanism for load regulation. However, in instances where coal power is insufficient to meet regulatory demands, energy storage systems are deployed for supplementary regulation.

2.2. Model Introduction

An operational model for coal-fired power that considers regional power stability, the flexibility of coal-fired power, and the overall system economy was developed. The objective was to guarantee power supply stability. Through a detailed examination of the flexible adjustment and supportive role of coal-fired power units, this study determined the coal-fired power installation plan with the minimal economic cost in the region. The PyCharm Communication Edition (2023.1.3) software was employed to analyze the time series production characteristics of wind and solar power generation using the Python (3.11.5) language [27]. This analysis was integrated with a study of dispatch load curves to calculate the operational electricity curves under a specified coal-fired power unit installed capacity, maintaining a balance of time series production power. The daily electricity deficit was subsequently computed to determine the required installed capacity for energy storage, adhering to safety standards. Furthermore, considerations were made regarding the flexibility of coal-fired power units, particularly the minimum operational load they could sustain, and their associated impact on system operation costs. To achieve optimal economic efficiency, the model provides an optimized configuration of the installed capacity for coal-fired power units within a designated scheduling load range. This model is anchored in a thorough power balance analysis that recognizes both the supportive and regulatory functions of generation.

2.3. Model Function

To precisely represent the scale of installed capacity for coal-fired power and energy storage devices, this paper uses the ratio of their installed capacity relative to the total installed capacity of wind and solar power (Rcoal and Rstorage, %). These ratios can be determined using the following formula:
R coal = I C coal / ( I C solar + I C wind ) × 100 %
R storage = I C storage / ( I C solar + I C wind ) × 100 %
where ICcoal, ICsolar, ICwind, and ICstorage represent the installed capacities of the coal-fired power unit, solar power system, wind power system, and energy storage devices, respectively (MW).
In the proposed model, the operational load of the coal-fired units (Lcoal, MW) is delineated within a specific range:
( L coal , min / 100 × I C coal ) L coal I C coal
where Lcoal,min represents the minimum load at which coal-fired power units can operate stably (%).
The system gives precedence to coal-fired power units in order to regulate the variable electricity provided by wind and solar power. The load of these coal-fired power units is modeled recursively via a difference equation, with the computational formula presented as follows:
L coal t + 1 = L coal t + Δ L need , Δ L need r coal Δ t L coal t + r coal Δ t , Δ L need > r coal Δ t
where L coal t + 1 and L coal t represent the load of coal-fired power units at time t and t + 1, respectively. ∆Lneed represents the quantum of power adjustment necessitated by the system at that moment. rcoal represents the maximum load change rate of coal-fired units (MW/min). ∆t represents the time interval (min).
The ratio of the cumulative generation from wind and solar power to the required electricity required for scheduling within a given time frame (Rsw,schedule, %) can be computed via the provided formula:
R sw , schedule = t 1 t 2 ( L solar + L wind ) d t / t 1 t 2 L schedule d t × 100 %
where t1 and t2 are the starting moment and ending moments, respectively, of the computation period. Lsolar and Lwind are the operation loads of the solar power system and wind power systems, respectively (MW). Lschedule is the scheduled load for this specific area (MW), which changes over time. In this study, the variation curves of the daily scheduled load are assumed to be identical.
To determine the installed capacity of energy storage in meeting the scheduled load requirements, it is imperative to compute the quantity of electricity that remains absent under varying coal-fired power unit capacities and minimum operating load conditions (Emissing, MWh). It can be calculated via the following formula:
E missing = t 1 t 2 ( L schedule L solar L wind L coal ) d t 𝟙 L schedule > ( L solar + L wind + L coal )
In this research, the regulation of wind and solar power by coal-fired power units and energy storage devices was quantified. The curtailment of wind and solar power (Rsw,cur, %) over a specified period was computed via the following formula:
R sw , cur = t 1 t 2 ( L solar + L wind + L coal L storage L schedule ) d t / t 1 t 2 ( L solar + L wind ) d t × 100 % 𝟙 ( L solar + L wind + L coal ) > ( L schedule + L storage )
where Lstorage represents the operation load of the energy storage device (MW).
The total operating cost of the comprehensive energy system (ctotal, CNY 100 million) analyzed in this study can be calculated according to the following formula:
c total = c sw , cur + c storage + c coal
where csw,cur represents the cost associated with abandoned wind and solar power generation (CNY 100 million), which can be expressed as follows:
c sw , cur = 0 t ( L solar + L wind + L coal + L storage L schedule ) d t × L C O E sw 𝟙 ( L solar + L wind + L coal + L storage ) > L schedule
where LCOEsw represents the average levelized cost of electricity (LCOE) for wind and solar power generation, which was established as 0.35 CNY/kWh in this research [28,29]. Importantly, LCOE involves the cost of generating electricity, including initial capital investment, return on investment, and variable costs [30,31]. This figure is derived by dividing the total cost by the total energy that is produced.
cstorage is the operating cost of energy storage devices (CNY 100 million), which can be expressed as follows:
c storage = 0 t L storage d t × L C O E storage
where LCOEstorage represents the mean of the LCOE values for three distinct capacity-based storage technologies (pumped storage, compressed air storage, and phosphate iron battery storage) [32,33,34], which is 0.62 CNY/kWh in this paper [35]. It should be noted that the energy storage efficiencies of the three aforementioned devices are 76%, 60%, and 88%, respectively. Furthermore, their operational lifespans are delineated as 50 years, 30 years, and 20 years, in sequence [35].
ccoal is the operating cost of coal-fired units (CNY 100 million), which can be expressed as follows.
c coal = n = 1 5 L coal , n d t × ( b n × c fuel + c coal , other )
where n represents the operational load range of coal-fired power units, with values ranging from 1 to 5. The variable bn represents the coal consumption of a power generation unit at varying operational load levels. In this study, the power supply coal consumption level of 600 MW supercritical units is selected for model calculation. The values and representative meanings of n, as well as the corresponding values of bn, are shown in Table 1. cfuel is the price of coal, which is 900 CNY/t in this research.
As determined by the LCOE model, fuel cost is identified as the primary factor influencing the LCOE of China’s coal-fired power units [36], accounting for approximately 60% of the total LCOE. As the operational load of coal-fired units decreases, there is a corresponding gradual increase in coal consumption per power generation [37,38]. The remaining costs (ccoal,other) encompass capital returns, taxes, depreciation, and operational and maintenance expenses. Notably, ccoal,other averages approximately 0.13 CNY/kWh [39].

3. Results and Discussion

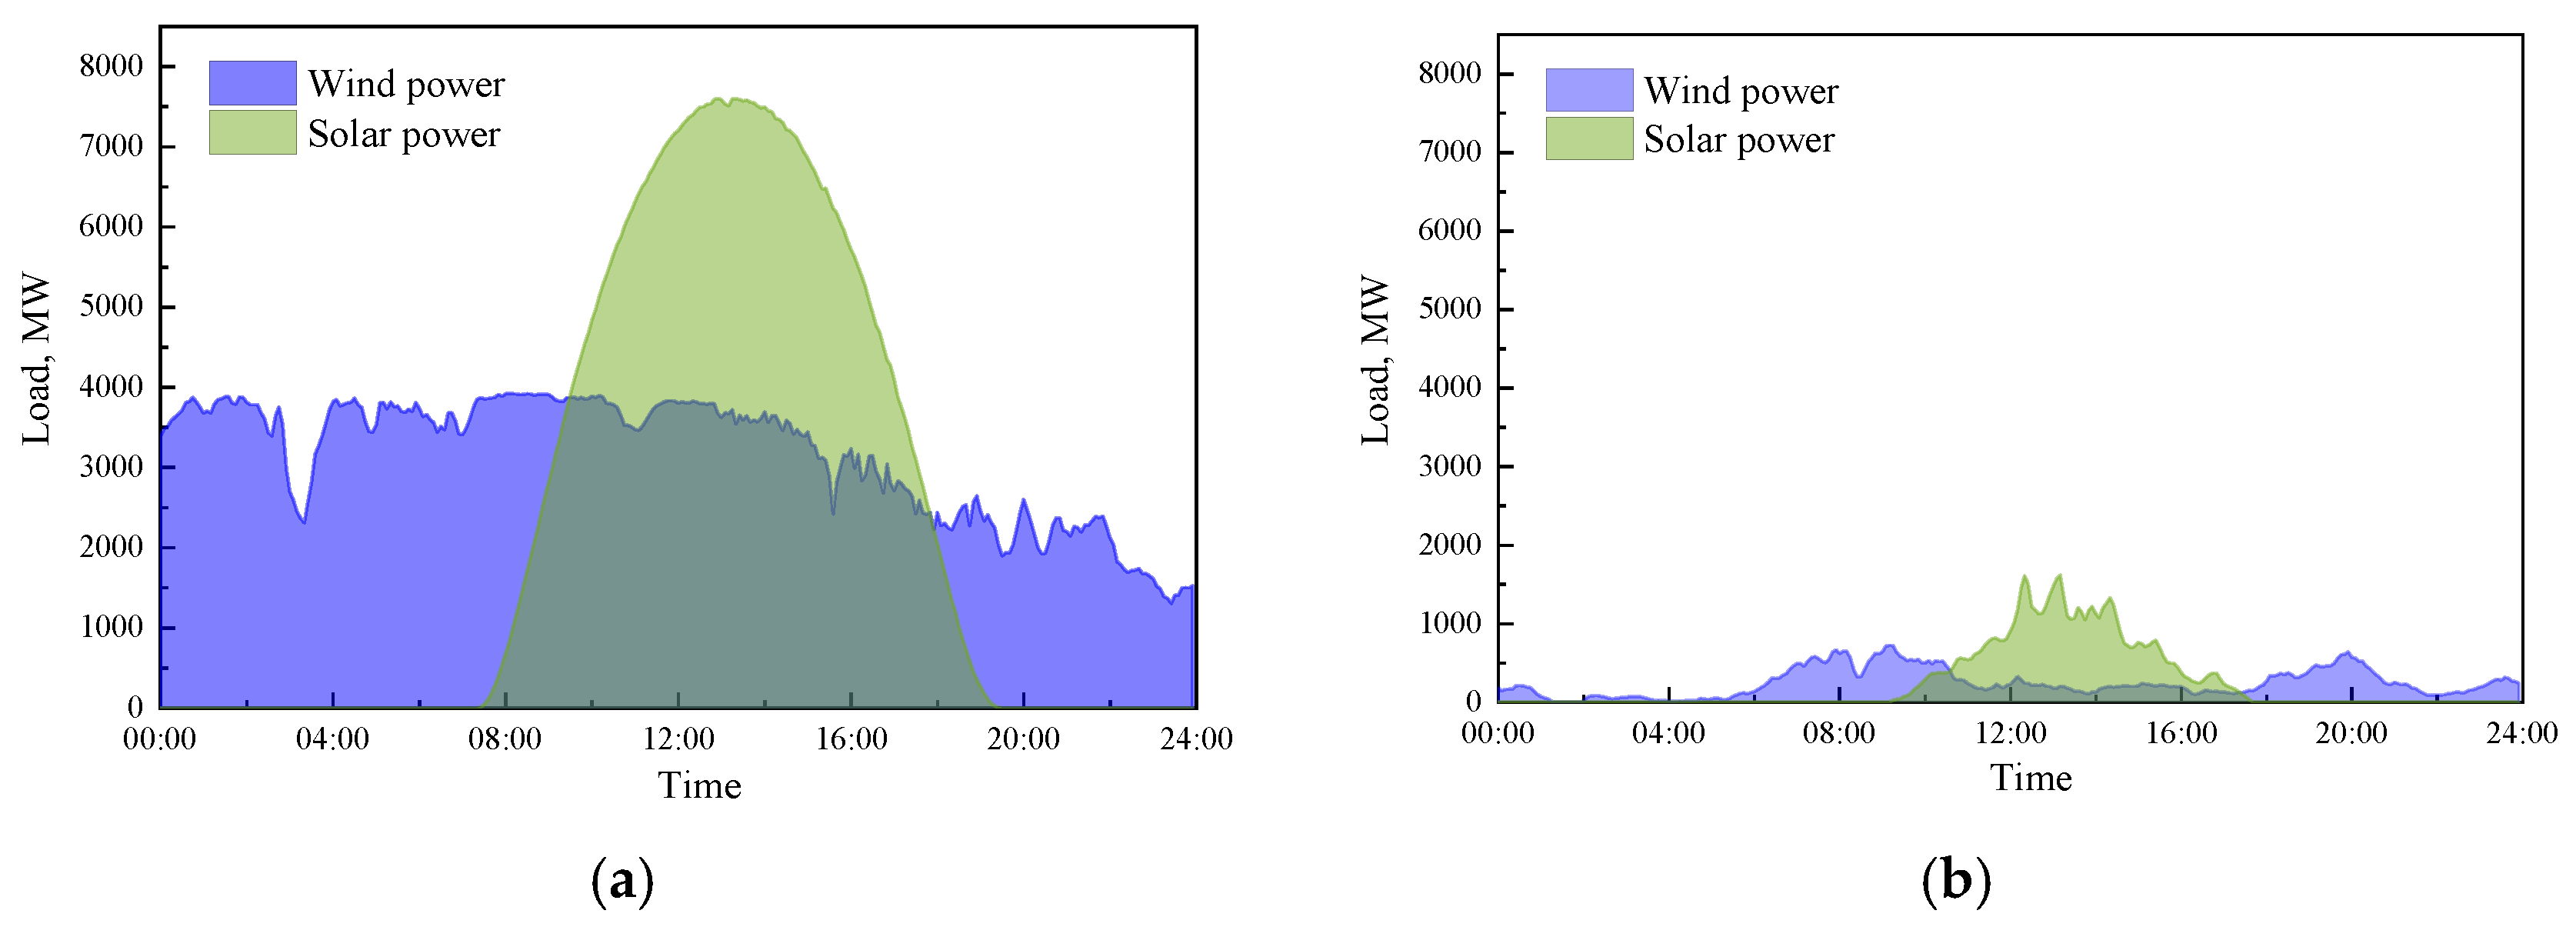
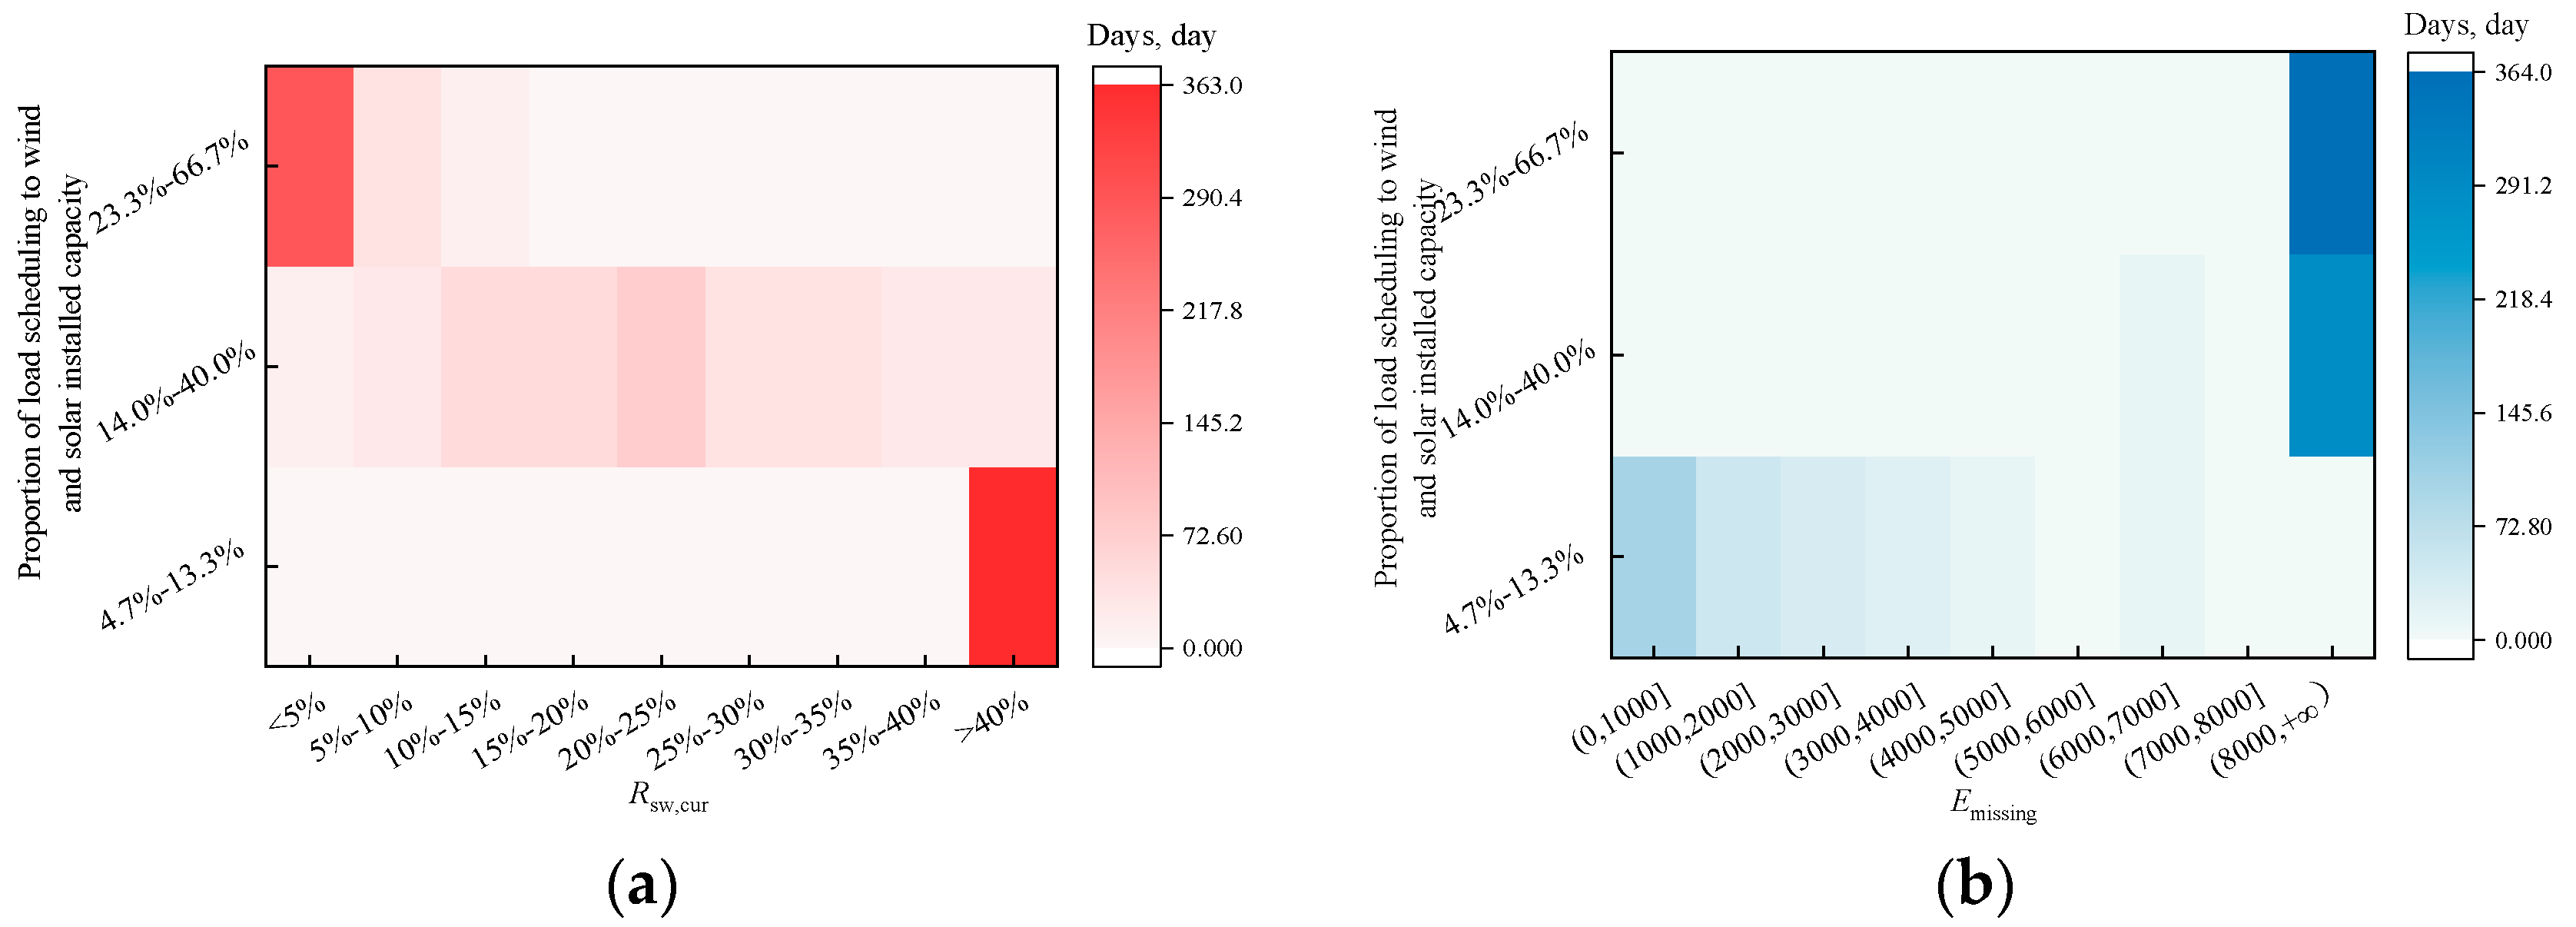
3.1. Flexible Power Regulation Requirements

Wind and solar power generation inherently exhibit volatility and intermittency. The typical daily patterns for these forms of energy generation are depicted in Figure 2. The solar power generation curve presents a distinctive pattern defined by cyclical fluctuations in energy production, characterized by high output during the day and periods of low output at night. Conversely, the wind power generation curve appeared to be more arbitrary, without any discernible regulation. Figure 2 also highlights a significant disparity between wind power and solar power generation across different days.
Figure 3 depicts a typical schedule load curve, corresponding to electricity demand, for an energy system. This curve was characterized by a step-like configuration, peaking in the middle with troughs at both ends. A representation aligns with real-world scenarios in which wind and solar energies coexist and in which the installed solar power capacity exceeds that of wind power. Given the ongoing advancements in renewable energy and power transmission technologies [40], the proportions of installed capacity and electricity generation from wind and solar sources are projected to increase. In some extreme scenarios, the installed capacity for wind and solar power might significantly surpass the electricity demand. To capture the nuances of these evolving conditions, this study examines three distinct ranges of scheduled curves for simulation analysis. These ranges are 560–1600 MW, 1680–4800 MW, and 2800–8000 MW, for 4.7–13.3%, 14.0–40.0%, and 23.3–66.7%, respectively, of the total installed capacity of wind and solar power.
Three scheduled load ranges are presented, each representing a distinct scenario:
(1)
Actual scenario. In the scenario where the load range of the scheduled curve is between 23.3% and 66.7% of the installed capacity for both wind and solar power, the combined power generation from these sources approximated 60% of the electricity demand;
(2)
Ideal scenario. In the scenario where the load range of the scheduled curve is between 14% and 40% of the installed capacity for both wind and solar power, the total power generation from these sources approximated 100% of the electricity demand;
(3)
Extreme scenario. In the scenario where the load range of the scheduled curve is between 4.7% and 13.3% of the installed capacity for both wind and solar power, the total power generation from these sources approximated 300% of the electricity demand.
When the schedule load was distributed in different ranges, computations were performed to determine the daily curtailment rates for wind and solar power, in addition to the daily missing power. Furthermore, the frequency of days falling within a particular range of these daily curtailment rates for wind and solar power was quantified, as shown in Figure 4a. Similarly, the frequency of days within a specified single-day missing power range was determined, as shown in Figure 4b.
In scenarios in which the proportion of the load scheduling range to the wind and solar installed capacity was 4.7–13.3%, the annual daily wind and solar curtailment rates exceeded 40% on 99% of the days in the given year. Half of these days experienced a daily shortfall exceeding 1000 MWh, with a notable period of nearly one month in which the daily deficit surpassed 6000 MWh. When the ratio of the load scheduling range to the wind and solar installed capacity was increased to 14.0–40.0%, the daily wind and solar curtailment rates were predominantly between 10% and 35%. However, on 80% of the days in the given year, the daily power deficit exceeded 8000 MWh. In the above two scenarios with different scheduling load ranges, the annual contributions of wind power and solar power to the total output surpassed 85% and 90%, respectively. Thus, even with a significant reliance on wind and solar power generation, there remained a need for substantial supplementary power sources to maintain stable output.
To maintain a consistent electricity output, the relationship between the installed capacity of coal-fired power units and the daily available supply from energy storage is shown in Figure 5. Figure 5a shows that the region can maintain a stable output that aligns with the scheduling curve for 95% of the year, equivalent to 345 days. Similarly, Figure 5b indicates that the region can consistently follow the scheduling curve with a stable output for 364 days of the year. When the scheduling load range was extremely low, coal-fired power units, with an installed capacity of 10% of the installed capacity of wind and solar power, were still required in the absence of storage alignment to ensure a stable power output. Research has revealed that by narrowing the planned load range to between 4.7% and 13.3% of the total installed capacity of wind and solar power and by constructing a single-day energy storage device with a capacity of 6000 MWh, a coal-free energy system can guarantee stable power output for 95% of the days in a year. If the scheduled load range ratio was increased to 14–40%, the power supply capacity of the energy storage device would need to be increased to 30,000 MWh. Beyond this point, the available stored electricity energy, which was the sum of discarded wind and solar power generation, may not meet the demand. In other words, achieving the projected increase in the scheduled load without the use of coal-fired units and the utilization of hourly energy storage devices would be unattainable.
To maintain a consistent power output annually, it was imperative to have coal power installations equivalent to 5% of the installed capacity of wind and solar power. This necessity arose when the daily energy storage capacity expanded from 4000 MWh to 10,000 MWh.

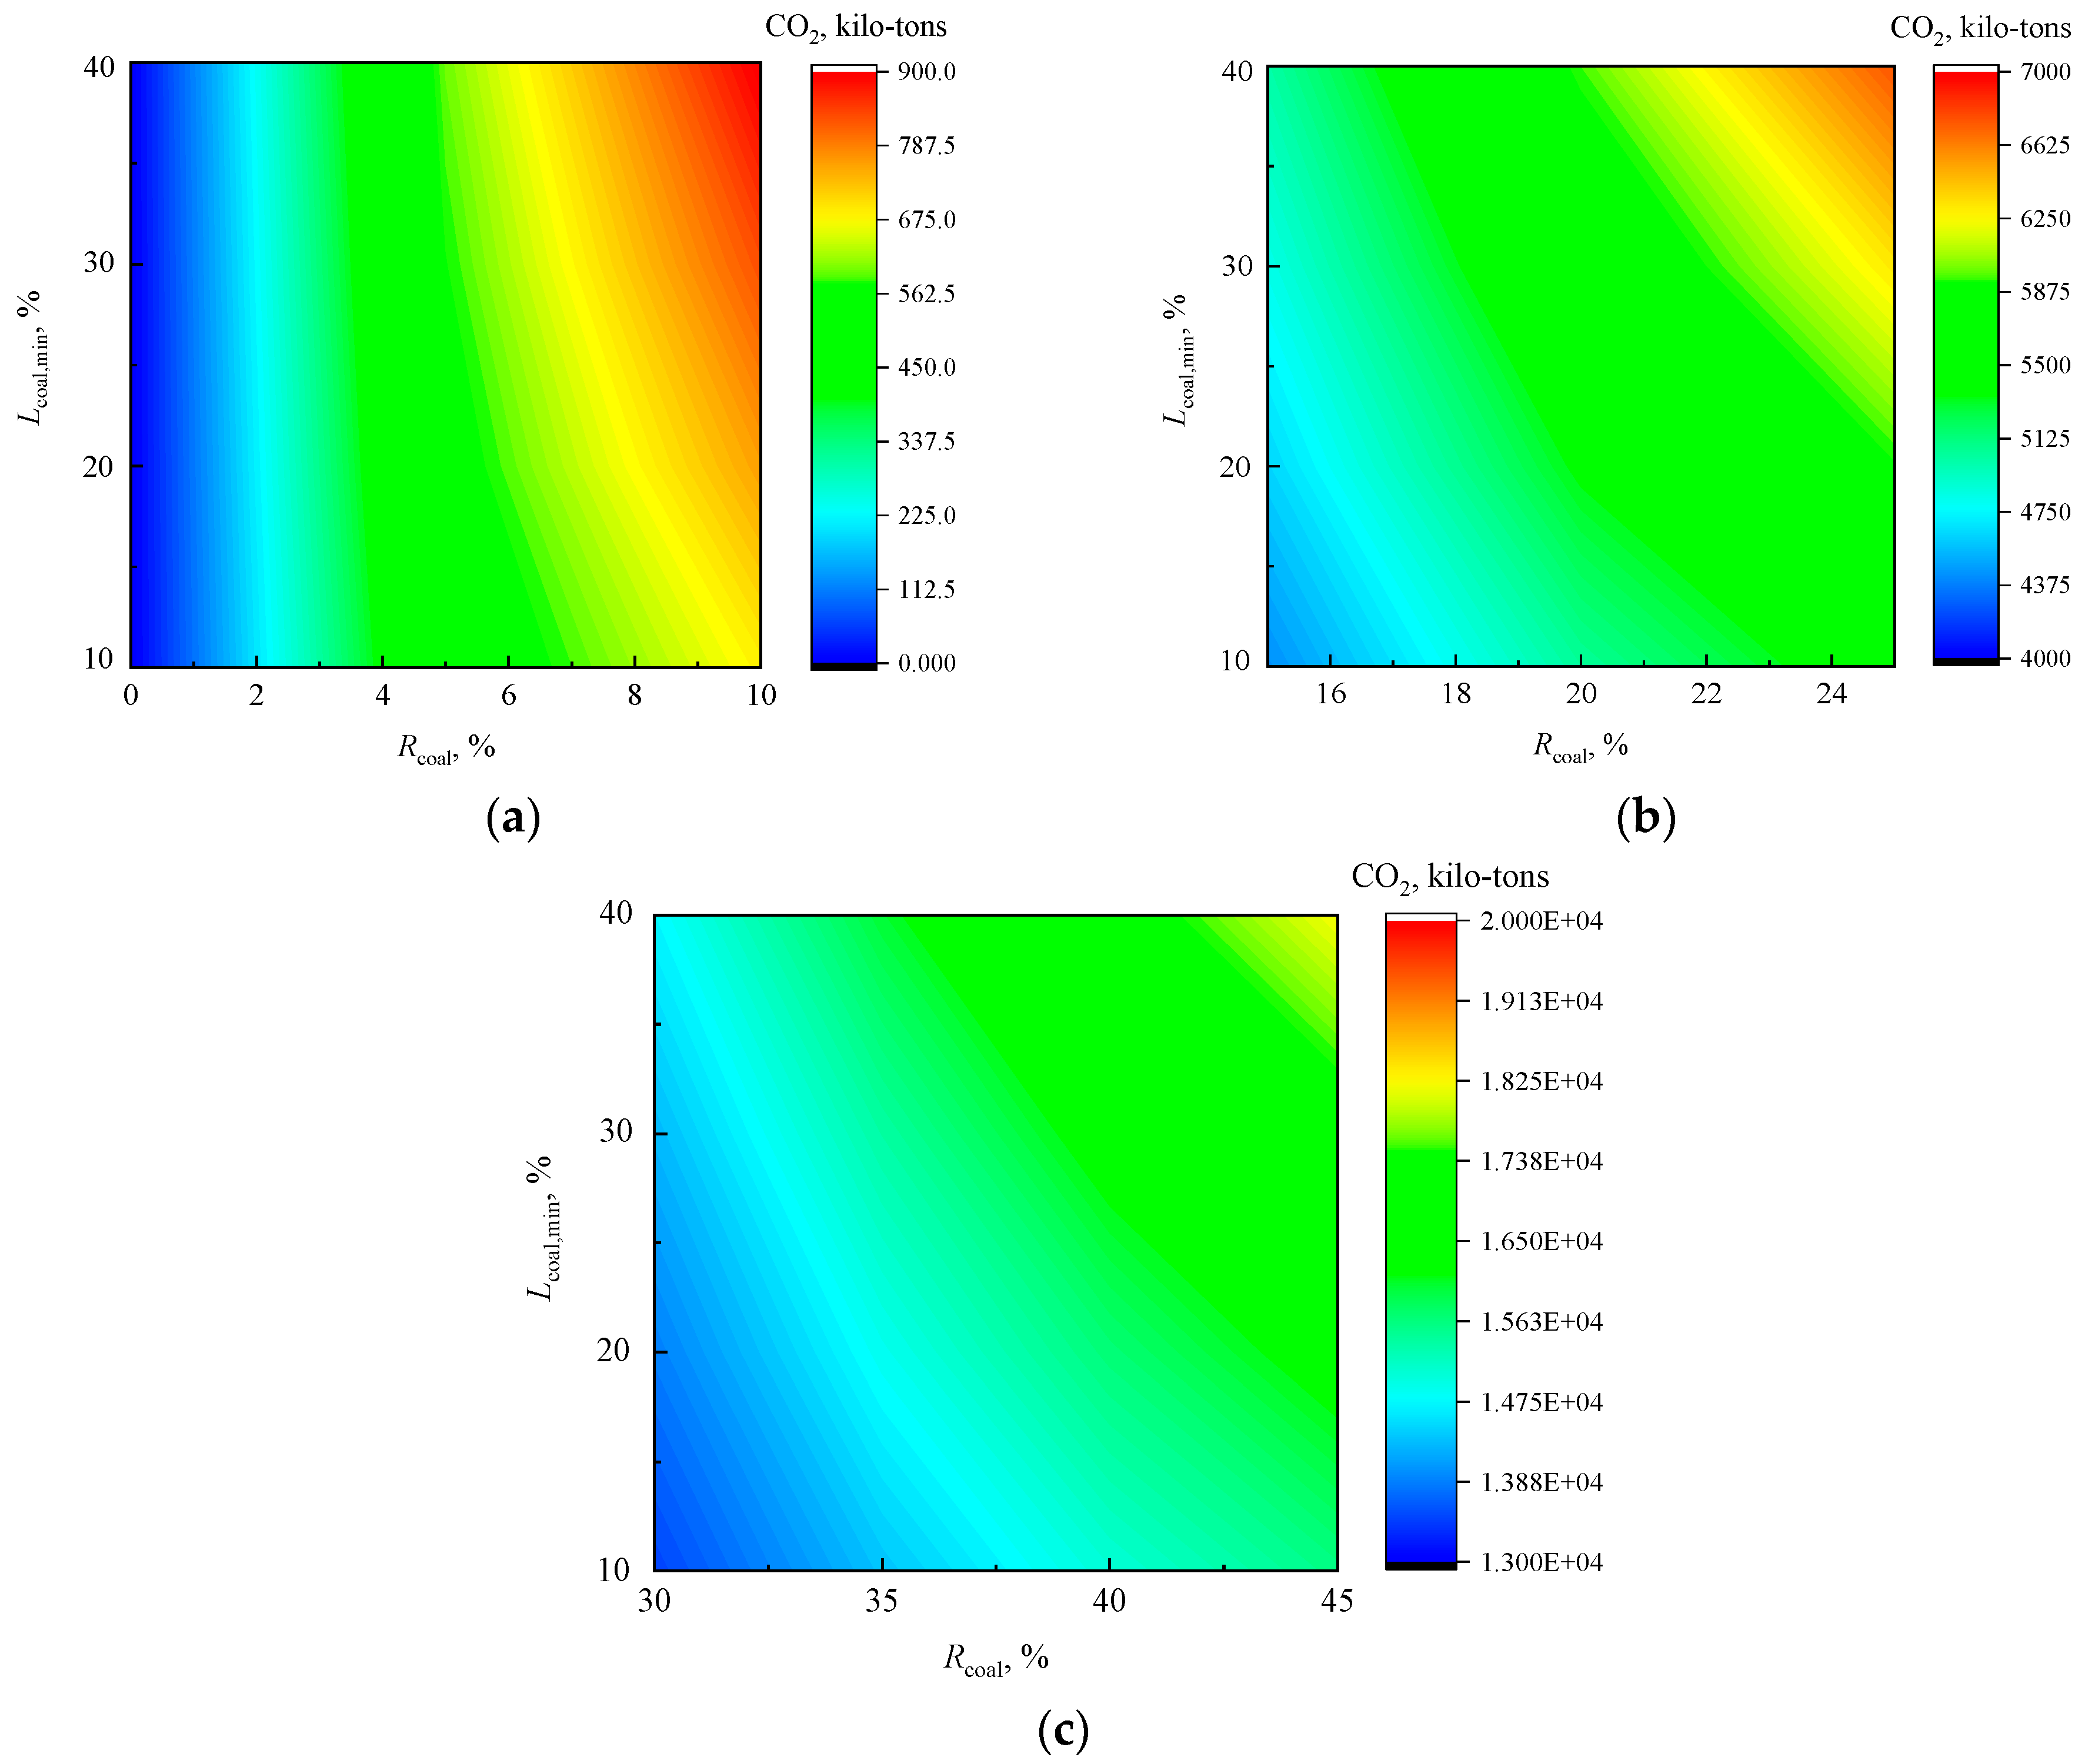
3.2. Effect of Coal-Fired Power on the Environment

To manage the variability in wind power and solar power generation, it was essential to equip coal-fired power units and energy storage devices for effective power regulation. The objective was to maintain a consistent power output that satisfied the demand for 95% of the days in a year. This can be accomplished when the installed capacity of coal-fired power generation units, in conjunction with the daily available power supply from energy storage, aligns with the parameters depicted in Figure 5b. In this context, the influence of the minimum operating load of coal-fired power units on the annual wind and solar energy curtailment rates in the specified region was calculated, as shown in Figure 6. The computation range for the minimum operating load (Lcoal,min) of the coal-fired units was established between 10% and 40%.
When the scheduling load was much smaller than the installed capacity of wind and solar power, i.e., the ratio of wind and solar power generation to output power surpassed 90%, the increase in the installed capacity of coal-fired power generation had a monotonic effect on the abandonment rate of wind and solar power. As the installed capacity of coal-fired power generation increased, the curtailment rate of wind and solar power also increased. However, with the same installed capacity of coal-fired power generation, the minimum operating load of coal-fired power generation units had a minimal effect on the regional curtailment rate of wind and solar power. As the scheduling load continues to increase, i.e., as the proportion of wind and solar power generation contributes to decreasing, the effect of the minimum operating load of coal-fired power units on the wind and solar energy curtailment rate gradually exceeds the effect of the installed capacity of the coal-fired units. The curtailment rate of wind and solar energy when the ratio of the installed capacity of coal-fired power plants to that of wind and solar energy was 45% and the minimum operating load of coal-fired power plants was 10% lower than that corresponding to a ratio of 40% and a minimum operating load of 30%.
Figure 7 shows the CO2 emissions of the system under different scenarios. The graph illustrates that, given the requirement for a safe and steady electricity supply, the minimum operating load of coal-fired power units has a more significant impact on carbon emissions compared to the influence generated by their installed capacity. Furthermore, as wind and solar energy continue to develop, the influence of coal-fired units’ minimum operating load on carbon emissions diminishes when the proportion of wind power and photovoltaic power exceeds the demand for electricity.

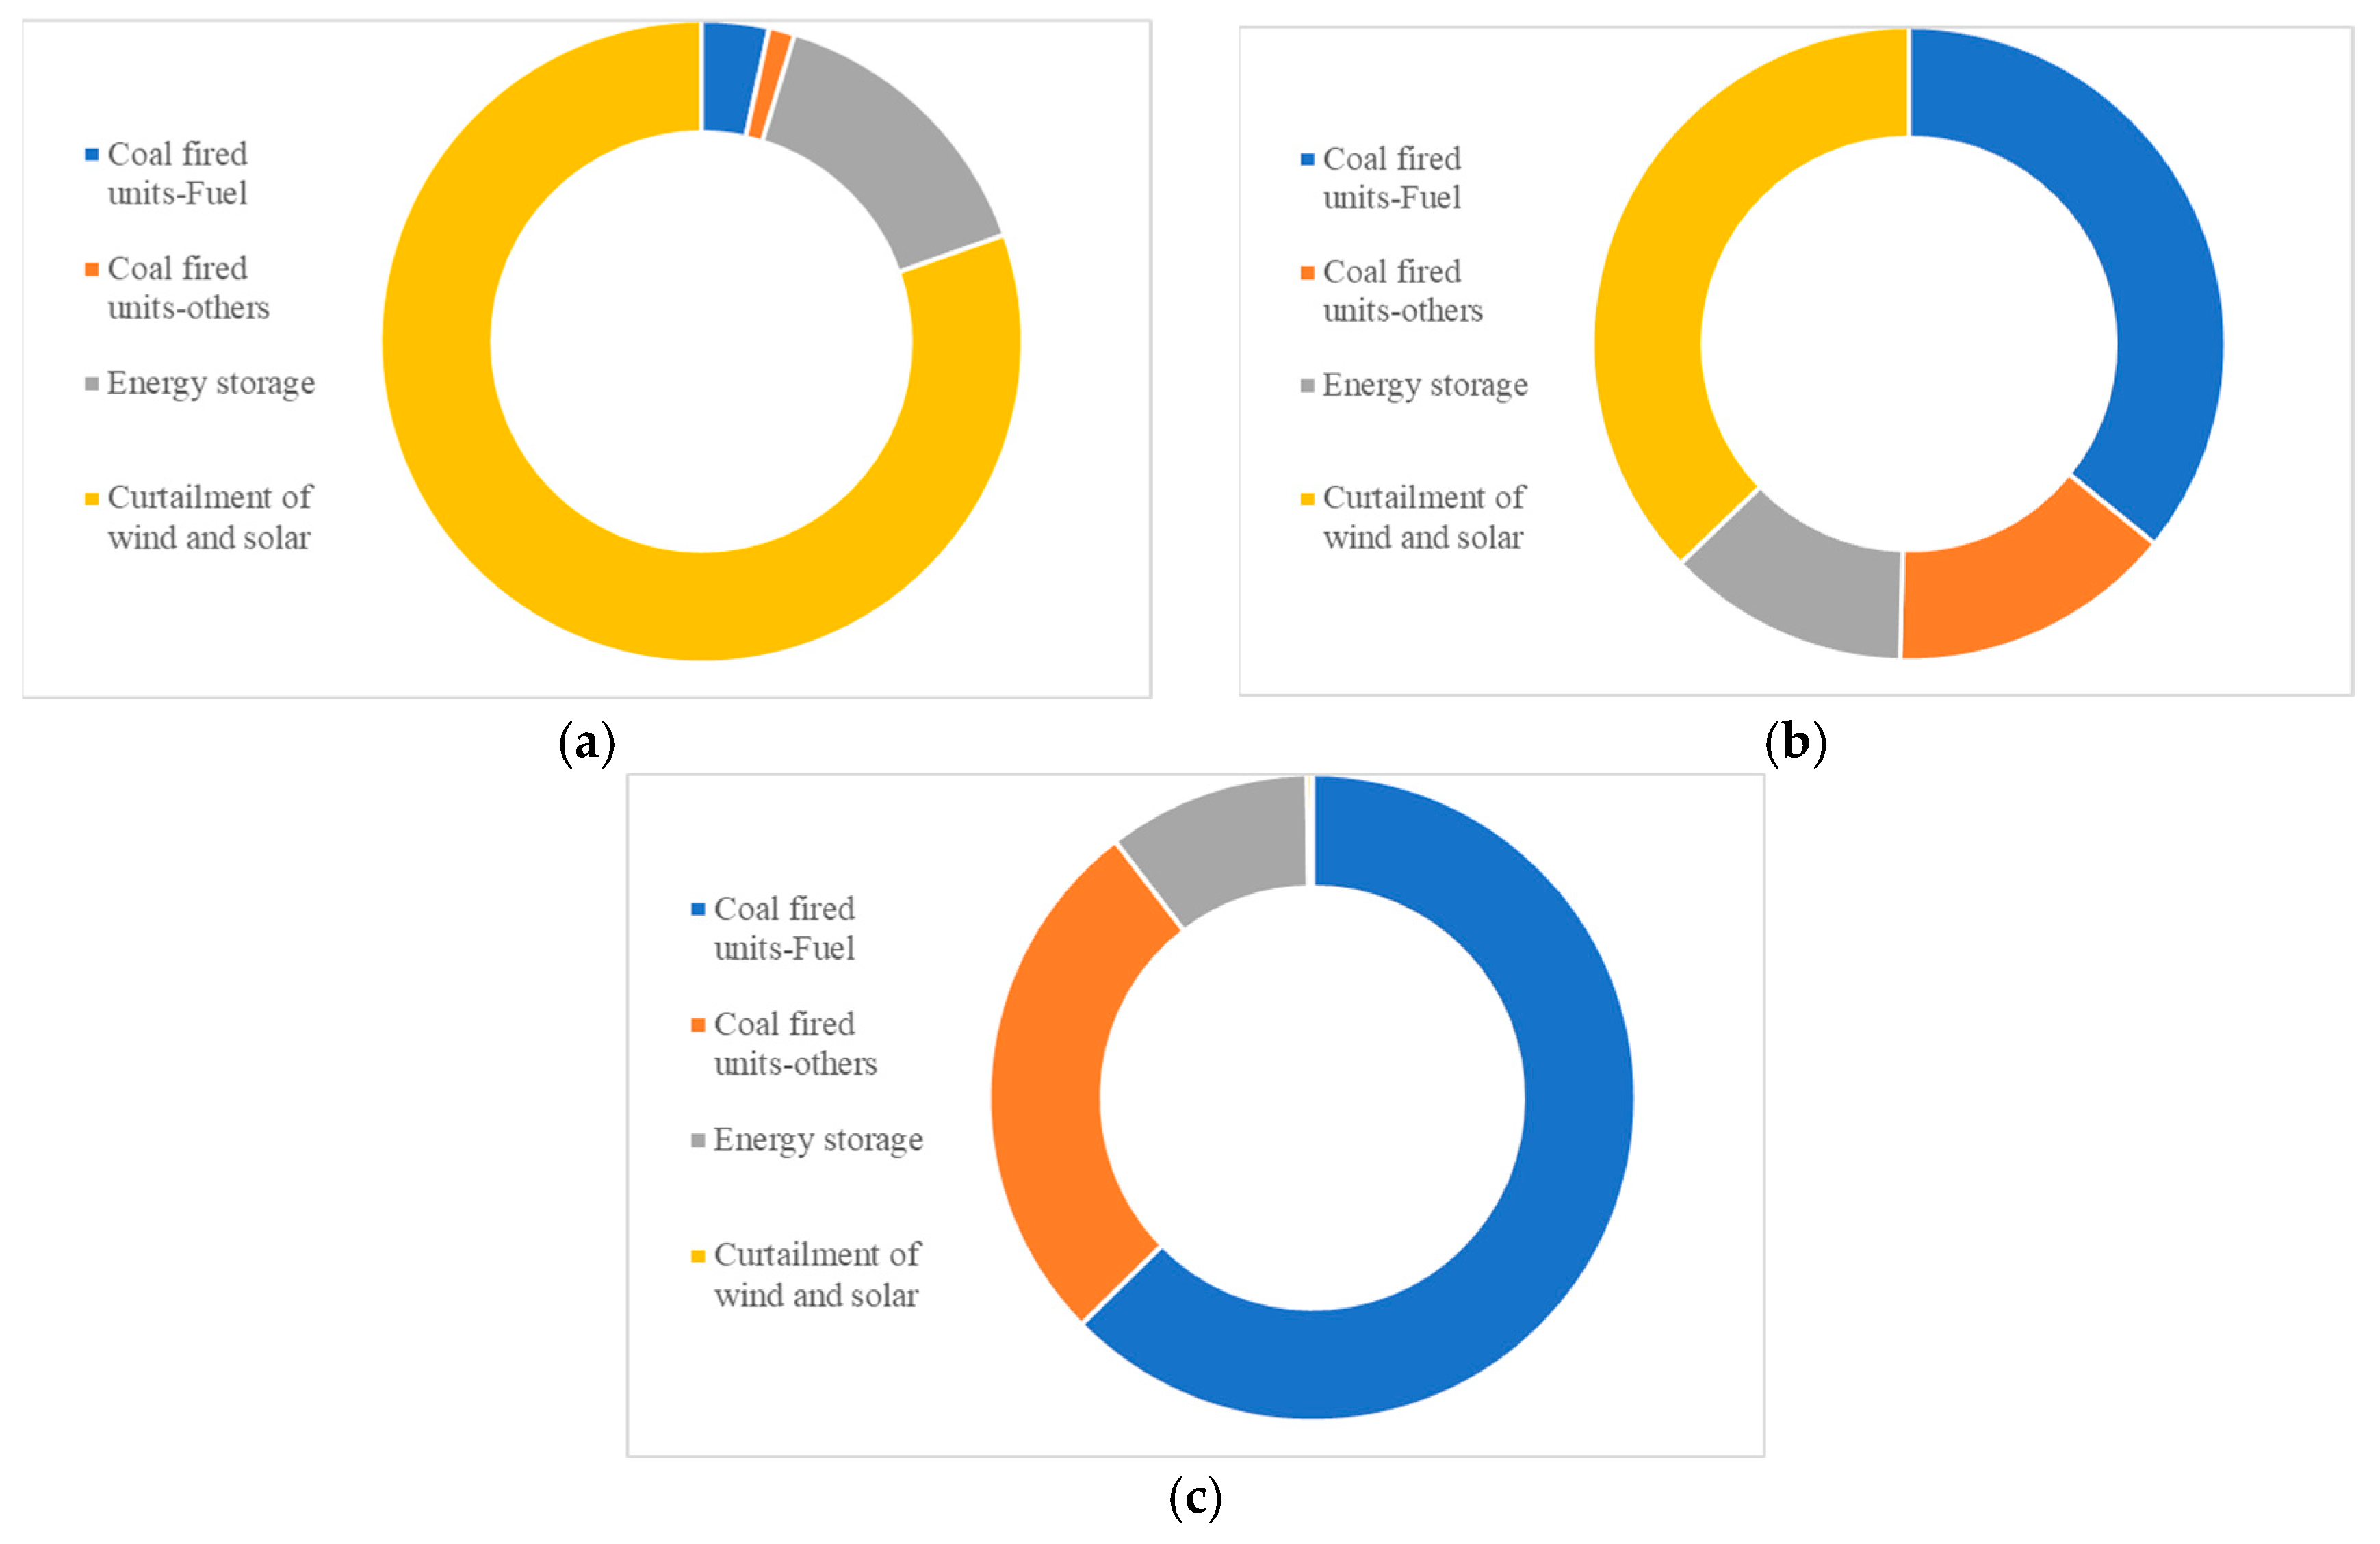
3.3. Effect of Coal-Fired Power on Operating Cost

An economic analysis of the aforementioned schemes, considering the ability of the energy system to meet established load demands, was conducted. This examination also highlights the impact of the minimum operational load of coal-fired units. The findings are shown in Figure 8. Within any scheduled load range, a reduction in the minimum operational load of coal units resulted in a decrease in the system operating cost. As the charge for single-day energy storage devices increases, the operating cost of the system fluctuates across different scheduled load ranges. When the scheduled load range fell between 4.7% and 13.3% of the total installed capacity of wind and solar power, the installed capacity of the coal-fired power units that was needed to meet this scheduled load was minimal. Consequently, the power generation of coal-fired power units was significantly lower than that of the energy storage devices. Furthermore, as the daily electricity output of energy storage devices increases, so does their operating cost.
The operating cost increased nonlinearly in relation to the increase in the charge for the available single-day energy storage when the scheduled load range fell between 14% and 40% of the total installed capacity of wind and solar power. However, when the upper limit of the scheduled load exceeded 40%, the system operation cost demonstrated a nonlinear decrease with increasing daily energy supply from energy storage. This trend can be attributed to the finding that within these scheduled load ranges, the flexible power generation of coal-fired electricity and energy storage was greater than the amount of wind and solar power that was discarded. The influence of coal-fired power unit installed capacity and energy storage devices on operating costs increased. Furthermore, as the supply capacity of energy storage increased, the installed capacity of coal-fired power units decreased (as shown in Figure 5). A reduction in Rcoal of 5% would significantly decrease coal-fired power generation, thereby reducing operating costs. Conversely, at a constant Rcoal, an increase in the daily energy supply derived from energy storage resulted in a corresponding increase in operating cost.
In the context of the curtailment cost parameters established in this study, the average system operating cost was minimized when the scheduled load range constituted 14–40% of the total installed capacity of wind and solar power. The average curtailment rate of wind and solar power for this system reached 11.3% under the schemes within this scheduled load range. If the curtailment penalty cost was adjusted to incentivize the use of wind and solar power generation, the scheduled load at which the system’s operating cost was minimized would increase.
Moreover, the operational cost reduction achieved by diminishing the minimum operational load of coal-fired power units was greater than that achieved by decreasing the installed capacity. Within the parameters of this study, when the scheduled load was 23.3–66.7% of the total installed capacity of wind and solar power, the scheme with the lowest operational costs had energy supplies from energy storage devices of 8000 MWh, an Lcoal,min of 10%, and an Rcoal of 35%.
The composition and proportion of operating costs corresponding to the scenarios with the lowest operating costs for different dispatching ranges are shown in Figure 9. Under the current assumption of various costs, the scenario in which the fuel cost of coal-fired unit operation was similar to the wind and solar curtailment cost of the system resulted in the lowest total system operating cost.
Advancements in retrofitting technologies for coal-fired power flexibility have caused a gradual decrease in coal consumption during low-load operation, which is defined as operating loads less than 30% Pe. Under the current coal assumption rates for coal-fired unit operations, the total system operating costs under various scenarios of coal consumption are calculated, and the results are shown in Figure 10. When the scheduled load range of the system was 4.7–13.3%, 14.0–40.0%, and 23.3–66.7% of the total installed capacity of wind and solar power (the ratio of wind and solar power generation to output power was 91%, 76%, and 58%, respectively), a 1% reduction in the coal consumption rate of coal-fired units during low-load operation resulted in decreases in total system operating costs of 0.012%, 0.093%, and 0.089%, respectively. In other words, under the current assumption, every 1 g/kWh reduction in the coal consumption rate of coal-fired units during low-load operation resulted in a decrease in system operating costs of CNY 0.18, 1.05, and 1.53 million, respectively, for the aforementioned three scheduled load ranges.

4. Conclusions

This study utilized an actual power generation curve of wind power, with an installed capacity of 4000 MW, and solar power, with an installed capacity of 8000 MW. The objective was to examine the complementary role of coal power within the energy system, particularly under future scenarios that involve the increased development of wind and solar energy. This research established three distinct scenarios and elucidated the relationship between the installed capacity of coal-fired power units and the daily electricity provided by energy storage devices, considering fluctuating scheduled load ranges. Furthermore, an economic analysis was performed. The primary conclusions drawn from this research are as follows:
(1)
When the scheduled load range was significantly lower than the installed capacity of wind and solar power, that is, when the combined power generation from wind and solar power sources reaches approximately 300% of the demand, these sources contribute to 90% of the required power, equipping coal-fired power units, whose installed capacity was greater than 5% of the installed capacities of wind and solar power, was necessary to ensure the stable annual power output of the system;
(2)
As the ratio of wind and solar power generation to output power decreases, the relationship between coal-fired unit installed capacity and the wind and solar curtailment rates of the system transitions from monotonic to nonmonotonic. Additionally, the effect of the minimum operating load of these units on the curtailment rate grew progressively more significant. The operational cost savings from decreasing the minimum operation load of coal-fired power units surpassed those obtained by either reducing the installed capacity of coal-fired power units or energy storage devices;
(3)
Under the research conditions of this study, the lowest operational cost was observed when wind and solar power generation constituted 76% of the total and a stable power output was ensured for 95% of the days in the given year. In this scenario, the curtailment rate of wind and solar power was 11.3%, the daily energy supply from energy storage devices was 1000 MWh, Lcoal,min was 10%, and the Rcoal was 25%;
(4)
When the ratio of wind and solar power generation to output power was 91%, 76%, and 58%, a 1% reduction in the coal consumption rate of coal-fired units during low-load operation caused a decrease in the total system operating costs of 0.012%, 0.093%, and 0.089%, respectively.
This study focuses primarily on the operation of coal-fired power units within a system, wherein the energy storage system is represented by a singular daily power supply index. Future enhancements to this model will encompass several areas: (i) refining the operational characteristics of the energy storage devices, such as the energy storage efficiency and load change rate of different technologies; (ii) considering the material connection between solar power and coal-fired power unit, such as hydrogen; (iii) classifying and discussing the optimal combinations of coal-fired power units with different capacities and pressure levels.

Author Contributions

Methodology, Y.L. (Yuhua Liu), and Q.L.; writing—original draft preparation, Y.L. (Yuhua Liu); funding acquisition, project administration, Q.L.; investigation, Z.G., Q.L., S.Z., Y.L. (Yongjiang Liu), M.G., and Z.C.; writing—review and editing, Y.L. (Yuhua Liu), J.F., and S.Z. All authors have read and agreed to the published version of the manuscript.

Funding

This work was supported by the Strategic Priority Research Program of the Chinese Academy of Sciences (No. XDA29010500).

Data Availability Statement

The original contributions presented in this study are included in the article. Further inquiries can be directed to the corresponding author.

Conflicts of Interest

Authors Zhengnan Gao and Yongjiang Liu were employed by the company Inner Mongolia Power (Group) Co., Ltd. The remaining authors declare that the research was conducted in the absence of any commercial or financial relationships that could be construed as a potential conflict of interest.

Abbreviations

The following abbreviations are used in this manuscript:
LCOELevelized cost of electricity
CNYChinese Yuan

References

  1. Ma, S.; Wang, M.; Han, T.; Song, H.; Zang, B.; Lu, D.; Chen, W. Kinetic experimental study on desorption of decarbonization solution using ammonia method. Chem. Eng. J. 2013, 217, 22–27. [Google Scholar] [CrossRef]
  2. Yang, N.; Kang, F.; Zhang, K.; Zhou, Y.; Lin, W.-F. A strategy for CO2 capture and utilization towards methanol production at industrial scale: An integrated highly efficient process based on multi-criteria assessment. Energy Convers. Manag. 2023, 293, 117516. [Google Scholar] [CrossRef]
  3. Tuttle, J.F.; Powell, K.M. Analysis of a thermal generator’s participation in the Western Energy Imbalance Market and the resulting effects on overall performance and emissions. Electr. J. 2019, 32, 38–46. [Google Scholar] [CrossRef]
  4. Liu, J.Z.; Zeng, D.L.; Tian, L.; Gao, M.M.; Wang, W.; Niu, Y.G.; Fang, F. Control strategy for operating flexibility of coal-fired power plants in alternate electricity power systems. Proc. CSEE 2015, 35, 5385–5394. [Google Scholar] [CrossRef]
  5. Zhao, P.; Wang, J.; Dai, Y. Capacity allocation of a hybrid energy storage system for power system peak shaving at high wind power penetration level. Renew. Energy 2015, 75, 541–549. [Google Scholar] [CrossRef]
  6. Kopiske, J.; Spieker, S.; Tsatsaronis, G. Value of power plant flexibility in power systems with high shares of variable renewables: A scenario outlook for Germany 2035. Energy 2017, 137, 823–833. [Google Scholar] [CrossRef]
  7. Wang, C.; Song, J. Performance assessment of the novel coal-fired combined heat and power plant integrating with flexibility renovations. Energy 2023, 263, 125886. [Google Scholar] [CrossRef]
  8. Trieb, F.; Liu, P.; Koll, G. Thermal Storage Power Plants (TSPP)—Operation modes for flexible renewable power supply. J. Energy Storage 2022, 50, 104282. [Google Scholar] [CrossRef]
  9. Zhang, X.; Gao, Z.; Zhou, B.; Guo, H.; Xu, Y.; Ding, Y.; Chen, H. Advanced Compressed Air Energy Storage Systems: Fundamentals and Applications. Engineering 2024, 34, 246–269. [Google Scholar] [CrossRef]
  10. Ouyang, T.; Xie, S.; Pan, M.; Qin, P. Peak-shaving scheme for coal-fired power plant integrating flexible carbon capture and wastewater treatment. Energy Convers. Manag. 2022, 256, 115377. [Google Scholar] [CrossRef]
  11. Kahrl, F.; Lin, J.; Liu, X.; Hu, J. Sunsetting coal power in China. iScience 2021, 24, 102939. [Google Scholar] [CrossRef] [PubMed]
  12. Wang, H.; Ouyang, Z.; Ding, H.; Su, K.; Zhang, J.; Hu, Y. Experimental study on the flexible peak shaving with pulverized coal self-preheating technology under load variability. Energy 2024, 289, 129830. [Google Scholar] [CrossRef]
  13. Zhu, S.; Hui, J.; Lyu, Q.; Ouyang, Z.; Zeng, X.; Zhu, J.; Liu, J.; Cao, X.; Zhang, X.; Ding, H.; et al. Experimental study on pulverized coal swirl-opposed combustion preheated by a circulating fluidized bed. Part A. Wide-load operation and low-NOx emission characteristics. Energy 2023, 284, 128573. [Google Scholar] [CrossRef]
  14. Serrano-Sanchez, C.; Olmeda-Delgado, M.; Petrakopoulou, F. Exergy and Economic Evaluation of a Hybrid Power Plant Coupling Coal with Solar Energy. Appl. Sci. 2019, 9, 850. [Google Scholar] [CrossRef]
  15. Ding, Z.; Hou, H.; Duan, L.; Hu, E.; Zhang, N.; Song, J. Performance analysis and capacity optimization of a solar aided coal-fired combined heat and power system. Energy 2022, 239, 122141. [Google Scholar] [CrossRef]
  16. Li, X.; Wang, Y.; Zhang, X.; Li, B.; Xu, Y.; Chen, H.; Sheng, S. Increasing Coal-Fired Power Plant Operational Flexibility by Integrating Solar Thermal Energy and Compressed Air Energy Storage System. J. Therm. Sci. 2023, 32, 2032–2047. [Google Scholar] [CrossRef]
  17. Masenga, B.; Byiringiro, J.; Kagiri, C.; Mharakurwa, E.; Ngoma, D.; Aristid, G. Design and Development of Wind-Solar Hybrid Power System with Compressed Air Energy Storage for Voltage and Frequency Regulations. J. Power Energy Eng. 2023, 11, 1–24. [Google Scholar] [CrossRef]
  18. Zhou, B.; Liu, D.; Zhang, J.; Li, Y.; Xu, E.; Bi, S. Research of optimal allocation of multi-energy complementary project of wind-solar-thermal integration. Power Gener. Technol. 2022, 43, 10–18. [Google Scholar] [CrossRef]
  19. Wang, R.; Liu, M.; Zhao, Y.; Zhou, B.; Hui, X. Low Carbon Scheduling Technology for Wind-PV-thermal-storage System Bsen on Carbon Trading and Carbon Capture Cost Balance. Renew. Energy Resour. 2023, 41, 562–568. [Google Scholar] [CrossRef]
  20. Antoniadou-Plytaria, K.-E.; Kouveliotis-Lysikatos, I.-N.; Georgilakis, P.-S.; Hatziargyriou, N.-D. Distributed and Decentralized Voltage Control of Smart Distribution Networks: Models, Methods, and Future Research. IEEE Trans. Smart Grid 2017, 8, 2999–3008. [Google Scholar] [CrossRef]
  21. Happ, H.-H. Optimal power dispatch—A comprehensive survey. IEEE Trans. Power Appar. Syst. 1977, 96, 841–854. [Google Scholar] [CrossRef]
  22. Al-falahi, M.D.A.; Jayasinghe, S.D.G.; Enshaei, H. A review on recent size optimization methodologies for standalone solar and wind hybrid renewable energy system. Energy Convers. Manag. 2017, 143, 252–274. [Google Scholar] [CrossRef]
  23. An, Y.; Zheng, S.; Su, Y.; Yang, R. Research on Two-layer Optimization of Wind-solar- water-storage Multi Energy Complementary Power Generation System. Acta Energ. Solaris Sin. 2023, 44, 510–517. [Google Scholar] [CrossRef]
  24. Rehman, S.; Menesy, A.S.; Zayed, M.E.; Al-Shaikhi, A.; Mohandes, M.A.; Irshad, K.; Kassas, M.; Abido, M.A. Synergistic sizing and energy management strategy of combined offshore wind with solar floating PV system for green hydrogen and electricity co-production using multi-objective dung beetle optimization. Results Eng. 2025, 25, 104399. [Google Scholar] [CrossRef]
  25. Shboul, B.; Zayed, M.E.; Al-Tawalbeh, N.; Usman, M.; Irshad, K.; Odat, A.-S.; Alam, M.A.; Rehman, S. Dynamic numerical modeling and performance optimization of solar and wind assisted combined heat and power system coupled with battery storage and sophisticated control framework. Results Eng. 2024, 22, 102198. [Google Scholar] [CrossRef]
  26. Liu, N.; Kang, J.; Zhao, C. Development Model of Multi-energy Complementary Energy Base and Comprehensive Benefit Enhancement Method. Proc. CSEE 2024, 44, 1339–1352. [Google Scholar] [CrossRef]
  27. Sartori da Silva, F.; Matelli, J.A. Script for resilience analysis in energy systems: Python programming code and partial associated data of four cogeneration plants. Data Brief 2021, 36, 106986. [Google Scholar] [CrossRef]
  28. Xu, Y.; Yang, K.; Yuan, J. Levelized cost of offshore wind power in China. Environ. Sci. Pollut. Res. 2021, 28, 25614–25627. [Google Scholar] [CrossRef]
  29. Fang, Y.; Li, G.; Li, S. Analysis of Optimal to Inverter Power Ratio and LCOE of PV Power Generation System. Sol. Energy 2023, 36–43. [Google Scholar] [CrossRef]
  30. Kee, Z.; Wang, Y.; Pye, J.; Rahbari, A. Small-scale concentrated solar power system with thermal energy storage: System-level modelling and techno-economic optimization. Energy Convers. Manag. 2023, 294, 117551. [Google Scholar] [CrossRef]
  31. Fuentealba, E.; Ferrada, P.; Araya, F.; Marzo, A.; Parrado, C.; Portillo, C. Photovoltaic performance and LCOE comparison at the coastal zone of the Atacama Desert, Chile. Energy Convers. Manag. 2015, 95, 181–186. [Google Scholar] [CrossRef]
  32. Xiang, C.; Xu, X.; Zhang, S.; Qian, H.; Duan, Z. Current situation of small and medium-sized pumped storage power stations in Zhejiang Province. J. Energy Storage 2024, 78, 110070. [Google Scholar] [CrossRef]
  33. Yun, P.; Wu, H.; Alsenani, T.R.; Bouzgarrou, S.M.; Alkhalaf, S.; Alturise, F.; Almujibah, H. On the utilization of artificial intelligence for studying and multi-objective optimizing a compressed air energy storage integrated energy system. J. Energy Storage 2024, 84, 110839. [Google Scholar] [CrossRef]
  34. Wang, Y.; Sun, Y.; Zhang, Y.; Chen, X.; Shen, H.; Liu, Y.; Zhang, X.; Zhang, Y. Optimal modeling and analysis of microgrid lithium iron phosphate battery energy storage system under different power supply states. J. Power Sources 2022, 521, 230931. [Google Scholar] [CrossRef]
  35. Wen, J.; Liu, N.; Pei, J.; Xu, R.; Liu, D. Life Cycle Cost Analysis for Energy Storage Technology. Therm. Power Gener. 2021, 50, 24–29. [Google Scholar] [CrossRef]
  36. Zhao, C.; Zhang, W.; Wang, Y.; Liu, Q.; Guo, J.; Xiong, M.; Yuan, J. The economics of coal power generation in China. Energy Policy 2017, 105, 1–9. [Google Scholar] [CrossRef]
  37. Jia, Z.; Qian, L. Analysis on the influence of deep peak regulation on carbon emission of 660 MW coal-fired thermal power unit. In Collection of 2023 Papers on Technical Supervision of the Power Industry and Technical Forum (Volume II); China Electricity Technology Market Association: Beijing, China, 2023; p. 6. [Google Scholar] [CrossRef]
  38. Wei, H.; Lu, Y.; Yang, Y.; Zhang, C.; He, C.; Wu, Y.; Li, W.; Zhao, D. Research on influence of steam extraction parameters and operation load on operational flexibility of coal-fired power plant. Appl. Therm. Eng. 2021, 195, 117226. [Google Scholar] [CrossRef]
  39. Yuan, J.; Ai, Y.; Zeng, Y.; Liu, Q.; Ouyang, M. Research on China’s coal-fired power generation cost and on-grid tariff policy. Coal Econ. Res. 2018, 38, 43–48. [Google Scholar] [CrossRef]
  40. Jiang, L.; Wang, C.; Huang, Y.; Pei, Z.; Xin, S.; Wang, W.; Ma, S.; Brown, T. Growth in Wind and Sun: Integrating Variable Generation in China. IEEE Power Energy Mag. 2015, 13, 40–49. [Google Scholar] [CrossRef]
Figure 1. Schematic diagram of wind–solar–thermal storage system.
Energies 18 02819 g001
Figure 2. Typical daily wind–solar power generation curves: (a) high solar power generation and high wind power generation; (b) low solar power generation and low wind power generation; (c) high solar power generation and low wind power generation; (d) low solar power generation and high wind power generation.
Energies 18 02819 g002aEnergies 18 02819 g002b
Figure 3. Typical schedule load curve.
Energies 18 02819 g003
Figure 4. Wind and solar curtailment rates and missing power on a single day for different scheduled load ranges: (a) wind and solar curtailment rates on a single day for different scheduled load ranges and (b) missing power on a single day for different scheduling ranges.
Energies 18 02819 g004
Figure 5. Relationship between the coal power installation ratio and the daily energy supply capacity of energy storage for different scheduled load ranges: (a) 95% and (b) 100%.
Energies 18 02819 g005
Figure 6. Curtailment rates of wind and solar power under different scenarios: (a) 4.7–13.3%, (b) 14.0–40.0%, and (c) 23.3–66.7%.
Energies 18 02819 g006
Figure 7. CO2 emission under different scenarios: (a) 4.7–13.3%, (b) 14.0–40.0%, and (c) 23.3–66.7%.
Energies 18 02819 g007
Figure 8. Operating cost under different scenarios: (a) 4.7–13.3%, (b) 14.0–40.0%, and (c) 23.3–66.7%.
Energies 18 02819 g008
Figure 9. Composition and proportion of operating costs under different scenarios: (a) 4.7–13.3%, (b) 14.0–40.0%, and (c) 23.3–66.7%.
Energies 18 02819 g009
Figure 10. Relationship between operating cost and coal consumption.
Energies 18 02819 g010
Table 1. Values of n and bn.
Value of nOperational Load RangeValue of bn, g/kWh
110–20% of power unit capacity530
220–30% of power unit capacity440
330–40% of power unit capacity380
440–50% of power unit capacity340
5>50% of power unit capacity310
Disclaimer/Publisher’s Note: The statements, opinions and data contained in all publications are solely those of the individual author(s) and contributor(s) and not of MDPI and/or the editor(s). MDPI and/or the editor(s) disclaim responsibility for any injury to people or property resulting from any ideas, methods, instructions or products referred to in the content.

