Article

DI4SHE: Deep Learning via Incremental Capacity Analysis for Sodium Battery State-of-Health Estimation

by
Xikang Wang
1,2,
Bangyu Zhou
1,2,
Huan Xu
3,
Song Xu
4,
Tao Wan
4,
Wenjie Sun
1,2,
Yuanjun Guo
1,5,
Zuobin Ying
6,
Wenjiao Yao
1,3,* and
Zhile Yang
1,5,*
1
Shenzhen Institute of Advanced Technology, Chinese Academy of Sciences, Shenzhen 518055, China
2
College of Engineering, Southern University of Science and Technology, Shenzhen 518055, China
3
Advanced Energy Storage Technology Research Center, Shenzhen Institute of Advanced Technology, Chinese Academy of Sciences, Shenzhen 518055, China
4
State Grid Hunan Electric Power Co., Ltd. Research Institute, Changsha 410000, China
5
Guangdong Institute of Carbon Neutrality (Shaoguan), Shaoguan 512000, China
6
Faculty of Data Science, City University of Macau, Taipa 999078, Macau
*
Authors to whom correspondence should be addressed.
Energies 2025, 18(11), 2792; https://doi.org/10.3390/en18112792
Submission received: 22 April 2025 / Revised: 20 May 2025 / Accepted: 23 May 2025 / Published: 27 May 2025

Abstract

:
Sodium batteries have emerged as a competitive energy storage candidate due to their low cost and abundant resources. The accurate estimation of the state of health (SOH) of sodium batteries is essential for their practical utilization. However, limited cycling data and rapid capacity decay pose significant challenges for SOH prediction. This study proposes a data-driven approach for SOH estimation in sodium batteries. By analyzing first-cycle data, the method determines battery health factor ranges and extracts comprehensive features from limited charging data segments. A predictive model is then established using deep learning techniques, specifically a stacked, bidirectional, long short-term memory (SB-LSTM) network. Unlike conventional methodologies relying on filtering or curve smoothing, the proposed approach demonstrates exceptional robustness, particularly at high discharge rates of up to 5C. Moreover, it applies to a wider range of current rates and consumes fewer computational resources. The method’s effectiveness is validated on three different battery sets, achieving high accuracy with an average absolute error in SOH estimation below 0.86% and a root mean square error under 1.07%. These results highlight the potential of this data-driven approach for reliable SOH estimation in sodium batteries, contributing to their practical implementation in energy storage systems.

1. Introduction

1.1. Motivations and Literature Review

With the continuous increase in energy demand, the use of renewable-energy-powered electric vehicles has become an important means to achieve sustainable development. Sodium batteries, due to their relatively low cost, wide sources, and environmental friendliness, have become one of the most important candidates to replace traditional lithium-ion batteries (LIBs) [1,2]. The commercial application of sodium batteries has entered the countdown stage [3]. Recent review studies have emphasized the rapid advancement of sodium batteries technologies as a sustainable and scalable alternative to lithium-ion batteries. Wu et al. [4] provided a comprehensive summary of high-performance sodium batteries electrode materials, electrochemical mechanisms, and system-level innovations aimed at improving energy density and cycling stability. In parallel, Nekahi et al. [5] offered a broader perspective on the historical evolution and future potential of various rechargeable battery chemistries, highlighting the strategic role of sodium-based systems in the future electrification landscape. These developments reinforce the importance of accurate health estimation methods for sodium batteries as their commercialization accelerates. However, one of the crucial issues is the long-term stability of the battery’s SOH, which has important implications for the safety, reliability, and economics of the battery and, therefore, is the primary evaluation index of battery performance [6]. The SOH of the battery changes continuously over time and with the cycles of charge and discharge, making it essential to accurately estimate the SOH to enhance the reliability and the lifespan of the battery, in particular for BMS [7]. According to previous studies of LIBs, the SOH can be defined as the ratio of the battery capacity at the current moment to the capacity at the initial moment. The battery capacity can only be indirectly estimated through parameters like voltage and current [8]. Moreover, the capacity of sodium batteries decays not only during charging and discharging but also under idle conditions [9,10].
The methods for estimating the SOH of batteries can be classified into direct and indirect measurement. The former obtains the SOH by directly measuring parameters related to battery capacity degradation, including direct current pulse testing and EIS testing, which are widely used in battery aging research in laboratories [11,12]. Battery aging can also be observed through capacity attenuation and power attenuation. Smith et al. [13] assessed the ageing of commercial LIBs by a combination of EIS, microscopy, and a finite element model. Yi et al. [14]. proposed a reliable joint estimation scheme for battery SOC and SOH using reduced-order electrochemical models and dual nonlinear filters. However, these methods are suitable for laboratory use but not for commercial application.
In recent years, obtaining SOH-related parameters through indirect measurement has become more common, such as via incremental capacity analysis (ICA) and differential voltage analysis (DVA) [15]. ICA converts the voltage plateau related to the grading of the graphite anode on the charge–discharge voltage curve into distinct peaks on the incremental capacity (IC) curve by differentiating the battery charging capacity and the terminal voltage [16]. The concept of ICA originates from studying the lithium intercalation process and the corresponding staging phenomenon [17,18,19]. ICA can sense changes in battery behavior more sensitively than traditional charge–discharge curves, while also providing information related to the electrochemical characteristics of the battery [20,21,22]. Compared to direct measurement, it is more practical and efficient as features can be extracted from partial charge–discharge curves [23]. The existing related research is mostly on LIBs. Matthieu et al. pointed out that the emergence of IC peaks is closely related to the phase transition of the active material, which occurs in the course of the Li-ion intercalation or the deintercalation process [24,25]. Taking LiFePO4 batteries as an example, Jiang et al. pointed out that the third peak of the IC curve is closely related to LLI [26], which is considered to be the main cause of capacity degradation [27,28,29]. Therefore, this parameter effectively represents the battery’s aging level [30]. As sodium batteries are believed to undergo similar phase transitions during charging and discharging [31], predicting the SOH of sodium batteries using ICA and DVA is a potential method. However, existing studies have not adequately investigated the aging mechanism of sodium batteries and the open-circuit voltage–state of charge (OCV-SOC) curves of sodium batteries do not have a long voltage plateau compared to LIBs [32]. Xiang et al. [33] emphasized these differences through detailed electrochemical impedance spectroscopy (EIS) modeling and a regression-based SOH analysis. Therefore, the methodology of LIBs cannot be replicated for the selection of peaks in the IC curves of sodium batteries as model outputs.

1.2. Gap Analysis and Article Contributions

Indirect measurement methods are often combined with data-driven strategies to form effective SOH estimation models. Data-driven methods are popular in SOH estimation research, especially in electric vehicle (EV) battery management systems (BMSs). Gae-won et al. [34] proposed a data-driven method for real-time SOH monitoring, utilizing key BMS data such as current, voltage, and temperature, along with their historical distributions. This approach has been validated to deliver highly accurate results under real-world EV driving conditions. Machine learning (ML) technology is one of the data-driven methods and is widely used in battery state estimation. Deep learning is a branch of ML that utilizes neural networks for modeling and has a powerful prediction ability. Guang et al. [35]. employed machine learning and model-based methods for SOH estimation, integrating a neural network with a dual-extended Kalman filter to achieve lithium-ion battery health management. Jian et al. [36]. Used an ICA and back propagation (BP) neural networks to estimate battery SOH under varying ambient temperatures. Lin et al. [37] combined multi-feature and multi-model approaches to identify essential factors affecting battery aging by analyzing multiple data sources and then used multi-model fusion to estimate the SOH of lithium-ion batteries. Lewis et al. [38]. proposed a simple but effective estimation model for SOH estimation based on the extracted features via an artificial neural network. However, methods relying on ICA or DVA typically necessitate a complete or specific charging process for feature extraction. Batteries are often charged before they are completely depleted or the charging process terminates before reaching full capacity. Thus, achieving constant voltage (CV) charging and discharging may not always be feasible, preventing the extraction of features based on CV charging and discharging times. Additionally, there are situations where charging is prematurely halted before the IC curve reaches its zenith. These circumstances can lead to the disability to extract essential HIs. Consequently, it becomes imperative to construct a battery SOH estimation model based on partial charging processes.
Currently, there is limited research on the estimation of SOH for sodium batteries, and existing studies often refer to methods used for LIBs [39]. There are some challenges in establishing data-driven models specifically tailored for sodium batteries. The most obvious challenge is the limited availability of data, which hinders the effective training of certain ML models. Therefore, it is essential to conduct comprehensive testing of various ML models under such conditions to assess their predictive performance. Another issue is the high computational cost. ICA-based models heavily rely on the geometric features of the IC curve, such as the peak height, position, slope, and area [23,27]. These geometric features are closely related to battery capacity degradation and systematically shift as the battery ages. The quality of these geometric features determines the quality of HIs, and it highly depends on the accuracy of the sensors and measurement strategies. In practical analysis, the original IC curve is often smoothed and filtered to facilitate the extraction of HIs. Geometric features are then recalculated based on the filtered data for each cycle. Performing such operations repeatedly for each cycle significantly increases the computational burden.
To address these research gaps, this paper proposes an innovative approach that combines an ICA and SB-LSTM networks, called Deep Learning via Incremental Capacity Analysis for Sodium Battery Health Estimation (DI4SHE), for the accurate SOH estimation of sodium batteries. Specifically, the key contributions of the article are listed below.
(1) Extensive experiments were conducted to provide a brand-new dataset for various Na-based cathode materials and full sodium-ion cells under different charge–discharge current rates.
(2) Based on an incremental capacity analysis and a Pearson correlation coefficient analysis, a convenient method for extracting health indicator features was proposed by combining the incremental capacity curve, correlation coefficient, and specific voltage range.
(3) The DI4SHE model was put forward, integrating an incremental capacity analysis with bidirectional long short-term memory networks for the accurate state-of-health estimation of sodium batteries, and its accuracy was validated through comparisons with other machine learning algorithms.
The remainder of this paper is organized as follows: Section 2 presents the extraction of HIs based on ICAs from experimental data on sodium batteries. Furthermore, it investigates the relationship between these HIs and the battery’s initial cycle. In Section 3, a comparison is made between the predictive performance of the classical HIs and the proposed HIs on different batteries. Subsequently, an SOH estimation model is established using deep learning algorithms and classical ML algorithms, the accuracy of which is then compared.

2. Experimental Data and Feature Extraction

In this work, five types of sodium batteries were made and tested. Table 1 provides the technical details related to the battery. Cathodes were prepared following previous studies [28], and other components of the cells were used as purchased. Coin-type cells were constructed in an Ar-filled glove box. Electrochemical tests were performed on a NEWARE CT-4008 system. Considering that the battery charging and discharging protocols significantly impact battery degradation, three different rates—1C, 2C, and 5C—were applied. Cells B1–B3 are coin-type half-cells with sodium metal anodes, while B4 and B5 are full-cells with hard carbon anodes. In this work, we refer to B1–B3 as “sodium–metal batteries” and to B4–B5 as “sodium-ion batteries” for clarity and consistency in terminology.

2.1. Data Description and Analysis

Further, the data were divided into five groups according to charging and discharging. The data were recorded at ten-second intervals, stopping when the battery capacity declined to 60% of its initial value. Each record captured relevant information, primarily including the cycle count, step index, timestamp, voltage, current, capacity, and specific capacity (mAh/g). The specific capacity in this study was calculated based on the total mass of the assembled coin cell. The SOC is an essential parameter for battery state estimation. It can be obtained by integrating the current over time. Several features can be created with the above data combinations, such as IC and differential voltage. They can be described as follows:
I C = Q V
D V = V Q
where I C represents the incremental capacity, D V represents the differential voltage, Q represents the capacity, and V represents the voltage.
Figure 1 illustrates a set of battery experimental data containing information such as current and voltage. It can be observed that the IC curve exhibits significant high-frequency noise. The cause of this phenomenon is the short sampling time, which often requires the incorporation of downsampled charge curves to filter out high-frequency noise. However, downsampling has its evident drawbacks, as certain crucial features may be lost, and it fails to capture certain high-frequency components. Moreover, if aliasing occurs, it can even introduce false low-frequency components.

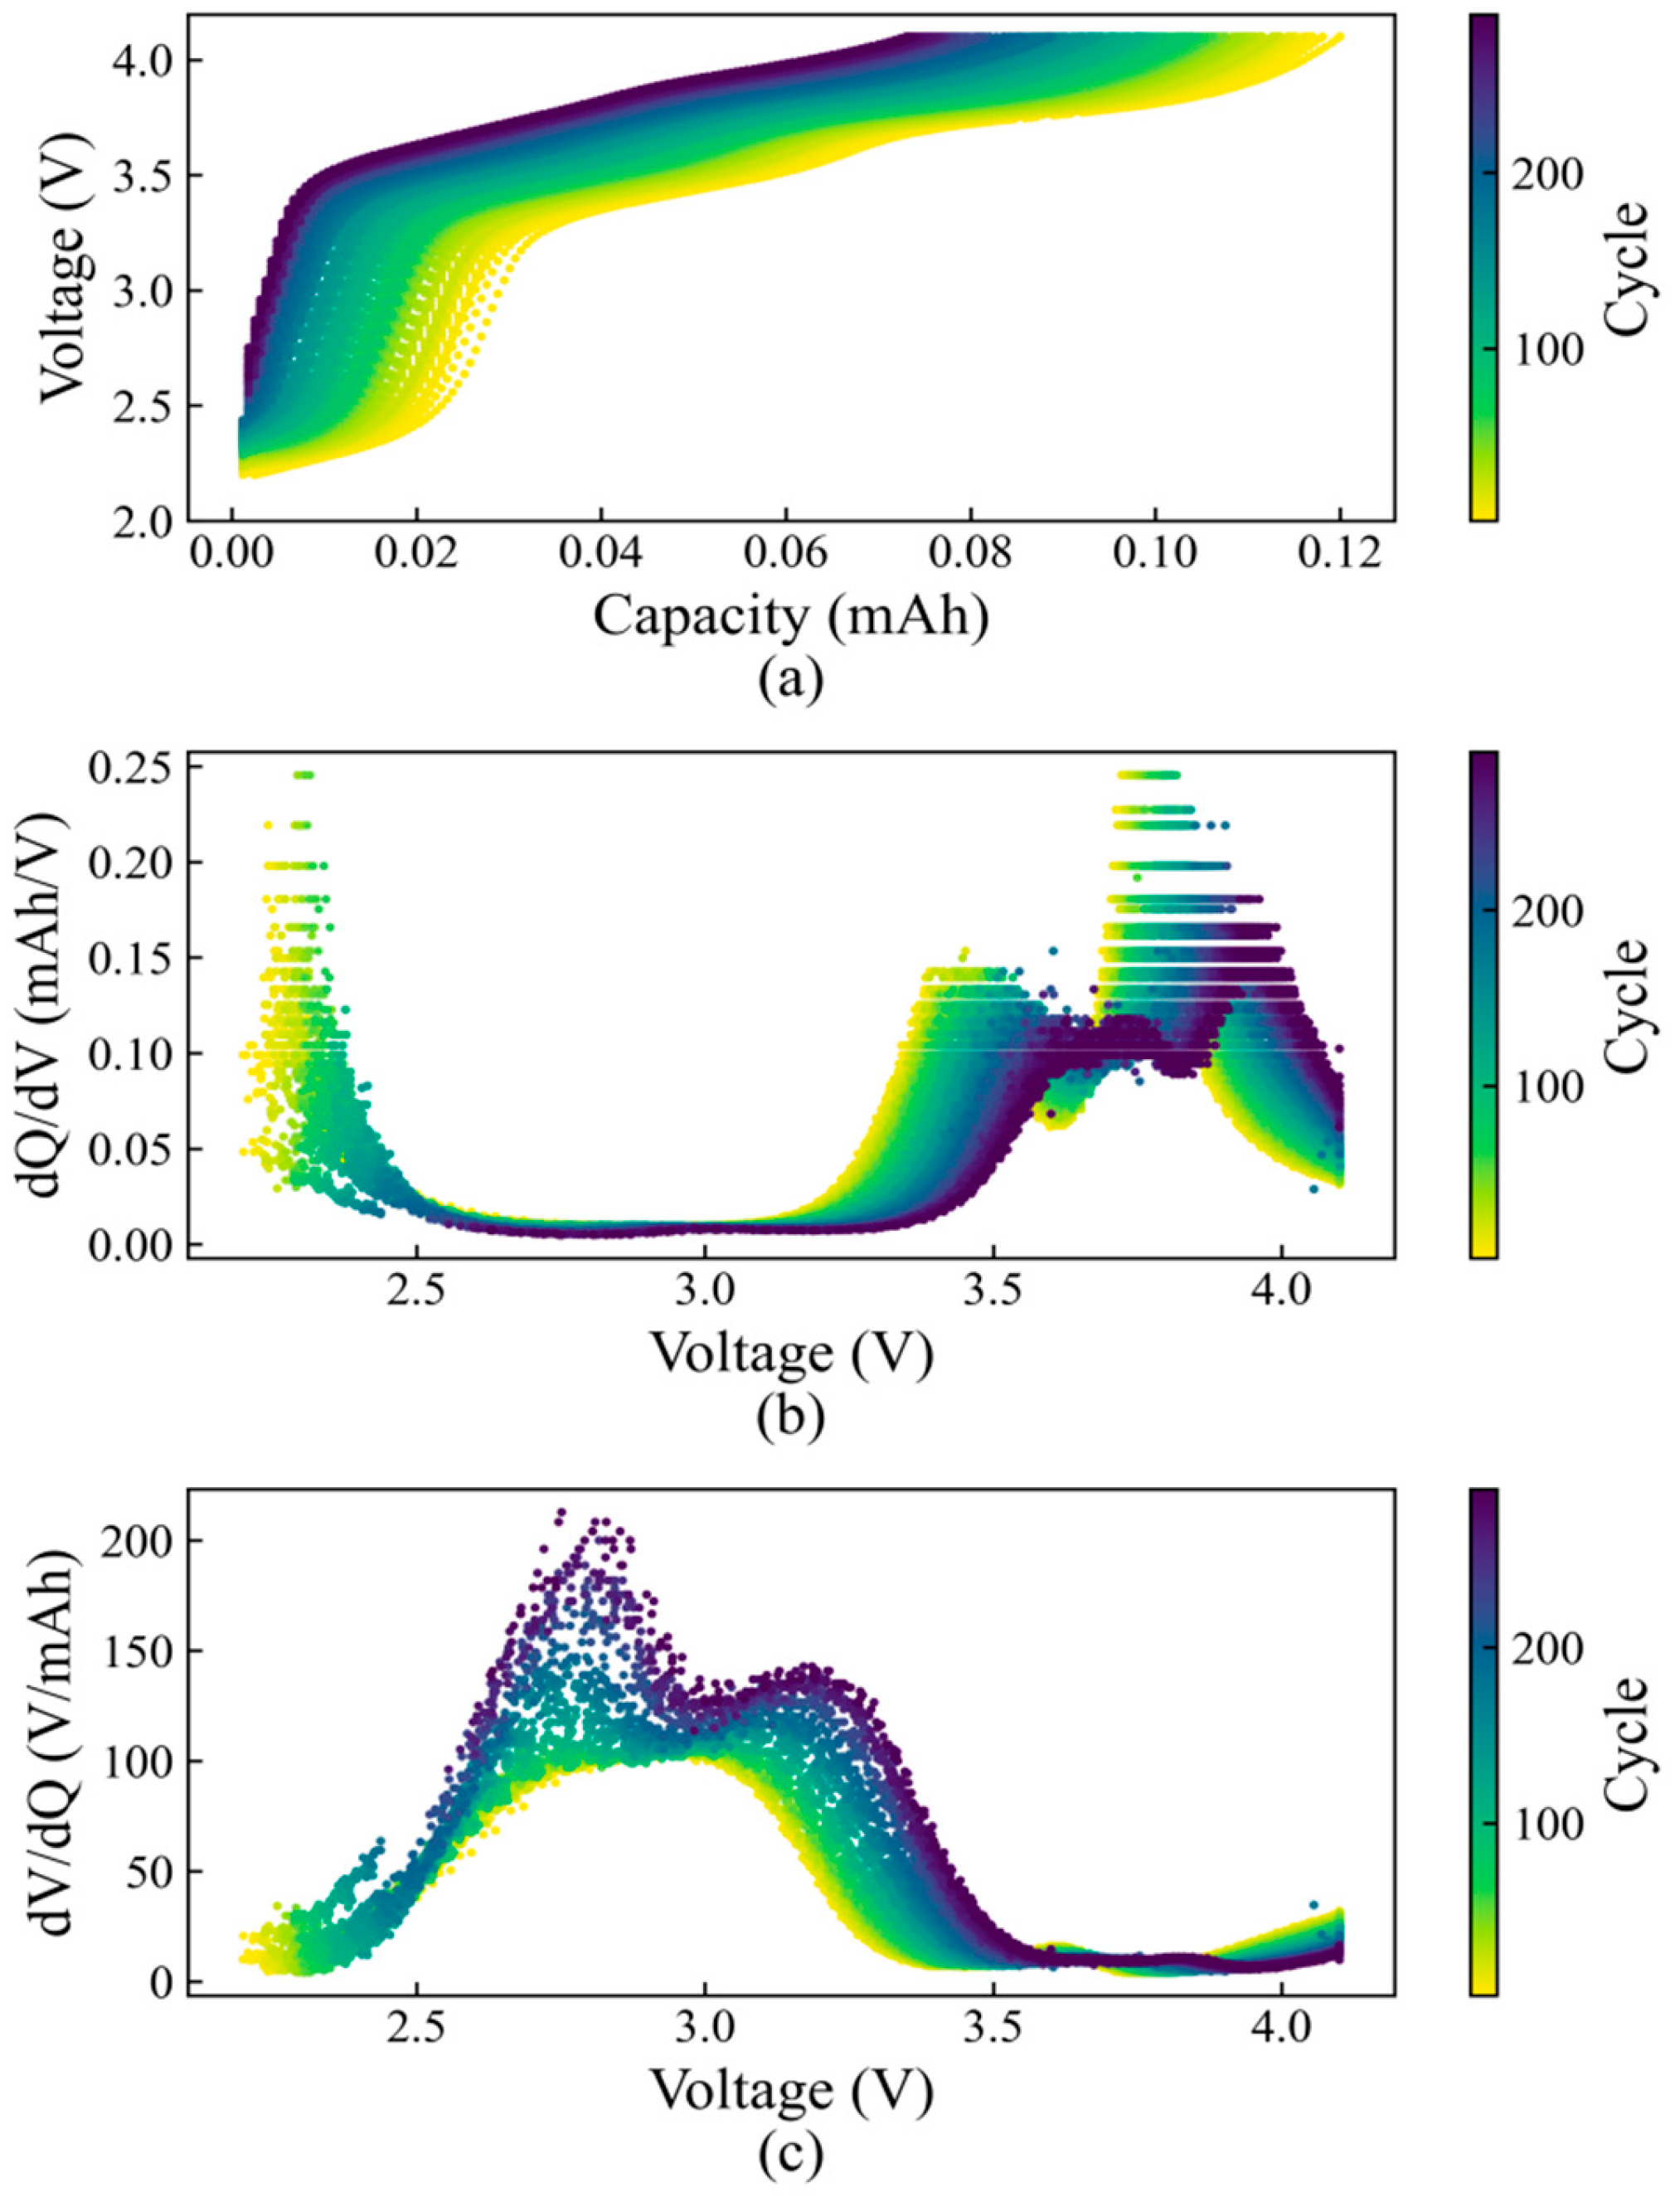
2.2. Feature Extraction from IC Curve

Figure 1b shows the ICA of B3 under different cycles. In the range of the voltage greater than 2.5 V, the IC curve has two peaks, and the lower peak can be called the secondary peak. In the voltage interval near the secondary peak, the IC curves show stratification across different cycles and shift toward the lower right as the cycle count increases. Such may be caused by the loss of electrode active material. Based on this, some features are extracted within this area, including the area and the height of the peak. The peak height is the maximum value of this interval, and the peak area is the integral of the IC of this interval to the voltage; that is, it is the change of the capacity in this interval. The detailed algorithm for HI extraction can be found in the “ICA for HIs Extraction” section of Algorithm 1.
The physical meaning of the SPA refers to the amount of capacity change within a certain voltage range. The key to obtaining the SPA lies in determining the specific voltage range, such as the capacity change within 3.3–3.5 V, which can indicate the SOH of the battery. The geometric meaning of SPA refers to the area between the secondary peak curve and the horizontal axis of the IC curve during the first cycle, when the battery has not degraded. Previous studies on the IC curves of LIBs typically utilized a mathematical method to calculate the peak area for each cycle [29]. However, the peak area described in this paper refers to the peak area of the IC curve during the first cycle of the battery. Based on the secondary peak area, key features can be extracted: the upper and lower voltage boundaries corresponding to the peak area. This study demonstrates that in all subsequent battery cycles, the amount of charge required to charge the battery from the lower voltage boundary to the upper voltage boundary can accurately estimate the battery SOH as an HI.
The choice of the secondary peak as the focus of the HI is primarily driven by three key factors. Firstly, within the IC curve of the tested batteries, higher peaks appeared at higher voltages, imposing more constraints on feature extraction. Limiting the upper cut-off voltage avoids rapid capacity degradation and the rapid reduction of battery life. Therefore, reducing to a lower cut-off voltage can result in a higher capacity. However, when the voltage range is too low, although the battery can obtain a higher capacity, it is accompanied by unsatisfactory cycle stability and a low energy density [32]. Secondly, charging the battery to higher voltage levels accelerates battery degradation, which is associated with changes in the electrode structure. Therefore, battery management systems do not recommend consistently reaching full charge, as this would expedite battery deterioration. This implies that extracting the highest peak as the HI would hasten battery degradation. Furthermore, it should be noted that the peaks on the IC curve of the battery shift continuously to the higher voltage with battery degradation. Towards the end of the battery’s lifespan, the voltage corresponding to the highest peak may reach or exceed the upper voltage threshold. This means that the extracted peak area becomes incomplete. Taking all these factors into account, if both primary and secondary peaks can serve as HIs, it is more suitable to choose the peak with the lower corresponding voltage as the HI. This approach facilitates obtaining comprehensive information conveniently and does not harm the battery.
The SPA corresponds to a specific voltage range that does not change with battery degradation, making it applicable throughout the entire lifespan of the battery. This voltage range is typically less than 0.3 V and approximately within the 30–60% range of the charge level. Within this range, another feature can also be extracted: the SPIC as the HI, which is the maximum value of the IC curve for each cycle within the selected voltage range. It is important to note that in the early cycles of the battery, the secondary peak falls within the chosen voltage range, and at this point, the maximum value of the curve in that range is indeed the peak value. As the battery decays, the secondary peak may not be within the voltage range, and the maximum value of the curve in this range is not the peak, but smaller than the peak. Although the SPIC is not the secondary peak in every cycle, they are the same in the early cycles of the battery.
B1, B3, and B4 batteries are used as case studies to extract potential HIs. After the features are extracted, they are compared with the SOH, and the PCC is used as the evaluation index. Figure 2 shows the results of the experiment, with the upper voltage representing the upper limit voltage of the selected voltage range. This value and the lower limit voltage form the voltage range, which is represented by the colored bar. Each scatter represents the degree of correlation between the HI and the SOH extracted within a specific interval. In (a)~(c), the extracted HI is the area surrounded by the IC curves of different voltage ranges. The HI extracted from (d)~(f) is the maximum IC curve of the corresponding voltage range.
The smaller the voltage range required to extract the HI, the less time and data are needed to complete the measurement. In Figure 2, a higher position and a redder color indicate the better quality of the extracted HI. From the perspective of convenient feature extraction, if the scatter plot of different colors concentrates around a certain upper voltage value, it implies that the voltage range with the voltage as the upper limit is not sensitive to the lower-limit voltage and has stronger robustness. For example, in Figure 2a, within the voltage range of 3.4–3.5 V, decent HI results can be obtained. Figure 2a–c, using the IC curve area as the HI, exhibit a distinct characteristic: there is a concentration of scatter points around a certain upper voltage, and as the upper voltage deviates from this concentration region, the scatter points gradually disperse. Figure 2d–f, using the maximum value of the IC curve as the HI, show similar characteristics. Subsequent research will further explore the connection between the voltage range used for extracting the SPA and the IC curve of the battery.

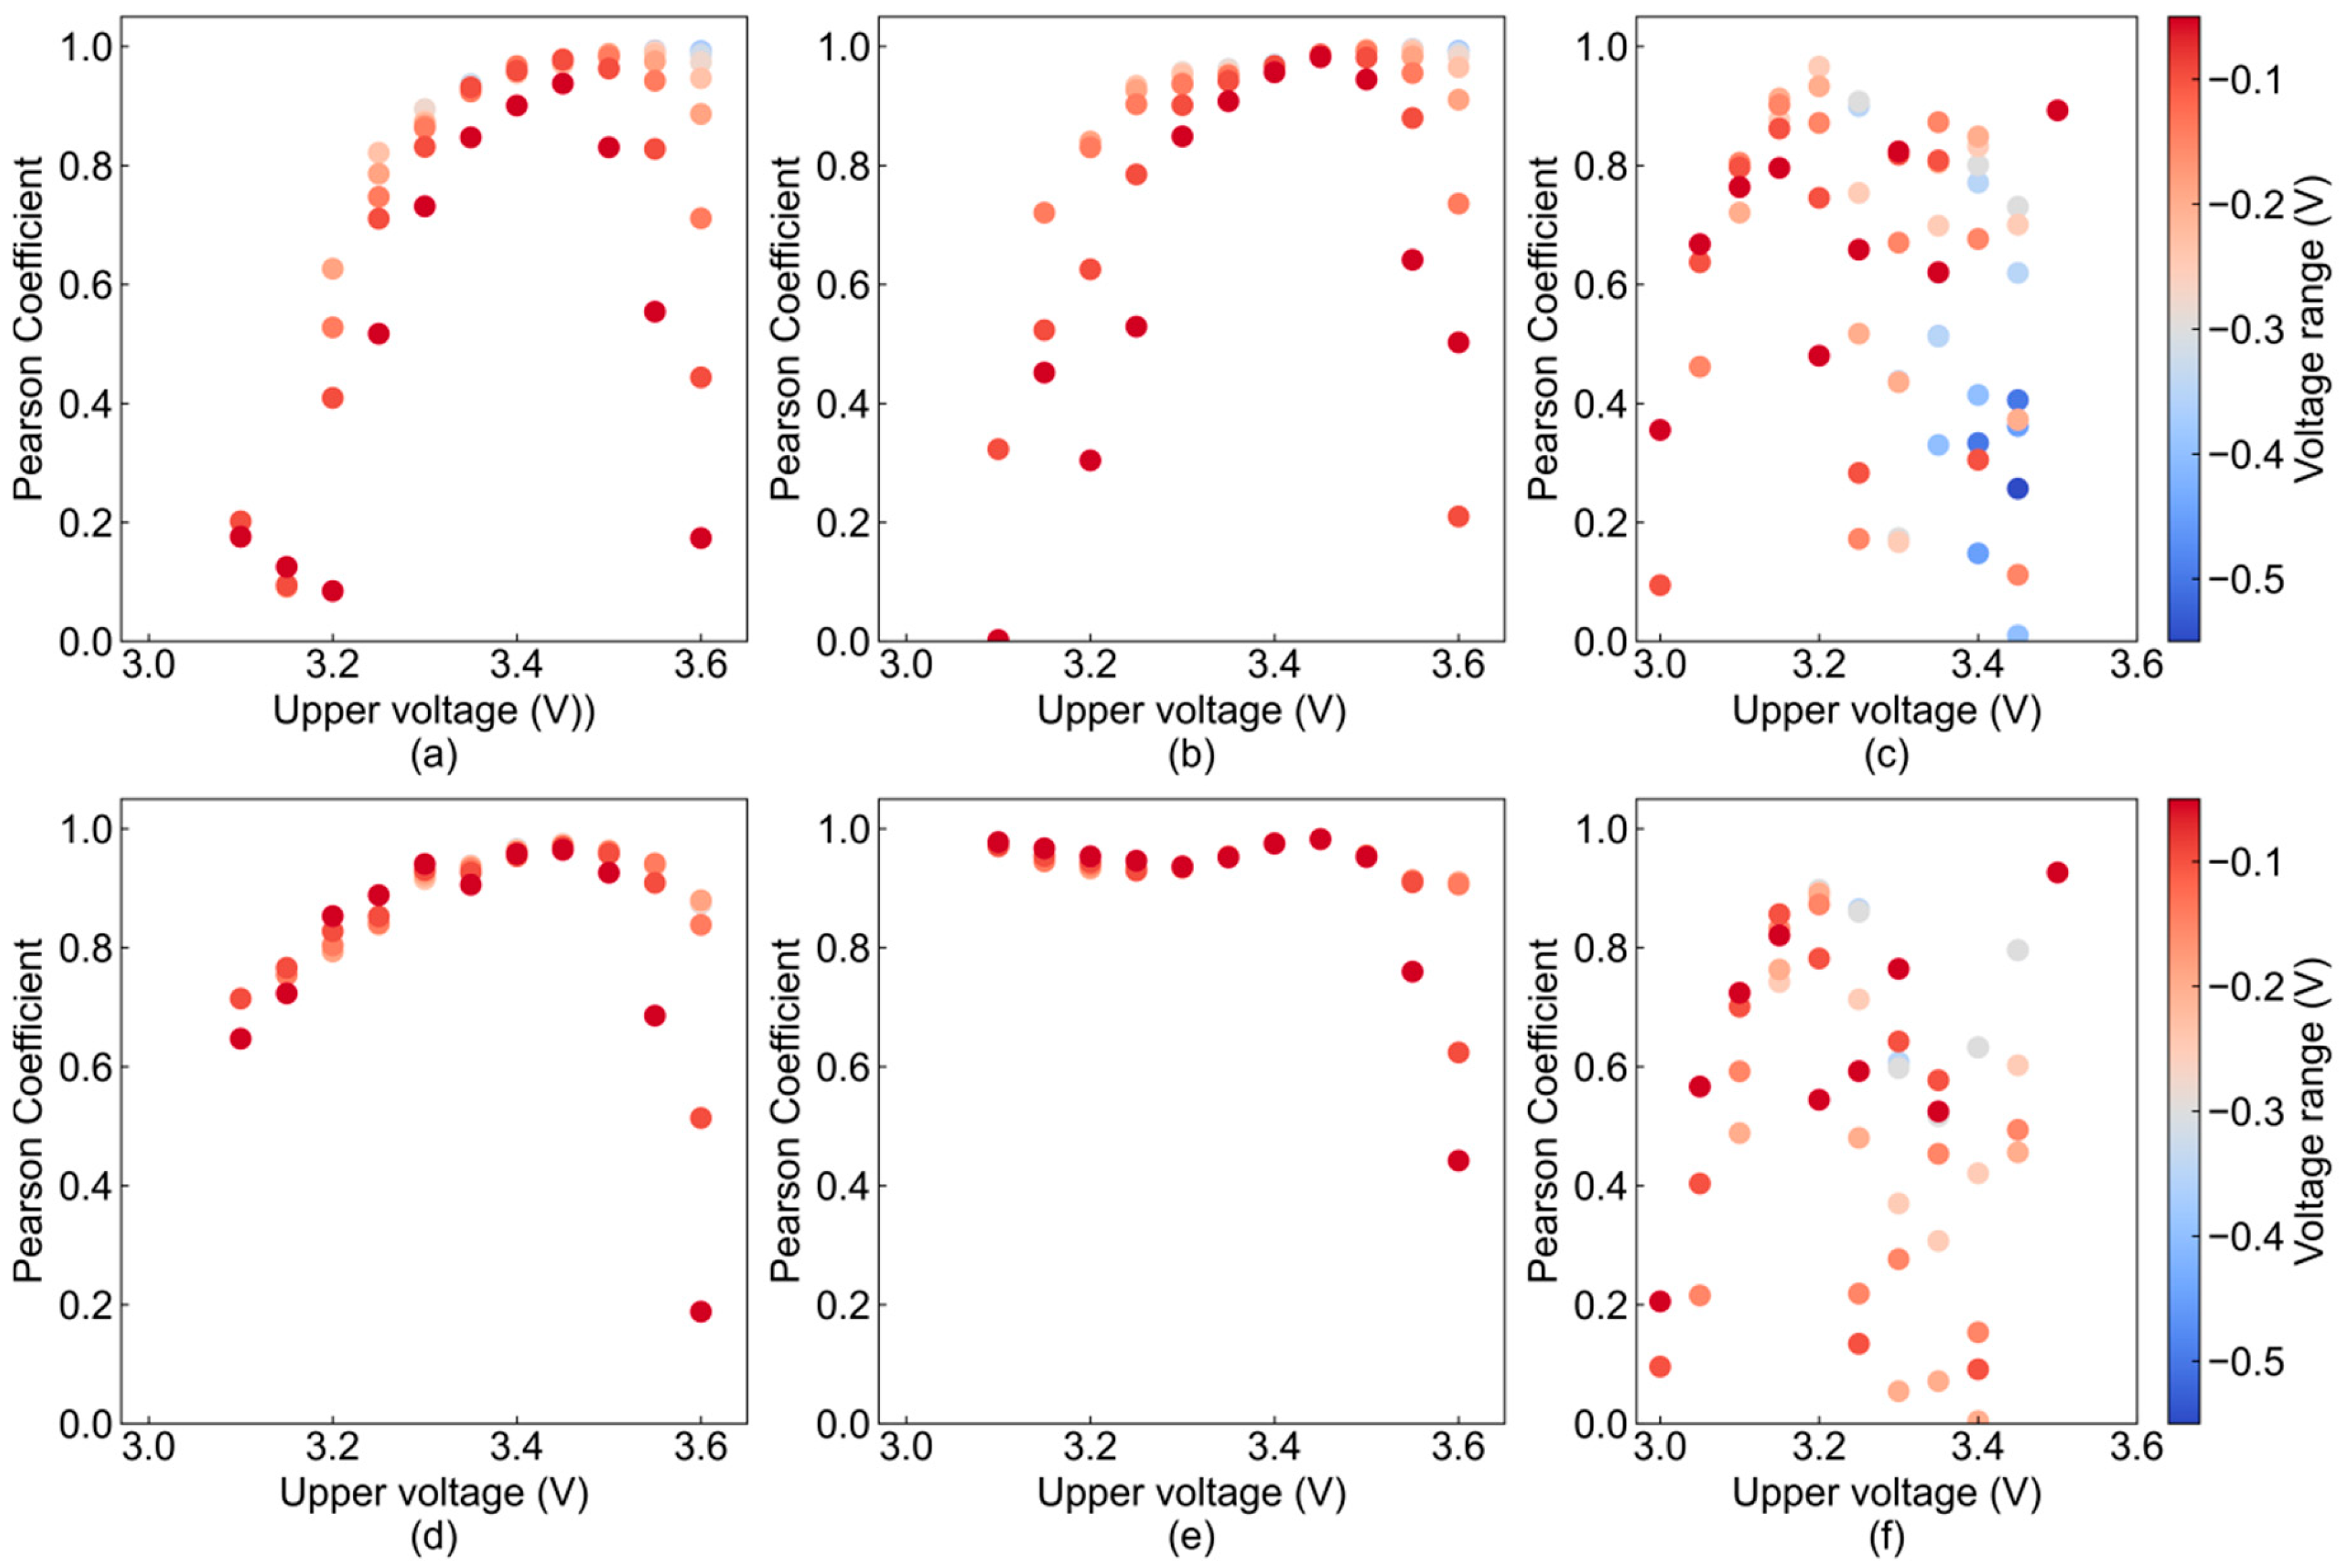
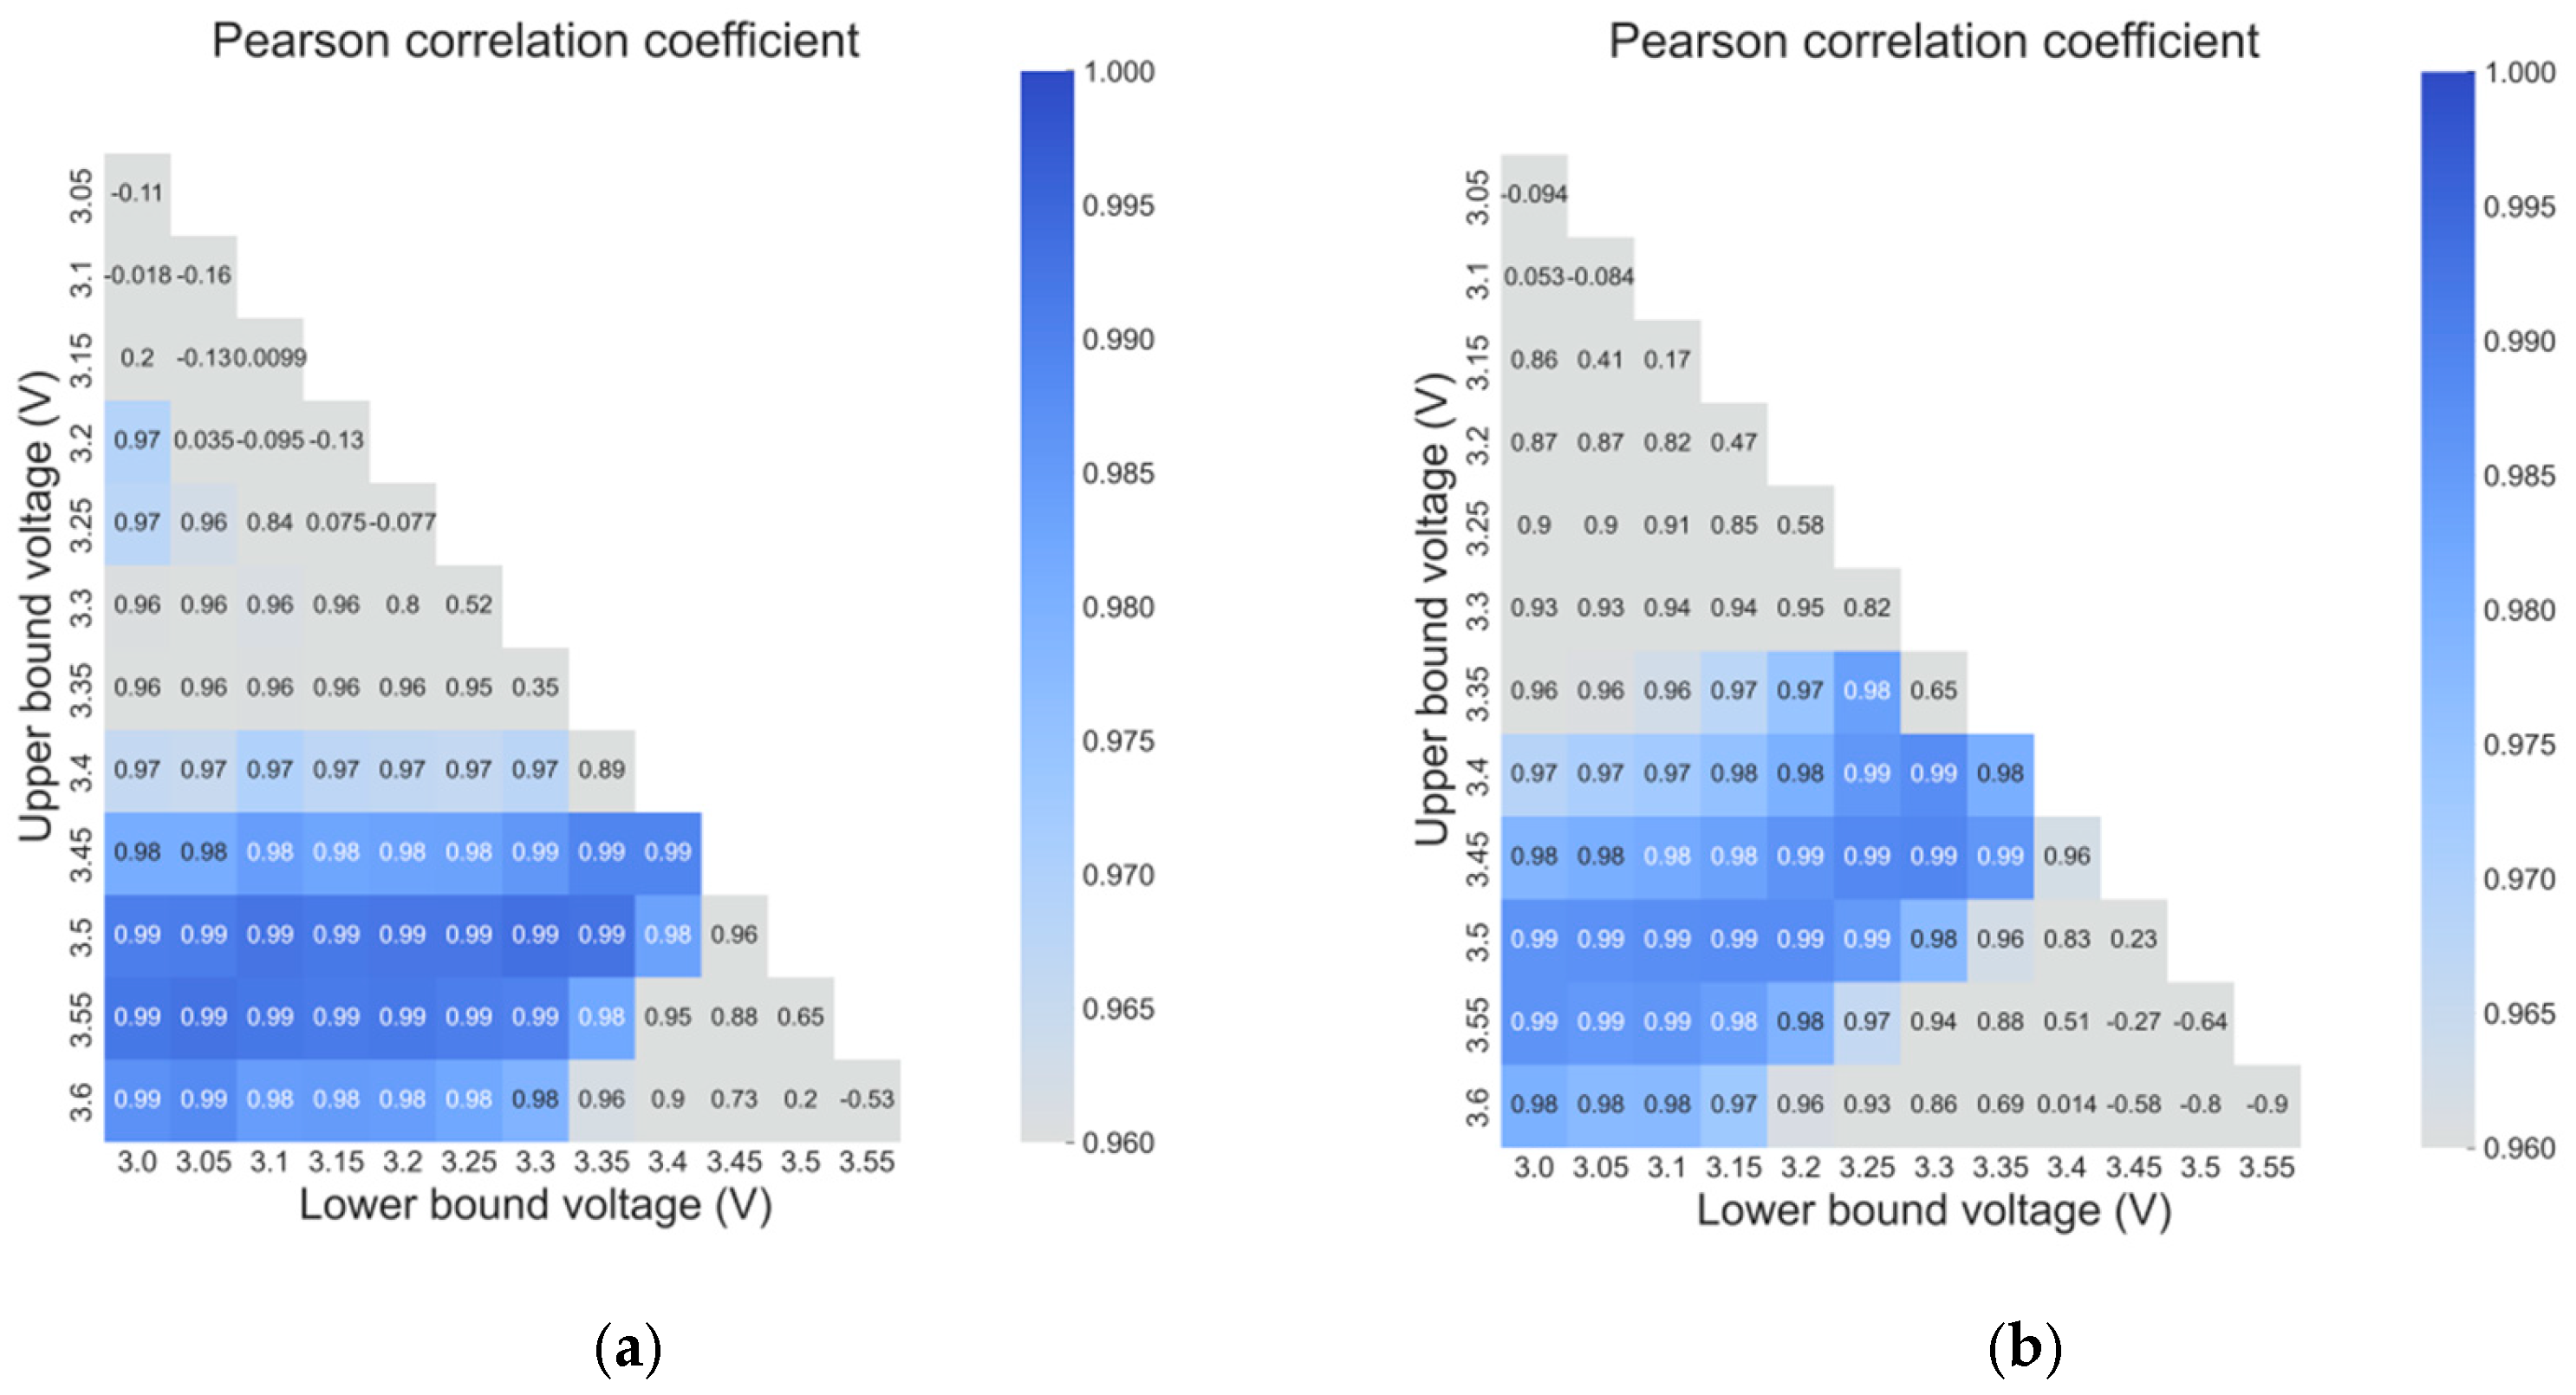
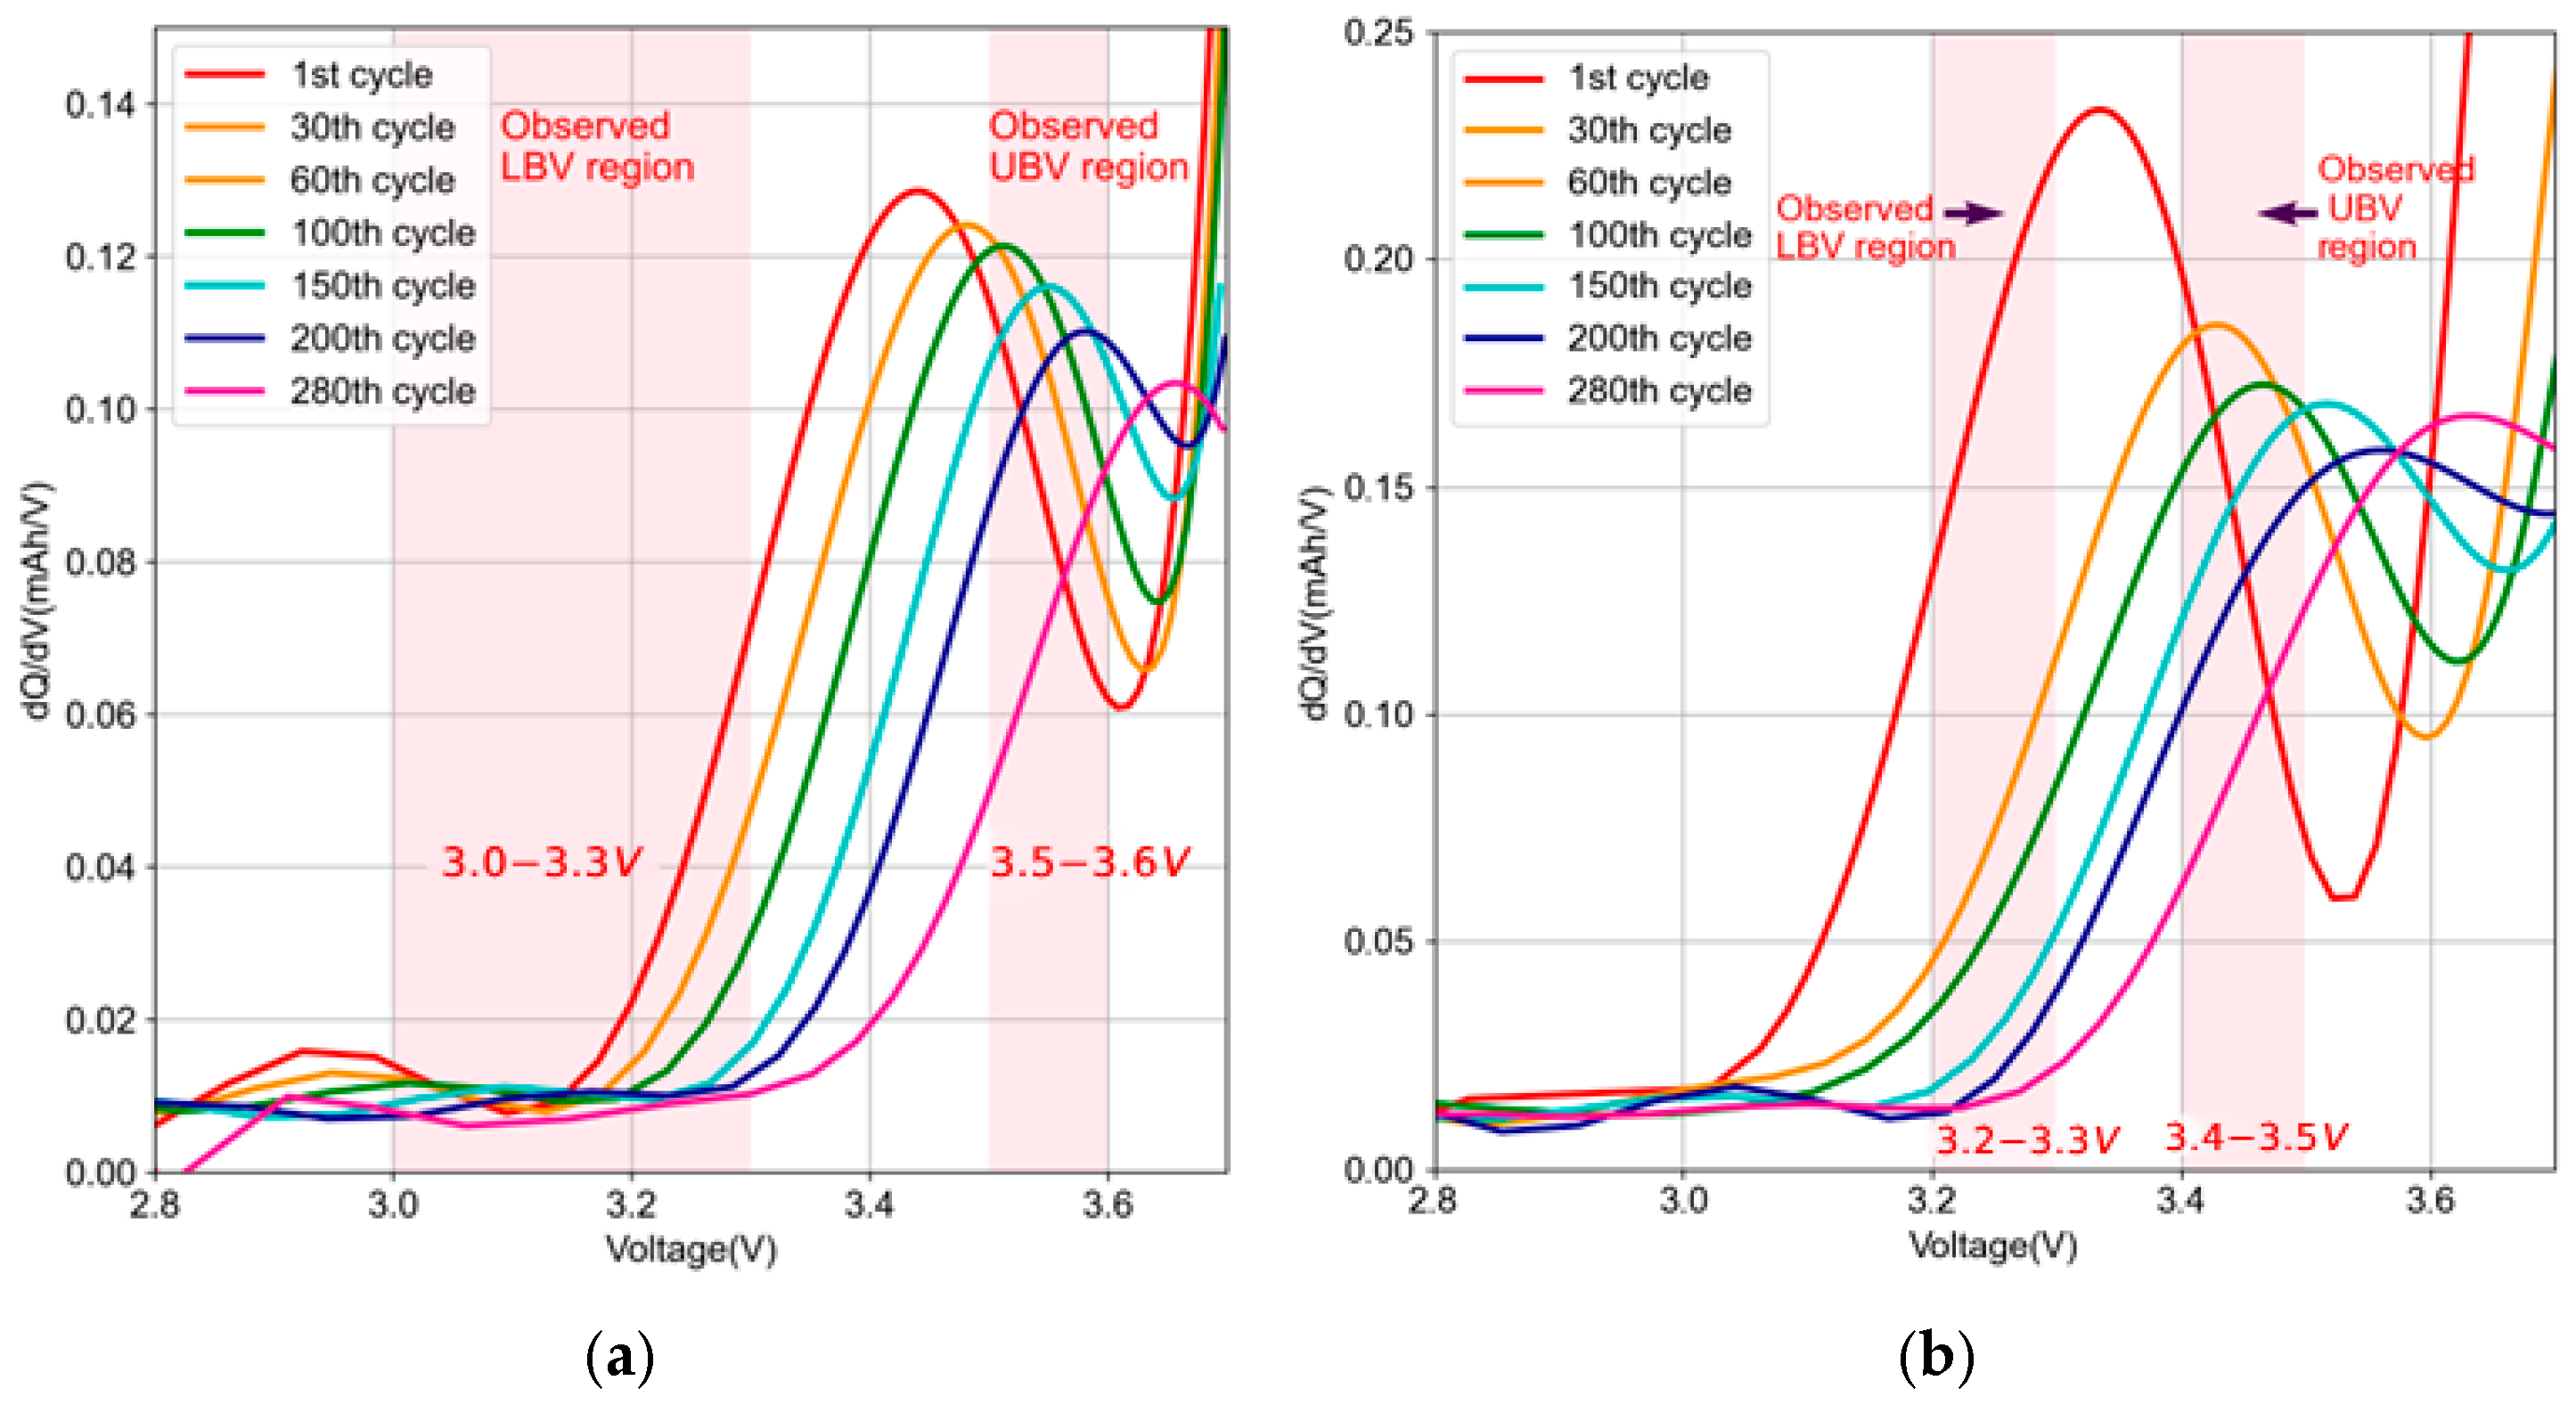
2.3. Voltage Range Determination

The SPA was found to be highly correlated with the SOH, while the appropriate voltage range needs to be determined to reduce the difficulty of estimation. This section will introduce in detail the voltage range for obtaining the SPA through the first cycle of the sodium battery. Taking B2 and B3 as examples for the analysis, the range of the SPA voltage is limited to 3.0–3.6 V and divided into 156 groups for testing.
Figure 3 presents the test results, with the correlation coefficient of SOH-SPA serving as the evaluation index. In the B3 experiment, a voltage range of 3.3–3.5 V yielded the highest correlation coefficient of 0.994, whereas the worst-performing set of experiments occurred within the voltage range of 3.0–3.4 V, with a correlation coefficient of only 0.965. Due to limitations in the sampling frequency, further narrowing of the voltage range could negatively impact accuracy. Therefore, a 0.1 V interval was chosen as the minimum voltage range. Figure 3 demonstrates that the UBV significantly impacts the correlation coefficient, with values that are either too low or too high leading to a reduced SPA quality. Additionally, the LBV also has a certain influence on the SPA quality, particularly when the LBV reaches 3.4 V, where the extracted SPA no longer exhibits a linear relationship with the SOH. However, within the 3.0–3.3 V range, the impact appears to be relatively small. Although the voltage range was determined based on the analysis of cells B2 and B3, which represent two distinct cathode chemistries and test conditions, the same voltage window was subsequently applied to all the other batteries used in this study, including B1, B4, and B5. For these cells, the secondary peak location in the first cycle served as the basis for applying the pre-selected window. As demonstrated in later experiments, the model maintained a high estimation accuracy across different chemistries and both the half-cell and full-cell configurations. This confirms the general applicability and robustness of the proposed voltage range selection rule.
For further verification, different cycles were plotted in Figure 4. The shaded part indicates the appropriate voltage range. It can be seen from Figure 4 that as the number of cycle increases, the peak value decreases, and its position gradually moves to the higher voltage. Combining the results presented in Figure 3 and Figure 4, from the perspective of the correlation coefficients of the SPA and the SOH, it can be considered that the LBV cannot be higher than the PSF. In addition, the selection of the LBV is also related to the UBV. Observing Figure 3, when the ordinate is determined, the relationship between the correlation coefficient and the abscissa is predictable. Specifically, when the UBV is 3.6 V, a higher correlation coefficient can be obtained when the LBV gradually approaches 3.0 V from 3.3 V.
On the contrary, when the ordinate is 3.4 V, the correlation coefficient decreases as the abscissa moves from 3.3 V to 3.0 V. It is worth noting that Figure 3b shows that when the UBV is set to 3.5 V, the LBV has almost the same results at 3.2 V and 3.0 V, and the correlation coefficients are 0.988 and 0.987, respectively. The above experiments show that if there is an optimal solution for the voltage range required to calculate the SPA, then its UBV and LBV have a coupling relationship. Intuitively, the relative positions of the UBV and the LBV to the PSF determine the quality of the extracted features. A combination of the UBV being far from the PSF and the LBV being near the PSF always leads to poor results. However, simply combining an LBV and a UBV that are close to the PSF does not necessarily guarantee good results. For instance, in Figure 3a, setting the LBV to 3.25 V or 3.35 V is not as effective as 3.3 V. This shows that although we know within a specific voltage range that the SPA can maintain a linear relationship with the SOH, it is difficult to find the optimal voltage range. In general, it follows a basic rule: the LBV and the UBV should be set on both sides of the secondary peak value of the first cycle and should be within the monotonic range on both sides. This can be easily verified. If the UBV exceeds the monotonic decreasing interval of the first cycle in Figure 5, the SPA will no longer maintain a linear relationship with the SOH.

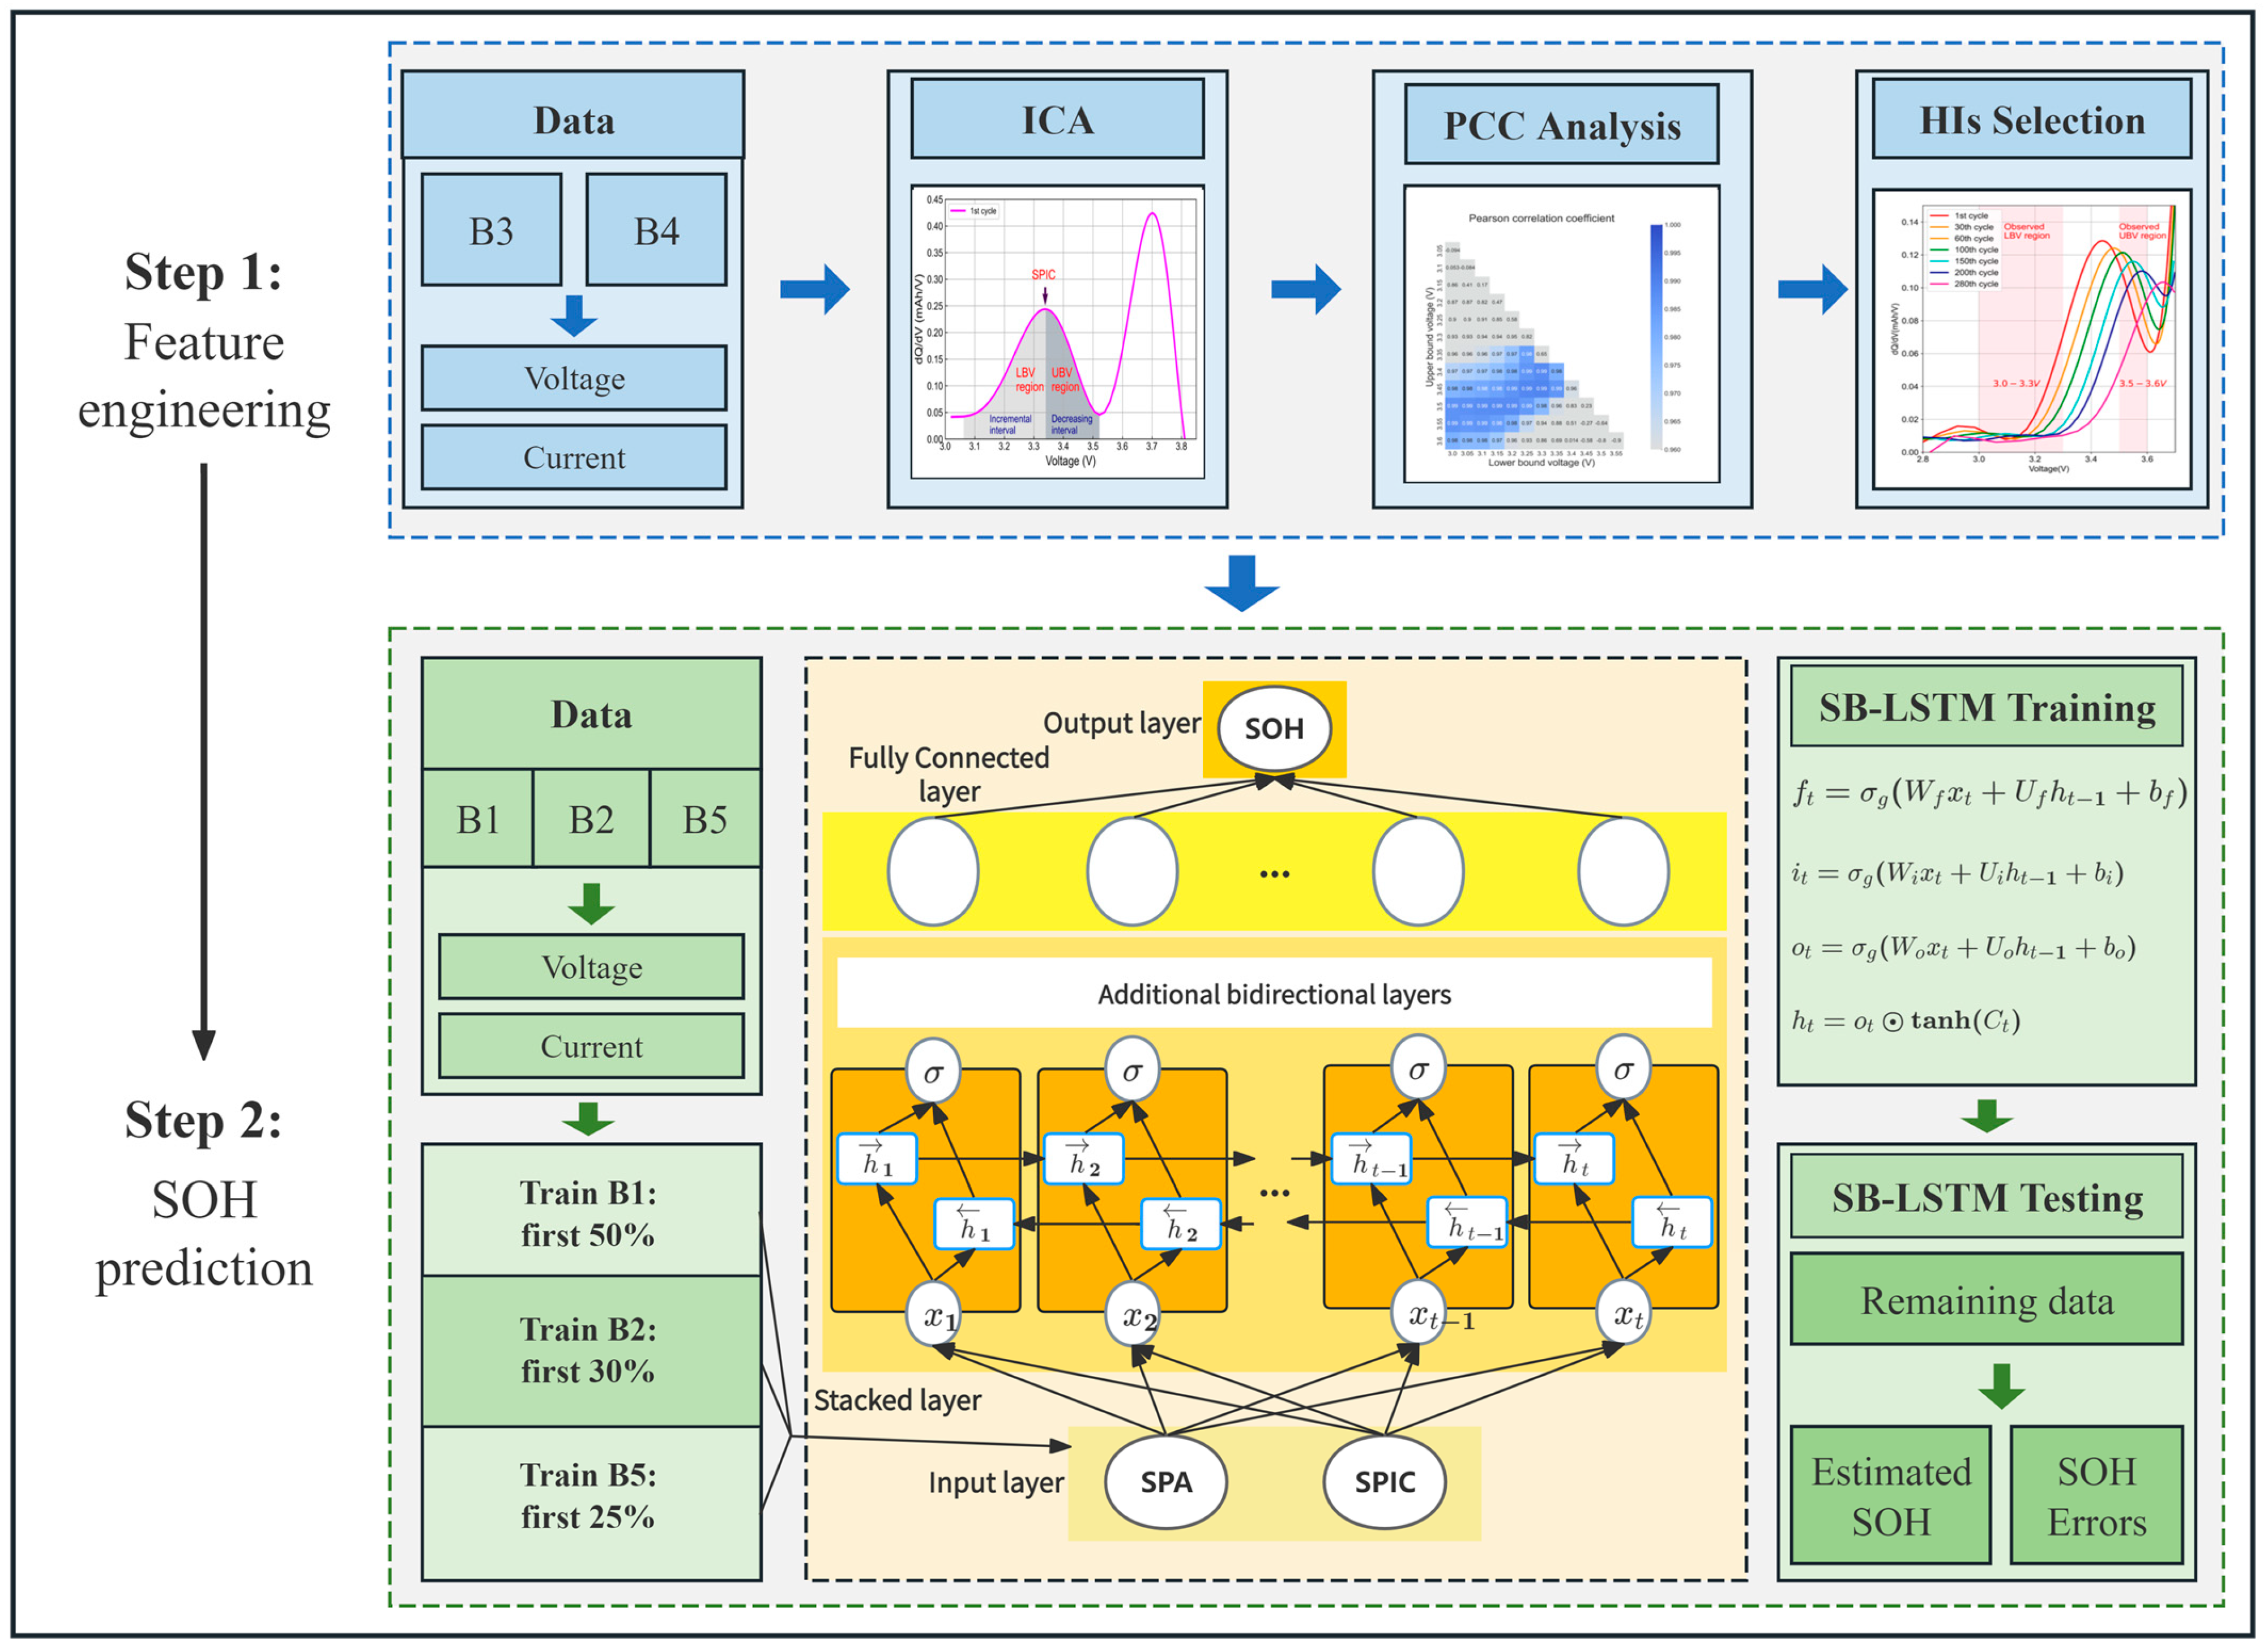
2.4. The Process of Establishing the SOH Estimation Model

The experiment comprised three main steps, as illustrated in Figure 6. The first stage was feature-engineering, where appropriate battery data were selected for the data analysis. In this experiment, the B3 and B4 battery datasets were chosen for feature engineering, analyzing the characteristics of the IC curves, and determining the extracted features based on the Pearson correlation coefficient. After extracting the features as HIs, their characteristics were combined with the original IC curves to identify the relationship between HIs and voltage ranges, facilitating the identification of the most suitable voltage range for the estimation.
In the second stage, the SOH estimation model was constructed for the sodium batteries’ SOH estimation. Prior to this, a comparison of different features’ prediction performances on B2 and B4 batteries was conducted, which will be discussed later in the article. Subsequently, the SOH of batteries B1 to B5 were predicted. The training was performed using 50% of the B1 dataset, 30% of the B2 dataset, and 25% of the B5 dataset, while the remaining dataset was utilized for the prediction. The accurate estimation model was established using the SB-LSTM algorithm, and regression metrics, such as MAE and RMSE, were used to evaluate the model’s accuracy. The detailed algorithm flow of DI4SHE can be seen in Algorithm 1.

2.5. Method and Evaluation

The RNN is a neural network designed for handling sequence data. Unlike traditional neural networks, it can effectively handle data with sequential variations. LSTM, a variant of RNNs, is less prone to gradient vanishing and explosion, making it more effective in handling longer sequences [30].
LSTM operates with two transmission states, c t (cell state) and h t (hidden state). The c t changes slowly, and the h t often shows considerable differences across various nodes. LSTM has structures called “gates” to remove or add information to the cell state. A gate lets information through selectively and is composed of a sigmoid neural net layer and a pointwise multiplication operation. The following formula defines the sigmoid function:
σ ( x ) = 1 1 + e x
An LSTM cell consists of a forget gate, an input gate f , a control gate c ~ , and an output gate o. The forget gate is responsible for balancing the reservation and discarding of past memory cell information, with its output ranging from 0 to 1, indicating the degree of discarding and reserving, which is defined as follows:
f t   = σ W f × h t 1 , x t + b f
The input gate determines what information can pass through the cell, which is defined as follows:
i t = σ W i × h t 1 ,   x t + b i
The control gate decides to update the cell state from c t 1 to c t , which is determined by the following formulas:
c ~ = tanh W c × h t 1 ,   x t + b C
c = f t c t 1 + i t c ~
The output gate decides what information to output, including the hidden state h t 1 , which is defined as follows:
o t = σ W o × h t 1 , x t + b o
h t = o t tanh c t
In Equations (3)–(7), W is the weight matrix, b is the bias vector, and represents the element product.
The core concept of a bidirectional LSTM is to use two LSTM networks during training, which share the same output layer. However, the two networks process the sequence in opposite directions, enabling the output layer to obtain complete past and future information for each position in the input sequence. In various time series data processing tasks, bidirectional neural networks are always better than unidirectional neural networks. This is because whether a simple RNN or an LSTM is used, the earlier input information will be more or less forgotten. If the LSTM reads the input information from left to right, the last state, h t , may forget the input information on the left. If the RNN reads the input information from right to left, the last state, h t , may forget the input information on the right. Combining the two allows the model not to forget the input information read first.
SB-LSTM extends the standard LSTM model by using two LSTM networks to process the input data. Stacking two layers of bidirectional LSTMs can form an SB-LSTM structure. Each time the LSTM reads a new input, x t , a set of state vectors, h t and c t , are generated as the output at the current moment and the input state at the next moment. The N inputs, x 0 and ~ x N , are input to the LSTM, and N sets of outputs will be generated accordingly. The N groups of state vectors output by the first layer of the LSTM can be used as the input of the second layer of LSTM. The second layer of the LSTM has independent parameters and reads N state vectors from the first layer of the LSTM to generate N groups of new outputs.
The SOH of a battery is a set of time series data, and the SOH at each moment is related to the SOH at the last moment and the next moment. The bidirectional recursive structure facilitates the model to obtain time series data from forward and backward. Therefore, this paper proposes a method for estimating the SOH using an SB-LSTM.
The direct input to the model consists of two parameters, the SPIC and the SPA, which can be represented as ω t = P t , A t | t = 1 , , T . The training dataset can be represented as ω t , S O H t , where S O H t represents the measured value of SOH at time t. For better results, the activation function of the model is set to the rectified linear unit (ReLU), whose formula is
f x = max 0 ,   x
Since SOH estimation is a regression problem, the loss function is set to the mean squared error (MSE):
M S E = 1 n i = 1 n Y i y i 2
The evaluation of all the models is based on the RMSE and the MAE:
R M S E =   1 n i = 1 n Y i y i 2
M A E = 1 n i = 1 n Y i y i
Y i ,   y i represent the observed and predicted values of the SOH, respectively.
The bidirectional structure of the SB-LSTM enables acquiring both historical and future data for predicting the current time result, which is more effective in modeling long sequences. In contrast, a unidirectional LSTM performs relatively poorly on longer sequences. The two-layer structure of the SB-LSTM allows the model to learn higher-level feature representations, enhancing its representation capability so that it can learn more complex patterns [29]. In addition, benefiting from the two-layer bidirectional network architecture, the multi-step prediction performance of the SB-LSTM was also superior to the LSTM. The SB-LSTM-based SOH estimation algorithm can be seen in the “SB-LSTM for SOH Estimation” section of Algorithm 1.
Algorithm 1: The algorithm flow of DI4SHE
Input: Battery charging data (voltage, current, capacity, time)
Output: Estimated SOH
ICA for HIs Extraction
 divide data into cycles();
 first cycle = data [0];
 IC_curve = diff(first_cycle.capacity) / diff(first_cycle.voltage);
 secondary_peak = find_secondary_peak(IC_curve);
 voltage_range = determine_voltage_range(secondary_peak);
 for each sub_range in voltage_range do
   SPA = calculate_area(sub_range);
   SPIC = find_max_IC(sub_range);
   correlation = calculate_PCC(SPA, SPIC, SOH);
 optimal_range = range_with_max_correlation;
 for each cycle in data do
   SPA[cycle] = calculate_area(optimal_range);
   SPIC[cycle] = find_max_IC(optimal_range);
SB-LSTM for SOH Estimation
 model = creat SB-LSTM_model();
 train_model(model, [SPA, SPIC], SOH_lable);
 data’ = data_online()
 for each cycle in data’ do
   SPA’ = calculate_area(optimal_range);
   SPIC’ = find_max_IC(optimal_range);
 estimated_SOH = model.predict([SPA’, SPIC’]);
The complex structure of the LSTM increases the risk of overfitting. In principle, this method is more suitable for larger datasets, as the two-layer bidirectional LSTM structure is more complex, requiring sufficient data for effective training. However, the risk of model overfitting can be reduced by using data with low noise, a uniform sample distribution, complete features, and sufficient unique samples. In addition, techniques such as Dropout, regularization, and data augmentation being used during model training can also mitigate overfitting. It can be reasonably speculated that as the lifespan of future sodium batteries increases to thousands of cycles, the advantages of this method will become more apparent. Therefore, using deep learning to predict battery life is a promising method.
Common ML and deep learning algorithms were utilized for modeling, and the model estimation effects were compared. Two types of models yielded relatively good results: first, linear models such as linear support vector machines and linear regression; second, multi-layer neural network models such as the MLP and the LSTM. In terms of the experimental results, the neural network methods were superior to the linear ML models. The detailed analysis of the specific results will be presented in the following section.

3. Verification and Discussion

The method for obtaining features that are highly correlated with the SOH is introduced above. This section will introduce the results of SOH prediction for different types of half-cells and full-cells using deep learning methods.

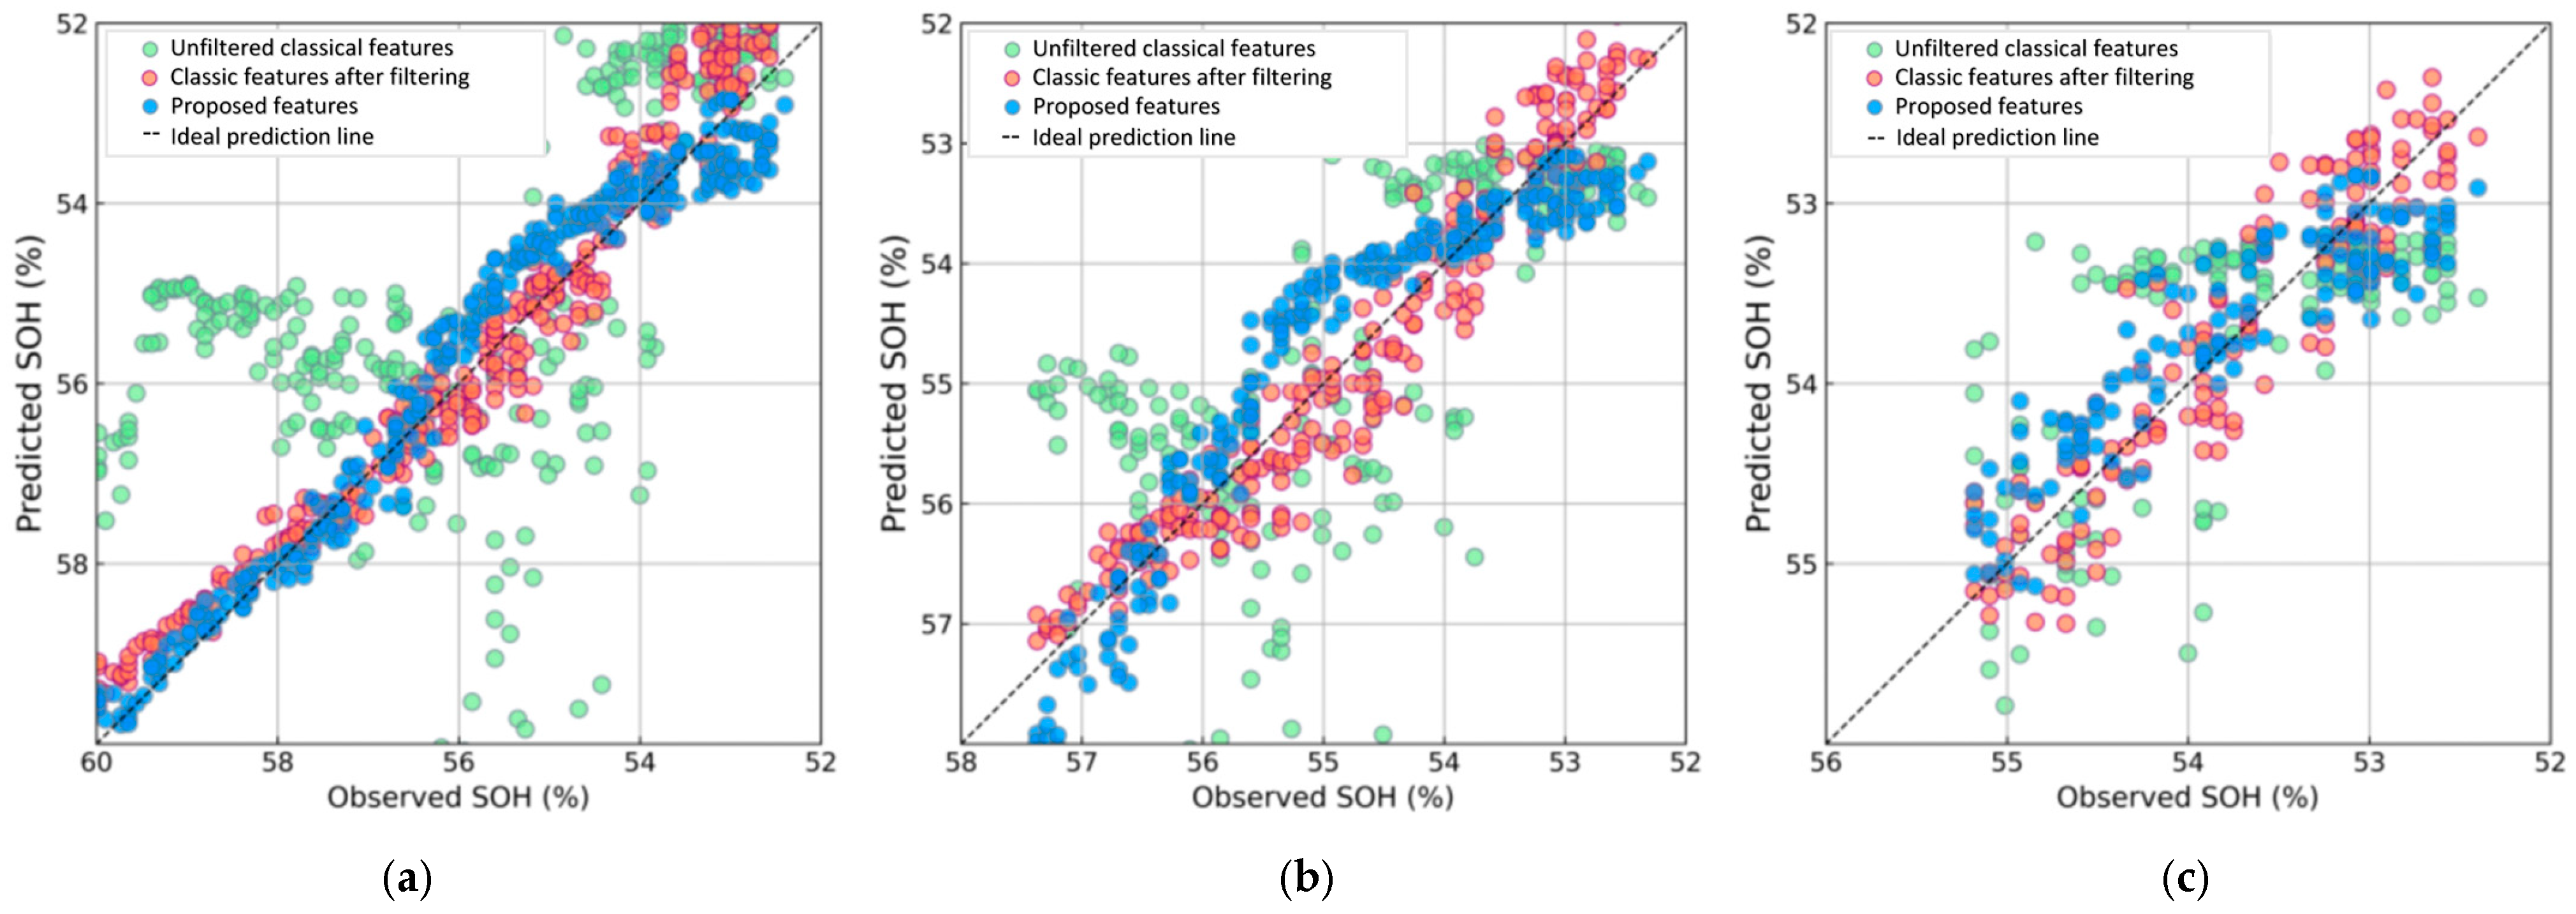
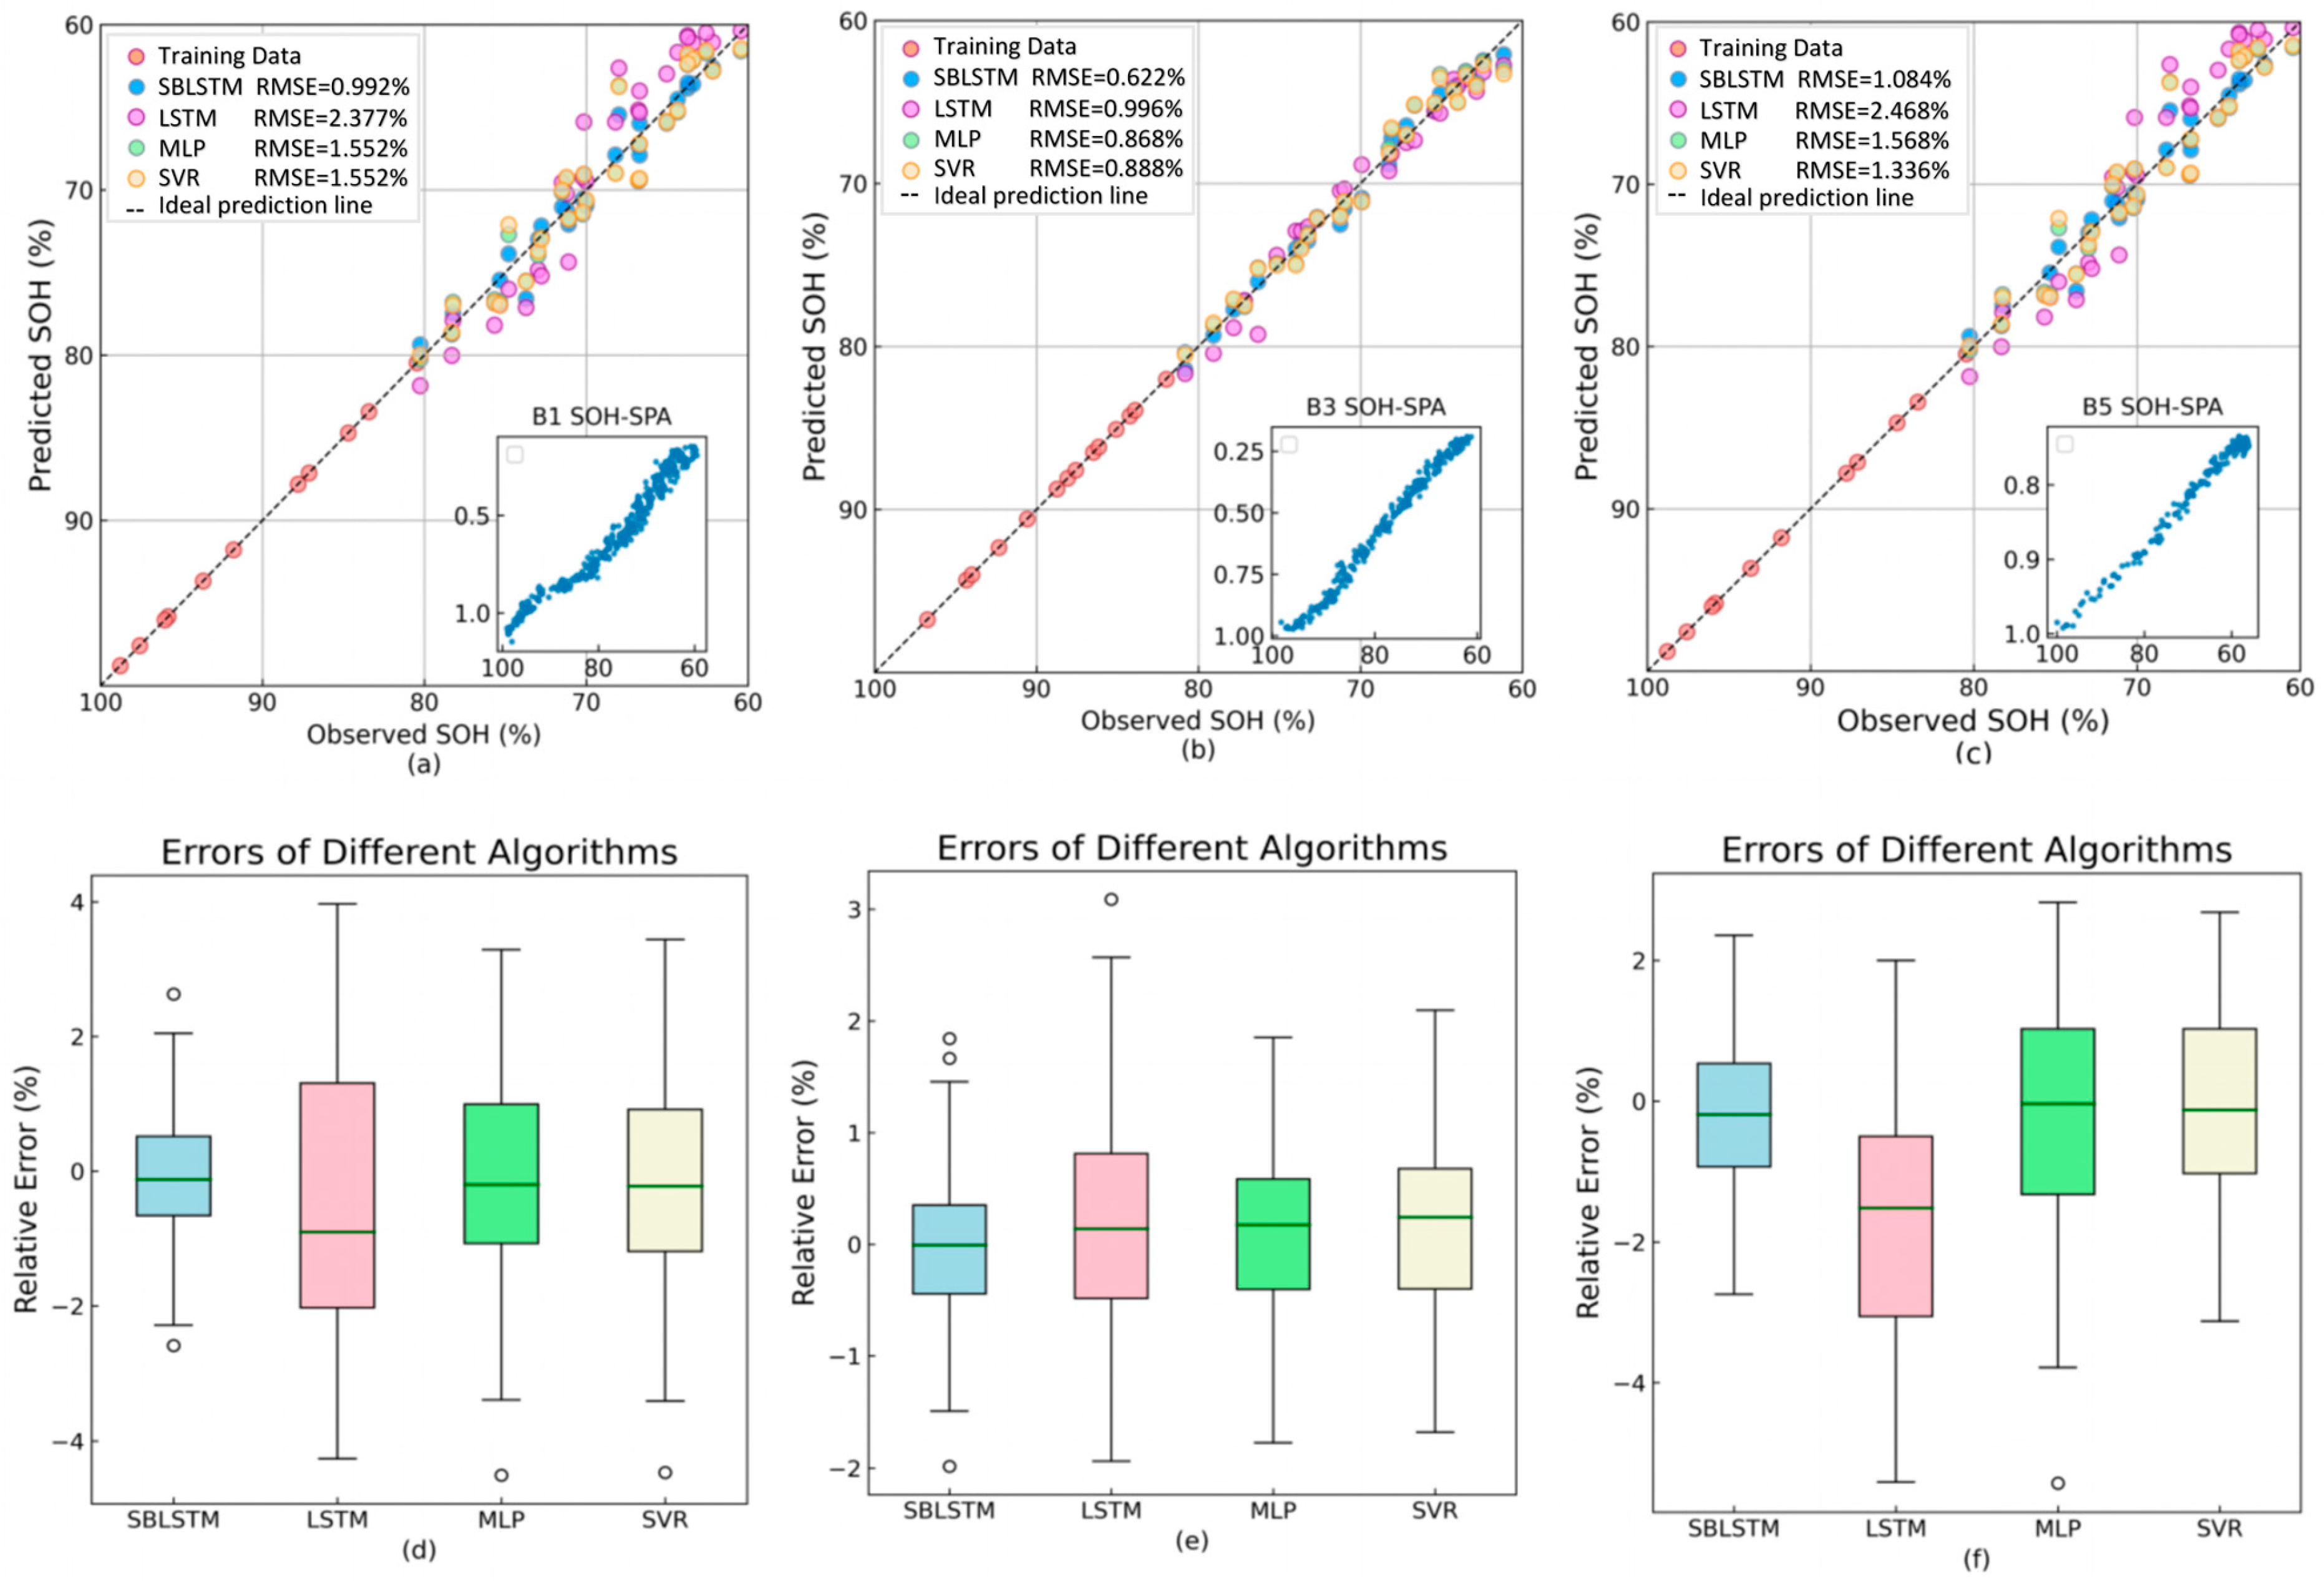
3.1. Feature Comparison Verification

In data-driven models, the quality of the input data significantly affects the results. HIs extracted through indirect methods, such as the peak height, peak position, peak area, and peak slope, generally cannot be directly extracted from the raw data. One important influencing factor is the sampling frequency or the time interval for recording battery data. If the experiment employs a lower current rate, it is necessary to decrease the sampling frequency and increase the interval between data acquisition to effectively reduce high-frequency noise. Otherwise, the extracted data curves need to undergo filtering processes. Conversely, for experiments with higher current rates, better HIs can be obtained without reducing the sampling frequency. Figure 7 and Figure 8 illustrate this issue. Figure 7 displays the results of SOH estimation using linear regression algorithms for the classic features (peak height and peak position) and the proposed features from the B2 battery data. The predictions are represented by red for the classic features and blue for the proposed features. The training datasets consist of the first 30%, 50%, and 70% of the battery data, while the remaining data was used for the prediction. Table 2 presents the specific error results. Since the B2 battery is charged and discharged at the 1C rate, the HIs extracted using traditional methods not only have poor quality and high-frequency noise but also fail to yield satisfactory results, even after downsampling and moving the average filtering. In contrast, the proposed HIs in this study avoid these issues. Even without any downsampling or filtering, they can still achieve relatively accurate prediction results, thereby enhancing the model’s reliability and reducing the implementation costs.
Using the same method, another group of batteries, B4, was tested, and an estimation model was established using the SB-LSTM algorithm. The results are shown in Figure 8, illustrating a more comprehensive scenario. The specific prediction results are provided in Table 3. The classic features extracted directly from the raw data are represented in green, the classic features processed through downsampling and filtering are represented in red, and the proposed features are represented in blue. The results indicate that the latter two significantly outperform the unfiltered classic features. However, the downsampling and filtered classic features slightly outperform the proposed features. It is worth noting that the B4 battery employs a high current rate of up to 5C for charging and discharging, completing a charge or discharge cycle in a matter of minutes. Only a few tens of datasets are available per cycle. Under these conditions, the high-frequency noise caused by the sampling interval is reduced, and classic His, such as the peak height and the peak position, can effectively predict the battery’s SOH after appropriate processing. Therefore, it can be concluded that the proposed HIs in this study cannot completely replace the classic ones but serve as an effective supplementary approach to compensate for the limitations of SOH prediction for batteries under conditions of high-frequency noise, low current rates, or high sampling frequencies.

3.2. Figures, Tables and Schemes

It should be noted that features with high correlations are more potential to obtain higher-accuracy SOH prediction through ML technology. However, the specific effect is related to the chosen modeling technology. To verify the effect of the model, several sets of experiments were set up to compare the impact of different algorithms and features on the prediction performance. The data of B1~B5 batteries were selected for the experiments, and the SPA and the SPIC were extracted as HIs, which were modeled with the SB-LSTM, the MLP, and SVR with a linear kernel.
B1 and B2 are half-cells with the same electrode material and different current rates. B3 is a half-cell with a different electrode material from the former. B4 and B5 are full-cells with different electrode materials. B1, B2, and B3 data were used to train the ML model by extracting the SPA and using the first 110 or 50 cycles of data, for which the corresponding SOH interval is 100%~80%. There were 500 cycles of data in B1, B4, and B5 and 300 cycles of data in B2 and B3. The prediction effect of this model is shown separately in Figure 9. In the scatterplot (a)~(b), a part of the data is sampled proportionally for testing: the red dots represent the training data, and the rest represent the training data of different algorithms. The subgraphs are used to show the Pearson correlation coefficient between the SPA and the SOH. The boxplots show errors in different algorithms. The specific data are displayed in the Table 4.
For the four sets of battery data, the MAE of the SB-LSTM is less than 0.9%, with a minimum of 0.5%, and the RMSE is less than 1.1%, with a minimum of 0.6%. It can be noted that the SOH estimation error distribution is uniform throughout the life cycle, and the prediction accuracy can also be guaranteed at the end of the battery life. Figure 9d–f show the comparison of the modeling by different algorithms. Table 4 shows that the SB-LSTM consistently achieves lower MAE and RMSE values across different batteries, with the highest R2 values indicating a strong fitting capability. Compared to a traditional LSTM, the SB-LSTM benefits from a bidirectional structure that allows the model to capture temporal features in both forward and backward directions, which is crucial for modeling battery degradation sequences. Moreover, the two-layer design enhances feature representation, leading to more accurate SOH predictions. In contrast, the LSTM shows larger variance and weaker generalization, especially on B5, where it suffers from a higher RMSE and error dispersion. The MLP and SVR, as shallow or non-temporal models, lack memory mechanisms and are prone to overfitting or underfitting under limited data conditions. The box plots in Figure 9d–f further support this analysis: the SB-LSTM exhibits narrower error distributions and fewer outliers, while the LSTM shows greater spread, particularly for B5. These results demonstrate that the SB-LSTM is not only accurate but also more robust and stable across different battery types and degradation patterns, making it a promising solution for practical SOH estimation tasks. Overall, the SB-LSTM has significant advantages over the LSTM, SVR, and the MLP. Almost all of its regression metrics outperformed the comparison algorithms. Specifically, the prediction results output by the SB-LSTM model are closer to the actual value, and the curve of the prediction results is smoother.
From these data, it can be concluded that a high correlation between features and targets leads to a higher model prediction accuracy. Through the method for determining the extraction SPA voltage range described in this paper, only a small amount of battery cycle data need to be used to determine the range of feature extraction. One obvious reason is that it is relatively easy to extract the HI if the functional relationship between the SOH and the HI is explicit, and HI extraction relies on the estimation method for the posterior of the SOH. The experiments tested different charge and discharge currents and full batteries and half batteries with different positive and negative electrodes, and the results showed that the method has versatility and a relatively high generalization ability. The more prominent point is that the life of the sodium batteries’ half-battery is slightly longer, but it decays to 60% of the initial capacity after only 500 cycles, while the full battery is even shorter, with a life of only 300 cycles. Sufficient data means better accuracy and insufficient data will lead to insufficient model training. Generally, LIBs have a lifespan of thousands of cycles. In comparison, the difficulty in estimating the SOH of sodium batteries lies in the small amount of data because the SOH is only updated once per cycle. This means that only a few hundred sets of SOH data can be obtained in total, and dozens of them are used for training. Figure 9c shows the prediction results for the full battery. The first 50 cycles of data are used for training, and the results are not worse than the model shown in (a) and (b) trained with 110 cycles.
From another point of view, a lower data volume also provides the possibility to use ML to predict the SOH. The linear SVR method used in this paper also achieves satisfactory results in the life prediction of sodium batteries. Due to the linear relationship of HI-SOH, most ML linear models can achieve good results, which were tested in the pre-experimental stage. The applicability of the SPA to various algorithms provides convenience for practical application.

3.3. Discussions and Future Work

The feasibility of using the proposed method to extract HIs for SOH estimation is verified experimentally. It only needs three kinds of data: voltage, current, and time, without any filtering scheme or complex data processing. Only the first cycle data of the sodium battery was used to determine the specific method of HI extraction for different types of batteries. The proposed method requires little data for estimation. Taking the B3 battery as an example, HIs only need to be extracted in the voltage range of 3.3 V−3.5 V, within the range of approximately a 40% to 60% SOC. This feature renders it highly suitable for the majority of charging situations, especially for users concerned about low-battery anxiety. Additionally, this method has relatively low data quality requirements. It can yield high-quality HIs regardless of the frequency at which the sensor data is collected or whether the data has undergone preprocessing.
In this study, both button half-cells and full-cells with different cathode materials were chosen as the research subjects. The tested batteries exhibited two peaks corresponding to two voltage plateaus. In LIB research, it is common to extract HIs using the peak with the maximum value on the IC curve. However, the experiments in this paper demonstrate that, for sodium batteries, smaller peaks can be equally effective, and in some cases, perform better than the highest peak. Some other types of sodium batteries undergo multiple voltage plateaus during the cycling process, and there is currently no research indicating that all peaks can be used to estimate the SOH. The results of [31] suggest that extracting features within a specific voltage range as input can improve the accuracy of SOH estimation for NCA-based batteries. This suggests that HIs can be extracted from a fixed voltage range for estimating the state of health of LIBs. To further validate the generalizability of this method, a large number of different types of batteries would be required for testing, which will be addressed in future experiments.
The experiments also demonstrated that the proposed method is applicable to low-rate currents, effectively avoiding the influence of high-frequency noise. Under conditions of high-rate current charging and discharging, this method can also maintain a good level of prediction accuracy, making it an effective supplementary approach to the traditional ICA method. Meanwhile, the experiments have some limitations: the effect of temperature on the capacity of sodium batteries is significant [32]. As this experiment was conducted under constant temperature conditions of 25 °C, the influence of temperature on capacity prediction was not taken into account, which will be an area for improvement in future work. Additionally, the batteries used in this experiment were laboratory-manufactured and may not represent commercially available sodium batteries. In the future, more tests will be conducted on sodium batteries suitable for commercial use.

4. Conclusions

This paper proposes a novel SB-LSTM model-based ICA method for the SOH estimation of sodium batteries. The features that are highly linear with the SOH and easily measured are extracted through ICA, and the estimation model of the SOH is established using an SB-LSTM, which is comprehensively tested and verified. The main conclusions are summarized as follows: An approach is developed to use a cycle of battery data to determine the SPA voltage range with only the voltage, current, and time information. The extracted features have high reference values for SOH estimation and can ensure the model’s accuracy, robustness, and universality.
The SB-LSTM-based ICA method has a good estimation effect. Compared with the SVR model, the error is even minor. The error of more than half of the predicted values is less than 0.5%, the MAE is less than 0.85%, and the RMSE is less than 1.06%. Our experiments show that this method has the characteristics of high precision, high robustness, high usability, and easy measurement. Only 25% of the battery life data was used to complete the modeling. Despite the different battery models, charging and discharging protocols, and the initial states, the models established by the proposed methods demonstrate good performance and generalization ability.

Author Contributions

Conceptualization, X.W. and W.Y.; methodology, X.W.; software, B.Z.; validation, X.W., W.S. and Z.Y. (Zuobin Ying); formal analysis, B.Z., W.S. and Z.Y. (Zuobin Ying); investigation, X.W. and H.X.; resources, S.X., T.W., Y.G., W.Y. and Z.Y. (Zhile Yang); data curation, B.Z. and H.X.; writing—original draft preparation, X.W.; writing—review and editing, W.Y. and Z.Y. (Zhile Yang); visualization, B.Z.; supervision, H.X., S.X., T.W., Y.G., W.Y. and Z.Y. (Zhile Yang); project administration, S.X., T.W. and Y.G.; funding acquisition, W.Y. and Z.Y. (Zhile Yang). All authors have read and agreed to the published version of the manuscript.

Funding

This research was funded by the Shenzhen Science and Technology Program (Grant Nos. RCYX20221008093036022 and RCYX20221008092850072), the “Advanced Technology for the Integration and Coordination of Novel Energy Storage and Power Grid” Project of State Grid Hunan Electric Power Company Limited, the National Natural Science Foundation of China (Grant Nos. 52372250), the Youth Innovation Promotion Association of CAS (Grant No. 2021358), the “Nanling Team Project” of Shaoguan City, and the Guangdong Basic and Applied Basic Research Foundation (Grant No. 2024A1515030076) And the APC was funded by the Shenzhen Science and Technology Program (Grant No. KJZD20230923113859006).

Data Availability Statement

The data presented in this study are not publicly available due to privacy or institutional restrictions.

Conflicts of Interest

Author Tao Wan was employed by State Grid Hunan Electric Power Co., Ltd. The company had no involvement in the study’s design, execution, analysis, or writing. The authors declare no competing interests.

Abbreviations

Acronyms
BMSbattery management system
BPback propagation
CTconstant current
DVAdifferential voltage analysis
EISelectrochemical impedance spectroscopy
EVelectric vehicle
HIhealth indicator
ICAincremental capacity analysis
LBVlower bound voltage
LIBslithium-ion batteries
LLIloss of lithium inventory
LSTMlong short-term memory
MAEmean absolute error
MLmachine learning
MLP multi-layer perceptron
OCVopen-circuit voltage
PCCPearson correlation coefficient
PSFposition of the secondary peak in the first cycle
RNNrecurrent neural network
SBstacked bidirectional
SIBssodium-ion batteries
SOCstate of charge
SOHstate of health
SPICsecondary peak of the incremental capacity curve
SPAsecondary peak area
SVRsupport vector regression
UBVupper bound voltage
RMSEroot mean square error

References

  1. Song, T.; Yao, W.; Kiadkhunthod, P.; Zheng, Y.; Wu, N.; Zhou, X.; Tunmee, S.; Sattayaporn, S.; Tang, T. A low-cost and environmentally friendly mixed polyanionic cathode for sodium-ion storage. Angew. Chem. 2020, 132, 750–755. [Google Scholar] [CrossRef]
  2. Lan, Y.; Yao, W.; He, X.; Song, T.; Tang, Y. Mixed polyanionic compounds as positive electrodes for low-cost electrochemical energy storage. Angew. Chem. Int. Ed. Engl. 2020, 59, 9255–9262. [Google Scholar] [CrossRef] [PubMed]
  3. Zhang, H.; Gao, Y.; Liu, X.; Yang, Z.; He, X.; Li, L.; Qiao, Y.; Chen, W.; Zeng, R.; Wang, Y.; et al. Organic cathode materials for sodium-ion batteries: From fundamental research to potential commercial application. Adv. Funct. Mater. 2022, 32, 2107718. [Google Scholar] [CrossRef]
  4. Wu, Y.; Shuang, W.; Wang, Y.; Chen, F.; Tang, S.; Wu, X.-L.; Bai, Z.; Yang, L.; Zhang, J. Recent Progress in Sodium-Ion Batteries: Advanced Materials, Reaction Mechanisms and Energy Applications. Electrochem. Energy Rev. 2024, 7, 1–50. [Google Scholar] [CrossRef]
  5. Nekahi, A.; Reddy, A.K.M.R.; Li, X.; Deng, S.; Zaghib, K. Rechargeable Batteries for the Electrification of Society: Past, Present, and Future. Electrochem. Energy Rev. 2024, 8, 1–30. [Google Scholar] [CrossRef]
  6. Fan, E.; Li, L.; Wang, Z.; Lin, J.; Huang, Y.; Yao, Y.; Chen, R.; Wu, F. Sustainable recycling technology for Li-ion batteries and beyond: Challenges and future prospects. Chem. Rev. 2020, 120, 7020–7063. [Google Scholar] [CrossRef]
  7. Lu, L.; Han, X.; Li, J.; Hua, J.; Ouyang, M. A review on the key issues for lithium-ion battery management in electric vehicles. J. Power Sources 2013, 226, 272–288. [Google Scholar] [CrossRef]
  8. Hansen, T.; Wang, C.-J. Support vector based battery state of charge estimator. J. Power Sources 2005, 141, 351–358. [Google Scholar] [CrossRef]
  9. Tran, M.-K.; Cunanan, C.; Panchal, S.; Fraser, R.; Fowler, M. Investigation of individual cells replacement concept in lithium-ion battery packs with analysis on economic feasibility and pack design requirements. Processes 2021, 9, 2263. [Google Scholar] [CrossRef]
  10. Stroe, D.-I.; Świerczyński, M.; Stan, A.-I.; Teodorescu, R.; Andreasen, S.J. Accelerated lifetime testing methodology for lifetime estimation of lithium-ion batteries used in augmented wind power plants. IEEE Trans. Ind. Appl. 2014, 50, 4006–4017. [Google Scholar] [CrossRef]
  11. He, X.; Yan, Q.; He, H.; Shang, J.; Zhou, X.; Chanlek, N.; Tunmee, S.; Kidkhunthod, P.; Yao, W.; Tang, Y. A Vanadium-Based Fluoroxide Cathode Material for Lithium-Ion Storage with High Energy Density. Adv. Sustain. Syst. 2022, 6, 2200122. [Google Scholar] [CrossRef]
  12. Broussely, M.; Biensan, P.; Bonhomme, F.; Blanchard, P.; Herreyre, S.; Nechev, K.; Staniewicz, R. Main aging mechanisms in Li ion batteries. J. Power Sources 2005, 146, 90–96. [Google Scholar] [CrossRef]
  13. R-Smith, N.A.-Z.; Leitner, M.; Alic, I.; Toth, D.; Kasper, M.; Romio, M.; Surace, Y.; Jahn, M.; Kienberger, F.; Ebner, A.; et al. Assessment of lithium ion battery ageing by combined impedance spectroscopy, functional microscopy and finite element modelling. J. Power Sources 2021, 512, 230459. [Google Scholar] [CrossRef]
  14. Gao, Y.; Liu, K.; Zhu, C.; Zhang, X.; Zhang, D. Co-Estimation of State-of-Charge and State-of- Health for Lithium-Ion Batteries Using an Enhanced Electrochemical Model. IEEE Trans. Ind. Electron. 2022, 69, 2684–2696. [Google Scholar] [CrossRef]
  15. Zheng, L.; Zhu, J.; Lu, D.D.-C.; Wang, G.; He, T. Incremental capacity analysis and differential voltage analysis based state of charge and capacity estimation for lithium-ion batteries. Energy 2018, 150, 759–769. [Google Scholar] [CrossRef]
  16. Dubarry, M.; Svoboda, V.; Hwu, R.; Liaw, B.Y. Incremental capacity analysis and close-to-equilibrium OCV measurements to quantify capacity fade in commercial rechargeable lithium batteries. Electrochem. Solid-State Lett. 2006, 9, A454–A457. [Google Scholar] [CrossRef]
  17. Yazami, R.; Touzain, P. A reversible graphite-lithium negative electrode for electrochemical generators. J. Power Sources 1983, 9, 365–371. [Google Scholar] [CrossRef]
  18. Dahn, J. Phase diagram of Li x C 6. Phys. Rev. B 1991, 44, 9170. [Google Scholar] [CrossRef]
  19. Yazami, R.; Reynier, Y. Thermodynamics and crystal structure anomalies in lithium-intercalated graphite. J. Power Sources 2006, 153, 312–318. [Google Scholar] [CrossRef]
  20. Dubarry, M.; Svoboda, V.; Hwu, R.; Liaw, B.Y. A roadmap to understand battery performance in electric and hybrid vehicle operation. J. Power Sources 2007, 174, 366–372. [Google Scholar] [CrossRef]
  21. Dubarry, M.; Liaw, B.Y. Identify capacity fading mechanism in a commercial LiFePO4 cell. J. Power Sources 2009, 194, 541–549. [Google Scholar] [CrossRef]
  22. Weng, C.; Cui, Y.; Sun, J.; Peng, H. On-board state of health monitoring of lithium-ion batteries using incremental capacity analysis with support vector regression. J. Power Sources 2013, 235, 36–44. [Google Scholar] [CrossRef]
  23. Stroe, D.-I.; Schaltz, E. Lithium-ion battery state-of-health estimation using the incremental capacity analysis technique. IEEE Trans. Ind. Appl. 2019, 56, 678–685. [Google Scholar] [CrossRef]
  24. Zhang, Y.; Liu, Y.; Wang, J.; Zhang, T. State-of-health estimation for lithium-ion batteries by combining model-based incremental capacity analysis with support vector regression. Energy 2022, 239, 121986. [Google Scholar] [CrossRef]
  25. Dubarry, M.; Liaw, B.Y.; Chen, M.-S.; Chyan, S.-S.; Han, K.-C.; Sie, W.-T.; Wu, S.-H. Identifying battery aging mechanisms in large format Li ion cells. J. Power Sources 2011, 196, 3420–3425. [Google Scholar] [CrossRef]
  26. Bian, X.; Liu, L.; Yan, J. A model for state-of-health estimation of lithium ion batteries based on charging profiles. Energy 2019, 177, 57–65. [Google Scholar] [CrossRef]
  27. Lin, C.; Xu, J.; Shi, M.; Mei, X. Constant current charging time based fast state-of-health estimation for lithium-ion batteries. Energy 2022, 247, 123556. [Google Scholar] [CrossRef]
  28. Bian, C.; He, H.; Yang, S. Stacked bidirectional long short-term memory networks for state-of-charge estimation of lithium-ion batteries. Energy 2020, 191, 116538. [Google Scholar] [CrossRef]
  29. Hewamalage, H.; Bergmeir, C.; Bandara, K. Recurrent neural networks for time series forecasting: Current status and future directions. Int. J. Forecast. 2021, 37, 388–427. [Google Scholar] [CrossRef]
  30. Xiong, R.; Sun, Y.; Wang, C.; Tian, J.; Chen, X.; Li, H.; Zhang, Q. A data-driven method for extracting aging features to accurately predict the battery health. Energy Storage Mater. 2023, 57, 460–470. [Google Scholar] [CrossRef]
  31. Wang, Y.; Hou, B.; Guo, J.; Ning, Q.; Pang, W.; Wang, J.; Lü, C.; Wu, X. An ultralong lifespan and low-temperature workable sodium-ion full battery for stationary energy storage. Adv. Energy Mater. 2018, 8, 1703252. [Google Scholar] [CrossRef]
  32. Zhang, J.; Wang, W.; Wang, W.; Wang, S.; Li, B. Comprehensive review of P2-type Na2/3Ni1/3Mn2/3O2, a potential cathode for practical application of Na-ion batteries. ACS Appl. Mater. Interfaces 2019, 11, 22051–22066. [Google Scholar] [CrossRef] [PubMed]
  33. Xiang, H.; Wang, Y.; Li, K.; Zhang, X.; Chen, Z. A comprehensive study on state-of-charge and state-of-health estimation of sodium-ion batteries. J. Energy Storage 2023, 72, 108314. [Google Scholar] [CrossRef]
  34. You, G.-W.; Park, S.; Oh, D. Real-time state-of-health estimation for electric vehicle batteries: A data-driven approach. Appl. Energy 2016, 176, 92–103. [Google Scholar] [CrossRef]
  35. Bai, G.; Su, Y.; Rahman, M.M.; Wang, Z. Prognostics of Lithium-Ion batteries using knowledge-constrained machine learning and Kalman filtering. Reliab. Eng. Syst. Saf. 2023, 231, 108944. [Google Scholar] [CrossRef]
  36. Wen, J.; Chen, X.; Li, X.; Li, Y. SOH prediction of lithium battery based on IC curve feature and BP neural network. Energy 2022, 261, 125234. [Google Scholar] [CrossRef]
  37. Lin, M.; Wu, D.; Meng, J.; Wu, J.; Wu, H. A multi-feature-based multi-model fusion method for state of health estimation of lithium-ion batteries. J. Power Sources 2022, 518, 230774. [Google Scholar] [CrossRef]
  38. Driscoll, L.; de la Torre, S.; Gomez-Ruiz, J.A. Feature-based lithium-ion battery state of health estimation with artificial neural networks. J. Energy Storage 2022, 50, 104584. [Google Scholar] [CrossRef]
  39. Zhou, P.; Zhang, J.; Che, Z.; Quan, Z.; Duan, J.; Wu, X.; Weng, J.; Zhao, J.; Zhou, J. Insights into the enhanced structure stability and electrochemical performance of Ti4+/F co-doped P2-Na0.67Ni0.33Mn0.67O2 cathodes for sodium ion batteries at high voltage. J. Energy Chem. 2022, 67, 655–662. [Google Scholar] [CrossRef]
Figure 1. Scatter diagram during constant current of B3 under different cycles: (a) Q-V; (b) V-IC; (c) V-DV.
Energies 18 02792 g001
Figure 2. The horizontal coordinate and the color bar together represent the voltage range for extracting features. (ac) The correlation coefficient between the charge change value of the battery in different voltage ranges and the SOH of the (a) B1 battery; (b) B3 battery; (c) B4 battery. (df) The correlation coefficient between the maximum IC value in different voltage ranges and the SOH in the (d) B1 battery; (e) B3 battery; (f) B4 battery.
Energies 18 02792 g002
Figure 3. SPA-SOH correlation coefficient: (a) B3 battery; (b) B2 battery.
Energies 18 02792 g003
Figure 4. Fitted voltage curve at 1st, 30th, 60th, 100th, 150th, 200th, and 280th cycles of the (a) B3 battery; (b) B2 battery.
Energies 18 02792 g004
Figure 5. The IC curve of the first cycle of the sodium batteries.
Energies 18 02792 g005
Figure 6. Framework of DI4SHE.
Energies 18 02792 g006
Figure 7. SOH estimation for B2 battery with linear regression algorithm using proposed features and classic features after filtering (the peak height and position of the IC curve). (a) Training with the first 30% of the data. (b) Training with the first 50% of the data. (c) Training with the first 70% of the data.
Energies 18 02792 g007
Figure 8. The SOH estimation of the B4 battery with the SB-LSTM algorithm, using proposed features and unfiltered and filtered classic features (the peak height and position of the IC curve). (a) Training with the first 30% of the data. (b) Training with the first 50% of the data. (c) Training with the first 70% of the data.
Energies 18 02792 g008
Figure 9. Battery SOH estimation results. (a) B1 battery; (b) B3 battery; (c) B5 battery. Errors of different algorithms for the batteries. (d) B1 battery; (e) B3 battery; (f) B5 battery.
Energies 18 02792 g009
Table 1. Basic battery parameters.
Cell TypeCoin-Type Half-Cell (B1)Coin-Type Half-Cell (B2)Coin-Type Half-Cell (B3)
CathodeNa2/3Ni1/3Mn15/30Ti5/30O2Na2/3Ni1/3Mn15/30Ti5/30O2Na2/3Ni1/3Mn2/3O1.95F0.05
Anodesodium–metalsodium–metalsodium–metal
Electrolyte1 M NaClO4 in PC and FEC (V/V = 95:5)1 M NaClO4 in PC and FEC (V/V = 95:5)1 M NaClO4 in PC and FEC (V/V = 95:5)
SeparatorGlassfiberGlassfiberGlassfiber
Standard specific capacity1 C = 173 mA g−11 C = 173 mA g−11 C = 173 mA g−1
Voltage window1.5–4.1 V1.5–4.1 V1.5–4.1 V
Charge–discharge methodGalvanostatic charge–dischargeGalvanostatic charge–dischargeGalvanostatic charge–discharge
Current density2C1C1C
Test temperature25 °C25 °C25 °C
Cell typeCoin-Type Full-Cell (B4)Coin-Type Full-Cell (B5)
CathodeNa2/3Ni1/3Mn2/3O2Na2/3Ni1/3Mn17/30Ti3/30O1.95F0.05
AnodeHard carbonHard carbon
Electrolyte1 M NaClO4 in PC and FEC (V/V = 95:5)1 M NaClO4 in PC and FEC (V/V = 95:5)
SeparatorGlassfiberGlassfiber
Standard specific capacity1 C = 173 mA g−11 C = 173 mA g−1
Voltage window1.5–3.6 V1.5–3.6 V
Charge–discharge methodGalvanostatic charge–dischargeGalvanostatic charge–discharge
Current density5 C 5 C
Test temperature25 °C25 °C
Table 2. SOH estimation error for B2 battery.
Training Using Proposed FeaturesTraining Using Filtered Classic Features
30% Data50% Data70% Data30% Data50% Data70% Data
MAE1.095%0.826%0.626%2.629%2.695%2.009%
RMSE1.361%1.068%0.780%3.396%3.478%2.682%
R 2 0.9140.8660.8240.467−0.420−1.088
Table 3. SOH estimation error for B4 battery.
Trained with Proposed FeaturesTrained with Filtered Classic FeaturesTrained with Unfiltered Features
30% Data50% Data70% Data30% Data50% Data70% Data30% Data50% Data70% Data
MAE0.381%0.446%0.312%0.402%0.287%0.254%1.833%0.944%0.573%
RMSE0.460%0.523%0.367%0.517%0.360%0.313%2.794%1.325%0.753%
R 2 0.9560.8580.7840.9440.9330.843−0.6230.0880.091
Table 4. Results of error analysis for the batteries.
SB-LSTMLSTMMLPSVR
B1MAE (%)
RMSE (%)
R 2
0.693
0.861
0.976
1.825
2.053
0.866
1.139
1.374
0.940
1.171
1.405
0.937
B2MAE (%)
RMSE (%)
R 2
0.801
1.013
0.931
1.174
1.454
0.865
1.087
1.330
0.882
0.945
1.191
0.905
B3MAE (%)
RMSE (%)
R 2
0.496
0.635
0.986
0.758
0.922
0.971
0.623
0.761
0.980
0.649
0.799
0.978
B5MAE (%)
RMSE (%)
R 2
0.849
1.054
0.962
1.971
2.457
0.796
1.324
1.653
0.907
1.098
1.302
0.942
Disclaimer/Publisher’s Note: The statements, opinions and data contained in all publications are solely those of the individual author(s) and contributor(s) and not of MDPI and/or the editor(s). MDPI and/or the editor(s) disclaim responsibility for any injury to people or property resulting from any ideas, methods, instructions or products referred to in the content.

