Article

Integrated Control Strategies of EGR System and Fuel Injection Pressure to Reduce Emissions and Fuel Consumption in a DI Engine Fueled with Diesel-WCOME Blends and Neat Biodiesel

by
Giorgio Zamboni
* and
Massimo Capobianco
DIME, Department of Mechanical, Energy, Management and Transportation Engineering, University of Genoa, 16145 Genoa, Italy
*
Author to whom correspondence should be addressed.
Energies 2025, 18(11), 2791; https://doi.org/10.3390/en18112791
Submission received: 23 March 2025 / Revised: 9 May 2025 / Accepted: 24 May 2025 / Published: 27 May 2025
(This article belongs to the Special Issue Performance and Emissions of Advanced Fuels in Combustion Engines)

Abstract

:
A wide experimental campaign was developed on an automotive turbocharged diesel engine, using two blends between diesel oil and waste cooking oil methyl esters (WCOME) and neat biodiesel. A conventional B7 diesel oil was considered as a reference fuel. The two blends, respectively, included 40 and 70% of WCOME, on a volumetric basis. The influence of biodiesel was analyzed by testing the engine in two part-load operating conditions, applying proper control strategies to the exhaust gas recirculation (EGR) circuit and rail pressure, to assess the interactions between the engine management and the tested fuels. The variable nozzle turbine (VNT) was controlled to obtain a constant level of intake pressure in the two experimental points. Referring to biodiesel effects at constant operating mode, higher WCOME content generally resulted in better efficiency and soot emission, while NOX emission was negatively affected. EGR activation allowed for limited NO formation but with penalties in soot emission. Furthermore, interactions between the EGR circuit and turbocharger operations and control led to higher fuel consumption and lower efficiency. Finally, the increase in rail pressure corresponded to better soot emission and penalties in NOX emission. Combining all these effects, the selection of EGR rate and rail pressure values higher than the standard levels resulted in better efficiency, NOX, and soot emissions when comparing blends and neat biodiesel to conventional B7, granting advantages not only with regard to greenhouse gas emissions. Combustion parameters were also assessed, showing that combustion stability and combustion noise were not negatively affected by biodiesel use. Combustion duration was reduced when using WCOME and its blend, even if the center of combustion was slightly shifted along the expansion stroke. The main contribution of this investigation to the scientific and technical knowledge on biodiesel application to internal combustion engines is related to the development of tests on diesel–biodiesel blends with high WCOME content or neat WCOME, identifying their effects on NOX emissions, the definition of integrated strategies of HP EGR system, fuel rail pressure, and VNT for the simultaneous reduction in NOX and soot emissions, and the detailed assessment of the influence of biodiesel on a wide range of combustion parameters.

1. Introduction

With a glorious history of more than one hundred and seventy years, internal combustion engines (ICEs) contribute to mobility development for people and goods and to energy generation in different fields of application. Currently, it is quite difficult to make a reliable prediction about their future, as strong competitors are available, such as electric propulsion systems based on batteries or fuel cells. In most countries, policies for decarbonization generally aim at their replacement to fulfill targets for the reduction in greenhouse gas (GHG) emissions. From a European perspective, the Fit for 55 package of the European Union [1] and the IMO strategies for the decarbonization of the maritime sector [2] can be mentioned among the most well-known acts.
On the other hand, considering their advantages and extended use, the investments required for their substitution, and the difficulties in replacing them for applications such as long hauling heavy-duty vehicles and deep-sea shipping [3], the development of ICEs is still of the largest relevance [4,5,6], while their life can be expected not to come to an end in a short period of time, even in the private mobility sector [7].
Biofuels and electro-fuels represent an alternative energy source [8,9] to replace fossil fuels, recycle waste materials, and generate additional jobs and incomes in the agricultural sector. Furthermore, alternative fuels are an unavoidable measure to tackle the problem of the legacy fleet and the corresponding CO2 emissions.
As far as the decrease in CO2/GHG emissions is concerned, the reduction strongly depends on the primary feedstock and the production process. As reported in Renewable Energy Directive II [10] and III [11], biodiesel obtained from waste cooking oil allows for GHG emission reductions of around 86%, representing the largest reduction among the biodiesel types listed in these Directives. Moreover, waste cooking oil methyl esters (WCOME) are classified as a second or third generation biofuel, as no land use change is required [12].
The methodology described in RED II and III is based on a Well-to-Wheels (or Well-to-Wake) approach. Within this analysis, contributions to GHG emissions are related to the extraction or cultivation of raw materials, delivery of the feedstock to the production sites, and the processing, transport, and distribution of the fuel, and its end-use. The same approach is followed by the Fuel EU Maritime Regulation [13]. Therefore, all these legislative acts give rules, set procedures for GHG emissions evaluation, and provide numerical estimations of GHG emissions potential reduction for alternative fuels following a comprehensive approach. An example of the application of the WtW method in the maritime sector is presented in [14].
However, GHG emissions are only one side of the problem. For diesel engines, the effects of biofuels on efficiency and emissions must be considered for an overall evaluation of benefits and disadvantages. The same approach is required when considering other alternative fuels/energy vectors, such as methanol [15,16], ammonia [17,18], and hydrogen [19,20], requiring the development of dual-fuel engines. In these cases, a careful assessment of NOX, N2O, and PM is required, with the adoption of suitable techniques and control strategies to limit them. Due to the large number of papers presenting tests on a wide range of biofuels, selecting engines of different characteristics and applying several investigation programs, the analysis of review papers may allow us to define a general behavior of biofuels, outlining their influence on energy and environmental parameters. As far as brake thermal efficiency (bte) is concerned, while a consistent conclusion was not obtained from the investigations analyzed in [21], a general agreement for enhanced values was shown in [22]. In a recent paper [23], bte does not change when replacing diesel with a B30 blend based on waste cooking oil, but, in this case, the tested engine was a single cylinder naturally aspirated unit with a mechanical fuel pump, confirming that outcomes are strongly dependent on engine type and experimental operating conditions. In the same paper, other results adding TiO2 nanoparticles (a common approach in recent studies) show some benefits on bte for high levels of engine rotational speed.
For PM emission, significant reductions are presented in [21,24,25] because of the oxygen content and lower sulfur level in biodiesel. A negative influence on nanoparticles is outlined in [22].
Effects on NOX emissions are still an open issue, because of the controversial outcomes reported in different review papers [21,22,24,26,27]. Even if most of the investigations show an increase in NOX emissions (with percentages of selected papers presenting this conclusion ranging from 48.5% [27] to 85% [21]), the number of studies showing emission decreases is not negligible. Among the main parameters affecting the results, biodiesel feedstock, engine characteristics (displacement, air management system, fuel injection systems, etc.), tested operating conditions, biodiesel content, and control strategies of engine sub-systems can be mentioned. For NOX emission, counteracting effects of the considered variables are also detected; therefore, the non-monotonic influence of biodiesel on raw NOX emission may be identified, as presented in [28].
Considering investigations on WCOME, basic characteristics related to combustion, physical, and chemical properties are presented in [29,30], comparing fuels obtained from different feedstock or testing blends and neat biodiesel. In [31], the effects of diesel, WCOME, and two types of Hydrotreated Vegetable Oil (HVO) on high-pressure pumps are analyzed.
Focusing on investigations at the engine test bench, the available literature covers a wide range of engines for different applications (marine [32], stationary [33], agricultural [34]) with single [34,35] or multi-cylinder [32,33,36] layout. In these papers, several blends are considered (ranging from B10 to B50), while fuel injection is based on electronically controlled common rail systems [32,36] or mechanical pumps [33,34]. Despite this variety, a general agreement is observed for emissions, with increased levels of nitrogen oxides and a reduction in HC and soot. The same outcome is shown in [37] when fueling an urban bus with B10 and B20.
Considering the current knowledge on WCOME and the main features of the available literature, several goals were identified for the present investigation, aiming at reducing the lack of understanding and competence in some fundamental aspects related to the use of biodiesel:
  • Give a contribution to the assessment of the WCOME influence on NOX emission using an engine fitted with state-of-the-art sub-systems (HP EGR circuit, fuel injection system with electronic control, turbocharging system including a variable nozzle turbine).
  • Analyze biodiesel application considering blends with high content or even neat WCOME, whose behavior is less available in the literature.
  • Verify if a proper management of selected control variables, following the experience gained in previous investigations [38,39], may compensate for the negative effects of WCOME or further enhance its advantages.
  • Propose integrated control strategies for EGR rate and rail pressure, to improve benefits offered by biodiesel, matching a proper management of EGR circuit to compensate for the increase in NOX emission, a higher rail pressure values to limit soot emission, and blends with high WCOME content or neat biodiesel to minimize CO2 emission on a WtW base.
In this paper, the applied methodologies are presented in Section 2. The main characteristics of the engine and the measuring system are first described. Then, details on the indicating technique and related combustion parameters are given. Finally, the main properties of the reference diesel oil, biodiesel, and related blends are analyzed, together with the program of the experimental campaign. In Section 3, the main outcomes are analyzed, focusing on engine parameters (operating, energy, environmental, and combustion quantities). The effects of the EGR rate and rail pressure control are analyzed, identifying integrated control strategies allowing for overall benefits when replacing diesel oil with blends including high biodiesel content or neat renewable fuel.

2. Materials and Methods
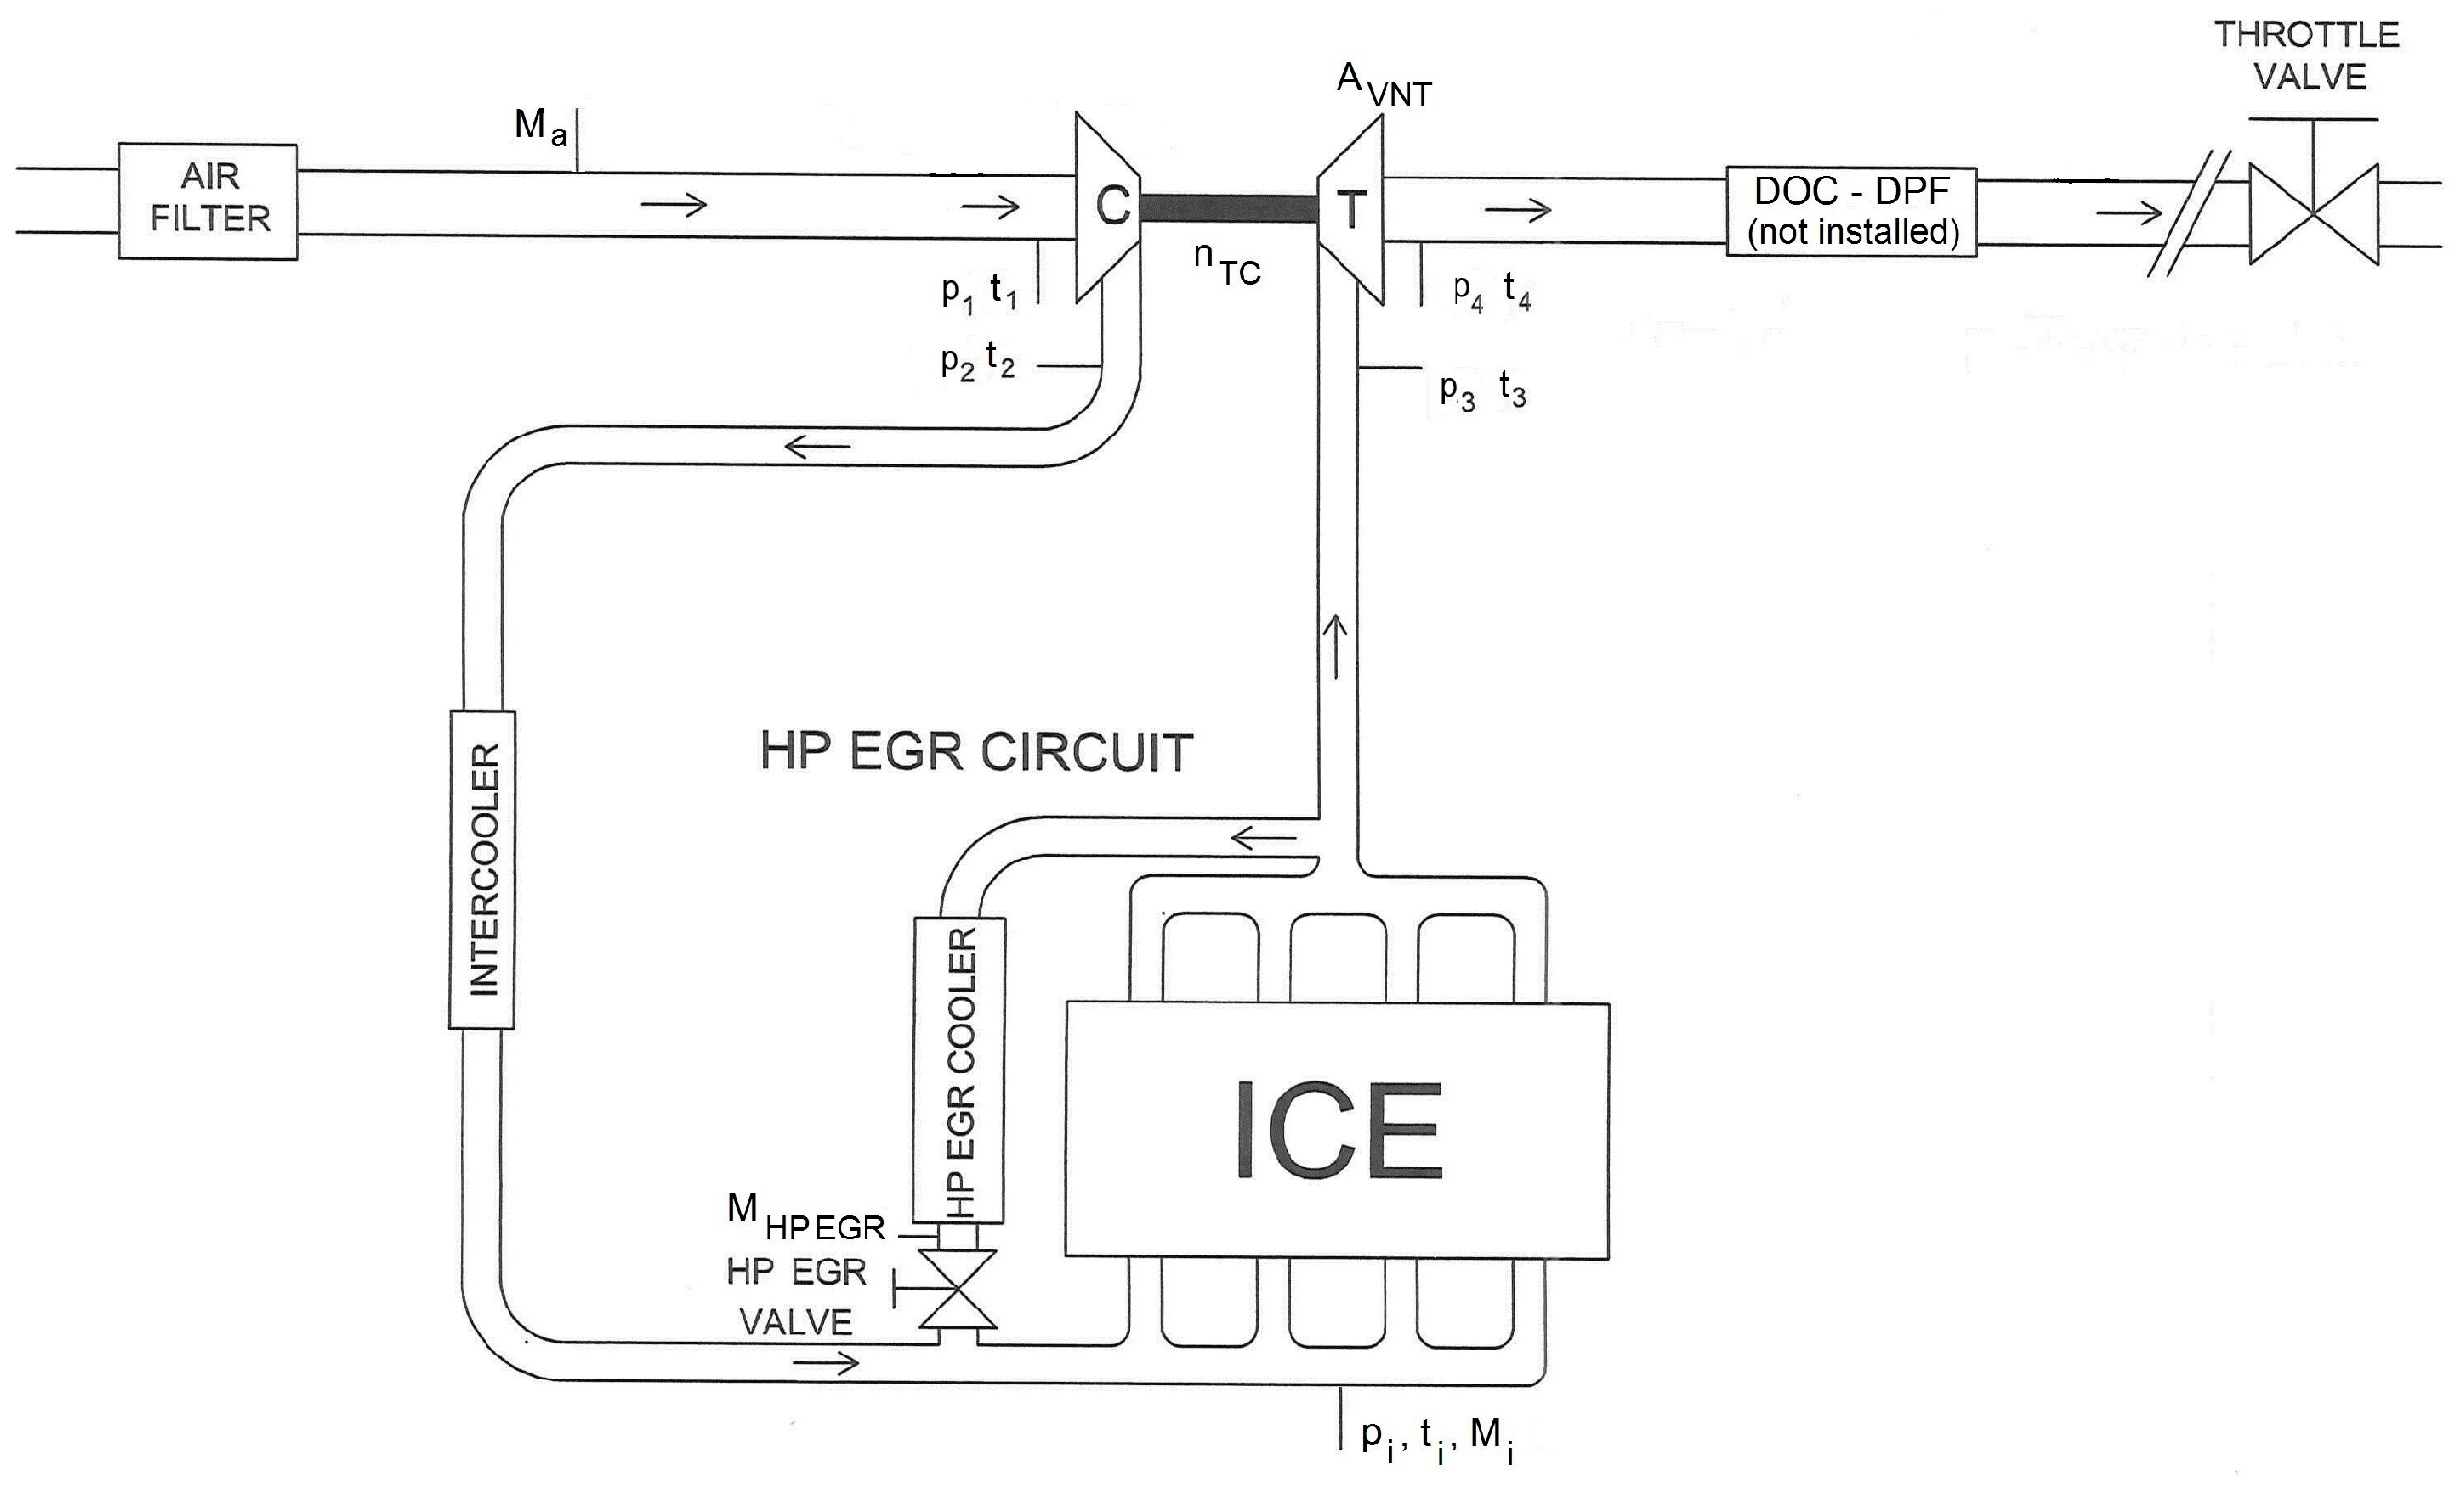
This section summarizes the main aspects related to the engine, instruments, assessment of heat release and combustion parameters, engine management system, tested fuels/blends, and investigation program. The goal is to provide information to allow the comparison between this investigation and other studies on biodiesel application.

2.1. Tested Engine

The main characteristics of the tested engine are listed in Table 1. The unit is an automotive turbocharged engine, with a downsized displacement, fitted with subsystems still representing state-of-the-art technologies. The Diesel Particulate Filter was not installed during the test in order to simplify engine operations. Measurements referred to raw emissions to identify the influence of blends and neat biodiesel on the engine output, excluding variations related to after-treatment devices.

2.2. Instruments and Measuring System

Figure 1 shows the scheme of the experimental test bench, based on a steady-state eddy current dynamometer, presenting the relevant nomenclature and the location of the transducers. Instrumentation aims at the measurement of the parameters listed in Table 2. Pressure and temperature values were measured in several locations of the intake and exhaust circuits, using strain gauge transducers, platinum resistance thermometers, and K-type thermocouples. Temperature levels of coolant, lubricant oil, and intake charge were managed to limit their influence on engine performance and to obtain a selected range of intercooler efficiency. Nitrogen oxide concentration was measured by an exhaust gas analyzer. Exhaust smoke in Filter Smoke Number (FSN) was measured by a variable sampling smoke meter. Soot concentration in [mg/m3] was estimated as a function of exhaust smoke according to a correlation provided by the instrument manufacturer. For specific emissions evaluation, the density of exhaust gases was assessed through the availability of pressure and temperature in the sampling sections of the NOX analyzer and the smoke meter. Volumetric flow rates of exhaust gases were then calculated, allowing for the assessment of NOX and soot mass flow rates, and then divided by the effective power to give the relevant specific emission (bsNOX and bsS).
Low-frequency measurements in steady-state conditions were made by an automatic data acquisition system, based on virtual instruments developed in Labview® version 2017. Data were processed in Excel®, evaluating statistical quantities of measured values (mean, standard deviation, coefficient of variation) and engine parameters.
As far as uncertainties are concerned, the relative value depends on the measured level of each parameter. For fuel consumption, the accuracy depends on the mass of fuel injected during the measurement, made with a time interval of 10 s. The overall uncertainties were calculated following the procedure presented in [40]. They change according to operating conditions, as shown in Table 3, presenting maximum values of relative uncertainties for brake specific fuel consumption (bsfc), NOX, and soot emissions. Experimental points are identified with the corresponding values of engine rotational speed n and brake mean effective pressure (bmep). Higher values are shown for soot, due to the lower accuracy of the smoke meter (Table 2).
In the case of in-cylinder peak pressure, the experimental acquisition was based on the sampling of 60 cycles for each mode. Therefore, the standard deviation of this parameter was evaluated and then compared to the uncertainty of the whole measuring chain, showing similar values. The overall uncertainty (estimated through [40]) shows levels around 1.5% for the different operating modes.

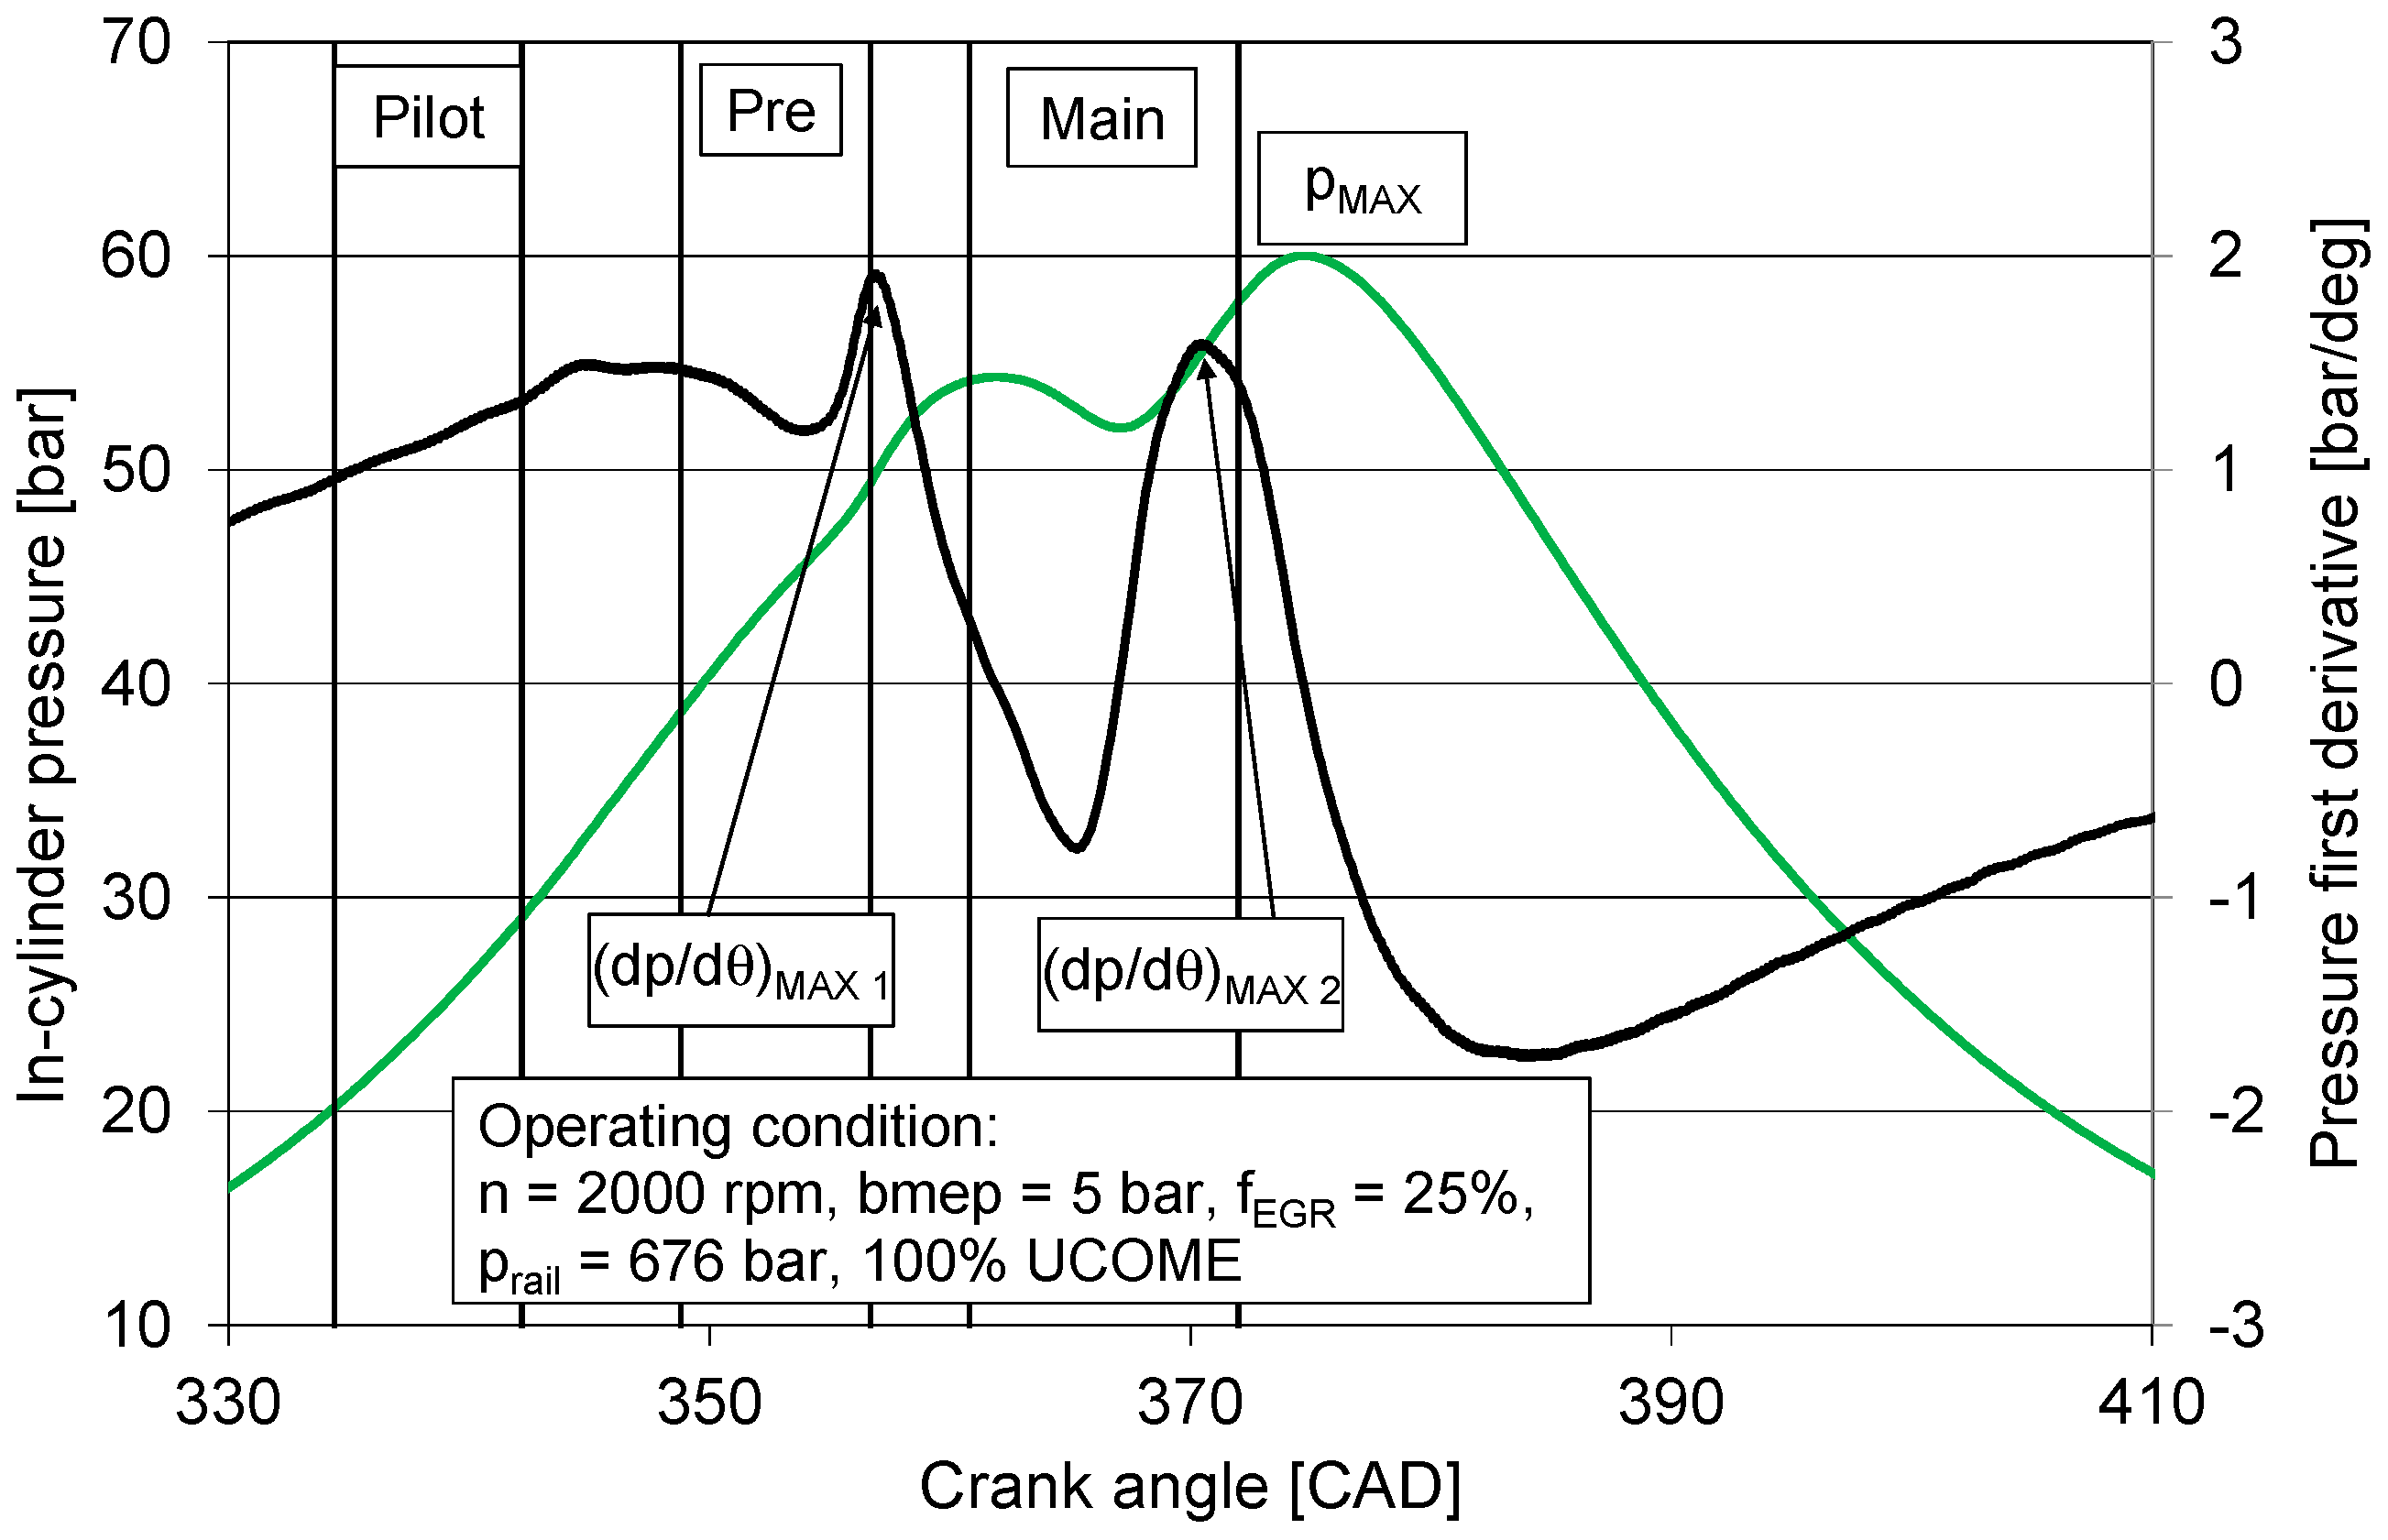
2.3. Pressure Diagrams, Heat Release Rate, and Combustion Parameters Evaluation

A dedicated high-frequency sampling system measured in-cylinder pressure diagrams. Four signals were acquired at a rate defined according to the engine rotational speed, to obtain a sampling period corresponding to a 0.1 crank angle rotation (i.e., 120 kHz for n = 2000 rpm). In-cylinder and fuel pressure upstream of the injector were measured through sensors and amplifiers listed in Table 2. Injector energizing current was assessed by a current sensor. Crank angle was gauged with a photoelectric incremental encoder.
LabVIEW® virtual instruments processed data for the calculation of absolute pressure levels, pressure signal filtering, average pressure diagram definition, and peak pressure assessment, together with the relevant crank angle. As mentioned in Section 2.2, 60 diagrams were sampled for each operating mode. Values of average and standard deviation of maximum pressure were calculated, together with the related coefficient of variation, allowing for the checking of combustion stability when replacing conventional fuel with blends or neat biodiesel, as discussed in Section 3.3 and Section 3.4.
The proper filtering of the pressure signal allows for the calculation of its first derivative (dp/dθ). An example of the two curves is shown in Figure 2. As three fuel delivery events (pilot, pre, and main) were actuated in the standard injection strategy, their timing and duration are also presented. As zero crank angle degree corresponds to the beginning of the intake stroke, combustion TDC occurs at 360 crank angle degrees. Two maximum values are apparent from the pressure diagram. The first is related to the compression stroke and to the combustion of pilot and pre-injections. The second maximum is given by the main combustion. The first derivative of the pressure signal shows two maximum values as well, (dp/dθ)MAX1 and (dp/dθ)MAX2, having the same relationship with the injection strategy.
The pressure gradient at the beginning of the two combustion phases can be related to noise emissions. Equation (1) [41] was applied to calculate the combustion noise indicator In:
In = n/nidle × [(dp/dθ)MAX1 + (dp/dθ)MAX2]/(dp/dθ)MAX,
where n and nidle are the engine speed values of the tested condition, and, in the idling mode, respectively, while (dp/dθ)MAX is the maximum value of the pressure derivative of the compression–expansion signal in the unfired engine, calculated at the same intake conditions. Even if Equation (1) is based on an indirect approach, the strong relationship between combustion noise and the rate of in-cylinder pressure rise in diesel engines is confirmed in [42], where it is concluded that this quantity represents a consistent indicator of noise levels due to combustion in diesel engines.
The calculation of the experimental rate of heat release was based on Equation (2), through a Fortran code developed by the main author:
(ΔQ/Δθ) = [k/(k − 1)] × p × (ΔV/Δθ) + [1/(k − 1)] × V × (Δp/Δθ) + (ΔQcoolant/Δθ)
ΔQ is the heat released during a crankshaft rotation Δθ. The three terms of the equation are obtained through the application of the first law of thermodynamics to cylinder gas, considering a complete combustion and setting the variation of mass due to fuel injection equal to zero [43,44]. The first term of Equation (2) is the product of the measured level of in-cylinder pressure and the corresponding variation of instantaneous cylinder volume. The second term is given by the pressure variation between two subsequent samples multiplied by the corresponding average value of cylinder volume. The last term corresponds to the heat transfer to the coolant, estimated using the Hohenberg correlation [45]. The instantaneous cylinder volume is calculated considering the measured crank angle and geometrical engine characteristics.
The evaluation of specific heats and their ratio was based on the composition of the intake charge, the amount of the different chemical components inside the cylinder during combustion, and the relevant temperature values, applying thermodynamic property functions of different chemical elements available in [46].
The fuel mass flow rate delivered in each calculation step was obtained from experimental data. Actual values of start of injection and injection duration for pilot, pre, and main events were estimated by adding proper delays at the start and end of the current signal, according to [47].
The burned mass fraction is calculated by integrating the heat release rate. It is then possible to identify the crank angles corresponding to the release of 10, 50, and 90% of the thermal energy available when completely burning the fuel. θ50 is the center of combustion, generally considered for its control. The difference between θ90 and θ10 is associated with the combustion duration, neglecting the initial and final phases. In fact, actual burning start and end angles assessment is affected by high uncertainties.
As in previous investigations [48,49], measured and calculated quantities obtained from pressure diagrams were considered to compare tested fuels and blends, also referring to their combustion, as discussed in Section 3.3 and Section 3.4.

2.4. Engine Management System

The engine management system includes an open electronic control unit (ECU), an EPROM emulator module, an ETAS® MAC2F interface, and a personal computer with the INCA® software. INCA manages the ETK module to perform three main tasks, which are, visualization of engine variables in real time, the choice of the requested maps available in the ECU, and the modification of control variables to actuate the experimental program.
The variable nozzle turbine is controlled either with open or closed loop strategies, depending on the engine operating point. The open-loop strategy is used at low levels of engine speed and load. In this case, the duty cycle applied to an electro-pneumatic valve (DCVNT) is selected. Consequently, a fixed value of variable nozzle turbine opening degree (AVNT) is actuated. This parameter is defined by Equation (3).
AVNT = [(SMAX − S)/(SMAX − SMIN] × 100 [%]
S is the shift of the turbine nozzle ring push rod (evaluated with a linear potentiometer). SMAX and SMIN are the corresponding maximum and minimum values. AVNT varies between 0 and 100 percent, leading to the minimum and maximum levels of turbine swallowing area.
At high values of engine speed and load, the ECU switches to the closed-loop control strategy, comparing the measured and set-point levels of intake pressure. DCVNT is modified, if necessary, to reduce this difference.
The fuel rail pressure (prail) control is based on a closed-loop approach. A pressure regulator is properly managed to reduce the difference between the prail measured and the set point values. The first is given by the onboard sensor fitted on the common rail. The second is evaluated by the ECU, depending on the engine operating point, or is fixed in the experimental program.
The high-pressure (HP) EGR system is managed through a closed-loop strategy, considering proper target values of excess air ratio (λ). The current level is calculated by measuring air mass flow rate, while fuel mass flow rate is selected by the ECU to produce the engine torque corresponding to the driver’s request. The electric HP EGR valve duty-cycle (DCEGR) is then controlled to reduce the difference between actual and target values, defining its opening degree and the mass flow rate of recirculated gases. To increase this quantity, lower values of λ must be set. EGR valve opening is then raised, achieving the requested reduction in air mass flow rate. A high value of λ (typically 6) is selected to close the valve and deactivate the EGR circuit.
EGR rate (fEGR) is defined by Equation (4)
fEGR = [MEGR/(MEGR + Ma + Mf)] × 100 [%]
Ma, Mf, and MEGR are the air, fuel, and EGR mass flow rates, respectively. Their sum corresponds to the total engine mass flow rate.
MEGR is calculated by applying an energy balance in the mixing section, considering the energy input of air and recirculated gases and the energy output of charge mass flow rates. To simplify the procedure, differences between specific heats at constant pressure and heat losses are neglected.

2.5. Tested Fuels and Blends

Some of the main properties of reference fuel (diesel B7), WCOME, and their blends are listed in Table 4. The two blends respectively included 40% and 70% of WCOME by volume. Tested biodiesel was supplied by an Italian refinery and is used to produce commercial B7 diesel. Therefore, its physical and chemical characteristics comply with the requested European standard for its application in the automotive sector. Fuel density was measured in the laboratory before each test. The biodiesel density was higher than diesel, with an increase of 5.3%. Therefore, blends with a higher content of biodiesel show rising levels of density compared to B7. Other characteristics were defined according to the literature. Lower Heating Value (LHV) for WCOME is the average of values presented in [50,51,52,53]. Decreasing LHV levels were estimated for the different blends. Percentage reductions compared to B7 are also presented in Table 4.
Oxygen, carbon, and hydrogen content were available in [50]. The stoichiometric values of air–fuel ratio (AFR) were then calculated, showing decreases due to the oxygen availability in renewable fuel. Finally, WCOME cetane number (CN) is similar to the reference one.
The composition of the tested waste cooking oil methyl esters was not known. The average content of the main fatty acid methyl esters (FAMEs) was defined considering different references [23,50,54,55,56,57]. As WCOME generally contains olive and sunflower oils [50], the fatty acid content of their methyl esters is presented in Table 5, where oleic and linoleic unsaturated fatty acids generally show the largest percentages.

2.6. Investigation Program

Two part-load engine operating conditions were chosen, with increasing levels of brake mean effective pressure at the same engine speed (Table 6). In each point, the HP EGR circuit was first managed, starting with the EGR valve fully closed, then applying three decreasing excess air ratios (i.e., increasing EGR rate), including the λ standard value and a lower level. In these four operating modes, the rail pressure standard level was applied. Then, at the higher EGR rate, the rail pressure was increased, firstly, by +7.5%, then, by +15%, compared to the standard set point.
The HP EGR control modifies turbine and compressor working conditions, so that the engine pressure gradient is modified, affecting fuel consumption and brake thermal efficiency. The variable nozzle turbine was, therefore, managed to keep the intake pressure at a constant level (shown in Table 7), selecting proper values of DCVNT (listed in Table 6), as both the tested operating conditions belong to the area of open loop control scheme.
As presented in Table 7, constant values were applied to injection parameters (pilot, pre, and main timing, duration, and quantity of fuel supplied in the pilot and pre injections) to remove the effect of their variations on engine behavior.
The operating modes listed in Table 6 were applied to all the fuels and blends considered in the experimental campaign (Table 4). The only exception was the neat biodiesel, for which only the second operating condition (2000 × 5) was tested.

3. Results and Discussion

The results are presented firstly considering the influence of high-pressure EGR system control on engine parameters in the two tested operating conditions for reference diesel oil, blends, and neat biodiesel. Therefore, trends are analyzed as a function of EGR rate, while keeping fuels/blends as a parameter.
Then, the effect of rail pressure control is shown for the maximum value of the EGR rate, considering most of the same quantities. In this case, trends are presented as a function of rail pressure for the tested fuels in both operating conditions. Referring to brake thermal efficiency and specific emissions, the comparison with the standard conditions will also be presented, to assess if an integrated control strategy of the three engine sub-systems allows for the enhancement of the different parameters when switching to blends with a high content of renewable fuel (or even 100% WCOME). In some cases, only outcomes for the 2000 × 5 experimental point are shown, for the sake of clarity.

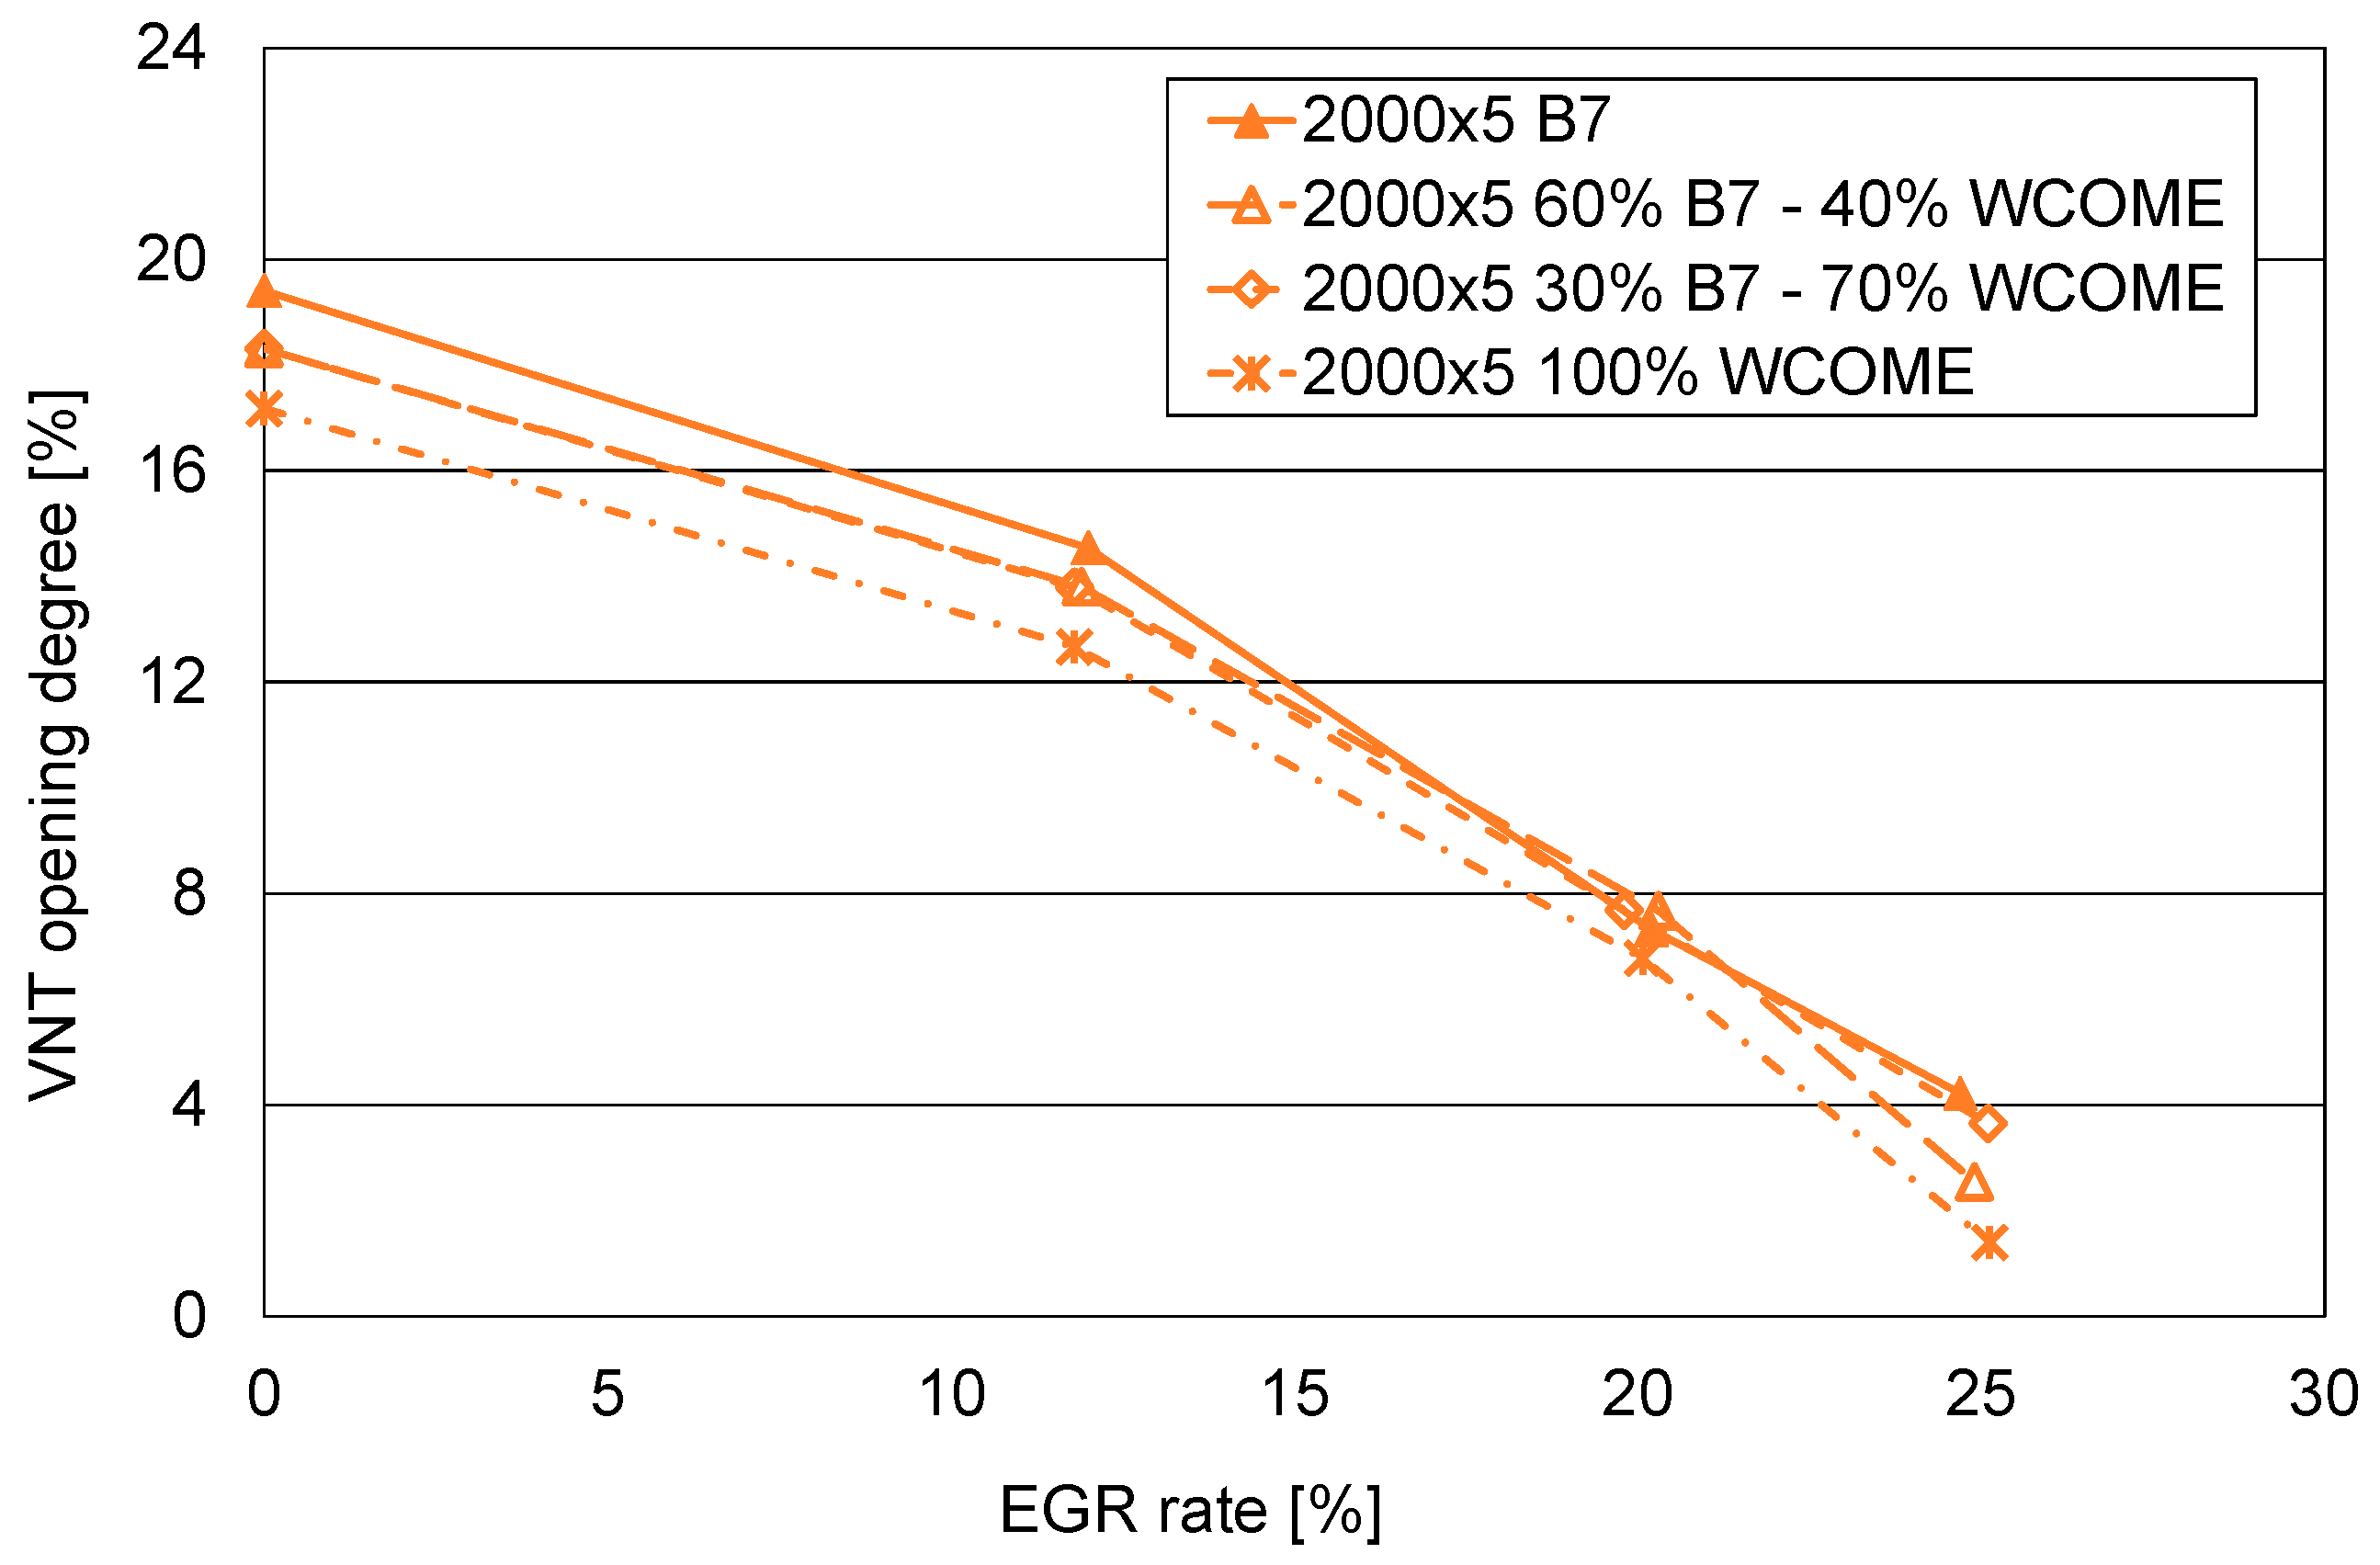
3.1. Influence of HP EGR System Control on Operating Parameters

Figure 3 provides values of the air fuel ratio, showing decreasing trends for higher levels of EGR rate, because of the wider replacement of intake air with recirculated gases. For bmep = 5 bar, AFR is, of course, lower, because of the larger amount of fuel required by the increased engine load. When introducing biodiesel, at constant load and EGR rate, a slightly lower level of AFR is observed, because of the increase in fuel consumption.
The variable nozzle turbine opening degree is shown in Figure 4, only for the 2000 × 5 experimental condition. The graph allows us to identify that, to keep the intake pressure at a constant value when higher EGR rates are applied (i.e., to fulfil the target related to the turbocharger control), a reduction in the turbine inlet area available for the gases entering the machine is requested, to compensate for their mass flow rate decrease. For the maximum EGR rate, AVNT is very close to zero. This behavior justifies the corresponding trends of the engine pressure gradient (calculated as the difference between turbine inlet pressure and intake pressure, i.e., p3−pi) presented in Figure 5. Due to the closure of the nozzle, increased levels of turbine inlet pressure are detected, leading to an increase in this quantity for higher EGR rates. Therefore, pumping losses are also increased, negatively affecting fuel consumption. Other choices are available for the management of turbine operations, modifying the interactions between the HP EGR circuit, the turbocharging system, and the engine. For example, a constant value of the variable nozzle turbine opening degree can be applied. In this case, EGR activation would lead to a reduction in engine pressure gradient, pumping losses, and fuel consumption, as discussed in [39,58]. Finally, intermediate strategies for AVNT management can also be considered. Limited variations of engine pressure gradient are outlined, comparing values at constant operating mode when changing the fuel; therefore, their effects can be neglected.

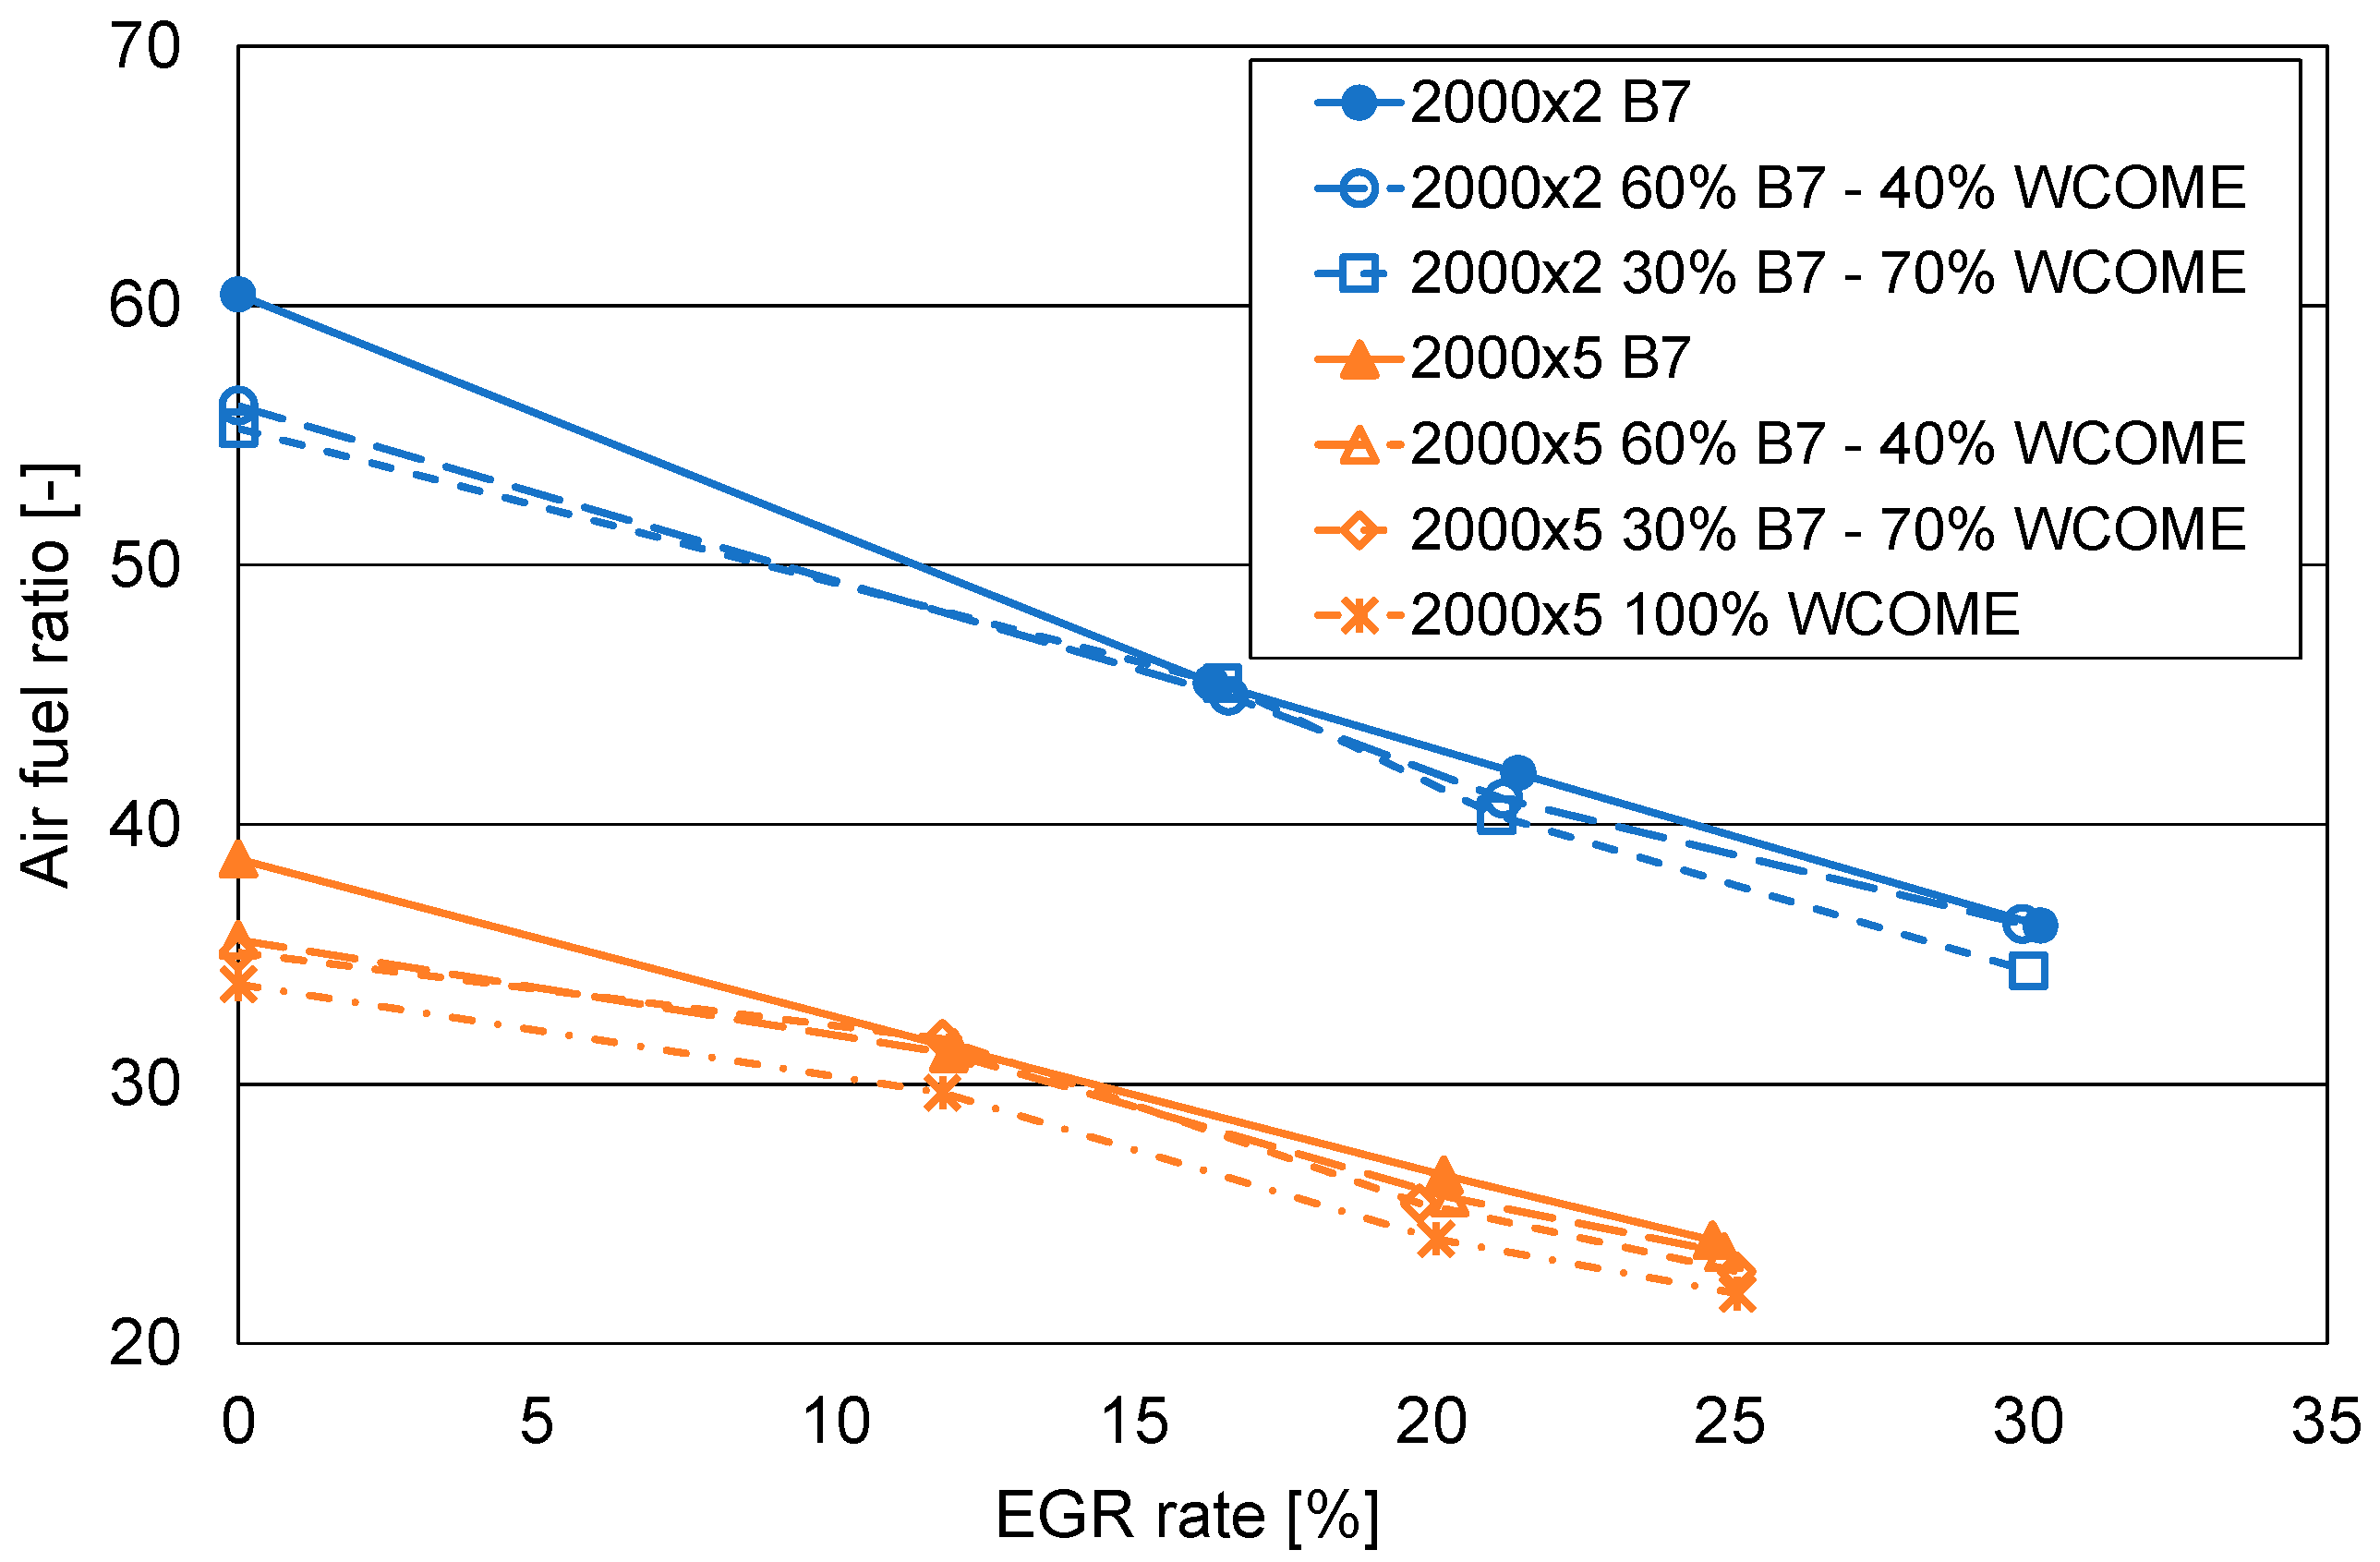
3.2. Influence of HP EGR System Control on Efficiency and Emissions

Brake-specific fuel consumption is shown in Figure 6. At constant operating conditions and fuel/blend, bsfc values increase with EGR rate, because of VNT control affecting engine pressure gradient and pumping losses, as outlined in Figure 4 and Figure 5. Compared to the levels measured without EGR, the highest percentage variations are detected for the maximum EGR rate, ranging between 4.8 and 7.4% in experimental point 2000 × 2 and between 3.5 and 6.6% in operating condition 2000 × 5, depending on the fuel. In any case, these variations are well above the corresponding uncertainties (Table 3).
When comparing values at constant operating conditions and EGR rate, higher values of bsfc can be observed replacing conventional B7 with the blends. Increasing WCOME content leads to a reduction in Lower Heating Value (Table 4). To supply the same amount of energy to the engine, a higher amount of fuel is required. The largest increase is measured when using pure biodiesel.
The effects on engine operations can be better identified considering brake thermal efficiency, presented in Figure 7, because the influence of LHV is removed by directly comparing energy output and input (i.e., the ratio between the effective power and the product between fuel mass flow rate and its LHV [44]). At constant operating conditions and EGR rate, better efficiency is obtained for larger WCOME content (even if in point 2000 × 5, blend with 70% of WCOME is better than 100% WCOME for standard and maximum EGR rate). It is worth noting that percentage variations are quite interesting, ranging between 3% and 6% in different operating modes. This output can be justified by a better development of the combustion process, outlined by the reduction in the combustion duration discussed in Section 3.3, as also assessed in [12,59]. A better bte is generally observed when testing biodiesel, as already outlined in the Introduction [12,22] and observed in an investigation on WCO [60].
On the other hand, at constant operating conditions and fuel/blend, a reduction in efficiency is observed at higher EGR rates, because of the increased fuel consumption. Of course, the higher bmep level is associated with higher values of efficiency and lower levels of bsfc, because of the reduced negative influence of thermal and mechanical losses.
Brake-specific NOX emissions are presented in Figure 8. The expected influence of EGR is confirmed, thanks to the dilution effect, which decreases the oxygen concentration in the combustion chamber. Referring to the operating mode without EGR, reductions are around 55% and 68% in the two experimental conditions when adopting the standard value of excess air ratio, corresponding to an EGR rate equal to 20% in both cases. When the EGR valve is further opened, the EGR rate reaches 30% at point 2000 × 2 and 25% at point 2000 × 5, and the decreases in NOX emission are around 70% and 80%, respectively. Even if trends are not as clear as in the case of fuel consumption and efficiency, at constant operating conditions and EGR rate, the use of blends and neat biodiesel leads to an increase in NOX emissions. As already discussed in the Introduction, the influence of biodiesel on NOX emission can be different, according to the prevailing effects related to the involved phenomena.
A larger formation of NO can be related to the oxygen content of biodiesel [21]; the decrease in the formation of soot in the combustion chamber, leading to a higher temperature because of the lower heat dissipated by radiation [21,22]. Other aspects are the changes of cetane number (but close values are estimated for tested blends, Table 4), variations of injection parameters (kept constant in this study, Table 7), and interactions between the main properties of biodiesel and engine control strategies [21]. Fuel physical characteristics and the relevant changes in flame structure and temperature are mentioned in [12] as the main factors affecting NOX formation.
Lower NOX emissions are related to local effects, such as the decrease in LHV (Table 4), leading to lower heat locally available, thus resulting in lower temperature levels, as discussed in [53]. Furthermore, adiabatic flame temperature can decrease [26] because of the different content of carbon and hydrogen in diesel and biodiesel, while variations of the air–fuel ratio can be observed, as a consequence of the oxygen coming from biofuel molecules. Finally, biodiesel chemical structure influences the combustion process development. This is mainly due to the number of double carbon bonds [61], resulting from the content of unsaturated fatty acid methyl esters and the iodine number. Referring to this aspect, controversial effects can be found in the literature. On one side, these quantities have a negative impact on NOX emissions, even if with limited effects for common rail engines [21]. However, in other studies [55,62], a new parameter was proposed, namely, the Degree of Unsaturation (DOU). DOU values of methyl esters of vegetable oils are lower (e.g., 1.7 for olive methyl ester, 2.6 for sunflower methyl ester, 3.0 for diesel oil [55]). Lower DOU values lead to a reduction in NOX emissions.
In this investigation, negative effects prevail, leading to the observed increase shown in Figure 8.
Brake-specific soot emissions are presented in Figure 9. EGR activation leads to an increase in this pollutant because of the reduction in oxygen availability [21,24,25]. The increase is larger for the conventional B7 diesel oil. When switching to blends, the oxygen content of biodiesel partly (2000x5) or totally (2000x2) compensates for the dilution effect induced by EGR. Differences between the two points are probably related to the different levels of AFR. Oxygen coming from WCOME is directly involved in the combustion process, reducing the extension of local fuel-rich zones inside the cylinder, especially at the ignition of the mixture [12]. There is a general agreement on the reduction in soot emissions when using WCOME [32,34,36,37,60], even if the overall effects on limited soot formation and modified soot oxidation are quite complex [12].

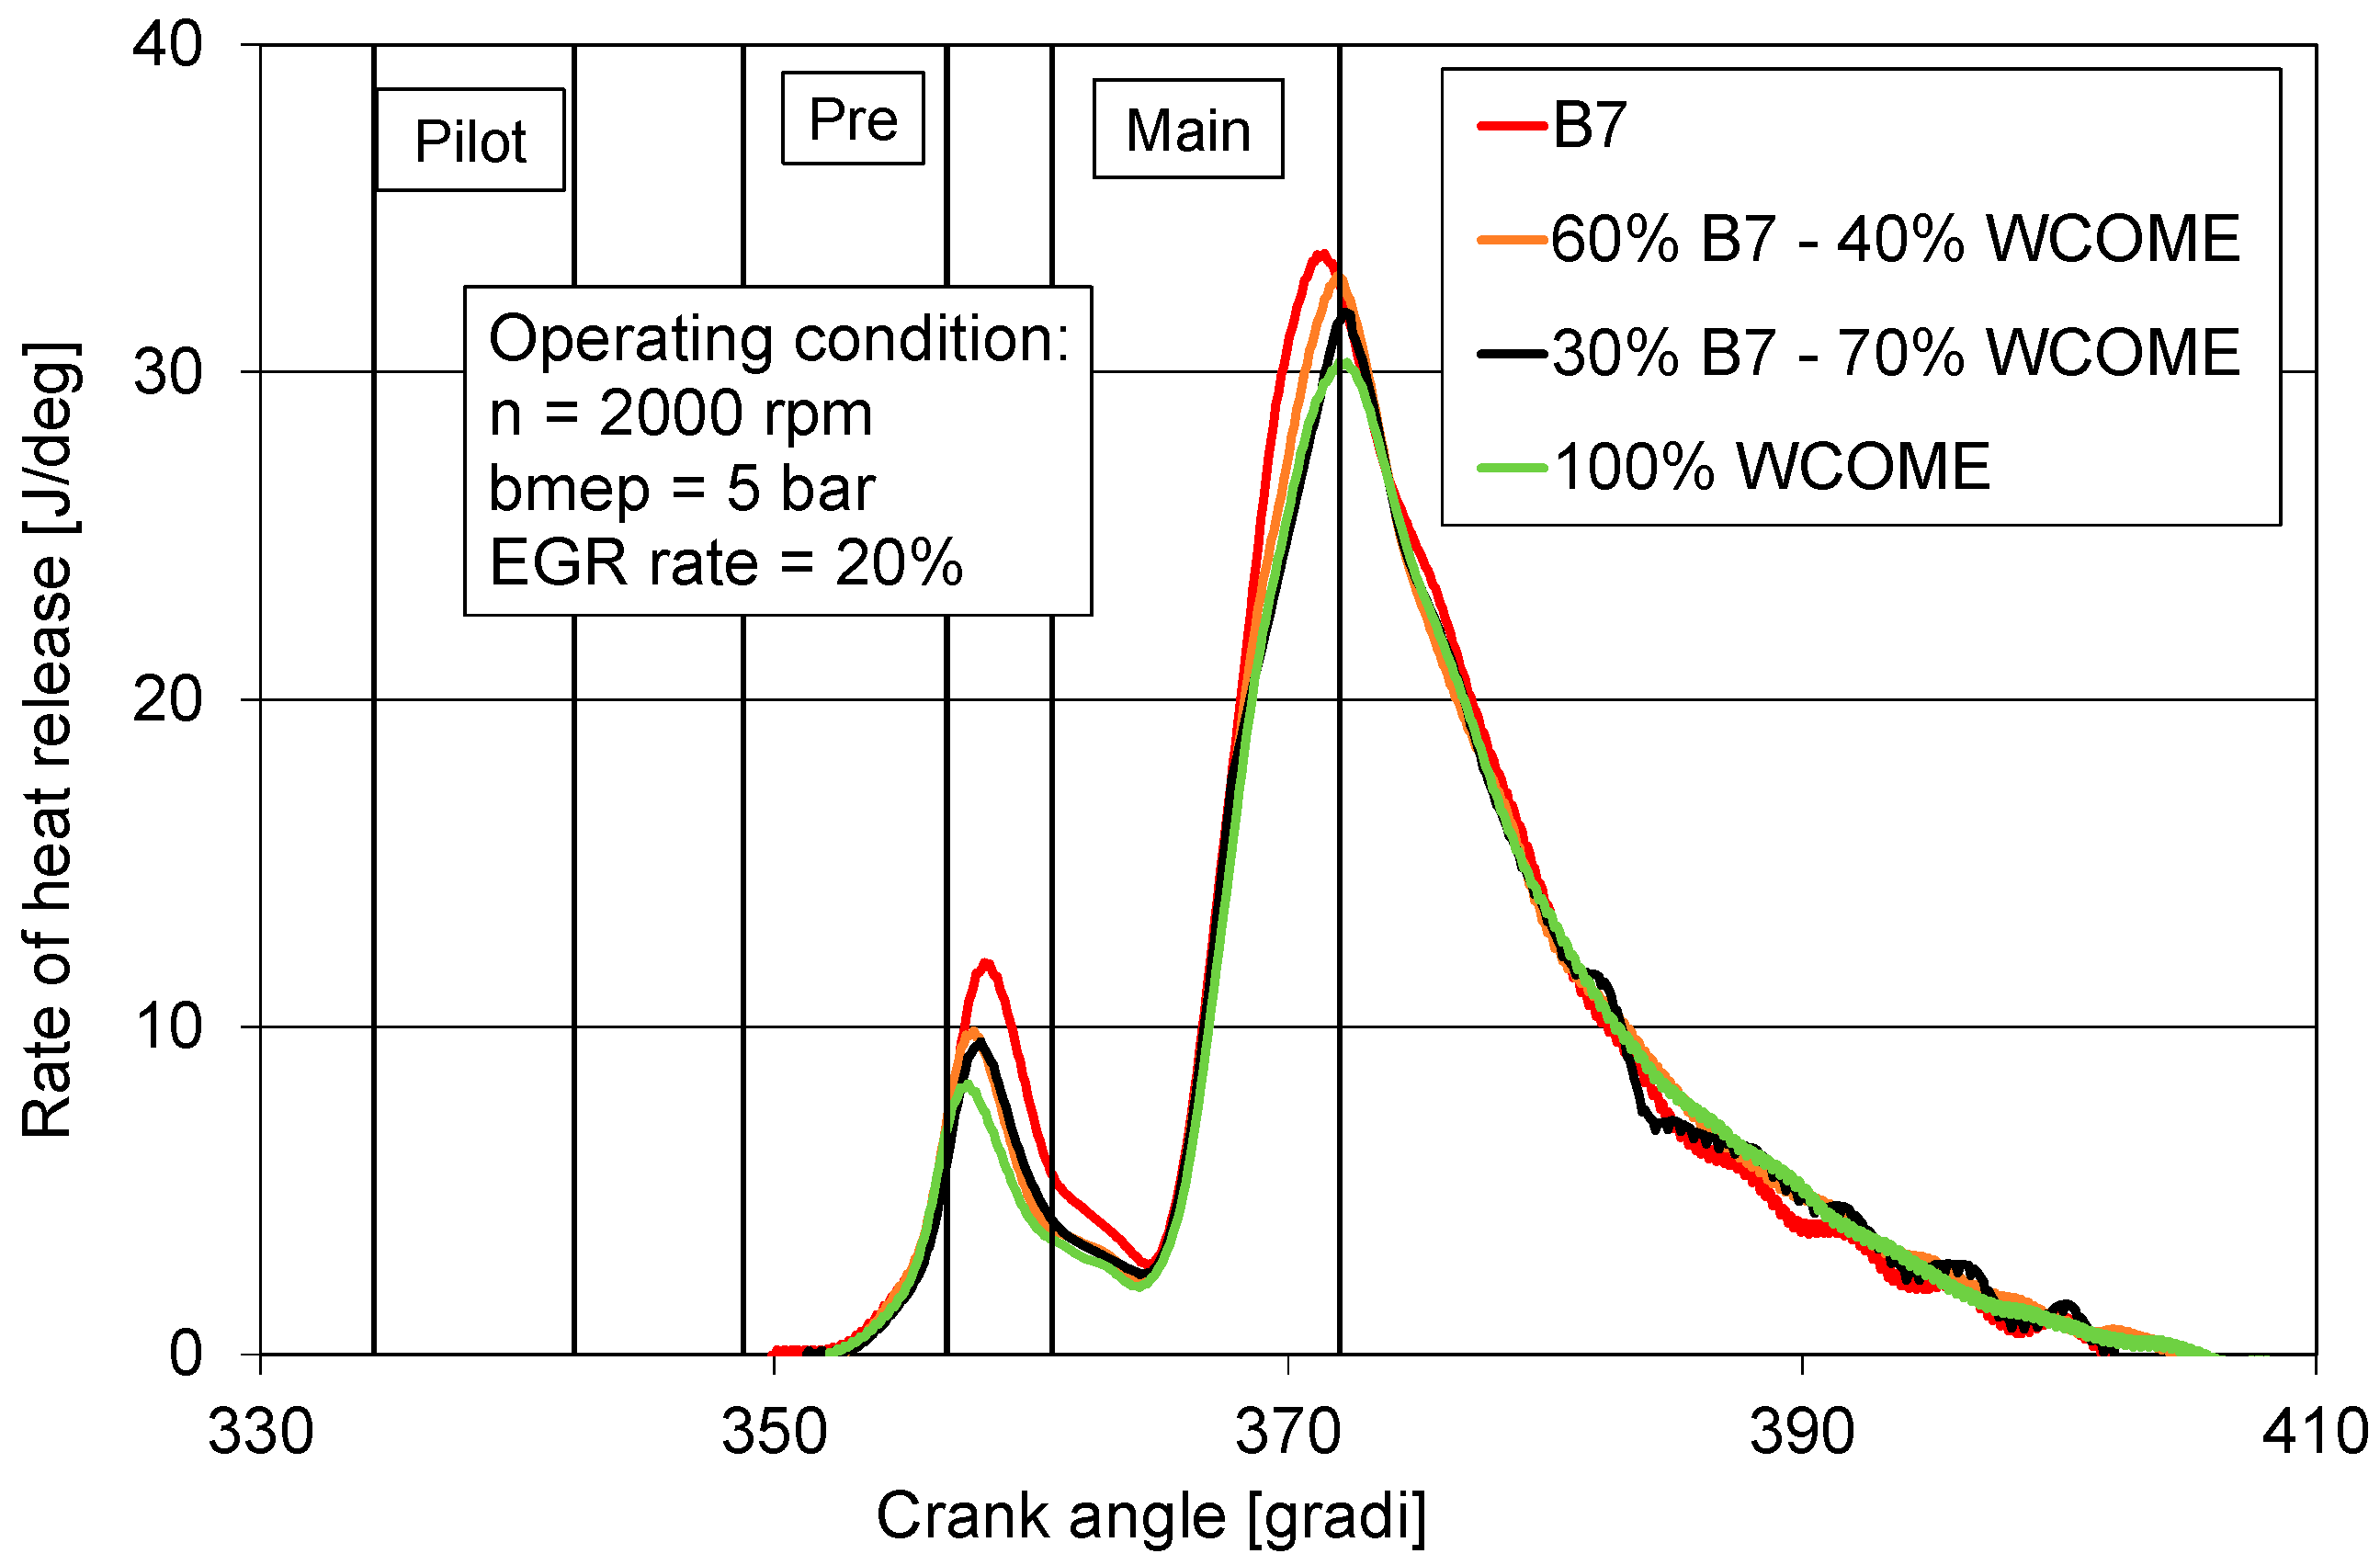
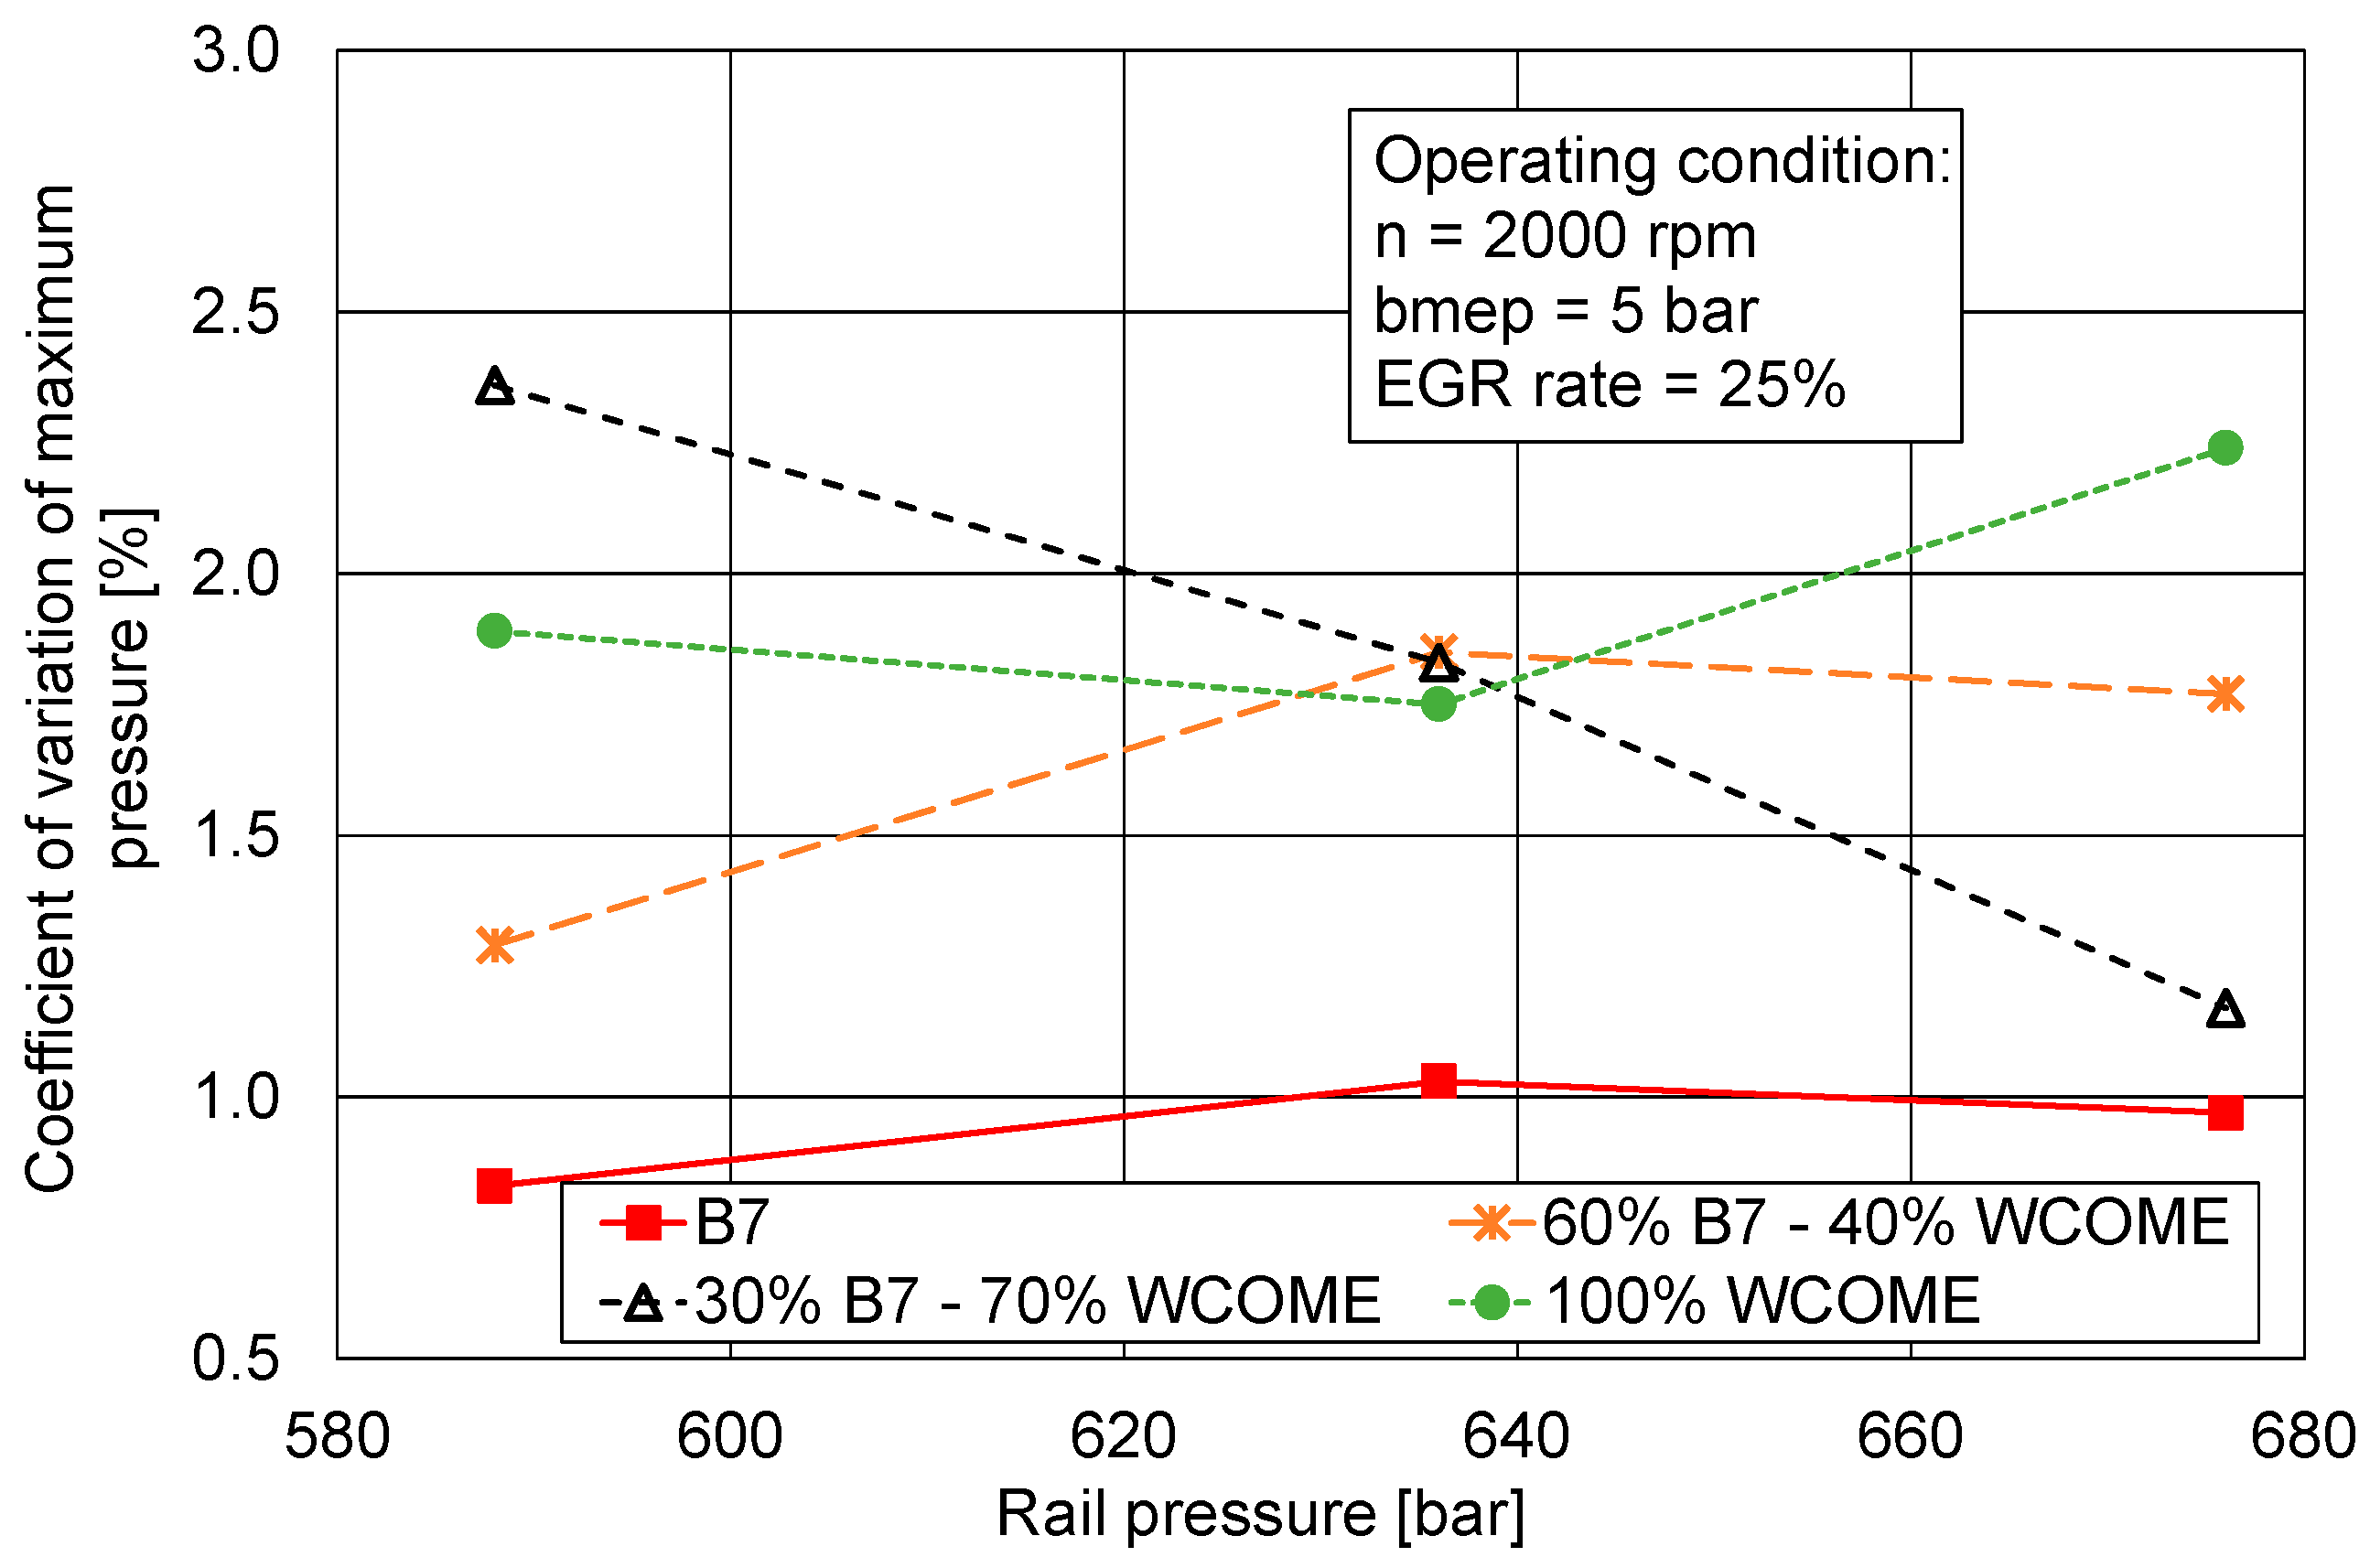
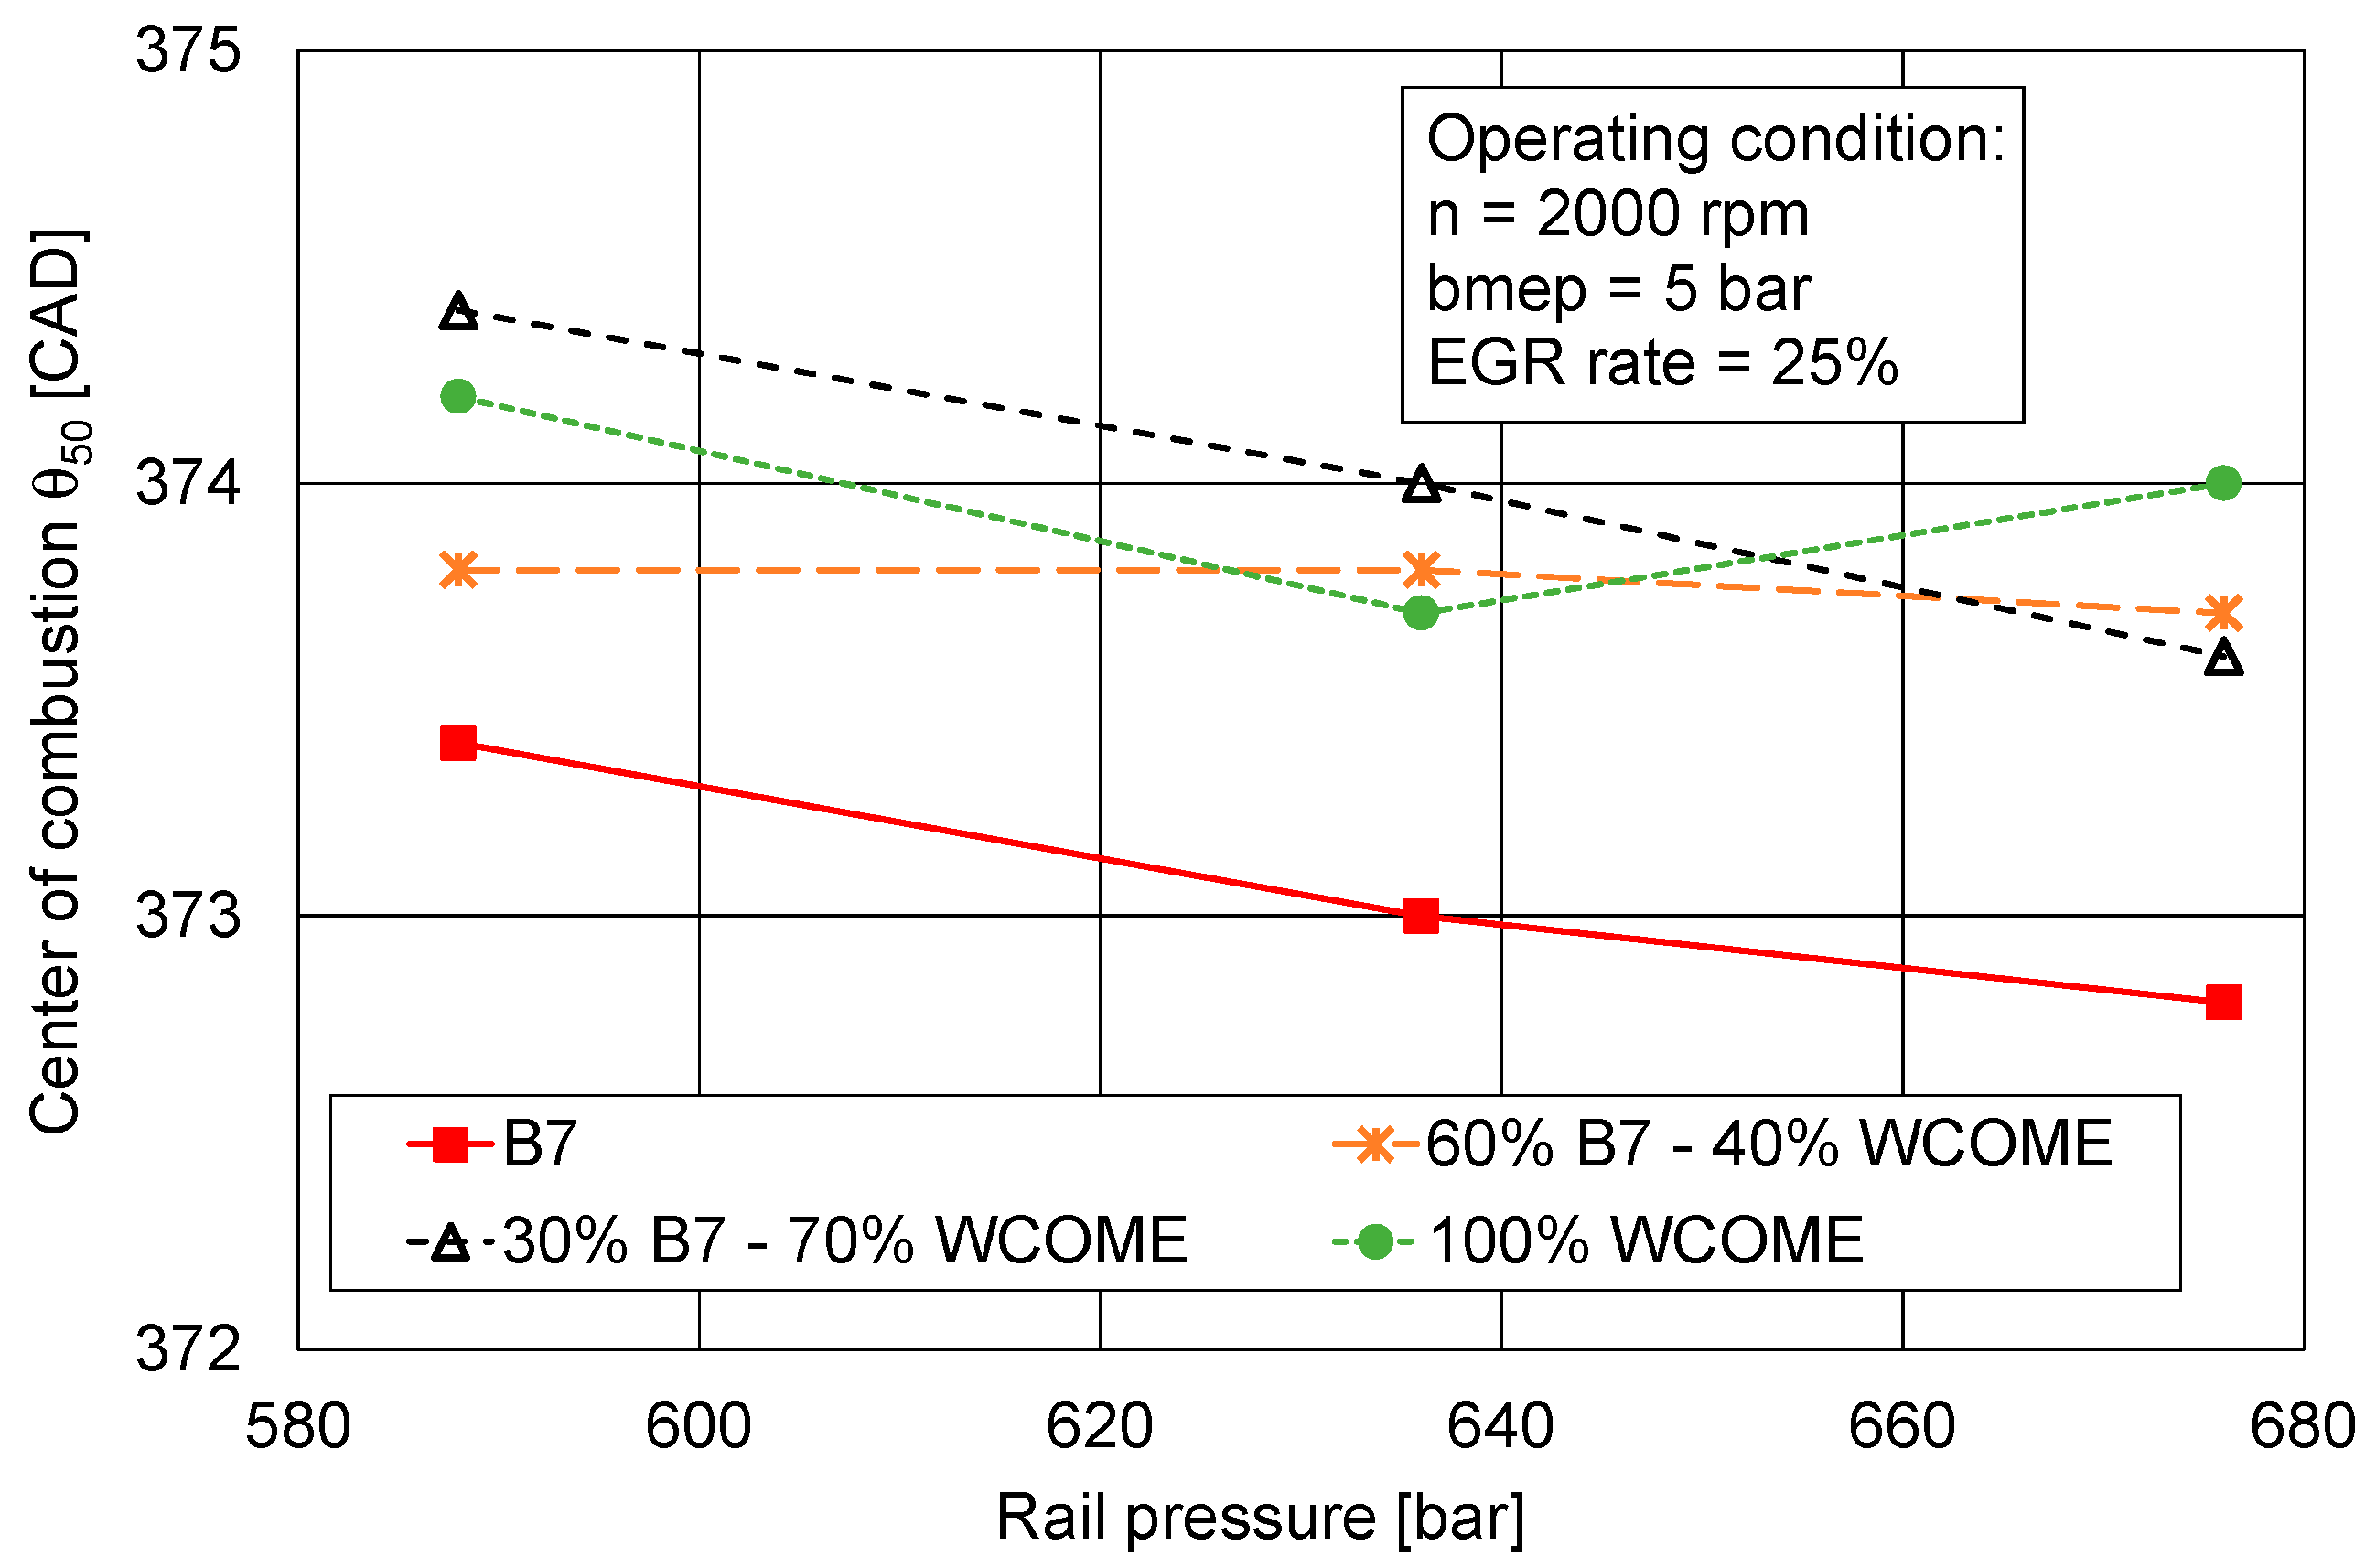
3.3. Influence of HP EGR System Control on Combustion Parameters

Figure 10 presents trends of the coefficient of variation of maximum pressure for one of the tested operating conditions (2000 × 5), obtained from the processing of indicated pressure diagrams described in Section 2.3. This quantity is an index of combustion stability, which is verified if CoV is lower than 2–3% [63]. There is no clear influence of EGR rate on this parameter. The lowest values are apparent for the reference B7 diesel oil, while a slight increase can be observed when considering blends or neat biodiesel. Anyway, combustion stability is always granted.
Figure 11 shows the behavior of the center of combustion, θ50. The increase in EGR rate leads to a shift in the combustion within the expansion stroke, as the θ50 values are slightly higher moving along a line for each tested fuel/blend. A similar outcome is apparent when comparing levels measured for B7 diesel oil with those corresponding to blends and neat biodiesel in the same operating mode. Replacing the conventional fuel with the alternative one or its blend leads to higher values of θ50. This outcome is justified in [12] with the higher viscosity of biodiesel, leading to poorer atomization and longer ignition delay (in [12], the tested engine was fitted with a mechanical injection pump, allowing it to provide fuel in a single event). A further contribution to the slower development of the combustion process in the initial phase may be related to the higher density of WCOME and its blends (Table 4). As explained in [21,24,26], spray development, fuel droplet diameter distribution, and the mixture formation depend on viscosity and density. Furthermore, the evaporation rate depends on the distillation curve of WCOME [21] and its oxygen content [24].
To better understand the influence of tested fuels/blends on the combustion, Figure 12 presents the rate of heat release (ROHR) for operating mode No.9 for the four different cases. Trends of ROHR allow us to identify that no significant variations of ignition delay can be observed at the start of the first combustion phase involving fuel injected during the pilot and pre-event. This is in line with the values of CN reported in Table 4 for B7, WCOME, and their blends. The maximum values of heat release in the two combustion phases show a decrease when higher biodiesel content is considered, confirming the slower process in the initial phase outlined by the behavior of θ50. Furthermore, the slope of the ROHR curve at the beginning of the main combustion is decreasing moving from B7 to neat WCOME.
A further consequence of changes in combustion resulting from EGR rate control and use of different fuels/blends is related to maximum values of in-cylinder pressure, presented in Figure 13. For a fixed fuel, increasing the EGR rate leads to a reduction in peak pressure, because of the slower process, and due to a decrease in the overall amount of charge trapped inside the cylinder. At a constant EGR rate, the peak pressure is reduced, increasing the WCOME content, because of the effects shown in Figure 11 and Figure 12.
When analyzing values of the combustion duration θ90–θ10 (Figure 14), opposite effects are apparent for EGR and renewable fuel. While EGR leads to a slower combustion process because of the dilution effect, a shorter duration is obtained for blends and 100% WCOME, at constant operating mode. Therefore, it can be deduced that the use of biodiesel results in a slightly slower process at the start of the combustion (as θ50 moves far from TDC), but in a shorter duration, considering the overall reaction. The same result is reported in [12,59]. Biodiesel combustion accelerates near the end of combustion, overtaking the process of diesel combustion. In the turbulent diffusive flame front typical of diesel combustion, the oxygen supply to the unburned fuel is gradually reduced. In the case of biodiesel, fuel-bound oxygen content compensates for the effects of locally insufficient oxygen.
A further effect is apparent when analyzing the combustion noise index In, defined by Equation (1) and presented in Figure 15. In this case, when EGR increases, a slight reduction in the index is assessed, because of the slower combustion process in the first phase involving fuel delivered by the pilot and pre-injections and at the beginning of the main injection, with decreased levels of maximum pressure gradients. At a constant EGR rate, increasing WCOME content also leads to a reduction in In, because of the decreased speed of combustion in the first phase [12].

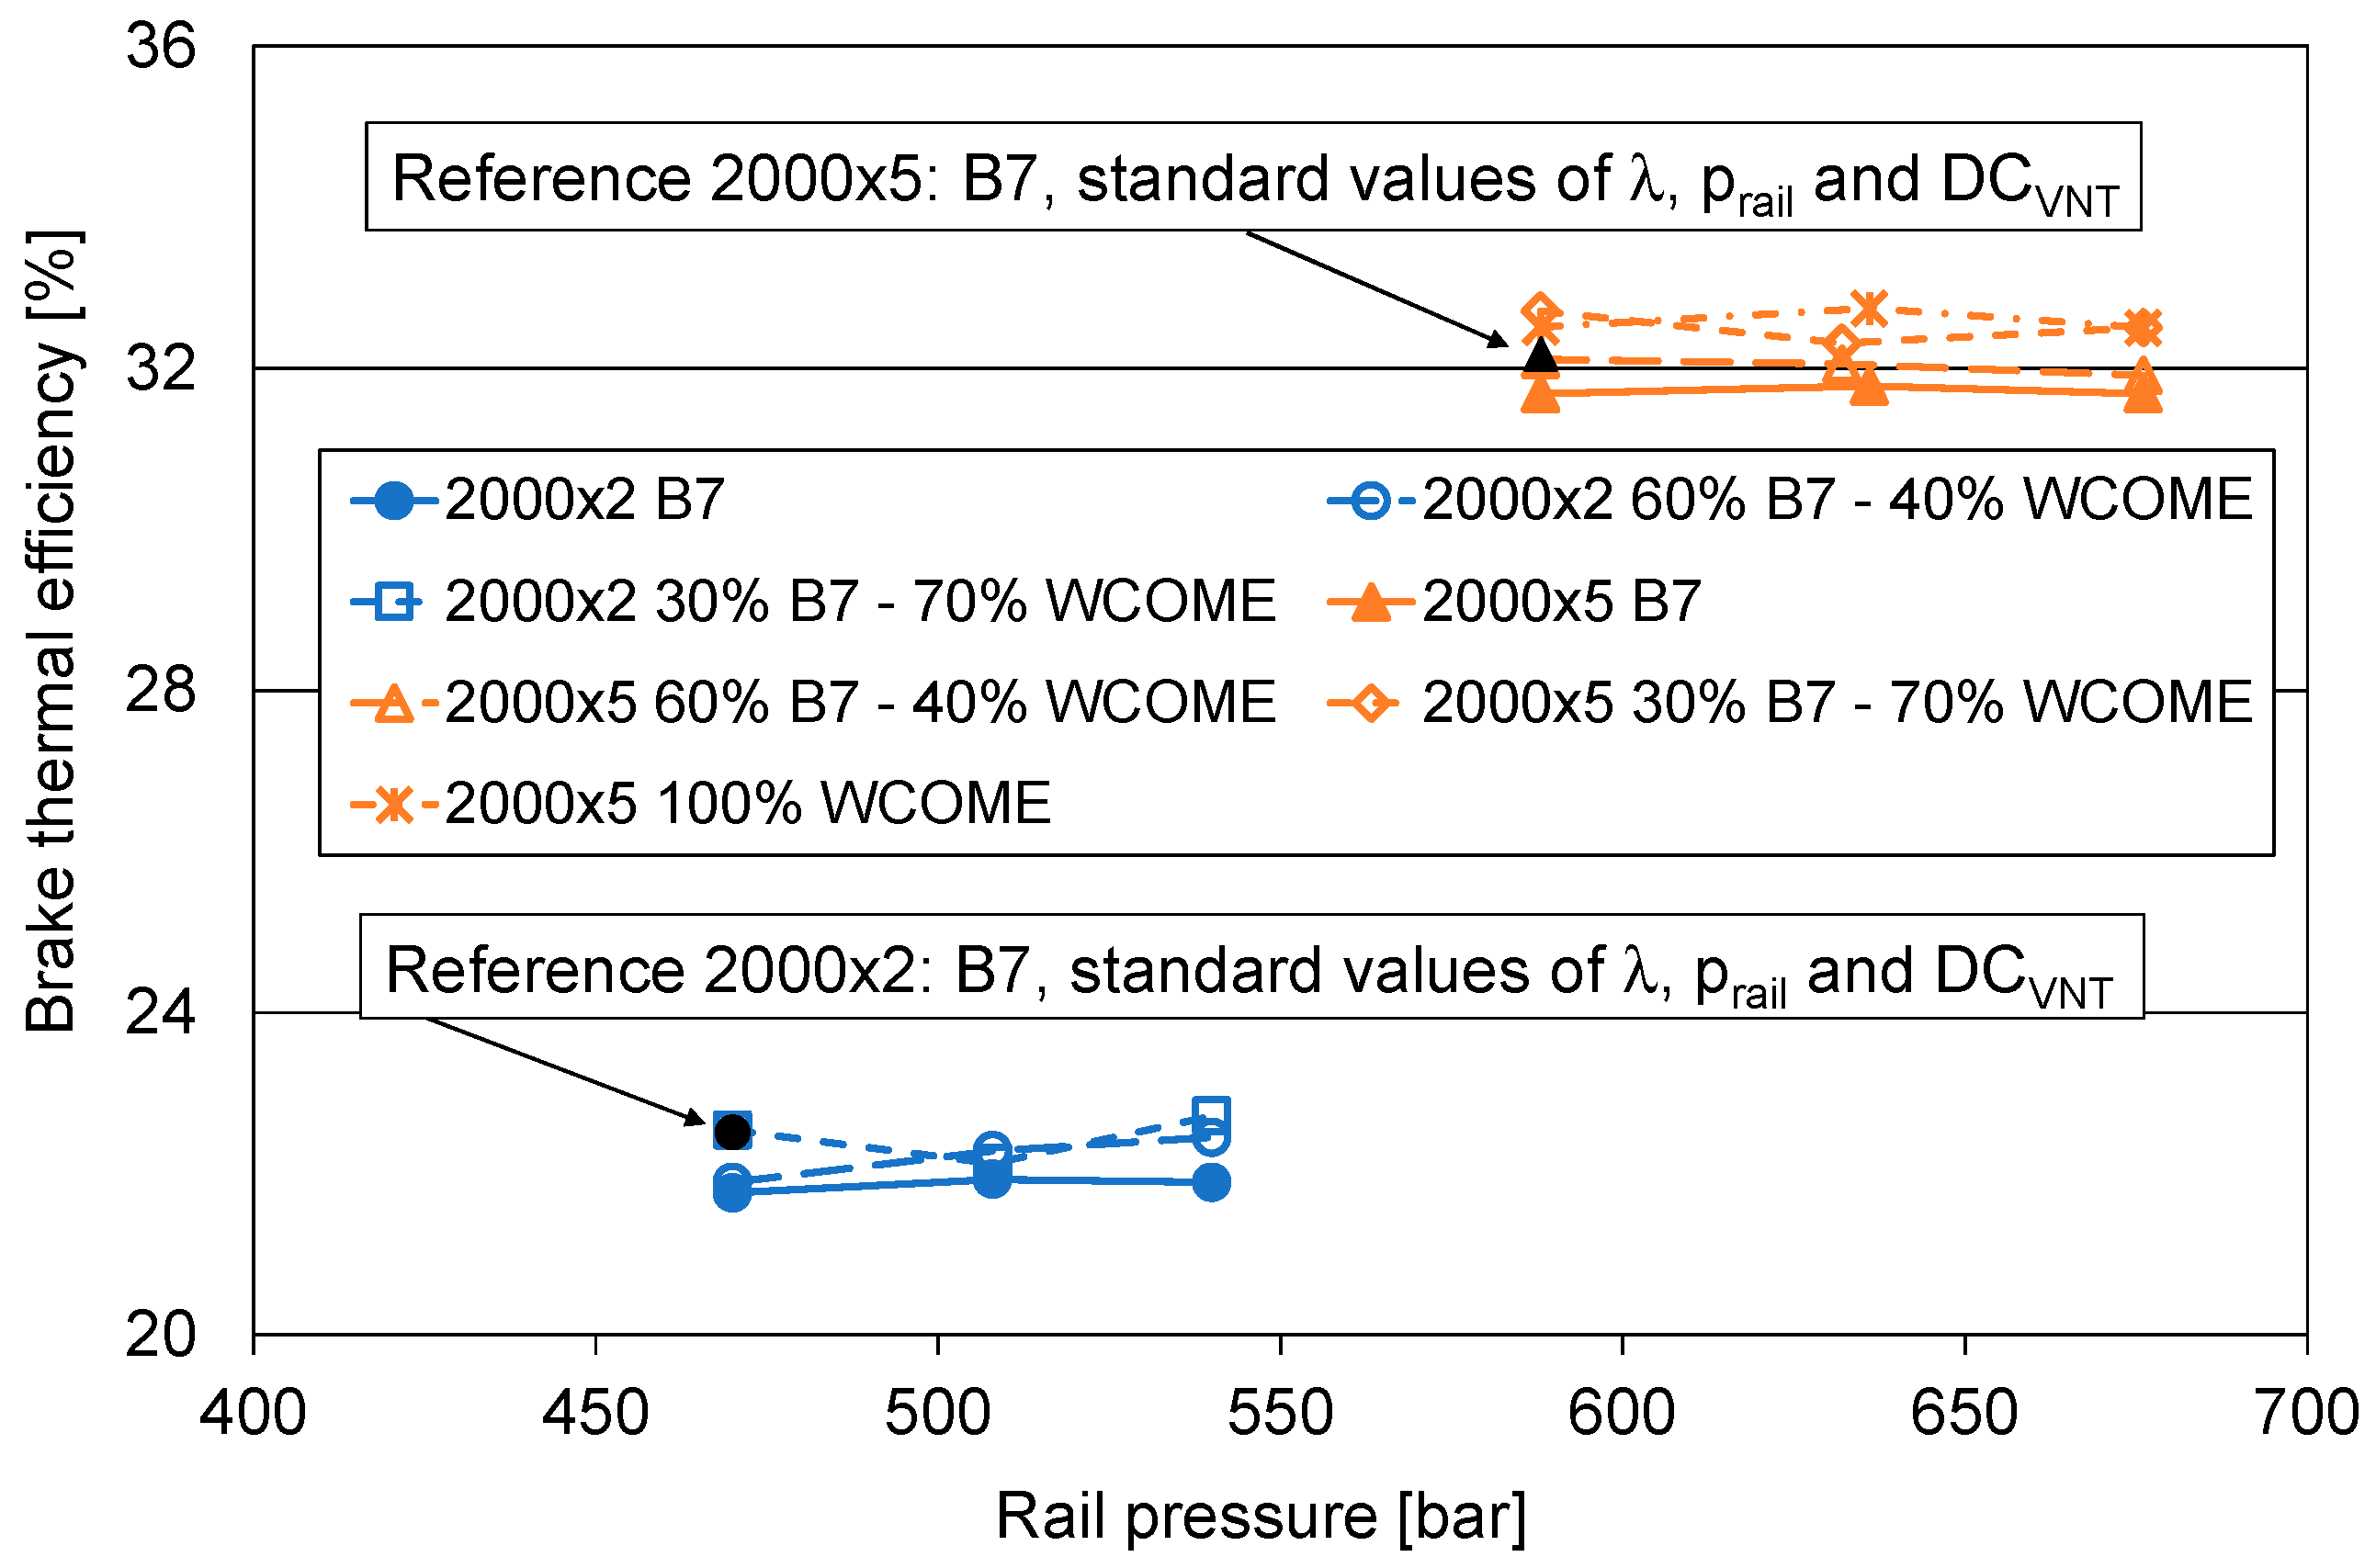
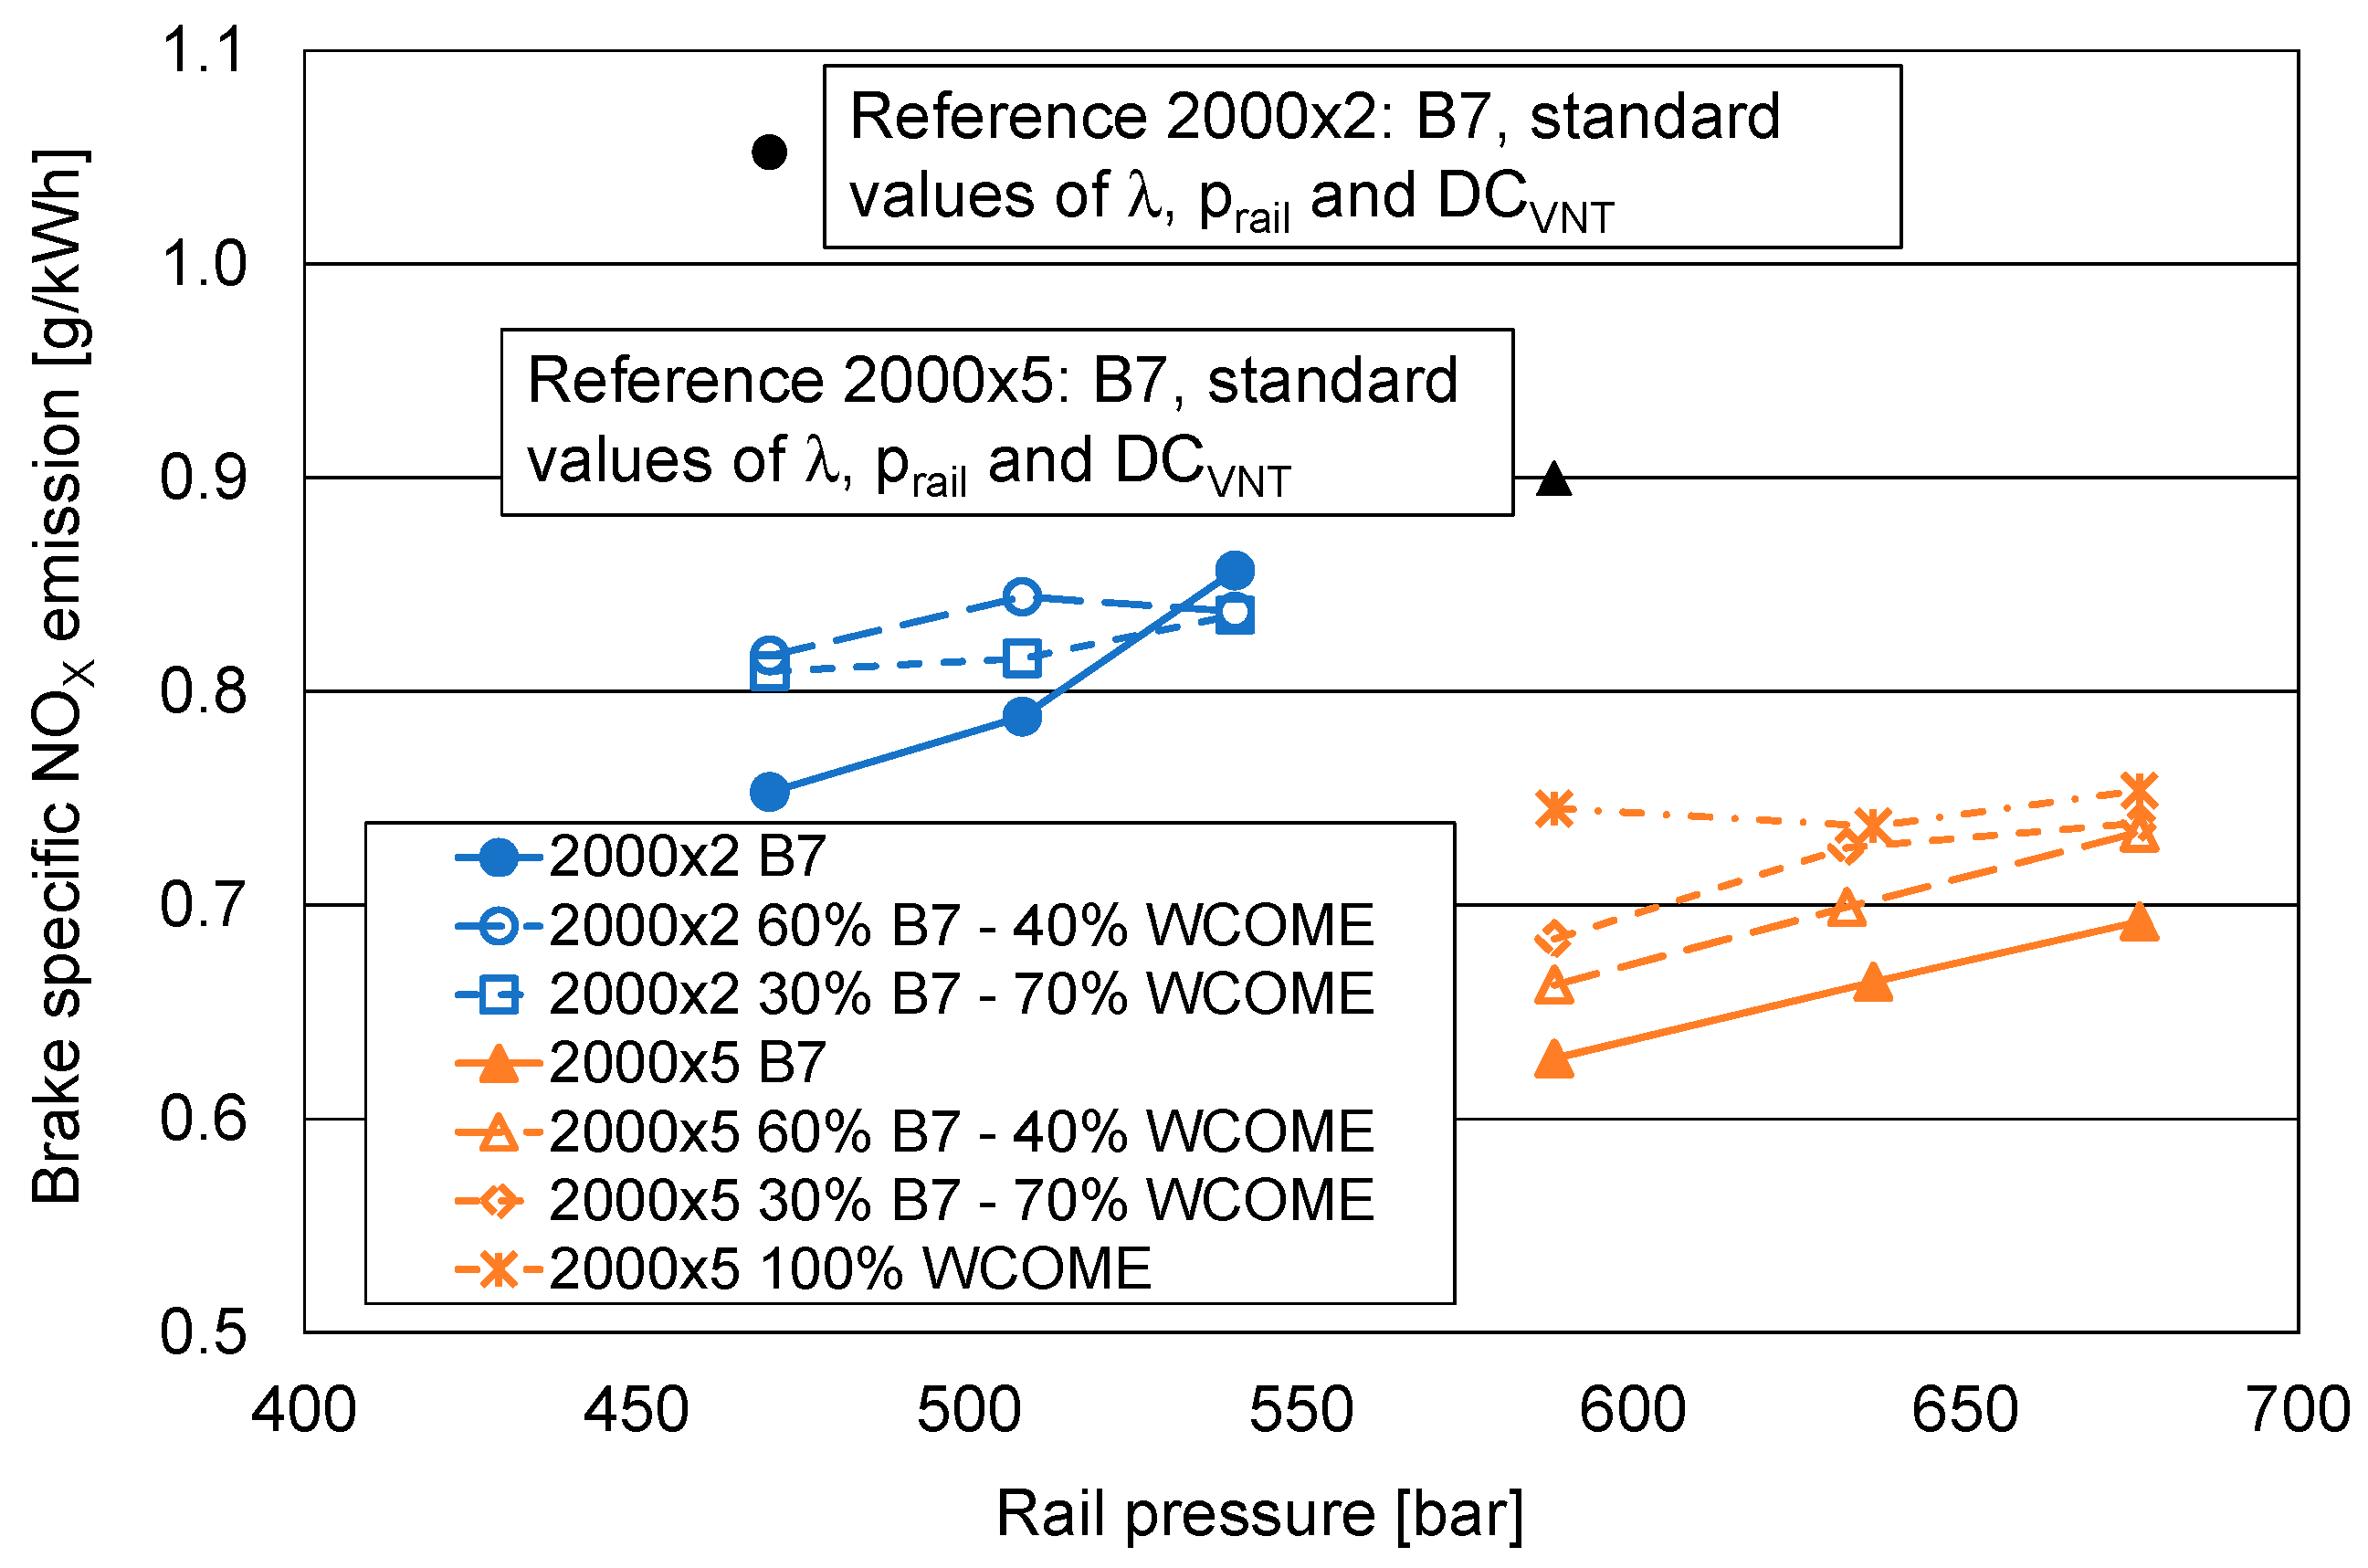
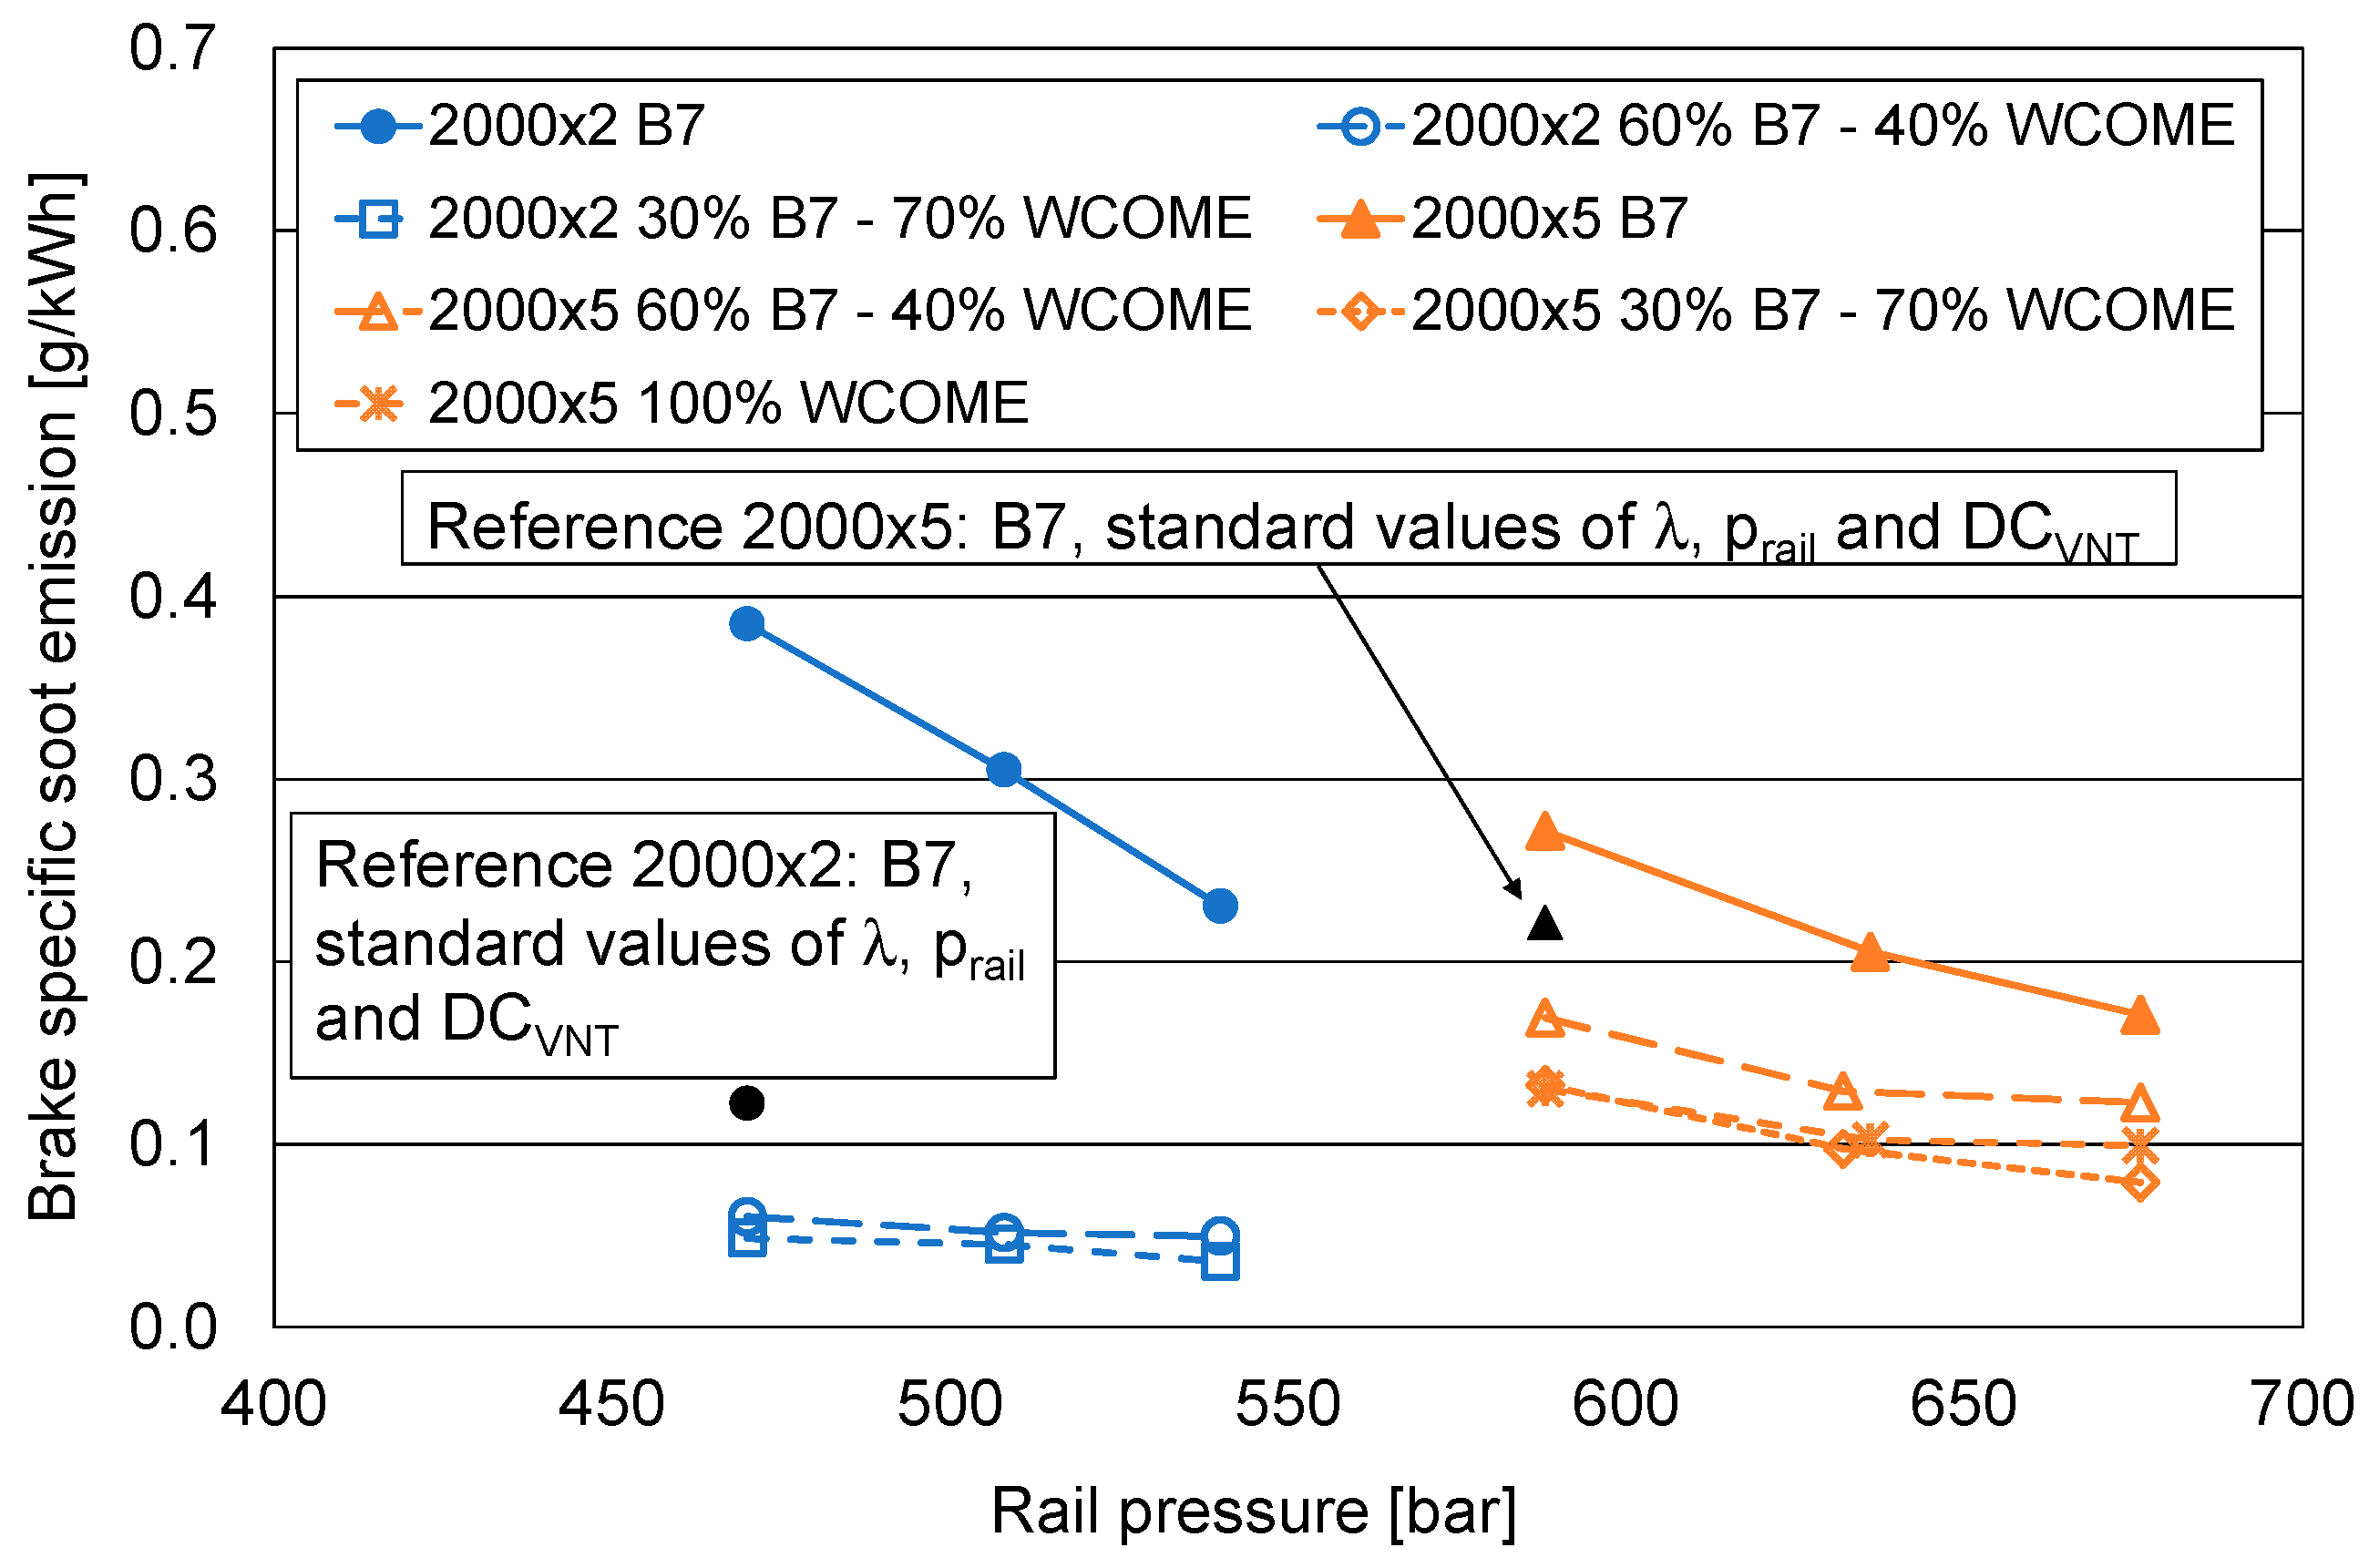
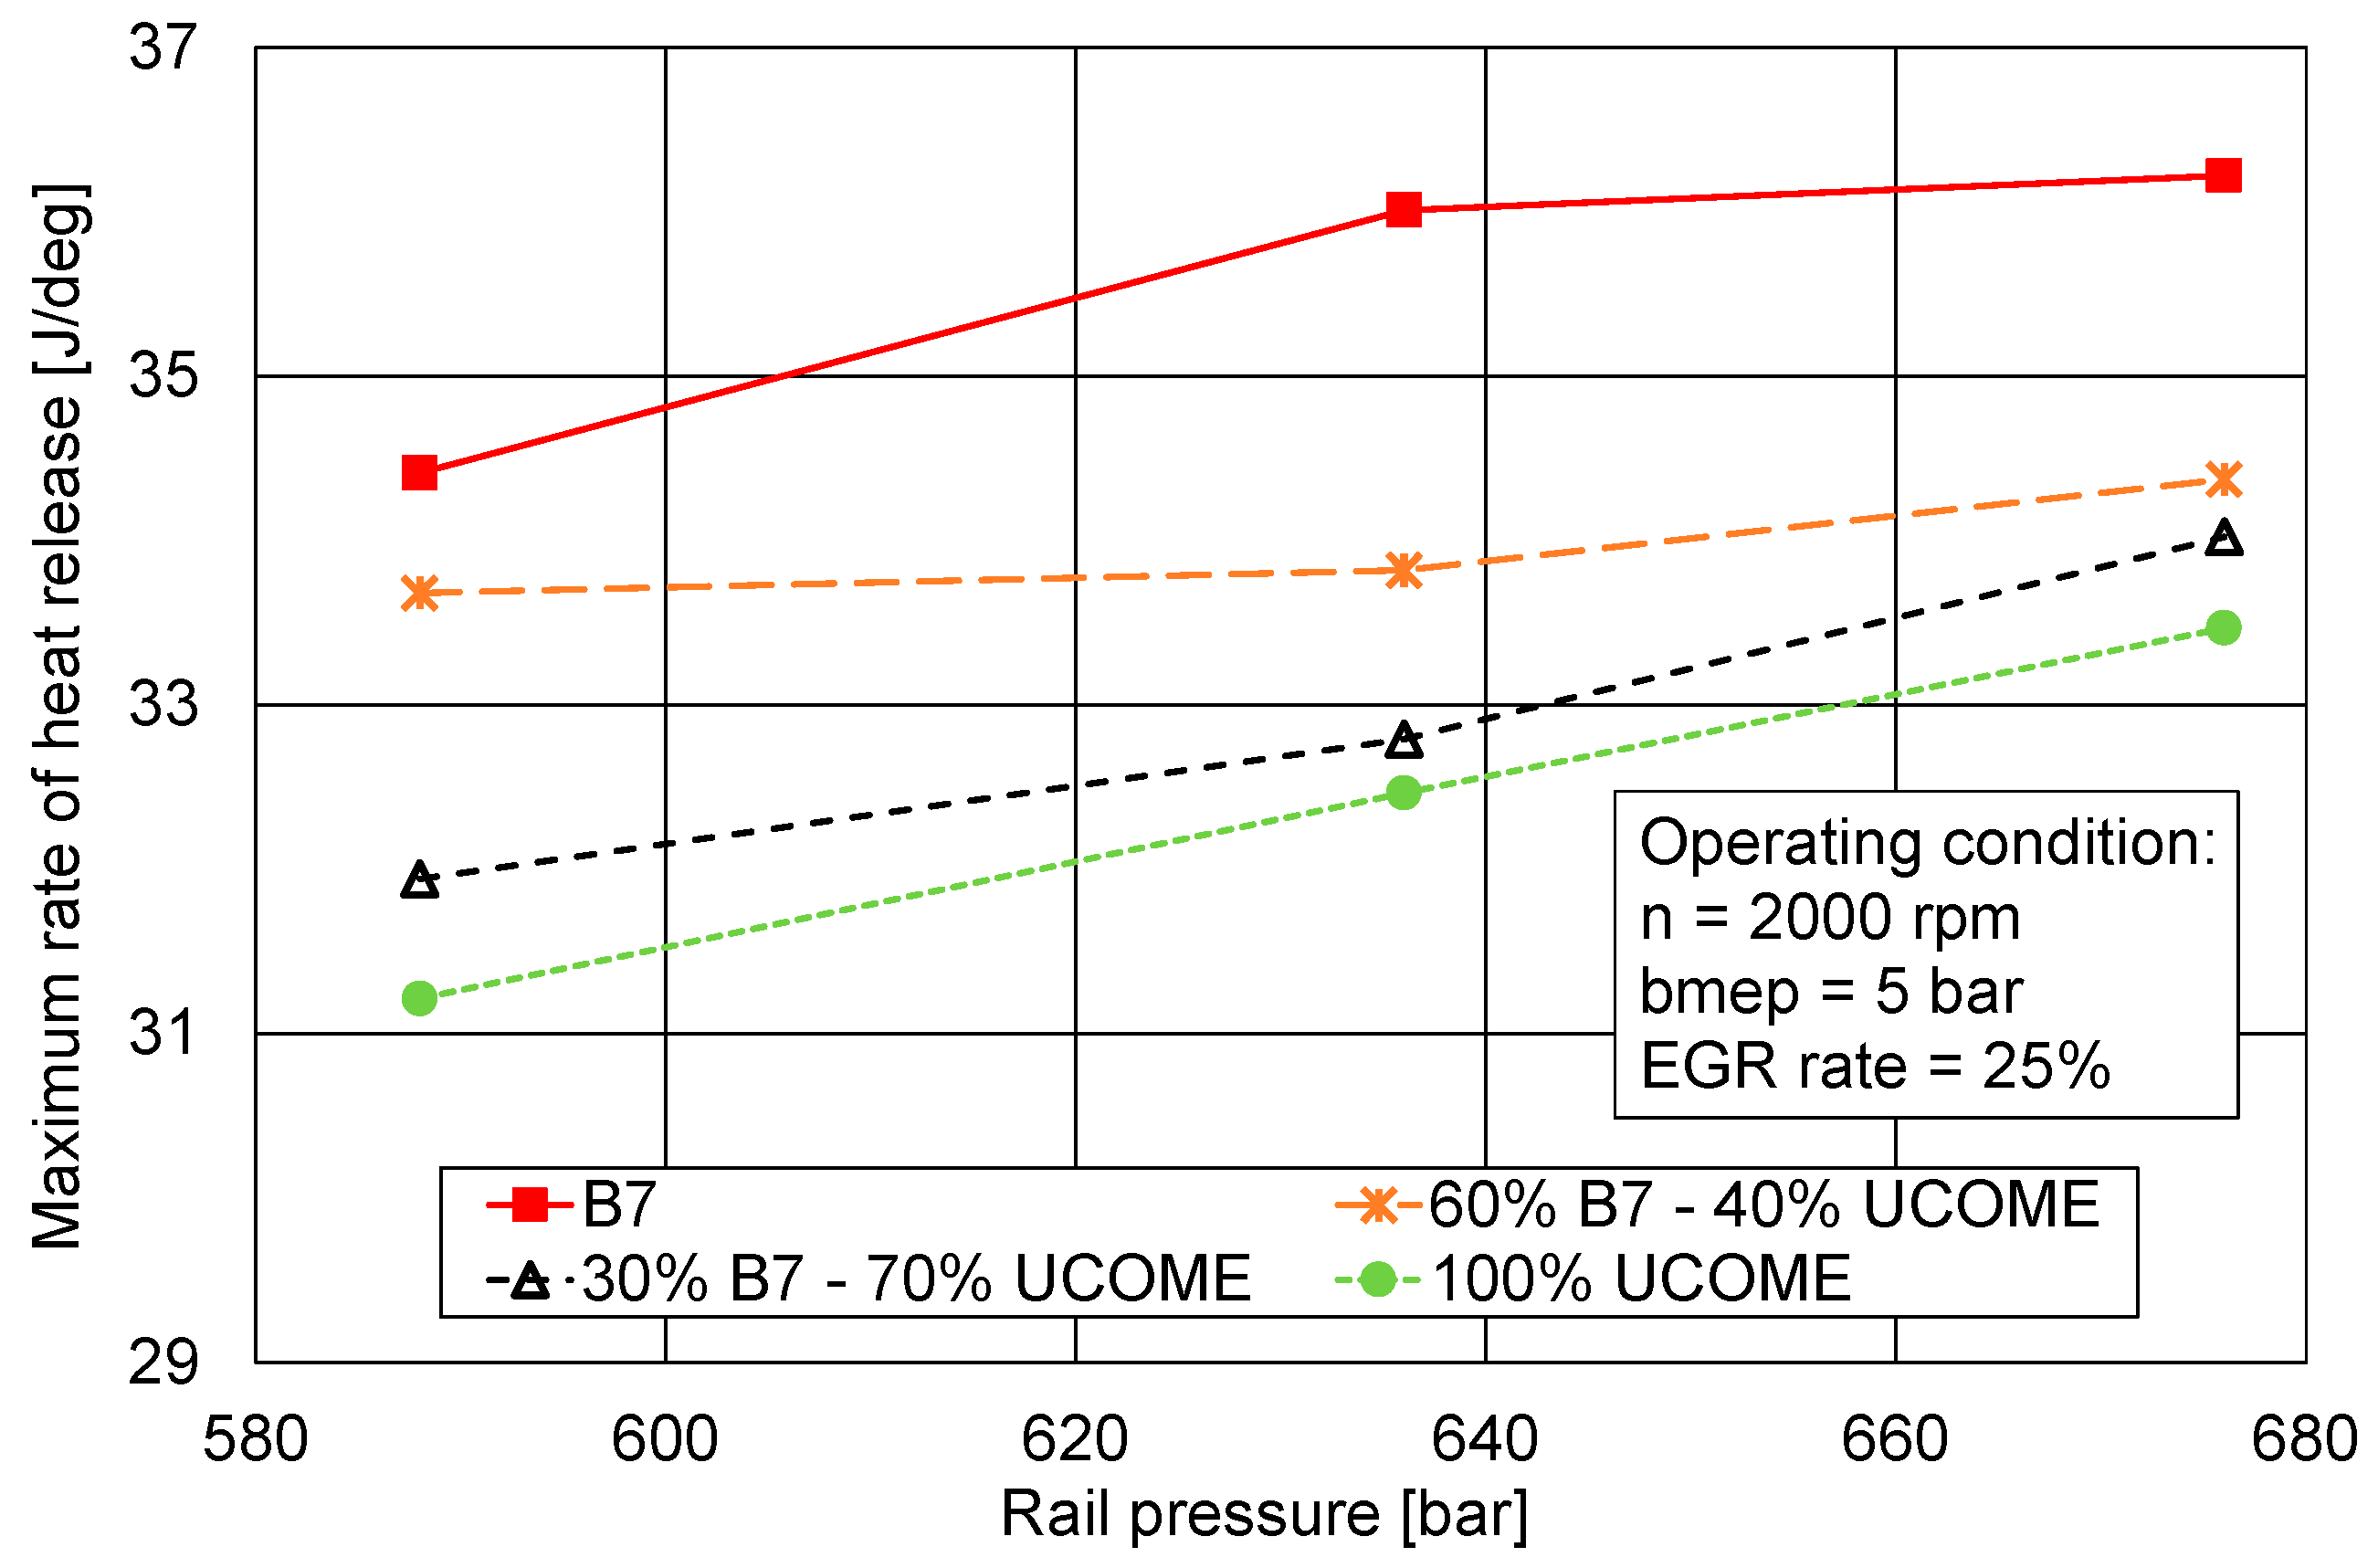
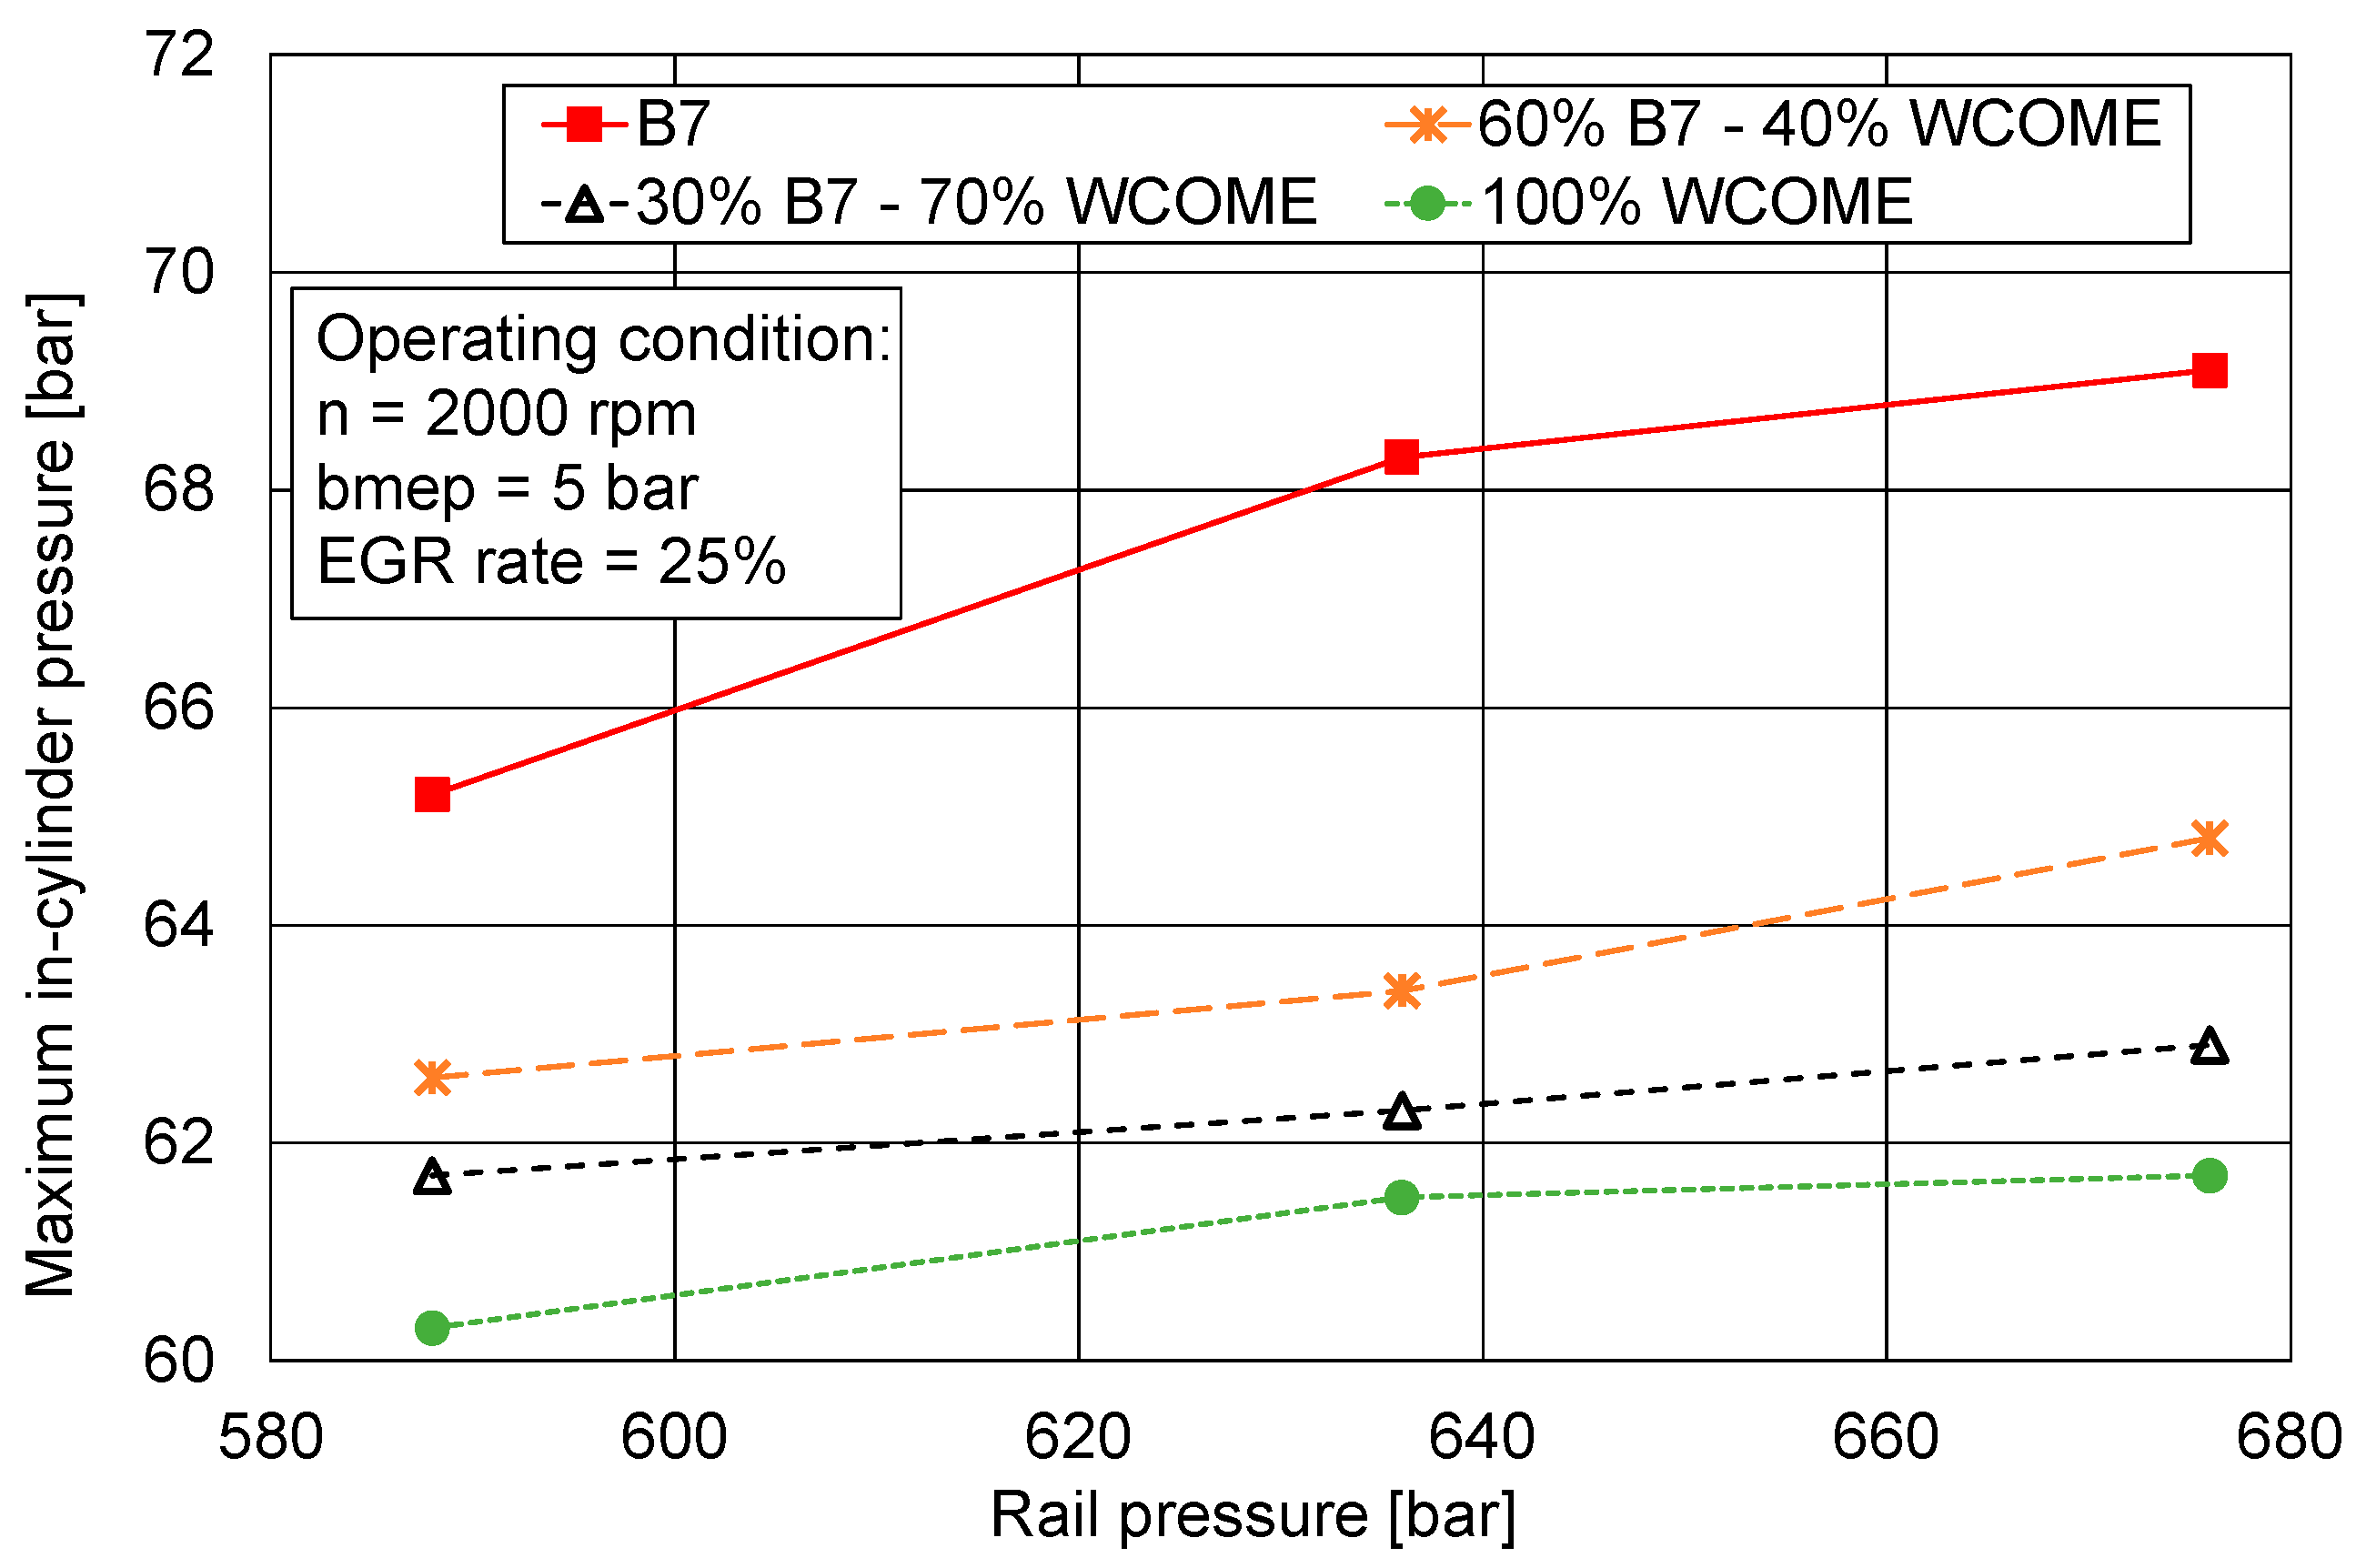
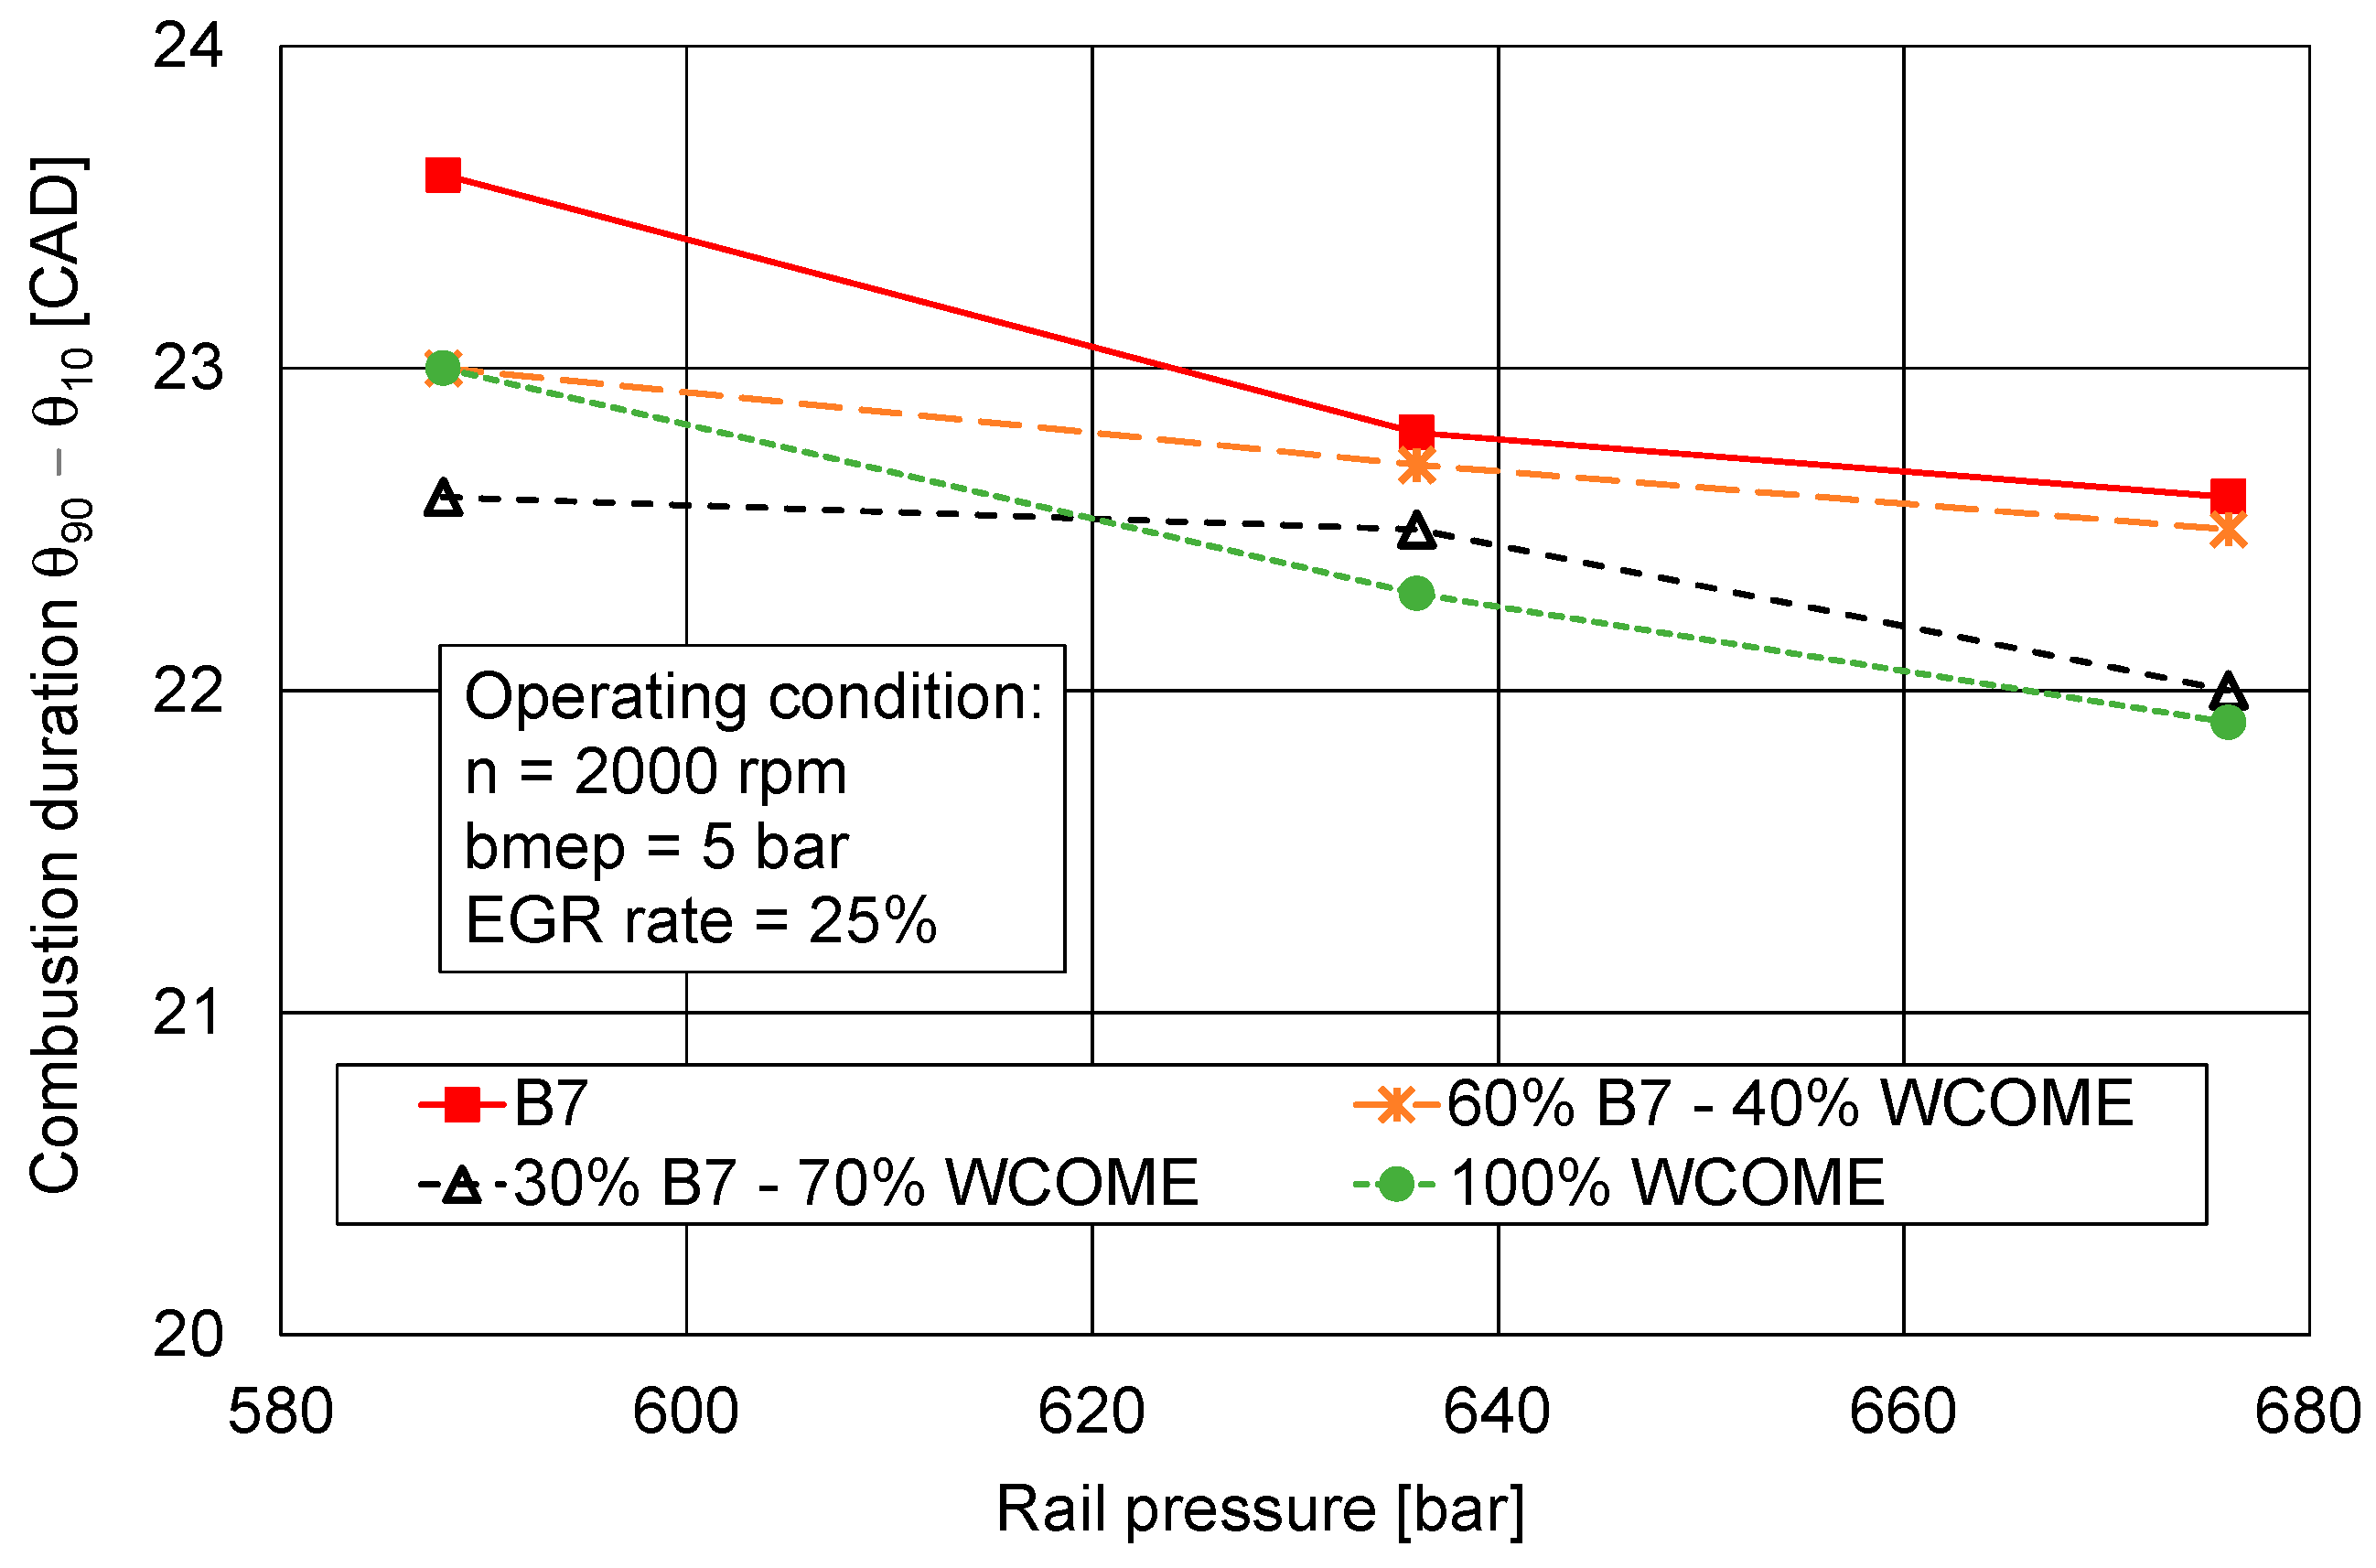
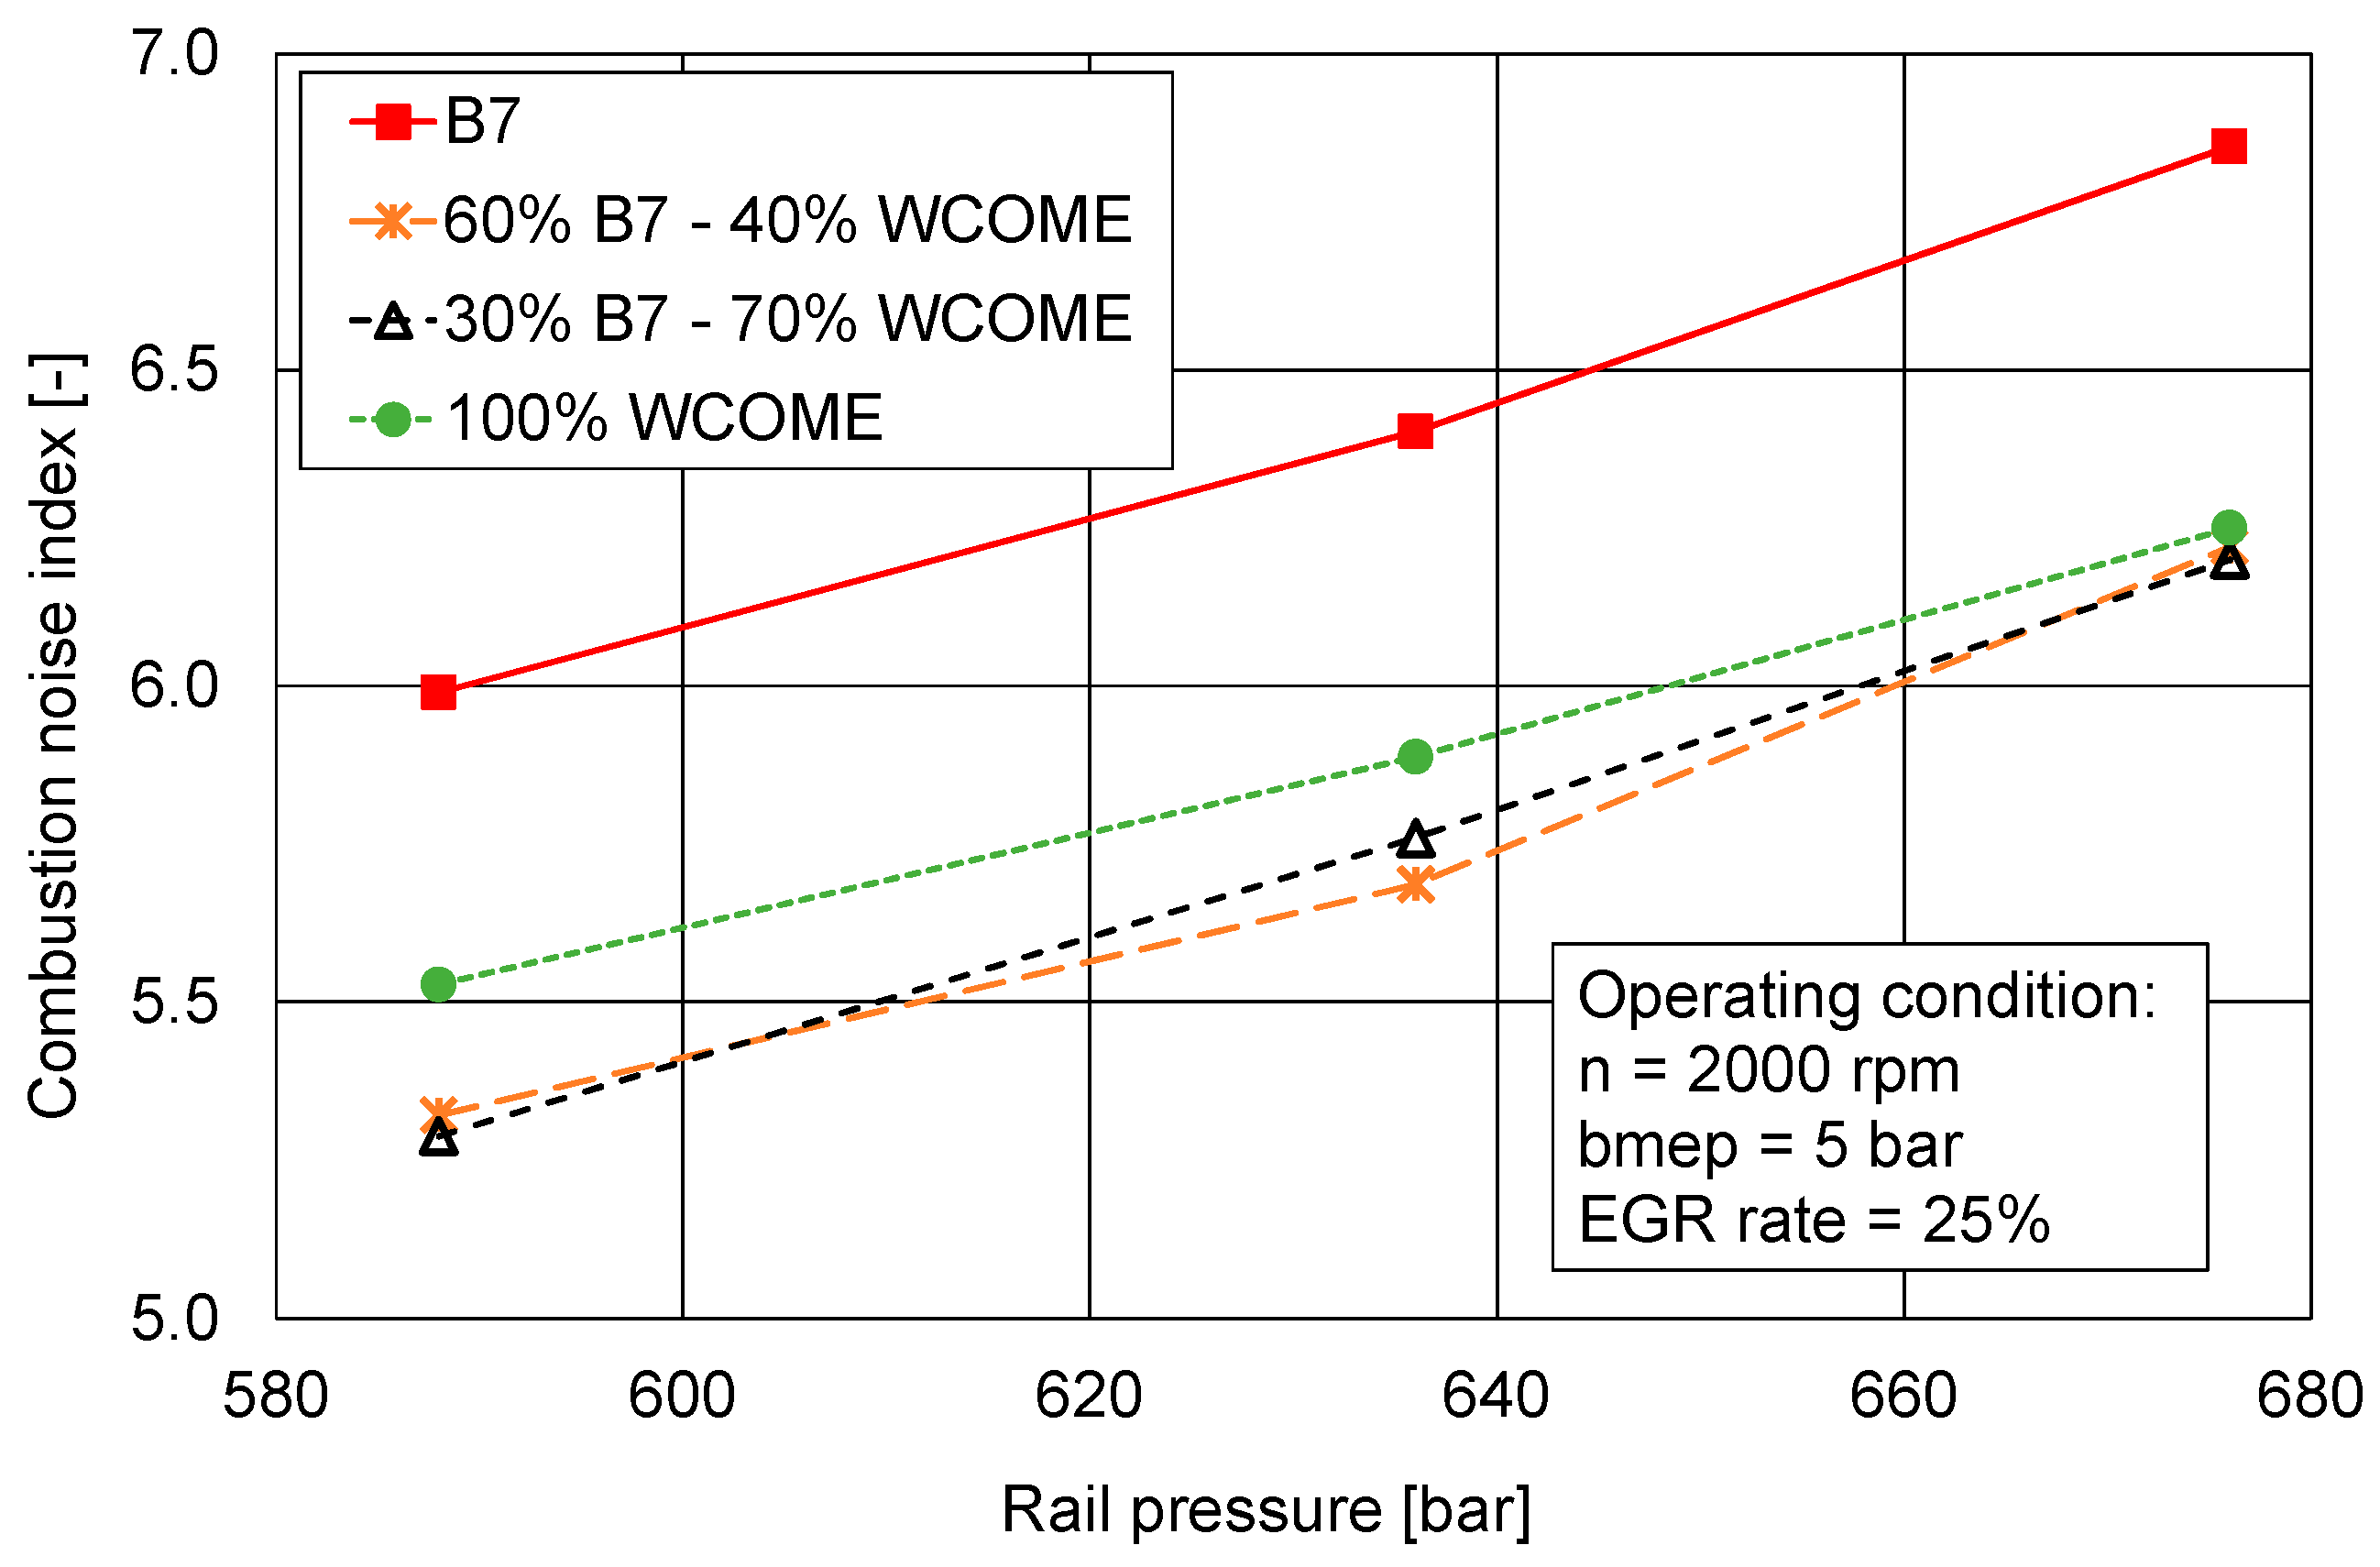
3.4. Influence of Rail Pressure Control at Maximum EGR Rate

Effects of rail pressure control are widely investigated. The author presented them in previous papers [39,49], supported by an extended bibliography. In summary, higher fuel injection pressure results in better atomization of the fuel droplets, with faster evaporation and an enhanced mixture preparation. The expected consequences are a shorter ignition delay, a faster premixed phase of the combustion process, with higher peak pressure and pressure gradient, and a shorter duration of the combustion. As far as emissions are concerned, better combustion leads to an increase in NOX emissions, but better atomization corresponds to a reduction in pyrolysis reactions, limiting the formation of soot particles.
In this section, the effects of the rail pressure increase will be analyzed, considering the maximum value of EGR rate for each tested condition and the use of biodiesel, to point out the different aspects listed in the Introduction. For thermal efficiency and emissions, reference values will also be shown in the relevant graphs, to highlight if the integrated control strategy of EGR and common rail allows for the achievement of benefits compared to the standard mode, thanks to the replacement of conventional fuel with biodiesel.
Trends of brake thermal efficiency are shown in Figure 16. For a selected fuel/blend, no changes are apparent when increasing rail pressure. When comparing reference values to operating modes with blends and neat WCOME, in the first operating condition (2000 × 2), benefit was not observed. In the 2000 × 5 experimental point, the largest increase is equal to 1.74% for 100% WCOME and rail pressure = 636 bar.
Values of brake-specific NOX emission are presented in Figure 17. As expected, emission increases with rail pressure, because of the phenomena previously described. The use of biodiesel results in higher emissions, as already explained in the analysis of Figure 8. Nonetheless, in these operating modes, the higher EGR rate allows for a significant reduction compared to the level in reference conditions. In both experimental points, the average decrease is around 22%.
Levels of brake-specific soot emission are presented in Figure 18. When using conventional fuel, the higher EGR rate leads to an increase in soot, because of the larger dilution effect with lower oxygen availability compared to the standard mode. Each line shows a reduction when higher values of rail pressure are applied, because of the lower occurrence of pyrolysis reactions. Finally, the beneficial effect of oxygen provided by WCOME allows us to largely compensate for the negative influence of EGR. On average, the soot emission reduction compared to the reference value is around 45% in the first operating condition (2000 × 2) and 58% in the second operating condition (2000 × 5).
Moving to the analysis of combustion parameters, the coefficient of variation of maximum pressure is shown in Figure 19. As for the influence of EGR (Figure 10), there is no clear effect of rail pressure on this quantity, but values are below 2.5%, allowing for combustion stability. It is also confirmed that blends and neat biodiesel show levels of CoV higher than B7.
Referring to the center of combustion (Figure 20), the increase in rail pressure results in a slight decrease in this quantity for all the tested fuels (i.e., θ50 is closer to the TDC), confirming the influence of this control variable on fuel distribution, mixture formation, and combustion development previously described. The same conclusion is valid for the maximum rate of heat release (Figure 21), maximum in-cylinder pressure (Figure 22), and the combustion duration (Figure 23). Trends of the combustion noise index are presented in Figure 24, further illustrating effects related to a higher level of rail pressure. The faster mixture formation and combustion result in higher levels of pressure rise rate, increasing In. For all these parameters, the influence of biodiesel shown in Figure 20, Figure 21, Figure 22, Figure 23 and Figure 24 is the same as outlined in Figure 11, Figure 12, Figure 13, Figure 14 and Figure 15. In fact, at a constant operating mode, a slight shift within the expansion stroke is observed for θ50 for the slower combustion at the start of the process, leading also to decreased values of maximum rate of heat release, peak pressure, and the combustion noise In. Reductions can be detected for θ90–θ10, because of the acceleration in the later stage of the combustion caused by the oxygen provided by the biodiesel [12,58].

4. Conclusions

The experimental investigation on the use of Waste Cooking Oil Methyl Esters while applying integrated control strategies to the EGR system, common rail, and turbocharger turbine allows us to outline some interesting aspects, disclosing potential for the achievement of advantages related not only to greenhouse gas emissions but also to chemical pollutants and efficiency. The main outcomes of this study can be summarized as follows:
  • At a constant operating mode (i.e., at constant value of EGR rate and rail pressure), increasing biodiesel content led to penalties in fuel consumption, due to the reduced level of Lower Heating Value, but brake thermal efficiency was enhanced because of a shorter combustion duration. At the same time, the oxygen content of biodiesel resulted in higher NOX emissions and lower soot emissions.
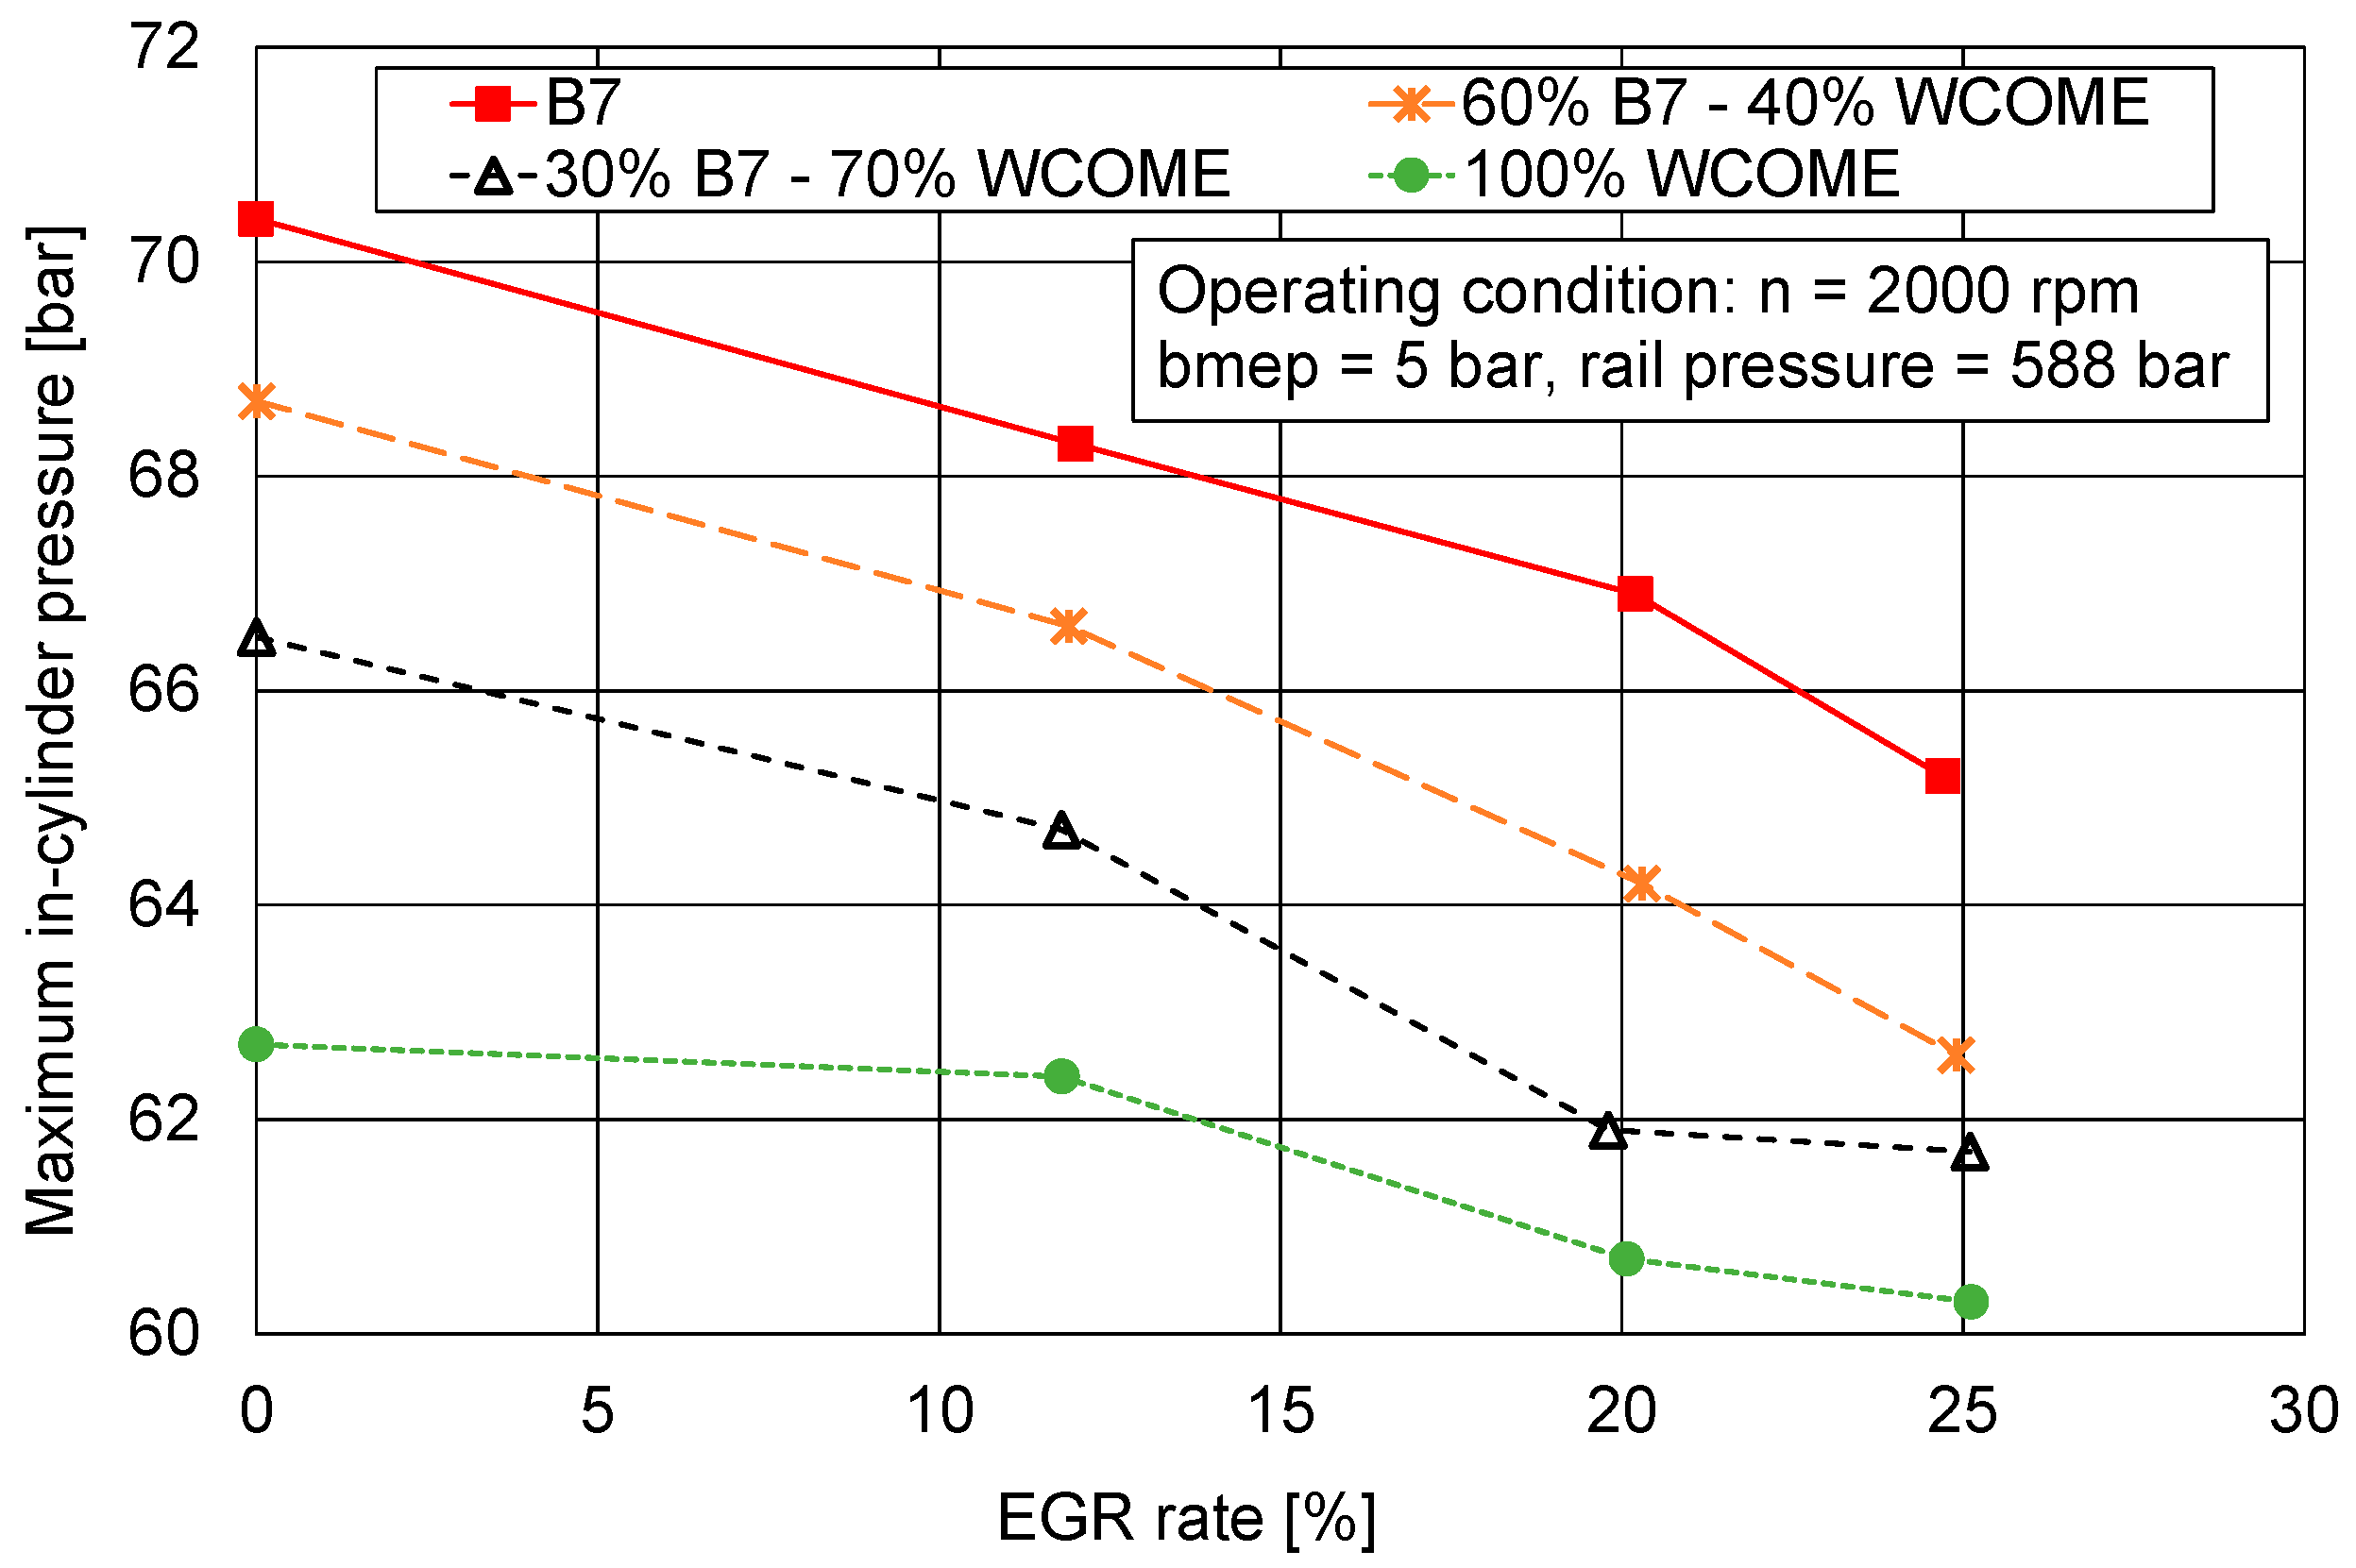
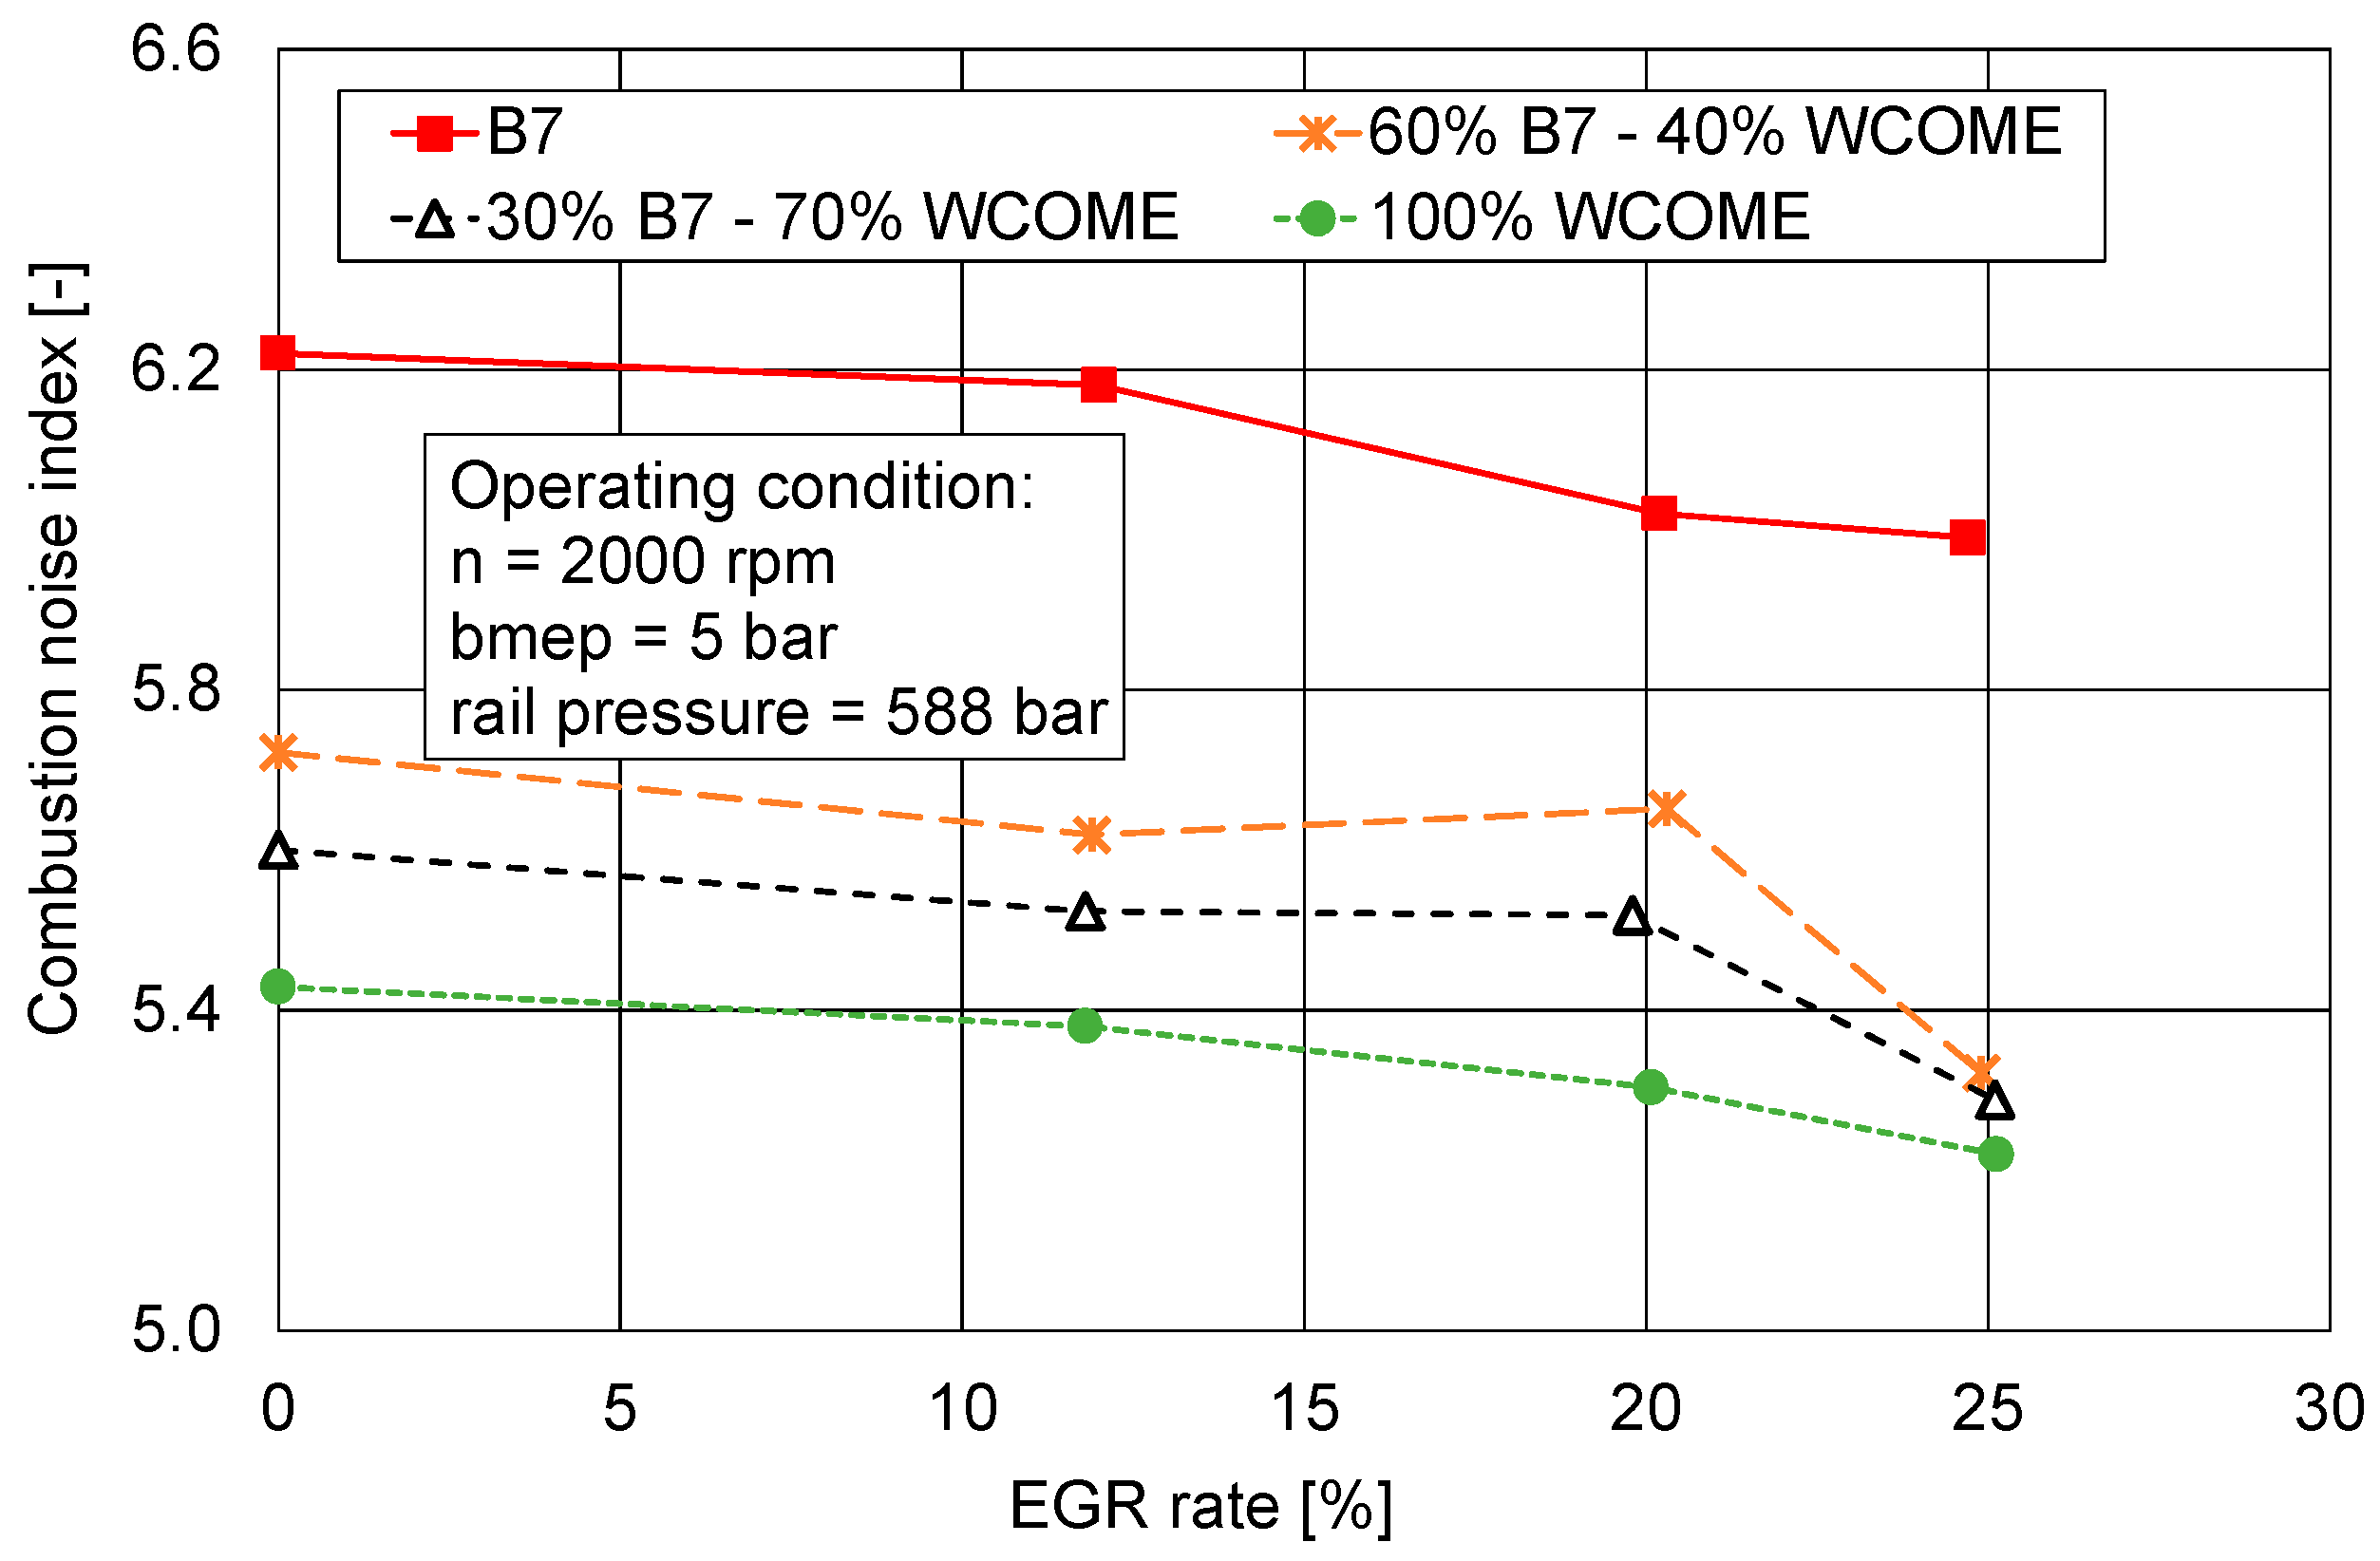
  • For a fixed fuel/blend, the EGR increase led to the expected reduction in NOX emission and an increase in soot emission. Bsfc was increased because of the control strategy applied to the variable nozzle turbine opening degree, aiming at keeping the intake pressure at a constant level while opening the EGR valve. This strategy results in higher engine pressure gradient and pumping losses.
  • Higher levels of rail pressure resulted in better soot emission and higher NOX emission, because of the better fuel droplet atomization, faster evaporation, enhanced mixture formation, and better combustion.
  • To compensate for the different negative effects, a proper selection of EGR rate and rail pressure values (higher than the standard levels) was tested, achieving better efficiency, NOX, and soot emissions when replacing reference B7 with blends and neat biodiesel.
  • Heat release analysis and the assessment of combustion parameters provided further details about biodiesel effects. Combustion stability was granted when using WCOME, while the combustion process was modified, with a slower speed at the start, leading to a slight reduction in combustion noise and a limited shift of the center of combustion within the expansion stroke. Combustion duration is then reduced because of a faster speed in the second part of the process.
As a final consideration, the investigation outlined that advantages can be obtained in terms of efficiency, NOX, and soot emissions when using biodiesel, through the application of proper control strategies, based on the knowledge of the characteristics of the main engine sub-systems and the behavior of the renewable fuel. Future work will be focused on another interesting option for biodiesel, namely, HVO, considering integrated management of EGR, fuel injection, and turbocharging systems.

Author Contributions

Conceptualization, G.Z.; methodology, G.Z.; investigation, G.Z.; data curation, G.Z.; writing—original draft preparation, G.Z.; writing—review and editing, M.C.; supervision, M.C. All authors have read and agreed to the published version of the manuscript.

Funding

This research did not receive any specific grant from funding agencies in the public, commercial, or not-for-profit sectors.

Data Availability Statement

Data will be made available on request.

Conflicts of Interest

The authors declare that they have no known competing financial interests or personal relationships that could have appeared to influence the work reported in this paper.

Abbreviations

The following abbreviations are used in this manuscript:
Notations
bmepbrake mean effective pressure
bsfc brake specific fuel consumption
bsNOX brake specific NOX emission
bsS brake specific soot emission
btebrake thermal efficiency
fmass fraction
kratio of specific heats
nrotational speed
ppressure
ttemperature [°C]
Aopening degree
AFRair–fuel ratio
Bbiodiesel
Ccompressor
CADcrank angle degree
CNcetane number
CO2carbon dioxide
CoVcoefficient of variation
DCduty-cycle
DOCDiesel Oxidation Catalyst
DOUDegree of Unsaturation
DPFDiesel Particulate Filter
ECUelectronic control unit
EGRexhaust gas recirculation
FAMEFatty Acid Methyl Esters
FSNFilter Smoke Number
GHGGreenhouse gas
HPhigh pressure
HVOHydrotreated Vegetable Oil
ICEinternal combustion engine
LHVlower heating value
Mmass flow rate
Mainmain injection
NOnitric oxide
NOXnitrogen oxides
PMparticulate matter
Pilotpilot injection
Prepre injection
QHeat
ROHRRate of heat release
Ssoot, displacement
SOIStart of injection
Tturbine
TDCTop Dead Center
TiO2Titanium dioxide
Vinstantaneous cylinder volume
VNT variable nozzle turbine
WCOMEwaste cooking oil methyl esters
WtWWell-to-Wheels/Well-to-Wake
λexcess air ratio
θcrank angle
Δvariation
Subscripts
1compressor inlet, first
2compressor outlet, second
3turbine inlet
4turbine outlet
aair
ffuel
iintake
idleidling mode
nnoise
railcommon rail
EGRexhaust gas recirculation
MAXmaximum
MINminimum
TCturbocharger

References

  1. Available online: https://www.consilium.europa.eu/en/policies/green-deal/fit-for-55/ (accessed on 19 March 2025).
  2. Joung, T.H.; Kang, S.G.; Lee, J.K.; Ahn, J. The IMO initial strategy for reducing Greenhouse Gas (GHG) emissions, and its follow-up actions towards 2050. J. Int. Marit. Saf. Environ. Aff. Shipp. 2020, 4, 1–7. [Google Scholar] [CrossRef]
  3. Det Norske Veritas. Energy Transition Outlook 2023—Transport in Transition; Det Norske Veritas: Melbourne, Australia, 2023. [Google Scholar]
  4. Kalghatgi, G. Is it really the end of internal combustion engines and petroleum in transport? Appl. Energy 2018, 225, 965–974. [Google Scholar] [CrossRef]
  5. Reitz, R.D.; Ogawa, H.; Payri, R.; Fansler, T.; Kokjohn, S.; Moriyoshi, Y.; Agarwal, A.K.; Arcoumanis, D.; Assanis, D.; Bae, C.; et al. The future of the internal combustion engine. Int. J. Engine Res. Editor. 2019, 21, 3–10. [Google Scholar] [CrossRef]
  6. Serrano, J.R.; Novella, R.; Piqueras, P. Why the Development of Internal Combustion Engines Is Still Necessary to Fight against Global Climate Change from the Perspective of Transportation. Appl. Sci. 2019, 9, 4597. [Google Scholar] [CrossRef]
  7. Senecal, K.; Leach, F. Racing Toward Zero—The Untold Story of Driving Green; R-501; SAE International: Warrendale, PA, USA, 2021. [Google Scholar]
  8. Joint Research Centre of the European Commission. Renewable Fuels of Non-Biological Origin in the European Union—Status Report on Technology Development, Trends, Value Chains and Market; Report JRC130729; Publications Office of the European Union: Luxembourg, 2022. [Google Scholar]
  9. Joint Research Centre of the European Commission. Advanced Biofuels in the European Union—Status Report on Technology Development, Trends, Value Chains and Market; Report JRC130727; Publications Office of the European Union: Luxembourg, 2022. [Google Scholar]
  10. European Union. Directive (EU) 2018/2001 of the European Parliament and of the Council of 11 December 2018 on the Promotion of the Use of Energy from Renewable Sources. Off. J. Eur. Union 2018, L 328/82, 82–209. [Google Scholar]
  11. European Union. Directive (EU) 2023/2413 of the European Parliament and of the Council of 18 October 2023 amending Directive (EU) 2018/2001, Regulation (EU) 2018/1999 and Directive 98/70/EC as regards the promotion of energy from renewable sources and repealing Council Directive (EU) 2015/652. Off. J. Eur. Union 2023, 1–77. [Google Scholar]
  12. Chong, C.T.; Ng, J.H. Advanced Transport Biofuels. Production, Economics, and Sustainability; Woodhead Series in Bioenergy; Elsevier: Amsterdam, The Netherlands, 2025. [Google Scholar]
  13. European Union. Regulation (EU) 2023/1805 of the European Parliament and of the Council of 13 September 2023 on the use of renewable and low-carbon fuels in maritime transport and amending Directive 2009/16/EC (Fuel EU Maritime). Off. J. Eur. Union 2023, L 234/48, 48–100. [Google Scholar]
  14. Zamboni, G.; Scamardella, F.; Gualeni, P.; Canepa, E. Comparative analysis among different alternative fuels for ship propulsion in a well-to-wake perspective. Heliyon 2024, 10, e26016. [Google Scholar] [CrossRef] [PubMed]
  15. Yang, R.; Shang, T.; Li, L.; Liu, J.; Xie, T.; Liu, Z.; Liu, J. The mechanism of the increased ratio of nitrogen dioxide to nitrogen oxides in methanol/diesel dual fuel engines. Energy 2024, 133701. [Google Scholar] [CrossRef]
  16. Wang, Z.; Jie, Z.; Liu, X. Combustion and Emission Characteristics of Methanol–Diesel Dual Fuel Engine at Different Altitudes. J. Mar. Sci. Eng. 2024, 12, 2210. [Google Scholar] [CrossRef]
  17. Liu, Y.; Cai, K.; Qi, Y.; Chen, Q.; Chen, H.; Wang, Z. Experimental investigation on N2O emission characteristics of ammonia-diesel dual-fuel engines. Int. J. Engine Res. 2025, 14680874241307920. [Google Scholar] [CrossRef]
  18. Dong, P.; Liu, K.; Zhang, L.; Zhang, Z.; Long, W.; Tian, H. Study on the synergistic control of nitrogenous emissions and greenhouse gas of ammonia/diesel dual direct injection two-stroke engine. Energy 2024, 132657. [Google Scholar] [CrossRef]
  19. Rueda-Vázquez, J.M.; Serrano, J.; Pinzi, S.; Jiménez-Espadafor, F.J.; Dorado, M.P. A Review of the Use of Hydrogen in Compression Ignition Engines with Dual-Fuel Technology and Techniques for Reducing NOx Emissions. Sustainability 2024, 16, 3462. [Google Scholar] [CrossRef]
  20. Guan, M.; Rochussen, J.; Steiche, P.; Sapkota, N.; Farzam, R.; McTaggart-Cowan, G.; Rogak, S.N.; Kirchen, P. Characterizing hydrogen-diesel dual-fuel performance and emissions in a commercial heavy-duty diesel truck. Int. J. Hydrogen Energy 2024, 86, 1085–1096. [Google Scholar] [CrossRef]
  21. Lapuerta, M.; Armas, O.; Rodrìguez-Fernàndez, J. Effect of biodiesel fuels on diesel engine emissions. Prog. Energy Combust. Sci. 2008, 34, 198–223. [Google Scholar] [CrossRef]
  22. Agarwal, A.K.; Gupta, J.G.; Dhar, A. Potential and challenges for large-scale application of biodiesel in automotive sector. Prog. Energy Combust. Sci. 2017, 61, 113–149. [Google Scholar] [CrossRef]
  23. Razzaq, L.; Mujtaba Abbas, M.; Waseem, A.; Abbas Jauhar, T.; Fayaz, H.; Kalam, M.A.; Soudagar, M.E.M.; Silitonga, A.S.; Ul-Husnain, S.; Ishtiaq, U. Influence of varying concentrations of TiO2 nanoparticles and engine speed on the performance and emissions of diesel engine operated on waste cooking oil biodiesel blends using response surface methodology. Heliyon 2023, 9, e17758. [Google Scholar] [CrossRef]
  24. Giakoumis, E.G.; Rakopoulos, C.D.; Dimaratos, A.M.; Rakopoulos, D.C. Exhaust emissions of diesel engines operating under transient conditions with biodiesel fuel blends. Prog. Energy Combust. Sci. 2012, 38, 691–715. [Google Scholar] [CrossRef]
  25. Khalife, E.; Tabatabaei, M.; Demirbas, A.; Aghbashlo, M. Impacts of additives on performance and emission characteristics of diesel engines during steady state operation. Prog. Energy Combust. Sci. 2017, 59, 32–78. [Google Scholar] [CrossRef]
  26. Sun, J.; Caton, J.A.; Jacobs, T.J. Oxides of nitrogen emissions from biodiesel-fuelled diesel engines. Prog. Energy Combust. Sci. 2010, 36, 677–695. [Google Scholar] [CrossRef]
  27. Balakrishnan, A.; Parthasarathy, R.N.; Gollahalli, S.R. A review on the effects of biodiesel blends on compression ignition engine NOX emissions. J. Energy Environ. Sustain. 2016, 1, 67–76. [Google Scholar] [CrossRef]
  28. Zamboni, G.; Capobianco, M. Definition of the optimal content of used cooking oil methyl ester in blends fuelling a turbocharged diesel engine. Biomass Bioenergy 2021, 150, 106098. [Google Scholar] [CrossRef]
  29. Saputra Nursal, R.; Khalid, A.; Shahridzuan Abdullah, I.; Jaat, N.; Darlis, N.; Koten, H. Autoignition behavior and emission of biodiesel from palm oil, waste cooking oil, tyre pyrolysis oil, algae and jatropha. Fuel 2021, 306, 121695. [Google Scholar] [CrossRef]
  30. Caliskan, H.; Yildiz, I.; Mori, K. Production and Assessment of New Biofuels from Waste Cooking Oils as Sustainable Bioenergy Sources. Energies 2023, 16, 463. [Google Scholar] [CrossRef]
  31. Chiavola, O.; Palmieri, F.; Verdoliva, F. Characteristics of High-Pressure Injection Pump Operated with Renewable Fuel for Diesel Engines. Energies 2024, 17, 1656. [Google Scholar] [CrossRef]
  32. Yusuf, A.A.; Yusuf, D.A.; Jie, Z.; Bello, T.Y.; Tambaya, M.; Abdullahi, B.; Muhammed-Dabo, I.A.; Yahuza, I.; Dandakouta, H. Influence of waste oil-biodiesel on toxic pollutants from marine engine coupled with emission reduction measures at various loads. Atmos. Pollut. Res. 2022, 13, 101258. [Google Scholar] [CrossRef]
  33. Mofijur, M.; Rasul, M.; Hassan, N.M.S. Investigation of exhaust emissions from a stationary diesel engine fuelled with biodiesel. Energy Procedia 2019, 160, 791–797. [Google Scholar] [CrossRef]
  34. Mandal, A.; Cha, D.; Cho, H.M. Impact of Waste Fry Biofuel on Diesel Engine Performance and Emissions. Energies 2023, 16, 3711. [Google Scholar] [CrossRef]
  35. Hawi, M.; Elwardany, A.; Ismail, M.; Ahmed, M. Experimental Investigation on Performance of a Compression Ignition Engine Fueled with Waste Cooking Oil Biodiesel–Diesel Blend Enhanced with Iron-Doped Cerium Oxide Nanoparticles. Energies 2019, 12, 798. [Google Scholar] [CrossRef]
  36. Meng, J.; Xu, W.; Meng, F.; Wang, B.; Zhao, P.; Wang, Z.; Ji, H.; Yang, Y. Effects of waste cooking oil biodiesel addition on combustion, regulated and unregulated emission characteristics of common-rail diesel engine. Process Saf. Environ. Prot. 2023, 178, 1094–1106. [Google Scholar] [CrossRef]
  37. Zhang, Y.; Lou, D.; Tan, P.; Hu, Z.; Fang, L. Effects of waste-cooking-oil biodiesel blends on diesel vehicle emissions and their reducing characteristics with exhaust after-treatment system. J. Clean. Prod. 2022, 381, 135190. [Google Scholar] [CrossRef]
  38. Zamboni, G.; Moggia, S.; Capobianco, M. Effects of a Dual-Loop Exhaust Gas Recirculation System and Variable Nozzle Turbine Control on the Operating Parameters of an Automotive Diesel Engine. Energies 2017, 10, 47. [Google Scholar] [CrossRef]
  39. Zamboni, G.; Capobianco, M. Effects of rail pressure control on fuel consumption, emissions and combustion parameters in a turbocharged diesel engine. Cogent Eng. 2020, 7, 1724848. [Google Scholar] [CrossRef]
  40. Working Group 1 of the Joint Committee for Guides in Metrology. Evaluation of Measurement Data—Guide to the Expression of Uncertainty in Measurement, 1st ed.; JCGM 100; BIPM: Sèvres, France, 2008; Available online: https://www.bipm.org/en/ (accessed on 23 May 2025).
  41. Torregrosa, A.J.; Broatch, A.; Martin, J.; Monelletta, L. Combustion noise level assessment in direct injection Diesel engines by means of in-cylinder pressure components. Meas. Sci. Technol. 2007, 18, 2131–2142. [Google Scholar] [CrossRef]
  42. Liang, X.; Yang, G.; Dai, P.; Lin, X.; Zhang, X.; Li, L. Experimental investigation on the relationship between in-cylinder pressure rise rate and combustion noise of the diesel engine. Appl. Acoust. 2024, 223, 110084. [Google Scholar] [CrossRef]
  43. Hsu, B.D. Practical Diesel-Engine Combustion Analysis; SAE International: Warrendale, PA, USA, 2002; ISBN 0-7680-0914-6. [Google Scholar]
  44. Heywood, J.B. Internal Combustion Engine Fundamentals, 2nd ed.; Mc Graw-Hill: Columbus, OH, USA, 2018; ISBN 0-07-028637-X. [Google Scholar]
  45. Hohenberg, J.F. Advanced Approaches for Heat Transfer Calculations; SAE International: Warrendale, PA, USA, 1979. [Google Scholar]
  46. Benson, R.S.; Whitehouse, N.D. Internal Combustion Engines; Pergamon Press: Oxford, UK, 1979; ISBN 978-0080227177. [Google Scholar]
  47. Badami, M.; Mallamo, F.; Millo, F.; Rossi, E.E. Influence of Multiple Injection Strategies on Emissions, Combustion Noise and BSFC of a DI Common Rail Diesel Engine; SAE International: Warrendale, PA, USA, 2002. [Google Scholar]
  48. Zamboni, G. A study on combustion parameters in an automotive turbocharged diesel engine. Energies 2018, 11, 2531. [Google Scholar] [CrossRef]
  49. Zamboni, G. Influence of fuel injection, turbocharging and EGR systems control on combustion parameters in an automotive diesel engine. Appl. Sci. 2019, 9, 484. [Google Scholar] [CrossRef]
  50. Lapuerta, M.; Herreros, J.M.; Lyons, L.L.; García-Contreras, R.; Briceño, Y. Effect of the alcohol type used in the production of waste cooking oil biodiesel on diesel performance and emissions. Fuel 2008, 87, 3161–3169. [Google Scholar] [CrossRef]
  51. Madheshiya, A.K.; Vedrtnam, A. Energy-exergy analysis of biodiesel fuels produced from waste cooking oil and mustard oil. Fuel 2018, 214, 386–408. [Google Scholar] [CrossRef]
  52. Dhanasekaran, R.; Ganesan, S.; Rajesh Kumar, B.; Saravanan, S. Utilization of waste cooking oil in a light-duty DI diesel engine for cleaner emissions using bio-derived propanol. Fuel 2019, 235, 832–837. [Google Scholar] [CrossRef]
  53. Attia, A.M.A.; Hassaneen, A.E. Influence of diesel fuel blended with biodiesel produced from waste cooking oil on diesel engine performance. Fuel 2016, 167, 316–328. [Google Scholar] [CrossRef]
  54. Richards, P. Automotive Fuels Reference Book, 3rd ed.; SAE International: Warrendale, PA, USA, 2014. [Google Scholar]
  55. Balakrishnan, A.; Parthasarathy, R.N.; Gollahalli, S.R. Effects of degree of fuel unsaturation on NOx emission from petroleum and biofuel flames. Fuel 2016, 182, 798–806. [Google Scholar] [CrossRef]
  56. Gad, M.S.; Abu-Elyazeed, O.S.; Mohamed, M.A.; Hashim, A.M. Effect of oil blends derived from catalytic pyrolysis of waste cooking oil on diesel engine performance, emissions and combustion characteristics. Energy 2021, 223, 120019. [Google Scholar] [CrossRef]
  57. Mahfouz, A.; Gad, M.S.; El Fatih, A.; Emara, A. Comparative study of combustion characteristics and exhaust emissions of waste cooking-diesel oil blends. Ain Shams Eng. 2018, 9, 3123–3134. [Google Scholar] [CrossRef]
  58. Zamboni, G.; Moggia, S.; Capobianco, M. Hybrid EGR and turbocharging systems control for low NOX and fuel consumption in an automotive diesel engine. Appl. Energy 2016, 165, 839–848. [Google Scholar] [CrossRef]
  59. Hossain, A.K.; Davies, P.A. Combustion and Emission Characteristics of a Typical Biodiesel Engine Operated on Waste Cooking Oil Derived Biodiesel; SAE International: Warrendale, PA, USA, 2012. [Google Scholar]
  60. Jaliliantabar, F.; Ghobadian, B.; Carlucci, A.P.; Najafi, G.; Mamat, R.; Ficarella, A.; Strafella, L.; Santino, A.; De Domenico, S. A comprehensive study on the effect of pilot injection, EGR rate, IMEP and biodiesel characteristics on a CRDI diesel engine. Energy 2020, 194, 116860. [Google Scholar] [CrossRef]
  61. Knothe, G.; Razon, L.F. Biodiesel fuels. Prog. Energy Combust. Sci. 2017, 58, 36–59. [Google Scholar] [CrossRef]
  62. Balakrishnan, A.; Parthasarathy, R.N.; Gollahalli, S.R. Experimental correlation of laminar flame pollutant emission indices with methyl ester fuel degree of unsaturation and equivalence ratio. Fuel 2019, 238, 139–148. [Google Scholar] [CrossRef]
  63. da Silva, M.J.; de Oliveira, A.; Sodré, J.R. Analysis of processing methods for combustion pressure measurement in a diesel engine. J. Braz. Soc. Mech. Sci. Eng. 2019, 41, 282. [Google Scholar] [CrossRef]
Figure 1. Scheme of the test rig.
Energies 18 02791 g001
Figure 2. Example of indicated pressure diagram (in green), pressure first derivative (in black), and related parameters.
Energies 18 02791 g002
Figure 3. Air–fuel ratio as a function of EGR rate.
Energies 18 02791 g003
Figure 4. Variable nozzle turbine opening degree as a function of EGR rate.
Energies 18 02791 g004
Figure 5. Engine pressure gradient as a function of EGR rate.
Energies 18 02791 g005
Figure 6. Brake specific fuel consumption as a function of EGR rate.
Energies 18 02791 g006
Figure 7. Brake thermal efficiency as a function of EGR rate.
Energies 18 02791 g007
Figure 8. Brake-specific NOX emission as a function of EGR rate.
Energies 18 02791 g008
Figure 9. Brake-specific soot emission as a function of EGR rate.
Energies 18 02791 g009
Figure 10. Trends of CoV of maximum pressure controlling EGR rate.
Energies 18 02791 g010
Figure 11. Trends of center of combustion controlling EGR rate.
Energies 18 02791 g011
Figure 12. Influence of WCOME content on the rate of heat release in a fixed operating mode (No. 9).
Energies 18 02791 g012
Figure 13. Trends of maximum in-cylinder pressure controlling EGR rate.
Energies 18 02791 g013
Figure 14. Trends of combustion duration controlling EGR rate.
Energies 18 02791 g014
Figure 15. Trends of combustion noise index controlling EGR rate.
Energies 18 02791 g015
Figure 16. Brake thermal efficiency as a function of rail pressure at the higher EGR rate.
Energies 18 02791 g016
Figure 17. Brake-specific NOX emission as a function of rail pressure at the higher EGR rate.
Energies 18 02791 g017
Figure 18. Brake-specific soot emission as a function of rail pressure at the higher EGR rate.
Energies 18 02791 g018
Figure 19. Trends of CoV of maximum pressure controlling rail pressure.
Energies 18 02791 g019
Figure 20. Trends of center of combustion controlling rail pressure.
Energies 18 02791 g020
Figure 21. Trends of maximum rate of heat release controlling rail pressure.
Energies 18 02791 g021
Figure 22. Trends of maximum in-cylinder pressure controlling rail pressure.
Energies 18 02791 g022
Figure 23. Trends of combustion duration controlling rail pressure.
Energies 18 02791 g023
Figure 24. Trends of combustion noise index controlling rail pressure.
Energies 18 02791 g024
Table 1. Main characteristics of tested engine.
CharacteristicValue
Engine typeFour-stroke, Diesel
Cylinders4 in-line
Bore [mm] × stroke [mm]69.9 × 82
Displacement [cm3]1248
Compression ratio16.8:1
Connecting rod [mm]131.3
Valves for cylinder4
Maximum Power [kW]70 @ 4000 rpm
Maximum Torque [Nm]200 @ 1500–3000 rpm
Fuel injection systemDirect injection, Multijet II common rail with solenoid injectors, maximum pressure 1650 bar
Turbocharging systemSingle stage, variable nozzle turbine, intercooler
EGR systemHigh pressure, cooled
Table 2. Measured parameters and instrumentation.
Measured QuantityInstrumentRangeAccuracy
Engine speedInductive pick-up0–5000 rpm±10 rpm
Engine torqueEddy current dynamometer0–250 Nm±1.25 Nm
Fuel mass flow rateAVL 733S dynamic measuring equipment0–37.5 kg/h0.81% for a measured value of 5 g, 0.42% for 10 g, 0.2% for 25 g
Air mass flow rateHot wire air flow meter0–1000 mg/stroke±5 mg/stroke
Exhaust smokeAVL 415 variable sampling smoke meter0–10 FSN±0.1 FSN
NOX concentrationRosemount 951 CLA analyzer0–250 ppm
0–1000 ppm
±1.25 ppm
±5 ppm
Turbocharger rotational speedEddy current probe200–400,000 rpm36 rpm
Temperatures (intake circuit, lubricant, coolant, etc.)4-wire RTD0–350 °C0.15 °C + 0.002 × measured value
Temperatures (exhaust and EGR circuits)K type TC0–1200 °C (class 2)±2.5 °C or
±0.75% × measured value (class 2)
PressuresStrain gauge−1–0.6 bar<±0.2% × full scale
In-cylinder pressureKistler 6125B0–2.5 bar<±0.5% × full scale
Kiag Swiss 5001 charge amplifier<±1% × full scale
Fuel pressureKistler 4067A20000–2000 bar<±0.5% × full scale
Kistler 4618A2 amplifier<±0.2% × full scale
Table 3. Estimated maximum relative uncertainties (in [%]) for brake specific fuel consumption (bsfc), NOX (bsNOX), and soot (bsS) emissions.
Operating Condition
ID = n × bmep
[rpm × bar]
2000 × 22000 × 5
bsfc1.51.3
bsNOX1.81.8
bsS3.23.1
Table 4. Properties of fuels and tested blends.
Fuel/BlendsDensity @ 15 °C [g/dm3]LHV [MJ/kg]Oxygen Content [%]Stoichiometric Air–Fuel RatioCetane Number
B783043-14.5752
WCOME87437.1 (−13.7%)10.912.5551.9
60% B7 + 40% WCOME84340.3 (−6.3%)4.813.8052
30% B7 + 70% WCOME85338.8 (−9.7%)7.913.4151.9
Table 5. Composition of different biodiesel.
Fatty AcidSunflower OilOlive OilWaste Cooking Oil
C16:0 Palmitic6–7 a/6.40 b5–13 a/11.47 b1–30 a/6.7 c/28.78 d/10.54 e/6 f
C18:0 Stearic3–5 a1–3 a2–6 a/1.6 c/6.41 d/4.02 e/0.8 f
C18:1 Oleic17–29 a/17.70 b71–75 a/74.52 b5–53 a/18.3 c/34.94 d/54.74 e/54 f
C18:2 Linoleic58–74 a/72.90 b10–18 a/9.54 b2–51 a/73.4 c/21.19 d/28.03 e/25.7 f
a [54] b [55] c [56] d [57] e [50] f [23].
Table 6. Investigation program.
Operating Mode Engine Speed [rpm]Brake Mean Effective Pressure [bar]Excess Air Ratio [−]Rail Pressure [bar]DCVNT [%]
1200026.0470 *82.0
23.289.0
32.8 *93.0 *
42.495.0
52.450895.0
62.454095.0
7250056.0588 *78.0
82.282.0
91.8 *87.4 *
101.6592.0
111.6563692.0
121.6567692.0
* Standard values.
Table 7. Values of intake pressure and injection parameters.
Engine Speed [rpm]Brake Mean Effective Pressure [bar]Intake Pressure [bar]PilotPreMain
SOI [CAD]Duration [CAD]SOI [CAD]Duration [CAD]SOI [CAD]Duration * [CAD]
200021.204334.07.5348.77.5360.89.8
250051.316334.47.8348.87.8360.811.2
* Standard duration for reference fuel B7.
Disclaimer/Publisher’s Note: The statements, opinions and data contained in all publications are solely those of the individual author(s) and contributor(s) and not of MDPI and/or the editor(s). MDPI and/or the editor(s) disclaim responsibility for any injury to people or property resulting from any ideas, methods, instructions or products referred to in the content.

