Article

Evaluation of Thermal Stress and Performance for Solid Oxide Electrolysis Cells Employing Graded Fuel Electrodes

Faculty of Maritime and Transportation, Ningbo University, Ningbo 315832, China
*
Author to whom correspondence should be addressed.
Energies 2025, 18(11), 2790; https://doi.org/10.3390/en18112790
Submission received: 29 April 2025 / Revised: 20 May 2025 / Accepted: 22 May 2025 / Published: 27 May 2025
(This article belongs to the Section A5: Hydrogen Energy)

Abstract

:
An electrochemical reactions coupled multi-physics model is developed and applied to elucidate overall performance and thermal stress distributed in solid oxide electrolysis cells (SOECs) with graded fuel electrodes. Extending the conventional fuel electrode, the effects of various graded parameters are investigated and discussed in terms of porosity, pore size, and material composition, with the goal of identifying characteristics of the hydrogen production rate and maximum thermal stress. The results show that the application of the graded parameters is able to optimize the gas distribution and to improve reaction kinetics, avoiding local overheating. The generated hydrogen molar fraction is enhanced by 15.6% while the maximum thermal stress is decreased by 5.0% if the graded parameters are applied, while changing the material composition may increase the thermal stress under the same circumstances. These explorations elucidate the complex role of the graded fuel electrodes on the electrolysis and thermomechanical properties of SOECs.

1. Introduction

Although a solid oxide electrolysis cell (SOEC) shares the same materials with that in a solid oxide fuel cell (SOFC), its energy conversion processes are fundamentally opposite, resulting in distinct operational characteristics [1,2]. Moreover, a mismatch in coefficient of thermal expansion (CTE) between the porous electrode and electrolyte materials has a more pronounced effect on the performance of SOECs operating at high operating temperatures [3,4], which may induce internal thermal-stress-related failures (including cell cracking and layer delamination) or degrade cell performance and the longevity of its service life [5,6,7].
Electrode structure design and material selection have a significant effect on electrolysis efficiency and product purity [8]. Functionally graded material electrodes (FGMs) are developed and applied in the cells to address this issue [9,10]; this employs modified electrode microstructures by progressively altering their material compositions or structures along cell thickness direction (e.g., from the electrolyte/electrode interface to the electrode’s free surface connecting with the interconnector), by improving its mass and heat transfer processes and mitigating the thermal stress [11,12].
A schematic of an SOEC with dense electrolyte sandwiched by graded porous electrode is presented in Figure 1. It should be mentioned that, along the cell thickness direction, the porosity and pore size of the electrodes gradually vary, while the composition of the electrode material may also undergo certain changes. The preparation of the graded electrodes for SOEC can be achieved through various techniques, such as electrophoretic co-deposition, screen printing, composite aerosol deposition, and atmospheric plasma spraying [13,14,15,16].
On the other hand, various theoretical models and numerical methods have been developed to reconstruct the graded electrode structures for simulating their transport and electrochemical processes [17,18]. It should be noted that the issues and approaches addressed in the above-mentioned studies at different scales are inconsistent. For instance, the design of the graded electrode particles was randomly filled at the atomic scale, the morphology of the porous electrode was altered at the mesoscopic scale, or the optimal curved gas diffusion paths were designed, while the macroscopic models investigated the overall performance of the functional layer reactions [19,20,21,22]. Although the microscopic approach can effectively investigate the optimization principles of the graded electrodes, it cannot directly offer guidance for practical applications.
It is also true that the graded fuel electrodes were primarily investigated with a focus on SOFCs, with limited applications in SOECs. Meanwhile, it is difficult to measure the internally distributed parameters (e.g., hydrogen molar fraction and thermal stress distribution) through experimental methods for the cells operating at high-temperature sealing conditions. Therefore, employing numerical simulation methods to predict the thermal stress distribution in SOECs is crucial for optimizing the cell structure and performance [23].
Traditional SOEC models typically apply the homogenization method in modeling the electrodes, which often overlooks the complexity of the microscopic structure within the electrodes and fails to effectively predict the reaction rates and mass transport processes, thereby hindering the optimization of electrode structures [23,24]. To further understand variations and impacts of FGMs on the electrode degradation, some researchers have examined the detailed evolution within the graded porous electrodes from a microscopic perspective [19,20,25]. It can be observed that effective gas diffusion path can be significantly improved by precisely controlling the microstructure and porosity distribution at pore levels in the graded porosity electrode. It has been proven that the alleviating concentration overpotentials caused by the gas diffusion in the porous electrodes may improve the thermal stability and inhibit growth of Ni clusters [26,27]. Nevertheless, these studies neglect the complex electrochemical reactions and mechanical performance within SOECs, which highlights the limitations of these models [28]. The three-dimensional computational fluid dynamics (CFD) model offers significant advantages in assessing the electrochemical reactions with various transport processes and thermal performance of FGM electrode in SOECs, providing an intuitive representation of physical phenomena, which can couple fluid flow and heat transfer processes, enabling a comprehensive reflection of the complex behavior (including the electrochemical properties and thermal stress distribution) in the SOEC.
In the fuel-electrode-supported SOEC, the relatively thick fuel electrode makes the cell design and its microstructure properties particularly critical. Many researchers have employed simplified models to investigate effects of the graded fuel-electrode-supported SOECs [29,30]. Employing a graded porous electrode can effectively enhance the electrochemical activity of the cells by increasing the probability of triple-phase boundary (TPB) formation and hydrogen collisions [31,32]. For instance, a half-cell model incorporating the graded porosity was proposed to investigate impact of the graded electrodes on the cell performance [33]. It was found that optimizing the microstructure can compensate for abrupt changes in the CTE between the electrodes and the electrolyte layer, thereby reducing the thermal stress in the electrolyte layer. Saied et al. [34] compared SOFCs employing FGM electrodes with constant porosity electrodes, and it was revealed that the von Mises stress was reduced by half, while energy conversion efficiency was significantly improved. Zeng et al. [35] and Gao et al. [36] investigated the relationship between the porosity of the fuel electrode and the exchange current density. Their results indicated that increasing the porosity of the fuel electrode reduces its activation polarization while maintaining high electrochemical performance and improving the mechanical compatibility of SOFC components. It should be noted that the aforementioned studies provide an insufficiently detailed description and analysis of the pore-scaled microstructural details of porous electrodes, and fail to conduct a more refined exploration of the impact of these microstructures on the macroscopic performance as well as thermal stresses.
Notably, the performance of SOECs is influenced not only by the electrode porosity but also by other microstructural factors, such as the electrode material composition. Osman et al. [37] developed a three-dimensional model of a honeycomb-structured fuel-electrode-supported SOFC, where compositional grading was applied to the porous electrode. This approach significantly improved the cell power density and reduced the maximum equivalent stress by 85% compared to the conventional electrodes without any gradient. Ma et al. [38] employed FGMs with different compositional distributions in the electrodes. It was revealed that the graded electrodes can markedly lower interfacial stress and mitigate localized stress concentrations. It was very interesting that, when FGMs are applied, specific material composition distributions to one side of the SOFC can reduce thermal stress on the opposite side. It should be noted that these studies on the graded electrodes have mainly focused on the microscopic level or single channel level. It is also true that, in these studies, the electrode structures were almost always treated with the homogenization approach, while the stress analysis was often focused on the interconnectors rather than on PEN regions (which are often susceptible to failure).
As mentioned early, even SOECs and SOFCs operate on similar principles, but SOECs differ in their heat absorption and release modes due to their unique feature of thermal neutral voltage. In the design of fuel-electrode-supported SOECs, the fuel electrode is thicker and is an important component where the fuel electrochemical reaction occurs, i.e., its performance determines the overall efficiency and durability of the SOEC. Ni composition in the fuel electrode is considered as one of the key factors affecting gas transport and electrolytic catalysis, which directly influence the reaction kinetics and TPB formation, as well as the electrochemical performance and structural stability of SOECs. Therefore, investigating the effect of the graded Ni composition and structures of the fuel electrodes on SOEC single cells is of great significance, and involves coupling of the multiple physical processes and various reactions, multi-scale structures, and operational parameters.
In this study, a multi-physics CFD model is developed for an SOEC single unit cell employing the graded fuel electrode and multi-channels with an interconnector. The effects of various graded parameters are investigated and discussed in terms of the fuel electrode porosity, pore size, and Ni composition, with aims to clarify the relationship between the graded fuel electrodes with the characteristics of the produced hydrogen and thermal stress distributed at the PEN region.

2. Model Development

This section outlines the research methodology and procedures using a coupled multi-physics CFD model, which encompasses geometric modeling, governing equations, and boundary conditions, as well as validation through experimental data.
The following assumptions are applied in this study:
(1)
The operating condition is steady state.
(2)
The incoming and outgoing gases are considered to be incompressible and ideal, and the flow pattern is laminar.
(3)
All cell layers are considered to be linearly elastic materials and isotropic.
(4)
Each interface between the cell layers is continuous, i.e., there are no fractures present.
(5)
The thermophysical properties (e.g., modulus of elasticity, CTE, and Poisson’s ratio) of all SOEC components are varied solely with temperature.
(6)
The fuel electrode graded factors change linearly only with singular variables in the cell thickness direction, which means that, when one graded factor is altered, the other factors remain unchanged.

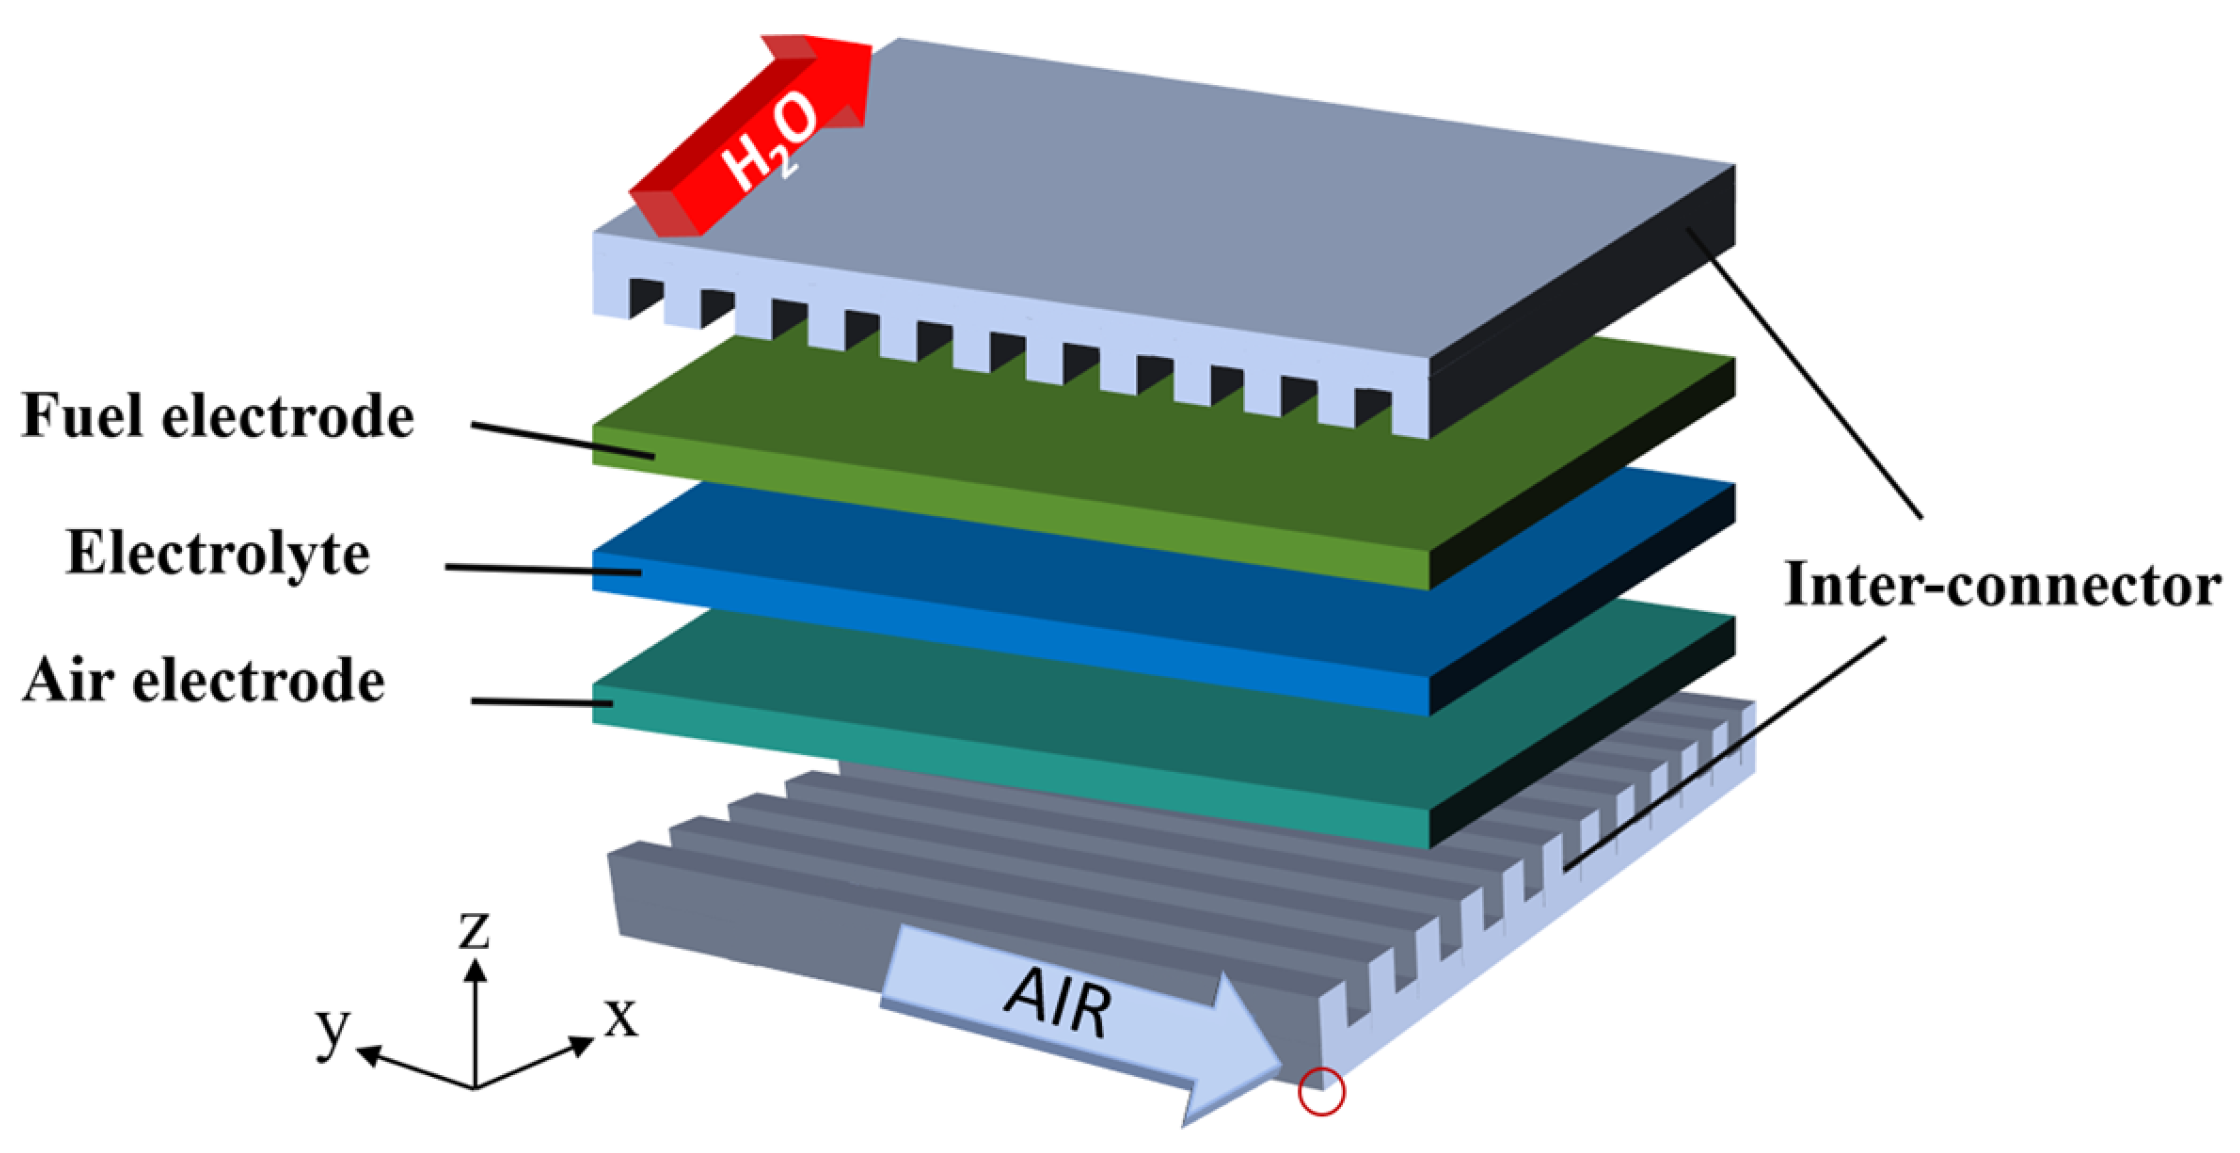
2.1. Geometric Model

A 91 mm × 91 mm planar SOEC unit cell with the fuel-electrode-supported structure is selected from the middle part of the SOEC stack. As shown in Figure 2, the circle in the lower right corner is the origin of the coordinate system. The studied geometry consists of an interconnector with 26 air channels, PEN, and an interconnector with 26 fuel channels, in which a cross-flow pattern is employed in this study. Table 1 presents the geometric parameters of the base-case SOEC (i.e., the cell without considering the graded fuel electrode). The cell materials include the porous fuel electrode (Ni/YSZ), dense electrolyte (YSZ), porous air electrode (LSM), and stainless steel interconnectors, as summarized in Table 2.
Three sets of the graded fuel electrodes are proposed for further investigation, which are graded porosity, graded pore size, and graded Ni composition. As shown in Figure 3, a relationship is applied for each graded factor with the normalized position within the graded fuel electrode. The following equation can be used to define the distribution of graded factors along the thickness direction of the graded fuel electrode:
X n = X 0 + m ( h t )
where Xn represents the graded parameter to be evaluated, X0 represents its initial value, h is the distance from the interface between the porous electrode/dense electrolyte to the free surface of the porous electrode connecting with the channels, t is the total thickness of the porous fuel electrode, and m is the variation coefficient. It should be mentioned that the porosity of the traditional fuel electrode without any gradient is typically set at 0.4, with a pore size of 4 μm, and the Ni content is 0.5, which is defined as the base-case in Figure 3.

2.2. Governing Equations

2.2.1. Electrochemical Reactions

The electrochemical reactions in the SOEC are composed of the reduction reaction at the fuel electrode and the oxidation reaction at the air electrode, as expressed below:
H2O → O2 + 2H+ + 2e
2H+ + 2e → H2
The current density and electrochemical reaction rate in the SOEC are closely related to the operating voltage. During the operation of the SOEC, the working voltage required for the SOEC can be expressed as
V = E Nernst + η act + η conc + η ohm
ENernst represents the Nernst potential; ηact, ηconc, and ηohm are the activation, concentration, and ohmic losses, respectively.
The Nernst potential can be specifically calculated using the following equation:
E Nernst = Δ G 2 F + R T 2 F ln P H 2 P O 2 1 2 P H 2 O
ΔG represents the Gibbs free energy; F represents the Faraday constant; R represents the ideal gas constant; T represents thermodynamic temperature; and Pi represents the partial pressure of H2, H2O, and O2 at the electrode–electrolyte interface, respectively.
Current transfer is achieved through movement of the electrons in the electrodes and ions in the electrolyte layer. The equations governing the transport of ions and electrons are as follows:
σ i e Φ i = ± J
σ e e Φ e = ± J
where Φi and Φe represent the ionic and electronic potentials, and σ i e and σ e e represent the effective ionic and electronic conductivities, respectively. J represents the current density indicating impact of the electrode reaction kinetics on charge balance. The effective conductivity in the porous electrodes is related to the conductive particles within the electrode materials [41]:
σ i e = σ i ( 1 θ Ni ) ( 1 ϵ )
σ e e = σ e θ Ni ( 1 ϵ )
where θNi represents the volume fraction of electronic conductor particles in the fuel electrode material, which is affected by the graded composition electrode, which varies solely with the change in the content of Ni, where ϵ represents the porosity of the porous electrode.
The electrode reaction kinetics can be described according to the generalized Butler–Volmer equation for charge transfer reactions. For the fuel electrode, the Butler–Volmer equation can be expressed for the fuel electrode [40]:
J = J 0 , H 2 exp 1 + β air F η act , fuel R T exp β fuel F η act , fuel R T
J = J 0 , O 2 exp β air F η act , air R T exp β fuel F η act , air R T
where J0 represents the exchange current density and β represents the asymmetric charge transfer coefficient. The exchange current densities J0 for both the fuel electrode and the air electrode can be expressed as
J 0 , H 2 = γ H 2 exp E act , fuel R T P H 2 P std P H 2 O P std
J 0 , O 2 = γ O 2 exp E act , air R T P O 2 P std 1 4
where γ represents the pre-exponential factor, Eact represents the activation energy, Pi represents the partial pressure of each component, and Pstd represents the standard pressure. Table 3 summarizes the parameters involved in the above equations.
The activation polarization can represent the activity of the electrode and can be calculated using the following equation:
η act = Φ e Φ i E
The ohmic loss is calculated using Ohm’s law based on the electrical resistance:
η ohm = J ASR ohm
ASRohm represents the area-specific resistance of the SOEC. The concentration polarization arises from the difference between the actual gas partial pressures at the reaction sites and the gas partial pressures at the electrode surface. It should be noted that, in the current CFD model, the local partial pressure and concentration of the gases are directly calculated, and are further applied to evaluate the Nernst equation and the potential difference generated by the concentration polarization.

2.2.2. Gas Flow and Momentum Equations

The general continuity equation applies to the conservation of mass flow in various regions of the SOEC, as expressed below [43]:
( ρ u ) = Q mass
in which ρ represents the density of the mixed gases, u represents the velocity vector, and Qmass represents the mass source term, which is 0 within the channels region; while in the triple-phase boundary (TPB) regions, Qmass encompasses the consumption and production of gas species due to the electrochemical reactions within both the porous fuel and air electrodes:
Q mass fuel = J fuel ( M H 2 M H 2 O ) 2 F
Q mass air = J air M O 2 4 F
In the porous electrodes, the conservation of the momentum is typically described by the Darcy–Brinkman equation, which takes into account the consumption and generation of gases during the chemical reactions, as well as the influence of the porous structures of the electrodes:
ρ ϵ 2 u u = p + μ u + u T ϵ 2 3 u ϵ ϵ μ u k
where k represents the permeability, and μ represents the dynamic viscosity of the mixed gases. In the gas flow channels, ϵ is 1 while k is +∞.
The permeability is a physical quantity that describes the ease with which a fluid passes through a porous medium. According to the Kozeny–Carman relationship, the permeability affected by the porosity can be expressed as follows [44]:
k = ϵ 3 d pore 2 150 ( 1 ϵ ) 2
where dpore is the effective pore diameter. It should be noted that the graded pore diameter of the porous fuel electrode also influences the permeability through this equation, altering the flow velocity of the gas molecules through the porous fuel electrode structures.
Due to the transport of the multi-component mixed gases in the gas flow channels and porous electrodes, the density and dynamic viscosity can be obtained using the following equations:
ρ = p x i M i R T
μ = x i μ i
where xi is the mole fraction of the gas component i, Mi is the molar mass of the substance, and μi is the dynamic viscosity of the gas component i.

2.2.3. Mass Conservation Equation

The electrochemical reactions occur at the TPB regions between the porous electrode and the electrolyte layer, so the mass conservation equation is crucial for understanding the transport of the gases from/to the TPB regions. Given the frequent collisions between gas molecules and the solid surfaces of the porous electrodes, Knudsen diffusion plays a significant role. The conservation equation for each gas species can be expressed as follows [45]:
j i + ρ ( v ) ω i = Q mass
where ωi is the mass fraction of species, and ji is the mass flux of the species calculated using the following equation:
j i = ρ D i m k ω i
where D i m k represents the effective diffusion coefficient of gas species i, which can be calculated by the Fick diffusion coefficient ( D m ) and the Knudsen diffusion coefficient ( D k ) [46]:
D i m k = ϵ τ ( 1 D i m + 1 D i k ) 1
where τ represents the tortuosity factor, which is calculated using the following equation [47]:
τ = 1 p ln ϵ
The Knudsen diffusion coefficient is related to the graded pore size:
D i k = d pore 3 8 R T π M i
It should be noted that graded pore size affects the Knudsen diffusion, thereby altering the transport characteristics of the gases in the porous fuel electrodes.

2.2.4. Heat Conservation Equation

The heat transfer within the SOEC consists of two parts: convective heat transfer and thermal conduction. In this study, the heat radiation is neglected. The energy conservation equation for the SOEC can be expressed in a general format [48]:
ρ C p u T = ( λ eff T ) + Q h
where Cp is the specific heat capacity and λeff is the effective thermal conductivity for the graded porous electrodes, as expressed [49]:
λ eff = ( 1 ϵ ) λ s + ϵ λ g
λs represents the thermal conductivity of the porous electrode’s solid phase, and λg is that of the gas within the pores. It should be noted that the effective thermal conductivity reduces to the gas thermal conductivity in the channels, while into the solid ones in the solid regions (such as the ribs and interconnectors). The term Qh denotes the heat source generated per unit volume within the TPB region, which includes the entropy changes due to the electrochemical reaction activation heat Qe, and the ohmic loss heat Qj (while 0 in the channels):
Q h = Q e + Q j

2.2.5. Thermal Stress–Strain Equation

Due to structural constraints (such as the cell frames that limit material deformation) and the mismatch in the mechanical properties of various components at high temperatures, the elastic strain and thermal strain will be generated. Therefore, the total strain can be expressed as follows [35]:
ε t = ε th + ε el
where εth represents the thermal strain, and εel represents the elastic strain. The thermal strain is calculated as
ε t h = a ( T T ref )
where α is the CTE, T is the local temperature predicted under the operating conditions, and Tref is the reference temperature at which there is no stress.
For an isotropic linear elastic solid material, the stress–strain relationship can be expressed as
C = E ( 1 + v ) ( 1 2 v ) 1 v v v 0 0 0 v 1 v v 0 0 0 v v 1 v 0 0 0 0 0 0 ( 1 2 v ) 2 0 0 0 0 0 0 ( 1 2 v ) 2 0 0 0 0 0 0 ( 1 2 v ) 2
where ν is Poisson’s ratio and E is the Young’s modulus of the material. When considering the volume fraction of Ni, the Young’s modulus can be expressed as follows [50]:
E = ( 1 + c + c 2 ) E 1 E 2 + c E 1 2 ( 1 + c ) ( c E 2 + E 1 )
where E1 is the Young’s modulus of YSZ material, E2 is that of nickel material, while c satisfies the following relationship:
c = ( 1 V ) 0.5 1
where V represents the volume fraction of nickel.
Figure 4 illustrates how the graded parameters (in the porosity, pore size, and Ni composition) affect the hydrogen production efficiency and operating voltage. The porosity gradient, by altering gas diffusion paths and permeability, plays a key role in affecting the mass and momentum transfer. Adjusting the porosity properly enhances the gas diffusion efficiency and boosts hydrogen production. It also impacts the local gas velocity and pressure distribution, influencing the kinetics of the electrochemical reactions. The pore size gradient impacts the gas diffusion by affecting the Knudsen diffusion and Darcy–Brinkman flow. Larger pores may speed up the gas transport in the electrode, reduce the concentration polarization, and improve SOEC performance. This graded parameter also influences the gas residence time in the electrode, indirectly affecting the hydrogen production. The Ni composition gradient affects the catalytic activity and electronic/ionic conductivity of the electrode, as well as the electrochemical reaction rate. In the TPB region, changes in Ni composition alter the number of active sites and the reaction kinetics, impacting the hydrogen production performance and operating voltage. The optimized gradient design parameters affect an SOEC’s operating voltage and overall performance to enhance the hydrogen production and reduce the activation, concentration, and ohmic losses.

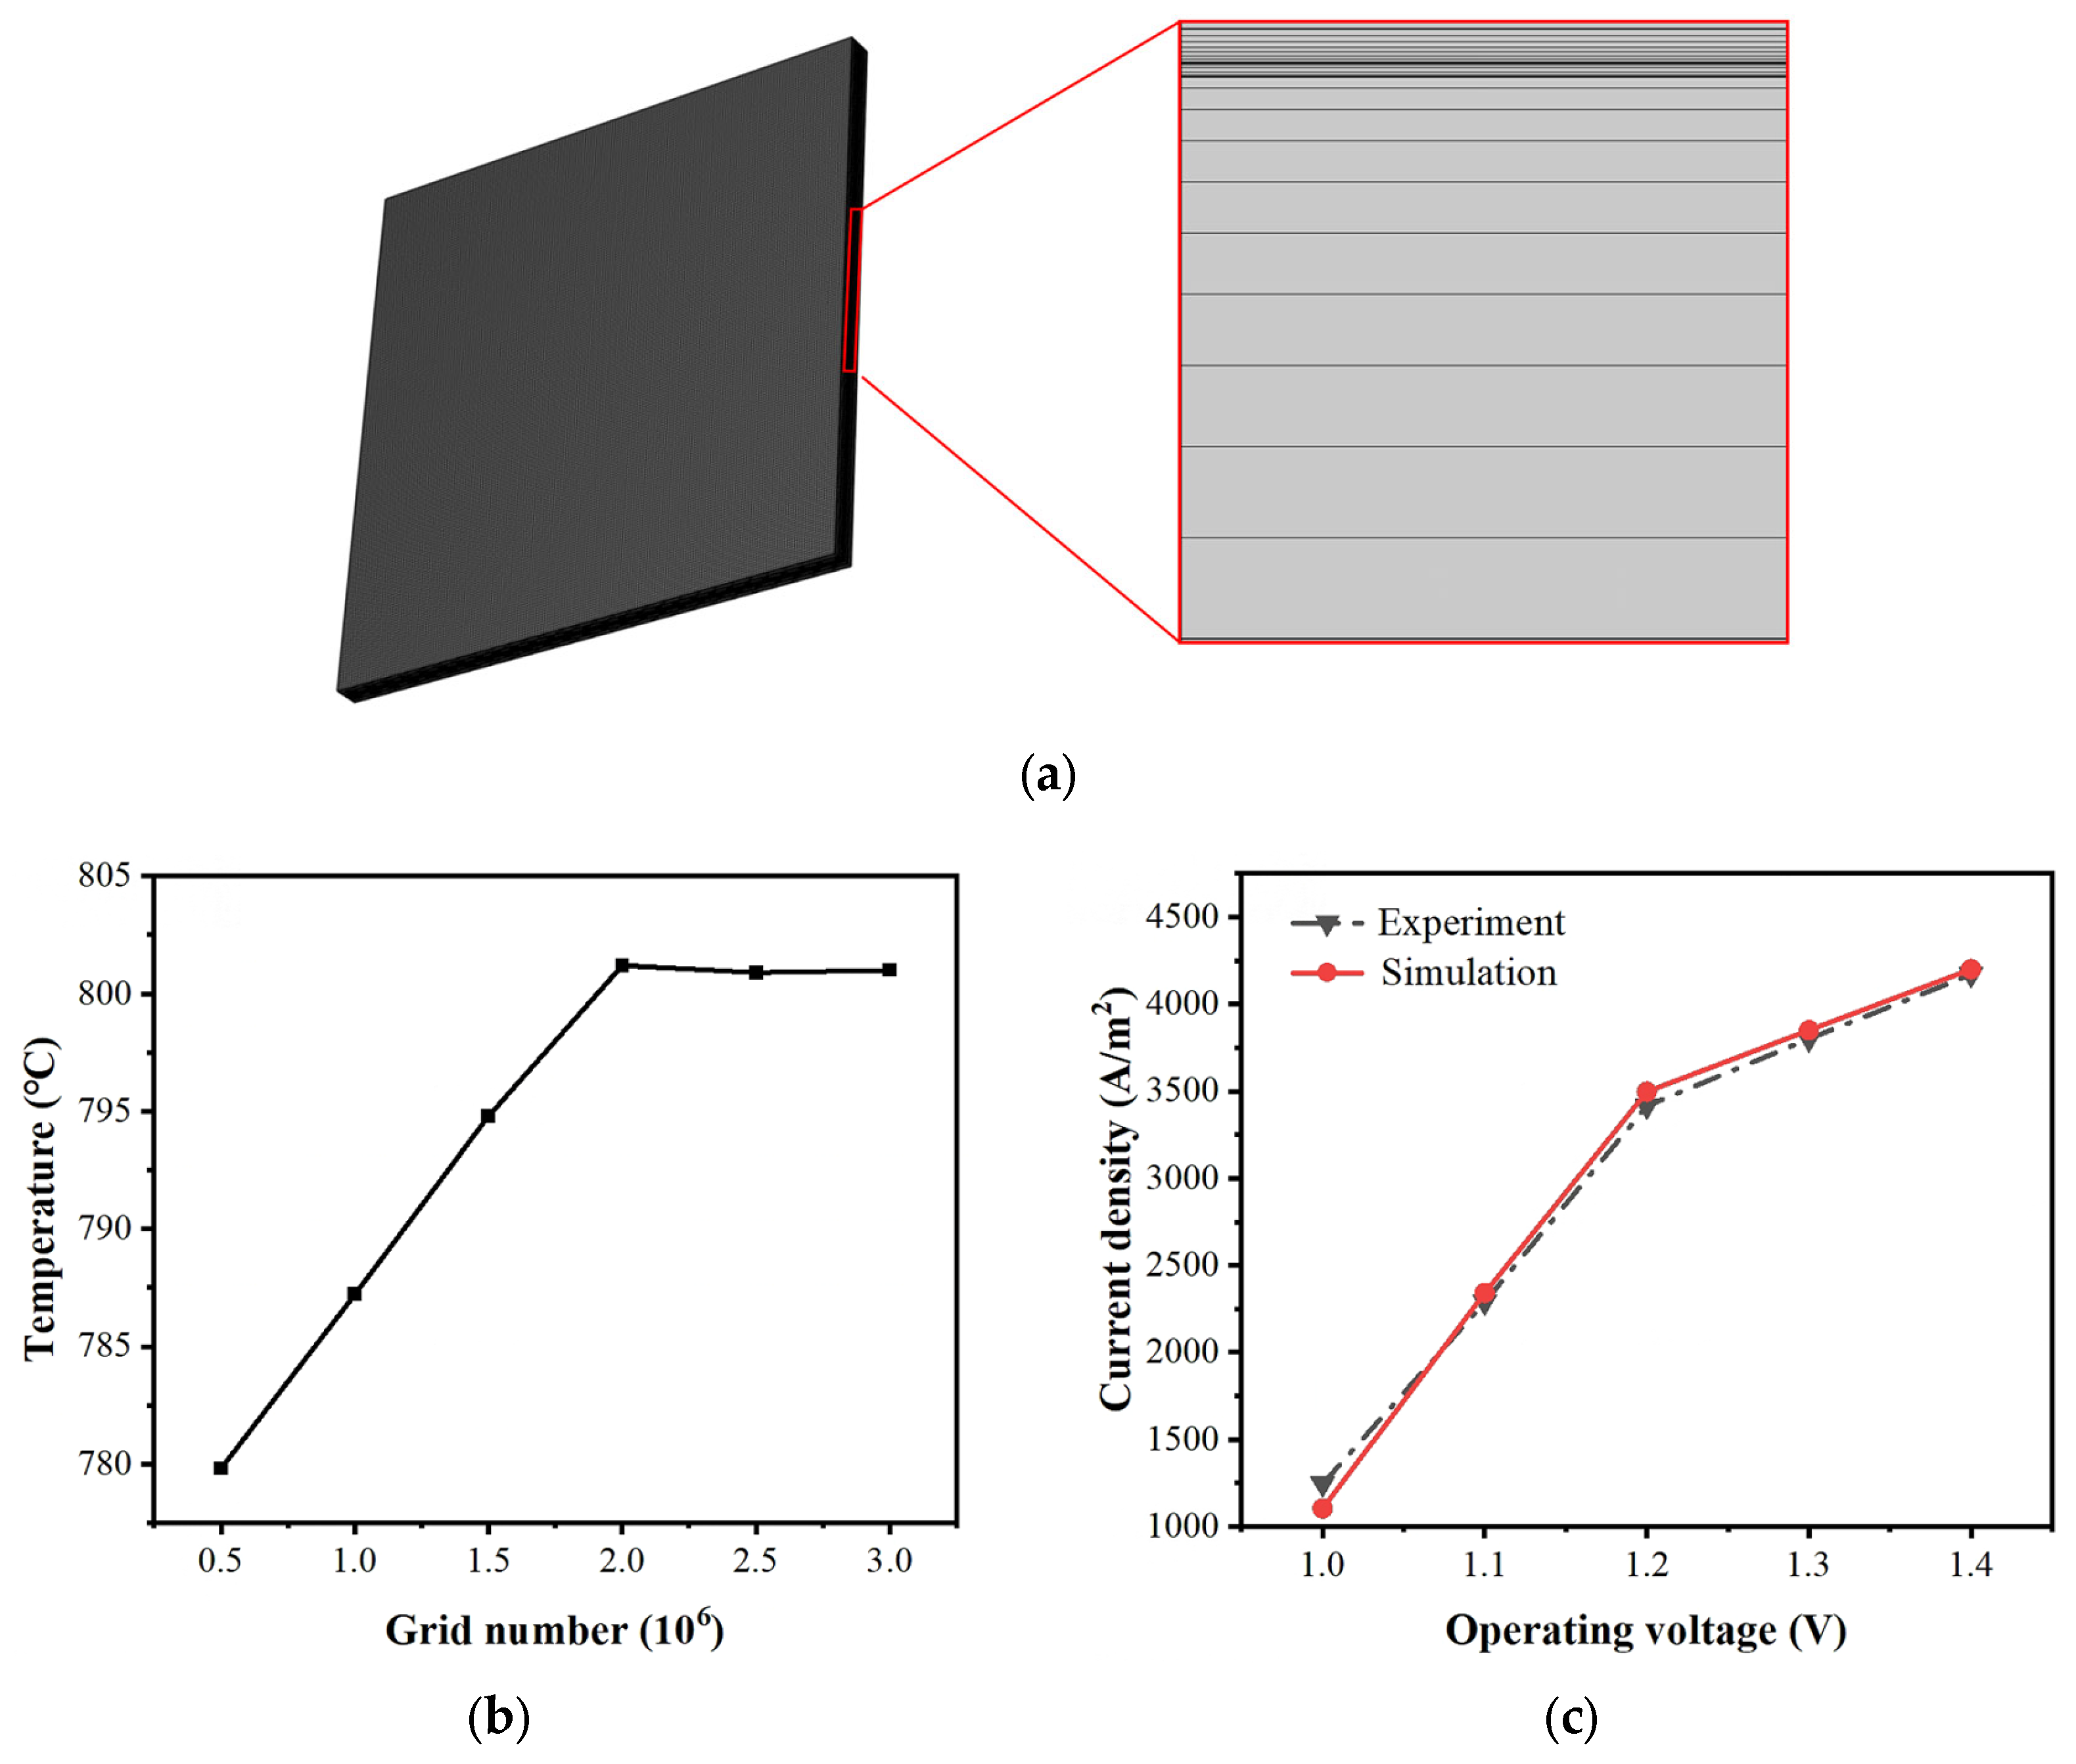
2.3. Boundary Conditions and Model Validation

In this study, one unit cell located in the central region of the SOEC stack is considered, and the assembly forces between the stacks are neglected. Mechanically, the upper and lower surfaces of the SOEC are subjected to fixed boundary conditions, as detailed in Table 4. Considering the potential differences in thermal–electrochemical reactions between the porous electrode surface and the internal gas flow of the SOEC with varied porosities, the three-dimensional numerical study from previous research [39] is extended to investigate the performance affected by various graded fuel electrodes during the operation. It should be noted that the same configuration and geometry parameters applied in the previous study are also employed in order to ensure the comparability of the modeling and validation of the simulation results.
In this study, COMSOL Multiphysics 6.2 is used to build a multi-physics coupled model and solve the governing equations based on its built-in physics interfaces. Here, the customized physical interfaces define coupling of the electrochemical reactions, mass transfer, fluid flow, and heat transfer, with the finite element method used for numerical discretization. The geometrical model and meshes of the PEN regions are shown in Figure 5a. For the regions involving complex processes in the PEN region, a dense meshing of rectangular prisms is applied.
The average temperature predicted on the electrolyte surface at the thermal neutral voltage is used to test mesh independence, as shown in Figure 5b. It is observed that when the total mesh exceeds 2 million, the predicted temperature stabilizes at 800 °C. As shown in Figure 5c, the simulation results align well with the experimental data from the literature [39] with the root mean square error (RMSE) of 4.65, demonstrating the effectiveness of the current CFD modeling and prediction.

3. Results and Discussion

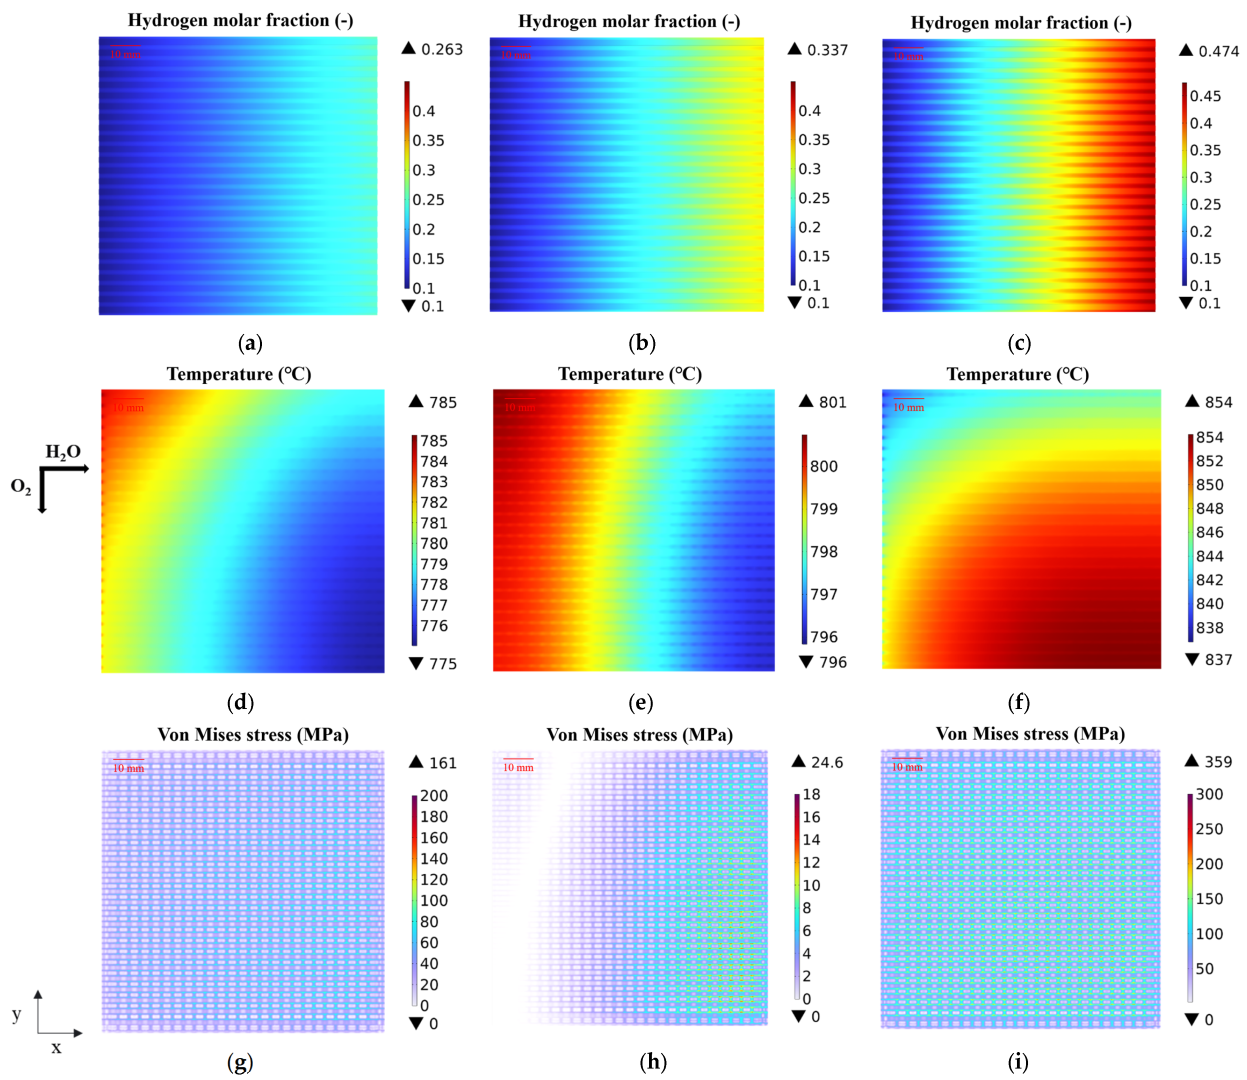
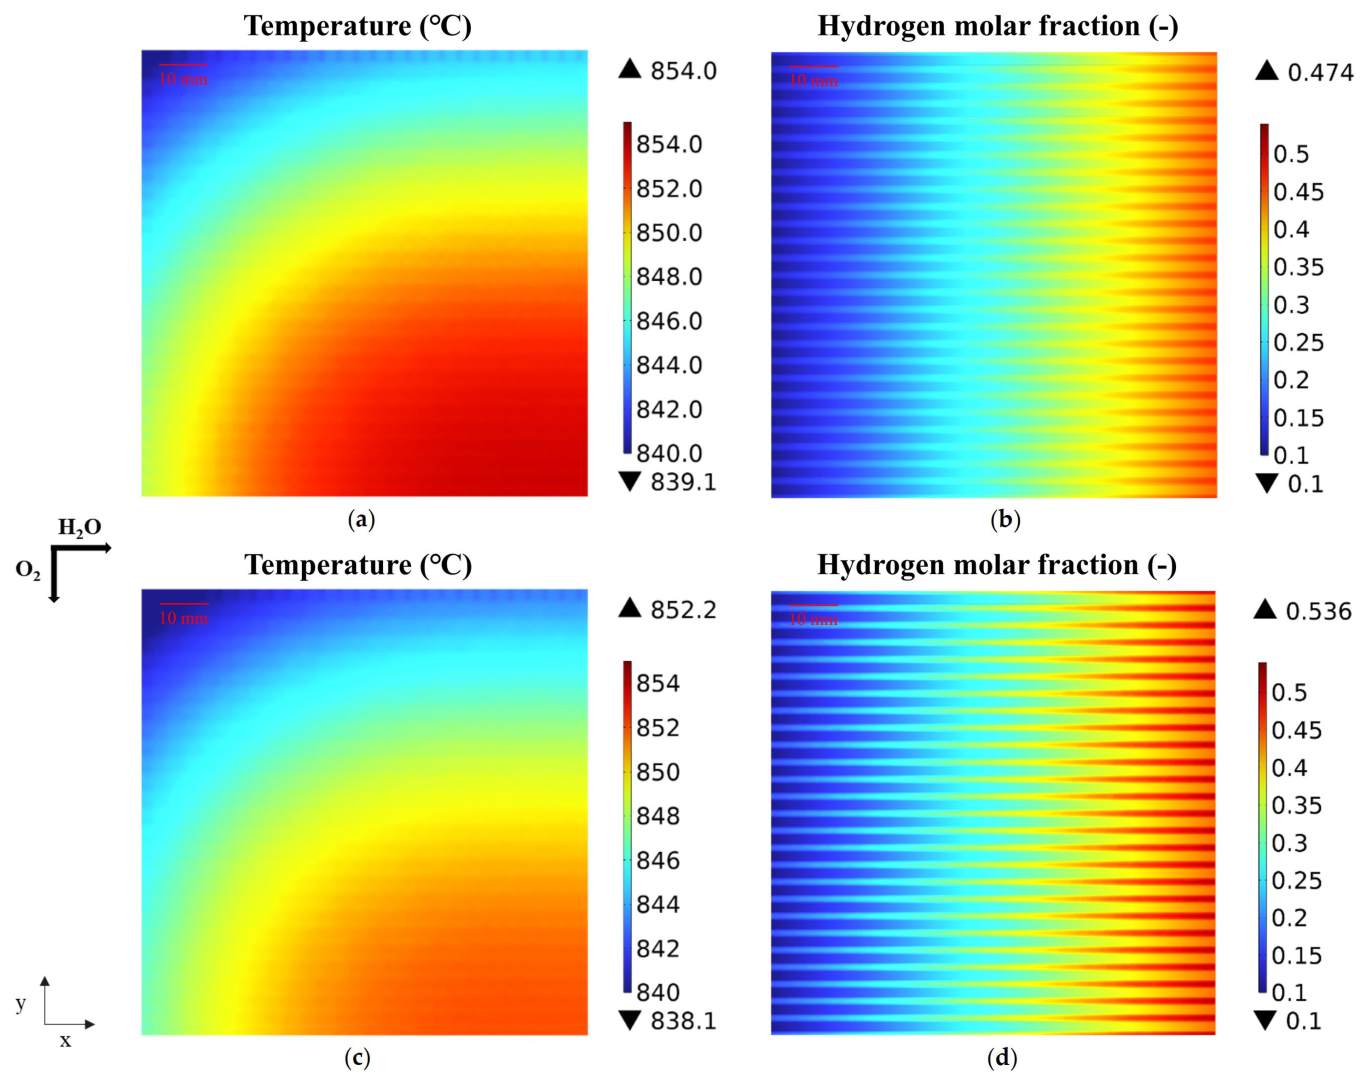
3.1. Predicted Performance with the Base-Case Porous Fuel Electrode (Case 0)

This section primarily presents key results from the numerical simulations conducted at various operating voltages. Based on the predicted distribution of hydrogen generated, temperature, and von Mises stress, the electrolysis performance and thermal behavior of the SOEC under traditional conditions are outlined and discussed. In this regard, the von Mises stresses are often employed to represent the temperature-related thermal stresses, because the von Mises stresses simplify the three principal stresses in a complex stress state into a single scalar value, which provides a convenient way to assess the yield risk of the cell materials.
The predicted hydrogen production are presented in Figure 6a–c for various operating voltages. It is found that the hydrogen production increases with the operating voltage. At the operating voltage of 1.2 V, the hydrogen molar fraction at the cell outlet is 0.263, while at 1.4 V, it rises to 0.474. The predicted hydrogen molar fraction is the lowest in the cell inlet region because the electrochemical reaction is less intense in this region. Along the main flow direction of water vapor, the hydrogen molar fraction gradually increases, reaching its maximum in the ribbed area at the outlet region. This may be attributed to the delayed diffusion of H₂ in the porous fuel electrode. Notably, as the operating voltage increases, the hydrogen production continues to rise, indicating that a higher operating voltage leads to greater water-to-hydrogen conversion efficiency.
Figure 6d–f demonstrate the predicted temperature distribution at different operating voltages. When the operating voltage is 1.2 V, the temperature decreases along the gas flow direction because it is in the heat absorption state. When the operating voltage is 1.4 V, the temperature in the PEN region is much higher than the operating temperature; thus, the temperature distribution increases along the gas flow direction. This phenomenon is mainly due to the lower intensity of the electrochemical reaction at the inlet, and the smaller temperature difference between the high-temperature gas passed in and the environment. In addition, the electrochemical reaction continues along the gas flow direction, resulting in the accumulation of exothermic heat from the SOEC, which causes the temperature to rise continuously along the gas flow direction.
On the other hand, as shown in Figure 6g–i, the maximum thermal stresses are 161 MPa, 24.6 MPa, and 359 MPa at the operating voltage of 1.2 V, 1.3 V, and 1.4 V, respectively. It should be noted that the temperature difference is minimal at the 1.3 V operating voltage due to the fact that the voltage is very close to the thermal neutral one, which therefore results in the lowest thermal stress. It can be observed from Figure 6c that the maximum thermal stress is 359 MPa occurring at the junction of the fuel and air flow channels in the PEN region, which increases gradually along the flow direction.
SOECs operating at 1.4 V and higher are widely used in industrial applications due to their high electrolysis efficiency. However, the elevated operating voltages exacerbate the uneven temperature distribution within the electrolysis cell, which may increase the local thermal stress or even significantly reduce the service life of the SOEC. As the SOEC using the conventional electrode is considered a representative one, this operating condition is used as case 0 to be compared with those from other cases in this study. The distributions of the hydrogen molar fraction and thermal stresses when applying different graded fuel electrodes are mainly compared.
The presence of high thermal stress by increasing operating voltage can adversely affect the long-term operation of an SOEC. Improving the electrochemical performance of the electrodes could enhance overall conversion efficiency and reduce energy consumption in an SOEC; this can be achieved by optimizing the electrode structure instead of increasing operating voltage. This optimization may involve altering the electrode morphology, adjusting the electrode material composition, or a combination. Based on this idea, three sets of the graded fuel electrodes are proposed, as shown in Figure 3 as well as Equation (1).

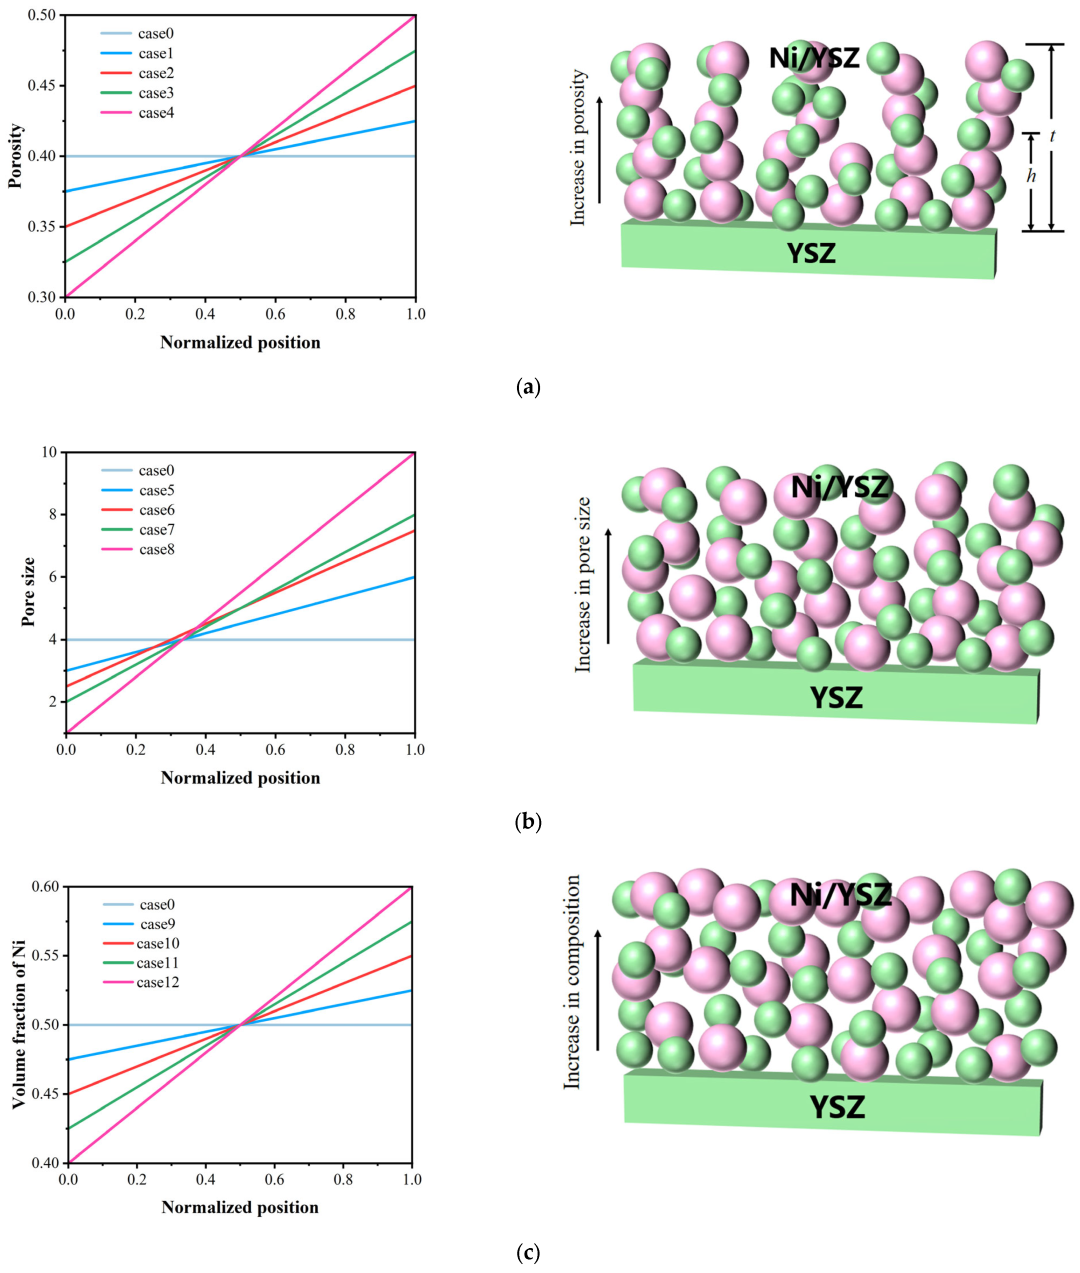
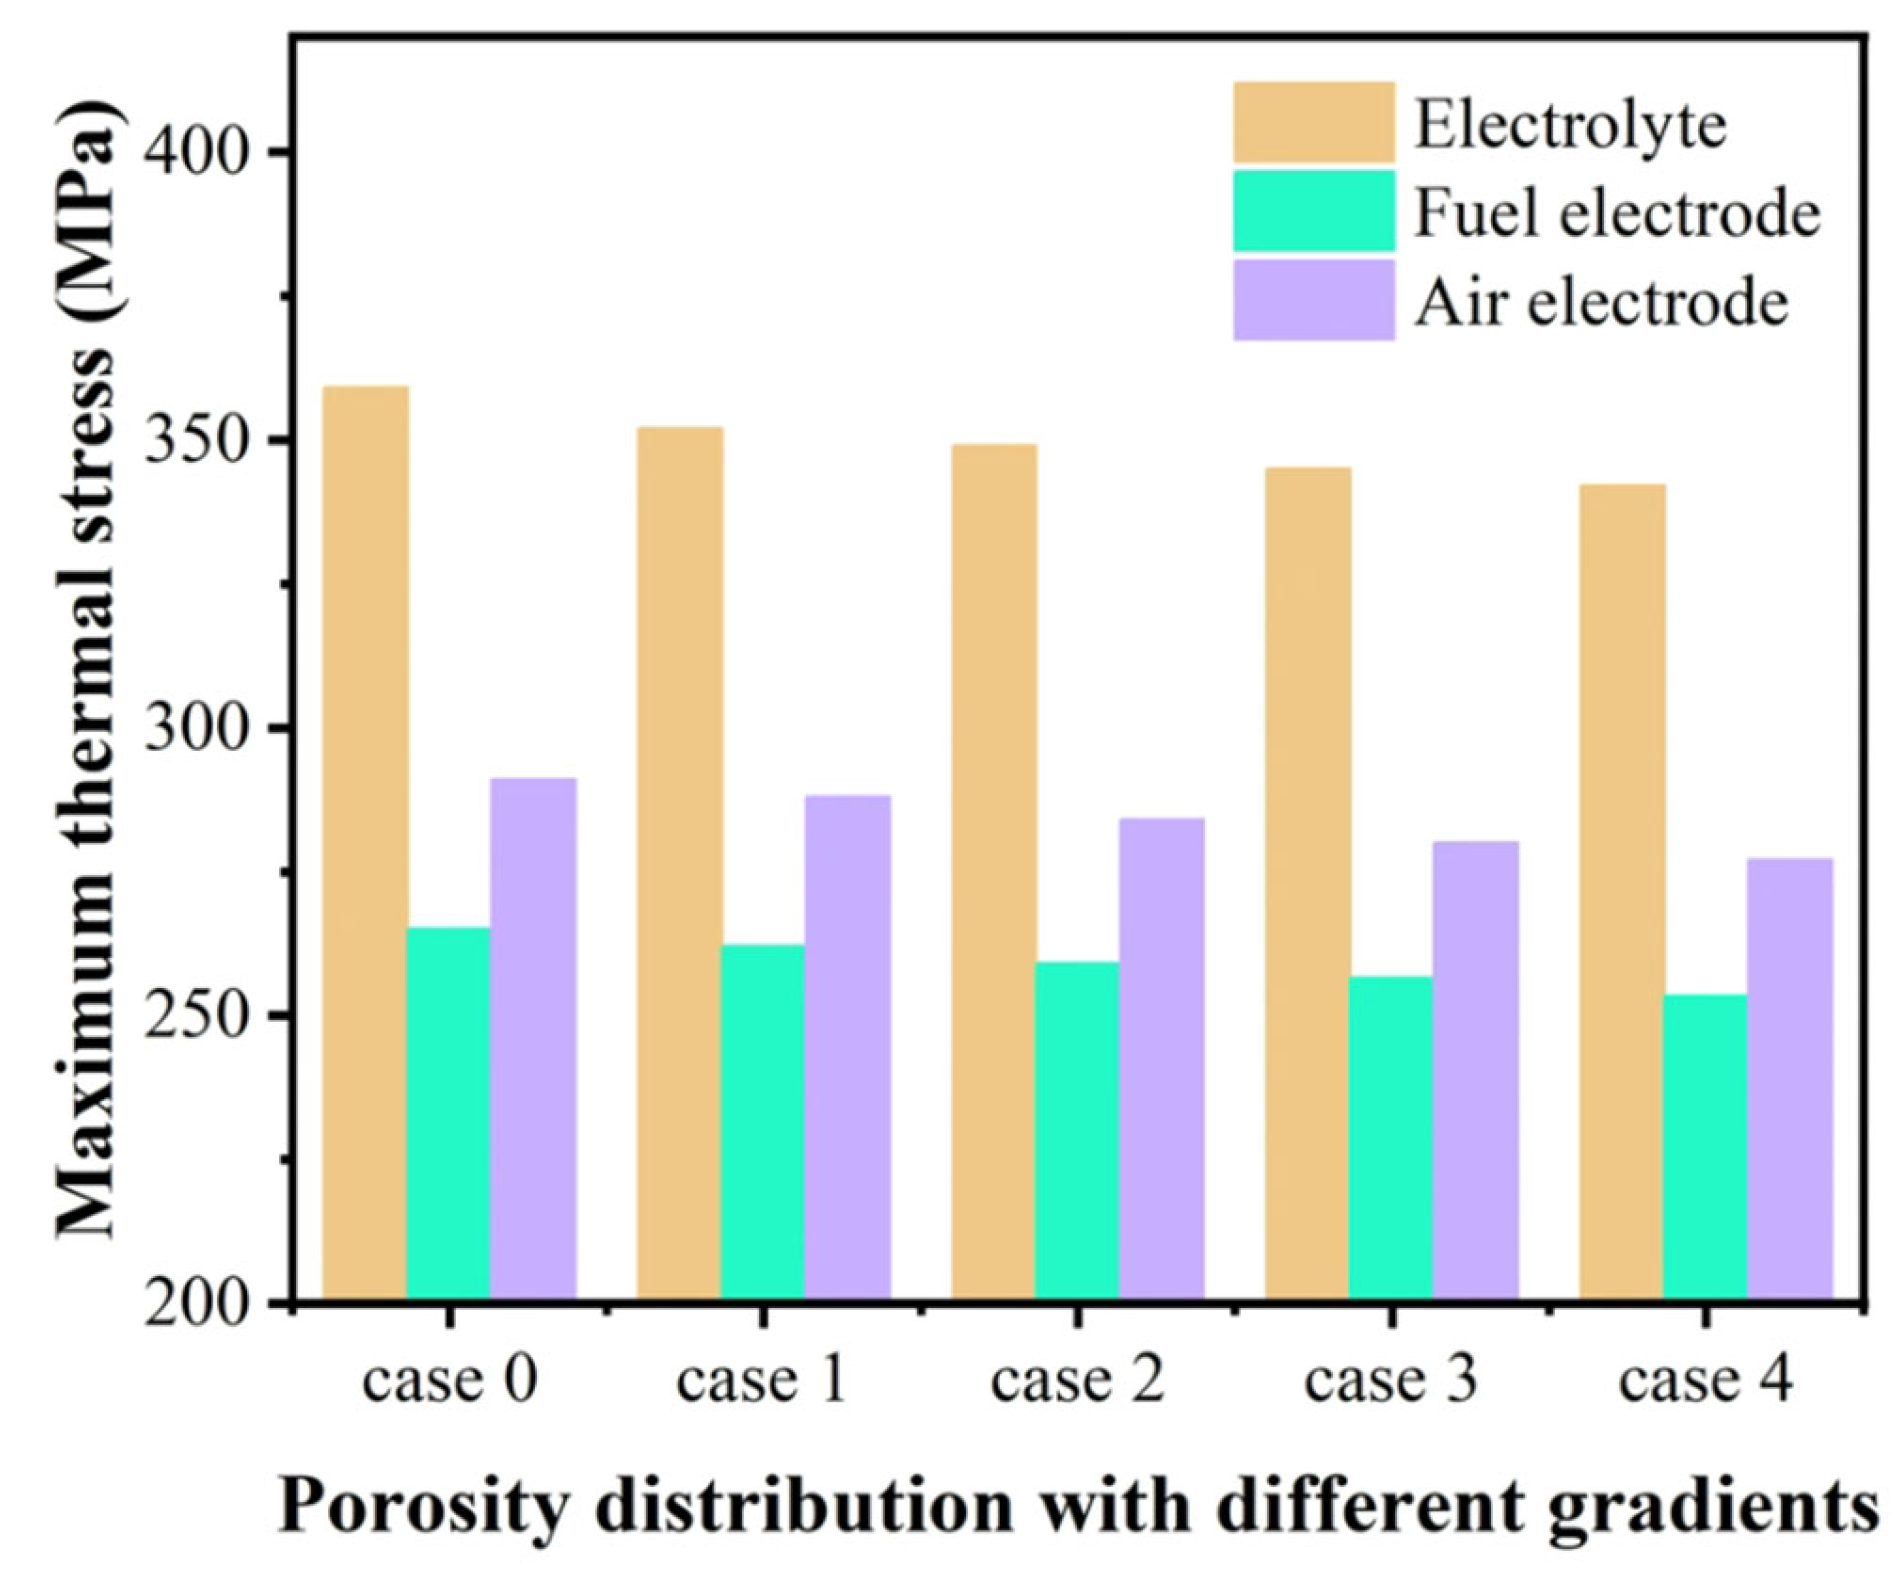
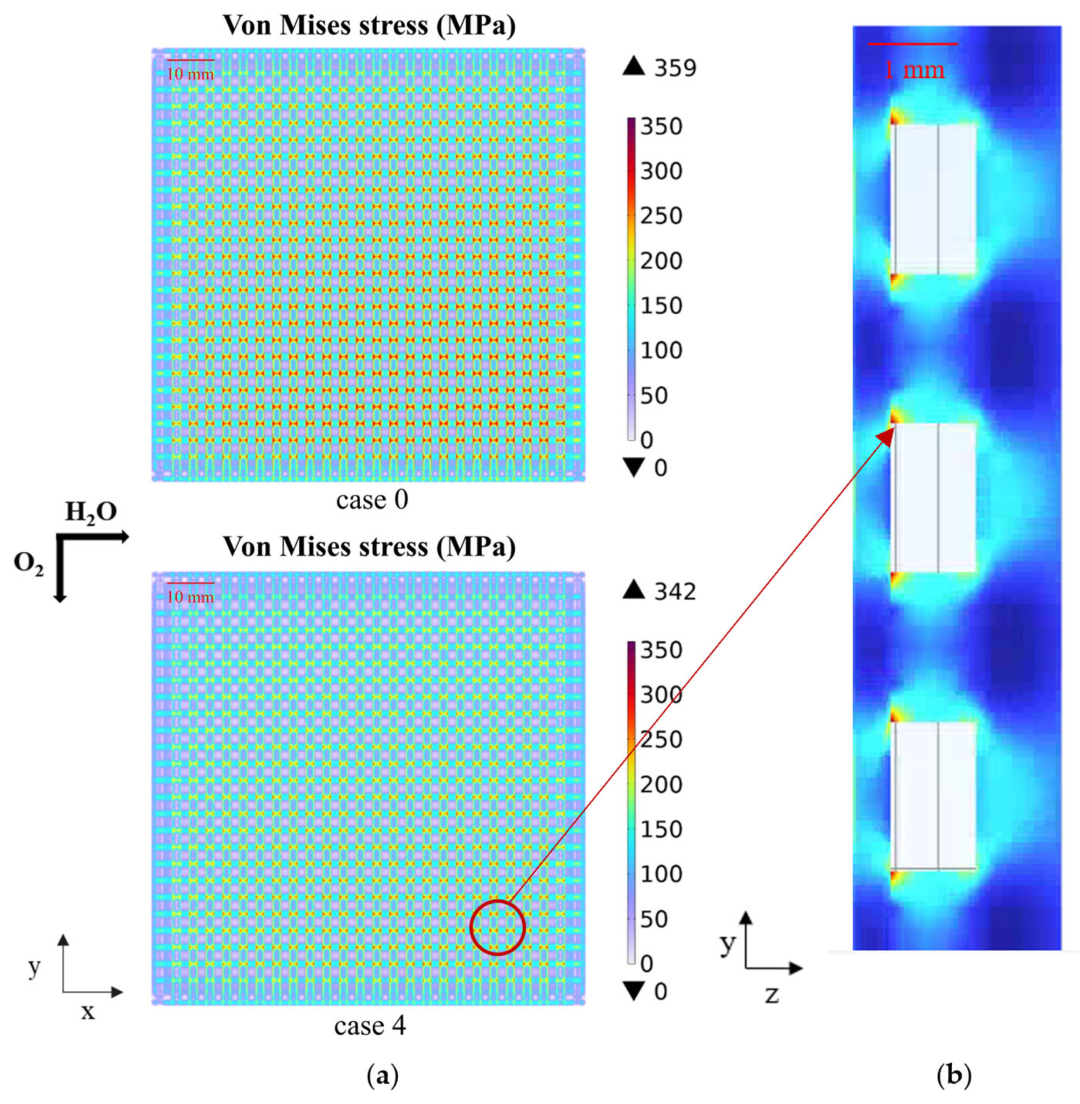
3.2. Effect of Graded Porosity

The averaged porosity for the SOEC fuel electrode is approximately maintained at 0.4. This study aims to determine the optimal range of the graded fuel electrode by varying its local porosity gradient, while the total porosity averaged over the electrode thickness is maintained (i.e., 0.4). The difference in the predicted electrochemical performance and mechanical properties will be outlined and analyzed by comparing with that obtained for case 0 condition presented in the last section.
In our previous study, it was found that the smaller the range of variation of the graded electrode parameters, the smaller the corresponding effect on the overall performance. Taking the graded porosity as an example, the hydrogen production performance and the maximum thermal stress vary very little when the graded porosity of the fuel electrode varies in the ranges of 0.395–0.405 (case a), 0.390–0.410 (case b), 0.385–0.415 (case c), and 0.380–0.420 (case d), respectively, as shown in Figure 7. Therefore, the present study compares the cell performance for graded fuel electrodes for a larger range of parameter variations.
From case 1 to case 4, the graded porosity gradually decreases from the channel to the electrolyte along the porous fuel electrode thickness direction. It should be noted that the range of the graded porosity increases, with the porosity near the electrolyte decreasing while that near the channel increases. The investigated parameters are summarized in Table 5.
The predicted maximum and minimum temperatures are shown in Figure 8a,b for cases 0 through 4 at 1.2 V and 1.4 V, respectively. It is indicated that the SOEC with a graded porosity along the thickness direction exhibits a reduced maximum temperature. By adopting the graded fuel electrode, the difference between the maximum and minimum temperatures (i.e., from case 1 to case 4) exhibits little change, as shown in Figure 8a. This is because although the porosity changes, the averaged porosity remains constant, meaning that the overall thermal conductivity of the porous electrode does not change significantly. Furthermore, the high thermal stability of SOEC ensures that the temperature variations remain minimal under these graded porosities.
On the other hand, as shown in Figure 8c, the hydrogen molar fraction increases as the porosity graded range expands. The maximum hydrogen molar fraction at the outlet for cases 1, 2, 3, and 4 reaches 0.508, 0.515, 0.525, and 0.536, respectively. In other words, case 4 demonstrates the greatest increase in the hydrogen production, which is enhanced by 13% compared to that in case 0.
The predicted maximum thermal stress under various cases is shown in Figure 8d. It is indicated that the maximum thermal stress is similarly distributed within all PEN components, i.e., it is decreasing gradually as the porosity graded range expands at 1.4 V. But for 1.2 V, the maximum thermal stress is almost constant. It is also clear that, among these components, the maximum thermal stress is the highest in the electrolyte layer, followed by the air electrode, with the lowest predicted in the fuel electrode at 1.4 V (as shown in Figure 9). The maximum thermal stress predicted in the electrolyte layer is primarily due to the difference in the CTE between the electrolyte and other cell components. This mismatch induces the additional thermal stress in the presence of a temperature gradient.
Additionally, due to the relatively thin electrolyte layer in the SOEC supported by the fuel electrode, the high elastic modulus results in a greater stress response. The maximum thermal stress in the fuel electrode is the lowest, primarily because the graded porosity design enables the fuel electrode to have varied porosity structures at different locations, which better aligns the CTE of the fuel electrode with that of the electrolyte and the interconnector channel/rib regions. This results in a more uniform temperature distribution within the fuel electrode, which helps alleviate the thermal stress concentration. This also reduces the overall thermal stress in the PEN to a certain extent. The predicted maximum von Mises stress in the electrolyte is 352 MPa, 349 MPa, 345 MPa, and 342 MPa for cases 1, 2, 3, and 4, respectively, at 1.4 V. It is a fact that the maximum thermal stress in case 4 is reduced the most, which is decreased by 4.7% (i.e., 17 MPa) compared to that in case 0.
As expected, the hydrogen production in case 4 exhibits the most significant and representative improvement compared with that in case 0. As the SOEC performance at 1.4 V is considered representative, comparisons with the other cases in this study are made primarily at this voltage. Therefore, these two cases are further compared individually, as presented in Figure 10.
The temperature distribution in the electrolyte region follows a similar trend in both cases, i.e., the high temperature appears at the gas outlet region which gradually increases along the fuel’s main flow direction (i.e., from the left- to the right-hand direction in Figure 10a,c). This is because the SOEC operates at a voltage of 1.4 V, which is above the thermal neutral voltage to place the SOEC in an exothermic state with the generated heat being carried by the flowing gases. Notably, the maximum temperature in case 4 is nearly 2 °C lower than that in case 0, while the location of the highest temperature shifts toward the fuel inlet region. This shifting can be primarily attributed to an increase in the range of the graded porosity. The heat is primarily generated by the electrolysis reaction in the SOEC.
The decreased graded porosity shortens the gas diffusion pathways within the electrode. This enables the electrochemical reactions to occur more rapidly and uniformly inside the electrode. Moreover, the graded porosity electrode design promotes more uniform heat distribution within the electrode, rather than concentrating in specific regions. In turn, this effectively mitigates local overheating and reduces the maximum temperature. Furthermore, optimization of the porosity gradient increases the effective diffusion coefficient in the region near the gas channels to reduce gas transport resistance. As a result, the temperature within the electrolyte surface decreases within a certain range. As the reaction progresses along the main flow direction, the molar fraction of fuel gas gradually decreases and the electrochemical reaction rate diminishes, while the heat generated within the cell decreases accordingly, causing the highest temperature to shift toward the fuel inlet.
As shown in Figure 10d, the fuel electrode adopts a graded porosity structure in case 4. The region near the flow channels has higher porosity, which is beneficial for hydrogen generation and diffusion. At the same time, the graded porosity electrode region facilitates the transformation and transmission of fuel and hydrogen. The enhanced diffusion ability makes it easier for hydrogen to accumulate near the flow channels, forming a high-concentration area at the outlet region. Meanwhile, a low gas transport resistance reduces the activated polarization and speeds up the electrochemical reaction rate, thereby improving the hydrogen generation rate.
The predicted von Mises stress in the electrolyte layer for case 4 is shown and compared with that in case 0 in Figure 11a. It is found that the distribution trend of the maximum thermal stress is similar to that of the temperature, with the maximum values primarily occurring near the fuel outlet region. This finding is attributed to the direct influence of the temperature and its distribution on the thermal stress distribution. The reduction in the temperature gradient within the cell is the primary factor contributing to the decrease in the thermal stress. Additionally, the arrangement of the graded porosity in the porous fuel electrodes typically changes the solid volume fraction that carries the mechanical load in the material, leading to a different Young’s modulus of the electrode material and resulting in varied thermal stresses during the temperature variations.
The enlarged view in Figure 11b clearly displays the location where the maximum thermal stress occurs, i.e., the gas outlet region in Figure 11a. The fuel electrode and fuel channel/rib junction are mainly intercepted for further analysis. Influenced by the cell cross-flow configuration, the maximum thermal stress in the electrolyte is concentrated in the rib regions of the upper and lower connectors that correspond longitudinally to the electrolyte. This phenomenon arises from the uneven distribution of the gas temperature, velocity, flow pattern, and gas composition within the channels. These imbalances may result in the non-uniformity in the electrochemical reactions, further leading to an uneven current density distribution, resulting in a higher overpotential and ohmic heating. The flow of fuel gas beneath the ribs is impeded, leading to a decrease in the heat transfer in this region, causing heat accumulation at the ribs to generate a larger temperature gradient particularly at the sharp edges or corners of the ribs, where the stress concentration is more pronounced.
In summary, the SOEC with the typical porosity gradient (i.e., in case 4) exhibits a 13% increase in the hydrogen molar fraction compared to that employing the conventional fuel electrode without the porosity gradient. Simultaneously, the maximum thermal stress is reduced by 17 MPa, which is about a 4.7% reduction. This improvement is attributed to the fact that the graded porosity promotes the overall SOEC performance.

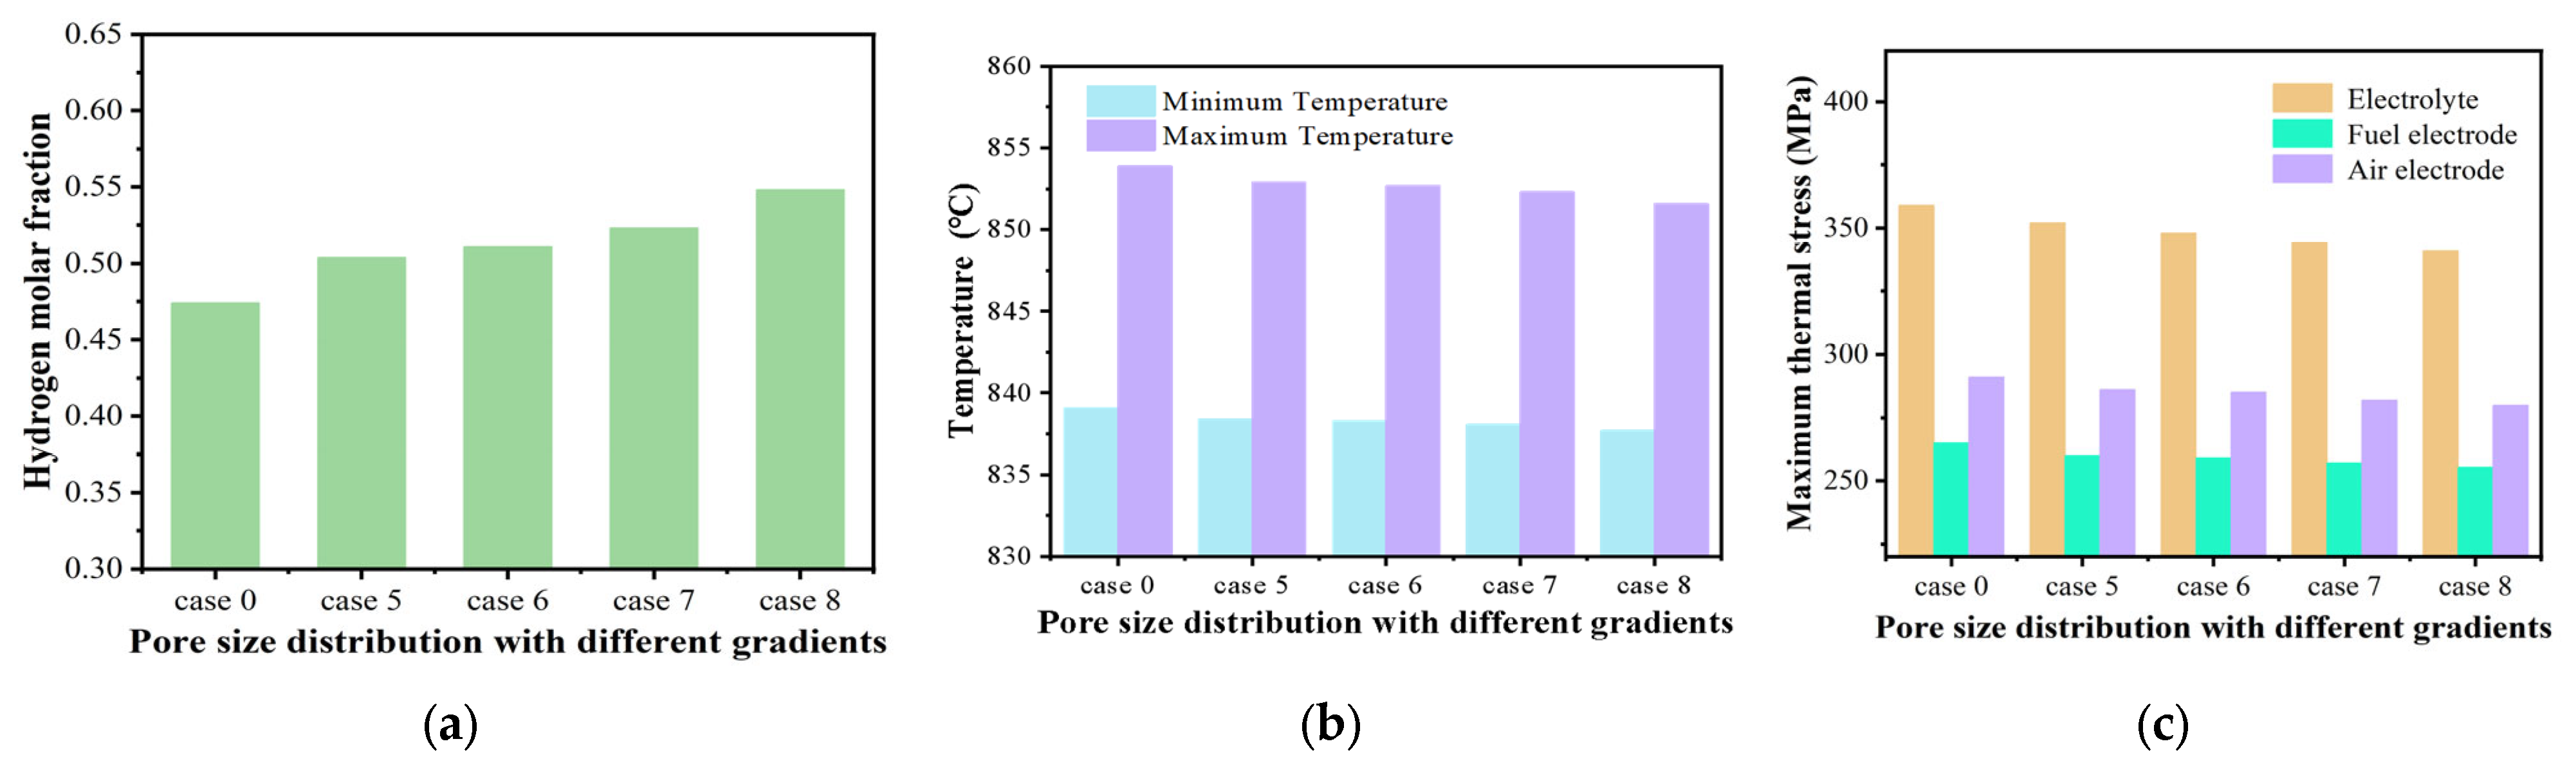
3.3. Effect of Graded Pore Size

The pore size and its distribution are crucial for the gas diffusion and mechanical strength, as well as the overall electrochemical performance within the porous fuel electrodes. Based on prior research [51,52,53], the average diameter falls within the range of 4–6 μm for most pores appearing in SOEC fuel electrodes. From case 5 to case 8, the pore size is gradually decreased from the channel to the electrolyte along the thickness direction; we aimed to analyze its impact. The investigated parameters are summarized in Table 6.
The predicted hydrogen production performance, along with the maximum and minimum temperatures of the cell, are predicted and shown in Figure 12a,b under different graded pore size conditions (i.e., case 5 to case 8). It is indicated that both the maximum temperature and the temperature difference decrease gradually from case 4 to case 8. In case 8 (i.e., with the most graded pore size), the maximum temperature is 852 °C and it is primarily distributed around the fuel outlet region, while the minimum temperature, around 835 °C, is predicted around the fuel inlet region. This finding is very similar to that obtained by optimizing the gradient of the porosity. The predicted hydrogen molar fraction also increases from case 4 to case 8, which is 0.504, 0.511, 0.523, and 0.548, respectively, in the fuel outlet region. Among these, case 8 exhibits the most significant improvement (enhanced by 15.6%) in the fuel outlet hydrogen production compared to that obtained in case 0. This performance enhancement is attributed to the graded pore size distribution, i.e., the pore diameter is the largest in the interface region close to the channel side, which gradually decreases towards the TPB region, in which the overall diffusion resistance is effectively reduced. This is because the larger pore diameters near the channels facilitate the ingress of H2O into the porous electrode toward to the TPB region, while smaller pores near the TPB region ensure a uniform distribution of steam and promote the electrochemical reactions. It is also true that the funnel-shaped pore structure improves return flow of the reacted gases and generated H2 back to the channels to enhance the gas transport, thereby boosting the SOEC performance. Furthermore, the gradually decreased pore diameter near the TPB region may increase the reaction sites, which may enhance the electrochemical reaction rates and reduce the activation polarization, as well as the mechanical strength in the TPB region.
The predicted maximum thermal stresses are shown in Figure 12c, and are quite similar to those predicted for the graded porosity. It is found that the maximum von Mises stress in the electrolyte layer are 352 MPa, 348 MPa, 344 MPa, and 341 MPa, respectively, for case 5, case 6, case 7, and case 8, in which the greatest reduction in the maximum thermal stress is observed for case 8, i.e., reduced by 18 MPa compared to that obtained in case 0, which is about a 5.0% reduction.
The SOEC with the graded pore diameter of case 8 in the fuel electrode demonstrates a 15.6% increase in the hydrogen molar fraction compared to that achieved in case 0 employing the conventional SOEC fuel electrode, while the maximum thermal stress is about a 5.0% reduction, as discussed above. Consequently, the graded pore size range to decrease the pore size near the TPB region can enhance SOEC performance and reduce its thermal stress.

3.4. Effect of Graded Ni Composition

Macroscale modeling often assumes the fuel electrode employing homogeneous materials distribution, i.e., with all involved material components uniformly distributed across the entire electrode. However, this assumption fails to account for the impact of varied electrode material composition on the cell performance. To address this, simulations are made for the electrodes with graded material composition, aiming to evaluate and compare its effects on the overall cell electrochemical and mechanical performance. From case 9 to case 12, the Ni content gradually decreases from the channel side to the electrolyte layer side along the thickness direction. The investigated parameters are summarized in Table 7.
The predicted results for cases 9 to 12 are shown and analyzed in Figure 13a to demonstrate the impact of the graded material composition on the SOEC performance. As the gradient of the Ni composition decreases (i.e., the Ni is reduced along the thickness direction towards the TPB region), both the maximum temperature and the temperature difference of the cell gradually rise. The location of the maximum temperature is similar to that of the two graded electrodes discussed earlier, while the temperature variation pattern differs. For instance, in case 12, the maximum temperature is found to be around 857 °C in the fuel inlet region, while the minimum temperature is 837 °C in the fuel outlet region. The different gradient in Ni content may affect the thermal conductivity of the electrode material, thereby influencing the temperature distribution. The graded composition may also alter the intensity of the electrochemical reaction, thereby affecting heat generation and temperature distribution.
Meanwhile, as the electrolysis efficiency increases, the hydrogen molar fraction is also increased as the Ni composition gradient expands. It is revealed that the maximum hydrogen molar fraction at the fuel outlet reaches 0.485, 0.493, 0.511, and 0.522 for cases 9, 10, 11, and 12, respectively. Case 12, with the largest reduction in the graded Ni composition along the electrode thickness direction towards to the TPB region, exhibits the most significant increase in the hydrogen molar fraction, enhanced by 10.2% compared to that achieved in case 0 with the homogenous distribution of the electrode materials. This phenomenon can be attributed to the increased catalytic activity within the TPBs and ion transfer conductivity of the electrode with the graded of Ni content (more YSZ particles appear in the TPB region).
The predicted maximum thermal stress in the various cases is shown in Figure 13b for cases 9 to 12 under different graded Ni composition configurations. Specifically, the maximum von Mises stress in the electrolyte is 340 MPa, 347 MPa, 364 MPa, and 376 MPa for cases 9, 10, 11, and 12, respectively. The maximum thermal stress increases with the increased maximum temperature, indicating that the graded Ni composition has a dual effect on the SOEC performance, as it increases the hydrogen molar fraction while also elevating the maximum thermal stress.
In case 12, the maximum thermal stress is enhanced by 17 MPa compared to that in case 0, which corresponds to a 4.7% increase, attributed to the Ni reduction along the thickness direction towards the TPB region. This is primarily due to the reduced Ni with increased YSZ compositions, which reduces the thermal conductivity and leads to increased heat accumulation in the TPB region. Simultaneously, more intense electrochemical reactions generate additional heat, thereby increasing both the temperature and thermal stress in that region.
In summary, the SOEC fuel electrode with the mostly graded Ni composition along the thickness direction (i.e., in case 12) demonstrates a 10.2% increase in the hydrogen production compared to that obtained in the fuel electrode with the conventional material composition (i.e., Ni/YSZ evenly distributed) in an SOEC. However, the maximum thermal stress is also enhanced by 4.7% (i.e., 17 MPa), which is undesirable.

3.5. Limitations and Prospects

The results of this study provide specific guidance for the design of fuel electrodes with graded structures. By strategically varying the porosity, pore size, and Ni composition of the fuel electrodes, the electrochemical and thermomechanical properties of SOECs can be tailored to meet specific industrial needs. Optimization of the fuel electrodes can lead to a more efficient SOEC system, thereby reducing the capital and operating costs, which makes SOEC hydrogen production more economically viable for industrial applications. Despite the various investigations into the graded fuel electrodes for SOEC applications, this study has some limitations. For instance, the current study is conducted at the single-cell level and mainly focuses on the operating conditions of steady-state operation. To overcome these limitations, future research will scale up to the stack level and evaluate the impacts of thermal cycling and mechanical conditions.

4. Conclusions

In this study, the electrochemical performance and thermal stress of the graded fuel electrode were investigated for SOECs using the electrochemical reactions coupled with an thermal mechanical CFD model. The predicted results indicate that significant improvement in the hydrogen production and reduction in the thermal stress may be achieved by strategically altering the porosity, pore size, and Ni composition of the fuel electrode. The principal research findings are the following:
(1)
The graded porosity can effectively improve heat distribution and local overheating, enhance reaction rates, and alleviate thermal stress concentration. The hydrogen molar fraction of an SOEC using a graded porosity of 0.3–0.5 is enhanced by 13%, and the maximum thermal stress is decreased by 4.7%.
(2)
The graded pore size may significantly improve gas diffusion and electrochemical reaction kinetics, thereby enhancing the overall performance of the SOEC. The hydrogen molar fraction of an SOEC with a graded pore size of 1–10 μm is enhanced by 15.6%, while the maximum thermal stress is decreased by about 5.0%.
(3)
The graded Ni composition in the fuel electrode is able to increase the catalytic activity and electronic/ion conductivity in the TPB region, thereby improving the electrochemical reaction rate and hydrogen production. The graded Ni component fuel electrode improves hydrogen production performance, but the maximum thermal stress increases as well.

Author Contributions

Conceptualization, F.L., R.Z. and J.Y.; methodology, F.L., R.Z., Q.L. and J.Y.; validation, F.L. and R.Z.; data curation, F.L., R.Z., Q.L. and L.X.; writing—original draft preparation, F.L.; funding acquisition, J.Y. All authors have read and agreed to the published version of the manuscript.

Funding

This work was funded by the National Key R&D Program of China (2024YFE0107400); the National Natural Science Foundation of China (52471380); the Graduate Student Scientific Research and Innovation Project of Ningbo University (IF2024040).

Data Availability Statement

Data are contained within the article.

Conflicts of Interest

The authors declare no conflicts of interest.

References

  1. Dawood, F.; Anda, M.; Shafiullah, G.M. Hydrogen production for energy: An overview. Int. J. Hydrogen Energy 2020, 45, 3847–3869. [Google Scholar] [CrossRef]
  2. Liu, W.; Wan, Y.; Xiong, Y.; Gao, P. Green hydrogen standard in China: Standard and evaluation of low-carbon hydrogen, clean hydrogen, and renewable hydrogen. Int. J. Hydrogen Energy 2022, 47, 24584–24591. [Google Scholar] [CrossRef]
  3. Xu, Y.; Cai, S.; Chi, B.; Tu, Z. Technological limitations and recent developments in a solid oxide electrolyzer cell: A review. Int. J. Hydrogen Energy 2024, 50, 548–591. [Google Scholar] [CrossRef]
  4. Cai, W.; Xiao, L.; Deng, T.; Hang, Q.; Pan, B.; Yuan, J.; Xie, C. Analysis of residual stress for thin-layered electrolyte co-sintered with porous electrodes applied in solid oxide cells. Thin-Walled Struct. 2025, 211, 113140. [Google Scholar] [CrossRef]
  5. Lim, K.; Kim, Y.; Salihi, H.; Ju, H. Integrated modeling of electrochemical, thermal, and structural behavior in solid oxide electrolysis cells. Int. J. Heat Mass Transf. 2024, 224, 125235. [Google Scholar] [CrossRef]
  6. Fang, X.; Lin, Z. Numerical study on the mechanical stress and mechanical failure of planar solid oxide fuel cell. Appl. Energy 2018, 229, 63–68. [Google Scholar] [CrossRef]
  7. Cai, W.; Zhou, R.; Yuan, J.; Tu, Y.; Zhang, Z. The electrochemical performance and thermal behavior analysis of SOFC containing thin gadolinium-doped ceria diffusion barrier layer. Int. Commun. Heat Mass Transf. 2024, 155, 107577. [Google Scholar] [CrossRef]
  8. Ilyushin, Y.V.; Boronko, E.A. Analysis of Energy Sustainability and Problems of Technological Process of Primary Aluminum Production. Energies 2025, 18, 2194. [Google Scholar] [CrossRef]
  9. Spreafico, C. Additive manufacturing of solid oxide fuel cells. A comprehensive review of patent literature. J. Power Sources 2025, 625, 235702. [Google Scholar] [CrossRef]
  10. Miyake, M.; Iwami, M.; Takeuchi, M.; Nishimoto, S.; Kameshima, Y. Electrochemical performance of Ni0.8Cu0.2/Ce0.8Gd0.2O1.9 cermet anodes with functionally graded structures for intermediate-temperature solid oxide fuel cell fueled with syngas. J. Power Sources 2018, 390, 181–185. [Google Scholar] [CrossRef]
  11. Wang, C. A Computational Analysis of Functionally Graded Anode in Solid Oxide Fuel Cell by Involving the Correlations of Microstructural Parameters. Energies 2016, 9, 408. [Google Scholar] [CrossRef]
  12. Kim, J.W.; Bae, K.; Kim, H.J.; Son, J.; Kim, N.; Stenfelt, S.; Prinz, F.B.; Shim, J.H. Three-dimensional thermal stress analysis of the re-oxidized Ni-YSZ anode functional layer in solid oxide fuel cells. J. Alloys Compd. 2018, 752, 148–154. [Google Scholar] [CrossRef]
  13. Wang, Z.; Zhang, N.; Qiao, J.; Sun, K.; Xu, P. Improved SOFC performance with continuously graded anode functional layer. Electrochem. Commun. 2009, 11, 1120–1123. [Google Scholar] [CrossRef]
  14. McCoppin, J.; Barney, I.; Mukhopadhyay, S.; Miller, R.; Reitz, T.; Young, D. Compositional control of continuously graded anode functional layer. J. Power Sources 2012, 215, 160–163. [Google Scholar] [CrossRef]
  15. He, S.; Dai, H.; Cai, G.; Chen, H.; Guo, L. Optimization of La0.75Sr0.25Cr0.5Mn0.5O3-δ-Ce0.8Sm0.2O1.9 compositionally graded anode functional layer. Electrochim. Acta 2015, 152, 155–160. [Google Scholar] [CrossRef]
  16. Marcano, D.; Mauer, G.; Vaßen, R.; Weber, A. Manufacturing of high performance solid oxide fuel cells (SOFCs) with atmospheric plasma spraying (APS) and plasma spray-physical vapor deposition (PS-PVD). Serf. Coat. Technol. 2017, 318, 170–177. [Google Scholar] [CrossRef]
  17. Sai Charan, M.; Naik, A.K.; Kota, N.; Laha, T.; Roy, S. Review on developments of bulk functionally graded composite materials. Int. Mater. Rev. 2022, 67, 797–863. [Google Scholar] [CrossRef]
  18. Cai, W.; Zhou, R.; Wang, C.; Xie, C.; Xiao, L.; Zhang, Z.; Yang, C.; Yuan, J. On characteristics and research development of coupled fuel cell stack performance and stress. Appl. Energy 2025, 388, 125719. [Google Scholar] [CrossRef]
  19. Abdullah, T.; Liu, L. Simulation-based microstructural optimization of solid oxide fuel cell for low temperature operation. Int. J. Hydrogen Energy 2016, 41, 13632–13643. [Google Scholar] [CrossRef]
  20. Li, J.; Lin, Z. Effects of electrode composition on the electrochemical performance and mechanical property of micro-tubular solid oxide fuel cell. Int. J. Hydrogen Energy 2012, 37, 12925–12940. [Google Scholar] [CrossRef]
  21. Bain, A.T.; Roberts, R.; Deiner, J.; Fellner, J. Computational Optimization of Functionally Graded Electrodes for Solid Oxide Fuel Cells. ECS Meet. Abstr. 2022, MA2022-02, 1794. [Google Scholar] [CrossRef]
  22. Xu, M.; Li, T.S.; Yang, M.; Andersson, M.; Fransson, I.; Larsson, T.; Sundén, B. Modeling of an anode supported solid oxide fuel cell focusing on thermal stresses. Int. J. Hydrogen Energy 2016, 41, 14927–14940. [Google Scholar] [CrossRef]
  23. Kamkeng, A.D.N.; Wang, M. Long-term performance prediction of solid oxide electrolysis cell (SOEC) for CO2/H2O co-electrolysis considering structural degradation through modelling and simulation. Chem. Eng. J. 2022, 429, 132158. [Google Scholar] [CrossRef]
  24. Liu, C.; Dang, Z.; Xi, G. Numerical study on thermal stress of solid oxide electrolyzer cell with various flow configurations. Appl. Energy 2024, 353, 122041. [Google Scholar] [CrossRef]
  25. Ni, M.; Leung, M.K.H.; Leung, D.Y.C. Micro-scale modelling of solid oxide fuel cells with micro-structurally graded electrodes. J. Power Sources 2007, 168, 369–378. [Google Scholar] [CrossRef]
  26. Yan, Z.; He, A.; Hara, S.; Shikazono, N. Design and optimization of functionally graded electrodes for solid oxide fuel cells (SOFCs) by mesoscale modeling. Int. J. Hydrogen Energy 2022, 47, 16610–16625. [Google Scholar] [CrossRef]
  27. Mukhopadhyay, M.; Maji, P.S.; Saravanan, R.; Mukhopadhyay, J. Designing tortuous gas diffusion path for hydrogen oxidation reaction and stability of solid oxide fuel cell: An engineered microstructural aspect in anode functional layer. Int. J. Hydrogen Energy 2024, 87, 1140–1154. [Google Scholar] [CrossRef]
  28. Sun, M.; Li, A.; Zhang, X.; Fei, Y.; Zhu, L.; Huang, Z. Influence of operating conditions on the fuel electrode degradation of solid oxide electrolysis cell investigated by phase field model with wettability analysis. J. Power Sources 2023, 587, 233700. [Google Scholar] [CrossRef]
  29. Damm, D.L.; Fedorov, A.G. Local thermal non-equilibrium effects in porous electrodes of the hydrogen-fueled SOFC. J. Power Sources 2006, 159, 1153–1157. [Google Scholar] [CrossRef]
  30. Gari, A.A.; Ahmed, K.I.; Ahmed, M.H. Performance and thermal stress of tubular functionally graded solid oxide fuel cells. Energy Rep. 2021, 7, 6413–6421. [Google Scholar] [CrossRef]
  31. Lee, S.; Park, I.; Lee, H.; Shin, D. Continuously gradient anode functional layer for BCZY based proton-conducting fuel cells. Int. J. Hydrogen Energy 2014, 39, 14342–14348. [Google Scholar] [CrossRef]
  32. Greene, E.S.; Chiu, W.K.S.; Medeiros, M.G. Mass transfer in graded microstructure solid oxide fuel cell electrodes. J. Power Sources 2006, 161, 225–231. [Google Scholar] [CrossRef]
  33. Luo, Y.; Jiang, W.; Zhang, Q.; Zhang, W.Y.; Hao, M. Effects of anode porosity on thermal stress and failure probability of planar solid oxide fuel cell with bonded compliant seal. Int. J. Hydrogen Energy 2016, 41, 7464–7474. [Google Scholar] [CrossRef]
  34. Saied, M.; Ahmed, K.; Ahmed, M.; Nemat-Alla, M.; El-Sebaie, M. Investigations of solid oxide fuel cells with functionally graded electrodes for high performance and safe thermal stress. Int. J. Hydrogen Energy 2017, 42, 15887–15902. [Google Scholar] [CrossRef]
  35. Zeng, S.; Xu, M.; Parbey, J.; Yu, G.; Andersson, M.; Li, Q.; Li, B.; Li, T. Thermal stress analysis of a planar anode-supported solid oxide fuel cell: Effects of anode porosity. Int. J. Hydrogen Energy 2017, 42, 20239–20248. [Google Scholar] [CrossRef]
  36. Gao, M.; Wang, K.; Song, D.; Wang, M.; Li, H.; Tu, S. Stress relief in solid oxide fuel cells by leveraging on the gradient porosity design in anode layers. Int. J. Heat Mass Transf. 2024, 232, 125900. [Google Scholar] [CrossRef]
  37. Osman, S.; Ahmed, K.; Nemattalla, M.; Ookawara, S.; Ahmed, M. Performance and thermal stresses in functionally graded anode-supported honeycomb solid-oxide fuel cells. Int. J. Hydrogen Energy 2021, 46, 33010–33027. [Google Scholar] [CrossRef]
  38. Ma, S.; Xue, D.; Li, Q.; Zheng, J.; Feng, C.; Li, G. Stress Analysis of Solid Oxide Fuel Cell Electrodes Using Functional Gradient Materials. J. Electrochem. Soc. 2023, 170, 034502. [Google Scholar] [CrossRef]
  39. Liu, Y.; Xiao, L.; Wang, H.; Ou, D.; Yuan, J. Numerical Study of H2 Production and Thermal Stress for Solid Oxide Electrolysis Cells with Various Ribs/Channels. Energies 2024, 17, 510. [Google Scholar] [CrossRef]
  40. Qu, Z.; Aravind, P.V.; Boksteen, S.Z.; Dekker, N.J.J.; Janssen, A.H.H.; Woudstra, N.; Verkooijen, A.H.M. Three-dimensional computational fluid dynamics modeling of anode-supported planar SOFC. Int. J. Hydrogen Energy 2011, 36, 10209–10220. [Google Scholar] [CrossRef]
  41. Lee, S.; Kim, H.; Yoon, K.J.; Son, J.; Lee, J.; Kim, B.; Choi, W.; Hong, J. The effect of fuel utilization on heat and mass transfer within solid oxide fuel cells examined by three-dimensional numerical simulations. Int. J. Heat Mass Transf. 2016, 97, 77–93. [Google Scholar] [CrossRef]
  42. Costamagna, P.; Honegger, K. Modeling of Solid Oxide Heat Exchanger Integrated Stacks and Simulation at High Fuel Utilization. J. Electrochem. Soc. 1998, 145, 3995. [Google Scholar] [CrossRef]
  43. Chen, B.; Xu, H.; Ni, M. Modelling of SOEC-FT reactor: Pressure effects on methanation process. Appl. Energy 2017, 185, 814–824. [Google Scholar] [CrossRef]
  44. Rehman, M.; Hafeez, M.B.; Krawczuk, M. A Comprehensive Review: Applications of the Kozeny–Carman Model in Engineering with Permeability Dynamics. Arch. Comput. Methods Eng. 2024, 31, 3843–3855. [Google Scholar] [CrossRef]
  45. Zhang, J.; Lei, L.; Liu, D.; Zhao, F.; Chen, F.; Wang, H. Numerical investigation of solid oxide electrolysis cells for hydrogen production applied with different continuity expressions. Energy Convers. Manag. 2017, 149, 646–659. [Google Scholar] [CrossRef]
  46. Szmyt, W.; Guerra-Nuñez, C.; Dransfeld, C.; Utke, I. Solving the inverse Knudsen problem: Gas diffusion in random fibrous media. J. Membr. Sci. 2021, 620, 118728. [Google Scholar] [CrossRef]
  47. Khirevich, S.; Höltzel, A.; Daneyko, A.; Seidel-Morgenstern, A.; Tallarek, U. Structure–transport correlation for the diffusive tortuosity of bulk, monodisperse, random sphere packings. J. Chromatogr. A 2011, 1218, 6489–6497. [Google Scholar] [CrossRef]
  48. Xu, Z.; Zhang, X.; Li, G.; Xiao, G.; Wang, J. Comparative performance investigation of different gas flow configurations for a planar solid oxide electrolyzer cell. Int. J. Hydrogen Energy 2017, 42, 10785–10801. [Google Scholar] [CrossRef]
  49. Zhang, B.; Harun, N.F.; Zhou, N.; Oryshchyn, D.; Colon-Rodriguez, J.J.; Shadle, L.; Bayham, S.; Tucker, D. A real-time distributed solid oxide electrolysis cell (SOEC) model for cyber-physical simulation. Appl. Energy 2025, 388, 125607. [Google Scholar] [CrossRef]
  50. Hsieh, C.; Tuan, W. Elastic and thermal expansion behavior of two-phase composites. Mater. Sci. Eng. A 2006, 425, 349–360. [Google Scholar] [CrossRef]
  51. Chi, H.; Xiao, L.; Deng, T.; Pan, B.; Yuan, J. Modeling and characterization of sintered YSZ/NiO porous electrode structural properties using coarse-graining molecular dynamics method. Ceram. Int. 2024, 50, 26205–26219. [Google Scholar] [CrossRef]
  52. Choi, S.; Cheung, C.; Graeve, O.A. Fabrication of continuous linear pores in an SOFC anode using unidirectional carbon fibers as sacrificial templates. J. Am. Ceram. Soc. 2021, 104, 3030–3041. [Google Scholar] [CrossRef]
  53. Hedayat, N.; Du, Y.; Ilkhani, H. Pyrolyzable pore-formers for the porous-electrode formation in solid oxide fuel cells: A review. Ceram. Int. 2018, 44, 4561–4576. [Google Scholar] [CrossRef]
Figure 1. Schematic of dense electrolyte sandwiched by graded porous electrodes.
Energies 18 02790 g001
Figure 2. Schematic of a cross-flow unit cell.
Energies 18 02790 g002
Figure 3. Graded parameters and schematic of electrode for (a) graded porosity, (b) graded pore size, (c) graded Ni composition.
Energies 18 02790 g003
Figure 4. Various physical parameters and performance affected by graded parameters.
Energies 18 02790 g004
Figure 5. (a) Modeled geometry; (b) grid independence testing performance; (c) predicted I–V curves compared with the experimental data.
Energies 18 02790 g005
Figure 6. Predicted (ac) hydrogen molar fraction, (df) temperature, and (gi) thermal stress distribution under different operating voltages of 1.2 V (a,d,g), 1.3 V (b,e,h), and 1.4 V (c,f,i).
Energies 18 02790 g006
Figure 7. Predicted distribution for temperature and hydrogen molar fraction affected by graded porosity in an SOEC fuel electrode operated at 1.4 V.
Energies 18 02790 g007
Figure 8. Predicted temperature distribution at (a) 1.2 V, (b) 1.4 V, and (c) hydrogen molar fraction, and (d) the maximum stress in the PEN region affected by graded porosity in an SOEC fuel electrode.
Energies 18 02790 g008
Figure 9. Predicted distribution for the maximum stress in the PEN region affected by graded porosity in an SOEC fuel electrode operated at 1.4 V.
Energies 18 02790 g009
Figure 10. Predicted temperature distribution (a,c) and hydrogen distribution (b,d) in the electrolyte region for (a,b) case 0 and (c,d) case 4 at 1.4 V.
Energies 18 02790 g010
Figure 11. Predicted maximum stress (a) in the electrolyte layer for case 0 and case 4; (b) enlarged view for case 4 at 1.4 V.
Energies 18 02790 g011
Figure 12. Predicted distribution for (a) hydrogen molar fraction, (b) temperature, and (c) the maximum thermal stress in the PEN region affected by graded pore size in an SOEC fuel electrode operated at 1.4 V.
Energies 18 02790 g012
Figure 13. Predicted distribution for (a) temperature and hydrogen molar fraction, and (b) the maximum stress in the PEN region affected by graded Ni composition in an SOEC fuel electrode operated at 1.4 V.
Energies 18 02790 g013
Table 1. Geometric parameters of SOEC unit in the base-case [39].
ParameterValueUnit
Cell width91mm
Cell length91mm
Channel height1.0mm
Channel width1.75mm
Rib width1.75mm
Number of channels26-
Fuel electrode thickness410μm
Electrolyte thickness10μm
Air electrode thickness25μm
Table 2. Physical parameters of materials for base-case conditions [39,40].
ParameterFuel ElectrodeElectrolyteAir ElectrodeInterconnector
MaterialNi-YSZYSZLSMStainless steel
Density (kg/m3)7740600053007700
Specific heat capacity
(J/(kg · K))
595400607600
Thermal conductivity
(W/(m · K))
6.232.71044.5
Electronic/ionic conductivity
(1/(Ω · m))
9.7 × 10 4 T exp 2100 T 3.34 × 10 4 exp 2100 T 9.7 × 10 4 T exp 2100 T 769,000
CTE (1/K)12.210.311.715.5
Young’s modulus (GPa)5718535214
Poisson’s ratio0.280.320.250.3
Table 3. Electrochemical parameters used in this study [42].
γ/A·m−2Eact/J·mol−1
Fuel electrode1.34 × 10101 × 105
Air electrode2.05 × 1081.2 × 105
Table 4. The boundary conditions of the SOEC model [39].
BoundaryMomentumThermalSpeciesElectric
Potential
Top IC wall-symmetry-Φtop = Vcell
Bottom IC wall-symmetry-Φbottom = 0
Air inlet0.33 L/min800 °C21% O2, 79% N2-
Air outletpressureconvectionconvection-
Fuel inlet0.217 L/min800 °C90% H2O, 10% H2-
Fuel outletpressureconvectionconvection-
Side walls-insulation--
Table 5. Parameters outlined for the graded porosity cases to be investigated.
CaseXnX0m
Case 0no graded porosity (−)0.4000
Case 1graded porosity (−)0.3750.425
Case 2graded porosity (−)0.3500.450
Case 3graded porosity (−)0.3250.475
Case 4graded porosity (−)0.3000.500
Table 6. Parameters outlined for the graded pore size cases to be investigated.
CaseXnX0m
Case 0no graded pore size (μm)4.000
Case 5graded pore size (μm)3.006.00
Case 6graded pore size (μm)2.507.50
Case 7graded pore size (μm)2.008.00
Case 8graded pore size (μm)1.0010.0
Table 7. Parameters of the graded Ni composition cases to be investigated.
CaseXnX0m
Case 0no graded Ni composition (−)0.5000
Case 9graded Ni composition (−)0.4750.525
Case 10graded Ni composition (−)0.4500.550
Case 11graded Ni composition (−)0.4250.575
Case 12graded Ni composition (−)0.4000.600
Disclaimer/Publisher’s Note: The statements, opinions and data contained in all publications are solely those of the individual author(s) and contributor(s) and not of MDPI and/or the editor(s). MDPI and/or the editor(s) disclaim responsibility for any injury to people or property resulting from any ideas, methods, instructions or products referred to in the content.

