Article

Numerical Simulation of Gas–Liquid Flow Field in PEM Water Electrolyzer

by
Yusheng Zhang
1,
Xiaoying Yuan
1,
Sheng Yao
1,
Hairui Yang
2 and
Cuiping Wang
1,*
1
Shandong Key Laboratory of Integrated Multi-Energy Systems for High Efficiency and Intelligent Operation, Shandong University of Science and Technology, Qingdao 266590, China
2
Department of Energy and Power Engineering, Tsinghua University, Beijing 100084, China
*
Author to whom correspondence should be addressed.
Energies 2025, 18(11), 2773; https://doi.org/10.3390/en18112773
Submission received: 30 April 2025 / Revised: 15 May 2025 / Accepted: 23 May 2025 / Published: 26 May 2025
(This article belongs to the Special Issue Catalytic Hydrogen Production and Hydrogen Energy Utilization)

Abstract

:
Hydrogen is an excellent clean energy, and hydrogen production by electrolyzing water has become the preferred method. Due to its high electrolysis efficiency and great potential for energy conversion and storage, water electrolysis in a proton exchange membrane (PEM) electrolyzer has attracted considerable attention. In order to explore the factors affecting the internal resistance of PEM water electrolyzers and optimize them, a three-dimensional steady-state model of PEM water electrolyzers coupled with a porous media physical field was established. First, the flow fields in multi-channel and single-channel electrolyzers were designed and comparably simulated. It was found that both flow field configuration and flow modes affected the mass transfer and current distribution. The multi-channel parallel flow field had the lowest flow pressure drop and uniform flow field, which is beneficial to efficient catalytic electrolysis. Secondly, the simulation results of mass transfer in the PEM cell were highly consistent with the reference experimental data, and the increased reference exchange current density (i0) can improve the oxygen/hydrogen production performance of the cell. These findings are helpful in optimizing the design of the PEM water electrolyzer.

Graphical Abstract

1. Introduction

As a renewable, eco-friendly secondary energy carrier, hydrogen is essential for driving the global energy transformation and achieving carbon neutrality. The proton exchange membrane (PEM) technique for water electrolysis hydrogen production has drawn extensive attention. This is attributed to its lower internal resistance and high-efficiency electrolysis performance [1,2,3,4]. A combination of operational parameters, such as temperature, pressure, and reactant flow, along with internal structural parameters like porosity and conductivity, consistently impacts the performance of PEM water electrolyzers [5,6,7]. Moreover, the configuration of the flow field and the choice of catalyst layer materials exert profound influences on performance. To enhance the efficiency and cost-effectiveness of water electrolysis for hydrogen generation, researchers have implemented diverse modifications to the electrolyzer, such as optimizing the water supply on the cathode side, adopting an open structure design [8], improving the membrane electrode assembly [9], and adjusting the flow field design [10]. The structural design of the flow field is especially important, including the cross-section shape, channel spacing, width, and height; all these factors will affect the distribution of electrolysis products and heat. The results show that ohmic overpotential is directly affected by the flow field structure on the cathode side, and the mass transfer and two-phase flow features are influenced by the structure on the anode side [11]. On the oxygen side of the anode, the accumulation of oxygen in the diffusion layer and catalytic layer hinders the penetration of water, thus affecting the velocity distribution in the flow field [12].
In order to optimize the hydrogen production performance of the PEM water electrolyzer, numerical simulation has become a common research method. Choi et al. [13] successfully constructed a one-dimensional steady-state model for PEM water electrolyzers to indicate that the reduction kinetics at the cathode exhibits a faster reaction rate, and the anode overpotential is the main factor leading to the voltage drop. Onda et al. [14] simulated individual cells using a two-dimensional model and predicted stack performance. In addition, combined experimental data and the specific effects of temperature and pressure on battery performance were analyzed. It was found that the temperature and current density (i) of the battery increased slightly along the flow direction under pressurized conditions compared with atmospheric conditions. Gorgun et al. [15] developed a dynamic model for electrolytic cells under one-dimensional adiabatic conditions, leveraging molar conservation and the ideal gas equation to ascertain the partial pressures at the anode and cathode. This facilitated discussions on electroosmotic resistance and water diffusion within the membrane electrode. There has been recent research that delves into the complex aspects of 3D-related phenomena [16,17]. Marangio et al. [18] constructed a one-dimensional nonadiabatic steady-state model, delving into polarization curves, activation, concentration, and ohmic overpotentials of both electrodes. Their work underscored the profound influence of pressure conditions on exchange current density. Jianhu Nie et al. [19] advanced a three-dimensional dynamic model of PEM water electrolyzers to simulate flow fields, accurately computing hydrogen/oxygen generation rates and distributions at specified flow velocities. Zhuqian Zhang et al. [20] introduced a three-dimensional steady-state model that coupled heat and mass transfer with current distribution, assessing the impacts of co-flow versus counter-flow configurations and varying flow field widths on cell performance. Hong Liu et al. [21] calculated the bulk flow and the average concentration of gas components in the electrode layer by performing one-dimensional mass transfer analysis along the normal direction of the membrane electrode layer. With less computational effort, a large number of different gas channel sizes and operating conditions were analyzed, and then the optimization of channel and rib size was completed. Shuzhe Li et al. [22] studied the dynamic changes of flowing liquid columns and stationary liquid droplets in triangular microchannels. They found that the triangular microchannel contributed stronger viscosity and less increase in liquid column velocity than the rectangular microchannel with the same hydraulic diameter.
Although the existing studies cover multi-dimensional and multi-physical fields, there are fewer 3D modeling studies, in which only a single or localized physical field (e.g., flow field, temperature field) is focused on, and they lack in-depth coupling analysis of multiple physical fields, such as electrochemical reaction, mass transfer, heat transfer, fluid flow, etc., which are involved in the hydrogen precipitation reaction. In this paper, five water flow field models in the electrolyzer are designed, and the hydrodynamic processes occurring in the fluid transport system are first numerically simulated by CFD [23] to choose one model of low flow resistance. Then, the three-dimensional steady-state model of the proton exchange membrane water electrolyzer is established in COMSOL 6.1 to couple the proton exchange membrane electrolyzer with the free and porous medium flow. The interaction mechanism of the hydrogen precipitation reaction is systematically studied. Combined with experimental verification, a new optimization strategy for the flow channel structure is proposed, and the influence of physical parameters on the performance of the electrolyzer is simulated and analyzed, which provides a more accurate theoretical basis and a technical way to improve the performance of the PEM water electrolyzer.

2. Modeling

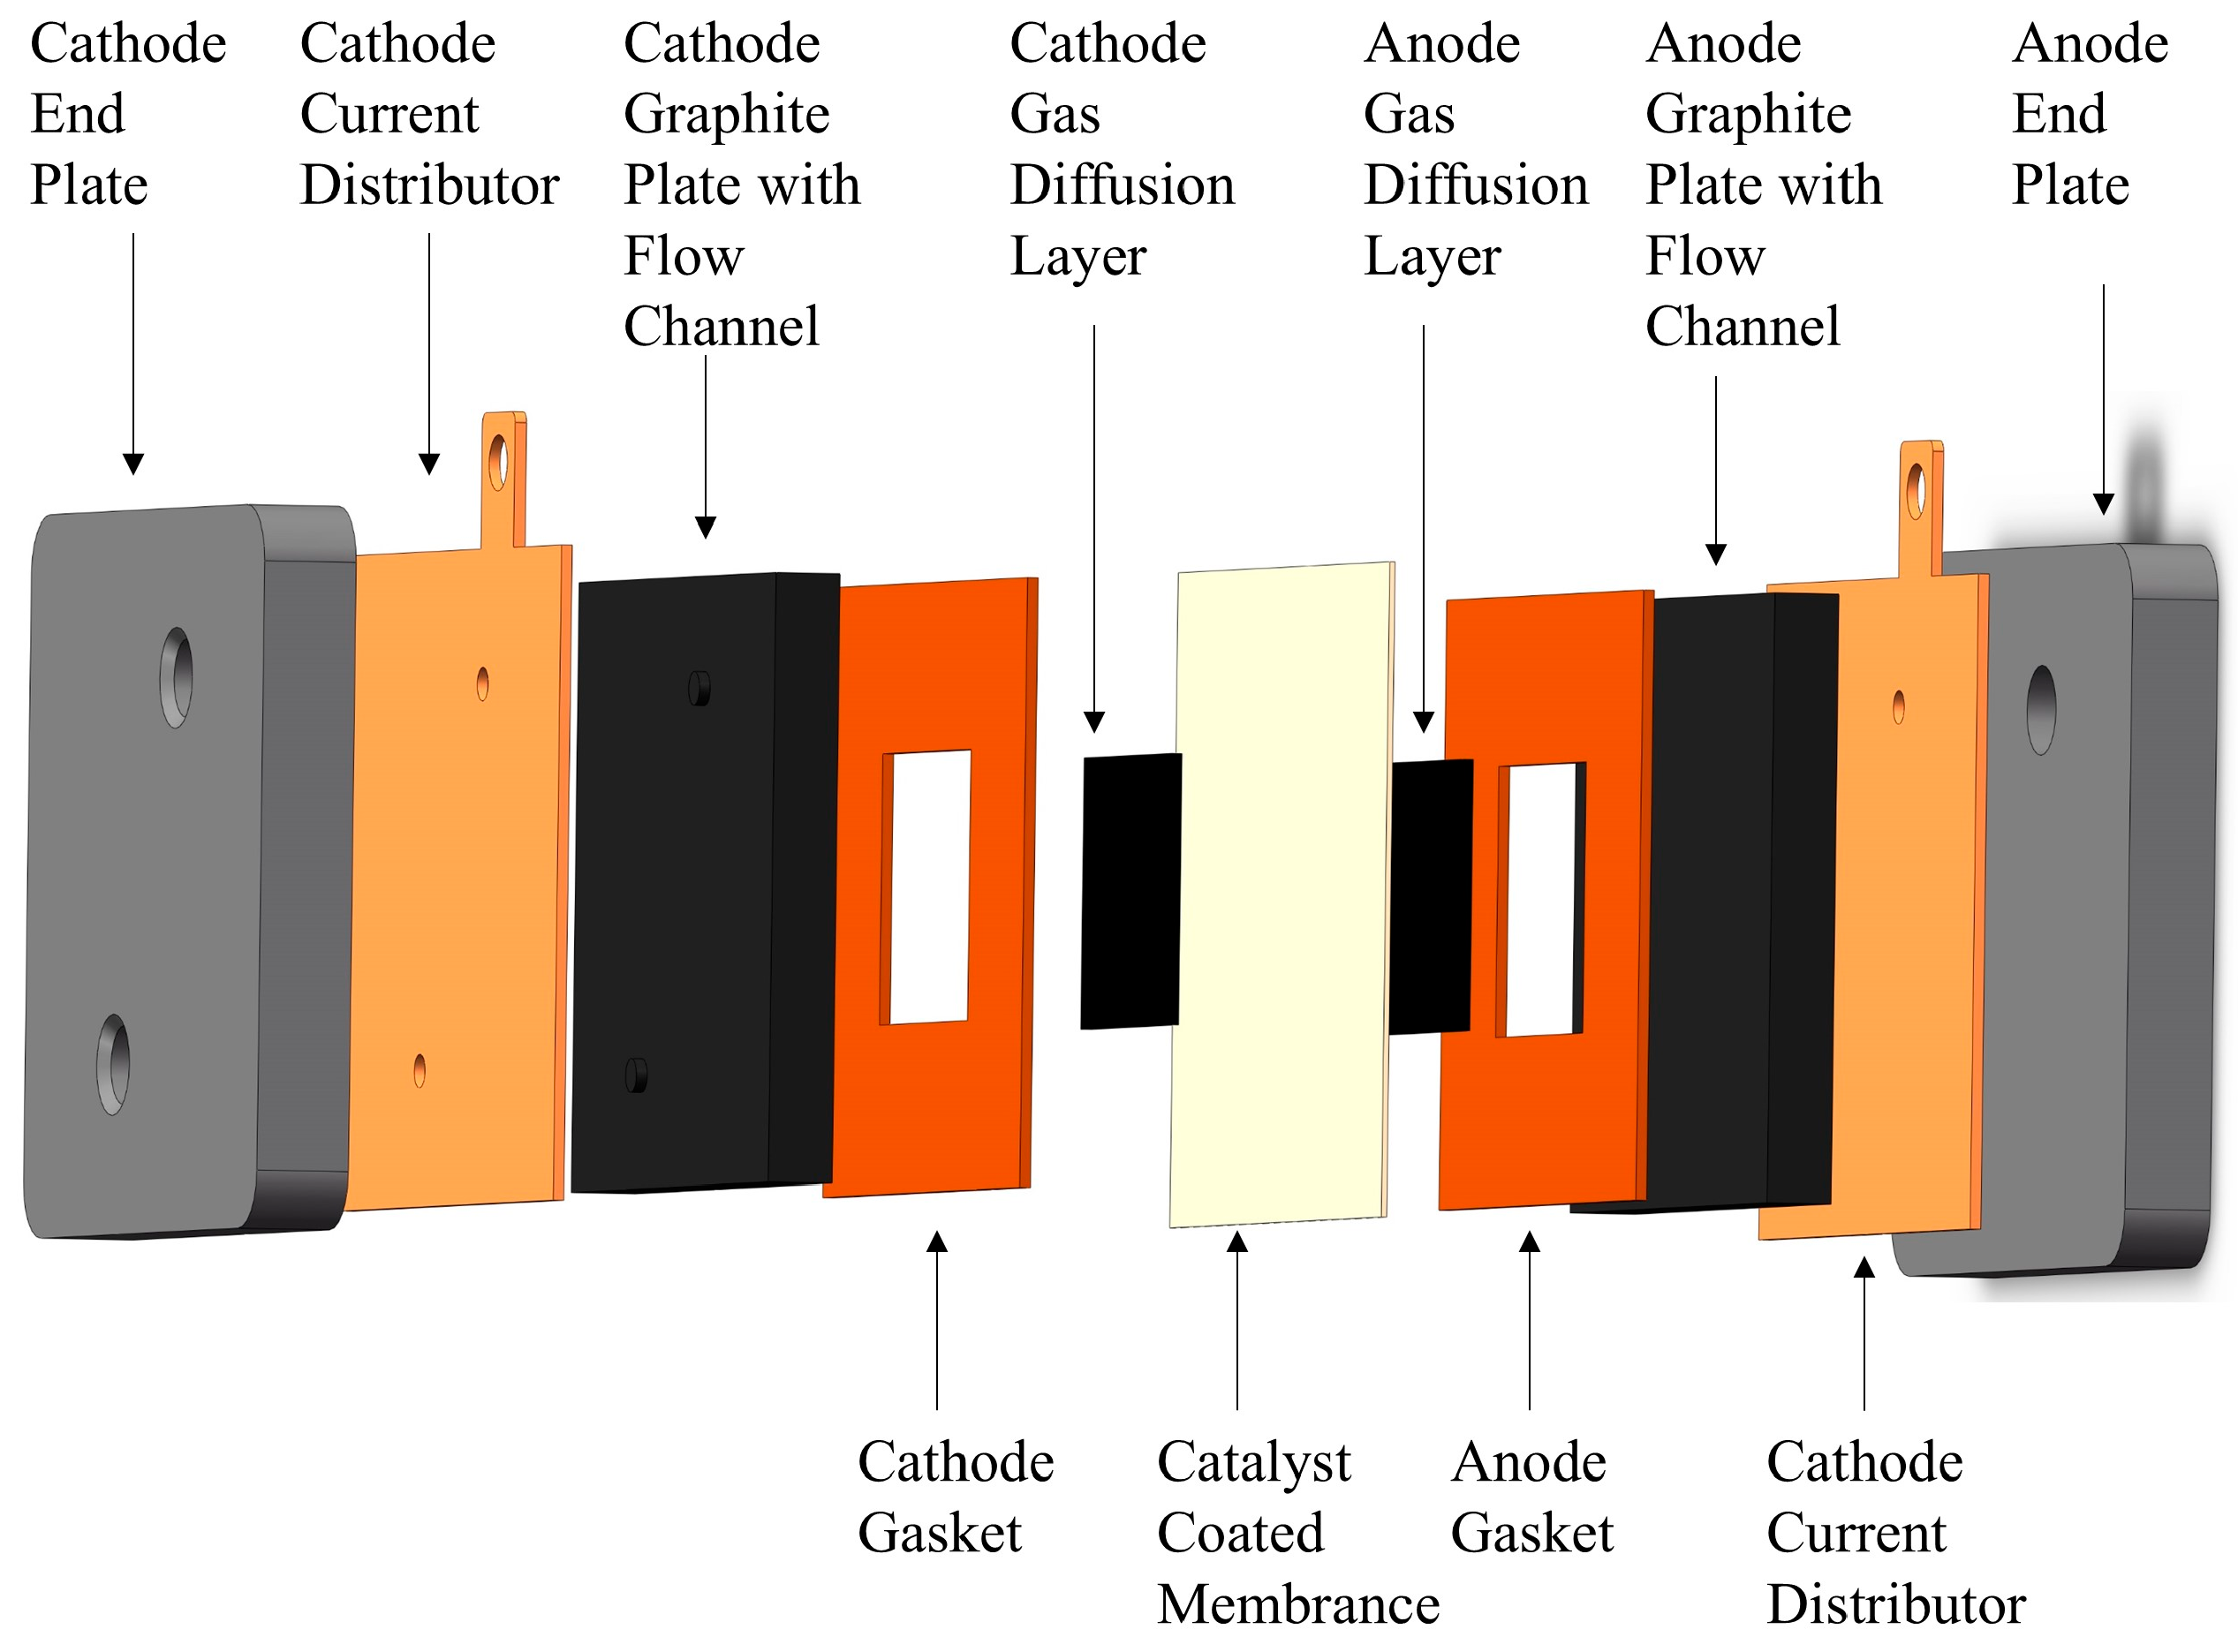
2.1. Electrolytic System

The hydrogen production system of electrolytic water is mainly composed of an electrolyzer, a filter, a water pump, a water tank, a water–gas separator, and a power supply, as seen in Figure 1.
The mechanism of hydrogen production by water electrolysis is shown in Figure 1. The heart of the electrolyzer is the proton exchange membrane (PEM) integrated into the membrane electrode assembly (MEA). Located between the anode and cathode catalytic layers, the PEM performs several critical functions: it enables proton transport, prevents electron leakage, and acts as a gas barrier. This multifunctionality not only facilitates efficient proton conduction but also isolates reactants and products on either side, maintaining product purity. The interfacial pores between the catalyst, membrane, and diffusion layers are the active reaction zones where water molecules undergo electrolysis to produce hydrogen and oxygen. The internal architecture of the PEM water electrolyzer used in this study is shown in Figure 2. Fabrication of the catalyst-coated membrane (CCM) involves ultrasonic spraying or equivalent techniques to deposit catalyst layers on both surfaces of the proton exchange membrane. These layers, one on the anode and the other on the cathode, form the central electrochemical interfaces. To enhance the mass transfer of reactants and products, porous diffusion layers are incorporated on the outside of each electrode, completing the MEA structure. Surrounding the MEA are a series of plates arranged in a specific sequence: flow field plates, current collector plates, and end plates. The flow field plates regulate the fluid dynamics within the cell, while the current collector plates provide an electrical connection to an external power source. The outermost end plate provides mechanical support and structural integrity, and the anode and cathode components are arranged symmetrically around the proton membrane. During operation, the electrolyte enters through the inlet port and, guided by flow channels etched into the electrode plates, oxygen-rich streams exit through the oxygen outlet, while hydrogen, accompanied by trace water vapor, exits through the hydrogen port. Obviously, well-designed flow channel geometries are essential for maintaining uniform fluid distribution.
The electrolyzer has an external dimension of 60 mm × 60 mm, with an internal active porous dielectric layer of 40 mm × 40 mm. In response, this study develops a three-dimensional non-adiabatic steady-state model. Impedance spectroscopy measurements indicate that the electrolyzer can achieve a peak current density of approximately 100 mA/cm², validating its suitability for experimental investigations. Polarization curve analysis is also performed to confirm the accuracy and reliability of the model.

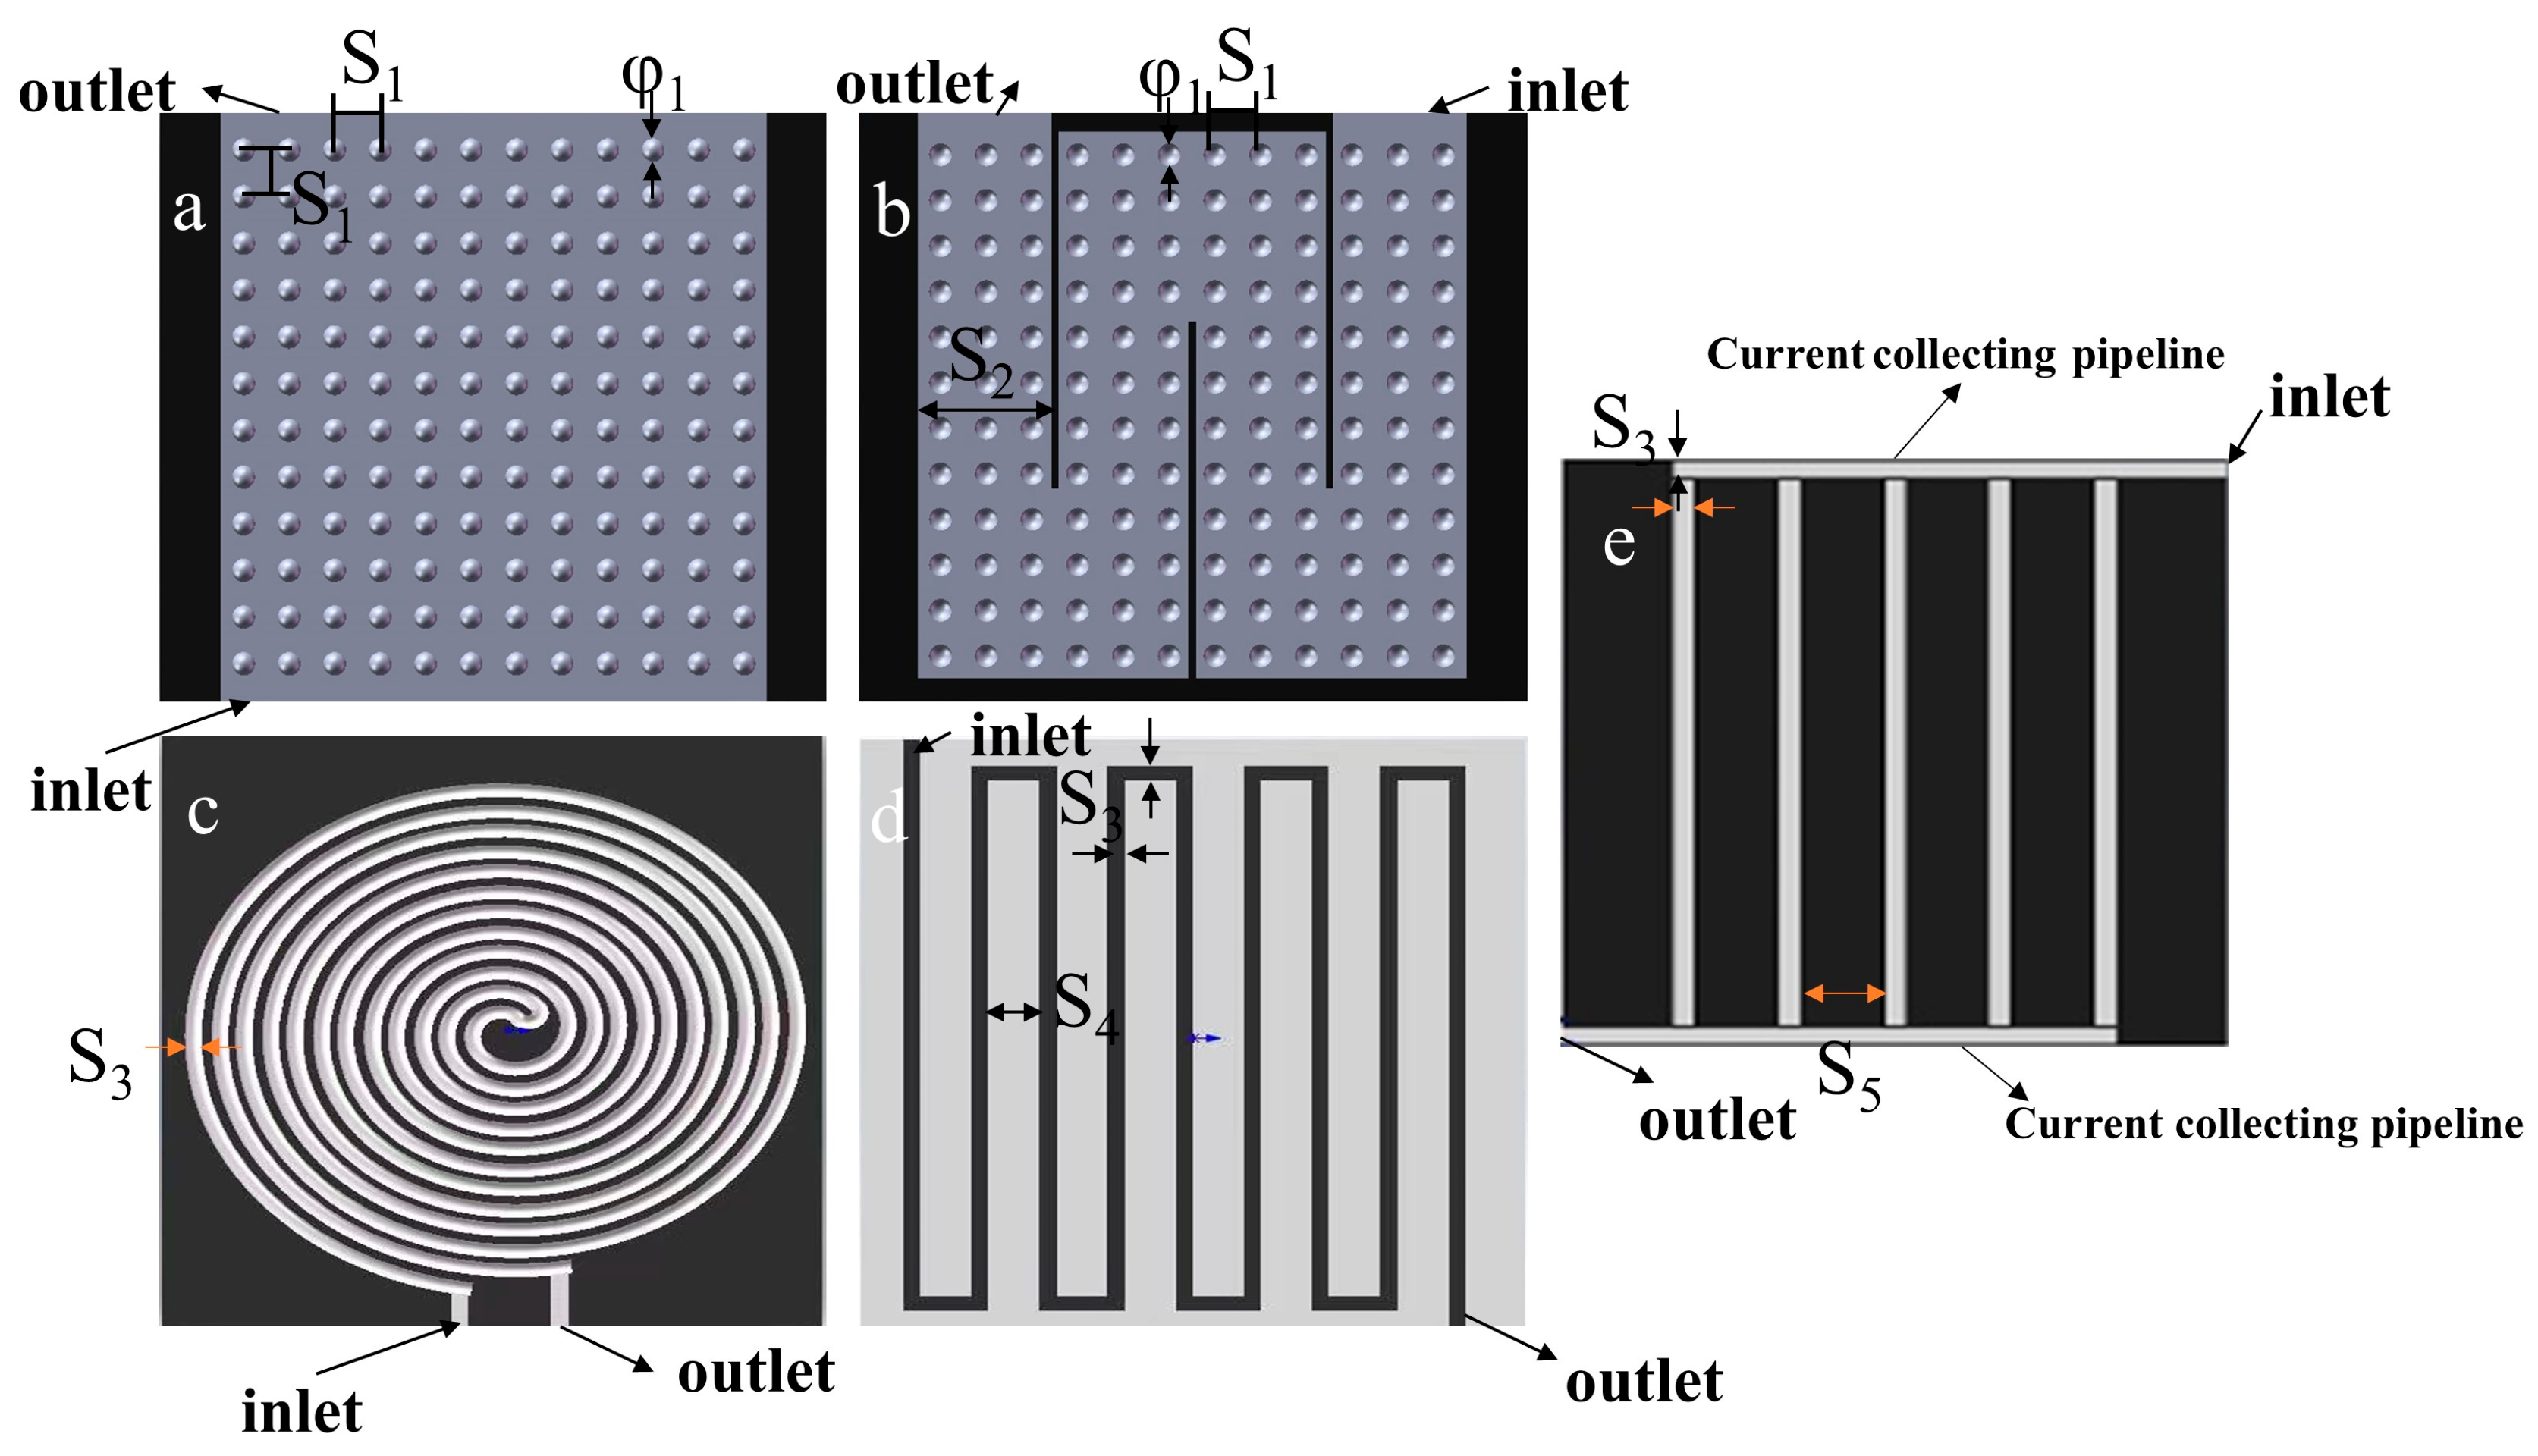
2.2. Geometric Model Parameters

As for the model of the water electrolyzer, the geometric parameters are presented in Table 1. The nuts, sealing rings, and bolts adopt the standard component size. When the battery is active, electrical energy is introduced into the electrolytic cell, transforming into both thermal and chemical energy. Throughout the cell’s operation, the catalyst facilitates the breakdown of water within the diffusion layer, transporting it to the anode catalyst layer where it splits into oxygen and protons. The reactions occurring in the anode are as follows:
H 2 O 2 H + + 1 2 O 2 + 2 e
Electrons flow into the cathode via an external circuit, while the proton exchange membrane facilitates the passage of protons generated at the anode. At the cathode, these electrons and protons unite to form hydrogen.
2 H + + 2 e H 2
During the water electrolysis process, both reactants (water) and products (hydrogen) co-exist at the anode. The flow behavior, diffusion patterns, and mass and heat transfer properties of this mixture are pivotal in determining the degree of concentration polarization, thereby exerting a profound influence on the performance of PEM water electrolyzers. At the same time, the flow field plate and the electrified plate also play a conductive role, ensuring a continuous electrochemical reaction. Under the combined effects of electrochemical reactions and concentration polarization, the performance of PEM water electrolyzers is closely intertwined with the design of the flow field and the membrane electrode assembly. The design and functionality directly impact the overall efficiency and operational stability of the electrolyzer system.
The five flow channel structures that were designed and adopted in this study are as follows: (a) teardrop runners, (b) teardrop runners with baffles, (c) mosquito coil runners, (d) serpentine runners, and (e) parallel runners, as illustrated in Figure 3. The parameters for each structure are enumerated in Table 2. A comprehensive analysis of the pressure and flow velocity distribution in each flow channel is imperative to ascertain the influential characteristics of these factors on the electrochemical reaction. This analysis will facilitate the determination of the optimal direction for enhancing the flow field plate of the electrolytic cell.

2.3. Simulation Assumptions

A three-dimensional, gas–liquid two-phase flow model of a PEM electrolyzer is established in this work. The following assumptions are proposed to simplify the calculation of the equations:
(1)
Because of the small Reynolds number (<2300), laminar flow is assumed;
(2)
The porous dielectric layer is thin and considered homogeneous and isotropic;
(3)
The contact resistance between adjacent parts is neglected (operating at room temperature);
(4)
The electrolytic cell operates under normal pressure, ignoring the influence of pressure;
(5)
It is assumed that conductivity is only dependent on temperature.

2.4. Mathematical Model

2.4.1. Electrochemical Model

The polarization curve is a visual display of the relationship between current density and voltage in a water electrolysis cell. It describes in detail the current output capability of the electrolysis cell at different voltages. In addition, polarization curves are helpful in identifying and optimizing key factors affecting the performance of the PEM water electrolyzer. The voltage of the electrolytic cell is mainly composed of four parts 20:
E c e l l = E O C V + η a c t + η o h m + η d i f f
where η a c t is activation overpotential; η a c t is diffusion overpotential; η a c t is ohmic overpotential; and EOCV is open-circuit voltage, determined by the Nernst equation, calculated as follows [24]:
E O C V = G / n F
where G is the Gibbs free energy, n is the number of electrons transferred in the half-reaction, and F is Faraday’s constant.
In PEM water electrolysis, the current is divided into two main components: the ionic current il across the membrane and the electron current is through the electrodes. The ohmic overpotential can be accurately calculated by applying Ohm’s law:
· i l = · σ l ε l 2 / 3 ϕ l , · i s = · σ s ε s 2 / 3 ϕ s
where ε is the electrode porosity; ϕ l and ϕ s are the electrolyte and boundary potentials, respectively; and σ is the resistivity, where the ionic resistivity ϕ l in the PEM membrane can be calculated as:
σ l = 0.005193 λ 0.00326 exp 1268 1 / 303 1 / T
The activation overpotential is an energy loss generated during an electrochemical reaction and can be calculated by the Butler–Volmer equation:
i v = a v i 0 exp ( η a c t α a F / R T ) exp η a c t α c F / R T
where α v is the active specific surface area of the electrode; α a and α c are the charge transfer coefficients on the anode and cathode; R is the gas constant; T is the cell temperature; and i 0 is the exchange current density, which will be affected by the concentration of reactants and products in the actual reaction, and can be calculated by the following formula:
i 0 = i 0 , r e f i ( c i / c i , r e f ) α a v i / n i ( c i / c i , r e f ) α c v i / n
where c i is the substance concentration; c i , r e f is the reference concentration; v i is the stoichiometric coefficient; and i 0 , r e f is the reference exchange current density.

2.4.2. Equation of Momentum

Brinkman’s equation accurately describes momentum transfer in porous media. Combining Darcy’s law and continuity equation to calculate gas velocity, it can be expressed as follows:
ρ u · u / ϵ p 2 = · p l + k μ k 1 + β ρ u + Q m / ϵ p 2 u + F
ρ · u = Q m
K = μ u + u T / ϵ p 0.667 μ · u l / ϵ p
where ρ is the density of the gas mixture; u is the mass velocity; μ is the viscosity; and k is the electrode permeability. Q m is the mass source term, which can be calculated as:
Q m = m i R i , m M i
where R i , m is the flux of the different components , and M i is the molar mass.

2.4.3. Mass Conservation

In porous media of flow fields and electrodes, gas flow distribution obeys the Maxwell–Stefan equation due to the influence of multicomponent diffusion and convection conditions. This phenomenon can be described by precise mathematical calculations:
t ρ ω i + · [ ρ ω i j = 1 N D i j M M j ω j + ω j M M + ( x j ω j ) P P + ω i ρ u ] = q i
where ω i is the mass fraction, P is the partial pressure, M is the molar mass, and   q i is the mass flux and is a function of the local current density.
q H 2 = M H 2 j c / ( 2 F )
q O 2 = M O 2 j a / ( 4 F )
q H 2 O = M H 2 O j a / ( 2 F )
Diffusivity in free space can be expressed as:
D i j = a T / ( T c i T j i ) 1 / 2 b P c i P c j 1 / 3 T c i T c j 5 / 12 ( 1 / M i + 1 / M j ) 1 / 2 / P
The effective diffusion coefficient within the electrode, corrected by Bruggeman, can be expressed as:
D i , j e f f = D i , j ε 1.5
The density calculation of gas mixture can be expressed as:
ρ = p + p r e f M / ( R T )
M = Σ i ω i / M i 1
x k   is the mole fraction calculated as:
x k = ( ω k / M k ) M n
Water inflow is related to stoichiometry, and mass flow can be expressed as:
M f l u x i n = λ M H 2 O j A / ( 2 F )
A complete mathematical model of the PEM water electrolyzer was established by coupling three kinds of models established by the Nernst equation, the Butler–Volmer equation, Ohm’s law, mass conservation, momentum conservation, and the Brinkman equation. The parameters and boundary conditions of the model should be set according to the actual working conditions.

3. Results and Discussion

3.1. Dynamic Analysis

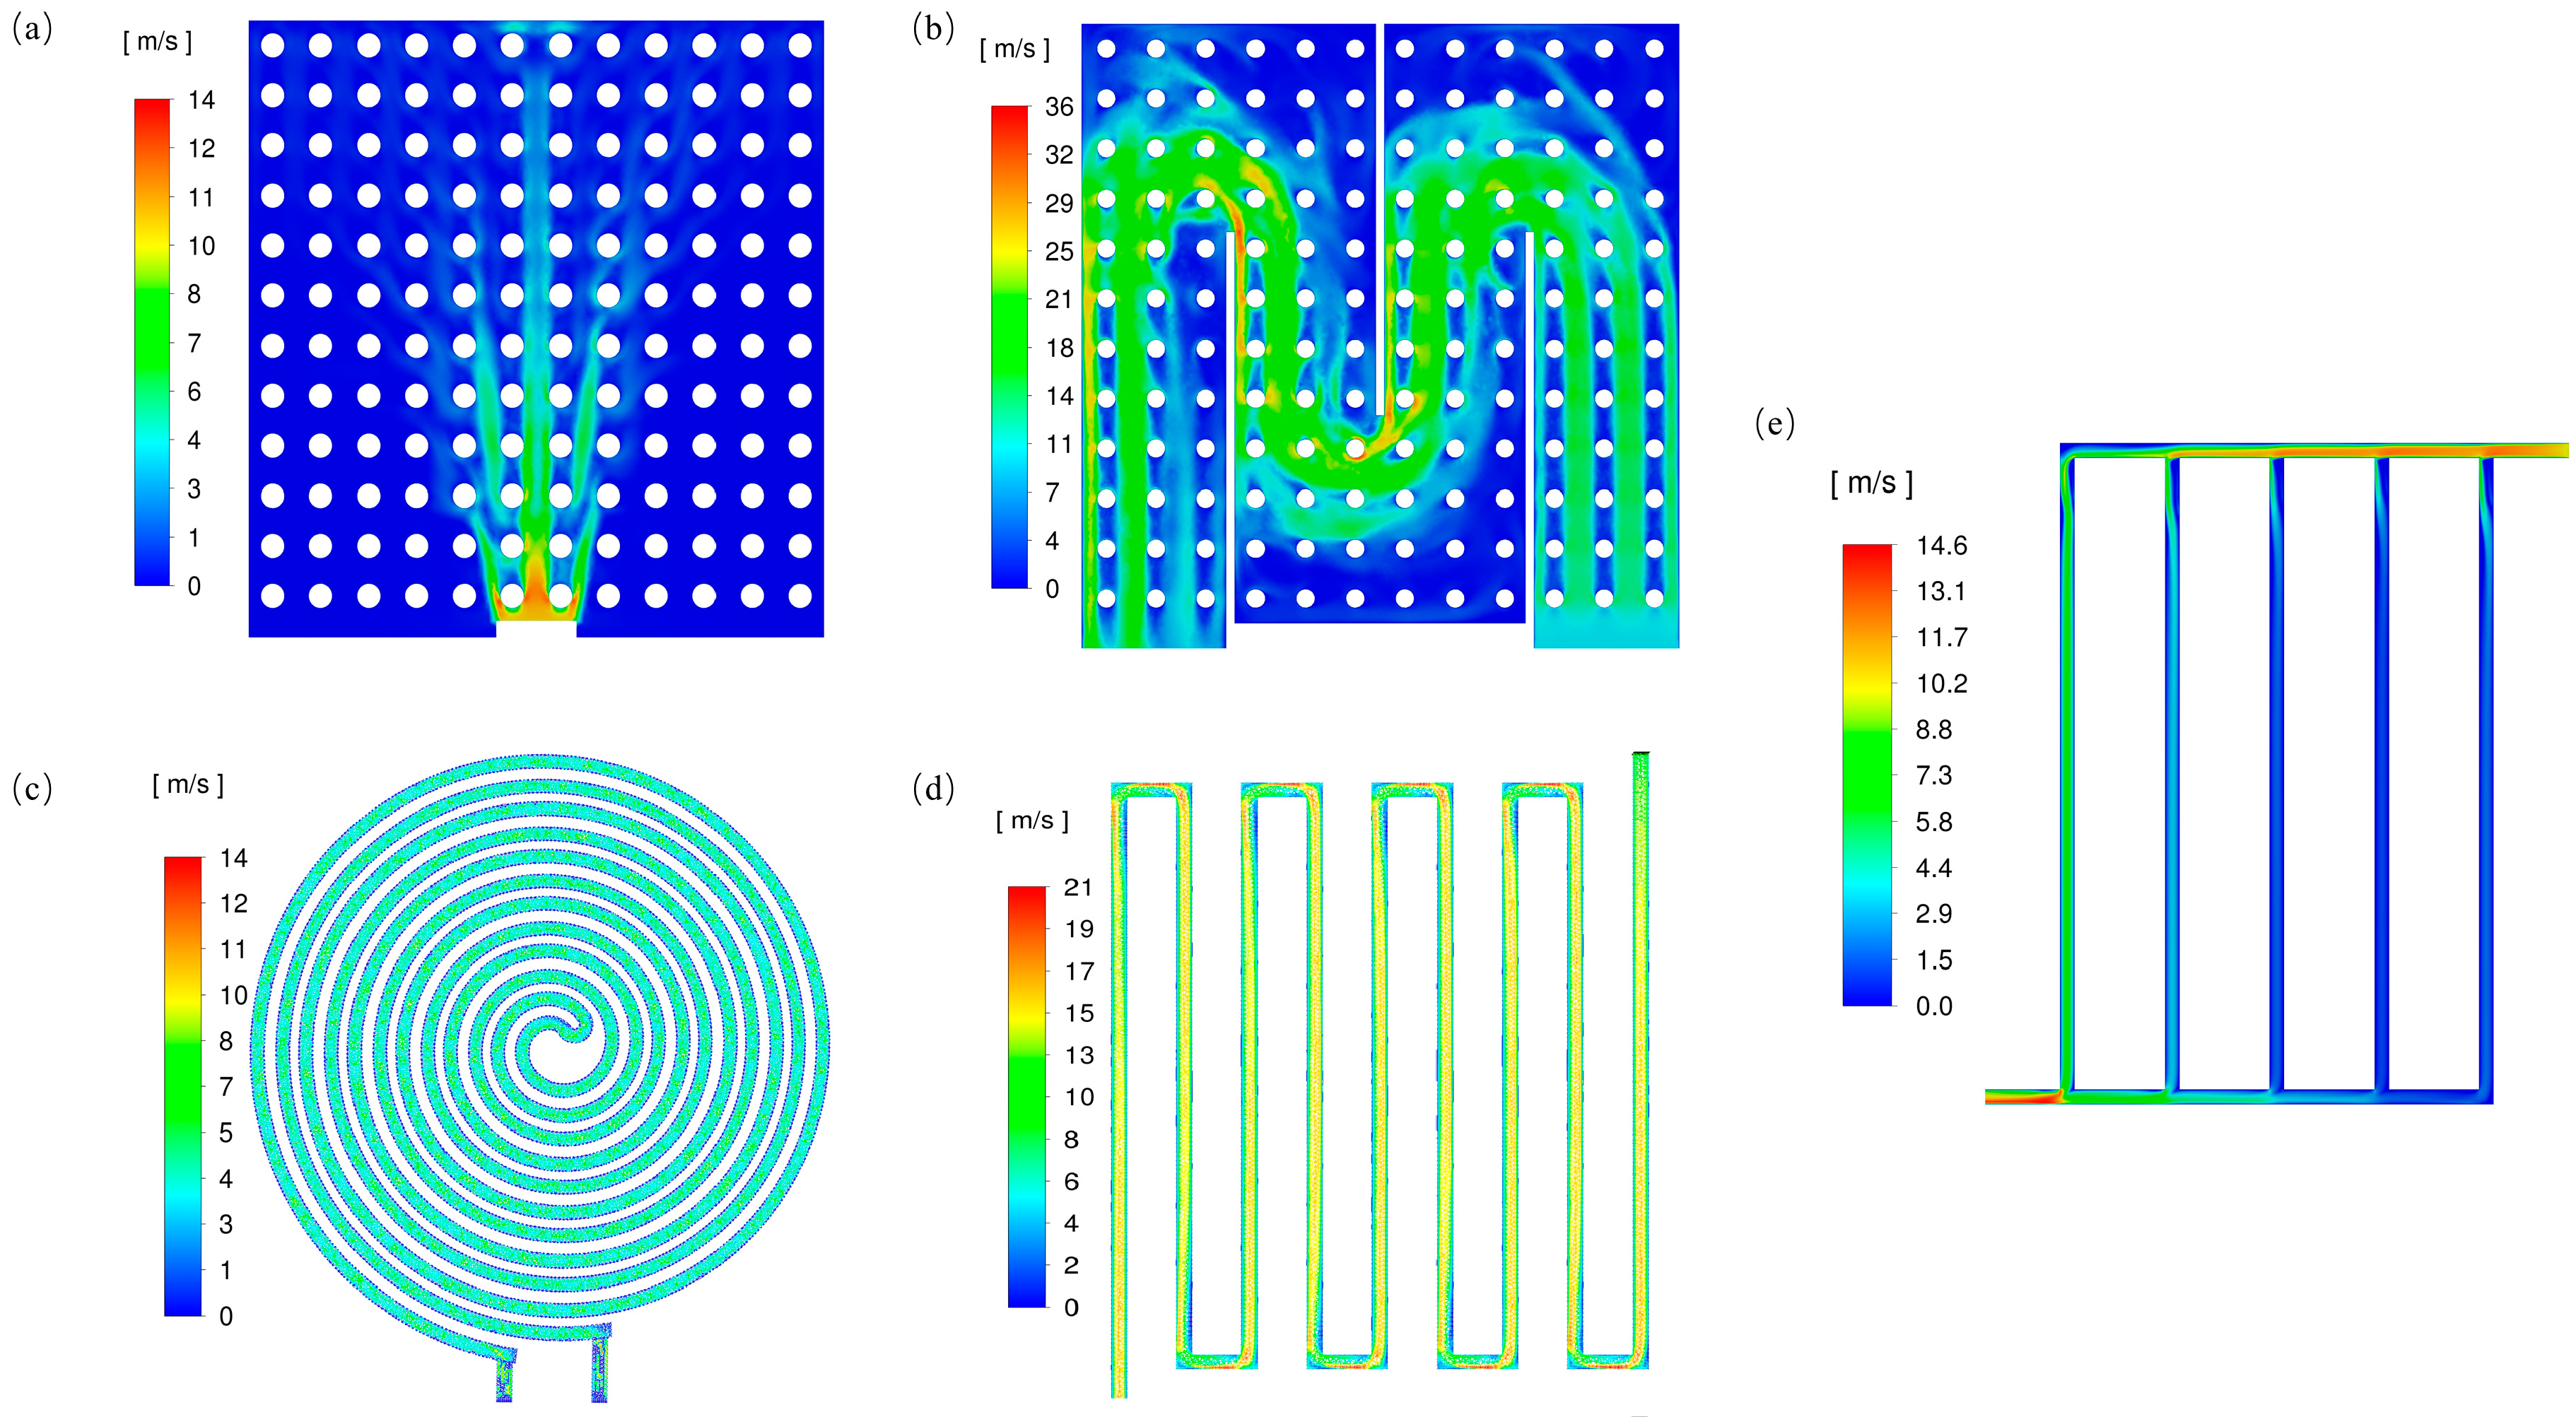
3.1.1. Comparison of Uniformity of Flow Field

Figure 4 illustrates the velocity profiles for various flow fields at an inlet velocity of 10 m/s as the data used in the experiment. Significantly, in Figure 4a, the flow velocity decreases at the bend of the flow field channel. This phenomenon is mainly due to the larger pressure gradient between adjacent channels. The mean velocities in the different flow channels are as follows: teardrop runners (3.5 m/s), teardrop runners with baffles (20.1 m/s), mosquito coil runners (8.5 m/s), serpentine runners (7.2 m/s), and parallel runners (5.8 m/s). In Figure 4b, for the flow field with baffles, velocity peaks primarily occur at the turning point, with lower velocities in the first half of the channel, potentially impacting the reaction efficiency negatively. The two serpentine flow channels (Figure 4c,d) exhibit relatively uniform flow velocities due to a smaller flow area. The parallel flow field (Figure 4e) demonstrates comparatively lower velocity, which may prolong product elimination but enhance reaction completeness.

3.1.2. Pressure Distribution in Flow Field

Under the condition of a water inlet flow rate of 10 m/s, the pressure distribution of each structure is shown in Figure 5. Water diffuses more quickly to the catalyst surface in the water electrolysis cell with a low-pressure drop, thus improving the performance of the water electrolysis cell to some extent. The figure exposes that the pressure drops of teardrop runners, teardrop runners with baffles, mosquito coil runners, serpentine runners, and parallel runners are 200 Pa, 148 Pa, 112 Pa, 145 Pa, and 129 Pa, respectively. Obviously, mosquito coils and parallel flow fields exhibit lower pressure drops. Combined with the velocity distribution characteristics, the flow velocity and pressure in parallel channels are low, which is beneficial to the full electrochemical reaction. Comprehensively, the structural design of the parallel flow channel is most beneficial to improve the performance of electrolytic cells, which is consistent with the conclusion of Zheng et al. [25].

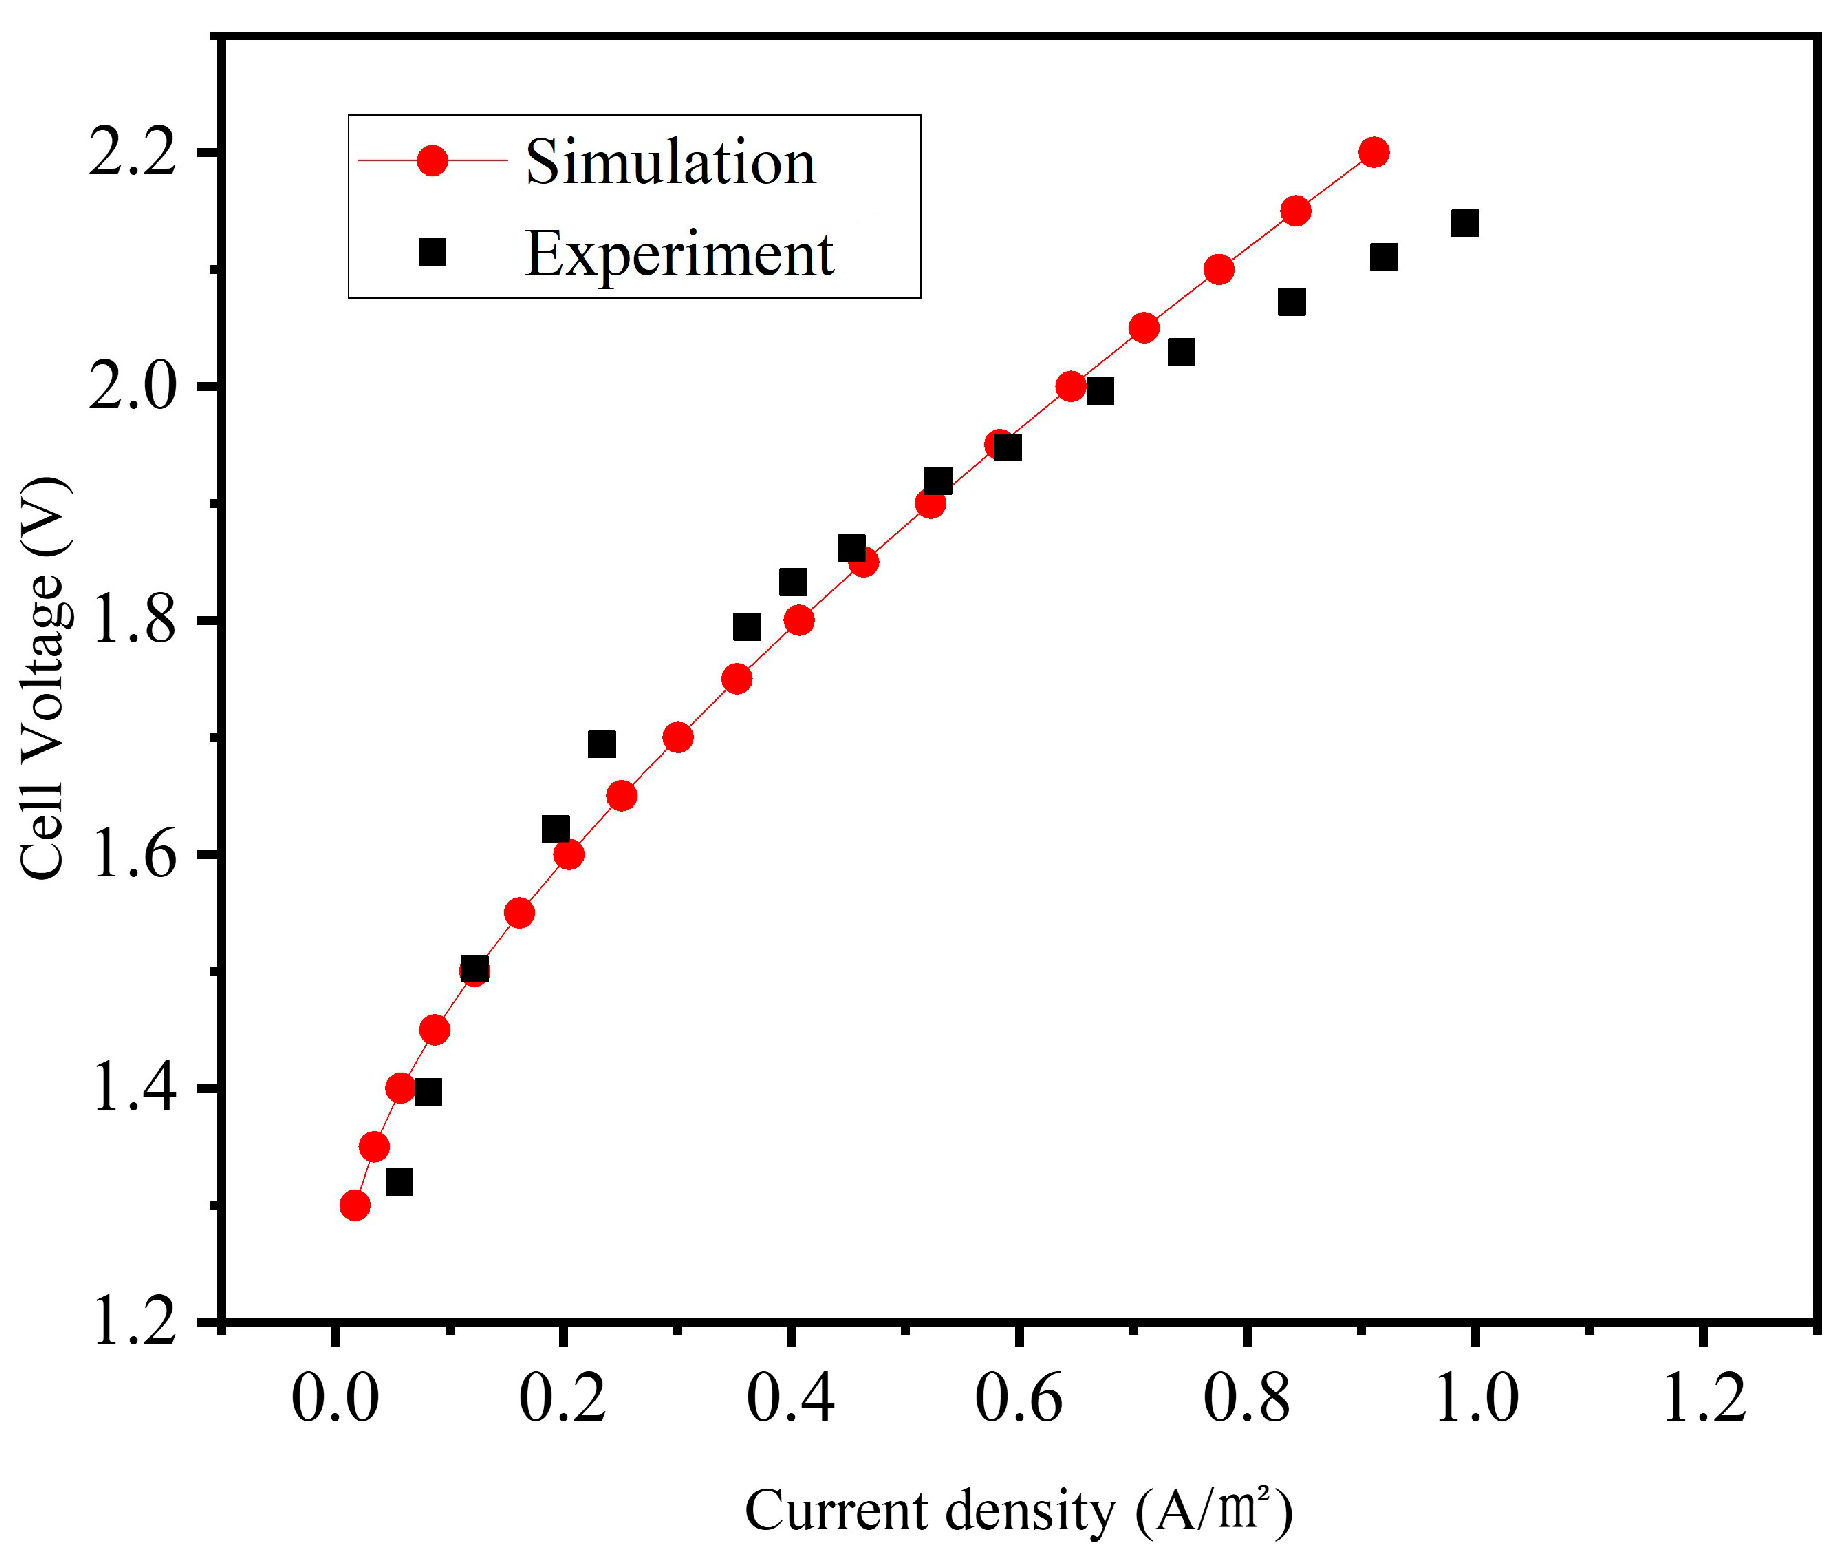
3.2. Model Validation

Because the form of the flow field has an important influence on the performance of the electrolyzer [26], electrochemical simulation is carried out for the parallel flow channels determined by the dynamic simulation of the above five flow fields, and a three-dimensional geometric model of the PEM water electrolyzer is established by using COMSOL 6.1 software. As exhibited in Figure 6, the parallel flow channels are connected to the catalyst layer of the porous medium.
The calculation domain is the area that does not include tight parts such as sealing washers and bolts. It is shown in Figure 6. The global mesh size is 0.25 mm, the encryption is 0.1 mm, the growth rate is 1.2, the mean skewness is 0.41, and orthogonality is 0.58. Since Figure 3a,b has a much larger cross-sectional area of the fluid channel compared to Figure 3, Figure 4 and Figure 5, the inlet flow rate is set at a larger value of 10 m/s and applied in the experiments. Model settings: the inlet speed is 10 m/s, the outlet is a pressure outlet, and there is gravitational acceleration in the z-direction.
In this study, four different mesh densities were used for this computational domain, namely 10,828, 52,603, 99,096, and 145,844 cells. The study examines the effect of these mesh densities on the fluid flow velocity and dynamic pressure. As shown in Figure 7, the difference in fluid flow velocity between coarser grids increases significantly as the number of grids increases. However, the deviation decreases when the grid density reaches 99,096 cells. The maximum differences in fluid flow velocity and dynamic pressure between grid densities of 99,096 and 145,844 are 0.28% and 2.14%, respectively. Therefore, based on these test results, the 99,096 grid configuration was selected in this paper to achieve the best balance between simulation effectiveness and computational process efficiency.
To verify the model, numerical results are compared with those of Zhang et al. [20] for a comparison of experimental results reported under the same operating conditions and similar geometric conditions. Temperature is 353.15 K, pressure is 1 atm, and other working conditions are presented in Table 3.
Figure 8 demonstrates a comparison of simulation results with experimental data, which agree well. After validation, the effects of different operating conditions and geometric forms on the electrolyzer were analyzed by using effective models.

3.3. Electrochemical Analysis

By comparing the velocity, electrolyte, oxygen concentration distribution, current density distribution, and polarization curves of different models, Zheng et al. [27] concluded that the parallel runners exhibit excellent performance in water electrolysis, which is consistent with the conclusion of this paper. Figure 9 shows the effect of the exchange current density on the velocity and pressure in the flow channel at a voltage of 2.2 V. The anodic exchange current density (ia) is 0.0056 A/m2 and the cathodic exchange current density (ic) is 0.19 A/m2, 0.25 A/m2, and 0.31 A/m2, respectively. The peak velocities are mainly at the inlet and outlet, while the velocities in the parallel channels are relatively small and uniform. The slower migration of water and electrolysis products through the porous media catalyst facilitates the electrolysis reaction to proceed adequately. Due to the low pressure drop in the flow channels, the water reactants are uniformly distributed in the PEM water electrolyzer. The pressure drops were close to 10.23 Pa, 10.4 Pa, and 10.55 Pa, respectively, at which time the flow resistance was very small.
Figure 10’s left panel illustrates the relationship between electrochemical performance and gas concentration in the electrolytic cell at an anode-side current density of 0.0056 A/m2. The right panel depicts the voltage variation in the electrolytic cell concerning the anode-side exchange current density at a cathode-side current density of 0.19 A/m2. As the exchange current density increases, there is a slight rise in both the current density and gas concentration within the cell. Notably, the performance of the cell is more significantly influenced by the exchange current density on the anode side due to it being a 4-electron transfer process, in contrast to the cathode side’s 2-electron transfer process. The molar concentration of oxygen is a consequence of the interaction between the oxygen evolution rate and the mixed flow, indicating a heightened overall reaction rate and improved electrolytic performance. The accumulation of products is more pronounced in parallel flow fields due to their slower velocity and minimal pressure drop, resulting in higher oxygen concentrations. This effect becomes more conspicuous with increasing exchange current density.
Increasing current density enhances gas yield and flow resistance in the flow field, as depicted in Figure 10 and Figure 11. Beyond a current density of 0.265 A/m2, the rise in flow resistance outpaces that of oxygen production, leading to heightened energy consumption for hydrogen production via electrolysis and a plateauing of electrolysis performance enhancement. Economically speaking, the PEM cell model detailed in this study features a cathode-side current density of 0.265 A/m2 and an anode-side current density of 0.00522 A/m2, as illustrated in Figure 12.

4. Influence of Geometric Dimensions

As seen in Figure 13, the relationship between the width of the branch pipe and the current density is illustrated; Figure 13a is for the width of the branch pipe fixed at 3 mm, and Figure 13b is for the width of the branch pipe of 2.77 mm, while the simulation conditions are set at 313.15 K, and the cell voltage is maintained at 1.8 V. The current density exhibits significant variation with the width of the collector plate, further substantiating that the geometric dimensions of the collector plate directly influence the performance of the electrolytic cell.
Figure 14 shows the effect of water inflow velocity on polarization curves, where (a) is the experimental result at room temperature, and (b) is the simulation result at 313.15 K. Specifically, the cycle with water(v2 = 1.34 m/s) exhibits a higher current density at the same voltage than the cycle without water(v1 = 0 m/s); v2 is measured in the experiments. The influent flow rate is a key factor affecting the performance of the electrolyzer. By comparing the polarization curves with the water inflow velocity, it is obvious that increasing the water inflow velocity can effectively improve the working efficiency of the electrolyzer, which in turn affects the performance of the entire electrolysis process.
The optimization of the collecting plate adopts an orthogonal experiment. Two remarkable advantages of orthogonal experiment design lie in its unique balance and representativeness. At each level of each factor, the frequency of occurrence of different values and the probability of pairing with each level of other factors are consistent, effectively ensuring that other variables are excluded to the greatest extent when analyzing the optimal deposition process conditions. In addition, the factor combinations in any two columns appear equally, so that all experimental points are evenly distributed among the combinations of factors and levels, thus ensuring the representativeness and comprehensiveness of the experimental design.
According to the four factors and three levels obtained from previous experiments and simulation, the specific numerical table of the orthogonal experiment with four factors and three levels in Table 4 is obtained. From the four factors and three levels of orthogonal experimental values in Table 4, nine orthogonal experimental designs in Table 5 can be obtained.
According to the design of the L9(34) orthogonal experiment with four factors and three levels, the current density is used as the evaluation basis for the above nine groups, and the range difference between factors and levels is calculated. Table 5 is the calculation result table of the orthogonal experiment.
After analyzing the influencing factors deeply, this paper confirms that the range of the manifold channel is significantly higher than the other factors, reaching 30.4, which clearly points out its core position in the overall performance. The ranges of the groove depth and branch tube width are next, indicating that they also play an important role in the overall structure. The range of inlet velocity is 20.3, which is the least significant of the four factors, but its role in the system cannot be ignored.
As depicted in Figure 15, the central cross-sectional velocities of the five branch channels (left to right: v1–v5) reveal significant hydrodynamic enhancements post-optimization. Comparative analysis of pre- and post-optimization flow characteristics (collector width: 3.1 mm, branch width: 2.7 mm, groove depth: 2 mm) demonstrates reduced sample variance in optimized channels, indicating improved velocity uniformity. This redesigned collector plate exhibits enhanced flow stability and orderliness, which collectively contribute to higher system efficiency, lower energy consumption, and extended equipment longevity.

5. Conclusions

A steady-state three-dimensional model of the PEM water electrolyzer is established. Under the same conditions, the velocity and pressure distributions of different flow fields are compared, and the multi-channel parallel flow field is beneficial to electrolyzing hydrogen production. The result unveils that:
(1)
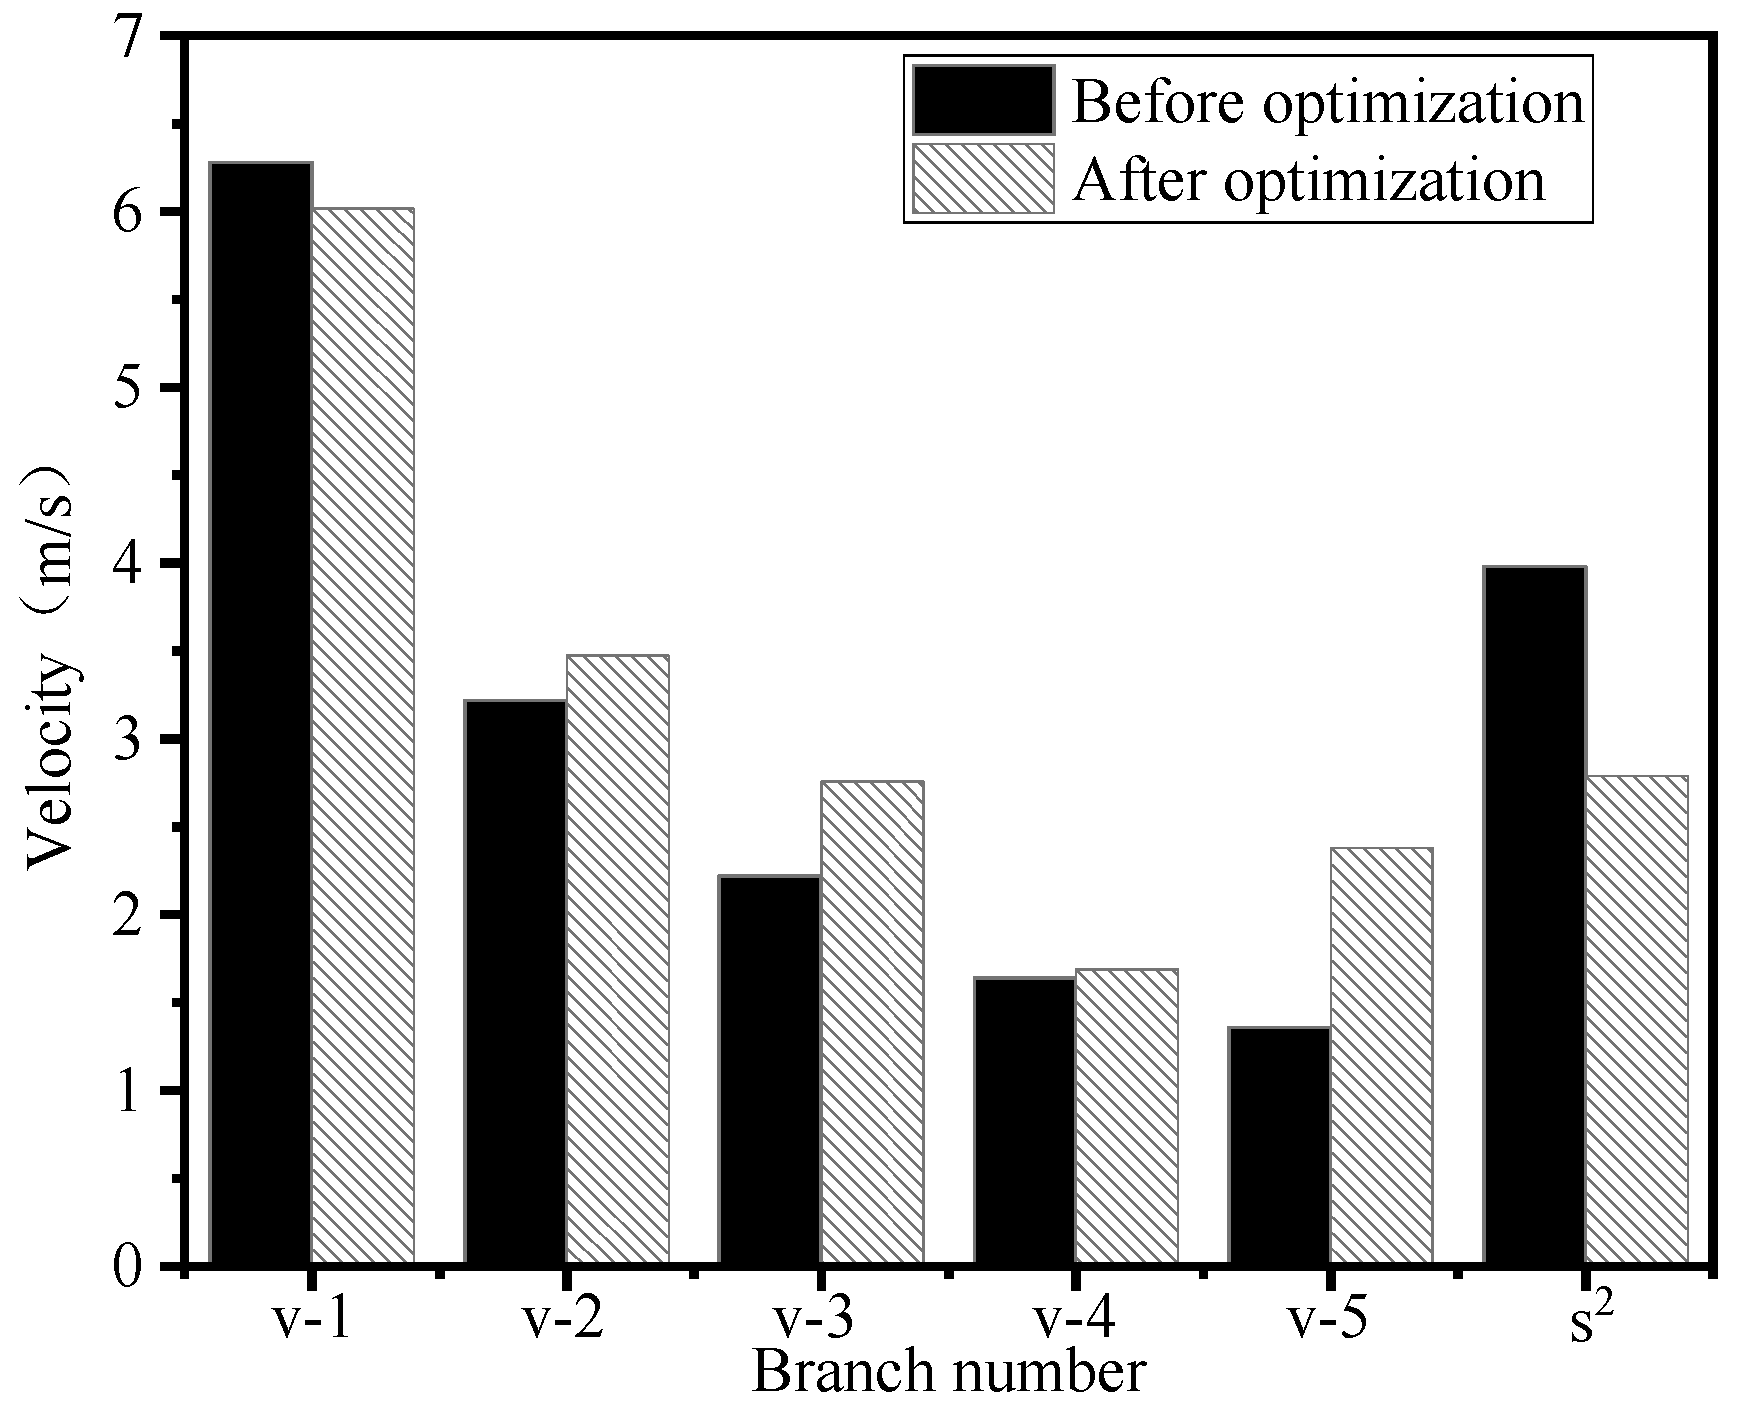
The flow field configuration significantly impacts the performance of electrolytic cells. The narrow inlet area of the convex milk-type gas leads to rapid entry of gas with high pressure and flow velocity, resulting in uneven flow. Incorporating baffles mitigates this issue but further increases flow velocity. In contrast, the serpentine channel demonstrates lower pressure drop and flow velocity, leading to reduced overpotential and superior performance. The parallel flow configuration of multi-channels combines the benefits of the serpentine design, exhibiting a more uniform flow velocity and pressure distribution, as the preferred electrode channel design.
(2)
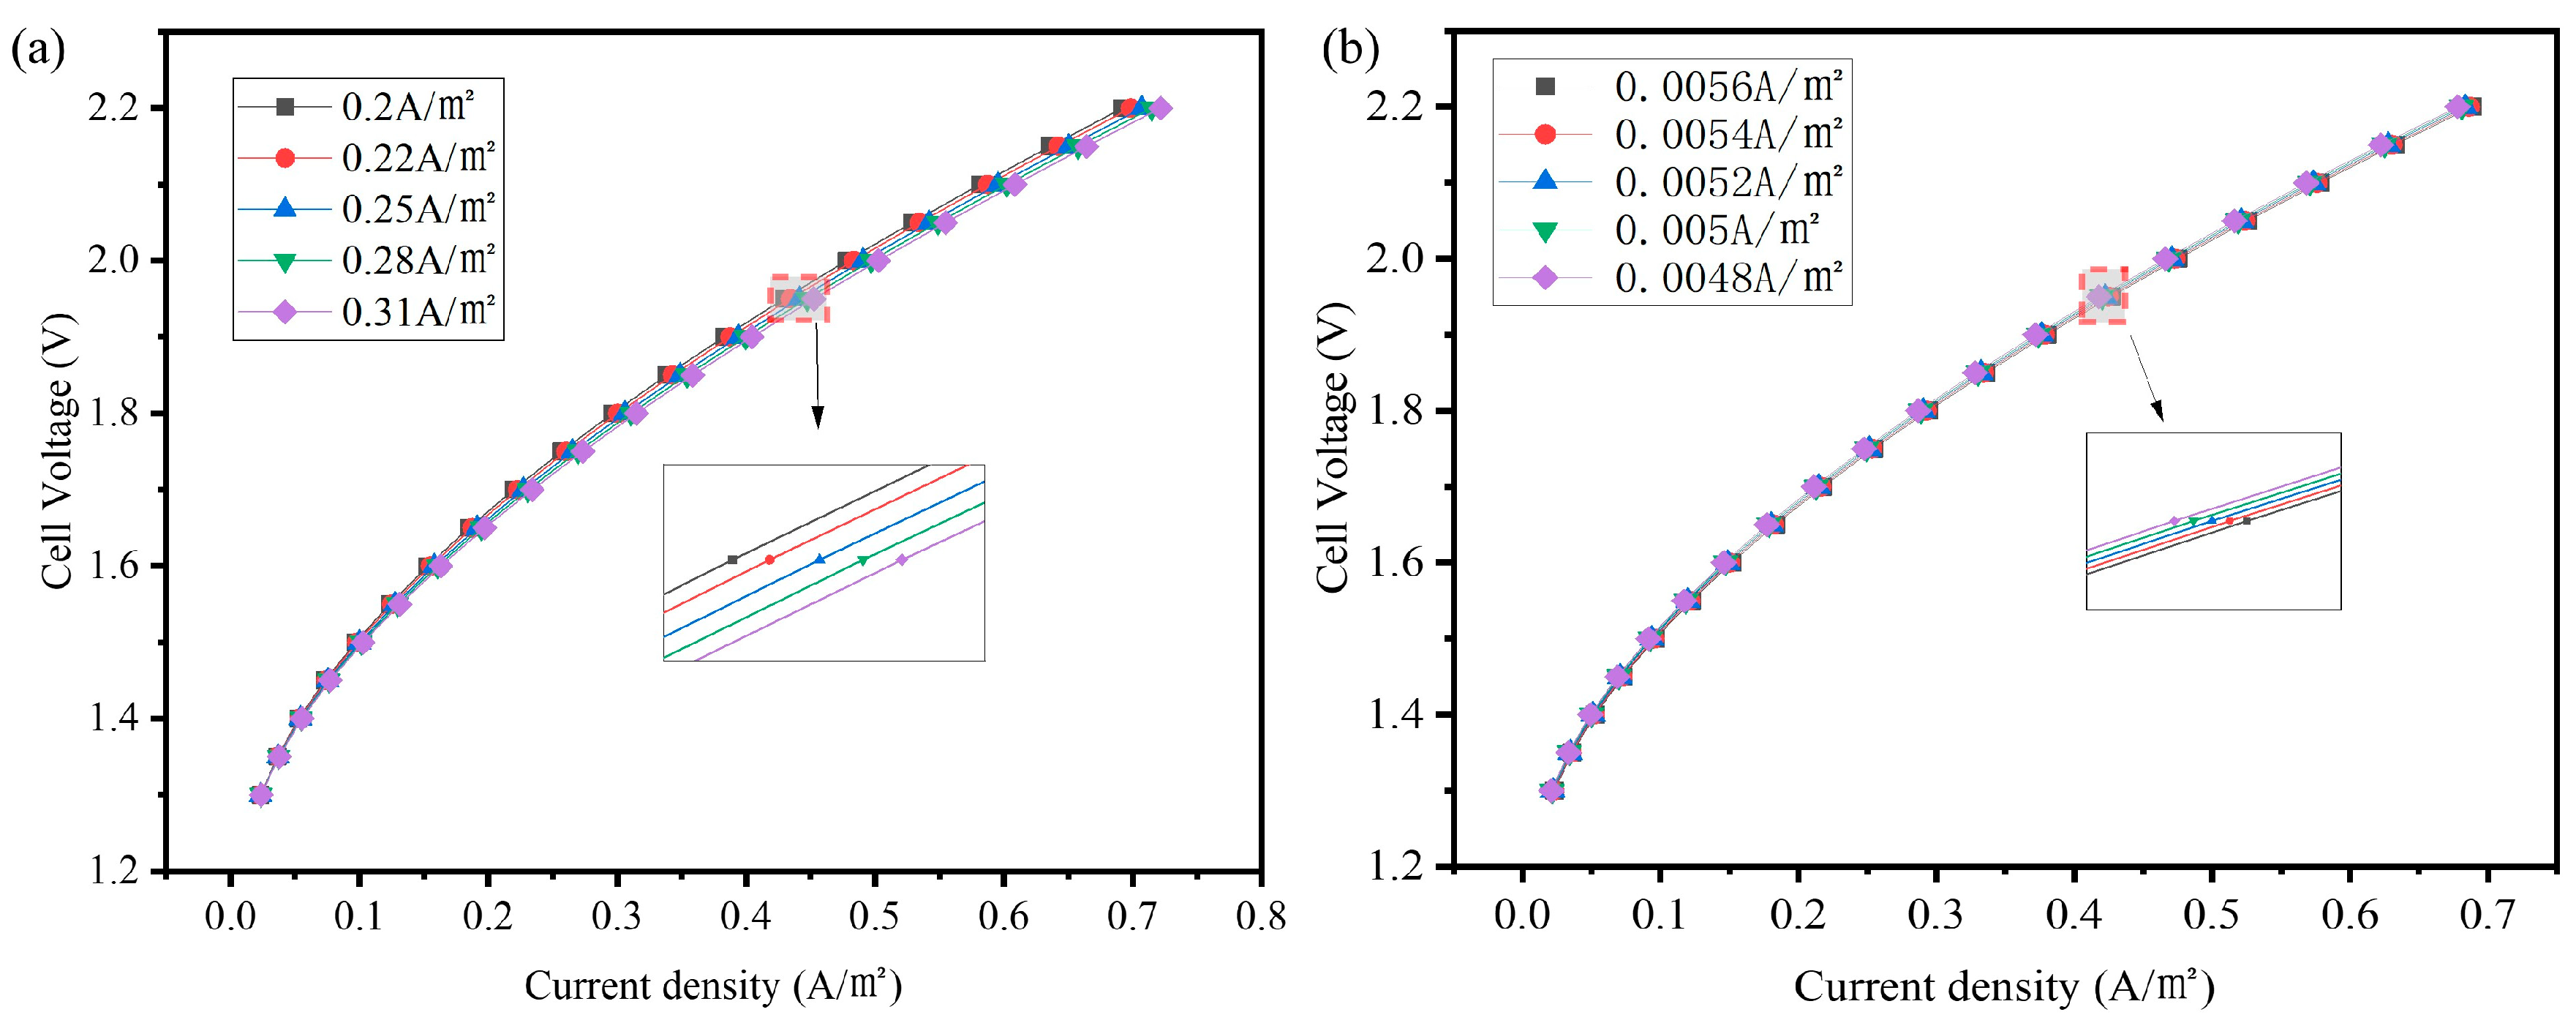
Enhancing the exchange current density facilitates the efficient transport of reactants to the reaction site, as evidenced by the polarization curve, thereby enhancing the performance of the electrolytic cell and ultimately improving water electrolysis efficiency. In this study, a cathode current density of 0.265 A/m2 and an anode current density of 0.00522 A/m2 were chosen.
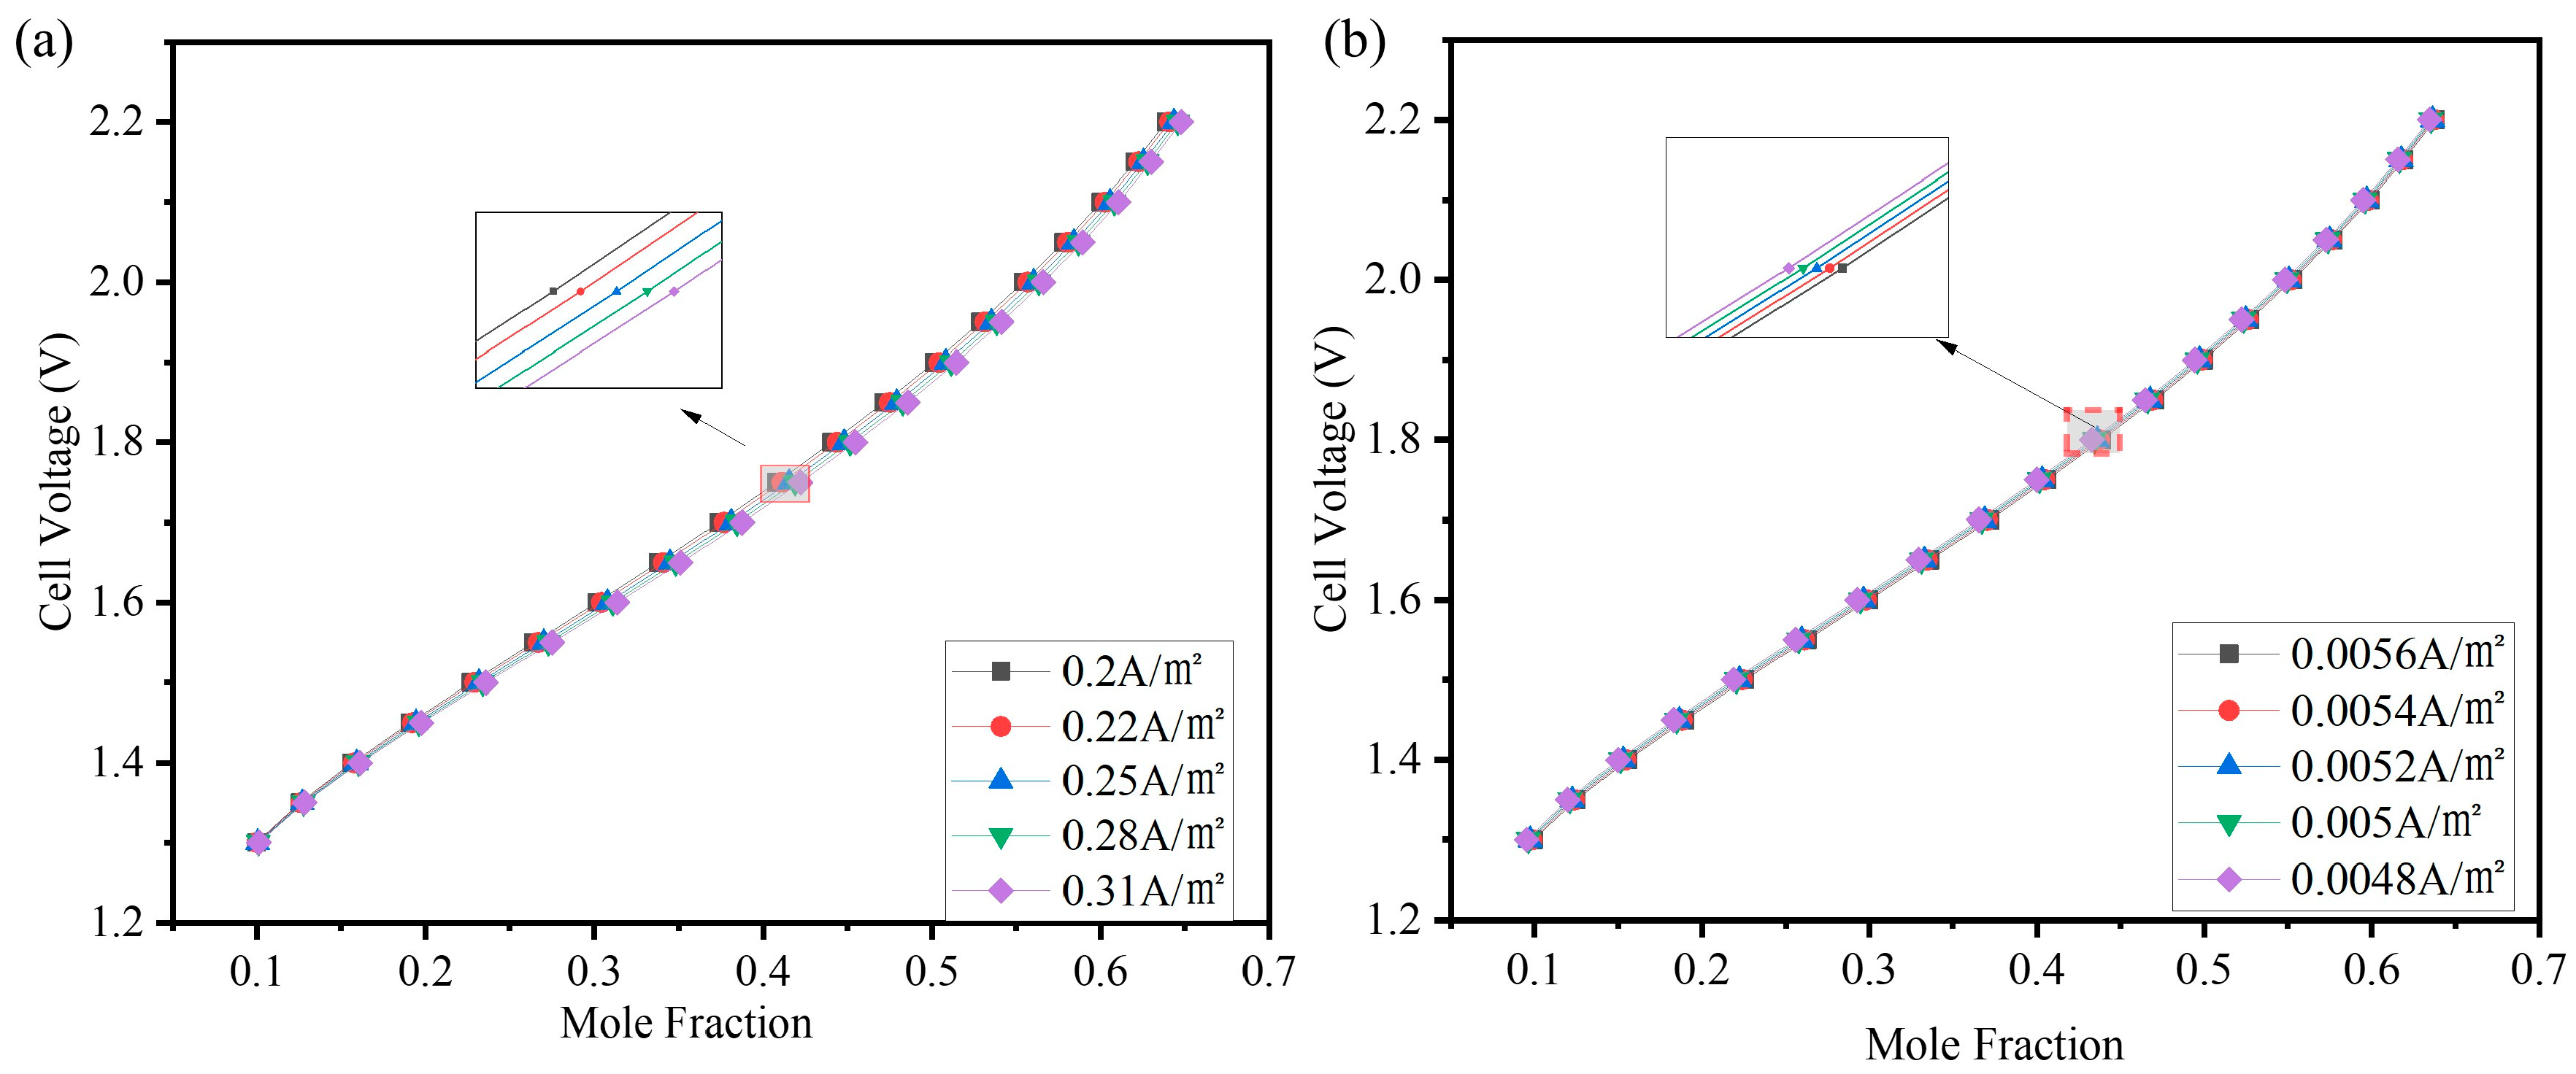
(3)
Increasing exchange current density increases the oxygen mole fraction, which proves that it is beneficial to the improvement of electrolytic cell performance.
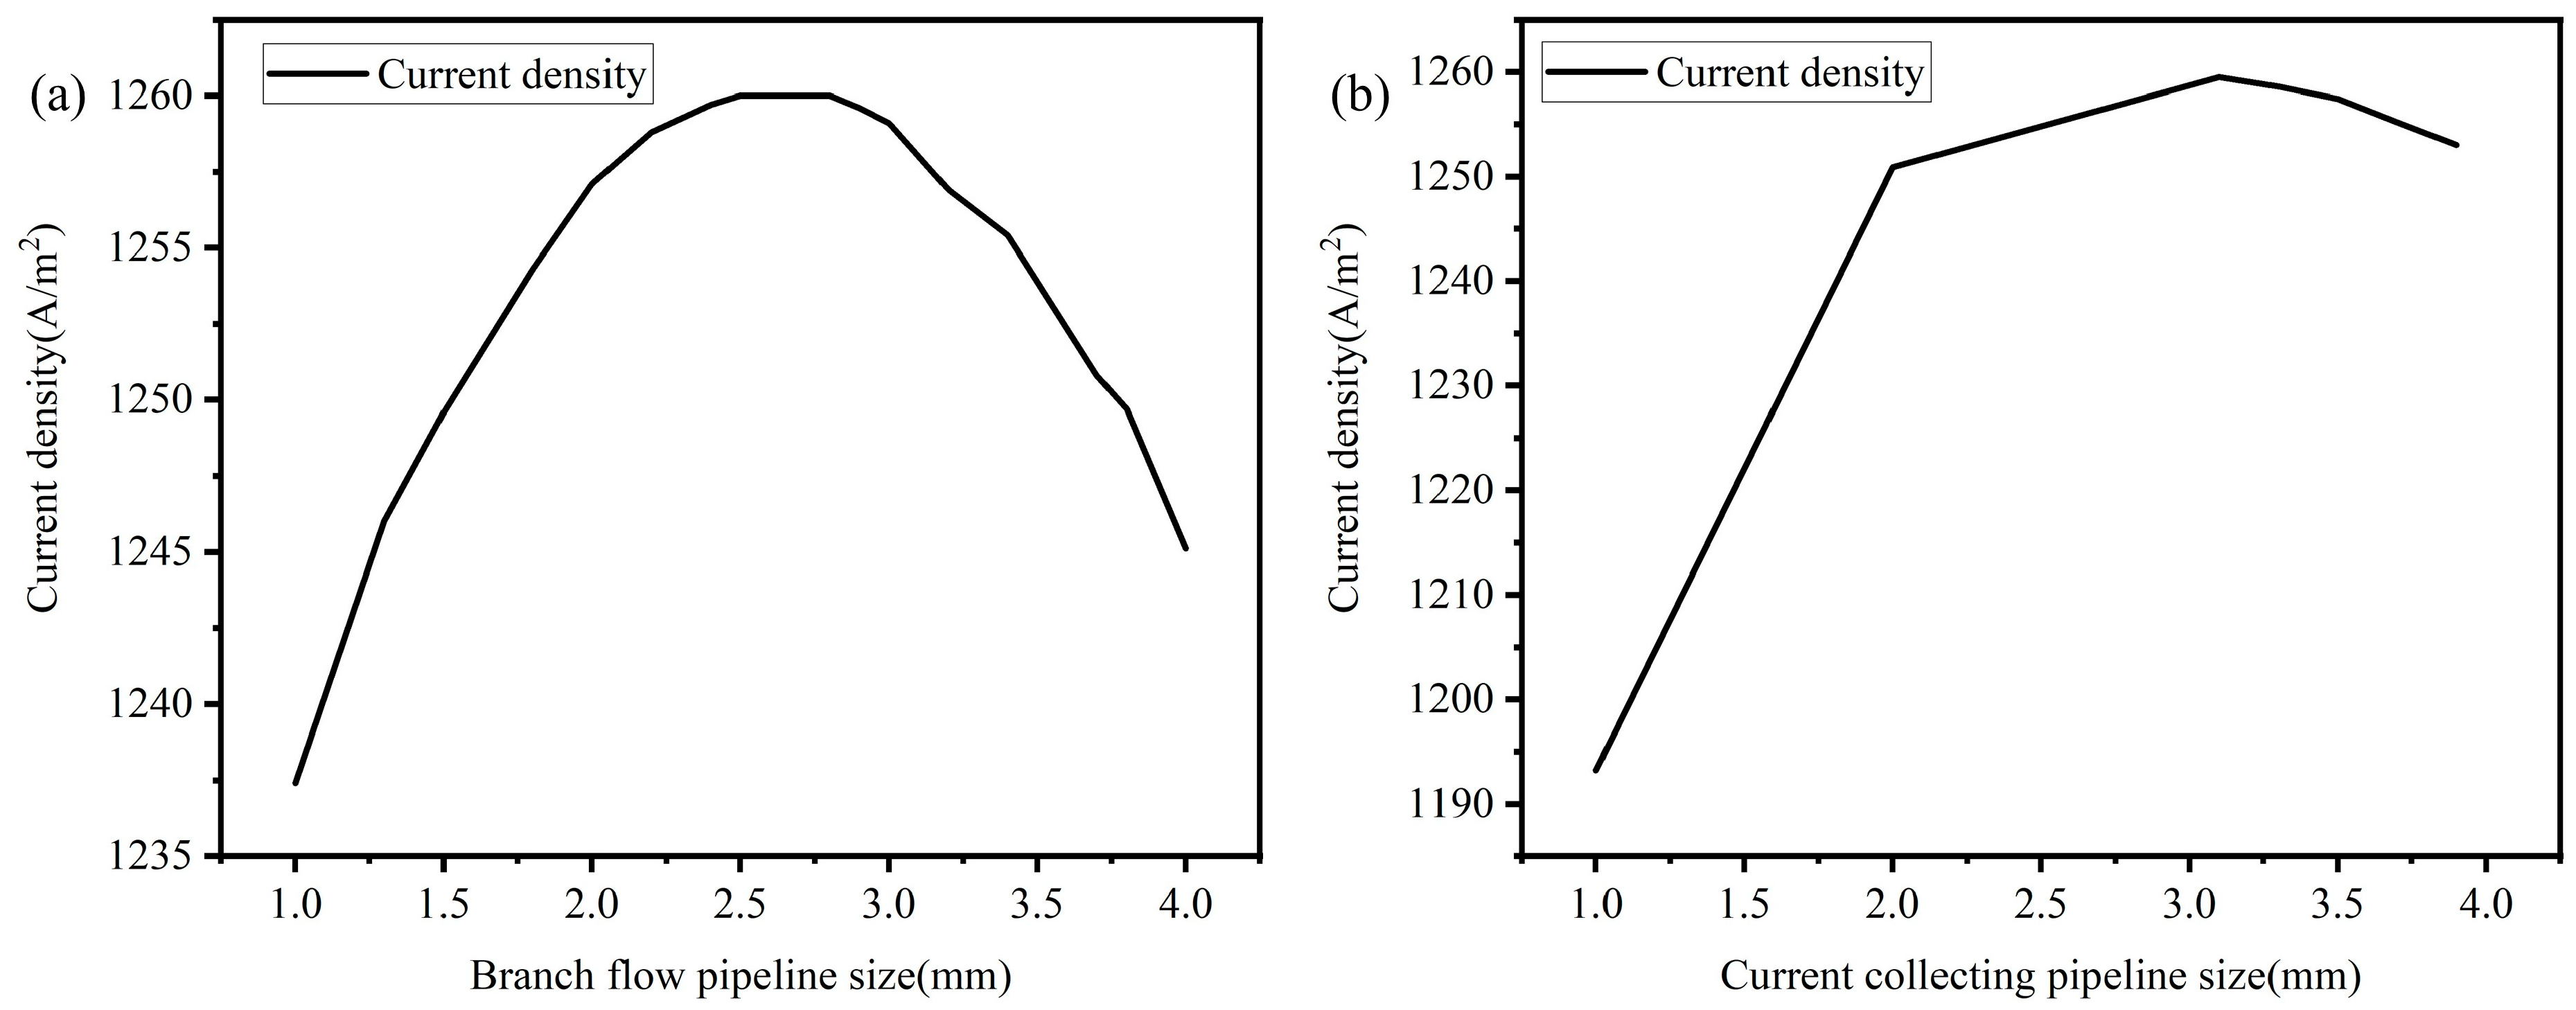
(4)
The width of the header is the most important factor. The orthogonal experiment reveals that the optimal size of the header plate is 3.1 mm in header width, 2.7 mm in branch width, 2 mm in groove depth, and 1.5 m/s in inlet velocity at 313.15 K.
In this study, the model construction is based on a number of simplifying assumptions, and the effects of contact resistance and magnetic field on conductivity are not considered for the time being in order to reduce the computational complexity. In the future, incorporating the above-mentioned key physical factors into the model framework is planned by developing customized UDFs to more accurately reflect the actual working conditions, so as to significantly improve the accuracy and predictive ability of the numerical simulations, and to provide more reliable theoretical support for optimizing the performance of the PEM water electrolyzer.

Author Contributions

Methodology, H.Y.; software, Y.Z.; formal analysis, Y.Z.; investigation, X.Y.; data curation, S.Y.; writing—original draft, Y.Z.; writing—review & editing, C.W.; supervision, H.Y. and C.W.; project administration, H.Y.; funding acquisition, C.W. All authors have read and agreed to the published version of the manuscript.

Funding

This research was funded by the National Natural Science Foundation of China (Grant NO. 52476120), the Huaneng Group sci-ence and technology research project (Grant NO. HNKJ23-H71), and the Key international Coop-eration of Qingdao City (Grant NO. 24-1-6-ghgg-9-hz). The sponsorships are gratefully acknowledged.

Data Availability Statement

The original contributions presented in the study are included in the article, further inquiries can be directed to the corresponding author.

Conflicts of Interest

The authors declare no conflict of interest.

References

  1. Carmo, M.; Fritz, D.L.; Mergel, J.; Stolten, D. A comprehensive review on PEM water electrolysis. Int. J. Hydrogen Energy 2013, 38, 4901–4934. [Google Scholar] [CrossRef]
  2. Wang, Y.; Chen, K.S.; Mishler, J.; Cho, S.C.; Adroher, X.C. A review of polymer electrolyte membrane fuel cells: Technology, applications, and needs on fundamental research. Appl. Energy 2011, 88, 981–1007. [Google Scholar] [CrossRef]
  3. Kumar, S.S.; Himabindu, V. Hydrogen production by PEM water electrolysis—A review. Mater. Sci. Energy Technol. 2019, 2, 442–454. [Google Scholar] [CrossRef]
  4. Turner, J.A. Sustainable hydrogen production. Science 2004, 305, 972–974. [Google Scholar] [CrossRef] [PubMed]
  5. Din, M.A.U.; Irfan, S.; Sharif, H.M.A.; Jamil, S.; Idrees, M.; Khan, Q.U.; Nazir, G.; Cheng, N. Nanoporous CoCu layered double hydroxide nanoplates as bifunctional electrocatalyst for high performance overall water splitting. Int. J. Hydrogen Energy 2023, 48, 5755–5763. [Google Scholar] [CrossRef]
  6. Din, M.A.U.; Idrees, M.; Jamil, S.; Irfan, S.; Nazir, G.; Mudassir, M.A.; Saleem, M.S.; Batool, S.; Cheng, N.; Saidur, R. Advances and challenges of methanol-tolerant oxygen reduction reaction electrocatalysts for the direct methanol fuel cell. J. Energy Chem. 2023, 77, 499–513. [Google Scholar] [CrossRef]
  7. Rashid, M.M.; Mesfer MK, A.; Naseem, H.; Danish, M. Hydrogen Production by Water Electrolysis: A Review of Alkaline Water Electrolysis, PEM Water Electrolysis and High Temperature Water Electrolysis. Int. J. Eng. Adv. Technol. (IJEAT) 2015, 4, 2249–8958. [Google Scholar]
  8. Xu, Y.; Lv, H.; Lu, H.; Quan, Q.; Li, W.; Cui, X.; Liu, G.; Jiang, L. Mg/seawater batteries driven self-powered direct seawater electrolysis systems for hydrogen production. Nano Energy 2022, 98, 107295. [Google Scholar] [CrossRef]
  9. You, J.; Zhang, J. Improving mass transport in membrane electrode assembly. Joule 2025, 9, 101824. [Google Scholar] [CrossRef]
  10. Sun, F.; Su, D.; Li, P.; Dong, X. A novel 3D fine-mesh flow field design and performance analysis for proton exchange membrane fuel cells. J. Power Sources 2023, 584, 233572. [Google Scholar] [CrossRef]
  11. Li, H.; Nakajima, H.; Inada, A.; Ito, K. Effect of flow-field pattern and flow configuration on the performance of a polymer-electrolyte-membrane water electrolyzer at high temperature. Int. J. Hydrogen Energy 2018, 43, 8600–8610. [Google Scholar] [CrossRef]
  12. Olesen, A.C.; Romer, C.; Kaer, S.K. A numerical study of the gas-liquid, two-phase flow maldistribution in the anode of a high pressure PEM water electrolysis cell. Int. J. Hydrogen Energy 2016, 41, 52–68. [Google Scholar] [CrossRef]
  13. Choi, P.; Bessarabov, D.G.; Datta, R. A simple model for solid polymer electrolyte (SPE) water electrolysis. Solid State Ion. 2004, 175, 535–539. [Google Scholar] [CrossRef]
  14. Onda, K.; Murakami, T.; Hikosaka, T.; Kobayashi, M.; Notu, R.; Ito, K. Performance Analysis of Polymer-Electrolyte Water Electrolysis Cell at a Small-Unit Test Cell and Performance Prediction of Large Stacked Cell. J. Electrochem. Soc. 2002, 149, A1069. [Google Scholar] [CrossRef]
  15. Gorgun, H. Dynamic modelling of a proton exchange membrane (PEM) electrolyzer. Int. J. Hydrogen Energy 2006, 31, 29–38. [Google Scholar] [CrossRef]
  16. Xu, P.; Li, Q.; Wang, C.; Li, L.; Tan, D.; Wu, H. Interlayer healing mechanism of multipath deposition 3D printing models and interlayer strength regulation method. J. Manuf. Process. 2025, 141, 1031–1047. [Google Scholar] [CrossRef]
  17. Tan, Y.; Ni, Y.; Xu, W.; Xie, Y.; Li, L.; Tan, D. Key technologies and development trends of the soft abrasive flow finishing method. J. Zhejiang Univ.-Sci. A 2023, 24, 1043–1064. [Google Scholar] [CrossRef]
  18. Marangio, F.; Santarelli, M.; Cali, M. Theoretical model and experimental analysis of a high pressure PEM water electrolyser for hydrogen production. Int. J. Hydrogen Energy 2009, 34, 1143–1158. [Google Scholar] [CrossRef]
  19. Nie, J.; Chen, Y. Numerical modeling of three-dimensional two-phase gas-liquid flow in the flow field plate of a PEM electrolysis cell. Int. J. Hydrogen Energy 2010, 35, 3183–3197. [Google Scholar] [CrossRef]
  20. Zhang, Z.; Xing, X. Simulation and experiment of heat and mass transfer in a proton exchange membrane electrolysis cell. Int. J. Hydrogen Energy 2020, 45, 20184–20193. [Google Scholar] [CrossRef]
  21. Liu, H.; Li, P.; Hartz, A.; Wang, K. Effects of geometry/dimensions of gas flow channels and operating conditions on high-temperature PEM fuel cells. Int. J. Energy Environ. Eng. 2015, 6, 75–89. [Google Scholar] [CrossRef]
  22. Li, S.Z.; Chen, R.; Wang, H.; Liao, Q.; Zhu, X.; Wang, Z.; He, X. Numerical investigation of the moving liquid column coalescing with a droplet in triangular microchannels using CLSVOF method. Sci. Bull. 2015, 60, 1911–1926. [Google Scholar] [CrossRef]
  23. Karpenko, M. Aircraft hydraulic drive energy losses and operation delay associated with the pipeline and fitting connections. Aviation 2024, 28, 1–8. [Google Scholar] [CrossRef]
  24. Arvay, A.; French, J.; Wang, J.-C.; Peng, X.-H.; Kannan, A.M. Nature inspired flow field designs for proton exchange membrane fuel cell. Int. J. Hydrogen Energy 2013, 38, 3717–3726. [Google Scholar] [CrossRef]
  25. Zheng, J.; Mo, J. 3D model numerical simulation of reaction characteristics of PEM hydro-solution pool. Power Sources Technol. 2021, 45, 1401–1404, 1504. [Google Scholar] [CrossRef]
  26. Mench, M.M.; Wang, C.Y.; Ishikawa, M. In situ current distribution measurements in polymer electrolyte fuel cells. J. Electrochem. Soc. 2003, 150, A1052. [Google Scholar] [CrossRef]
  27. Zheng, J.; Kang, Z.; Han, B.; Mo, J. Three-Dimensional Numerical Simulation of the Performance and Transport Phenomena of Oxygen Evolution Reactions in a Proton Exchange Membrane Water Electrolyzer. Materials 2023, 16, 1310. [Google Scholar] [CrossRef]
Figure 1. Schematic diagram of hydrogen production process by electrolytic water.
Energies 18 02773 g001
Figure 2. Typical structure of PEM water electrolyzer.
Energies 18 02773 g002
Figure 3. Five forms of flow fields: (a) teardrop runners, (b) teardrop runners with baffles, (c) mosquito coil runners, (d) serpentine runners, (e) parallel runners.
Energies 18 02773 g003
Figure 4. Velocity distribution in different flow fields: (a) teardrop runners, (b) teardrop runners with baffles, (c) mosquito coil runners, (d) serpentine runners, (e) parallel runners.
Energies 18 02773 g004
Figure 5. Pressure distribution in different flow fields: (a) teardrop runners, (b) teardrop runners with baffles, (c) mosquito coil runners, (d) serpentine runners, (e) parallel runners.
Energies 18 02773 g005
Figure 6. Computational domain of the model: (a) mesh generation and (b) boundary conditions.
Energies 18 02773 g006
Figure 7. Effect of different grid numbers on (a) velocity and (b) pressure.
Energies 18 02773 g007
Figure 8. Comparison between simulation results and experimental data [18].
Energies 18 02773 g008
Figure 9. Effect of exchange current density on velocity and pressure in a flow channel.
Energies 18 02773 g009
Figure 10. Comparison of polarization curves of different exchange current densities. (a) The current density on the anode side is fixed at 0.0056 A/m2. (b) The current density on the cathode side is fixed at 0.19 A/m2.
Energies 18 02773 g010
Figure 11. Comparison of oxygen molar fraction at different exchange current densities. (a) The current density on the anode side is fixed at 0.0056 A/m2; (b) the current density on the cathode side is fixed at 0.19 A/m2.
Energies 18 02773 g011
Figure 12. Optimum operating conditions with different exchange current densities. (a) The current density on the anode side is fixed at 0.0056 A/m2. (b) The current density on the cathode side is fixed at 0.19 A/m2.
Energies 18 02773 g012
Figure 13. Influence of different widths of collector plate pipes on electrolytic cell performance. (a) The size of the collector tube is 3 mm; (b) the size of the branch tube is 2.77 mm.
Energies 18 02773 g013
Figure 14. Influence of water inlet speed on electrolytic cell performance: (a) experimental results and (b) simulation results.
Energies 18 02773 g014
Figure 15. Comparison of average speed before and after optimization.
Energies 18 02773 g015
Table 1. Geometric parameters of the model.
GeometryWidth (mm)Height (mm)Length (mm)
Anode/Cathode flow channel1140
Anode/Cathode diffusion layer400.240
Anode/Cathode catalyst layer400.0140
Proton exchange membrane400.0740
Table 2. Geometric parameters of the flow channel.
NameSize (mm)
S13.5
S214
S31
S46
S57
φ11.5
Table 3. Numerical model parameters.
ParametersSymbolValue
Reference pressure P r e f 1 at
Initial temperatureT353.15 K
Anode transfer coefficient α a 0.5
Cathode transfer coefficient α c 0.5
Porosity of diffusion layer ε g d l 0.6
Porosity of catalyst layer ε c l 0.5
Thermal conductivity of the diffusion layer k g d l 1 W/(m·K)
Thermal conductivity of the catalyst layer k c l 3 W/(m·K)
Conductivity σ s 750 S/m
Table 4. Numerical table of four-factor, three-level orthogonal experiment.
FactorLevel 1Level 2Level 3
Width of the current collecting pipe (mm)1.33.14
Width of the branch pipe (mm)12.74
Slot depth (mm)1.21.62
Flow velocity at the water inlet (m/s)0.81.31.5
Table 5. Orthogonal experimental designs.
GroupWidth of the Current Collecting Pipe (mm)Width of the Branch Pipe (mm)Slot Depth (mm)Flow Velocity at the Water Inlet (m/s)
11.31.01.20.8
21.32.71.61.3
31.34.02.01.5
43.11.01.61.5
53.12.72.00.8
63.14.01.21.3
74.01.02.01.3
84.02.71.21.5
94.04.01.60.8
Disclaimer/Publisher’s Note: The statements, opinions and data contained in all publications are solely those of the individual author(s) and contributor(s) and not of MDPI and/or the editor(s). MDPI and/or the editor(s) disclaim responsibility for any injury to people or property resulting from any ideas, methods, instructions or products referred to in the content.

