Article

Produced Water Use for Hydrogen Production: Feasibility Assessment in Wyoming, USA

Department of Energy and Petroleum Engineering, University of Wyoming, Laramie, WY 82071, USA
*
Author to whom correspondence should be addressed.
Energies 2025, 18(11), 2756; https://doi.org/10.3390/en18112756
Submission received: 31 March 2025 / Revised: 19 May 2025 / Accepted: 21 May 2025 / Published: 26 May 2025
(This article belongs to the Special Issue Advances in Hydrogen Energy IV)

Abstract

:
This study evaluates the feasibility of repurposing produced water—an abundant byproduct of hydrocarbon extraction—for green hydrogen production in Wyoming, USA. Analysis of geospatial distribution and production volumes reveals that there are over 1 billion barrels of produced water annually from key basins, with a general total of dissolved solids (TDS) ranging from 35,000 to 150,000 ppm, though Wyoming’s sources are often at the lower end of this spectrum. Optimal locations for hydrogen production hubs have been identified, particularly in high-yield areas like the Powder River Basin, where the top 2% of fields contribute over 80% of the state’s produced water. Detailed water-quality analysis indicates that virtually all of the examined sources exceed direct electrolyzer feed requirements (e.g., <2000 ppm TDS, <0.1 ppm Fe/Mn for target PEM systems), necessitating pre-treatment. A review of advanced treatment technologies highlights viable solutions, with estimated desalination and purification costs ranging from USD 0.11 to USD 1.01 per barrel, potentially constituting 2–6% of the levelized cost of hydrogen (LCOH). Furthermore, Wyoming’s substantial renewable-energy potential (3000–4000 GWh/year from wind and solar) could sustainably power electrolysis, theoretically yielding approximately 0.055–0.073 million metric tons (MMT) of green hydrogen annually (assuming 55 kWh/kg H2), a volume constrained more by energy availability than water supply. A preliminary economic analysis underscores that, while water treatment (2–6% LCOH) and transportation (potentially > 10% LCOH) are notable, electricity pricing (50–70% LCOH) and electrolyzer CAPEX (20–40% LCOH) are dominant cost factors. While leveraging produced water could reduce freshwater consumption and enhance hydrogen production sustainability, further research is required to optimize treatment processes and assess economic viability under real-world conditions. This study emphasizes the need for integrated approaches combining water treatment, renewable energy, and policy incentives to advance a circular economy model for hydrogen production.

1. Introduction

Hydrogen is a key enabler of global decarbonization, playing a pivotal role in the transition to a sustainable energy future [1]. The US Department of Energy (DOE) has outlined an ambitious vision for clean hydrogen through its National Clean Hydrogen Strategy and Roadmap, aiming to scale up clean hydrogen production and utilization across the country [2]. Legislative initiatives, such as the Bipartisan Infrastructure Law and the Inflation Reduction Act, have provided substantial funding and incentives [3], paving the way for large-scale deployment. These efforts align with the DOE’s targets of 10 million metric tons (MMT) of clean hydrogen annually by 2030 and 50 MMT by 2050, emphasizing hydrogen’s growing significance in achieving energy market competitiveness [4].
One of the most transformative initiatives is the Hydrogen Shot program, which sets a bold objective: “$1 per 1 kg of clean hydrogen in 1 decade” [5]. This cost-reduction strategy underscores hydrogen’s potential to revolutionize multiple sectors by providing a scalable, clean, and cost-effective energy source. The impact on emissions is substantial, with projections indicating that clean hydrogen could reduce US carbon emissions by approximately 10% by 2050 compared to 2005 levels.
Among the various hydrogen production methods, electrolysis has emerged as a critical technology, with the potential to meet over 90% of hydrogen demand by 2030 [6]. Unlike conventional hydrogen production techniques, such as steam methane reforming (SMR) and coal gasification, which generate significant carbon emissions, green hydrogen refers to the hydrogen produced through renewable-powered electrolysis process or biomass gasification, offering a carbon-free alternative [7]. Electrolysis not only supports long-duration energy storage but also enhances grid stability and integrates with renewable energy sources, making it a cornerstone of the clean-energy transition [8].
Achieving the Hydrogen Shot goal requires substantial investments in clean hydrogen infrastructure, including initiatives such as the Clean Hydrogen Electrolysis Program, Clean Hydrogen Manufacturing and Recycling RDD&D, Regional Clean Hydrogen Hubs, and the Clean Hydrogen Production Standard. These programs collectively form a comprehensive strategy for hydrogen deployment.
While clean-hydrogen production relies on renewable electricity, the availability of suitable water feedstock for electrolysis remains a critical challenge. Freshwater resources, which make up only 1% of the planet’s water supply [9], are already under stress from competing demands, including irrigation and oil and gas operations, where hydraulic fracturing consumes 3–6 million gallons of freshwater per well [10]. Additionally, drought-prone regions in the US face increasing water scarcity (Figure 1 and Figure 2) [11]. To mitigate this challenge, several studies have explored the feasibility of using low-quality and non-traditional water sources, including treated wastewater and seawater desalination, for electrolysis [12].
Using produced water instead of fresh water to make hydrogen through electrolysis is a promising idea, but produced water contains impurities that cause problems. One way to use it is to clean the produced water thoroughly first using methods like ultrafiltration (UF) and reverse osmosis (RO) [13], making it pure enough for standard electrolyzers, although this adds complexity and cost [14]. Studies show that directly using treated produced water works, but hydrogen production is lower because of impurities like cloudiness (turbidity) and dissolved salts (TDS); however, simple UF treatment helps significantly (Chauhan and Ahn (2023) [15]). A more direct approach uses special forward osmosis (FO) membranes to pull clean water out of the wastewater right into the electrolyzer system, achieving very fast hydrogen production with less pre-treatment needed (Cassol et al. (2024) [16]).
Other methods change the electrolysis process itself. Instead of making oxygen at one electrode (which uses a lot of energy), researchers use reactions that break down pollutants found in the wastewater. This “hybrid electrolysis” uses less energy to make hydrogen at the other electrode and cleans the water at the same time. Some systems even turn waste materials like sulfur compounds, urea, or simple organics into useful chemicals alongside hydrogen production, sometimes using light to help (photoelectrocatalysis) [17]. Another approach combines water electrolysis with microbial fuel cells (creating MWECs). Bacteria help break down waste to generate some electricity, which assists the electrolysis process, leading to efficient hydrogen production and waste removal simultaneously, even protecting the helpful microbes [18]. These different strategies show there are many ways to potentially use wastewater for making hydrogen while also addressing water treatment needs [19].
This study proposes an alternative approach: utilizing produced water from oil and gas operations in Wyoming for hydrogen production via electrolysis. Wyoming generates over 1 billion barrels (159 GL) of produced water annually, which is typically reinjected into disposal wells or treated for reuse. By repurposing this water for green hydrogen production, this approach aligns with the DOE’s clean-hydrogen vision while addressing concerns about freshwater availability [20].
The following sections provide an overview of
  • Oil and gas activities in Wyoming, including production volumes and major basins;
  • Chemical analysis of produced water and its suitability for electrolysis;
  • Feasibility of water treatment to meet electrolysis standards;
  • Renewable-energy potential for supporting hydrogen production in Wyoming.
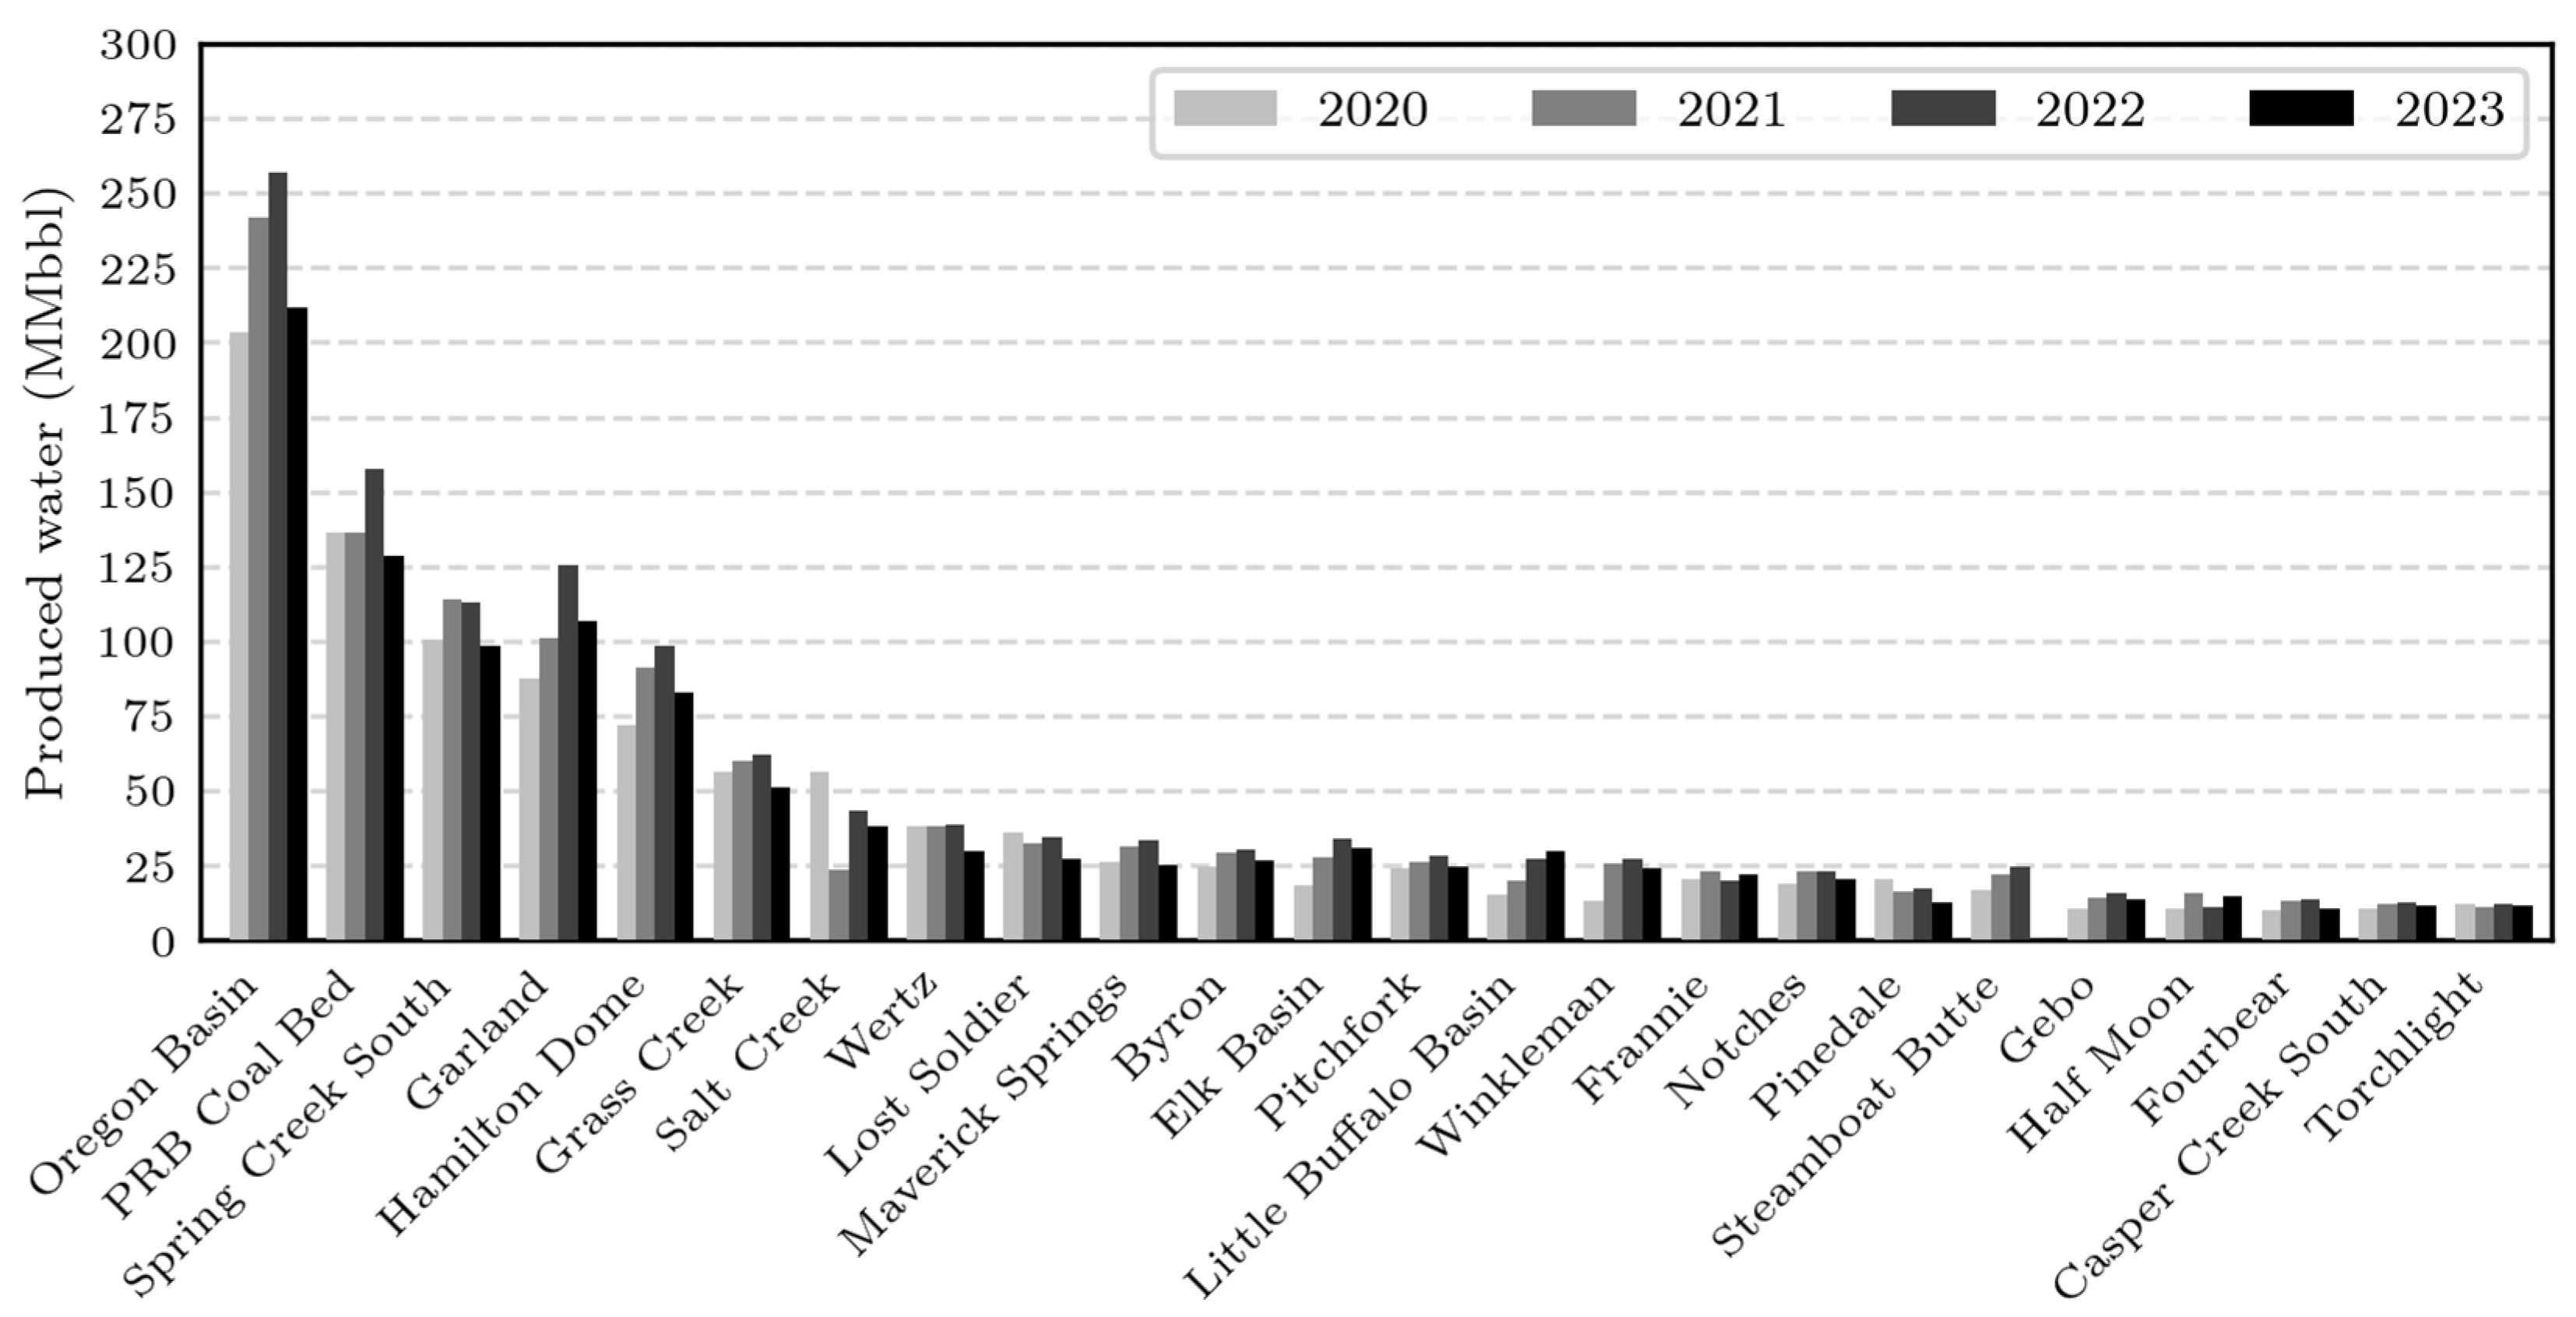
Figure 1. Continental US percent area in US drought monito categories [21].
Energies 18 02756 g001
Figure 2. Wyoming drought data [21].
Energies 18 02756 g002
By integrating water-resource management with clean hydrogen production, this study aims to advance a sustainable, large-scale hydrogen economy while minimizing freshwater consumption.

2. Area of Study

This study focuses on the state of Wyoming, necessitating an overview of its oil and gas production. Wyoming hosts eight producing basins: the Greater Green River (which includes two sub-basins), Powder River, Bighorn, Wind River, Denver, Laramie, Overthrust, and Hanna basins (Figure 2). Among these, the four primary producing basins—Greater Green River, Powder River, Wind River, and Bighorn—are of particular significance. These basins exhibit distinct geological characteristics that influence hydrocarbon accumulation and water production. The following sections provide a geological summary and production insights for each.

2.1. Powder River Basin

The Powder River Basin encompasses both structural and energy basins, featuring formations with varying dips and Laramide structural deformation. Hydrocarbon fields predominantly occur within stratigraphic traps or basin-bounding anticlinal structures, particularly in Paleozoic and lower-Mesozoic strata [22,23]. The Tensleep Sandstone and Minnelusa Formation serve as the primary oil-producing reservoirs.

2.2. Wind River Basin

The Wind River Basin, an east–west elongate Laramide-style basin, experienced significant deformation during the Laramide orogeny, leading to deep structural features. Hydrocarbon accumulation occurs in structural traps such as domes and anticlines, primarily along basin margins [23]. Additionally, stratigraphic traps, including facies changes and sandstone pinch-outs, contribute to hydrocarbon entrapment.

2.3. Greater Green River Basin

Spanning Wyoming, Utah, and Colorado, the Greater Green River Basin formed during the Laramide orogeny and comprises multiple sub-basins. This basin contains sedimentary deposits up to 9144 m thick, with anticlinal traps serving as the dominant hydrocarbon reservoirs. The Jonah Gas Field is a notable example of a high-yield field within this basin. Cretaceous formations act as the primary hydrocarbon source, though stratigraphic traps are relatively uncommon [24].

2.4. Bighorn Basin

The Bighorn Basin, a northwest-trending structural basin in north-central Wyoming, is characterized by a thick sequence of Paleozoic, Mesozoic, and Cenozoic rocks, exceeding 7620 m in depth. The basin formed during the Late Cretaceous to Early Eocene Laramide orogeny and it is dominated by oil-producing anticlines, generated through compressional stress. The Phosphoria Formation is the primary hydrocarbon source, with both structural and stratigraphic traps in Paleozoic and Cretaceous reservoirs [25].
From Figure 3 (right), it can be seen that the Greater Green River Basin exhibits the highest level of oil and gas activity, with over 94% of its wells producing natural gas. The Powder River Basin follows, featuring a nearly equal distribution of oil and gas wells. In contrast, the Bighorn and Wind River Basins exhibit significantly lower exploration and production activity, with minimal well development in the remaining basins.
While Wyoming was selected as the study area due to its direct relevance to the authors’ research, it also presents a notable advantage regarding produced water composition. Compared to other major oil- and gas-producing states, Wyoming’s produced water exhibits significantly lower salinity levels (Figure 3). Electrolysis requires high-purity water as a feedstock, necessitating pre-treatment steps such as reverse osmosis (RO). However, high-salinity water poses challenges for the RO process, including increased energy consumption due to higher operating pressure requirements, reduced salt rejection impacting water purity, and membrane fouling [26], which degrades system performance and raises maintenance costs. Consequently, utilizing lower-salinity produced water—as found in Wyoming—could reduce water-treatment energy costs and could improve the overall feasibility of electrolysis-based hydrogen production. This characteristic of lower salinity compared to other regions [6,7] could potentially lessen the pre-treatment burden for electrolysis, a factor explored further in Section 4.

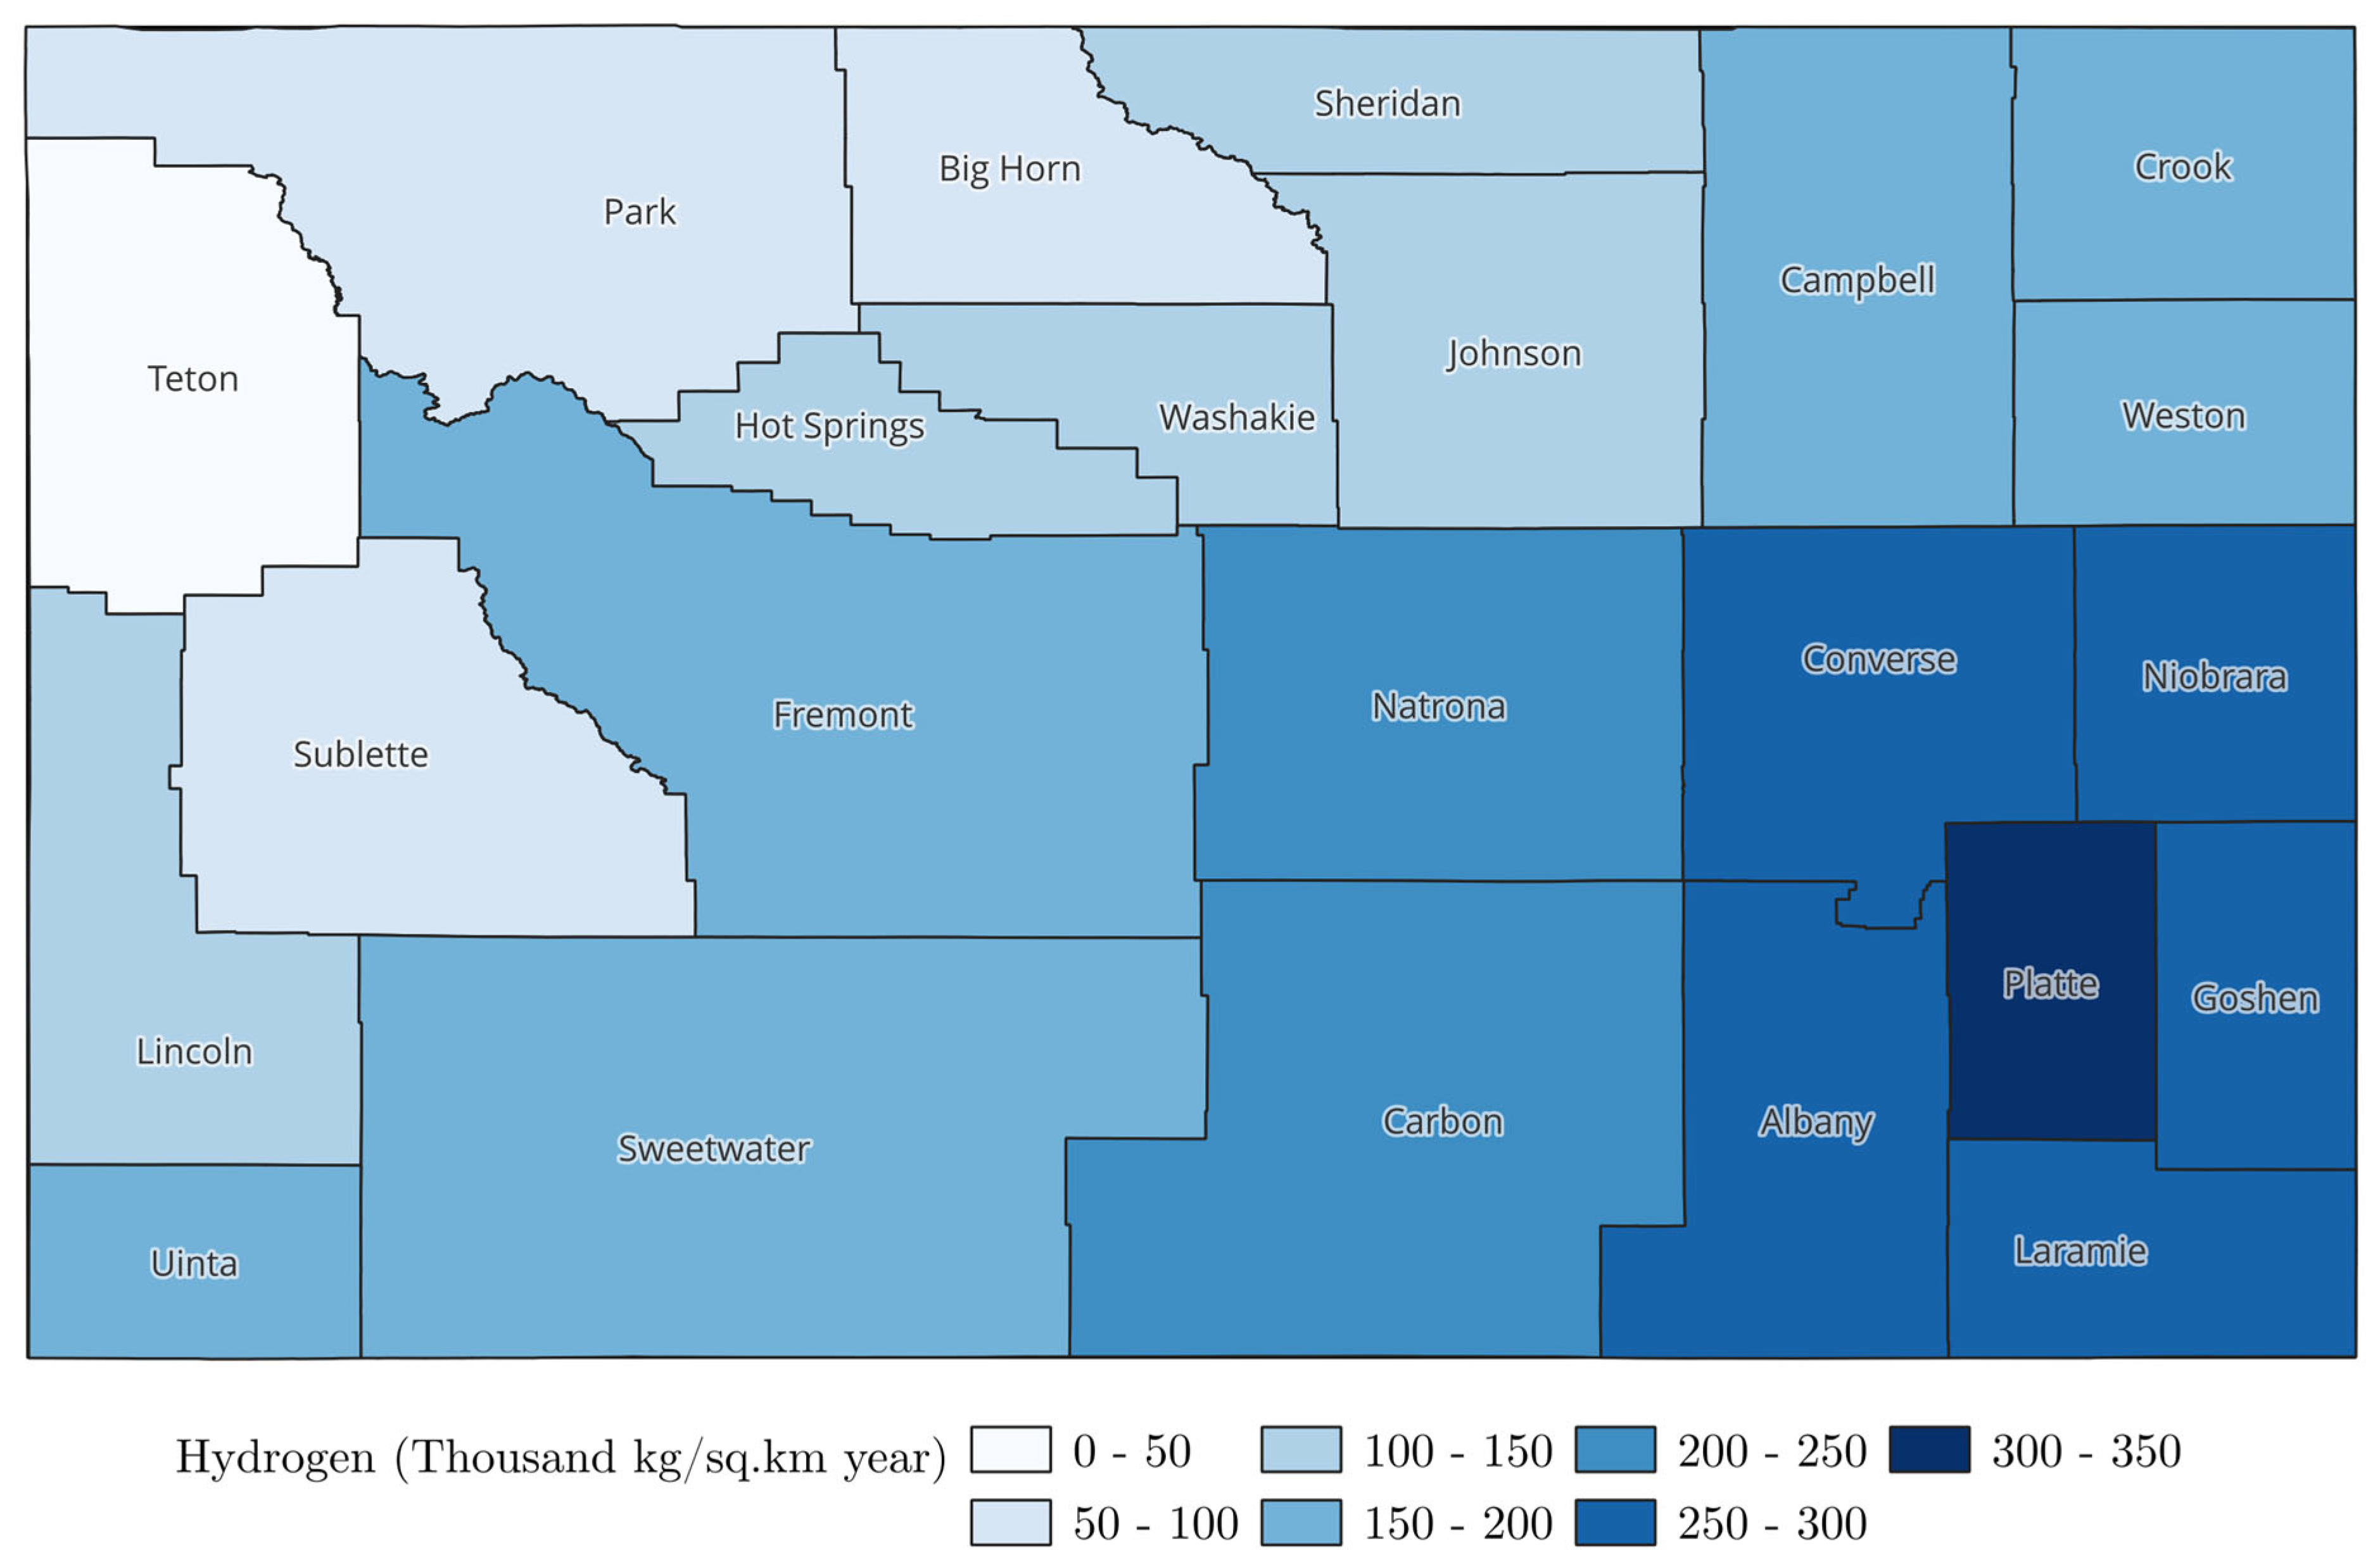
3. Geospatial Analysis of Produced Water

It is important to note that this study relies exclusively on the analysis of existing, publicly available datasets obtained from the Wyoming Oil and Gas Conservation Commission (WOGCC), including production reports and historical water analyses. Therefore, no new field sampling or laboratory analyses were conducted as part of this study, and details regarding specific historical sampling protocols or analytical methods (including QA/QC or interference handling like that for X-Ray Fluorescence—XRF) employed by operators submitting data to WOGCC are generally not available within these datasets [27].
Understanding the spatial distribution and production trends of produced water is crucial for assessing its feasibility as a feedstock for electrolysis. In this study, well-index data, monthly production reports, and water-analysis datasets were obtained from the Wyoming Oil and Gas Conservation Commission (WOGCC) to analyze water-production patterns across the state. WOGCC production data are comprehensive as it is the primary regulatory agency in the state to which all companies report directly.
Analyzing individual wells introduces excessive variability and noise due to differences in reservoir characteristics, production history, and operational factors. Conversely, data aggregation at the field level offers an optimal balance between granularity and generalization. Unlike county- or basin-level aggregation, which can obscure localized trends due to its large geospatial span, field-level aggregation is a good middle-ground that retains meaningful spatial and production variability while smoothing out well-level fluctuations. Any real project that aims to exploit produced water from oil and gas wells will most probably be on a field-level rather than well-level or basin-level, hence our choice for data aggregation.
Figure 4 presents the salinity distribution of produced water across the US, measured in total dissolved solids (TDS). For context, seawater has an average salinity of approximately 35,000 ppm. Wyoming’s produced water generally exhibits lower salinity levels compared to other major oil- and gas-producing states, which enhances its suitability for electrolysis by reducing the energy and cost burden of desalination.
Figure 5 and Figure 6 illustrate cumulative produced water volumes across Wyoming’s top-producing fields. Specifically, Figure 5 displays yearly cumulative water production for the highest-producing fields in 2023. To ensure statistical significance, only fields with cumulative production exceeding 10 million barrels (MMbbl) were considered, representing the top 2% of fields. These fields collectively account for over 80% of the state’s total produced water volume, making them the primary contributors to any large-scale water utilization strategy. This spatial analysis identifies high-yield fields and potential clusters, providing essential input for locating future hydrogen-production facilities to minimize water-transport costs.

4. Electrolysis and Produced Water as a Feedstock

In this section, we will provide a brief introduction to the electrolysis process for green hydrogen production and different types of electrolyzers, and we will discuss the effect of impurities and finally assess produced water suitability for electrolysis.

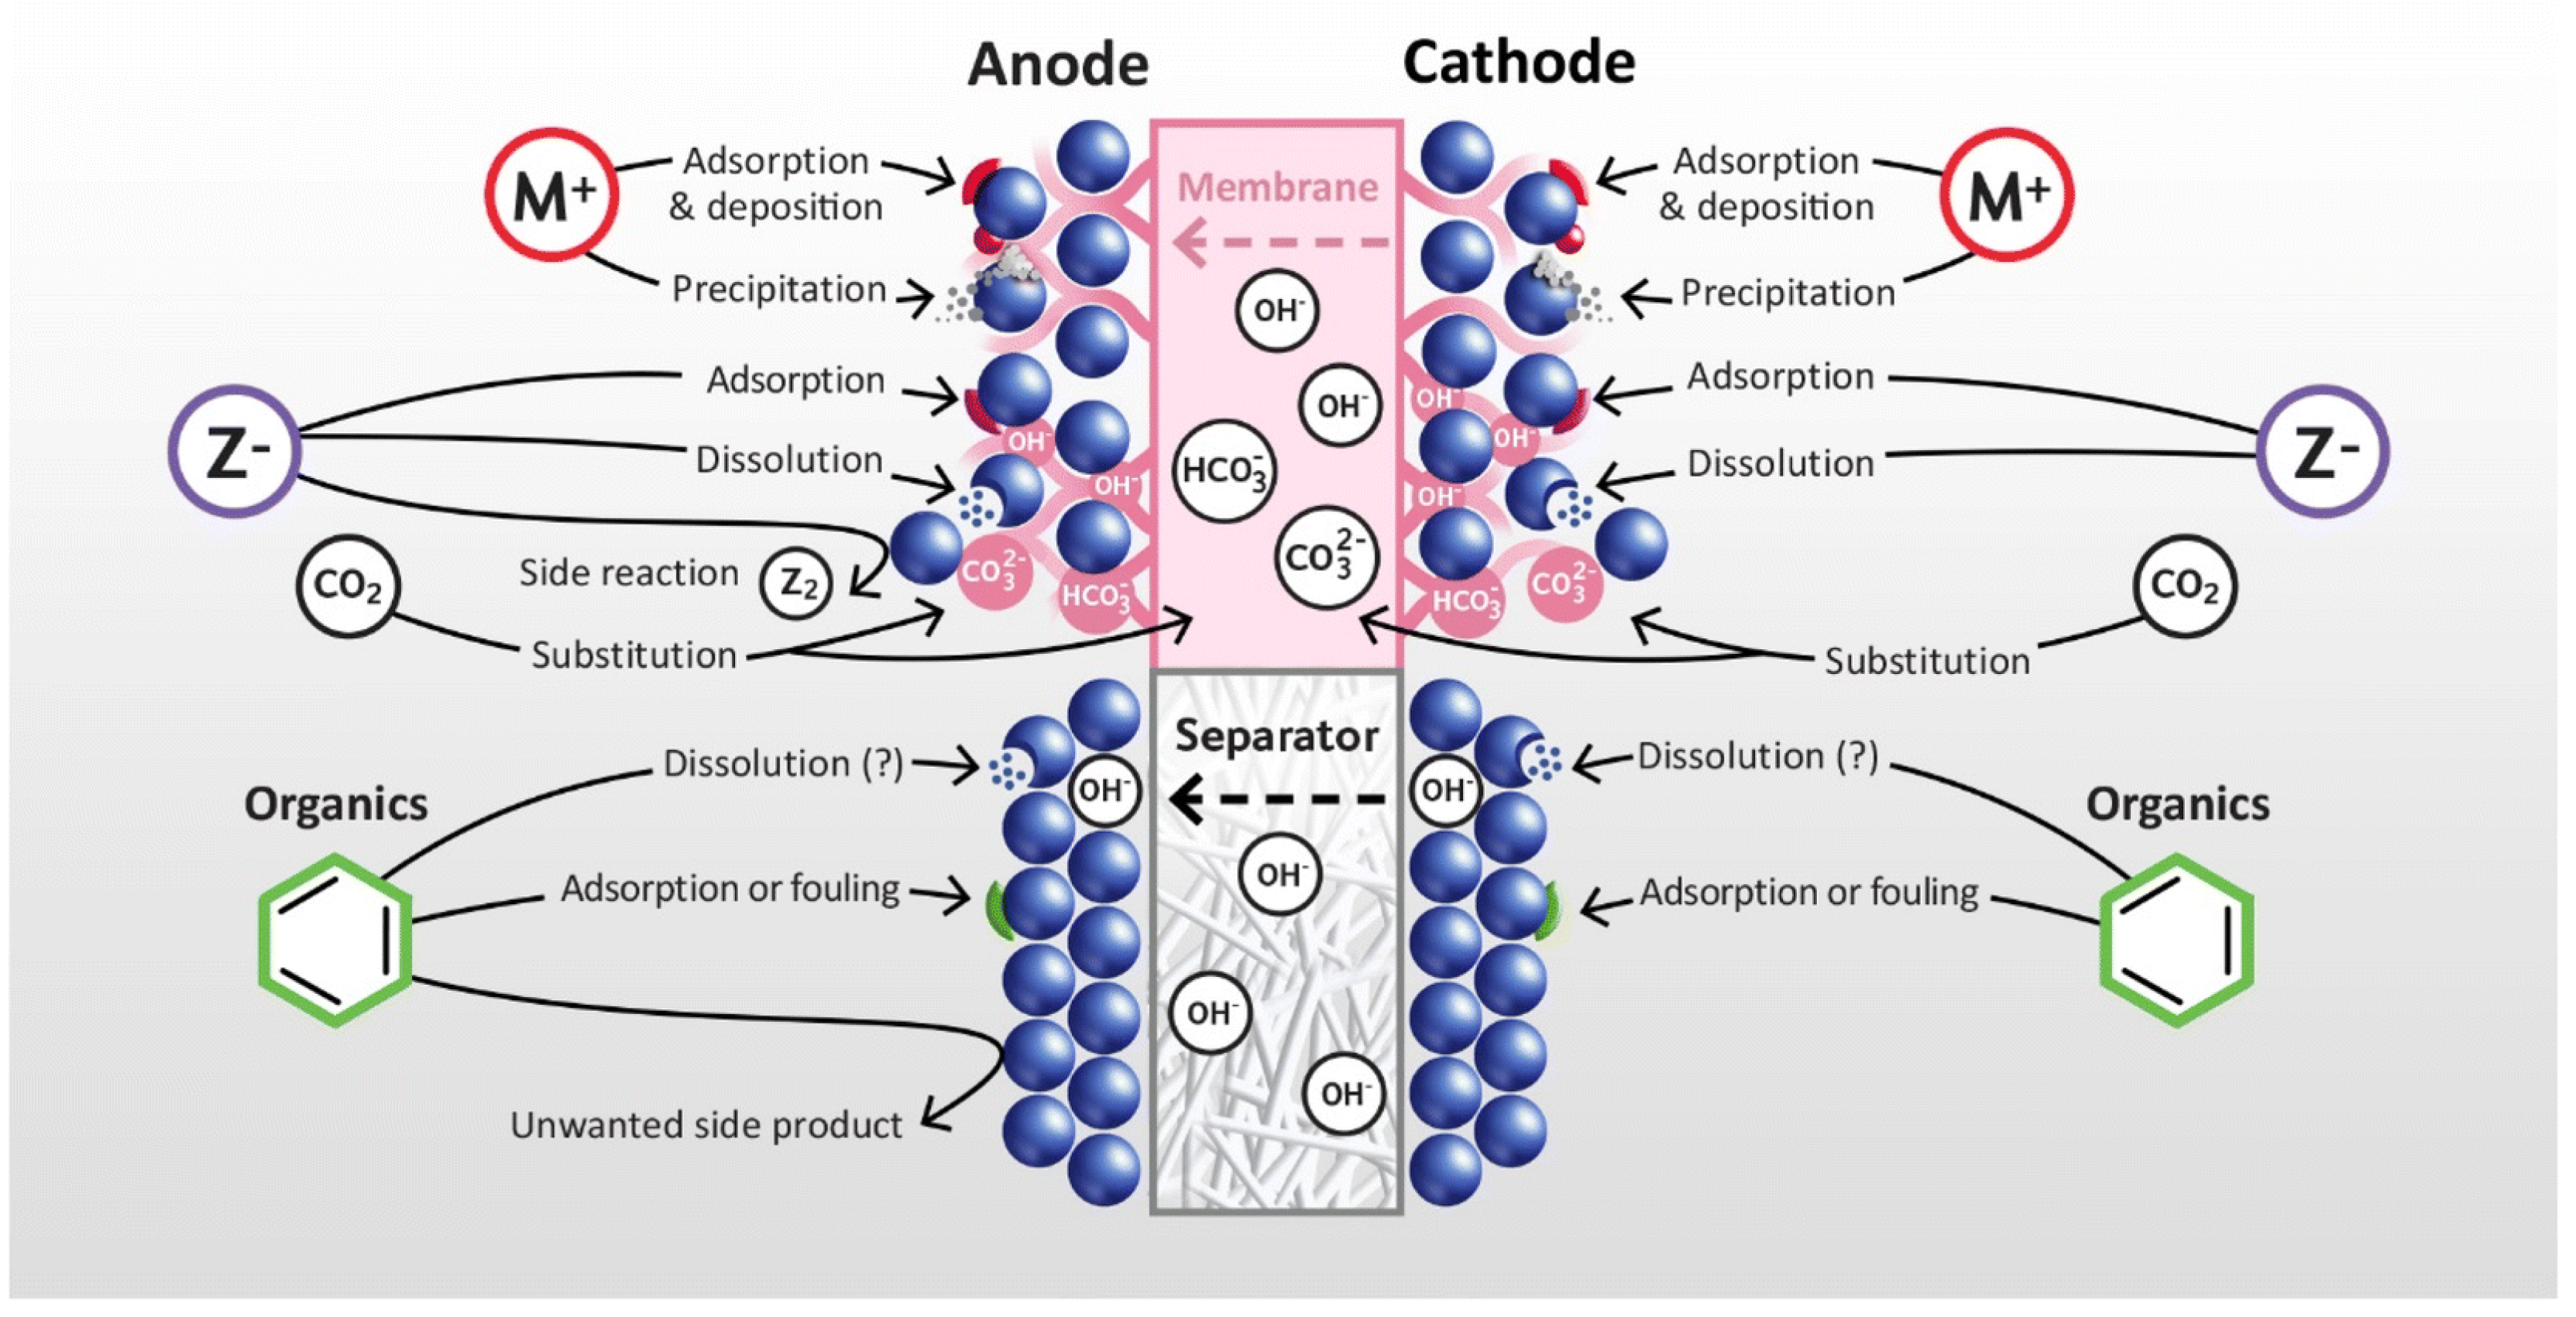
4.1. The Electrolysis Process

Electrolysis is a process wherein electrical energy is utilized to drive a non-spontaneous chemical reaction, typically involving the decomposition of a substance, into its constituent elements or ions. This electrochemical technique is commonly employed to produce hydrogen and oxygen from water as described by Equation (1) [5].
H 2 O + E l e c t r i c i t y   ( 237.2   k J m o l 1 ) + Heat   ( 48.6   kJ   m o l 1 )   H 2 + 1 2 O 2
Different types of electrolyzers are utilized in the electrolysis processes, which can be split into three categories based on their electrolyte, operating conditions, and their ionic agents [8]. A critical distinction between these technologies lies in their material requirements, which significantly impacts the electrolyzer’s capital cost (CAPEX) and, consequently, the overall Levelized Cost of Hydrogen (LCOH).

4.1.1. Proton Exchange Membrane Water Electrolyzers (PEMWE)

Proton exchange membrane water electrolysis (PEMWEs) utilize thin perfluorosulphonic acid (PFSA) membranes (100–200 µm thick) for efficient separation between anode and cathode electrodes. These membranes, with a hydrophobic polytetrafluoroethylene (PTFE) backbone, ensure high ionic conductivity and physical isolation of produced hydrogen and oxygen. Electrodes contain platinum group metal (PGM) electrocatalysts, with platinum at the cathode and iridium oxide or mixed metal oxides at the anode, necessary for high activity in the acidic environment. Titanium-based porous transport layers (PTLs) and bipolar plates (BPPs) are required to support electrodes, manage flow, and resist corrosion, often with platinum coatings reducing contact resistance. While PEMWE offers high performance (efficiency, current density, dynamic response), the mandatory use of these expensive PGM catalysts and corrosion-resistant titanium components significantly elevates the electrolyzer stack’s capital cost (CAPEX). This high material cost is a primary barrier to reducing the LCOH and achieving widespread cost-competitiveness for PEMWE.

4.1.2. Alkaline Water Electrolyzers (AWEs)

Alkaline water electrolyzers (AWEs) employ potassium hydroxide solutions (20–50 wt%) for ionic conductivity between anode and cathode electrodes. Zifron, a chemically inert separator made of zirconia and polysulphone or other diaphragm materials, aids gas separation and ionic conductivity. The electrodes typically consist of stable, earth-abundant transition metals, like porous bulk nickel coated with catalysts [29]. The ability to use these inexpensive catalysts and conventional structural materials (like steel) allows AWEs to achieve significantly lower stack capital costs (CAPEX) compared to PEMWEs. AWEs, having existed for nearly a century, use a zero-gap configuration in recent advancements. While operating typically at a lower current density (1 A/ c m 2 ) compared to PEMWEs and having larger footprints than membrane-based electrolysers, potentially increasing the balance of plant costs and slightly reducing efficiency, thus impacting OPEX, their low material costs and proven durability, often cited as 20+ years, make them commercially established technology for large-scale hydrogen production.

4.1.3. Anion Exchange Membrane Water Electrolyzers (AEMWE)

Anion exchange membrane water electrolyzers (AEMWEs) share a similarity with PEMWEs in using a membrane but are in earlier development stages and use an anion exchange membrane (AEM) to separate anodes and cathodes. Typically employing hydrocarbon polymers with quaternary ammonium or other cationic groups, AEMs vary in chemistry. Operation in an alkaline environment (either via the membrane itself or sometimes with a dilute electrolyte) theoretically allows for the use of PGM-free, lower-cost catalysts (e.g., nickel, cobalt or iron-based) and a potentially cheaper balance of plant components compared to PEMWEs. AEMWEs aim to offer benefits similar to PEMWEs but with significantly reduced material costs approaching those of AWEs, thereby holding great promise for lowering the LCOH. The current literature reports AEMWEs operating around 60 °C and producing pure hydrogen at performance benchmarks like 2 A/ c m 2 and 1.9 V, with fast response times and small footprints. However, significant challenges remain, particularly concerning the relatively slow hydrogen evolution reaction kinetics in alkaline media, and, critically, the limited long-term durability and performance stability of current AEMs, ionomers, and non-PGM catalysts under operating conditions. Overcoming these hurdles through advancements in membranes, ionomers, and catalysts is essential for AEMWEs to realize their cost-reduction potential and achieve commercial viability [30].
The selection of an electrolyzer technology significantly impacts both the material costs and the overall hydrogen-production costs. PEM electrolyzers, despite offering high current densities and compact designs, involve expensive components such as platinum and iridium, making their capital costs relatively high (approximately USD 1000–USD 1800/kW) [31]. AWE systems, relying mainly on nickel-based electrodes and alkaline solutions, are less expensive (around USD 800–USD 1200/kW) and benefit from long lifespans but they require larger footprints and slower dynamic responses. AEM electrolyzers offer the potential to combine the low-cost materials of AWEs with the compactness of PEM, but remain at earlier development stages, with performance and durability limitations.
As a result, hydrogen production costs from AWEs tend to be lower in large-scale and steady operations, whereas PEM is favored for applications requiring flexibility, high-purity hydrogen, and smaller system sizes, albeit at a higher cost. AEM technology presents a promising low-cost pathway but requires further technical maturity to compete with commercial PEM and AWE systems.
The quality of water serving as feedstock for electrolysis is a critical factor influencing the efficiency and durability of the electrolysis process. High-purity water is often preferred to minimize the presence of impurities.
Impurities affecting electrolysis efficiency can originate from two sources: exogenous (carried by the feed water) or endogenous (arising within the electrolyzer). These impurities are broadly grouped into three main categories: cationic, anionic, and organic. Each category impacts different electrolysis technologies in distinct ways [32]. In PEMWE, cationic impurities can severely degrade the electrolyzer performance through the reduction of the membrane’s proton conductivity, deposition on the cathode, or by reacting with the membrane and causing membrane thinning. Anionic impurities can reduce the active surface area by adsorption on catalyst surfaces, cause fouling, and corrode metallic components. Organic impurities can oxidize at the anode and produce carbon monoxide and dioxide, lowering the quality of hydrogen and adsorption at the catalyst surface, lowering electrolysis efficiency. In AWEs and AWEMWEs, certain cationic impurities can adsorb and reduce the catalyst active surface area. Carbon dioxide can diffuse into the cell, forming anionic impurities, lowering the cell’s ionic conductivity. Organic impurities can also oxidize at the anode, lowering produced-hydrogen quality [32]. These effects are summarized in Figure 7 and Figure 8.
The quantitative requirements for the quality of water that will serve as a feedstock to the electrolysis process are not readily provided by manufacturers. For the purpose of this study, we used water specifications for the HyLYZER PEM electrolyzer from Hydrogenics Corporation as a rule of thumb (Table 1) [33]. It is important to note that these specific limits may vary for other manufacturers or electrolyzer types. International standards (e.g., ISO 22734) primarily focus on the purity of the produced hydrogen or define general input water categories (like Type I/II water based on conductivity/resistivity), rather than providing comprehensive maximum allowable limits for specific ionic contaminants like those listed here. Therefore, Table 1 serves as an illustrative benchmark for assessing the degree of treatment likely required. It must be noted that this unit is equipped with an integrated water-treatment system, and these specifications are for the feed water entering this treatment system.
Produced water, irrespective of its initial quality, requires treatment and purification to be suitable as an electrolyzer feedstock. While this universal need for treatment might seem to lessen the importance of assessing its initial quality, the characteristics of the raw produced water significantly impact treatment complexity and cost. Specifically, high-salinity and highly contaminated produced water presents greater challenges for achieving efficient and cost-effective treatment. Membrane fouling is often the limiting factor influencing the long-term operation of UF/MF membranes, and it greatly depends on water quality, operational conditions, and membrane properties. Severe membrane fouling has been found when certain types of produced water are filtered using MF/UF [34].
Despite high removal rates for most contaminants in the produced water by RO, the concentrations of chloride and boron, as well as the sodium adsorption rate (SAR) in the RO permeates, exceeded irrigation guidelines. Studies have observed the passage of surfactants with molecular weights much higher than the molecular weight cutoff of NF and RO membranes, suggesting that membranes are not an absolute barrier to organic contaminants [35].
Additionally, treatment methods usually generate large amounts of byproducts, such as reverse osmosis concentrate (ROC) in the case of reverse osmosis, which has a very high salinity and organic impurities concentration, posing serious environmental issues and requiring further treatment or disposal, ultimately increasing operational cost and complexity [36].
Furthermore, the management and disposal of these concentrated brines and potentially contaminated sludges represent significant environmental challenges that require careful consideration and potentially additional treatment steps or specialized disposal methods, such as deep well injection (for brines, where permitted) or Zero Liquid Discharge (ZLD) technologies.
Addressing the high salinity of produced water typically involves desalination technologies. Reverse Osmosis (RO) is widely used, employing high pressure to force water through semi-permeable membranes, achieving high salt rejection but remaining susceptible to fouling by organics and scaling and requiring significant energy, especially for high TDS water. Electrodialysis (ED/EDR), which uses ion-exchange membranes and an electric field to separate ions, can be more energy-efficient for moderately saline waters (<10,000–15,000 ppm TDS) and is less sensitive to non-ionic foulants, but may require more extensive pre-treatment for PW containing organics or scaling ions. Capacitive Deionization (CDI) uses electrodes to adsorb ions and is emerging as a potentially lower-energy option for brackish water desalination, but its effectiveness for high TDS produced water and robustness for complex PW matrices is still under investigation. The optimal choice depends heavily on the specific PW characteristics (salinity, key contaminants), required purity, recovery rate, and local economic factors.

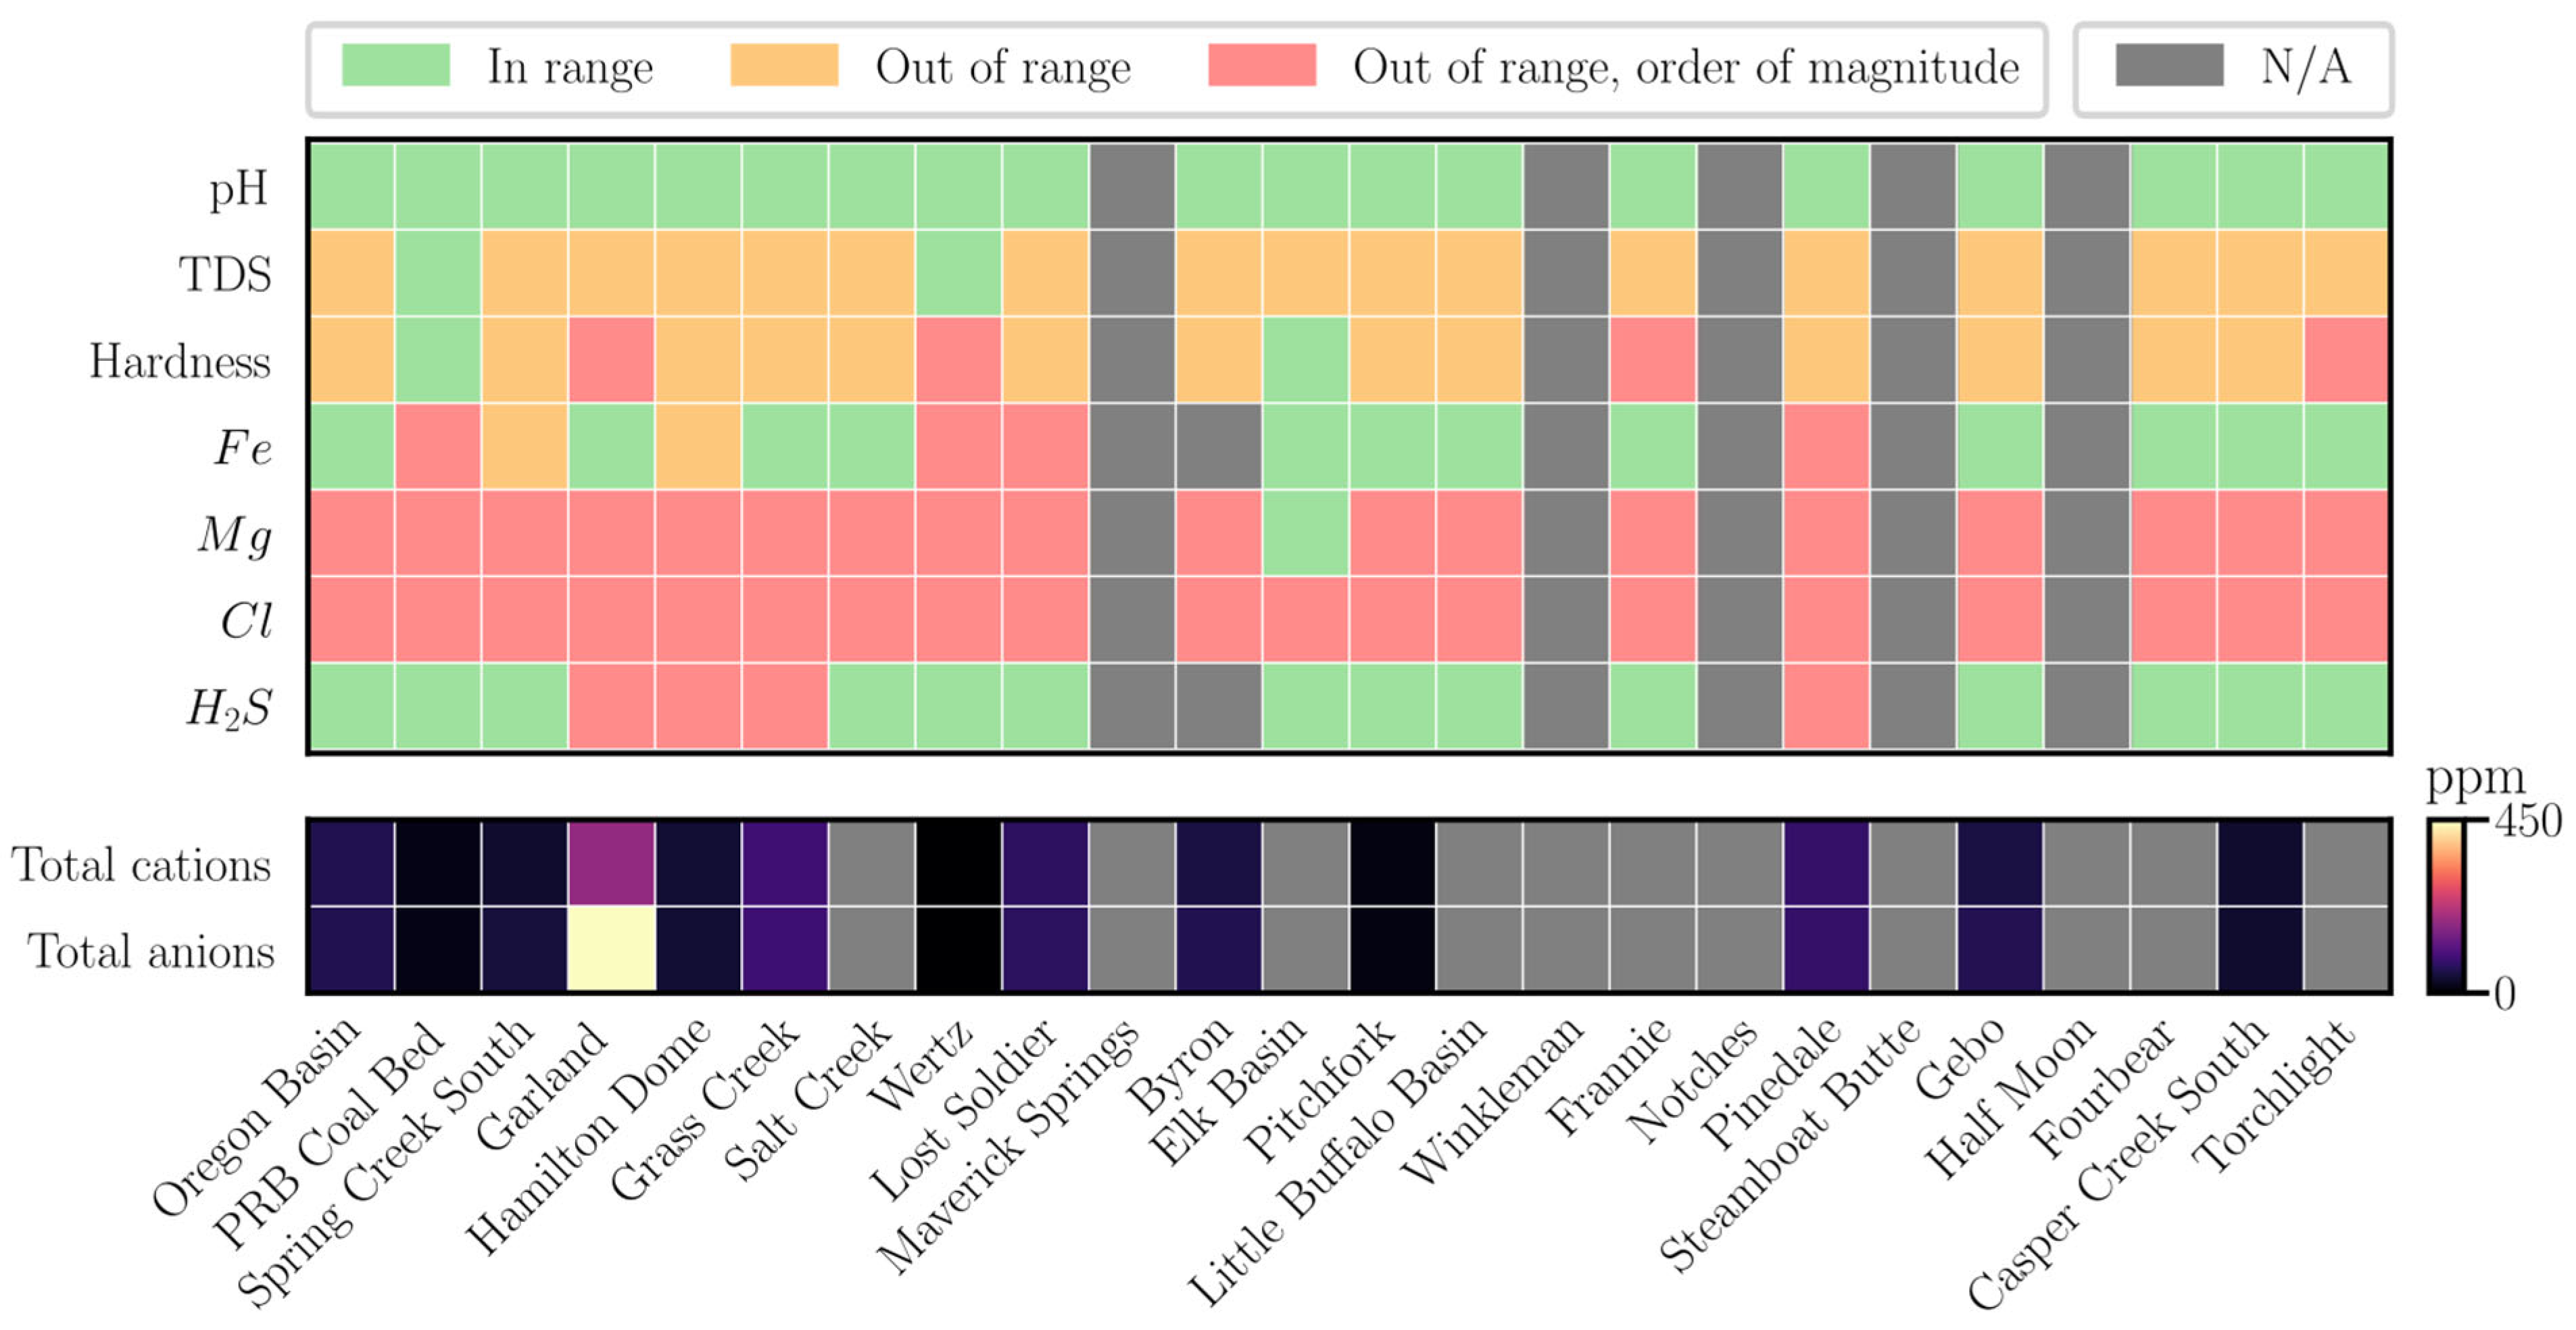
4.2. Water Analysis Results

To evaluate the suitability of Wyoming’s produced water against typical electrolyzer feedstock standards (Table 1), a detailed analysis of available water quality data from WOGCC was conducted at the field level. This assessment identifies common contaminants exceeding limits and highlights fields potentially requiring less intensive treatment. As with produced water volumes, we aggregated water analysis results per field and calculated the mean of all wells for which data were available. Hardness was calculated from the calcium and magnesium concentrations using the equation
[ Ca C O 3 ] = 2.5   ×   [ C a 2 + ] + 4.1   ×   [ M g 2 + ]  
and is expressed as the equivalent of calcium carbonate. The average of each field was compared to the electrolysis water requirements from Table 1. We determined whether the value of each property fell within the acceptable range, outside the acceptable range by up to an order of magnitude, or outside the acceptable range by at least an order of magnitude. Missing data were marked as not available (N/A). Since cationic and anionic impurities also greatly affect efficiency and longevity of electrolyzers, these were also summarized. Fields were ordered by the produced water volume in accordance with Figure 4.
It should be noted that the available public water quality dataset often contains limited sample numbers per field for many parameters. While field averages are presented, calculating robust statistical variability metrics like confidence intervals or standard deviations across all fields and parameters was not feasible with the current dataset and represents a limitation of this analysis based on existing public data. The results are summarized in Figure 9.
A significant portion of the water samples fell outside the required range for electrolysis, with many parameters exceeding the acceptable limits (red and orange). Several fields lacked complete water composition data (gray cells), limiting a full assessment of their suitability. High concentrations of cationic and anionic impurities (visible in the lower section) suggest that extensive pretreatment will likely be required for most fields to make the water usable for hydrogen production via electrolysis. However, some fields contain water that naturally meets more of the electrolysis standards (green or fewer orange cells), representing potential low-treatment—burdensources for hydrogen production. These results emphasize the necessity of site-specific water-treatment strategies before using produced water for electrolysis, particularly for fields where multiple parameters exceed permissible levels. This assessment confirms the necessity for pre-treatment but also pinpoints fields where water quality is comparatively better, guiding targeted treatment strategies crucial for managing costs and ensuring the technical feasibility of using produced water. It is also critical to recognize that while lower overall salinity (TDS) reduces the energy required for bulk desalination compared to hypersaline waters, it does not necessarily simplify the removal of specific challenging contaminants often found in PW. For instance, elements like boron can be difficult to remove effectively with standard RO, and residual hydrocarbons or dissolved organic compounds may require dedicated treatment steps such as activated carbon adsorption or advanced oxidation processes. Therefore, Wyoming’s lower salinity offers a distinct advantage for the primary desalination stage but does not negate the need for a potentially complex, multi-barrier treatment train tailored to the specific contaminant profile.

4.3. Hydrogen Production Volumes: An Estimation

As a final step, we estimated potential hydrogen production by integrating produced water volumes with renewable-energy availability. Renewable-energy potential was determined from combined solar, wind, and biomass sources. The results were then expressed in terms of a thousand kilograms of hydrogen per square kilometer per year at the county level (Figure 10). To achieve this, we integrated solar energy (annual irradiance and land area suitability), wind energy (capacity factors derived from wind-speed distributions), and biomass availability (residual agricultural and forestry biomass potential).
This spatially resolved approach allowed a comparative analysis of regional hydrogen-production capacities and highlighted key areas for potential development.
Figure 10 presents a county-level hydrogen-production potential map, where darker shades of blue indicate a higher production capacity. This NREL study estimated the US county-level potential for hydrogen production from key renewable resources (onshore wind, solar PV, biomass) using GIS analysis. Researchers first applied environmental and land-use exclusions to determine technically available resource areas. They then calculated potential hydrogen yield by assuming specific conversion pathways: electrolysis for wind and solar-generated electricity (using an efficiency of 58.8 kWh/kg H2), and gasification or steam methane reforming for various biomass feedstocks (using established conversion rates). The potential hydrogen output was quantified in kilograms per year for each county and was also normalized by area and population, allowing for the identification of high-potential regions like the Great Plains and comparison against gasoline consumption.
The key observations include the following.
Eastern counties (e.g., Platte, Goshen, Laramie, Converse, and Niobrara) exhibit the highest hydrogen potential, likely due to strong wind resources and sufficient solar irradiation.
Central and southern counties (e.g., Natrona, Carbon, Albany) display moderate hydrogen yields, benefiting from a mix of wind and solar potential.
Western and northwestern counties (e.g., Teton, Park, Lincoln) have the lowest hydrogen-production estimates, primarily due to limited solar exposure, weaker wind speeds, and lower biomass availability.
These results highlight spatial variability in renewable-driven hydrogen production, emphasizing the importance of regional energy planning. Counties with high hydrogen potential could serve as strategic hubs for hydrogen infrastructure development, while lower-potential regions may require alternative strategies, such as energy imports or grid integration, to participate in the hydrogen economy.
It is crucial to interpret this map as representing technical potential based primarily on renewable-resource availability and land-suitability screening performed in the source study. Actual deployment feasibility in high-potential counties would require further detailed, site-specific analysis considering critical practical constraints not fully captured in this regional assessment. These include the proximity and capacity of electrical-grid infrastructure for interconnection, detailed local land-use restrictions and permitting processes (including potential conflicts with protected areas or other existing uses), water rights and transportation infrastructure, and the economic viability of biomass feedstock collection and logistics, where applicable.
By combining water availability with renewable-energy potential, this analysis provides a roadmap for hydrogen-production feasibility, guiding investment decisions and policy frameworks for sustainable hydrogen deployment. However, translating this regional potential and the water volumes identified in Section 3 into specific hydrogen-production forecasts requires detailed modeling, incorporating electrolyzer efficiency, plant capacity factors, water transport logistics, and the temporal availability of renewable energy, which is beyond the scope of this initial feasibility assessment [37]. Overlaying this renewable potential with water availability maps provides a preliminary guide to regions where integrated water-energy hubs for hydrogen production might be most viable.
Figure 10. Estimated hydrogen-production potential by county in Wyoming (thousand kg H2/km2/year), based on combined renewable-energy resource assessments (solar, wind, and biomass). Data adapted from [38].
Energies 18 02756 g010

5. Economic Feasibility

The prospect of repurposing produced water from Wyoming’s oil and gas operations for hydrogen production via electrolysis presents both opportunities and challenges [39]. A comprehensive economic analysis is essential to evaluate the viability of this approach, considering factors such as water-treatment costs, transportation expenses, and the overall impact on the levelized cost of hydrogen (LCOH).

5.1. Water-Treatment Costs

Produced water often contains high levels of total dissolved solids (TDS) and other contaminants (Figure 9) that exceed electrolysis purity requirements (Table 1), thus necessitating treatment to meet them. Treatment costs can vary significantly based on the initial water quality and desired output standards. For instance, studies have shown that treatment expenses can range from USD 0.11 to USD 1.01 per barrel (bbl) [40], depending on the specific treatment technologies employed and the composition of the produced water. Based on these ranges and typical electrolysis system costs, preliminary estimates suggest treatment could account for 2–6% of the final LCOH, depending heavily on initial salinity and chosen technology. While potentially significant, this cost component is often less dominant than electricity costs.

5.2. Transportation Expenses

The logistics of transporting produced water to a treatment facility or treated water to hydrogen-production facilities can substantially influence the overall economics. Transportation costs are influenced by factors such as distance, infrastructure availability, and mode of transport. In some cases, transportation expenses can increase the LCOH by over 10% [41], underscoring the importance of strategically locating hydrogen-production hubs near sources of suitable produced water and/or treatment facilities to minimize these costs.

5.3. Impact on Levelized Cost of Hydrogen (LCOH)

Understanding the cost components is crucial for assessing feasibility. Water-treatment costs (Section 5.1), estimated in this preliminary analysis to potentially contribute roughly 2–6% to the final LCOH depending on initial water quality and chosen technology, combined with transportation expenses (Section 5.2, which can be highly variable), constitute noticeable operational factors [42]. However, these water-related expenses are typically secondary compared to the primary drivers of green hydrogen LCOH.
Electricity prices are the dominant determinant, often accounting for 50–70% of the LCOH for grid-connected or renewable-powered electrolysis [43]. The efficiency of the electrolysis process directly impacts electricity consumption [44]; modern systems typically operate with efficiencies ranging from around 60% to 80% (system level, based on higher heating value), with ongoing research aiming to push these limits higher [21]. Electrolyzer capital cost (CAPEX), discussed previously (Section 4.1), represents the other major cost driver, often contributing 20–40% to the LCOH, depending on system scale, lifetime, and financing conditions [45]. Therefore, while managing water-treatment and transport costs is important, achieving competitive LCOH for hydrogen from produced water hinges primarily on securing low-cost renewable electricity and continued reductions in electrolyzer-system costs.

5.4. Comparative Analysis with Conventional Disposal Methods

Traditionally, produced water is disposed of through deep-well injection, with costs ranging from approximately USD 0.25 to USD 2.50 per bbl [39], excluding transportation. When transportation is factored in, costs can escalate significantly, depending on the distance to disposal sites. In contrast, treating produced water for hydrogen production not only offers a potential cost advantage but also aligns with environmental sustainability goals by reducing the need for disposal and potentially offsetting freshwater consumption. However, the economic viability compared to disposal depends heavily on achieving cost-effective treatment and competitive hydrogen-production costs.

5.5. Comparison with Conventional Hydrogen Production

For context, conventional hydrogen production via Steam Methane Reforming (SMR) typically has costs in the range of 1.00−2.00/kg H2, depending heavily on natural gas prices and whether carbon capture technologies are implemented. While current green hydrogen costs via electrolysis are generally higher (often 3−7/kg or more, depending on electricity price and CAPEX, utilizing low-cost renewable electricity and potentially lower water handling costs (as explored here for low-salinity PW) alongside declining electrolyzer CAPEX, are key pathways towards achieving cost-parity with SMR, aligning with goals like the DOE’s Hydrogen Shot [USD 1/kg by 2031] [46]. This economic overview confirms that, while water handling is a factor, electricity cost and electrolyzer CAPEX currently dominate the economics of green hydrogen, emphasizing the need for access to low-cost renewables and continued improvements in electrolyzer technology for PW-based hydrogen to become competitive.

6. Conclusions

This study evaluated the feasibility of utilizing produced water from Wyoming’s oil and gas operations for hydrogen production via electrolysis. Our analysis included an assessment of major producing basins in the state, geospatial trends in produced water availability, and key technical challenges associated with water treatment. Wyoming presents a unique advantage due to its lower-salinity produced water compared to other major oil-producing regions, potentially reducing the energy and operational costs associated with pre-treatment for electrolysis.
A geospatial analysis of produced-water production identified key areas (e.g., the Powder River Basin) with the highest water yields, allowing for the selection of optimal locations for hydrogen production hubs. These hubs should be positioned strategically to minimize transportation costs while maximizing the availability of suitable produced water.
Furthermore, while the technical challenges associated with treating produced water appear addressable, the economic assessment underscores that, while water treatment expenses (preliminarily estimated at 2–6% of the total levelized cost of hydrogen, LCOH) and transportation costs are important operational considerations, overall commercial viability hinges primarily on the dominant factors of electricity prices and electrolyzer capital costs (CAPEX). Repurposing produced water offers significant environmental advantages over traditional deep-well disposal and provides a pathway to resource valorization, but achieving economic competitiveness against conventional hydrogen sources or disposal methods necessitates substantial progress in reducing these main cost drivers.
Addressing the broader context of hydrogen production, electrolysis currently constitutes only a small fraction of the global supply, primarily due to cost competition from fossil-fuel-based methods and concerns regarding resource requirements, particularly water. Our findings suggest that utilizing alternative water sources like produced water, especially in regions like Wyoming where lower salinity potentially reduces the pre-treatment burden compared to hypersaline PW common in other basins or seawater desalination efforts, represents a tangible pathway to potentially mitigate the water-resource challenge. By repurposing a readily available industrial byproduct and potentially reducing reliance on strained freshwater resources, this approach could contribute to improving the sustainability profile and enabling the scale-up of electrolytic hydrogen. While not a singular solution, demonstrating the feasibility of integrating produced water sources addresses a critical input constraint and, therefore, supports the real prospects of enlarging the share of electrolysis in the future hydrogen economy, provided that major cost drivers like electricity prices and electrolyzer capital expenses continue to decline. Realizing the potential outlined in this feasibility study will likely depend not only on technological advancements but also on supportive policy frameworks and economic incentives, such as the federal 45 V tax credit, designed to accelerate the transition towards clean hydrogen.
Future Work: Further studies should conduct a detailed techno-economic analysis (TEA) incorporating site-specific factors, such as detailed produced-water quality variability and optimized treatment train design and costs, including research into advanced treatment technologies, particularly membranes robust to PW contaminants, local electricity prices, the potential for decentralized electrolysis systems suitable for smaller or stranded PW sources, and infrastructure availability. This would provide a clearer understanding of the commercial viability of integrating produced water into Wyoming’s hydrogen economy. Additionally, policy incentives and market dynamics (e.g., 45 V tax credits, LCFS markets) should be explored to assess the potential for large-scale deployment of this approach. Furthermore, future work should explicitly model the impact of intermittent renewable-energy generation. Critically, field-scale pilot studies within Wyoming are needed to validate technical performance, treatment efficacy, long-term durability, and projected costs under real-world operating conditions.

Author Contributions

Conceptualization, C.A., M.R. and K.V.; Methodology, C.A., A.L. and K.V.; Formal analysis, C.A. and A.L.; Writing—original draft, C.A.; Writing—review & editing, M.R.; Supervision, M.R. All authors have read and agreed to the published version of the manuscript.

Funding

This research received no external funding.

Data Availability Statement

The original contributions presented in the study are included in the article, further inquiries can be directed to the corresponding author.

Conflicts of Interest

The authors declare no conflicts of interest.

References

  1. Masson-Delmotte; Allan, R.P.; Arias, P.A.; Berger, S.; Canadell, J.G.; Cassou, C.; Chen, D.; Cherchi, A.; Connor, S.L.; Coppola, E.; et al. Summary for Policymakers. Available online: https://www.ipcc.ch/report/ar6/wg1/downloads/report/IPCC_AR6_WGI_SPM.pdf (accessed on 30 March 2025).
  2. Department of Energy. U.S. National Clean Hydrogen Strategy and Roadmap at a Glance. Tech. Rep. October 2019. Available online: https://www.hydrogen.energy.gov/docs/hydrogenprogramlibraries/pdfs/clean-hydrogen-strategy-roadmap-at-a-glance.pdf?Status=Master (accessed on 30 March 2025).
  3. Can the Inflation Reduction Act Unlock a Green Hydrogen Economy?—International Council on Clean Transportation. Available online: https://theicct.org/ira-unlock-green-hydrogen-jan23/ (accessed on 14 May 2025).
  4. Murdoch, H.; Munster, J.; Satyapal, S.; Rustagi, N. Pathways to Commercial Liftoff: Clean Hydrogen. 2023. Available online: https://trid.trb.org/View/2494936 (accessed on 14 May 2025).
  5. Kumar, S.S.; Himabindu, V. Hydrogen production by PEM water electrolysis—A review. Mater. Sci. Energy Technol. 2019, 2, 442–454. [Google Scholar] [CrossRef]
  6. Global Hydrogen Review 2023—Analysis—IEA. Available online: https://www.iea.org/reports/global-hydrogen-review-2023 (accessed on 30 March 2025).
  7. Acar, C.; Dincer, I. Comparative assessment of hydrogen production methods from renewable and non-renewable sources. Int. J. Hydrogen Energy 2014, 39, 1–12. [Google Scholar] [CrossRef]
  8. Wilkinson, J.; Mays, T.; McManus, M. Review and meta-analysis of recent life cycle assessments of hydrogen production. Clean. Environ. Syst. 2023, 9, 100116. [Google Scholar] [CrossRef]
  9. Miller, J.E. Review of Water Resources and Desalination Technologies; Sandia National Lab: Albuquerque, NM, USA, 2003. [CrossRef]
  10. Zhang, L.; Hascakir, B. A review of issues, characteristics, and management for wastewater due to hydraulic fracturing in the U.S. J. Pet. Sci. Eng. 2021, 202, 108536. [Google Scholar] [CrossRef]
  11. Hamiche, A.M.; Stambouli, A.B.; Flazi, S. A review of the water-energy nexus. Renew. Sustain. Energy Rev. 2016, 65, 319–331. [Google Scholar] [CrossRef]
  12. Saada, H.; Fabre, B.; Loget, G.; Benoit, G. Is Direct Seawater Splitting Realistic with Conventional Electrolyzer Technologies? ACS Energy Lett. 2024, 9, 3351–3368. [Google Scholar] [CrossRef]
  13. Ibrahim, M.; Nawaz, M.H.; Rout, P.R.; Lim, J.W.; Mainali, B.; Shahid, M.K. Advances in Produced Water Treatment Technologies: An In-Depth Exploration with an Emphasis on Membrane-Based Systems and Future Perspectives. Water 2023, 15, 2980. [Google Scholar] [CrossRef]
  14. Zawadzki, P.; Kończak, B.; Smoliński, A. Municipal wastewater reclamation: Reclaimed water for hydrogen production by electrolysis—A case study. Measurement 2023, 216, 112928. [Google Scholar] [CrossRef]
  15. Chauhan, D.; Ahn, Y.-H. Alkaline electrolysis of wastewater and low-quality water. J. Clean. Prod. 2023, 397, 136613. [Google Scholar] [CrossRef]
  16. Cassol, G.S.; Shang, C.; An, A.K.; Khanzada, N.K.; Ciucci, F.; Manzotti, A.; Westerhoff, P.; Song, Y.; Ling, L. Ultra-fast green hydrogen production from municipal wastewater by an integrated forward osmosis-alkaline water electrolysis system. Nat. Commun. 2024, 15, 2617. [Google Scholar] [CrossRef]
  17. Huang, L.; Fang, C.; Pan, T.; Zhu, Q.; Geng, T.; Li, G.; Li, X.; Yu, J. Hydrogen Production via Electrolysis of Wastewater. Nanomaterials 2024, 14, 567. [Google Scholar] [CrossRef]
  18. Dong, X.; Pang, D.; Luo, G.; Zhu, X. Microbial Water Electrolysis Cells for Efficient Wastewater Treatment and H2 Production. ACS Sustain. Chem. Eng. 2024, 12, 4203–4212. [Google Scholar] [CrossRef]
  19. Zhang, Z.; Yang, H.; Zhang, F.; Zou, M.; Li, J.-C.; Zhang, L.; Hou, P.-X.; Shi, C.; Zhang, L.; Cheng, H.-M. Green and efficient electrolysis of seawater using carbon nanotube-based hybrid films. Nano Energy 2024, 123, 109356. [Google Scholar] [CrossRef]
  20. Konkel, L. Salting the Earth: The Environmental Impact of Oil and Gas Wastewater Spills. Environ. Health Perspect. 2016, 124, A230–A235. [Google Scholar] [CrossRef] [PubMed]
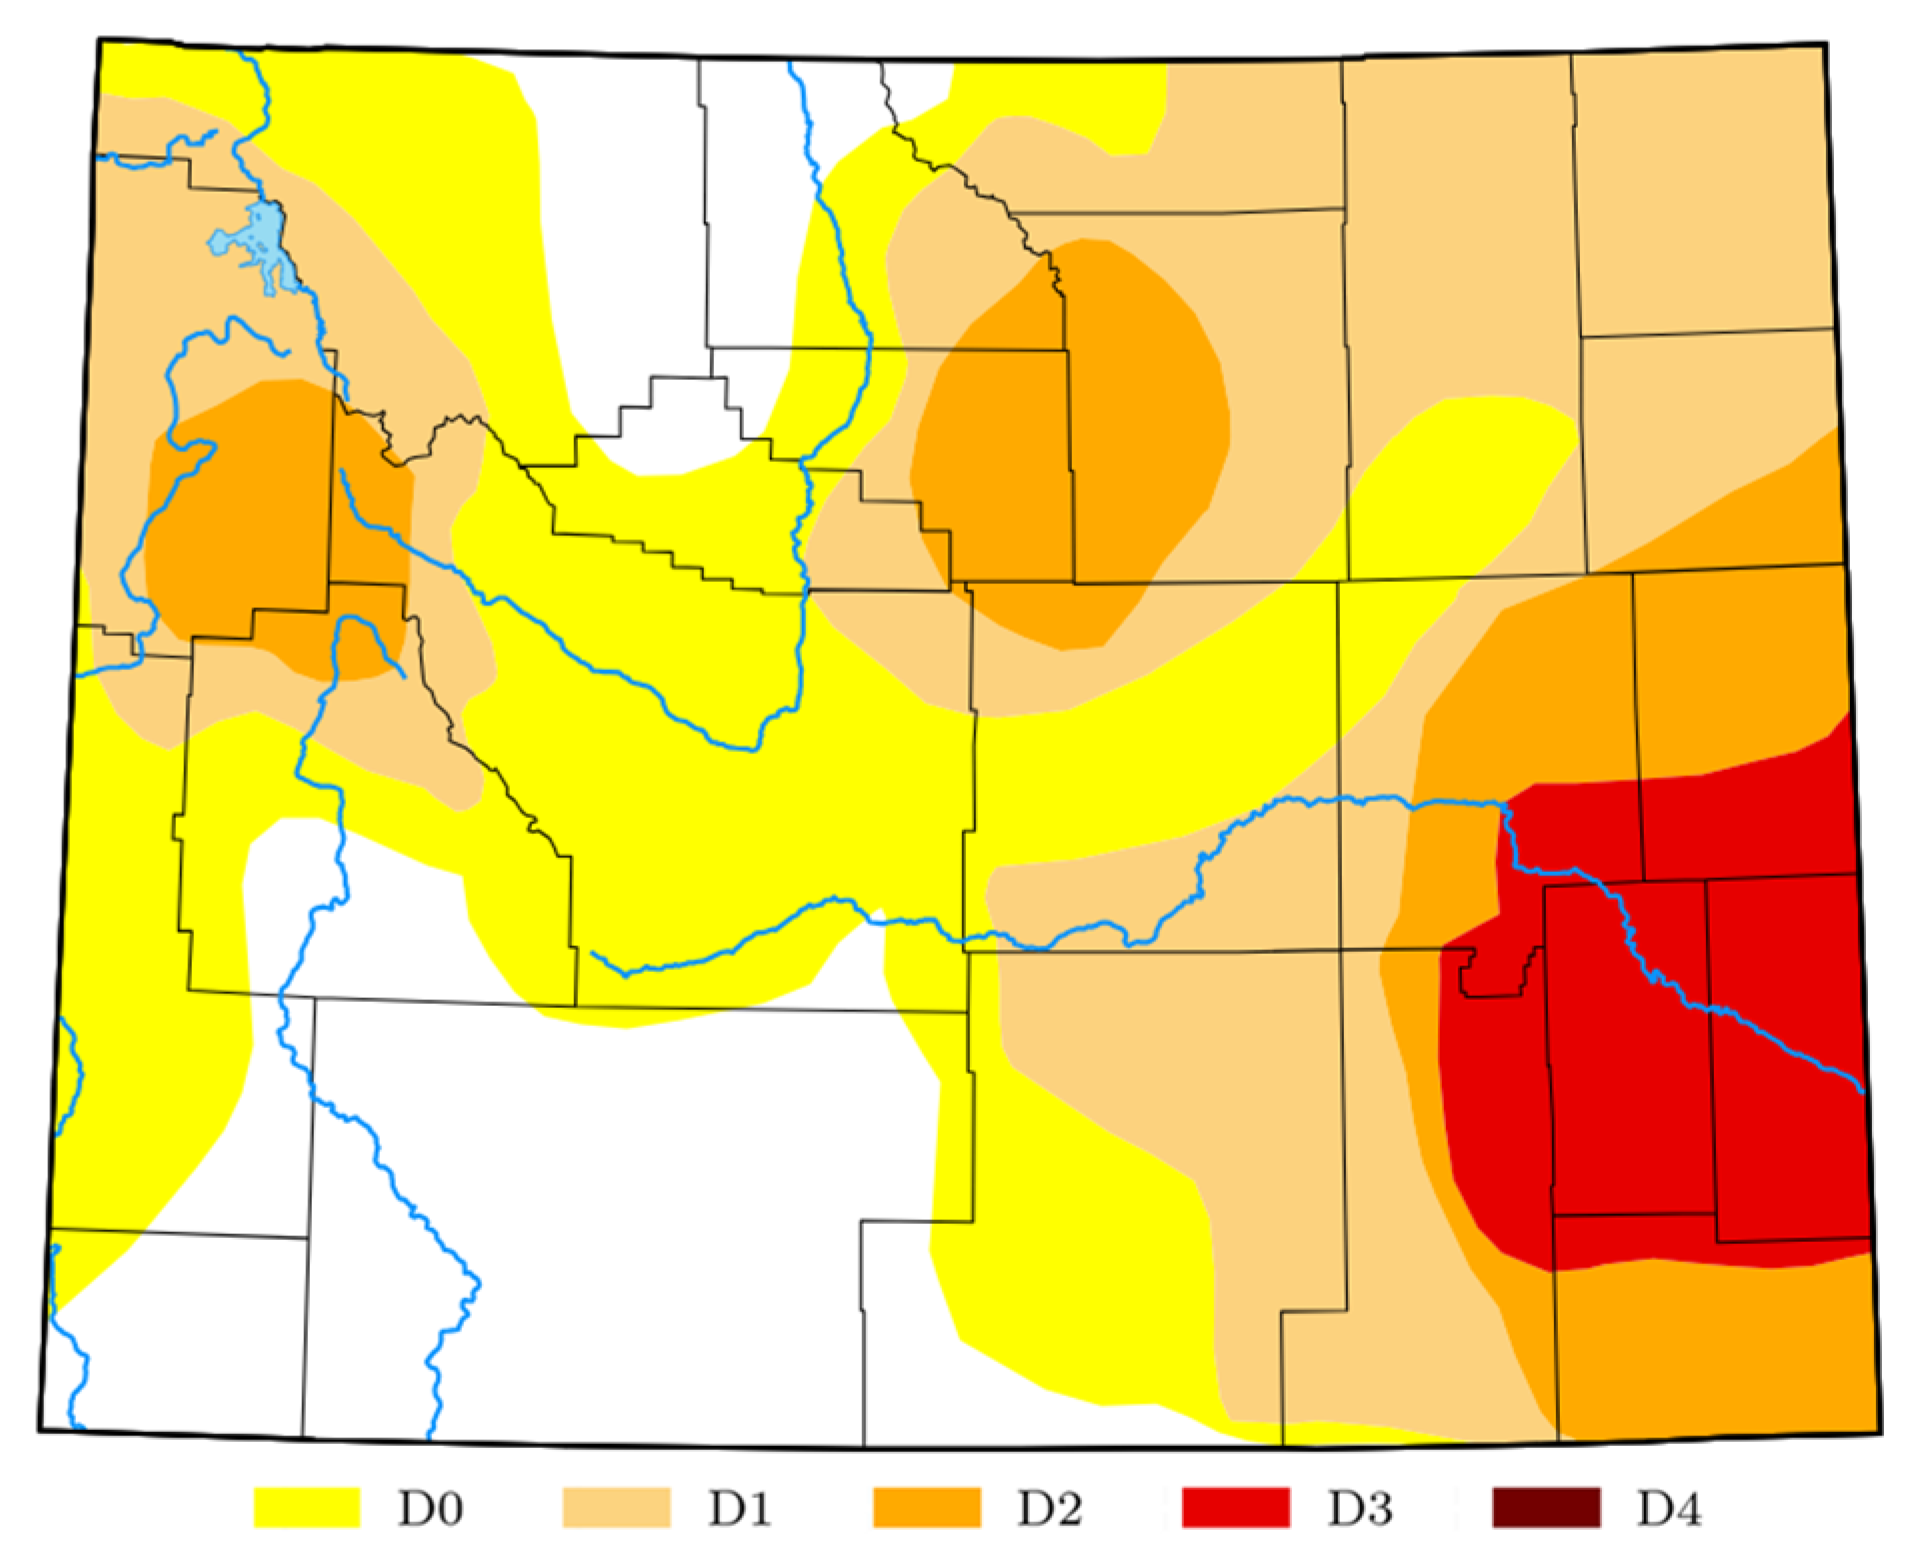
  21. National Drought Mitigation Center. Available online: https://drought.unl.edu/ (accessed on 30 March 2025).
  22. Slack, P.B. Paleotectonics and Hydrocarbon Accumulation, Powder River Basin, Wyoming. Am. Assoc. Pet. Geol. Bull. 1981, 65, 730–743. [Google Scholar] [CrossRef]
  23. Bauer, C.M. Wind River Basin. GSA Bull. 1934, 45, 665–696. [Google Scholar] [CrossRef]
  24. Roehler, H.W. Eocene Climates, Depositional Environments, and Geography, Greater Green River Basin, Wyoming, Utah, and Colorado; U.S. Geological Survey: Reston, VA, USA, 1993. Available online: https://books.google.it/books?hl=en&lr=&id=jA4-isGCWsYC&oi=fnd&pg=PA1&dq=greater+green+river+basin&ots=UGm7jO0pbZ&sig=MJHiQY5xnsSKggwA8Nx3tjbT78A&redir_esc=y#v=onepage&q=greater%20green%20river%20basin&f=false (accessed on 30 March 2025).
  25. Clyde, W.C.; Hamzi, W.; Finarelli, J.A.; Wing, S.L.; Schankler, D.; Chew, A. Basin-wide magnetostratigraphic framework for the Bighorn Basin, Wyoming. GSA Bull. 2007, 119, 848–859. [Google Scholar] [CrossRef]
  26. Zaidi, S.Z.; Shafeeq, A.; Sajjad, M.; Hassan, S.; Aslam, M.S.; Saeed, T.; Walsh, F.C. Benchmarking of scaling and fouling of reverse osmosis membranes in a power generation plant of paper and board mill: An industrial case of a paper and board mill study. Int. J. Environ. Sci. Technol. 2021, 18, 2511–2518. [Google Scholar] [CrossRef]
  27. Meng, M.; Chen, M.; Sanders, K.T. A Geospatial Feasibility Assessment of Utilizing Produced Water from Oil and Natural Gas Production in California for Beneficial Use. In Proceedings of the World Environmental and Water Resources Congress 2016, West Palm Beach, FL, USA, 22–26 May 2016; pp. 207–216. [Google Scholar] [CrossRef]
  28. Gardiner, J.; Thomas, R.B.; Phan, T.T.; Stuckman, M.; Wang, J.; Small, M.; Lopano, C.; Hakala, J.A. Utilization of produced water baseline as a groundwater monitoring tool at a CO2-EOR site in the Permian Basin, Texas, USA. Appl. Geochem. 2020, 121, 104688. [Google Scholar] [CrossRef]
  29. Na, J.; Yu, H.; Jia, S.; Chi, J.; Lv, K.; Li, T.; Zhao, Y.; Zhao, Y.; Zhang, H.; Shao, Z. Electrochemical reconstruction of non-noble metal-based heterostructure nanorod arrays electrodes for highly stable anion exchange membrane seawater electrolysis. J. Energy Chem. 2024, 91, 370–382. [Google Scholar] [CrossRef]
  30. Li, L.; Chen, G.; Shao, Z.; Huang, H. Progress on smart integrated systems of seawater purification and electrolysis. Energy Environ. Sci. 2023, 16, 4994–5002. Available online: https://pubs.rsc.org/en/content/articlehtml/2023/ee/d3ee02712k (accessed on 30 March 2025). [CrossRef]
  31. IRENA. Green Hydrogen Cost Reduction: Scaling up Electrolysers to Meet the 1.5 °C Climate Goal; International Renewable Energy Agency: Abu Dhabi, United Arab Emirates, 2020; p. 105. Available online: www.irena.org/publications (accessed on 30 March 2025).
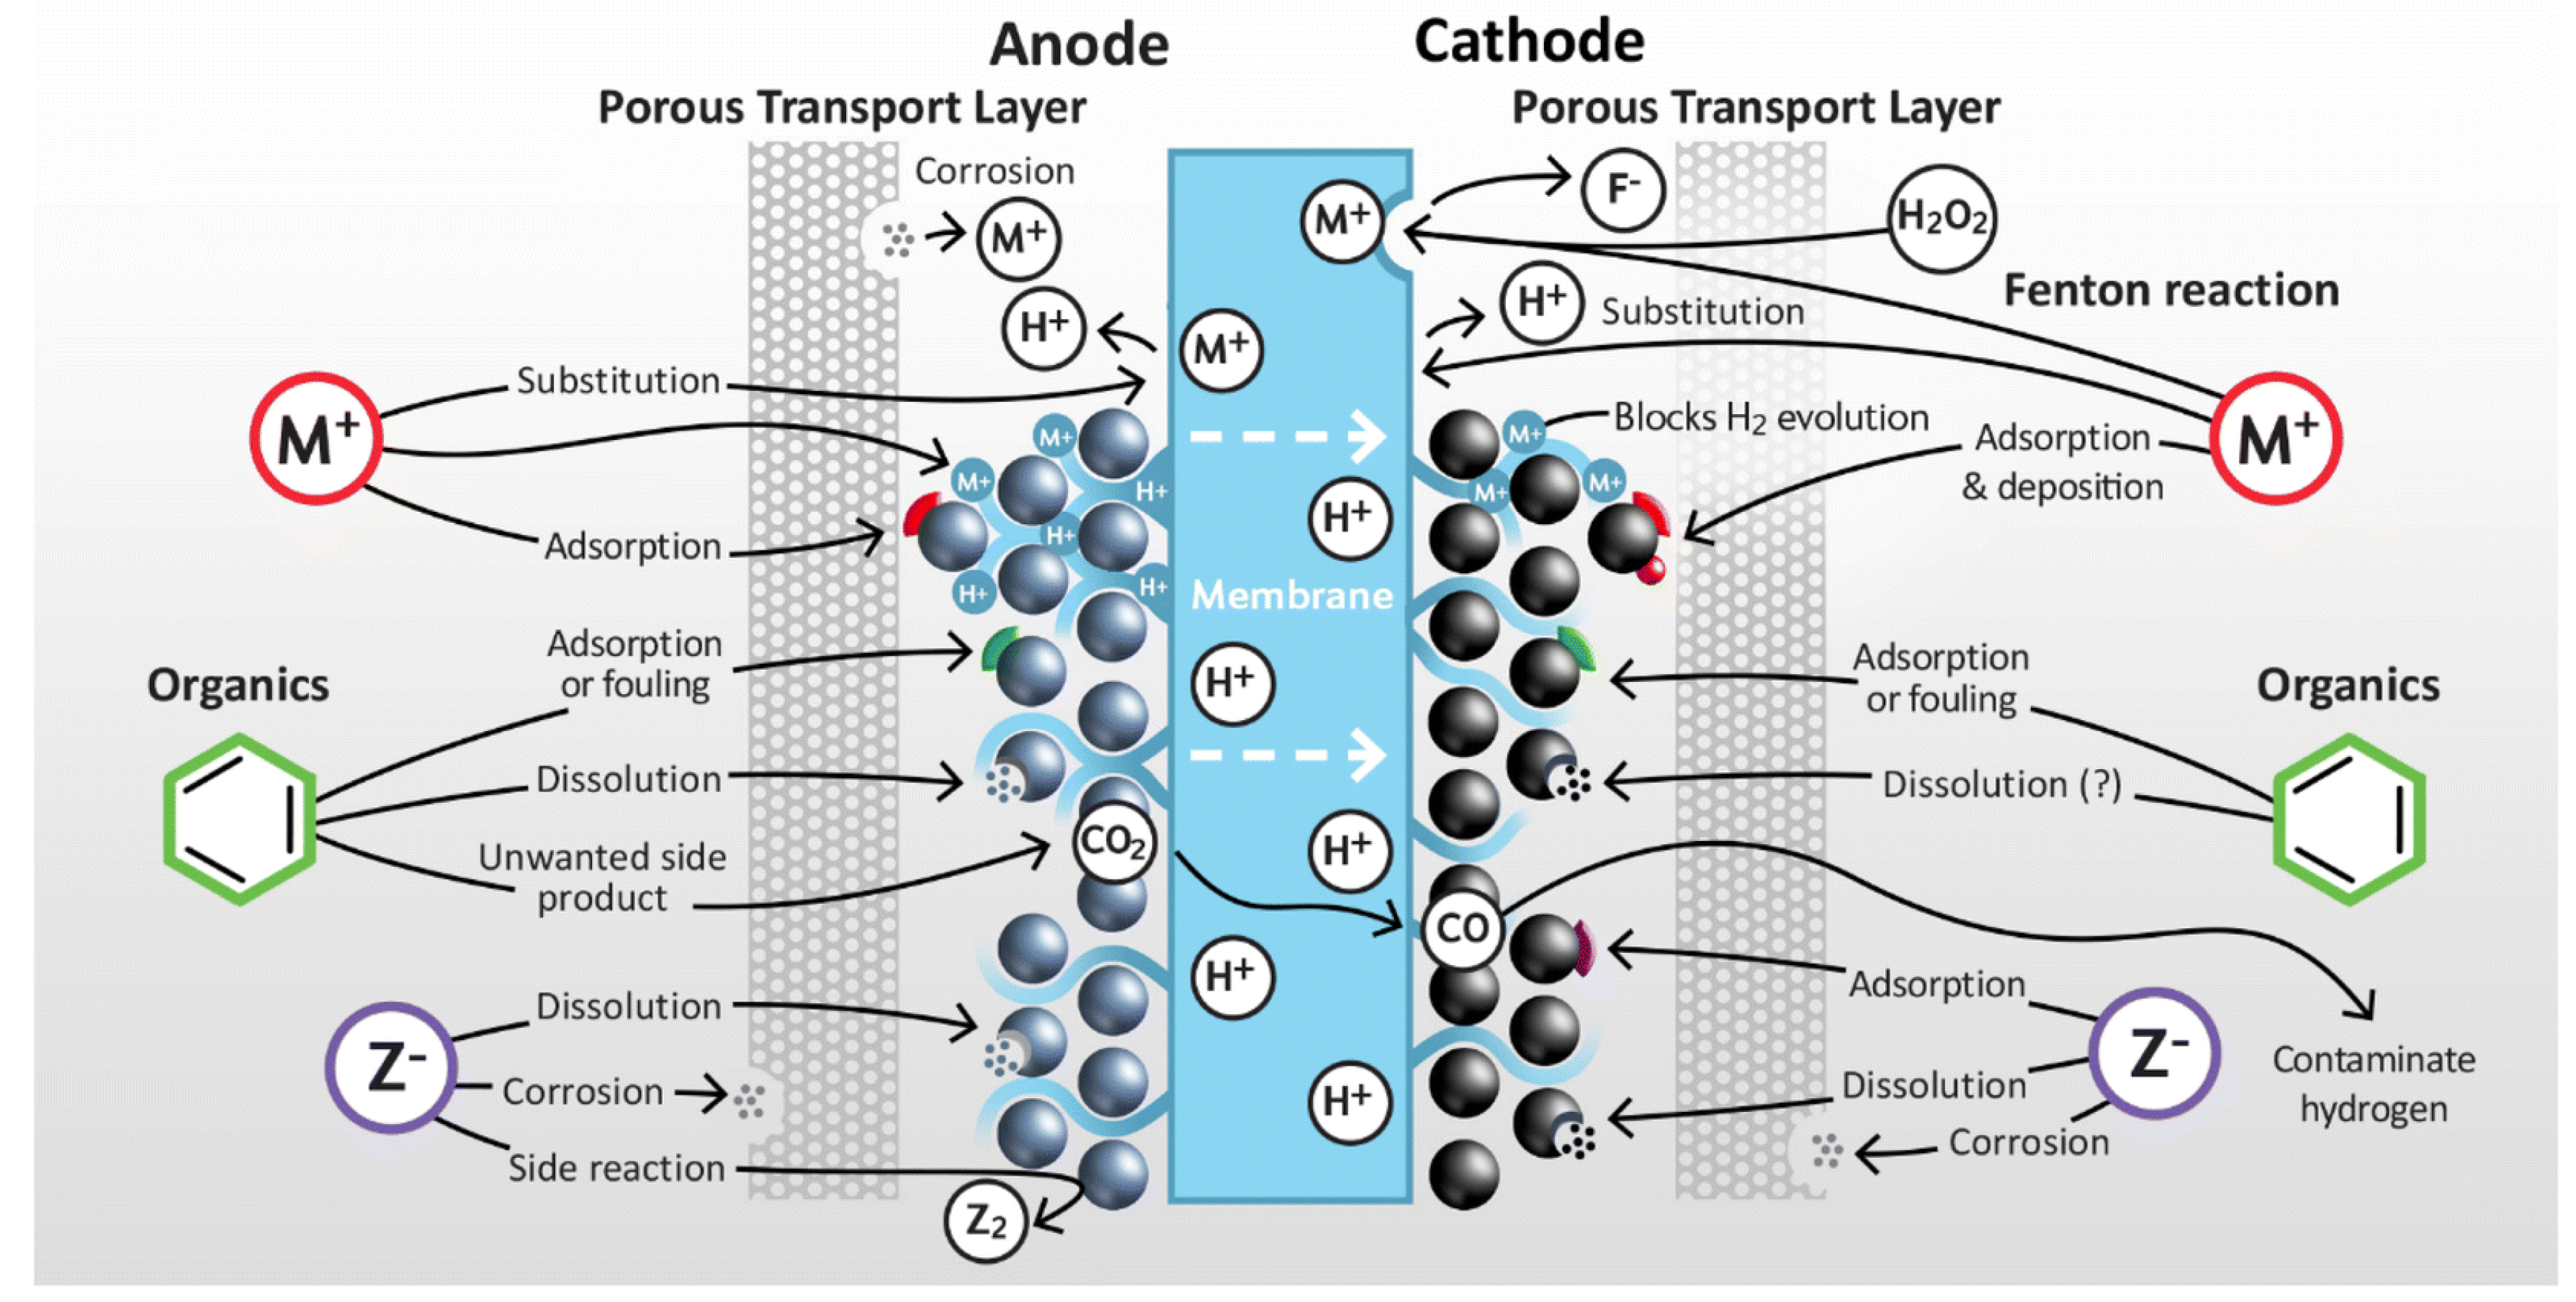
  32. Becker, H.; Murawski, J.; Shinde, D.V.; Stephens, I.E.L.; Hinds, G.; Smith, G. Impact of impurities on water electrolysis: A review. Sustain. Energy Fuels 2023, 7, 1565–1603. [Google Scholar] [CrossRef]
  33. HyLYZERTM—Hydrogen Systems—PDF Catalogs|Technical Documentation|Brochure. Available online: https://pdf.directindustry.com/pdf/hydrogen-systems/hylyzer/14703-642453.html (accessed on 30 March 2025).
  34. Chang, H.; Li, T.; Liu, B.; Vidic, R.D.; Elimelech, M.; Crittenden, J.C. Potential and implemented membrane-based technologies for the treatment and reuse of flowback and produced water from shale gas and oil plays: A review. Desalination 2019, 455, 34–57. [Google Scholar] [CrossRef]
  35. Jeong, N.; Wiltse, M.E.; Boyd, A.; Blewett, T.; Park, S.; Broeckling, C.; Borch, T.; Tong, T. Efficacy of Nanofiltration and Reverse Osmosis for the Treatment of Oil-Field Produced Water Intended for Beneficial Reuse. ACS ES T Eng. 2023, 3, 1568–1581. [Google Scholar] [CrossRef]
  36. Wang, X.; Xia, J.; Ding, S.; Zhang, S.; Li, M.; Shang, Z.; Lu, J.; Ding, J. Removing organic matters from reverse osmosis concentrate using advanced oxidation-biological activated carbon process combined with Fe3+/humus-reducing bacteria. Ecotoxicol. Environ. Saf. 2020, 203, 110945. [Google Scholar] [CrossRef]
  37. Khan, A.A.; Minai, A.F.; Godi, R.K.; Sharma, V.S.; Malik, H.; Afthanorhan, A. Optimal Sizing, Techno-Economic Feasibility and Reliability Analysis of Hybrid Renewable Energy System: A Systematic Review of Energy Storage Systems’ Integration. IEEE Access 2025, 13, 59198–59226. [Google Scholar] [CrossRef]
  38. Potential for Hydrogen Production from Key Renewable Resources in the United States|Request PDF. Available online: https://www.researchgate.net/publication/237735832_Potential_for_Hydrogen_Production_from_Key_Renewable_Resources_in_the_United_States (accessed on 30 March 2025).
  39. Oliveira, A.M.; Beswick, R.R.; Yan, Y. A green hydrogen economy for a renewable energy society. Curr. Opin. Chem. Eng. 2021, 33, 10070. [Google Scholar] [CrossRef]
  40. Sanchez-Rosario, R.; Hildenbrand, Z.L. Produced Water Treatment and Valorization: A Techno-Economical Review. Energies 2022, 15, 4619. [Google Scholar] [CrossRef]
  41. Frieden, F.; Leker, J. Future costs of hydrogen: A quantitative review. Sustain. Energy Fuels 2024, 8, 1806–1822. [Google Scholar] [CrossRef]
  42. Salkuyeh, Y.K.; Saville, B.A.; MacLean, H.L. Techno-economic analysis and life cycle assessment of hydrogen production from different biomass gasification processes. Int. J. Hydrogen Energy 2018, 43, 9514–9528. [Google Scholar] [CrossRef]
  43. Noussan, M.; Raimondi, P.P.; Scita, R.; Hafner, M. The Role of Green and Blue Hydrogen in the Energy Transition—A Technological and Geopolitical Perspective. Sustainability 2021, 13, 298. [Google Scholar] [CrossRef]
  44. Wallnöfer-Ogris, E.; Grimmer, I.; Ranz, M.; Höglinger, M.; Kartusch, S.; Rauh, J.; Macherhammer, M.-G.; Grabner, B.; Trattner, A. A review on understanding and identifying degradation mechanisms in PEM water electrolysis cells: Insights for stack application, development, and research. Int. J. Hydrogen Energy 2024, 65, 381–397. [Google Scholar] [CrossRef]
  45. Glenk, G.; Reichelstein, S. Economics of converting renewable power to hydrogen. Nat Energy 2019, 4, 216–222. [Google Scholar] [CrossRef]
  46. Maestre, V.M.; Ortiz, A.; Ortiz, I. The role of hydrogen-based power systems in the energy transition of the residential sector. J. Chem. Technol. Biotechnol. 2022, 97, 561–574. [Google Scholar] [CrossRef]
Figure 3. (Left) Map shows the approximate boundaries of major oil- and gas-producing basins within Wyoming. (Right) Count of active producing gas wells (black bars) and oil wells (white bars) by basin, based on Wyoming Oil and Gas Conservation Commission (WOGCC) data. GGR denotes the Greater Green River Basin.
Energies 18 02756 g003
Figure 4. Spatial distribution of produced water salinity (TDS) across the continental US, based on measured samples [28]. Wyoming generally shows lower salinity compared to major basins such as the Permian and Appalachian. Average seawater salinity (~35,000 ppm). For comparison, seawater has a salinity of approximately 35,000 ppm.
Energies 18 02756 g004
Figure 5. Yearly produced water volumes (Million Barrels, MMbbl) for selected top-producing fields in Wyoming, 2020–2023.
Energies 18 02756 g005
Figure 6. Spatial distribution of total cumulative produced water volume (Million Barrels, MMbbl) per field for the period 2020–2023.
Energies 18 02756 g006
Figure 7. Impact of various impurities on PEMWEs. Reproduced from Becker et al.’s study [32] with permission from the Royal Society of Chemistry.
Energies 18 02756 g007
Figure 8. Impact of various impurities on AEMWEs (top) and AWEs (bottom). Reproduced from Becker et al.’s study [32] with permission form the Royal Society of Chemistry.
Energies 18 02756 g008
Figure 9. Produced water quality assessment vs. electrolysis needs (Table 1) using average field data (WOGCC). Top: Parameter suitability (Rows = parameters; see legend for color definitions). Bottom: average ion concentrations (Rows = ions; color scale units: [ppm], columns represent fields.
Energies 18 02756 g009
Table 1. Water requirements for electrolysis.
VariableUnitValue
pHRange3–11
Maximum TDSppm2000
Ironppm0.1
Manganeseppm0.1
Chlorineppm0.1
Hydrogen sulfideppm0.1
HardnessGrains (ppm)10 grains (170 ppm as CaCO3)
Maximum turbidityNTU1.0
Disclaimer/Publisher’s Note: The statements, opinions and data contained in all publications are solely those of the individual author(s) and contributor(s) and not of MDPI and/or the editor(s). MDPI and/or the editor(s) disclaim responsibility for any injury to people or property resulting from any ideas, methods, instructions or products referred to in the content.

