Article

Energy and Exergy Analysis of a Photovoltaic-Thermal Geothermal Heat Pump Coupled with Radiant Ceiling and Fresh Air System

by
Yaolin Lin
1,*,
Zhenyan Bu
1,
Wei Yang
2,*,
Melissa Chan
3,
Lin Tian
4 and
Mingqi Dai
1
1
School of Environment and Architecture, University of Shanghai for Science and Technology, Shanghai 200093, China
2
Faculty of Architecture, Building and Planning, The University of Melbourne, Melbourne 3010, Australia
3
College of Sport, Health and Engineering, Victoria University, Melbourne 3011, Australia
4
School of Engineering, RMIT University, Melbourne 3000, Australia
*
Authors to whom correspondence should be addressed.
Energies 2025, 18(11), 2715; https://doi.org/10.3390/en18112715
Submission received: 22 April 2025 / Revised: 16 May 2025 / Accepted: 20 May 2025 / Published: 23 May 2025
(This article belongs to the Section G: Energy and Buildings)

Abstract

:
This paper presents energy and exergy studies on a photovoltaic-thermal solar-assisted geothermal heat pump coupled with a radiant ceiling system. The system utilizes renewable solar and geothermal energy. It has an independent fresh air unit that provides clean air to the space. The computer model of the system was developed under the TRNSYST environment and validated with experimental results from open literature. Distribution of the energy consumption and exergy loss of the system were analyzed. It was found that the heat pump unit consumes the largest amount of energy while the transmission and distribution system has the highest exergy loss. Under optimized operating conditions, i.e., both demand side circulation flow and source side circulation flow are maintained at 65% of the design flow rate (design loop water temperature difference of 7.0 °C), the average exergy efficiency of the whole system was found to be 37.56%, which achieves an accumulative exergy loss reduction of 16.5% compared with 100% design flow rate condition during cooling season. The optimal bearing load ratio of the ground source heat pump vs. photovoltaic-thermal system in the heating season was found to be 67%.

1. Introduction

Photovoltaic and photothermal technologies have been widely applied in various regions in China due to recent breakthroughs [1]. When the technologies are applied to the heat pump system, the solar power outputs can be fed into the grid via electrical transmission and improve building energy efficiency by offsetting the electricity input from the public power grid to the building [2]. Furthermore, geothermal energy, as a renewable energy source, although it can be directly used for heating and domestic hot water systems, the coefficient of performance (COP) of the ground source heat pumps could decrease year by year due to thermal load imbalance [3]. If the technologies are applied to the geothermal heat pump system, the problem can be solved [4] and the COP of the system can be greatly improved [5,6,7,8,9].
Studies on the solar geothermal system started as early as the 1990s. Faisal et al. [10] developed a mathematical model on the hybrid system and investigated the impact of solar air collector design parameters, such as collector area and type, on the system performance. Salih et al. [11] investigated the system’s performance under different climate conditions and found its advantages in space heating and domestic hot water supply. The solar geothermal heat pump system can achieve additional environmental and economic benefits compared to traditional geothermal heat pump systems [11,12]. Berardi et al. [13] proved the economic and technological feasibility of the application of a solar geothermal heat pump system in humid and hot areas through simulation under the TRNSYS environment. Elsabe et al. [14] found that the combination of solar collector and heat pump system helps minimize system operational instability caused by fluctuation of climatic conditions and improves solar energy utilization efficiency. Berdal et al. [15] found that the average COP of the solar geothermal heat pump system during the heating mode during the eleven-month testing period in a 180 m2 residential building was as high as 3.75.
The radiant air conditioning system is an alternative to the traditional air conditioning system to provide indoor thermal comfort, which can effectively prevent the transmission of airborne viruses during a pandemic while maintaining low-energy consumption by supplying 100% fresh air with no recirculation. It consists of radiant cooling/heating terminal systems, an independent fresh air subsystem, and a cold/heat source subsystem [16]. The supply-chilled water temperature is as high as 16–18 °C for the radiant air conditioner and the room temperature and humidity are controlled independently. The sensible thermal load of the building is handled by the radiant terminal and the latent thermal load is handled by the fresh air unit, which also supplies fresh air to ensure indoor air quality [9,13], and low energy consumption [17]. When the radiant system is combined with the geothermal heat pump system, 25–66% energy savings can be achieved in the cooling season [18]. So far, little research has been conducted on coupling photovoltaic-thermal (PV/T) solar geothermal heat pumps with a radiant ceiling and fresh air system.
Exergy analysis has been an effective approach to assess the energy usage quality of renewable energy systems. For example, Ramdani and Ould-Lahoucine [19] conducted an evaluation on the overall exergy and energy performances of a water-based hybrid photovoltaic-thermal solar collector and found that solar radiation has a positive impact on exergy efficiency and no impact on energy efficiency, while ambient temperature negatively affects exergy efficiency but has no impact on energy efficiency. Arslan et al. [20] performed a numerical and experimental investigation on the exergy performance of a fin structure photovoltaic-thermal solar collector and found that by increasing the mass flow rate of the working fluid, the collector surface temperature was reduced and the exergy efficiency of the collector was increased by 0.42%. Suleman et al. [21] experimentally investigated the exergy performance of a solar heat pump industrial heating system and determined its exergy efficiency to be 35.7%. Huseyin et al. [22] found that the PV panel is critical in improving the exergy performance of the solar–air heat pump system.
Some researchers have investigated the performance of solar-assisted heat pumps. Li et al. [23] conducted energy and exergy analysis for an ejector-enhanced solar–air composite dual-source heat pump (EDHP) system for residential water heating and found heat pump heating coefficient improvements of 24.92–30.0% and exergy performance improvements of 24.89–29.96%. Gao et al. [24] carried out an experimental investigation on the performance of a solar composite heat pump with an evaporative thermal accumulator utilizing phase change slurry as the heat transfer medium and found an average COP of 4.74 for water-based systems and 8.23 for using phase-change slurry. Petrucci et al. [25] performed energy analysis for a direct expansion heat pump assisted by a thermal photovoltaic panel for hot water production and found the COP of the heat pump varied from 7.5 to 2.5.
Different modeling approaches have also been conducted to model heat pump performance. Yousaf et al. [26] developed a component-based gray-box model for unitary air conditioners using symbolic regression, which offers a solution for building energy management and optimization. Ma et al. [27] developed a “state point” model to evaluate the exergy performance of an air-source auto cascade steam generating heat pump and found that it outperforms the conventional system. Gao et al. [28] developed “state point” models to perform energy and exergy analysis for a conventional air source heat pump cycle (CHPC) and two dual-temperature air source heat pump cycles and found that the later ones have higher energy and exergy performance than the conventional one.
Based on the literature survey, it can be found that the researchers mainly focused on the energy performance investigation of solar heat pump systems and integration of radiant air conditioner terminal and heat pump systems. Few studies can be found on the energy and exergy performance of the integration of PV/T solar geothermal heat pump coupled with radiant terminal and fresh air system. In addition, the evaluation of the integration of geothermal heat pump system coupled with radiant system and fresh air unit focused on indoor thermal comfort generally overlooked the energy usage quality and energy performance of the system.
Therefore, in this paper, a radiant air conditioning system is proposed to provide heating and cooling for an office building in Shanghai City, which is located in the hot summer and cold winter climate region. The system is combined with a PV/T solar collector to satisfy different energy needs with an independent fresh air unit. The system can help to maintain a comfortable and healthy indoor comfort even during the pandemic period as there is no recirculation air and thus avoids contaminated air from returning back to the occupied zone. The mathematical model of the energy and exergy performance of the system was developed and simulated under the TRNSYS environment to find the optimal solution for the operating parameters. The outcomes of the research can provide a reference for the integration of air conditioning systems with renewable energy resources to improve building energy performance while ensuring a healthy indoor environment.

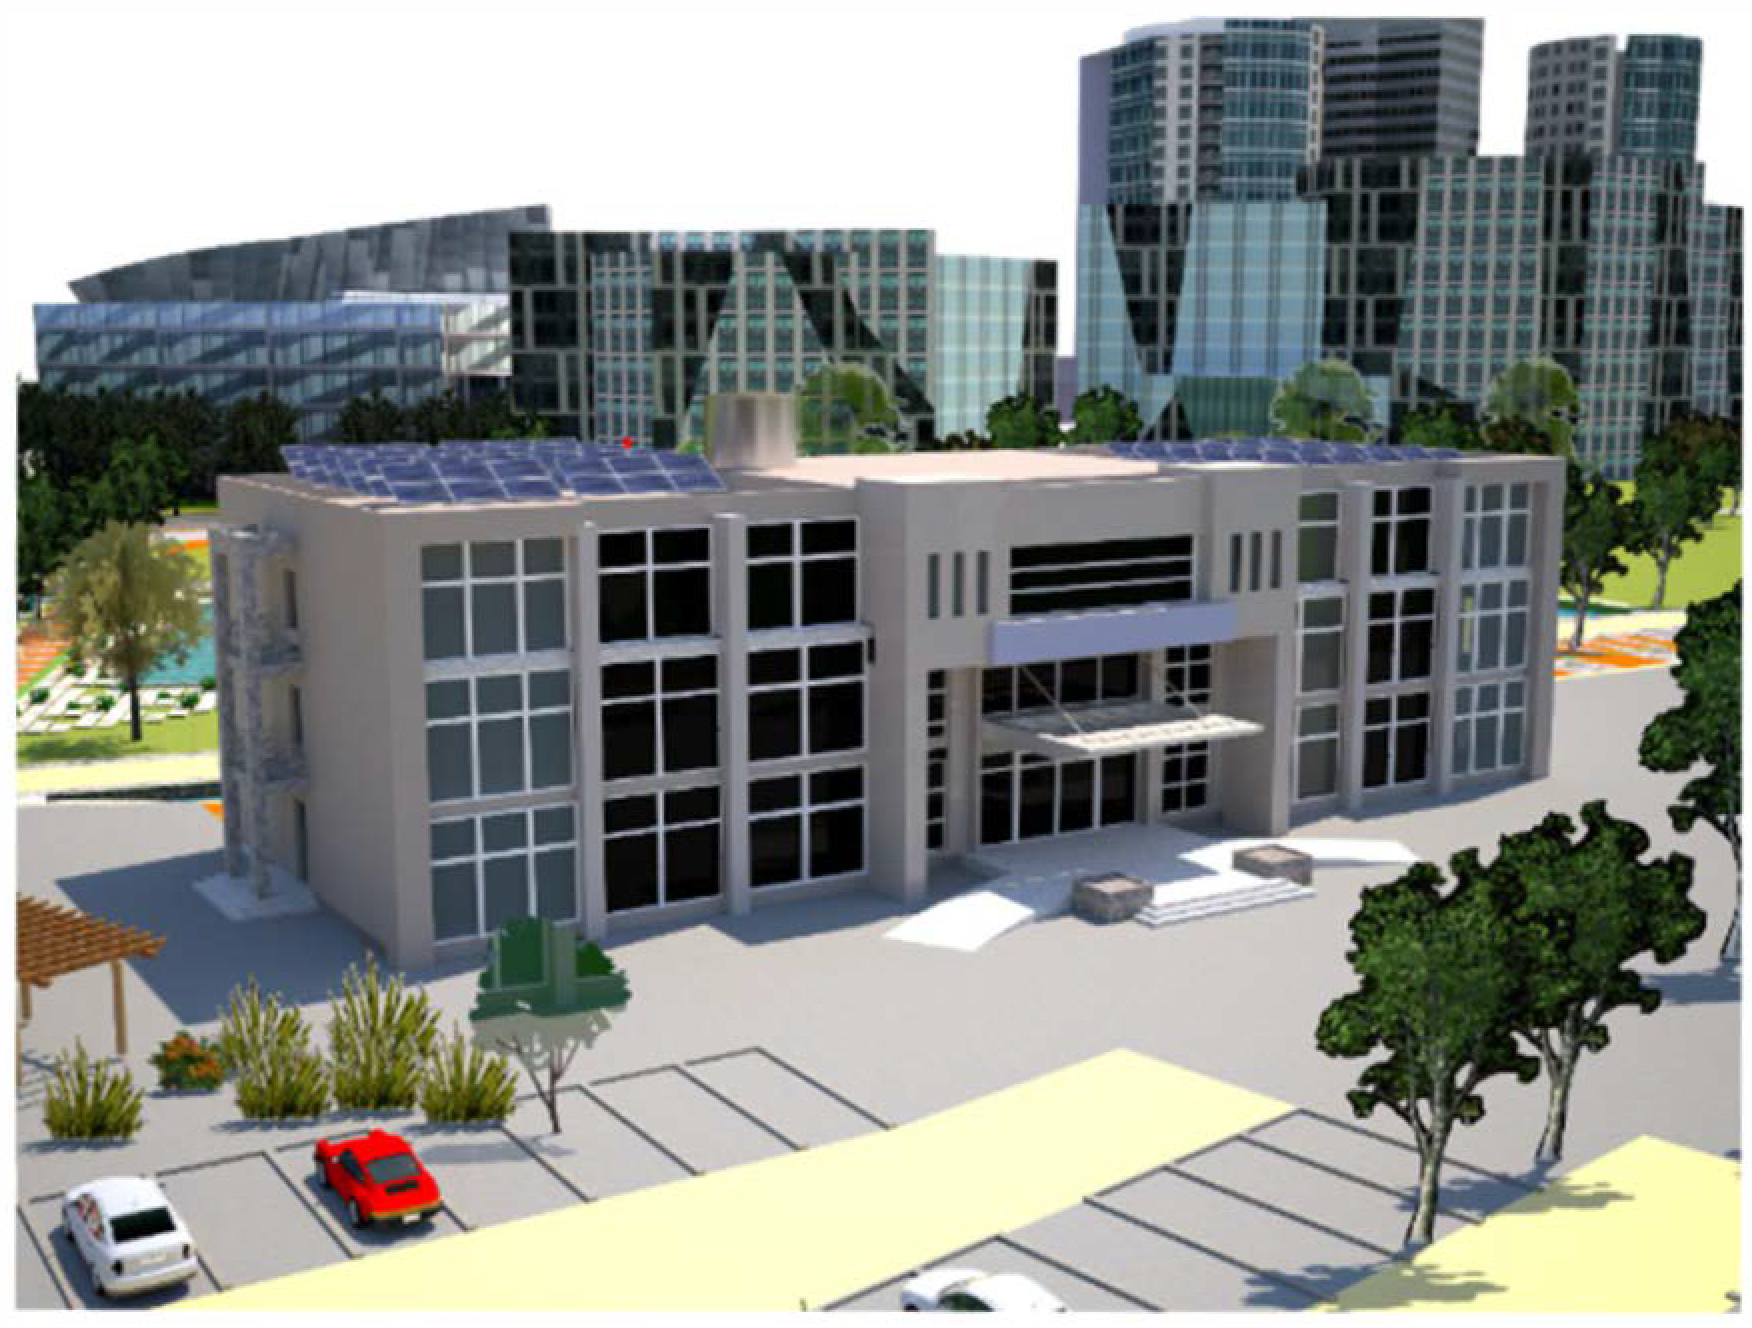
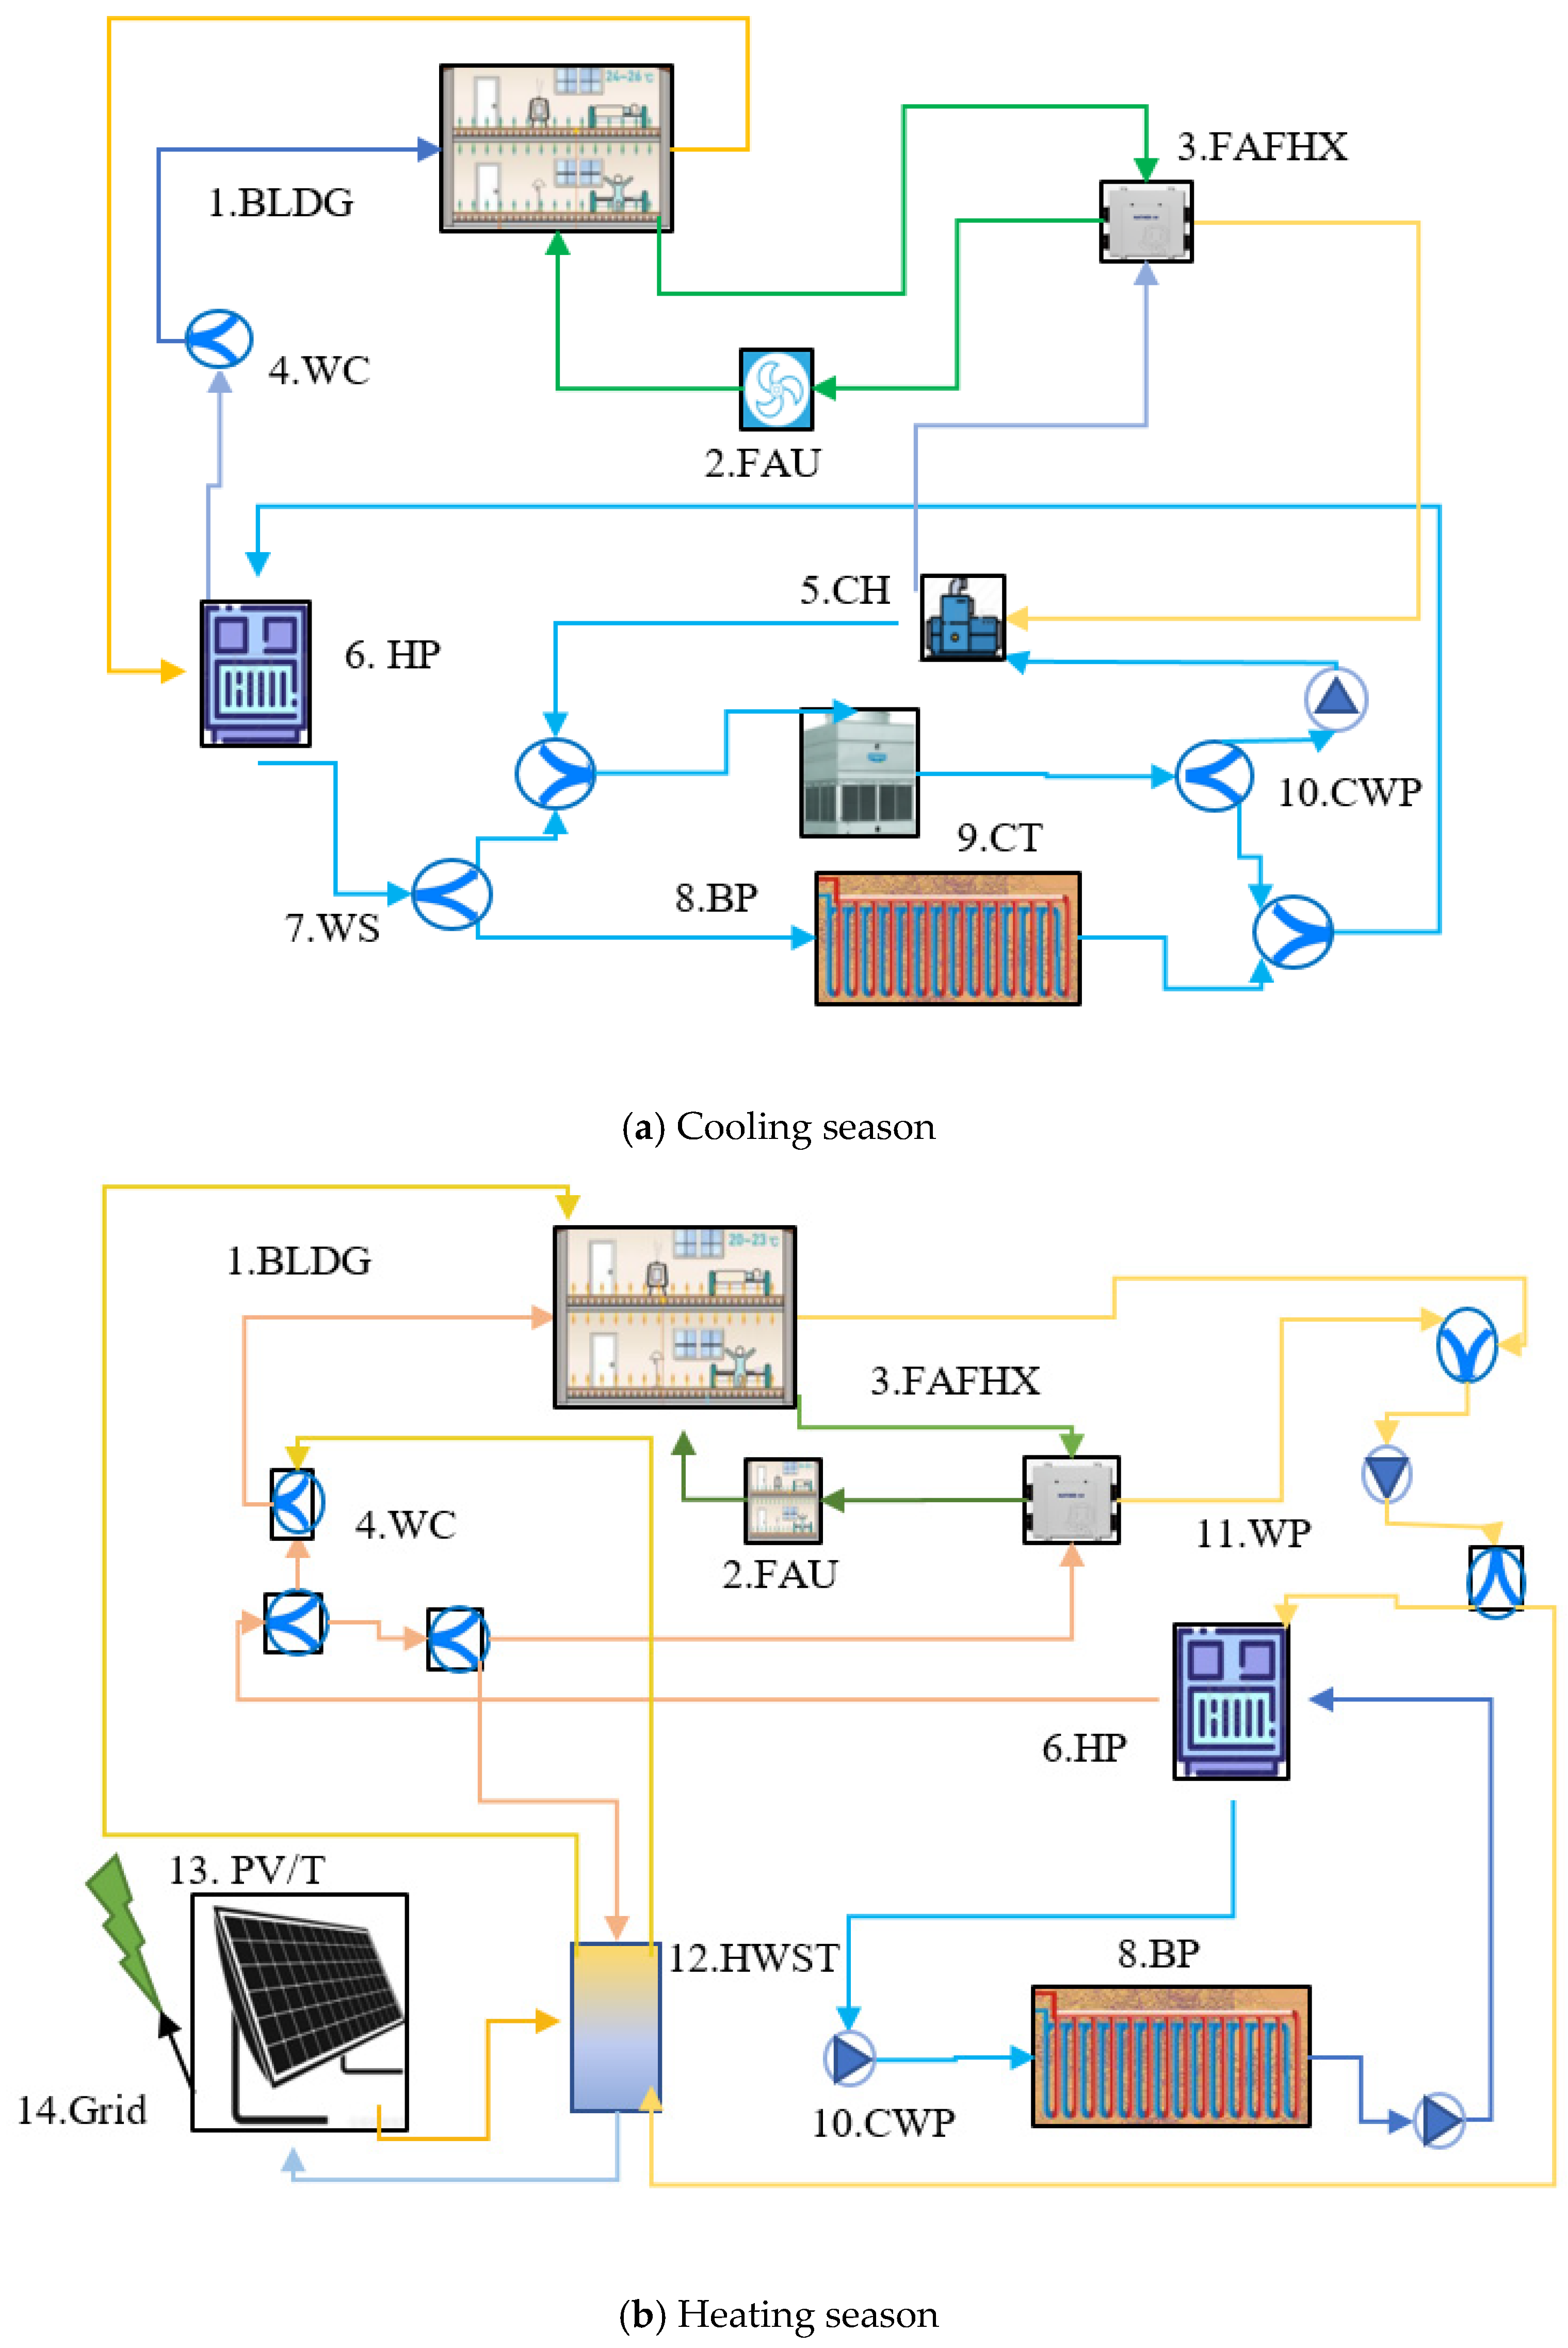
2. Description of the System

The building located in Shanghai has a total construction area of 4160 m2. It is a three-story office building (Figure 1) with office rooms, data rooms, large conference rooms, equipment rooms, a monitoring room, and a bathroom on each floor. The PV/T solar air collector and hot water storage tank are placed on the roof. The heat pump unit and cooling tower are located outside the building. The heat pump unit provides 7/12 °C chilled water in the cooling season and 45/40 °C in the heating season. The PV/T collector system provides 45 °C domestic hot water and serves as a heat source for radiant air conditioning during the heating season. The whole system consists of three parts: PV/T solar collector system, heat pump unit system and radiant air conditioning system with an independent fresh air unit.
Figure 2 presents the system operation diagram. During the cooling season, the heat pump unit provides chilled water to cool the fresh air and the high-temperature chiller supplies chilled water to the radiant terminal to maintain space temperature at 26 °C. The chiller will be turned ON when the space cooling load is above 10% of the maximum value. The heat pump unit and fresh air unit are turned ON during the cooling season and maximum fresh air flow is allowed during the transition season for energy saving purposes; minimum fresh air flow is provided during non-economizer mode. During the heating season, the system is operated under three modes to ensure the returned hot water temperature is higher than 30 °C and maintain space temperature at 18 °C: (1) the solar collector system serves as the only heat source for the system; (2) the heat pump unit serves as the only heat source; and (3) the solar collector system and the heat pump unit jointly provide heating to the building. The PV/T system mainly serves as a heat source for domestic hot water and space heating, and is also connected to the public power grid. Due to limited roof surface area, the PV/T system can only meet 30% of the maximum heating load. The heat pump unit will be turned on when the heating load exceeds 10% of the maximum value, otherwise, hot water will be supplied from the hot water storage tank to the radiant system for radiant heating. Minimum fresh air flow is provided during heating season.
The values of the system design parameters are listed in Table 1.
Chinese Standard Weather Data (CSWD), downloaded from the EnergyPlus official website [29], were used as climate inputs. According to [30], the occupancy density, minimum fresh air volume, lighting density, the equipment load density are 5 m2/person, 30 m3/h per person, 9 W/m2, and 15 W/m2, respectively. The cooling temperature setpoint and heating temperature setpoint are 26 °C and 18 °C, respectively. The hourly thermal load of the building, as calculated by DesignBuilder, is presented in Figure 3, with a maximum cooling and heating load of 442 kW and 278 kW, respectively.

3. Mathematical Models

3.1. Exergy Model of the PV/T System

The electrical and thermal efficiencies of the PV/T system can be calculated as the ratios of the electrical energy and thermal energy obtained by the system to the absorbed solar energy (Equation (1a,b)) [31].
The electrical efficiency can be calculated as:
η e = U m I m I · A PV
where η e is the electrical efficiency of the system, dimensionless; Um and Im are the voltage and current at maximum power output, taken as 31.2 V and 8.86 A, respectively; I is solar radiation intensity, in W/m2; Apv is photovoltaic cell module area, in m2.
The thermal efficiency of the water tank can be calculated as:
η th = c p m ( T W 1 T W 2 ) I · A PV
where cp is the specific heat of the water, in J/(kg·K); m is the mass flow rate of the water, in kg/s; Tw1 and Tw2 are the leaving and entering water temperature, respectively, in °C.
Electrical energy is high-quality energy, and therefore, the electrical energy generated by the PV/T system can be considered as exergy:
E x e =   U m I m
The absorbed exergy of the PV/T system all comes from solar energy and can be calculated as:
E x all = Ψ s I A PV
where Ψ s is the solar exergy conversion coefficient, which can be obtained by the following formula [32]:
Ψ s = 1 4 3 · T o T solar + 1 3 T o T solar 4
where Tsolar is the solar surface temperature, taken as 5760 K; To is the instant ambient air temperature, in K.
The specific exergy of the water can be calculated as [33]:
e = h T 0 s
where h is the specific enthalpy, in J/kg; s is the specific entropy, in J/kg·K.
Therefore, the entering exergy and leaving exergy of the hot water can be calculated using Equations (6) and (7):
E x in = m ( h in T o s in )
E x out = m ( h out T o s out )
where hin and hout are the inlet and outlet specific enthalpy of the water, in J/kg; sin and sout are the inlet and outlet specific entropy of the water, in J/kg·K; m is the mass flow rate of the water, in kg/s.
The thermal exergy obtained from the heat source side of the PV/T heat collection system be considered as expenditure exergy [34]:
E x th _ S = E x out _ 1 E x in _ 1 = m [ ( h O 1 h O 2 ) - T o ( s O 1 s O 2 ) ] = m c p [ ( T O 1 T O 2 ) T o ln T O 2 T O 1 ] =   m c c p [ ( T co T ci ) T o ln T co T ci ]
where mc is the mass flow rate of the cooling water, in kg/s; Tco and Tci are the outlet and inlet cooling water temperature of the collector system, in °C.
The thermal exergy loss can be calculated via Equation (9a–c):
E x dest _ W =   Q S ( 1 T 0 T s )
Q s =   m s c p T sm d τ
T sm = i = 1 m t i m s
where Qs is the heat storage rate of hot water storage tank, in kW; Tsm is the average temperature of the hybrid hot water tank, in °C; ms is the mass of the water inside the hot water tank, in kg.
When the space heating is served by the hot water storage tank, the exergy gain can be calculated as:
E x th _ W 1 = E x out _ 3 E x in _ 4 = m g c p [ ( T s T eo ) T o ln T s T eo ]
When the space heating is served by the heat pump unit, the exergy gain can be calculated as:
x th _ W 2 = E x out _ 3 E x in _ h = m g c p [ ( T s T h ) T o ln T s T h ]
The exergy gain of the domestic hot water can be calculated as:
E x th _ Wh = E x out _ HW E x in _ HW = m hw c p [ ( T w 1 T w 2 ) T o ln T w 1 T w 2 ]
Therefore, the total exgery loss of the hot water storage tank can be calculated as:
E x dest = E x th _ S E x dest _ W F r E x th _ W 1 F p F ¯ r E x th _ W 2 E x th _ Wh = m c c p [ ( T co T ci ) T o ln T co T ci ] Q S ( 1 T 0 T s ) F r m g c p [ ( T s T eo ) T o ln T s T eo ] F p F ¯ r m g c p [ ( T s T h ) T o ln T s T h ] m hw c p [ ( T w 1 T w 2 ) T o ln T w 1 T w 2 ]
where Teo is the supply water temperature of the heat pump unit at the demand side, in K; Th is the leaving water temperature at the radiant terminal, in K; Tw1 and Tw2 are the entering and leaving water temperature of the domestic hot water, in K; Fp and Fr are the control function of the heat collector and heat pump unit, “1” represents “ON” and “0” represents “OFF”.
Thus, the exergy loss, electrical exergy efficiency and thermal exergy efficiency of the PV/T collector system can be calculated via Equations (14)–(16a):
E x PVT = E all Q elc Q heat
where Eall is the total exergy of the PV/T collector system, in kW; Qelc is the electricity generation rate, in kW; Qheat is the heat collecting rate, in kW.
ξ e = E x e E x solar = U m I m Ψ s I A PV = η e I A PV Ψ s I A PV = η e Ψ s
ξ th = E x loss E x solar = m c c p [ ( T co T ci T o ln T ci T co ) - m g c p ( T s T eo T o ln T s T eo ) ] Ψ s I A PV
The total exergy efficiency of the the PV/T collector system can then be calculated as the sum of electrical exergy efficiency and thermal exergy efficiency:
ξ = ξ e + ξ th

3.2. Exergy Model of Each Component During the Cooling Season

Figure 4 presents the system diagram of the ground source heat pump for exergy analysis. The blue color line refers to cooling operation and the red color line refers to heating operation. The state point approach is applied as it has been proved by other researchers [27,28] to be useful to calculate the energy consumption and exergy loss for each component. During the cooling season, cooling water enters the radiant system at point 5; after absorbing heat from the building, it reaches point 6 and then returns to the evaporator of the heat pump and cools down to point 5. The cooling water that absorbs heat in the condenser enters the buried pipe heat exchanger at point 7. After releasing heat to the soil, the water that changes to point 8 enters the condenser and circulates to absorb the heat released by the refrigerant and returns to point 7 [35].
(1) Exergy model of the compressor
The power required by the compressor can be obtained as:
W ˙ com = m ˙ ref ( h 1 h 2 )
The exergy loss of the compressor can be calculated as:
E ˙ x dest _ C = m ˙ ref ( e x h 1 e x h 2 ) + W ˙ com
The exergy efficiency of the compressor can be calculated as:
ξ ex dest _ C = M ˙ ref ( e x h 2 e x h 1 ) W ˙ com
The exergy loss rate of the compressor can be calculated as:
d _ c = E x dest _ C E x dest _ SYSEM
(2) Exergy model of the evaporator
The energy balance model of the evaporator can be obtained as:
m ˙ W _ C ( h 6 h 5 ) = m ˙ ref ( h 4 h 1 )
The exergy loss of the evaporator can be calculated as:
E ˙ x dest _ EVA = m ˙ ref ( e x h 4 e x h 1 ) - m ˙ W _ C ( e x h 6 e x h 5 ) + W ˙ pump _ 1
The exergy efficiency of the compressor can be calculated as:
η ex dest _ EVA = m ˙ W _ C ( e x h 6 e x h 5 ) m ˙ ref ( e x h 4 e x h 1 ) + W ˙ pump _ 1
The exergy loss rate and efficiency of the evaporator can be obtained via Equations (24)–(26):
E ˙ x dest _ EVA = m ˙ ref ( e x h 4 e x h 1 ) - m ˙ W _ C ( e x h 6 e x h 5 ) + W ˙ pump _ 1
ξ ex dest _ EVA = m ˙ W _ C ( e x h 6 e x h 5 ) m ˙ ref ( e x h 4 e x h 1 ) + W ˙ pump _ 1
m ˙ ref = Q eva h 1 h 4
(3) Exergy model of the condenser
The energy balance of the condenser can be obtained as:
m ˙ W _ B ( h 8 h 7 ) = m ˙ ref ( h 2 h 3 )
The exergy loss of the condenser can be calculated as:
E ˙ x dest _ CON = m ˙ W _ B ( e x h 7 e x h 8 ) - m ˙ ref ( e x h 3 e x h 2 ) + W ˙ pump
The exergy efficiency of the condenser can be calculated as:
ξ dest _ CON = m ˙ ref ( e x h 3 e x h 2 ) m ˙ W _ B ( e x h 7 e x h 8 ) + W ˙ pump _ 2
The exergy loss rate of the condenser can be calculated as:
d CON = E ˙ x dest _ CON E x dest _ SYSEM
(4) Exergy model of the expansion valve:
The energy balance of the expansion valve can be written as:
m ˙ ref ( h 3 ) = m ˙ ref ( h 4 )
The exergy loss of the expansion valve can be obtained as:
E ˙ x dest _ TXV = m ˙ ref ( e x h 3 e x h 4 )
The exergy loss rate of the expansion valve can be calculated as:
d TXV = E ˙ x dest _ TXV E x dest _ SYSEM
(5) Exergy model of the cooling tower [36]:
The energy balance equation of the cooling tower can be written as:
Q ct = c pw m ˙ we ( T 9 T 10 )
The exergy loss of the cooling tower can be calculated as:
E x ct = Q ct ( 1 T a / T ct ) - m we ( e 9 e 10 )   = Q ct ( 1 T a / T ct ) m we ( T 9 T 10 Ln T 9 T 10 )
The exergy efficiency of the cooling tower can be calculated as:
ξ ct = m we ( e 9 e 10 ) Q ct ( 1 T a / T ct ) = m we ( T 9 T 10 Ln T 9 T 10 Q ct ( 1 T a / T ct )
(6) Exergy model of the buried pipe heat exchanger [35]:
The transfer rate of heat between ground heat exchanger and the ground can be calculated as:
Q ˙ BHE = m ˙ W _ B ( h 8 h 7 )
The exergy loss of the heat exchanger can be calculated as:
E ˙ x dest _ BHE = m ˙ wa _ BHE ( e x h 8 e x h 7 ) + E ˙ x QBHE   = m ˙ wa _ BHE ( e x h 8 e x h 7 ) Q BHE ( T 0 T soil 1 )
The exergy efficiency of the heat exchanger can be calculated as:
ξ BHE = m ˙ wa _ BHE ( e x h 8 e x h 7 ) E ˙ x QBHE
The exergy loss rate of the heat exchanger can be obtained as:
d BHE = E ˙ x dest _ BHE E x dest _ SYSEM
The exergy loss of the radiant terminal includes two parts: convection exergy loss and radiative exergy loss [37].
The thermal load of the radiant terminal can be written via Equations (41) and (42):
Q ˙ load _ L = m ˙ W _ ceiling ( h 5 h 6 )
Q ˙ load _ L = Q ˙ conv _ c + Q ˙ rad _ c
The exergy loss of the radiant terminal can be calculated as:
E ˙ x dest _ ceiling = m ˙ wa _ ceiling ( e x h 8 e x h 7 ) E x Qload = Q conv _ c ( 1 T 0 T a ) + A σ Fr [ T S 4 T r 4 ] 4 3 A σ Fr T r [ T S 3 T r 3 ]
According to ASHRAE Handbook [38], during cooling season, the convection heat transfer and radiative heat transfer can be calculated as:
Q conv _ c = 0.87 A ( T a T rad ) 1.25
Q rad _ c = A σ F r ( T S T r ) 4
The exergy efficiency of the radiant terminal can be calculated as:
ξ r = E ˙ x Qload m ˙ wa _ ceiling ( e x h 8 e x h 7 )
The exergy loss rate of the radiant terminal can be calculated as:
d r = E ˙ x dest _ ceiling E x dest _ SYSEM
(7) Exergy model of the fresh air unit [32]
The exergy efficiency of the fresh air unit can be calculated as:
ξ a = E ef E in
Exergy loss of total heat exchanger can be calculated as:
E x NEW = E x liqu E x air = C p m xf _ h ( T X 1 T X 2 To ln T X 1 T X 2 ) Q air W air
The exergy efficiency of the total heat exchanger (for heating unit) can be calculated as:
ξ NEW _ X = E XNEW / E NEW = C p m xf ( T X 1 T X 2 To ln T X 1 T X 2 ) Q air W air Q LR T 0 T 1
Since the PV/T heat collection and heat storage system does not provide cooling for the building in summer, the total exergy loss of the PV/T system involves electricity only and its exergy loss can be calculated as:
E ˙ x dest _ SYSTEM = E ˙ x dest _ EVA + E ˙ x dest _ CON + E ˙ x dest _ TXV + E ˙ x dest _ COM +   E ˙ x dest _ BHE + E ˙ x dest _ ceiling + E ˙ x NEW + W ˙ pump + W ˙ pump _ 1 + W ˙ COM
Thus, the exergy efficiency of the system can be calculated as the ratio of the revenue exergy gain against the paid exergy:
ξ ex = Q load _ L + ξ e Ψ s I A PV + E x NEW W ˙ pump + W ˙ pump _ 1 + W ˙ com E ˙ x QBHE + E d

3.3. Exergy Model of Each Component During the Heating Season

(1) Exergy Model of the Compressor:
The power required by the compressor can be calculated as:
W ˙ com = m ˙ ref ( h 1 h 2 )
The exergy loss of the compressor can be calculated as:
E ˙ x dest _ C = m ˙ ref ( e x h 1 e x h 2 ) + W ˙ com
The exergy efficiency of the compressor can be calculated as:
ξ e x dest _ C = M ˙ ref ( e x h 2 e x h 1 ) W ˙ com
The exergy loss rate of the compressor can be calculated as:
d _ C = E x dest _ C E x dest _ SYSEM
(2) Exergy model of the evaporator:
The energy balance of the evaporator can be written as:
m ˙ W _ B ( h 8 h 7 ) = m ˙ ref ( h 2 h 3 )
The exergy loss of the evaporator can be calculated as:
E ˙ x dest _ EVA = m ˙ ref ( e x h 2 e x h 3 ) m ˙ W _ B ( e x h 8 e x h 7 ) m ˙ W _ H ( e x h 04 e x h 03 )   + W ˙ pump _ 1 + W ˙ pump _ 2
The exergy efficiency of the evaporator can be calculated as:
e x dest _ C = m ˙ ref ( e x h 2 e x h 3 ) m ˙ W _ B ( e x h 8 e x h 7 ) + m ˙ W _ H ( e x h 04 e x h 03 ) + W ˙ pump _ 1 + W ˙ pump _ 2
The exergy loss rate of the evaporator can be calculated as:
d EVA = E ˙ x dest _ EVA E x dest _ SYSEM
(3) Exergy model of the condenser:
The energy balance equation can be written as:
m ˙ W _ C ( h 6 h 5 ) = m ˙ ref ( h 2 h 3 )
The exergy loss of the condenser can be calculated as:
E ˙ x dest _ CON = m ˙ ref ( e x h 1 e x h 4 ) - m ˙ w _ ceiling ( e x h 6 e x h 5 ) + W ˙ pump
The exergy efficiency of the condenser can be calculated as:
ξ e x dest _ C = m ˙ w _ ceiling ( e x h 6 e x h 5 ) m ˙ ref ( e x h 1 e x h 4 ) + W ˙ pump
The exergy loss rate of the condenser can be calculated as:
d CON = E ˙ x dest _ CON E x dest _ SYSEM
(4) Exergy model of the expansion valve
The energy balance of the expansion valve can be written as:
m ˙ ref ( h 3 ) = m ˙ ref ( h 4 )
The exergy loss of the expansion valve can be calculated as:
E ˙ x dest _ TXV = m ˙ ref ( e x h 3 e x h 4 )
The exergy loss rate of the expansion valve can be calculated as:
d TXV = E ˙ x dest _ TXV E x dest _ SYSEM
(5) Exergy model of the buried pipe heat exchanger [39]
The transfer rate of heat between ground heat exchanger and the ground can be calculated as:
Q ˙ BHE = m ˙ W _ B ( h 7 h 8 )
The exergy loss of the heat exchanger can be calculated as:
E ˙ x dest _ BHE = m ˙ wa _ BHE ( e x h 7 e x h 8 ) + E ˙ x QBHE   = m ˙ wa _ BHE ( e x h 7 e x h 8 ) + Q BHE ( 1 T 0 T soil )
The exergy efficiency of the heat exchanger can be calculated as:
d BHE = m ˙ wa _ BHE ( e x h 8 e x h 7 ) E ˙ x QBHE
The exergy loss rate of the heat exchanger can be calculated as:
d BHE = E ˙ x dest _ BHE E x dest _ SYSEM
(6) Exergy model of the radiant terminal:
The thermal load of the radiant system can be calculated as:
Q ˙ load _ H = m ˙ W _ ceiling ( h 6 h 5 )
The exergy loss of the radiant terminal can be calculated as:
E ˙ x dest _ ceiling = m ˙ wa _ ceiling ( e x h 5 e x h 6 ) E x Qload   = m w _ ceiling ( e x h 5 e x h 6 ) Q conv _ c ( 1 T 0 T a ) + A σ Fr [ T S 4 T r 4 ]   4 3 A σ Fr T r [ T S 3 T r 3 ]
The exergy efficiency of the radiant terminal can be calculated as:
ξ ceiling = m w _ ceiling ( e x h 6 e x h 5 ) Q conv _ c ( 1 T 0 T a ) + A σ Fr [ T S 4 T r 4 ] 4 3 A σ Fr [ T S 4 T r 4 ]
The exergy loss of the radiant system can be calculated as:
d ceiling = E ˙ x dest _ ceiling E x dest _ SYSEM
In winter, the PV/T heat collection and storage system and the ground source heat pump serve as the heat source. Therefore, its revenue exergy includes the thermal exergy obtained by the underground pipes and the hot water storage tank. The expenditure exergy of the system includes all input work exergy of the heat pump system:
E ˙ x dest _ SYSTEM = E ˙ x dest _ EVA + E ˙ x dest _ CON + E ˙ x dest _ TXV + E ˙ x dest _ COM +   E ˙ x dest _ BHE + E ˙ x dest _ ceiling + E ˙ x loss + W ˙ pump + W ˙ pump _ 1 + W ˙ COM
The system exergy efficiency thus can be calculated as:
ξ ex = E ˙ x QAHU + E ˙ x e W ˙ pump + W ˙ pump _ 1 + W ˙ com + E ˙ x QBHE = Q load _ H + ξ e Ψ s I A PV W ˙ pump + W ˙ pump _ 1 + W ˙ com + E ˙ x QBHE
(7) Exergy model of the heat pump unit:
The input exergy of the heat pump unit can be calculated as:
E ˙ GAHP _ in = m ˙ g · C w ( T 7 T 6 ) ( 1 2 T o T 7 + T 6 )
The output exergy of the heat pump unit can be calculated as:
E ˙ GAHP _ out = m ˙ h · C w ( T 8 - T 9 ) ( 1 2 T o T 8 + T 9 )
The output mechanical exergy of the heat pump unit can be calculated as:
E ˙ hp = W hp η c
The exergy loss of the heat pump unit can be calculated as:
E ˙ x GASP = E ˙ GAHP _ out + E ˙ hp E ˙ GAHP _ in = m ˙ h · C w ( T 8 T 9 ) ( 1 2 T o T 8 + T 9 )   + W hp η c m ˙ g · C w ( T 7 T 6 ) ( 1 2 T o T 7 + T 6 )
The exergy efficiency of the heat pump unit can be calculated as:
ξ g = E ˙ GAHP _ out E ˙ hp + E ˙ GAHP _ in
Exergy model of the distributing system
The exergy loss of the distributing system can be calculated as:
E X _ hd = γ hd · Q hp · ( 1 2 T o T sup T re )
Q hp = m h c p ( T sup T re )
where Q h p is the heating capacity of the unit, in kW.
The exergy efficiency of the distributing system can be calculated as:
ξ hd = 1 E X _ hd E hpout = 1 γ hd m wa c p ( T sup T re ) ( 1 2 T O T sup T re ) m g c p ( T 6 T 5 T O Ln T 6 T 5 )
where γ h d is the heat loss rate of the distribution network, taken as 2.5%.
The input power of the heat pump unit can be calculated as:
W com = i = 1 2 Q load × X i CO P i
The system COP is calculated as:
CO P system = Q load W total
The COP of the heat pump unit is calculated as:
CO P HP = Q HP W HP
where Q load is the thermal load of the building, in kW; CO P i is the COP of the ith heat pump unit; X i is the load ratio of the ith heat pump unit against the thermal load of the building.
The water flow rate of the radiant system can be calculated as:
m ˙ wa _ ceiling   = Q load _ L C p ( T 5 T 6 ) ( summer   mode )
m ˙ wa _ ceiling   = Q load _ H C p ( T 6 T 5 ) ( winter   mode )
m ˙ W _ B = Q ˙ BHE ( T 8 T 7 )
m ˙ wa _ ceiling   = m ˙ wa _ C  
The leaving chilled/cooling water temperature can be calculated via Equations (93)–(96):
Li = Q load _ L × X i
W com = i = 1 2 Q load × X i CO P i
t 5 = t 6 L i m i C p
t 7 = t 8 + L i + W HP _ i m i C p

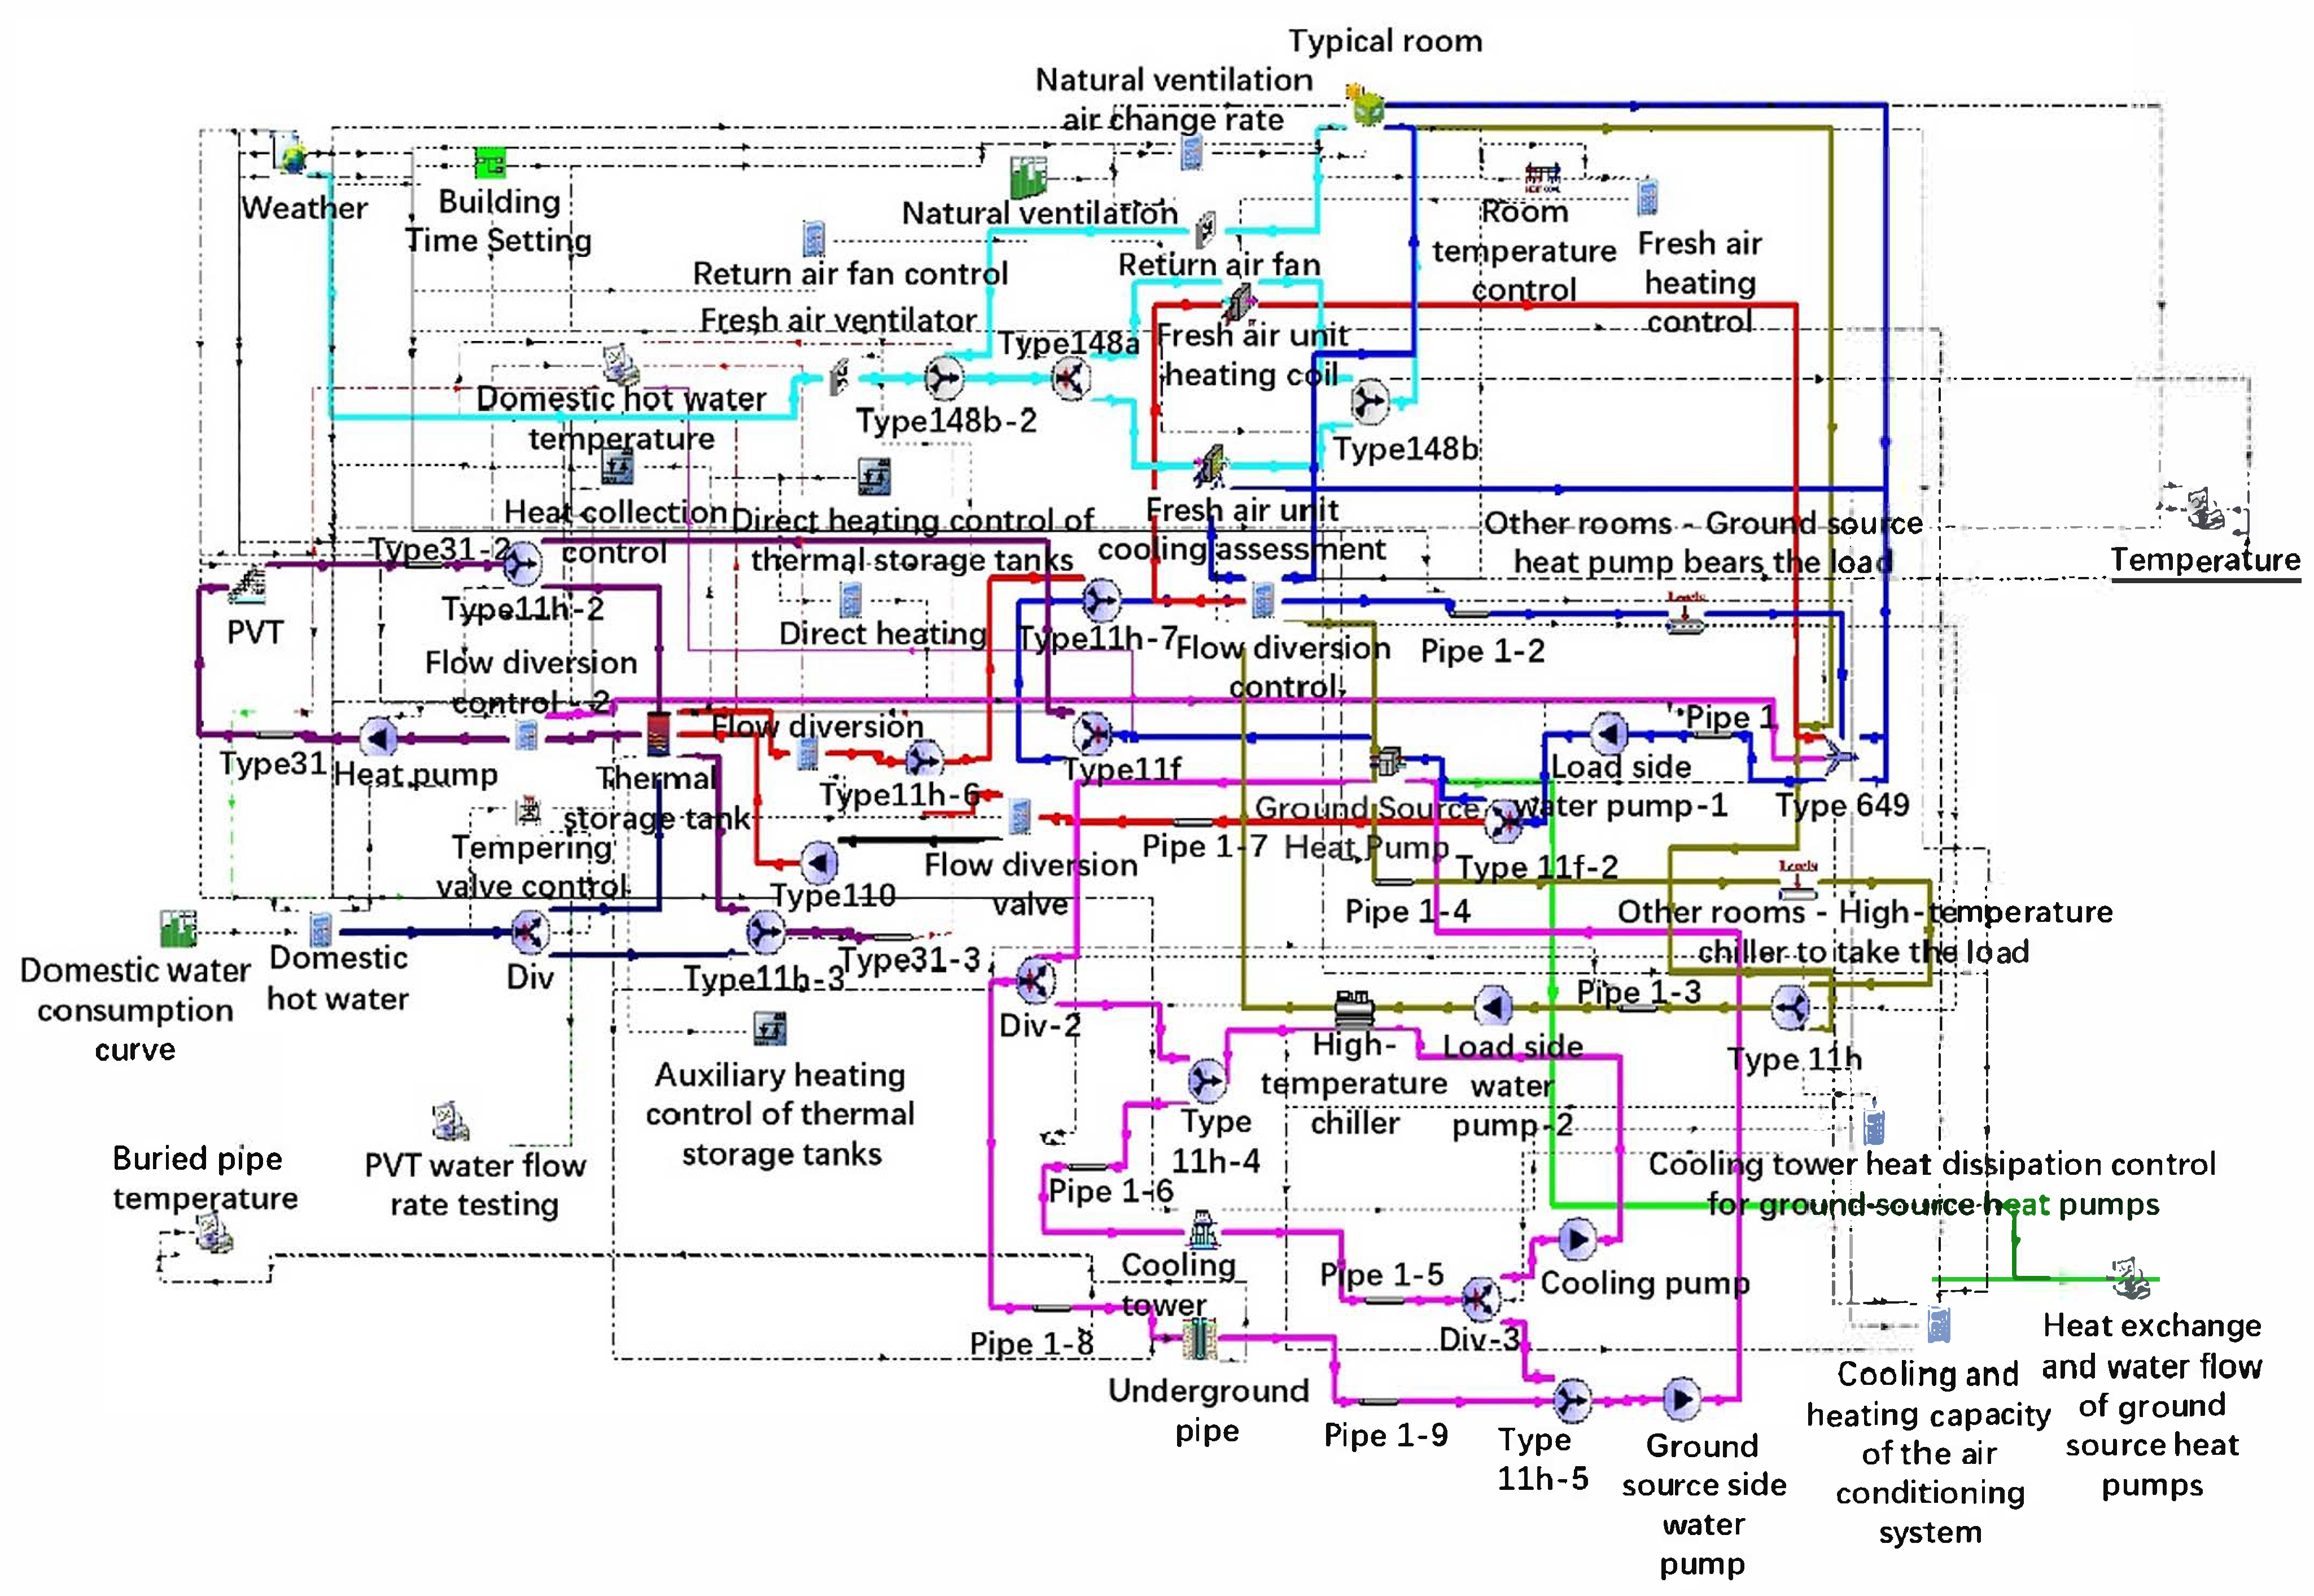
3.4. Mathematical Model Under TRNSYS Environment

The whole system is developed under the TRNSYS environment (Figure 5). Type50b, a PV module that can simulate standard flat-plate collector and concentrating combined collectors, is used to represent the PV/T heat collection and power generation system. Type156, which models the fluid in the storage tank that interacts with the fluid in the heat exchanger, is used to simulate the hot water storage tank. Type110, which models a variable speed pump that is able to maintain any outlet mass flow rate, is used to simulate the circulation pumps. Type216 and Type666, where their operation performance parameters can be customized, are used to simulate the heat pump and chiller. Type162b, which models the performance of a multiple-cell counter flow or crossflow cooling tower and sump, is used to simulate the cooling tower. Type577, which models the vertical heat exchanger that interacts thermally with the ground, is used to simulate the buried pipe. Type753e, which models a heating coil with various control modes, and Type508e, which models a cooling coil with various control modes, are used to simulate the fresh air unit with/without heating, respectively. The type of soil in Shanghai is silty clay, with density of 1530 kg/m3, heat capacity of 920 J/kg∙K, and diffusivity of 1.06 × 10⁻⁶ (m2/s), and the soil temperature stabilized at 17.30 °C under the depth of 10 m [40]. The PV efficiency degradation is assumed to be 0.3%/year for post-2010 installations based on Jordan et al. [41].

4. Model Validation

The outcomes of the ground source heat pump and radiant system computer model, and PT/V collector system were verified with experimental and simulation results from Refs. [16,42], respectively.

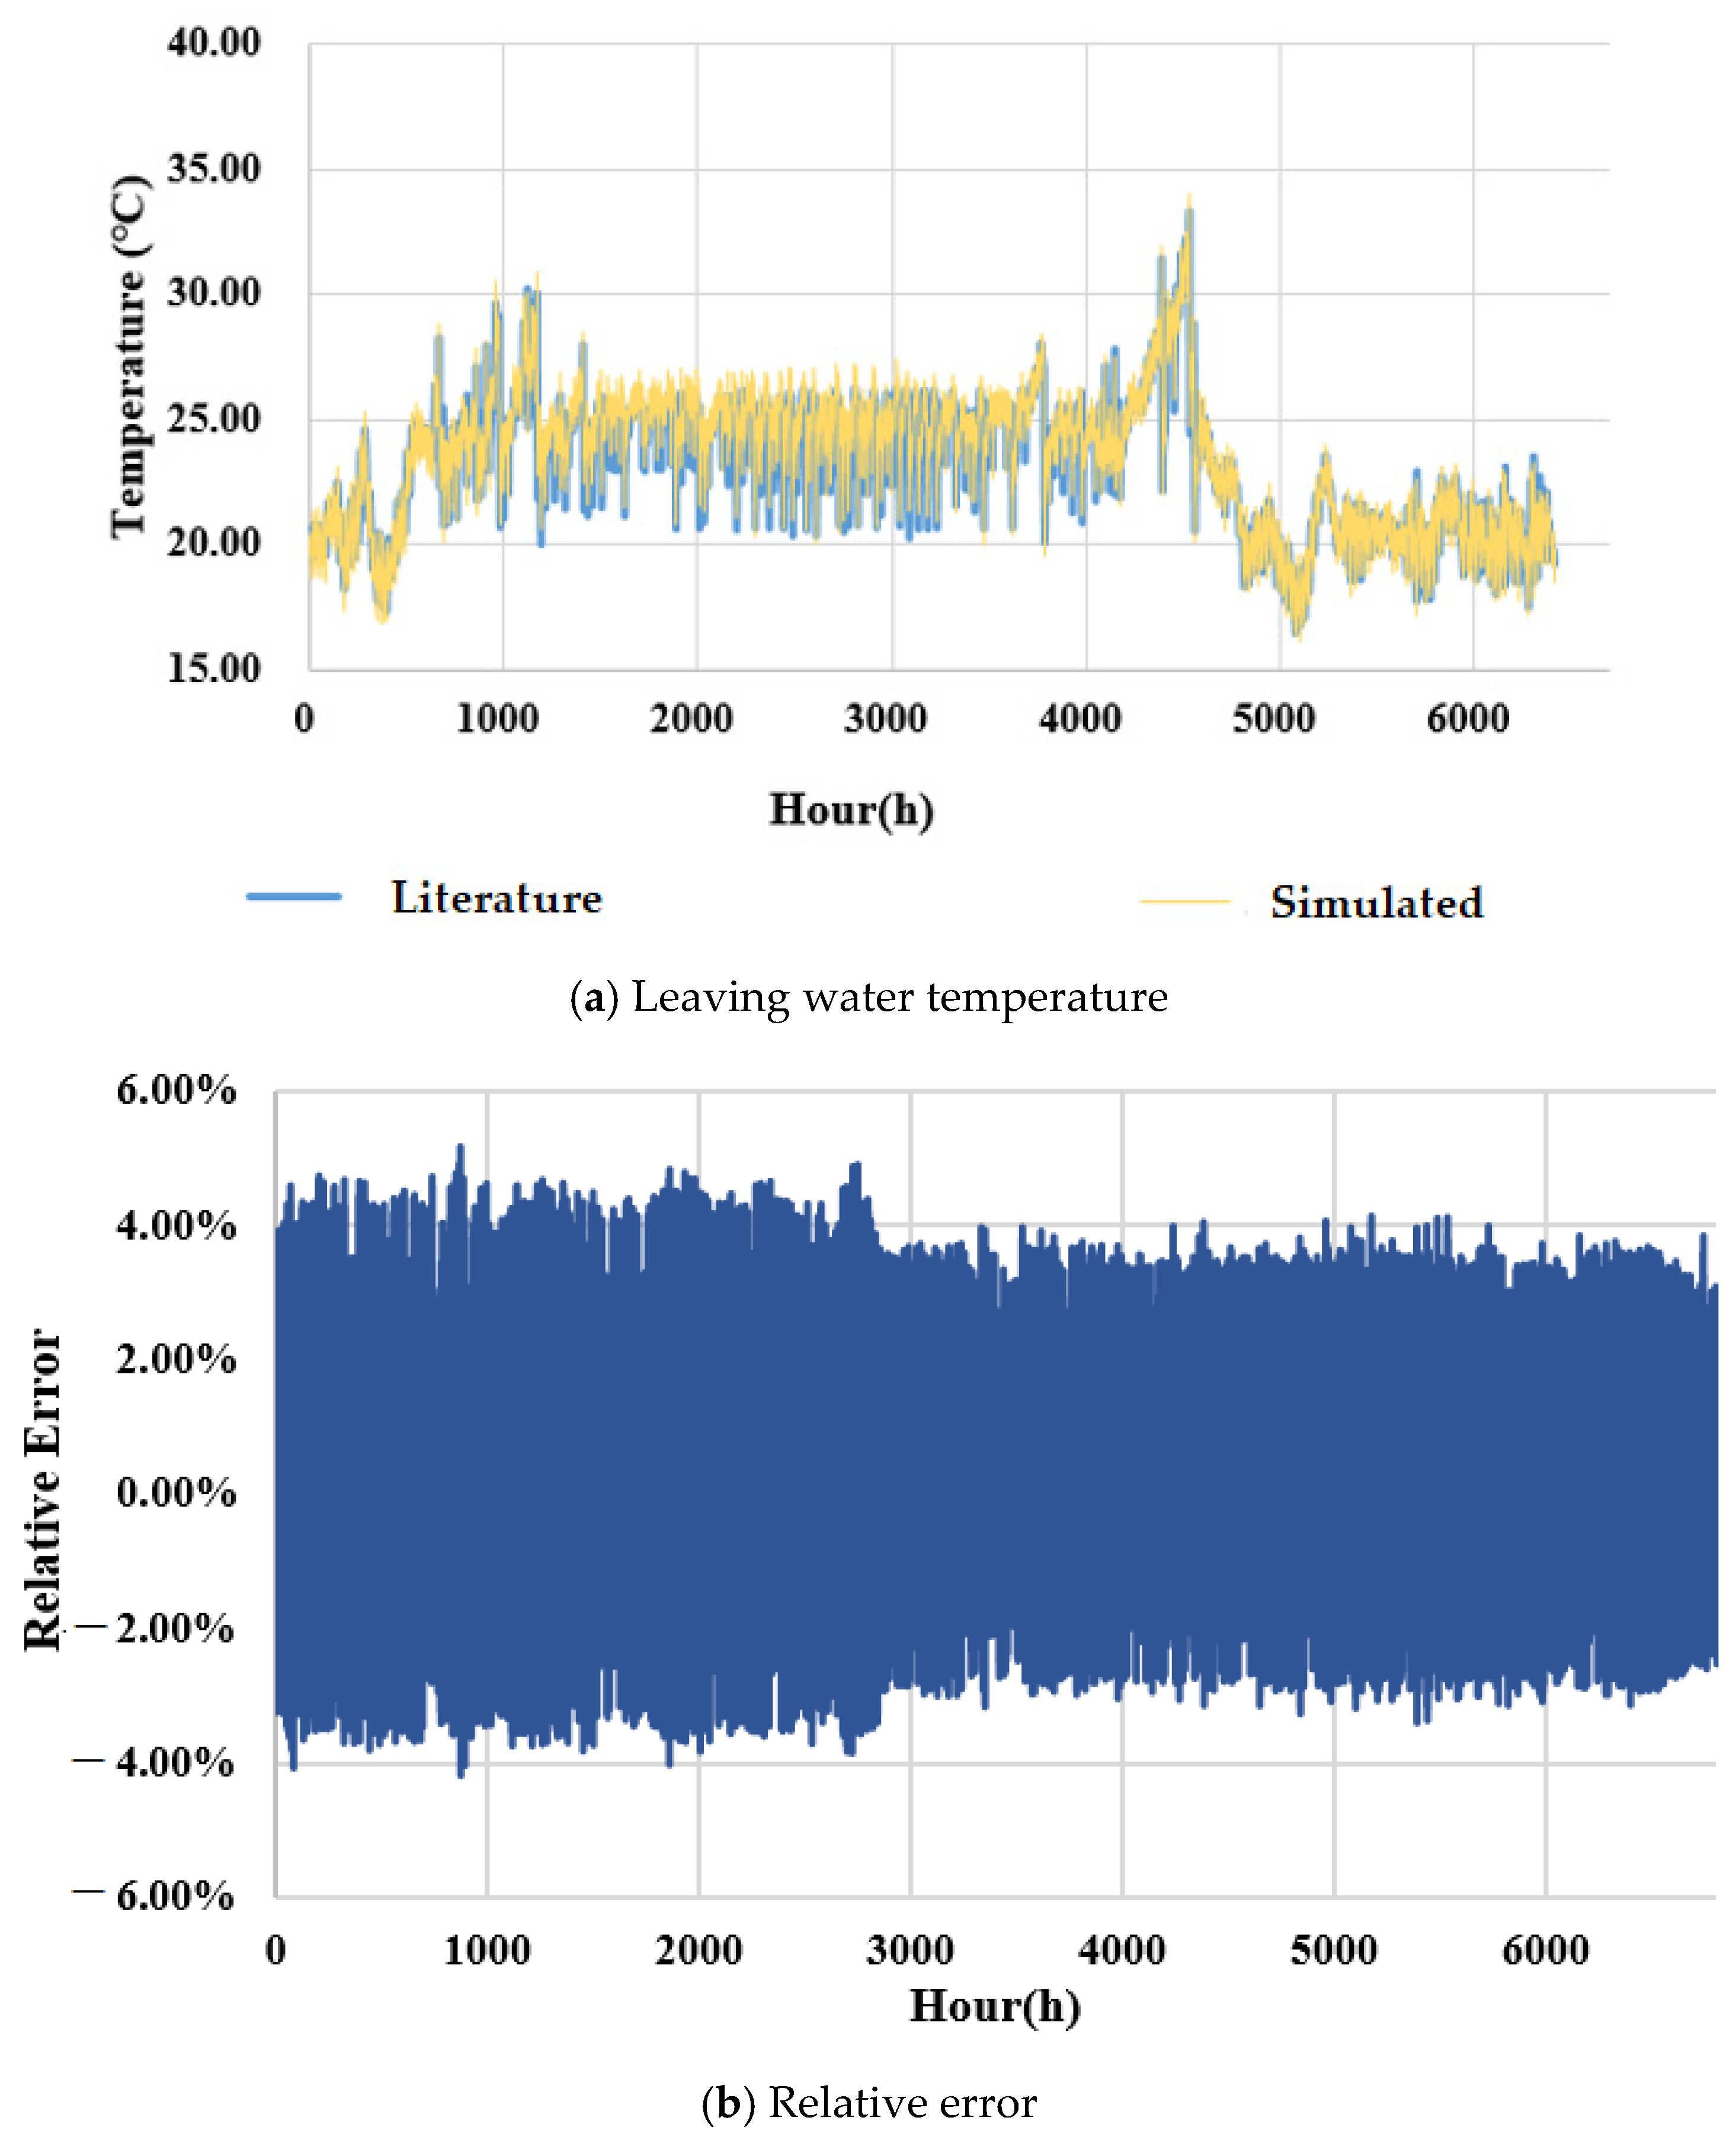
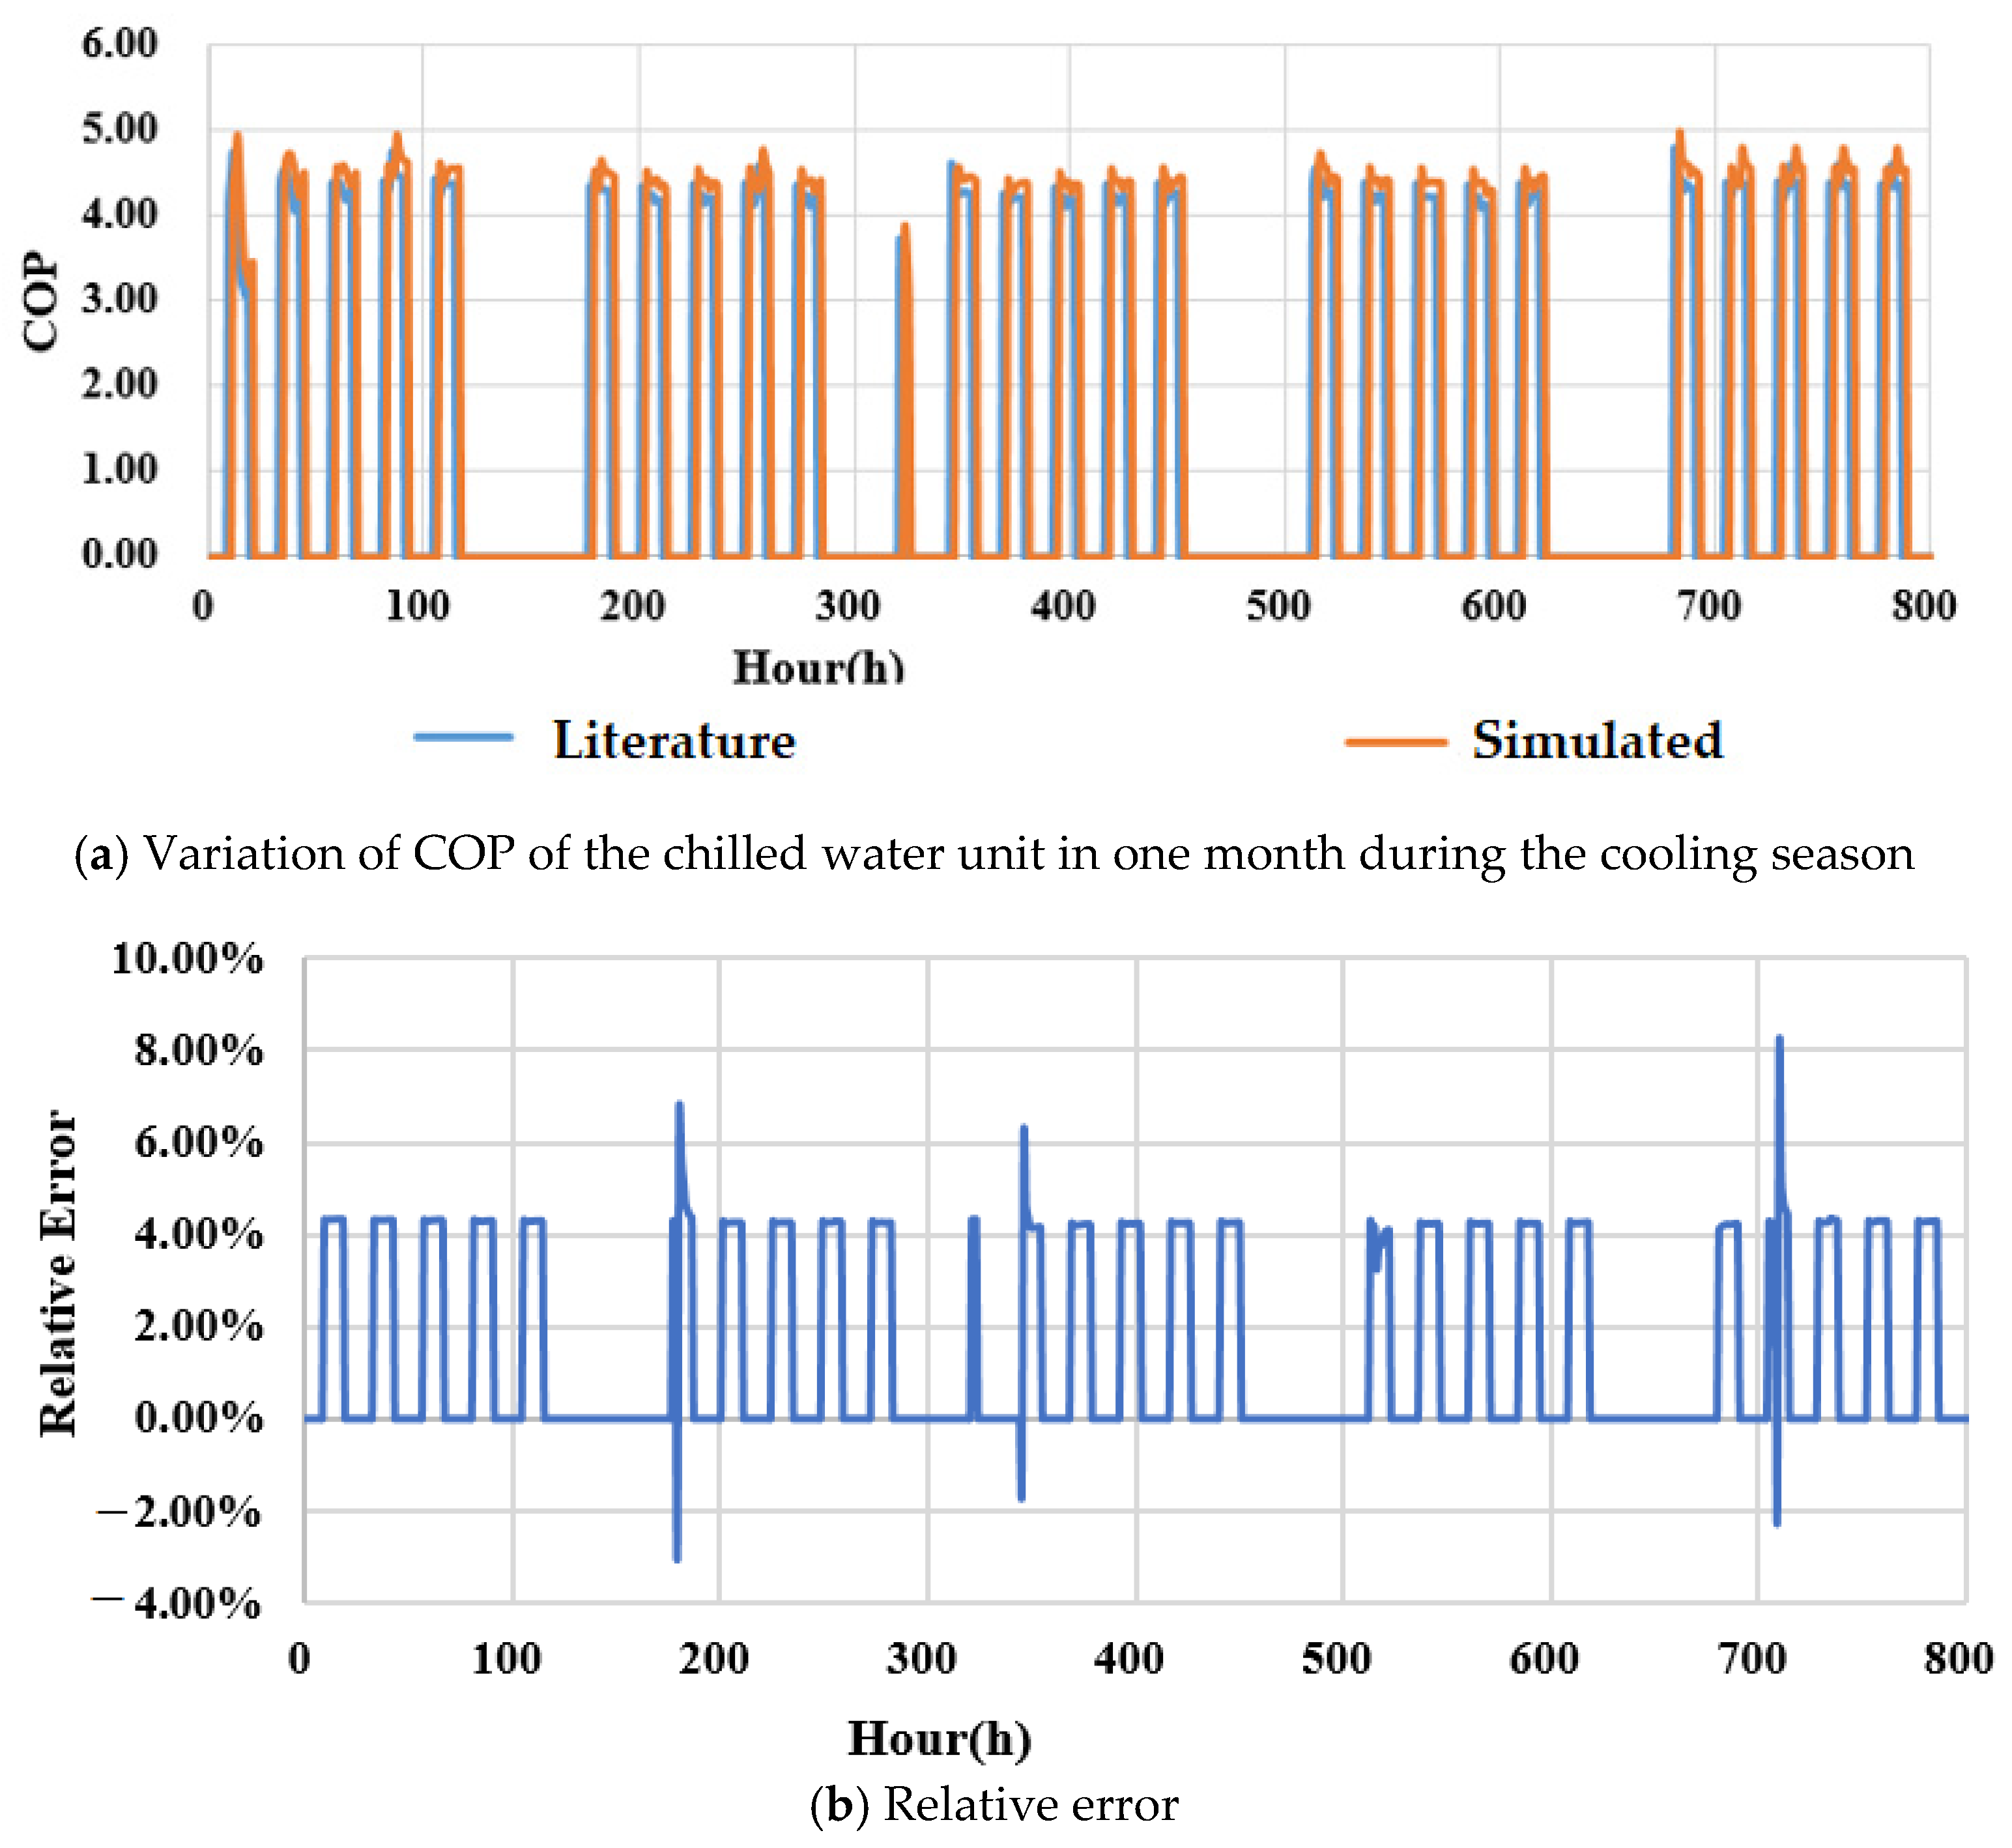
4.1. Validation on the Ground Source Heat Pump and Radiant System

The simulation results on the ground source heat pump and radiant system were compared with the ones from Ma et al. from practical projects [16]. Table 2 lists the values of the parameters on the radiant system and buried pipe heat exchanger.
Comparisons between the simulated results and the ones from [41] are listed in Table 3. It can be observed that the maximum temperature is less than 0.5 °C and the difference in thermal load is less than 0.9 kW, indicating good agreement between the simulated results and the ones from the literature.
Figure 6 presents an example of the comparison between the hourly source-side supply water temperature. It can be observed that the maximum relative error is less than 6%.
Figure 7 presents an example of the comparison between the hourly supply water temperature of the radiant system. It can be observed that the maximum relative error is less than 5.1%.
Figure 8 presents an example of the comparison between the hourly COP of the heat pump for one month during the cooling season. It can be observed that the maximum relative error is less than 9.0% and most of the time less than 5%.

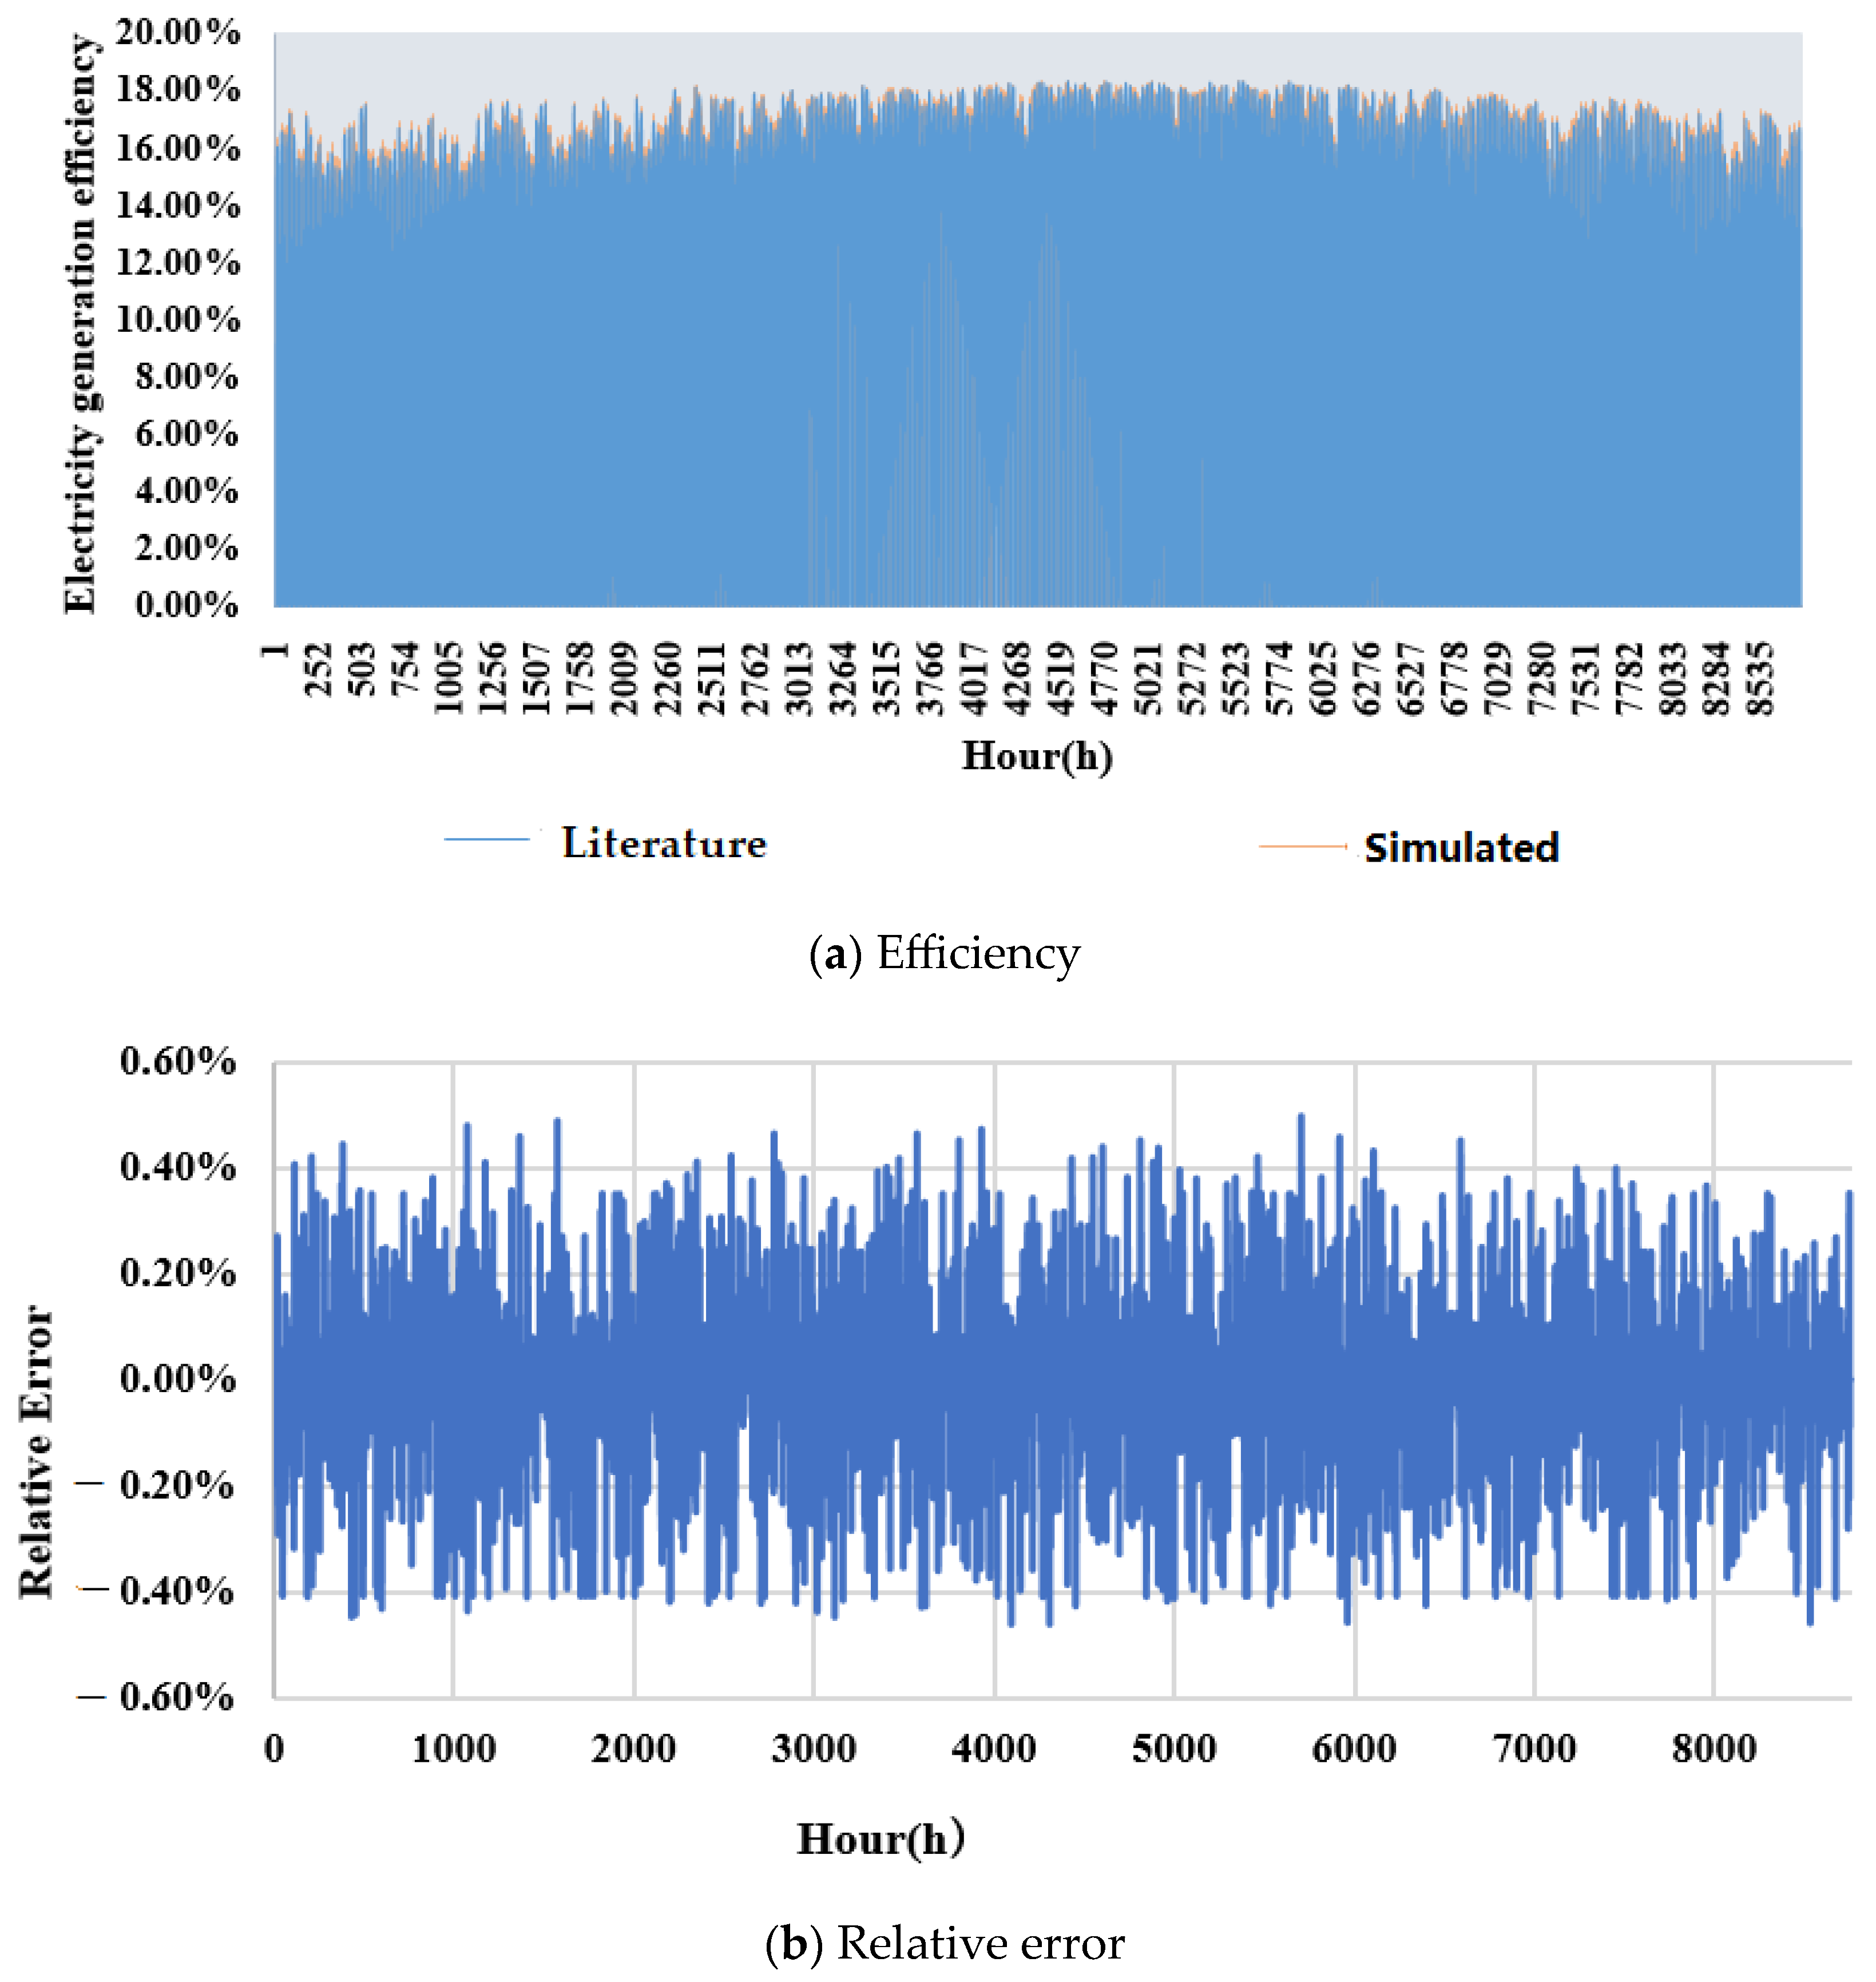
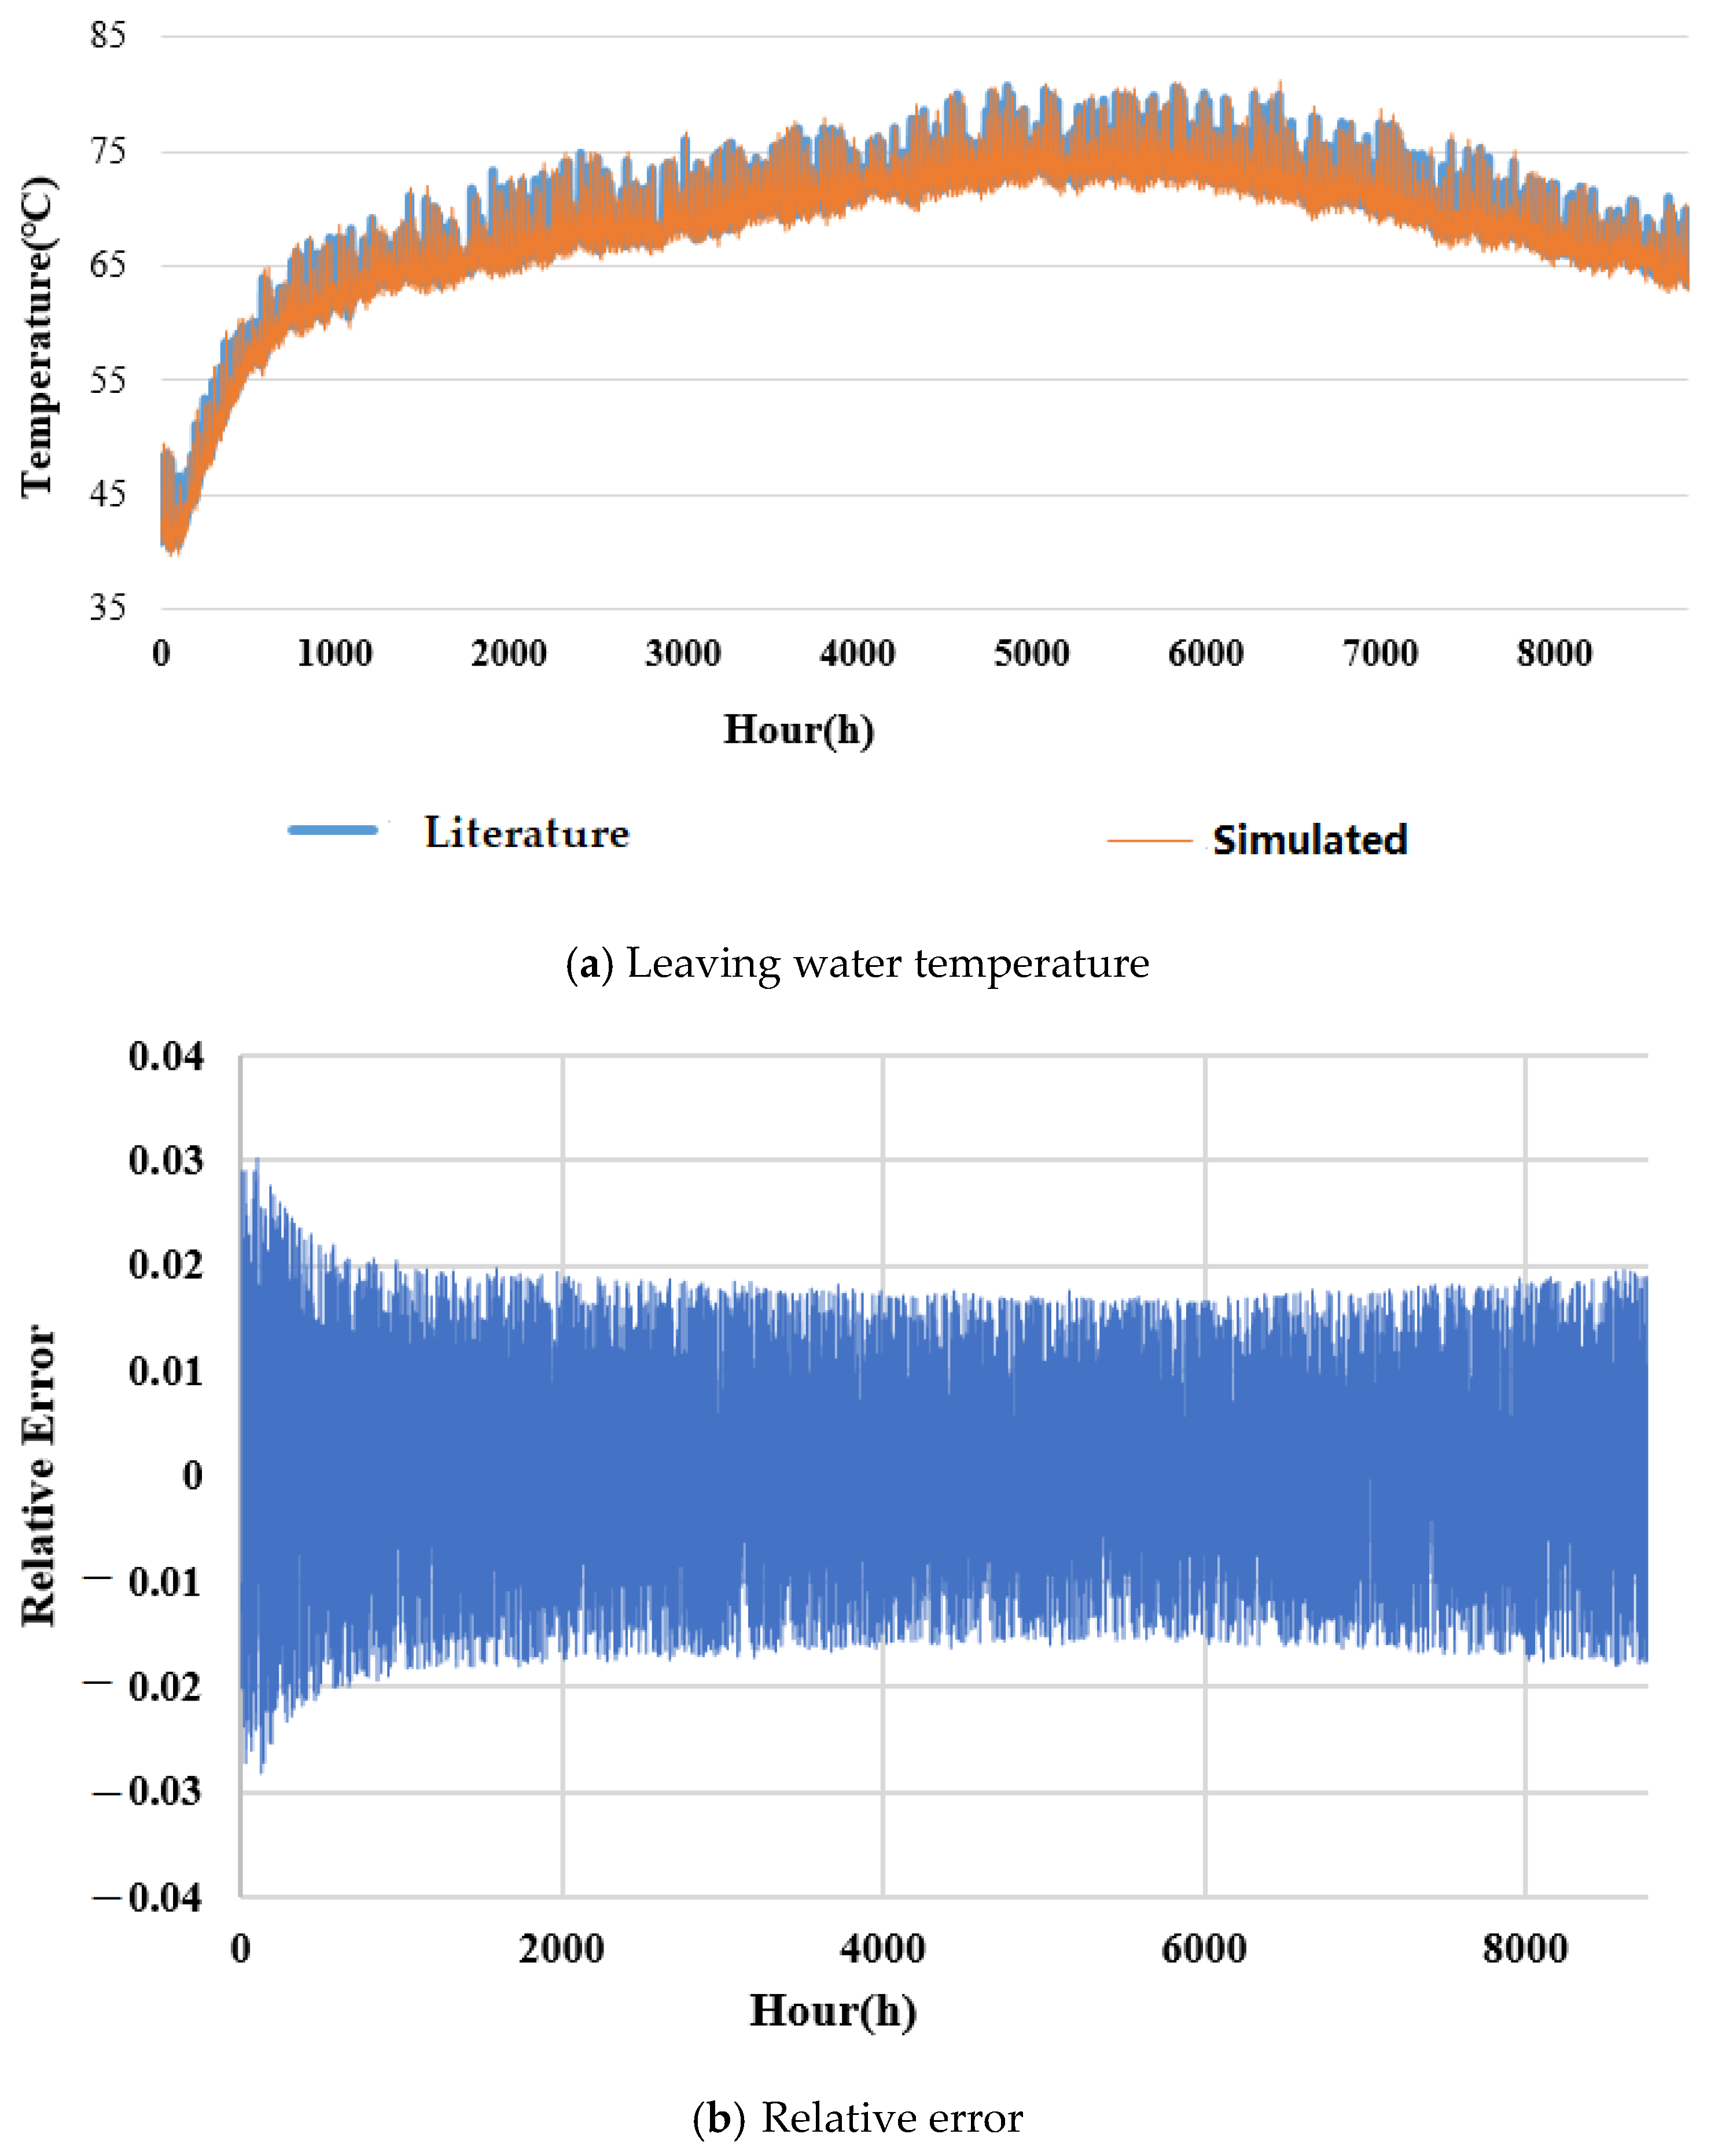
4.2. Validation on the PV/T System

The simulated results of the PV/T system were compared with the ones from [42]. The values of the PV/T system design parameters are listed in Table 4. The comparisons to the electricity generation efficiency and leaving water temperature of the heat collector are presented in Figure 9 and Figure 10, respectively. It can be observed that the maximum relative errors on the electricity generation efficiency and leaving water temperature are less than 1% and 5%, respectively, indicating good agreement between the simulated results and the ones from the literature.

5. Results and Discussion

5.1. Exergy Performance of the System and Each Component

Table 5 lists the average hourly exergy loss, accumulative exergy loss, exergy loss rate, and average exergy efficiency for each component and the whole system during the cooling and heating seasons. It can be found that the condenser has the lowest exergy efficiency during the cooling season. However, it also has the lowest exergy loss and loss rate, indicating limited room for improvement. The radiant system has the highest exergy loss rates, which accounts for 34.7% in winter and 42.8% in summer, and has the lowest exergy efficiency in summer. Furthermore, the transmission and distribution system also has relatively high exergy loss and relatively low exergy efficiency. The chiller and cooling tower have large exergy losses during the cooling season. However, they also have relatively high exergy efficiency, and short operation hours throughout the year. The exergy loss rate and exergy efficiency of the fresh air unit are relatively lower compared to other components. Based on the above analysis, more attention should be paid to the improvement of exergy performance for the radiant system and the transmission and distribution system.

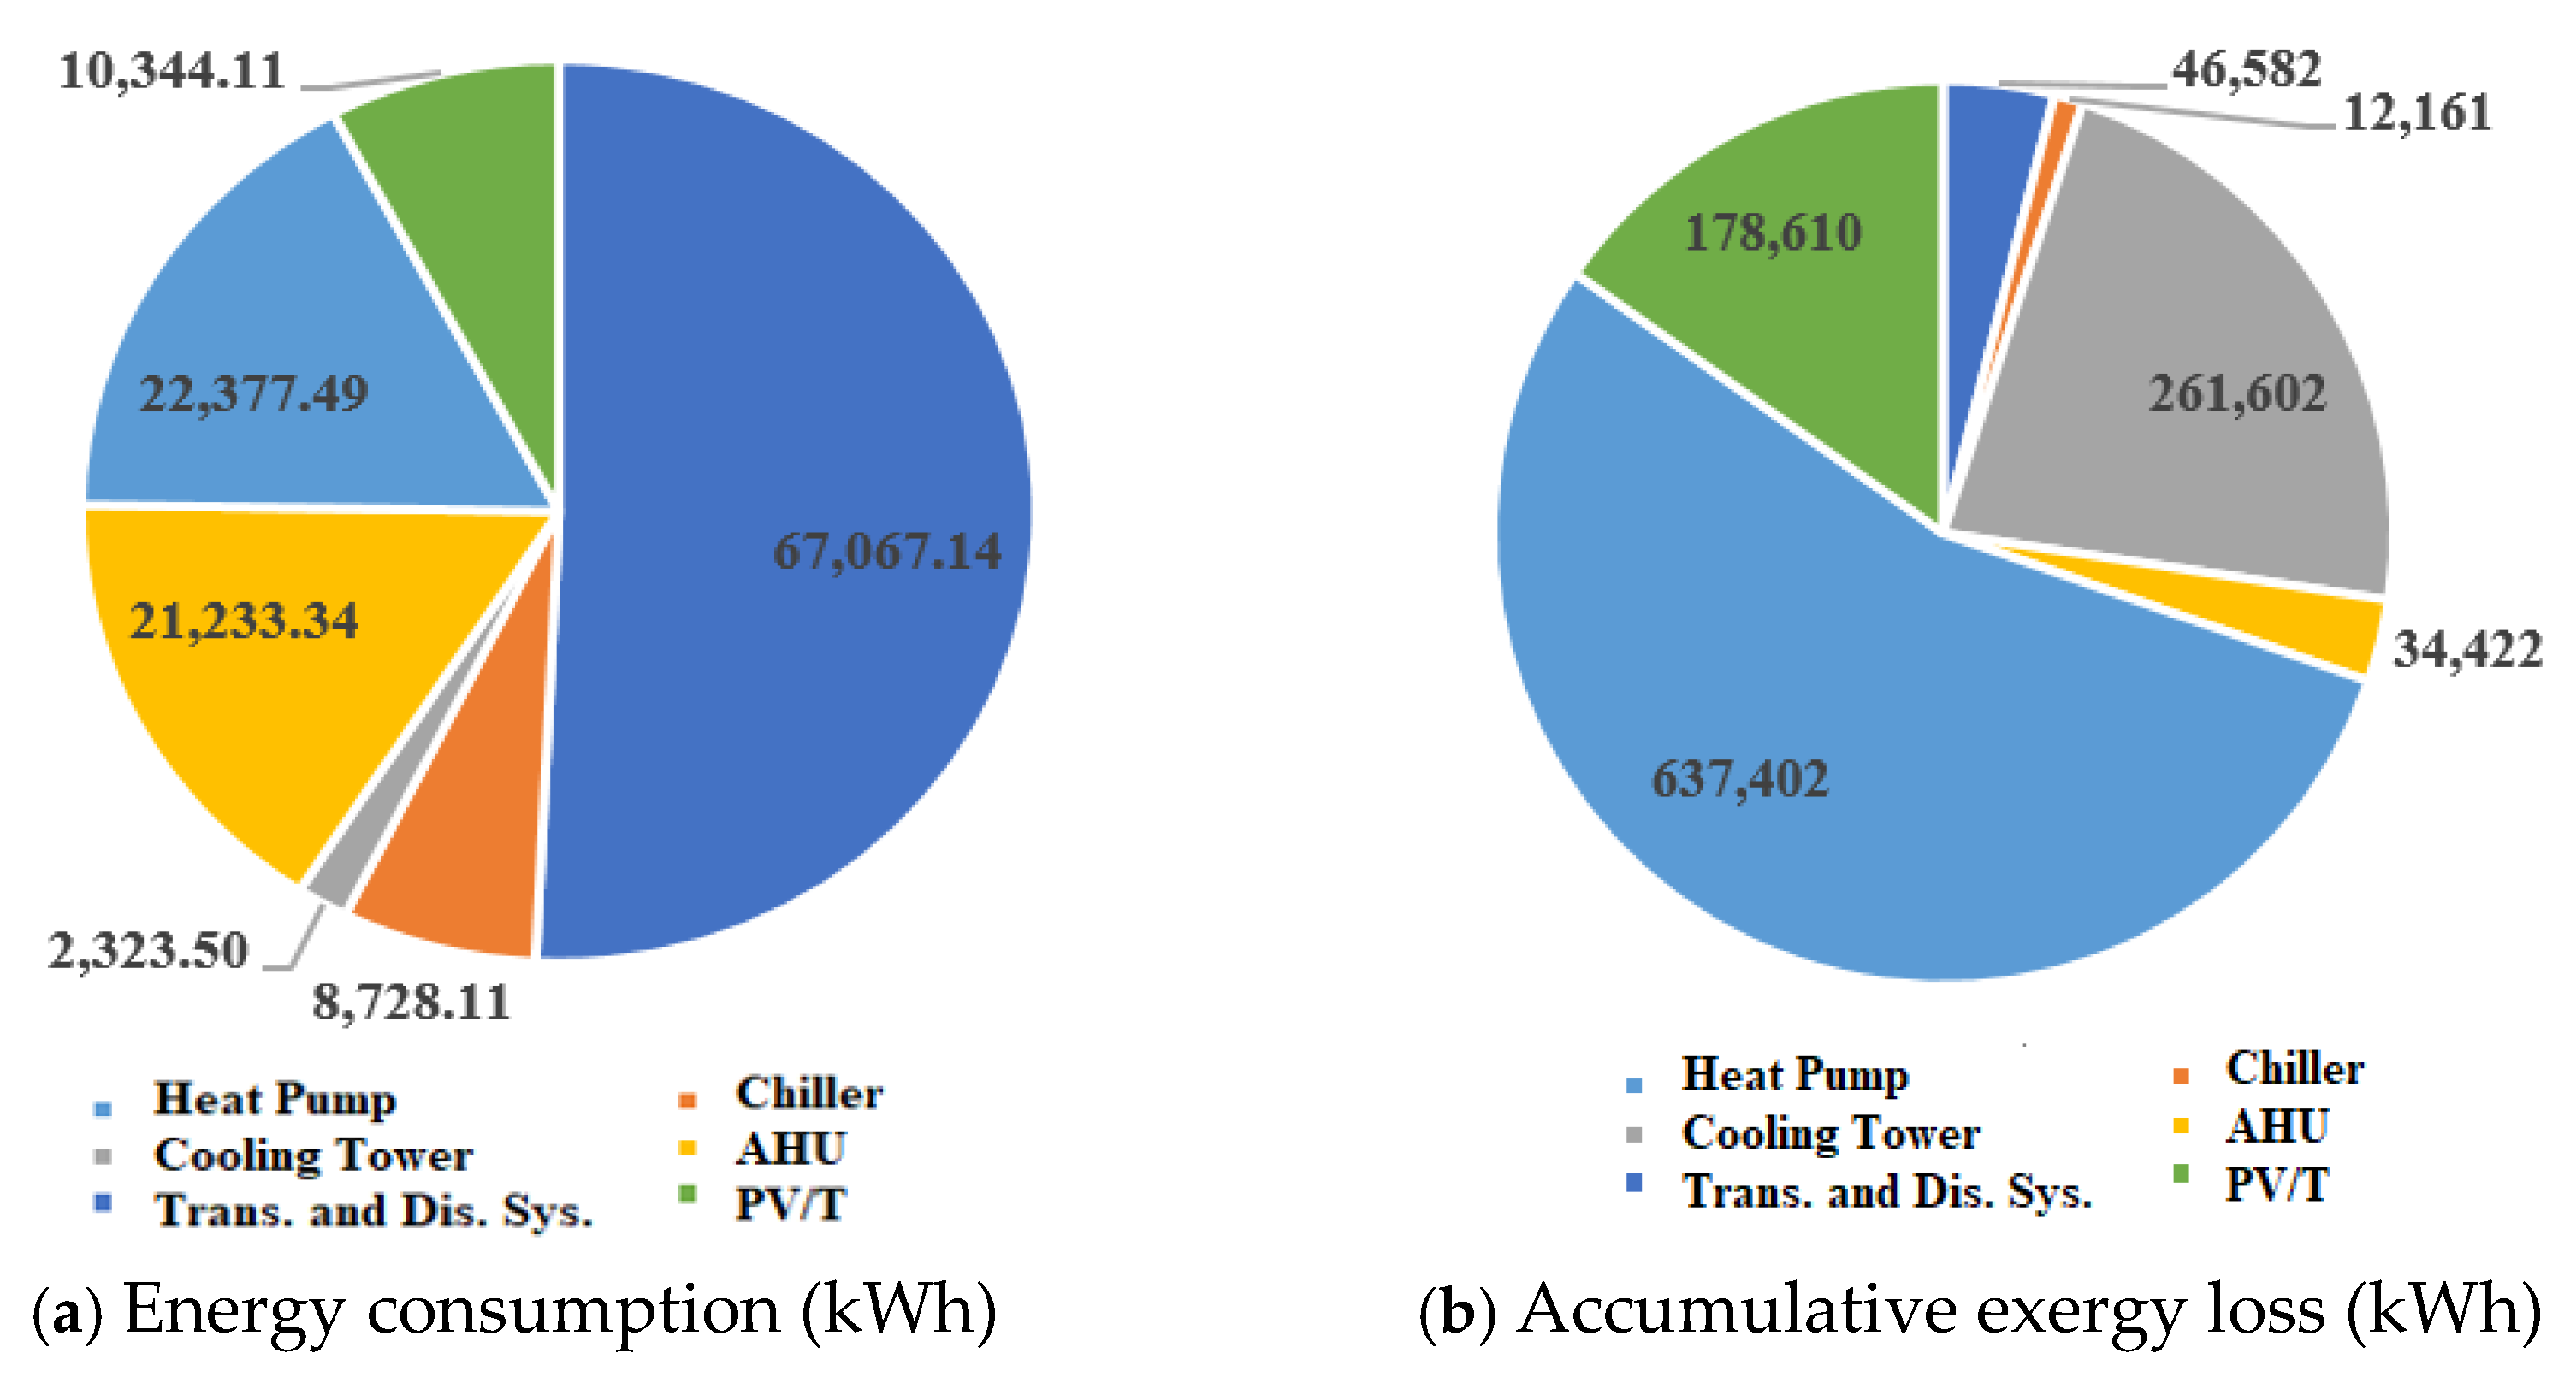
5.2. Energy Consumption of the System and Each Component

The distribution of the energy consumption and exergy loss of the PT/V collector system, ground source heat pump system, fresh air system, transmission and distribution system, and cooling tower and chiller system during the cooling and heating season are presented in Figure 11. It can be observed that the heat pump system consumed the largest amount of energy while the transmission and distribution system has the highest accumulative exergy loss, which should be paid attention to for improvement.
Figure 12 presents the variation of the system energy demand with the outdoor air temperature. It can be observed that the energy demand increases with the outdoor air temperature in summer. However, the energy consumption in winter is much larger than that in summer, which deserves much attention during the optimization.
The annual energy consumption of the system is 150,260.05kWh, while the accumulative power generation by the PV/T system is 105,441.73 kWh, which accounts for 66% of the total system energy consumption, which proves that the incorporation of the PV/T system can greatly improve the system performance.

5.3. Optimization on the Exergy Performance of the System

5.3.1. Optimization on the Temperature Difference Between the Supply and Chilled Water Temperature

During the cooling season and under thermal load conditions, if the system still operates under design flow rate conditions, it not only leads to high exergy loss but also high energy consumption due to operation under a large flow rate with a low temperature difference. Therefore, there is a need for the system to operate under variable flow conditions and find the optimal flow ratios to achieve the best system exergy and energy efficiency.
The demand side circulation flow (rd) and source side flow ratio (rs) can be calculated via Equations (97) and (98):
r d = Flow dmd , oper Flow dmd , desig  
r s = Flow source , oper Flow source , desig  
where Flow dmd , oper and Flow dmd , desig are the operation and design flow rates at the demand side, respectively, in m3/h; Flow source , oper and Flow source , desig are the operation and design flow rates at the source side, respectively, in m3/h.
Figure 13 presents the variation of the total system exergy efficiency with the demand-side and source-side flow ratios.
It can be observed that of the system exergy efficiency increases with lower flow ratio. However, too low of a flow rate will cause the system to not be able to work and meet the building thermal load, although lower flow leads to higher exergy efficiency and lower pump work. However, the pump head decreases with the flow ratio according to a quadratic relationship and would not be able to overcome the loop resistance. At the same time, there is a minimum flow requirement for the heat pump unit. To avoid too low of a flow rate, the flow ratios of 0.65 for both the demand side and source side were selected (indicating 7.0 °C of design temperature difference). The exergy efficiency was found to be 37.56% with an accumlative exergy loss of 1,242,655.45kWh. Under the this operation condition, the exergy efficiency of the buried pipe system, heat pump unit, radiant system, transmission and distribution system are found to be 50.12%, 51.2%, 27.68%, and 45.1%, respectively. The accumulative exergy losses of the buried pipe system, heat pump unit, radiant system, transmission and distribution system are found to be 3531.40 kWh, 121,381.00 kWh, 21,178.21 kWh, and 332,889.90 kWh, respectively. The total system exergy loss is reduced from 1,487,391.46 kWh to 1,242,655.45 kWh (16.5%).

5.3.2. Optimization on the Bearing Load Ratio of Ground Source Heat Pump vs. PV/T System in Heating Season

During the heating season, the ground source heat pump and PV/T system both provide hot water to the radiant system and fresh air system. The bearing thermal load ratio provided by the heat pump and PV/T system has an impact on the system exergy efficiency. Through evaluation, the PV/T storage system can only provide 43% of the yearly heating load. Figure 14 presents the variation of the exergy efficiency of the PV/T system, ground source heat pump, and system with the heating load bearing ratio of the ground source heat pump. Figure 15 presents the variation of exergy losses of the PV/T system, ground source heat pump, and system with the heating load bearing ratio of the ground source heat pump.
It can be observed that the total system exergy efficiency first increases with the increase in bearing thermal load ratio of the ground source heat pump and then it decreases. From Figure 14 and Figure 15, it can be observed that the exergy loss of the heat pump increases almost linearly with the bearing load proportion, while the exergy loss of the PV/T system decreases with the bearing load proportion, and a flow ratio of 67% appears to be the point of diminishing returns for the PV/T system. The optimal maximum efficiency of about 39% occurs when the ratio is about 67%, when the total accumulative system exergy loss is reduced to about 766,156 kWh.
During the cooling season, the exergy loss of the radiant system and chiller slightly decrease with the increase in ambient temperature. The exergy loss of the buried pipe and cooling tower obviously increases with the increase in ambient temperature. The exergy loss of the radiant system and buried pipe during cooling season is slightly lower than during heating season. The exergy loss of the cooling tower is much higher in cooling season than in heating season. When the solar radiation intensity is fixed, the exergy loss of the PV/T collector decreases with the increase in ambient temperature. The average exergy loss of the PV/T system in the cooling season is much lower than that in the heating season; however, its exergy efficiency is only slightly higher.

6. Conclusions

This paper presents an investigation on the exergy performance of a photovoltaic-thermal geothermal heat pump coupled with a radiant ceiling and fresh air system serving an office building in Shanghai. The following conclusions can be made:
(1) The exergy loss of the transmission and distribution system account for the largest proportion (54%) of the total exergy loss and should be paid special attention to for improvement.
(2) During the cooling season, the increase in the supply and returned chilled-water temperature difference can lead to the improvement of the total exergy efficiency. However, the increase is not obvious after the difference reaches 5.5 °C.
(3) During the heating season, system exergy efficiency first increases and then decreases with the bearing thermal load ratio of the ground source heat pump vs. the PV/T system, with the optimal ratio at about 67%.
To gain further insight into system inefficiencies, application of advanced exergy analysis, especially the decomposition of exergy destruction into avoidable vs. unavoidable and endogenous vs. exogenous parts, would help distinguish between irreducible losses and those due to suboptimal design or operation, and provide guidance on targeted component performance improvements. It would be feasible to incorporate this approach in future research.

Author Contributions

Conceptualization, Y.L. and W.Y.; methodology, Y.L. and W.Y.; formal analysis, Y.L.; investigation, Z.B.; resources, Y.L.; writing—original draft preparation, Z.B.; writing—review and editing, Y.L, Z.B.; W.Y. and M.C.; L.T. and M.D.; supervision, Y.L.; funding acquisition, Y.L. All authors have read and agreed to the published version of the manuscript.

Funding

This work is financially supported by the National Natural Science Foundation of China, grant number 52268002.

Data Availability Statement

The original contributions presented in the study are included in the article, further inquiries can be directed to the corresponding author.

Acknowledgments

The authors express their sincere gratitude to the support from R & D center of the transportation industry of health and epidemic prevention technology, Ministry of transportation of the People’s Republic of China.

Conflicts of Interest

The authors declare no conflicts of interest.

Abbreviations

The following abbreviations are used in this manuscript:
A Area of the radiant ceiling, m2
ex h 1 Inlet enthalpy of the compressor, kW
ex h 2 Outlet enthalpy of the compressor, kW
ex h 3 Inlet enthalpy of the condenser, kW
ex h 4 Outlet enthalpy of the condenser, kW
ex h 5 Inlet enthalpy of the radiant ceiling system, kW
ex h 6 Outlet enthalpy of the radiant ceiling system, kW
ex h 7 Outlet enthalpy of the buried pipe system, kW
ex h 8 Inlet enthalpy of the buried pipe system, kW
Ex dest _ ceiling Exergy loss of the radiant ceiling system, kW
Ex dest _ C Exergy loss of the compressor, kW
Ex dest _ BHE Exergy loss of the buried pipe, kW
Ex dest _ CON Exergy loss of the condenser, kW
Ex dest _ EVA Exergy loss of the evaporator, kW
Ex dest _ SYSTEM Exergy loss of the overall system, kW
F r Radiation heat transfer factor, taken as 0.87
m ˙ C PV/T panel heat transfer medium flow rate, kg/s
m ˙ g Ground source heat pump load side heat transfer medium flow rate, kg/s
m ˙ h Ground source heat pump source side water flow rate, kg/s
m ˙ ref Mass flow rate of the refrigerant, kg/s
m ˙ xf _ h Heating water flow rate of the fresh air unit, kg/s
m ˙ xf _ l Cooling water flow rate of the fresh air unit, kg/s
m ˙ w a _ c e i l i n g Water flow rate at the radiant ceiling terminal, kg/s
m ˙ W _ B Water flow rate of the heat exchanger at the source side, kg/s
m ˙ W _ H Mass flow rate from the hot water storage tank, kg/s
Q ˙ BHE Heat gain/loss from/to the ground, kW
Q ct Heat exchange rate between the cooling water and the outside air, kJ
Q conv _ c Convective heat transfer between the ceiling and the indoor air, kW
Q load _ H Heating load, kW
Q load _ L Cooling load, kW
Q rad _ c Radiant heat transfer between the ceiling and other surfaces, kW
t 5 Load side entering water temperature of the heating pump system, ºC
t 6 Load side leaving water temperature of the heating pump system, ºC
t 7 Source side entering water temperature of the heating pump system, ºC
t 8 Source side leaving water temperature of the heating pump system, ºC
T 9 Entering cooling water temperature, K
T 10 Leaving cooling water temperature, K
T CT Average cooling water temperature inside the cooling tower, K
L i Load shared by unit i, kW
T a Indoor air temperature, K
T o Ambient air temperature, K
T r Radiant ceiling surface temperature, K
T r e Leaving water temperature of the radiant system, K
T s Surface temperature, excluding the radiant ceiling surface, K
T soil Soil temperature, K
T sup Entering water temperature of the radiant system, K
T x 1 Entering water temperature to the fresh air unit, K
T x 2 Leaving water temperature from the fresh air unit, K
W ˙ _ 1 Input power to the fresh air unit, kW
W ˙ _ 2 Input power to PV/T collector, kW
W ˙ _ 3 Input power to the cooling tower, kW
W ˙ com Input power to the heat pump unit, kW
W ˙ HP _ i Real time power input to heat pump unit i, kW
W ˙ pump Input power to the chilled water pump, kW
W ˙ pump _ 2 Input power to the cooling water pump, kW
σ Stefan–Boltzmann constant, equal to 5.67 × 10⁻⁸ W/(m2∙K4)

References

  1. Lin, Y.; Bu, Z.; Yang, W.; Zhang, H.; Francis, V.; Li, C. A Review on the Research and Development of Solar-Assisted Heat Pump for Buildings in China. Buildings 2022, 12, 1435. [Google Scholar] [CrossRef]
  2. Lamnatou, C.; Chemisana, D.; Cristofari, C. Smart grids and smart technologies in relation to photovoltaics, storage systems, buildings and the environment. Renew. Energy 2022, 185, 1376–1391. [Google Scholar] [CrossRef]
  3. Qi, Z.; Gao, Q.; Liu, Y.; Yan, Y.Y.; Spitler, J.D. Status and development of hybrid energy systems from hybrid ground source heat pump in China and other countries. Renew. Sustain. Energy Rev. 2014, 29, 37–51. [Google Scholar] [CrossRef]
  4. Penrod, E.B.; Prasanna, K.V. Design of a flat-plate collector for a solar earth heat pump. Sol. Energy 1962, 6, 9–22. [Google Scholar] [CrossRef]
  5. Liu, L.; Zhu, N.; Zhao, J. Thermal equilibrium research of solar seasonal storage system coupling with ground-source heat pump. Energy 2016, 99, 83–90. [Google Scholar] [CrossRef]
  6. Girard, A.; Gago, E.J.; Muneer, T.; Caceres, G. Higher ground source heat pump COP in a residential building through the use of solar thermal collectors. Renew. Energy 2015, 80, 26–39. [Google Scholar] [CrossRef]
  7. Zhu, N.; Wang, J.; Liu, L. Performance evaluation before and after solar seasonal storage coupled with ground source heat pump. Energy Convers. Manag. 2015, 103, 924–933. [Google Scholar] [CrossRef]
  8. Kaygusuz, K. Experimental and theoretical investigation of a solar heating system with heat pump. Renew. Energy 2000, 21, 79–102. [Google Scholar] [CrossRef]
  9. Bakirci, K.; Ozyurt, O.; Comakli, K.; Comakli, O. Energy analysis of a solar-ground source heat pump system with vertical closed-loop for heating applications. Energy 2011, 36, 3224–3232. [Google Scholar] [CrossRef]
  10. Al-Juwayhel, F.I. Simulation of Dynamic Performance of Air-Source, Earth-Source and Solar Assisted Earth-Source Heat Pump System. Ph.D. Thesis, Oklahoma State University, Stillwater, OK, USA, 1981. [Google Scholar]
  11. Coskun, S. Performance analysis of a solar-assisted ground source heat pump system in climatic conditions of Turkey. Therm. Sci. 2020, 24, 977–989. [Google Scholar] [CrossRef]
  12. Biglarian, H.; Saidi, M.H.; Abbaspour, M. Economic and environmental assessment of a solar-assisted ground source heat pump system in a heating-dominated climate. Int. J. Environ. Sci. Technol. 2019, 16, 3091–3098. [Google Scholar] [CrossRef]
  13. Berardi, U.; Heidarinejad, G.; Rayegan, S.; Pasdarshahri, H. Enhancing the cooling potential of a solar-assisted desiccant cooling system by ground source free cooling. Build. Simul. 2020, 13, 1125–1144. [Google Scholar] [CrossRef]
  14. Zhang, C.; Nielsen, E.; Fan, J.; Furbo, S.; Li, Q. Experimental investigation on a combined solar and ground source heat pump system for a single-family house: Energy flow analysis and performance assessment. Energy Build. 2021, 241, 110–958. [Google Scholar] [CrossRef]
  15. Maranghi, F.; Gosselin, L.; Raymond, J.; Bourbonnais, M. Modeling of solar-assisted ground-coupled heat pumps with or without batteries in remote high north communities. Renew. Energy 2023, 207, 484–498. [Google Scholar] [CrossRef]
  16. Ma, L. Energy Efficiency Experiment and Simulation Analysis of Ground Source Heat Pump and Capillary Radiation Terminal Composite System. Master’s Thesis, Huazhong University of Science and Technology, Wuhan, China, 2017. [Google Scholar]
  17. Banjac, M. Achieving sustainable work of the heat pump with the support of an underground water tank and solar collectors. Energy Build. 2015, 98, 19–26. [Google Scholar] [CrossRef]
  18. Cui, M.; Liu, J.; Kim, M.K.; Wu, X. Application potential analysis of different control strategies for radiant floor cooling systems in office buildings in different climate zones of China. Energy Build. 2023, 282, 112772. [Google Scholar] [CrossRef]
  19. Ramdani, H.; Ould-Lahoucine, C. Study on the overall energy and exergy performances of a novel water-based hybrid photovoltaic-thermal solar collector. Energy Convers. Manag. 2020, 222, 113–138. [Google Scholar] [CrossRef]
  20. Arslan, E.; Aktaş, M.; Can, Ö.F. Experimental and numerical investigation of a novel photovoltaic thermal (PV/T) collector with the energy and exergy analysis. J. Clean. Prod. 2020, 276, 123–155. [Google Scholar] [CrossRef]
  21. Suleman, F.; Dincer, I.; Agelin-Chaab, M. Energy and exergy analyses of an integrated solar heat pump system. Appl. Therm. Eng. 2014, 73, 559–566. [Google Scholar] [CrossRef]
  22. Ozcan, H.G.; Varga, S.; Gunerhan, H.; Hepbasli, A. Numerical and experimental work to assess dynamic advanced exergy performance of an on-grid solar photovoltaic-air source heat pump-battery system. Energy Convers. Manag. 2021, 227, 113605. [Google Scholar] [CrossRef]
  23. Li, S.; Yang, H.; Yuan, J.; Zeng, X.; Yang, Z.; Lu, J. Thermodynamic and economic analyses of modified ejector enhanced solar-air composite dual-source heat pump system in residential buildings. Energy Build. 2024, 308, 113978. [Google Scholar] [CrossRef]
  24. Gao, J.; Zhao, Y.; Wu, F.; Adnouni, M.; Sun, Y.; Li, S.; Yu, Z.; Zhang, X. Experimental investigation on efficient heating method of solar composite heat pump based on evaporative thermal accumulator. Energy 2025, 317, 134627. [Google Scholar] [CrossRef]
  25. Petrucci, G.A.; Chenche, L.E.P.; Gomez, A.O.C.; Loayza, D.M.J.; Flores, J.M.B.; Pabon, J.J.G. Energy analysis of a direct expansion heat pump assisted by a thermal photovoltaic panel for hot water production in several regions of Brazil. Energy Convers. Manag. 2024, 319, 118969. [Google Scholar] [CrossRef]
  26. Yousaf, S.; Bradshaw, C.R.; Kamalapurkar, R.; San, O. A gray-box model for unitary air conditioners developed with symbolic regression. Int. J. Refrig. 2024, 168, 696–707. [Google Scholar] [CrossRef]
  27. Ma, X.; Du, Y.; Li, B.; Zhang, C.; Wu, Y. Enhancing the performance of autocascade steam generating heat pumps through advanced exergy methods. Energy Convers. Manag. 2025, 332, 119705. [Google Scholar] [CrossRef]
  28. Gao, Y.; Yang, W.; Zhang, Y. Thermodynamic analysis of a new tandem dual-temperature air source heat pump with ejector. Int. J. Refrig. 2024, 168, 307–317. [Google Scholar] [CrossRef]
  29. EnergyPlus. Weather Data. Available online: https://energyplus.net/weather (accessed on 14 May 2025).
  30. JGJ/T 76-2019; Ministry of Housing and Urban-Rural Development of the People’s Republic of China (MOHURD). Standards for Design of Office Building. China Architecture & Building Press: Beijing, China, 2019.
  31. GB50495—2019; Ministry of Housing and Urban-Rural Development. Technical Specification for Solar Heating Engineering. China Architecture & Building Press: Beijing, China, 2019.
  32. Deng, Y.; Ding, L.; Luo, Y. Exergy analysis on a new style cold outdoor air processing system of water loop heat pump. World SCI-TECH RD 2009, 31, 655–657. Available online: https://kns.cnki.net/kcms2/article/abstract?v=XMmmt_ij6VEIqgrxWpuCNxEqx1VPl4zUbTBNxveMQa7I6lcrcbPyRy4uz8vWHhcNzkwGoQ80fU--U6ucB61d85o7UviTMicl6TUWpx8iD5IgqRrb7HFz7QHexmouSTSzGEmUFBUtbfEGSFzMVYCEPEI4gZUxUXEoPfkgUIypGpSXXGfHy9h8pg==&uniplatform=NZKPT&language=CHS (accessed on 19 May 2025).
  33. Wang, L. Exergy Analysis and Experimental Study of Solar Water Source Heat Pump Hybrid System. Master’s Thesis, Hunan University, Changsha, China, 2012. [Google Scholar]
  34. Gong, G.; Wang, L.; Su, H. Analysis and Experimental Study on Solar Water Source Heat Pump Composite System. Acta Energiae Solaris Sin. 2013, 6, 1051–1056. [Google Scholar]
  35. Yuan, C. Dual-Condition Exergy Analysis of Ground Source Heat Pump System. Master’s Thesis, Xi’an University of Architecture and Technology, Xi’an, China, 2013. [Google Scholar]
  36. Chen, D. Research on Operating Characteristics of Cooling Tower Assisted Composite Ground Source Heat Pump System. Master’s Thesis, Yangzhou University, Yangzhou, China, 2016. [Google Scholar]
  37. Liu, S. Research on Operation Control Optimization of Ground Source Heat Pump-Radiant Ceiling Air Conditioning System. Master’s Thesis, Xi’an University of Architecture and Technology, Xi’an, China, 2019. [Google Scholar]
  38. American Society of Heating, Refrigerating and Air-Conditioning Engineers, Inc. ASHRAE Handbook. HVAC System and Equipment; ASHRAE: Atlanda, GA, USA, 2024. [Google Scholar]
  39. Hu, W. Energy-Saving Analysis and Management of Ground Source Heat Pump Air Conditioning System. Master’s Thesis, Hunan University, Changsha, China, 2019. [Google Scholar]
  40. Lin, Y.; Feng, H.; Yang, W.; Hao, X.; Tian, L.; Yuan, X. Thermal performance optimization of a semi-nested building coupled with an earth-to-air heat exchanger using iterative Taguchi method. Renew. Energy 2022, 195, 1275–1290. [Google Scholar] [CrossRef]
  41. Jordan, D.C.; Kurtz, S.R.; VanSant, K.; Newmiller, J. Compendium of photovoltaic degradation rates. Prog. Photovolt. Res. Appl. 2016, 24, 978–989. [Google Scholar] [CrossRef]
  42. Khanmohammdi, S.; Musharavati, F.; Sheykhmohammadi, M. Energy and exergy examinations of PV/T based hybrid system for power, heating and potable water production: Transient modeling. Renew. Energy 2022, 195, 540–553. [Google Scholar] [CrossRef]
Figure 1. Front view and PV/T system location of the building.
Energies 18 02715 g001
Figure 2. Schematic diagram of system operation. (a) Cooling season; (b) Heating season. Note: 1. BLDG: Building 2. FAU: Fresh air unit 3. FAFHX: Fresh air full heat exchanger 4. WC: Water collector 5. CH: Chiller 6. HP: Heat pump 7. WS: Water segregator 8. BP: Buried pipe 9. CT: Cooling tower 10. CWP: Cooling water pump 11.WP: Water pump 12. HWST: Hot water storage tank 13. PV/T: PV/T solar collector 14. Grid: Power grid.
Energies 18 02715 g002
Figure 3. Hourly thermal load of the building.
Energies 18 02715 g003
Figure 4. Exergy analysis diagram of the ground source heat pump (blue color refers to cooling operation and red color refers to heating operation).
Energies 18 02715 g004
Figure 5. Computer model under the TRNSYS environmen.
Energies 18 02715 g005
Figure 6. Comparison on the hourly leaving water temperature of the buried pipe, data from literature [16] against simulated. (a) Leaving water temperature; (b) Relative error.
Energies 18 02715 g006
Figure 7. Comparison between the hourly supply water temperature of the radiant system, data from literature [16] against simulated. (a) Leaving water temperature; (b) Relative error.
Energies 18 02715 g007
Figure 8. Comparison on the COP of the chiller serving radian ceiling cooling in one month, data from literature [16] against simulated. (a) Variation of COP of the chilled water unit in one month during the cooling season; (b) Relative error.
Energies 18 02715 g008
Figure 9. Comparison on the electricity generation efficiency, data from literature [42] against simulated. (a) Efficiency; (b) Relative error.
Energies 18 02715 g009
Figure 10. Comparison on the leaving water temperature of the PT/V heat collector, data from literature [42] against simulated. (a) Leaving water temperature; (b)Relative error.
Energies 18 02715 g010
Figure 11. Distribution of the energy consumption and exergy loss for each component. (a) Energy consumption; (b) Exergy loss.
Energies 18 02715 g011
Figure 12. Variation of system energy demand with outdoor air temperature.
Energies 18 02715 g012
Figure 13. Variation of the system exergy loss and exergy efficiency with the temperature difference between the supply and return chilled water.
Energies 18 02715 g013
Figure 14. Variation of PV/T, heat pump system and overall system exergy efficiencies with heat pump system bearing load during the heating season.
Energies 18 02715 g014
Figure 15. Variation of the exergy loss ratio of PV/T and heat pump system to the total accumulativeexergy loss during heating season.
Energies 18 02715 g015
Table 1. Major equipment list and design characteristics.
ItemModuleQuantityParameterValue
1PV/T collector1Average heating capacity (kW)60.93
Average thermal efficiency (%)40
Heat loss from pipelines and heat storage devices (%)15
Area compensation coefficient0.98
Area (m2)276.29
2Monocrystalline silicon plate1Power generation efficiency %0.21
Component efficiency %16.6
3Thermal storage/heat collection tank1Volume (m3)27.63
heat loss coefficient of the hot Water tank0.4
4Heat collector pump2Flow rate (m3/h)16.58
Input power (kW)1.29
5Source side circulation pump1Flow rate (m3/h)68.75
Input power (kW)6.69
6Cooling water pump of the Chiller1Flow rate (m3/h)23.21
Input power (kW)2.26
7Chilled water pump1Flow rate (m3/h)20.62
Input power (kW)2.57
8Chilled water pump of the Chiller2Flow rate (m3/h)58.42
Input power (kW)7.28
9Heat pump1Heating capacity (kW)374
Cooling capacity (kW)540
Heating COP4.85
10Chiller1Cooling COP5.66
Cooling capacity (kW)120
11Cooling tower1Cooling water flow rate (m3/h)55
Fan flow rate (m3/h)33000
Input power (kW)1.5
12Fresh air unit12Flow rate (m3/h)660
Input power (kW)0.18
Table 2. Values of the parameters on radiant system and buried pipe heat exchanger.
Radiant System ParameterValueBuried Pipe ParameterValue
Tube spacing (mm)10Thermal conductivity of backfill material (W/(m·K))2.1
Tube inner diameter (mm)26Drilling diameter (mm)110
Tube outer diameter (mm)32Drilling spacing (m)0.06
Air layer thickness (mm)5Hole depth (m)60
Return water temperature in summer (°C)19Borehole thermal resistance
(°C/W)
0.099
Return water temperature in winter (°C)30Thermal conductivity of the U-shaped tube (W/(m·k))30
LocationWuhanPipe typeSingle U pipe
Table 3. Comparisons between the simulated results and the ones from [41].
ModeSourceAverage Source Side Supply Water Temperature (°C)Average Source Side Return Water Temperature (°C)Average
Supply Water Temperature of Radiant System (°C)
Average Return Water Temperature of Radiant System (°C)Maximum Cooling Load (kW)Maximum Heating Load (kW)
CoolingFrom [16]30.126.814.821.515.68-
Simulated29.826.714.222.216.56-
HeatingFrom [16]12.514.633.730.1-16.89
Simulated12.815.134.129.7-17.21
Table 4. Values of the PV/T system parameters.
ParameterValue
Collector incident angle (°)28
Collector tilted angle (°)40
Dimension (m × m)1.2 × 0.65
Dimension of the PV cell (mm × mm)125 × 0.65
Total heat collection area (m2)985
Back flow channel/pipe diameter10/0.01 m
Collector inlet mass flow rate36 kg/h
Table 5. Exergy performance of the system and each component.
SeasonComponentAverage Hourly Exergy Loss (kWh)Accumulative Exergy Loss (kWh)Exergy Loss Rate
(−)
Average
Exergy
Efficiency (%)
Cooling seasonPV/T system25.95103,822.420.03565.8
Hot water storage tank4.819,193.310.00632.2
Compressor18.6174,561.970.02575.1
Evaporator12.9351,717.140.01778.2
Condenser2.764753.060.00436.3
Transmission and distribution system252.36415,156.60.33842.3
Radiant system319.32501,973.510.42828.5
Fresh air unit16.1931,5430.02243.3
Chiller35.360,806.890.04748.9
Buried pipe 3.232810.810.00449.2
Cooling tower 55.24221,052.750.07436.3
Total746.691,487,391.46134.5
Heating seasonPV/T system67.9974,788.280.09167.2
Hot water storage tank17.8371,338.540.08753.6
Compressor16.8244,593.150.05483.2
Evaporator18.6849,548.050.06032.3
Condenser1563,520.790.07781.2
Transmission and distribution system221.36197,126.50.24036.5
Radiant system299.07284,415.170.34732.3
Fresh air unit3.272878.800.0446.6
Chiller----
Buried pipe 3.164933.030.00647.6
Cooling tower 4.817621.100.0349.2
Total667.99800,763.411.00036.5
Disclaimer/Publisher’s Note: The statements, opinions and data contained in all publications are solely those of the individual author(s) and contributor(s) and not of MDPI and/or the editor(s). MDPI and/or the editor(s) disclaim responsibility for any injury to people or property resulting from any ideas, methods, instructions or products referred to in the content.

