Article

Modeling and Testing of 3D Wound Core Loss of Amorphous Alloy Transformer for Photovoltaic Inverter

1
Longyuan New Energy Co., Ltd., Yantai 265400, China
2
Xi’an Thermal Power Research Institute Co., Ltd., Xi’an 710054, China
3
School of Electrical Engineering, Shenyang University of Technology, Shenyang 110870, China
*
Author to whom correspondence should be addressed.
Energies 2025, 18(11), 2698; https://doi.org/10.3390/en18112698
Submission received: 24 April 2025 / Revised: 12 May 2025 / Accepted: 14 May 2025 / Published: 23 May 2025
(This article belongs to the Section F: Electrical Engineering)

Abstract

The harmonic content of transformers used in the field of new energy is significantly higher than that of conventional transformers, leading to an abnormal increase in transformer loss during operation. Therefore, the loss characteristics of amorphous alloy transformers are investigated in this paper. First, a measurement platform for the magnetic property of transformer cores under sinusoidal excitation is developed. The magnetization characteristics, loss characteristics and loss composition of the amorphous alloy core under sinusoidal excitation are measured and analyzed. On this basis, the traditional Steinmetz loss calculation formula is modified, and the loss calculation formula is further refined by improving its coefficients to accommodate various frequencies. Secondly, using a field-circuit coupling method, a 3D model of the transformer core is established by finite element simulation. The magnetic flux distribution and core losses are computed under both sinusoidal excitation and non-sinusoidal excitation. Finally, the impact of core rotation magnetization on the magnetic flux density is considered, and experimental errors are minimized by applying an empirical formula. The numerical model validity and accuracy are verified by comparing the simulation results with experimental data.

1. Introduction

Soft magnetic materials, due to their high permeability and low loss characteristics, are widely used in the form of iron cores in large electrical equipment, such as power transformers and electric motors. They play a critical role in the design and performance analysis of electrical equipment in power systems [1]. Amorphous alloys, as a novel class of soft magnetic materials, exhibit excellent electromagnetic properties, low iron loss, and good temperature stability. However, these materials suffer from the drawback of high magnetostriction, resulting in increased noise. Consequently, they are predominantly utilized in the new energy sector. Transformer equipment often operates under complex harmonic excitation conditions. Flux distortion occurs in the iron core, which is typically made of laminated grain-oriented silicon steel sheets. This distortion leads to intensified core vibration and local overheating, which in turn affects heat generation analysis and the insulation evaluation of electrical equipment [2]. In contrast to the hysteresis behavior exhibited by ferromagnetic materials under sinusoidal excitation, magnetic materials subjected to more complex excitations, like the superposition of harmonics on the fundamental wave, can produce localized hysteresis loops. This affects the hysteresis and loss characteristics of the material [3]. Therefore, accurately predicting the dynamic magnetic properties of grain-oriented silicon steel sheets under complex multi-harmonic excitation is of paramount importance. Significant research has been dedicated to studying the hysteresis and loss characteristics of ferromagnetic materials under harmonic excitation. Existing core loss calculation methods can be broadly categorized into three types: the loss separation method, the hysteresis model method, and the empirical formula based on the Steinmetz equation. The loss separation method includes models such as the Bertotti loss trinomial model, which considers core loss as the sum of hysteresis loss, eddy current loss, and anomalous loss. The hysteresis model method encompasses the Preisach model and the Jiles–Atherton (J-A) model [4]. The Steinmetz empirical formula, due to its relatively simple structure, ease of calculation, and high accuracy, remains one of the most commonly used formulas for core loss calculation. However, the Steinmetz formula is derived and fitted for sinusoidal wave excitation and needs to be modified for application to non-sinusoidal excitations [5,6]. In recent years, scholars have proposed several improvements to the Steinmetz empirical formula. One such modification accounts for the fact that core loss is related not only to the amplitude B of the magnetic flux density but also to its rate of change, leading to the development of a modified Steinmetz formula [7,8]. Further, foreign researchers have recognized that core loss is also influenced by the instantaneous value of B(t) within a magnetization period. This understanding has led to the proposal of a generalized Steinmetz formula [9]. Considering that the magnetization process is influenced by the rate of change in the magnetic flux density as well as the magnetization history, an improved generalized Steinmetz formula has been suggested [10]. Additionally, an enhanced loss separation algorithm for modifying the voltage waveform is proposed, though this model faces challenges in accurately calculating the loss of magnetic materials under non-sinusoidal excitation conditions [11].
A time-domain extension algorithm for iron loss is utilized, which is applicable to non-sinusoidal excitation based on the loss separation method [12]. However, this model neglects the correlation between the characteristic parameters of anomalous loss and the magnetization frequency. It is only suitable for loss calculation under conditions of low magnetic flux density and frequency, and significant errors occur in core loss calculations at higher magnetic flux densities and frequencies. In the improved Steinmetz formula method, the total core loss is merely influenced by variables such as permeability and the amplitude of magnetic induction intensity [13]. It fails to accurately calculate the loss characteristics of soft magnetic materials under any complex multi-harmonic excitation. Moreover, the model contains numerous coefficients and demands a substantial amount of experimental data for fitting.
In [14], the J-A hysteresis model to characterize the nonlinear properties of the transformer core is employed and the secondary voltage amplitude is derived to analyze the primary side short-circuit fault of the transformer. As indicated in [15], under operating conditions like damping attenuation and sinusoidal steady state, an extremely precise hysteresis model is not necessary. Thus, an equivalent hysteresis model based on a high-order polynomial was established. In [16], a parallel combination of nonlinear inductors and nonlinear resistors to embody the nonlinear features of the core material using an algebraic approach is adopted. In [17], the aforementioned model is enhanced. When computing the parameters of the nonlinear resistor, the no-load loss test results were taken into account. The merit of this model lies in its simplicity, which facilitates circuit simulation applications. However, its drawbacks include limited accuracy and poor adaptability.
To address the aforementioned issues, this paper employs the Brockhaus magnetic characteristic experimental measurement platform to measure and calculate the magnetic properties of amorphous alloy cores under diverse complex harmonic excitations. The Preisach model is utilized to simulate the hysteresis characteristics of the cores. Concurrently, by taking into account the correlation between the statistical parameter of abnormal loss under single-frequency sinusoidal excitation and the amplitude of magnetic flux density as well as the magnetization frequency, a function is constructed and parameters are extracted based on the loss experimental data. Subsequently, a computational expression for the magnetic field intensity corresponding to the abnormal loss under multi-harmonic excitation is formulated. A dynamic hysteresis model under multi-harmonic excitation is thereby proposed, enabling the prediction of the dynamic hysteresis and loss characteristics of amorphous alloys when multiple harmonics are superimposed, which improves the clarity and smoothness of the operation. Through a comparative analysis of the prediction results and the experimental results, the universality and accuracy of the dynamic hysteresis correction model and the loss prediction algorithm put forward in this paper are validated.

2. Core Loss Characteristics Under Sinusoidal Excitation Low-Voltage Side Winding Model

The total core loss can be attributed to the contributions of hysteresis loss and eddy current loss. Due to the existence of magnetic domain structures, eddy currents can be classified into global eddy currents and local eddy currents [18]. Bertotti proposed the loss separation method based on the microscopic magnetization process inside magnetic materials, dividing the total core loss P of silicon steel sheets per unit volume per unit cycle into three parts. They are the hysteresis loss Ph, the eddy current loss Pe and the anomalous loss Pc [19].
P = P h + P e + P c
This model is applicable to sinusoidal magnetic flux density and has been widely used in the calculation of core losses of electrical equipment.

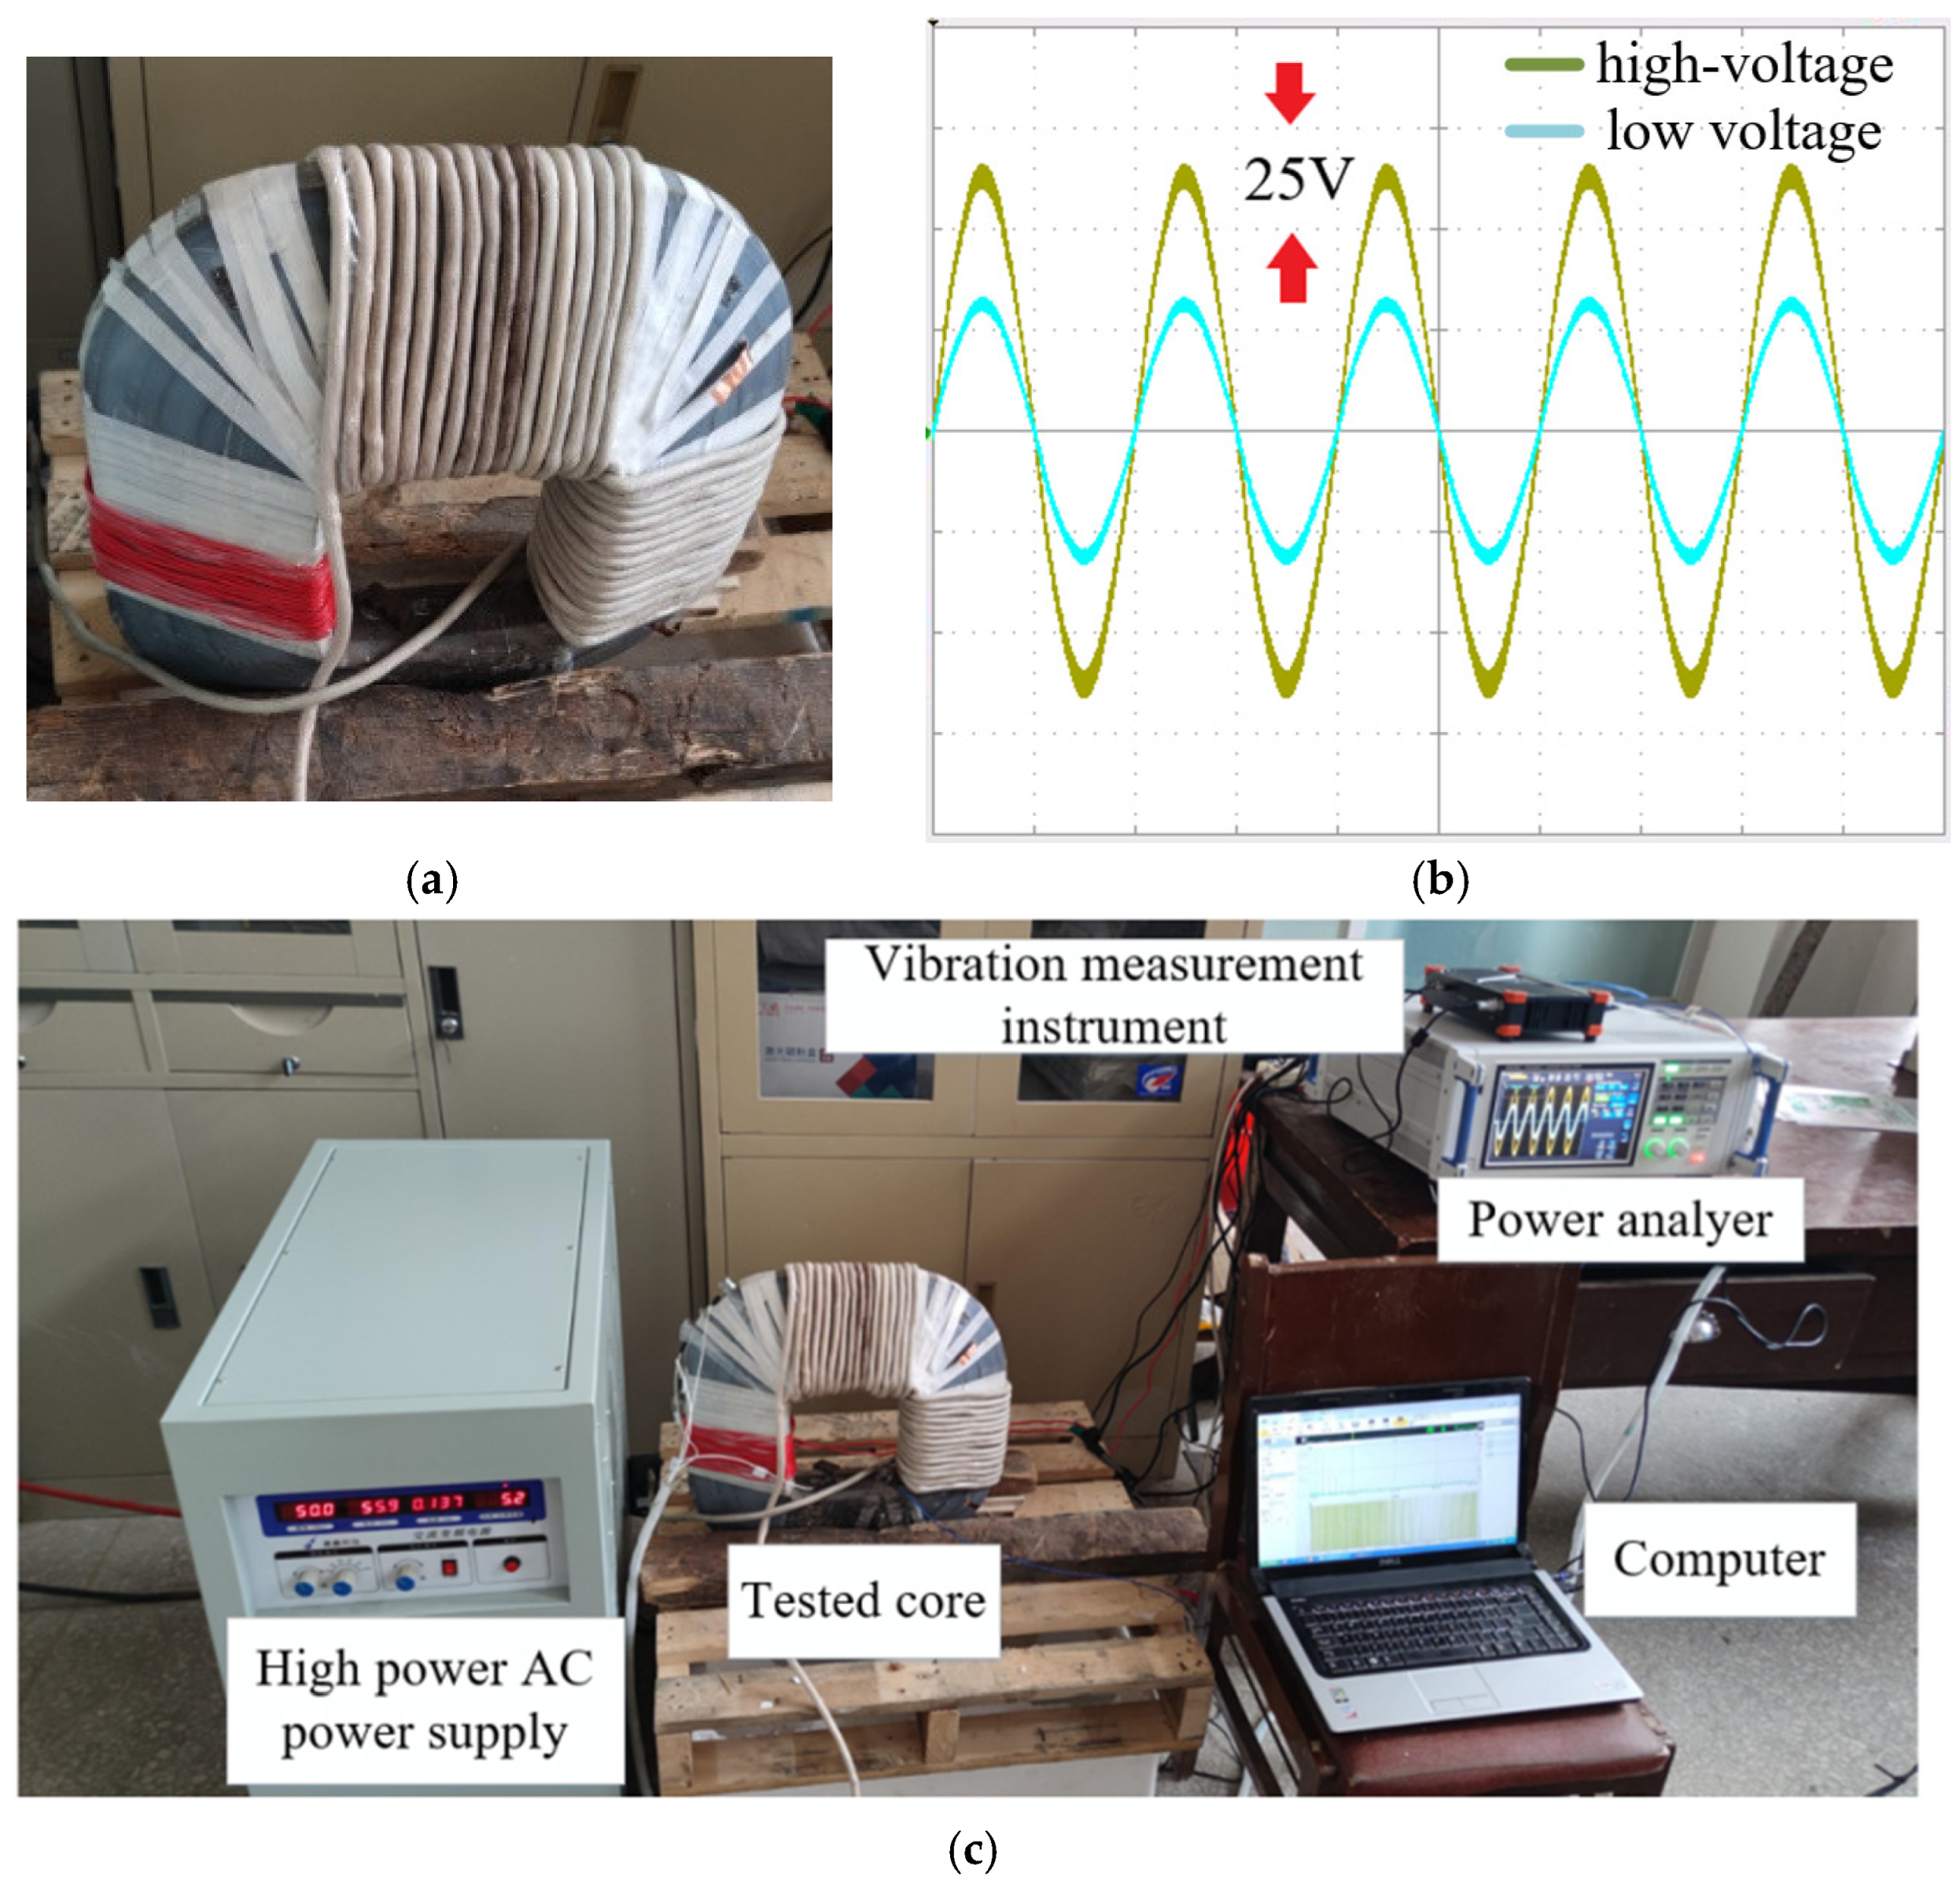
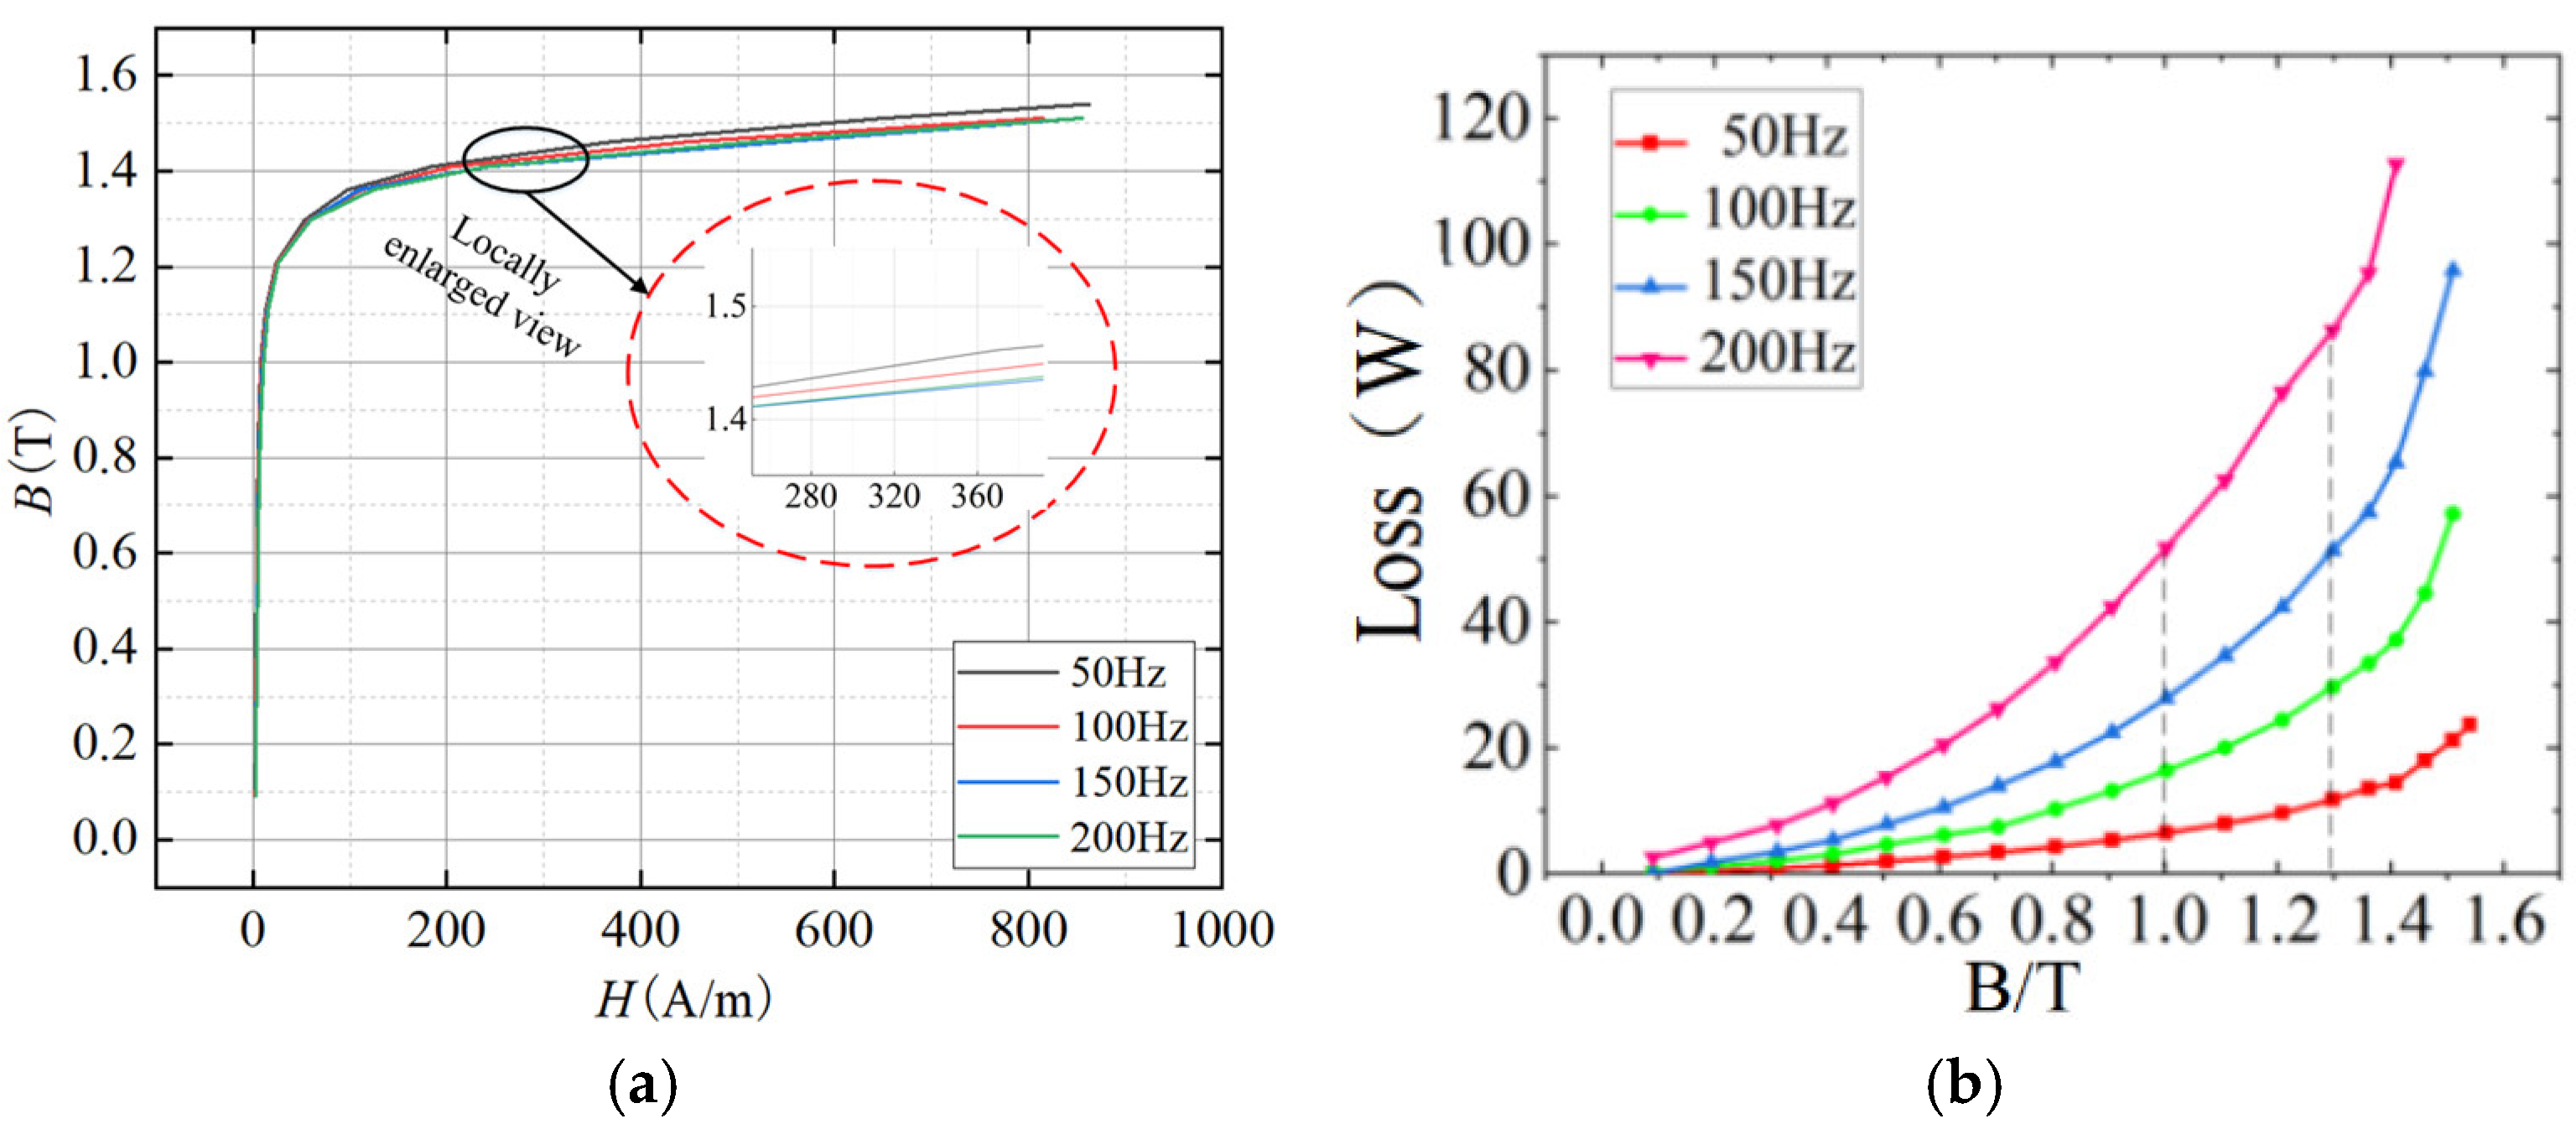
2.1. Core Loss Characteristics Under Sinusoidal Excitation

The electromagnetic characteristics of core materials are usually measured and obtained under sinusoidal alternating magnetization conditions in accordance with international standards. However, since intermediate-frequency transformers usually operate in power electronic circuits with non-sinusoidal excitations such as odd harmonics, square waves, and PWM waves, in order to detect the hysteresis and loss characteristics of core materials under different frequency excitations, this paper will utilize the Brockhaus magnetic characteristic experimental measurement platform in the laboratory to conduct loss characteristic tests. Through the measured data, the magnetic characteristics of amorphous alloys under different frequency excitations will be analyzed and studied.
Figure 1 shows the physical objects of the core magnetic characteristic measurement device and the test specimen. The basic parameters of the tested 50 kVA single-frame amorphous alloy 3D wound core are shown in Table 1. The wires are wrapped on the primary and secondary sides. The excitation voltage source of the primary winding comes from a power amplifier, and the waveform of excitation voltage is output as an alternating voltage. The secondary winding can measure the induced voltage waveform, and then the magnetic flux density of the core specimen can be calculated according to the law of electromagnetic induction. The test process is under closed-loop control. By adjusting the excitation voltage of the primary winding, the waveform of the input magnetic flux density is controlled to be the desired waveform.

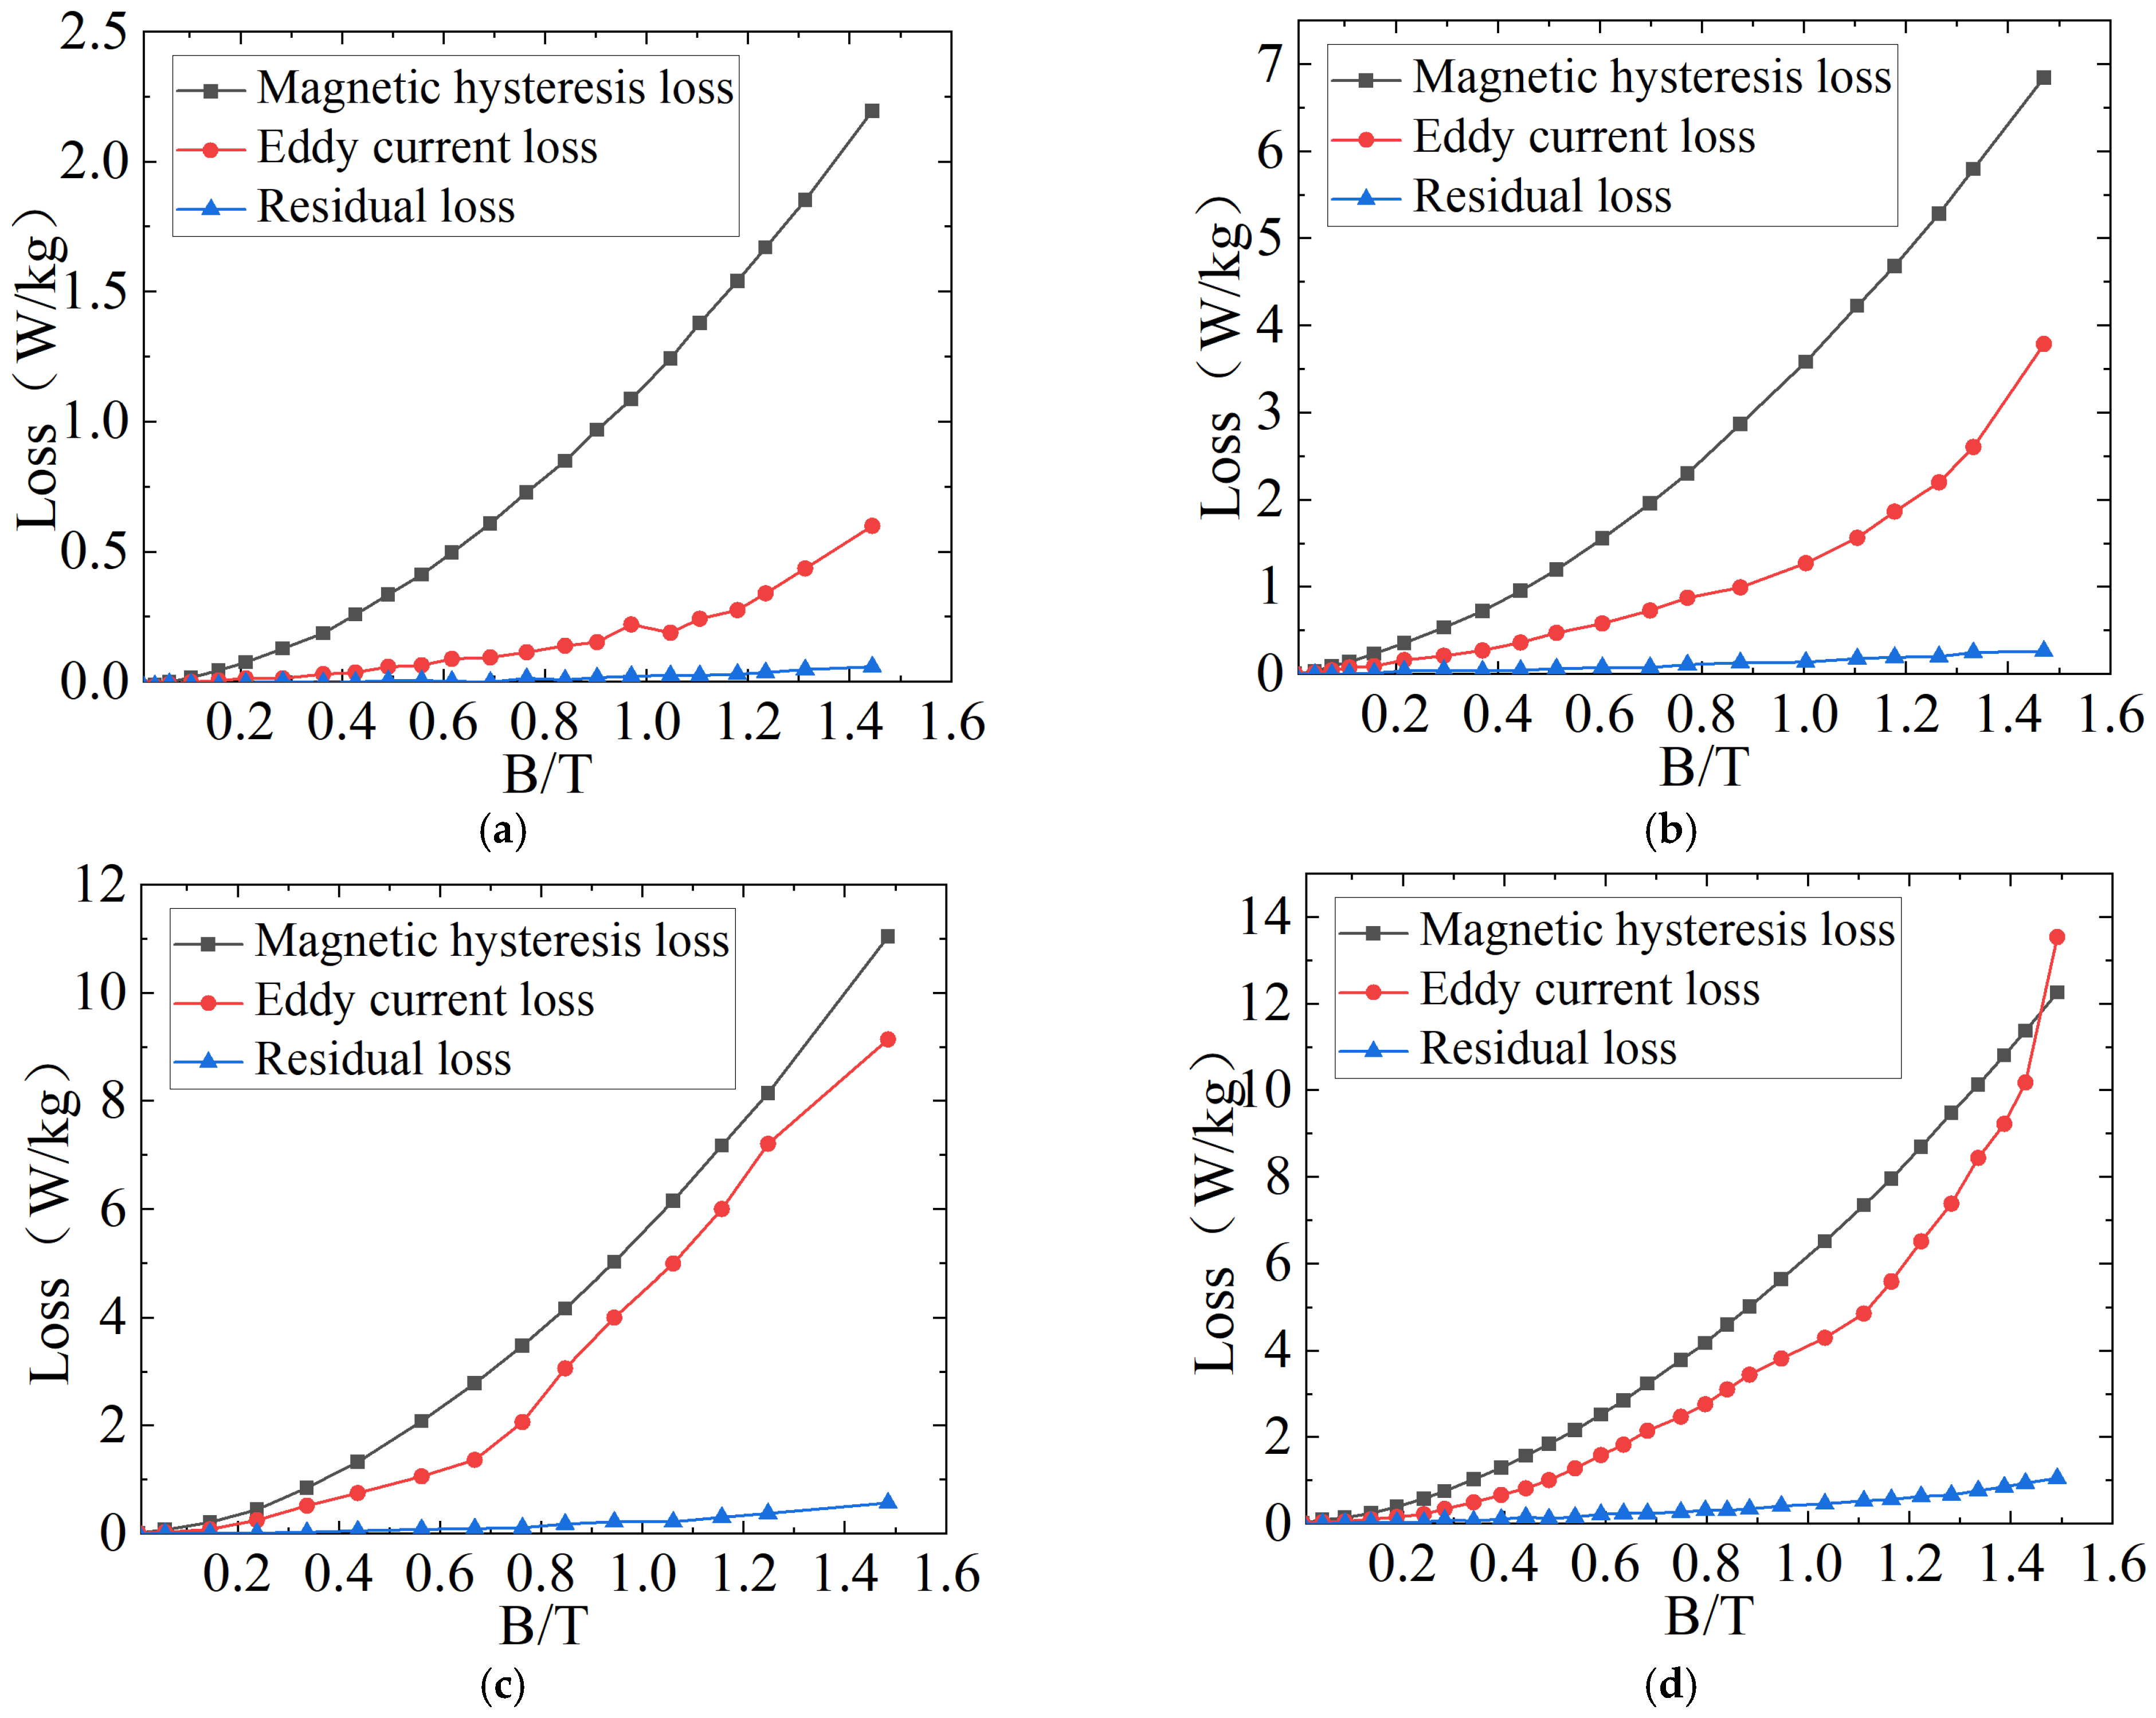
2.2. Loss Separation Method for Single-Frame Amorphous Alloy Iron Core

Figure 2a presents the B-H curves at different frequencies. The horizontal axis represents the magnetic field intensity H, and the vertical axis represents the magnetic induction intensity B. Four curves with different colors respectively represent the frequencies of 50 Hz, 100 Hz, 150 Hz, and 200 Hz. These curves all show an upward trend as the magnetic field intensity increases, and with the increase in frequency, the slopes of the curves gradually decrease. This indicates that at higher frequencies, the increment in the magnetic induction intensity is relatively small. Figure 2b shows the relationship curves between the loss and the magnetic flux density at different frequencies. There are four curves in the figure, representing the frequencies of 50 Hz, 100 Hz, 150 Hz, and 200 Hz, respectively. The vertical axis represents the loss, and the horizontal axis represents the magnetic flux density. It can be seen that as the magnetic flux density increases, the loss also gradually increases, and the higher the frequency, the greater the loss at the same magnetic flux density.
For the transformer core, the loss separation method cannot be directly applied. By considering the introduction of the core process coefficient, a loss separation model applicable to the transformer core is proposed on this basis.
K = P s m P s
P t o t a l = P h c o r e + ( P c + P e x c ) K
where K represents the core process coefficient, which is affected by the material, excitation, and the magnitude of the peak magnetic flux density. Psm denotes the specific total loss of the core model, while Ps represents the specific total loss of a single specimen of the corresponding ferromagnetic material. Given that the impact of K on eddy current loss and anomalous loss is not exactly the same, it is assumed that in the anomalous loss, Bm is the average value of the former, ensuring that it still adheres to the trend of varying with the square of the peak magnetic flux density within the core. Ptotal represents the fitted total loss in the separation model and Phcore represents the hysteresis loss of the core model.
Under power frequency sinusoidal excitation, the basic process for core loss separation calculation is as follows, based on the voltage excitation and magnetic induction intensity expressions defined in Equation (1). Assuming a uniform magnetic field distribution within the core, the eddy current loss of the ferromagnetic material can be derived according to Lenz’s law, as presented in Equation (4).
P c = σ d 2 12 ρ 1 T 0 T ( d B ( t ) d t ) 2 d t = σ d 2 π 2 6 ρ B m z 2 f 0 2
Here, σ represents the electrical conductivity of the material, d is the thickness of a single piece of ferromagnetic material, and ρ stands for the density of the material. As the excitation conditions involve a fundamental frequency of 50 Hz and inter-harmonics with relatively low frequencies, the influence of the skin effect can be neglected.
Taking the area of the quasi-static hysteresis loop under 50 Hz sinusoidal excitation as the unit hysteresis loss Pwh of the core, parameter fitting is carried out according to Equation (5). Since the growth rate of the core loss increases sharply when Bm is large, the parameter β is set as a function of Bm, as shown in Equation (6), where Kh, β1β4 are all parameters to be fitted. Finally, the hysteresis loss of the core can be calculated by Equation (7).
P w h = K h B m z β
β = β 1 + β 2 B m z + β 3 B m z 2 + β 4 B m z 3
P h c o r e = P w h f 0
The anomalous loss of the ferromagnetic material is computed as demonstrated in Equations (8) and (9).
Z = 1 T 0 T d B ( t ) d t d t = 4 f B m z
P e x c = n 0 V 0 2 Z ( 1 + 4 σ G S s n 0 2 V 0 B ˙ 1 ) 8 σ G S s V 0 f 1.5 B m z 1.5 2 n 0 V 0 f B m z
where Z represents the average magnetization rate, Ss is the cross-sectional area of a single piece of ferromagnetic material, G is a constant with a value of 0.1375, and no and Vo are the statistical parameters of the magnetic units of the material and are only related to the material and the peak magnetic flux density Bm. Therefore, the function relationships are defined by using the function shown in Equations (10) and (11), where α1–α6 are the parameters to be fitted.
V 0 = α 1 + α 2 B m α 3
n 0 = α 4 + α 5 B m α 6
By employing the Levenberg–Marquardt optimization algorithm to fit the experimental data, the loss separation outcomes of the amorphous core at frequencies of 50 Hz, 100 Hz, 150 Hz, and 200 Hz are obtained, as depicted in Figure 3. The corresponding fitting parameters are presented in Table 2. It is evident from the figure that the fitted loss curves align well with the measured data, thus validating the feasibility and high accuracy of the separation method. Among the three separated loss components, the anomalous loss exhibits the smallest magnitude. For the amorphous core, due to the extremely thin nature of the amorphous material, the eddy current loss is much smaller compared to that of a silicon–steel core. However, it should be noted that as the frequency increases, the eddy current loss rises significantly. Although the eddy current loss remains relatively low at lower frequencies, it becomes more pronounced with increasing frequency. In contrast to the eddy current and hysteresis losses, the anomalous loss is negligible, and the hysteresis loss essentially increases exponentially with the peak magnetic flux density.

2.3. Construction of Finite Element Simulation

According to the experimental principle and theory, a 3D finite element simulation model is established. The model consists of iron core, high-voltage winding and low-voltage winding, as shown in Figure 4.
The magnetic flux density nephograms under different working conditions are obtained as shown in Figure 5. The loss comparison curve in Figure 6 is drawn by comparing the simulation results with the experimental data.
The graph shows two curves representing experimental loss. The discrepancies between them can be attributed to several factors. Measurement Errors: In experiments, the instruments used for measuring loss may have inaccuracies. For example, the voltage and current sensors might have a tolerance level, leading to slight variations in the measured values. This could contribute to the differences between the two experimental loss curves. Environmental Influences: External factors such as temperature and electromagnetic interference can impact the experimental results. Minor changes in ambient temperature can alter the material properties of the components under test, causing variations in the measured losses.
Sampling and Data Processing: The sampling frequency and data-processing methods also play a role. If the sampling is not dense enough, important details might be missed, resulting in differences between the curves. Despite these errors, they remain within an acceptable range, ensuring the overall validity of the experimental results. In the constructed finite element simulation, the core losses under diverse working conditions are compared and collated with the experimental measurement data, as illustrated in Figure 6. It can be observed that the losses remain similar within the range of 0 T to 0.8 T. However, between 0.9 T and 1.45 T, the simulation values are marginally higher than the experimental values, indicating the presence of a certain degree of error.

3. Core Loss Characteristics Under Non-Sinusoidal Excitation

With the connection of a considerable number of new energy power electronic devices, high-voltage direct current transmission facilities, and nonlinear components to the power grid, serious harmonic pollution problems will ensue, leading to a continuous escalation in the distortion rates of both voltage and current. Subsequently, this will have a multitude of adverse impacts on the distribution system and its associated equipment. In this context, various inter-harmonic components that are not integer multiples of the fundamental frequency will emerge in the power system. When these inter-harmonic components are applied to the transformer, the excitation current of the transformer will surge sharply, leading to a significant increase in the transformer’s core and copper losses and causing the transformer to enter the saturation state prematurely. Meanwhile, the reactive power will also experience a significant augmentation, ultimately severely disrupting the normal operation of the transformer and posing a potential hazard to the stability and safety of the power system.
Based on the core loss separation method under sinusoidal excitation described previously, an in-depth study on the composition of the core loss of the transformer in the inter-harmonic environment is carried out, and the magnetic loss of the single-frame amorphous alloy core model under inter-harmonic working conditions is calculated.
The experimental operation procedures remain identical to those previously described: Gradually increase the voltage input from zero. When the measured effective value of the voltage attains the calculated value, record the magnitudes of the primary and secondary voltages, excitation current, no-load loss, and apparent power. It is noteworthy that after each set of data is measured, a sinusoidal excitation must be applied to the iron core until the magnetic induction intensity reaches a relatively high value, and then slowly reduced to zero for demagnetization. The subsequent measurement can only be initiated after the iron core has been completely demagnetized. Failure to properly demagnetize the iron core will result in the next measurement outcome deviating from the true value. Additionally, if the voltage does not decline gradually but instead rapidly drops to 0 V during demagnetization, the generated transient current will be excessively large, potentially blowing the fuse or even causing damage to the equipment. This chapter investigates the influence laws of the frequency and content of diverse inter-harmonic components on the magnetic performance of the iron core. The specific form of a harmonic component is determined by three elements: harmonic frequency, harmonic amplitude, and harmonic phase. The current waveform output by the signal generator in the experiment and the corresponding magnetic induction intensity waveform in the iron core are shown in Figure 7.
Due to the influence of inter-harmonics, the peak magnetic flux density in the transformer increases during operation, resulting in deeper saturation, deterioration of the magnetic permeability effect, and reduced efficiency. Figure 7a,b illustrate the sinusoidal and inter-harmonic excitation waveforms, respectively, while Figure 7c shows the loss curve under inter-harmonic excitation. When the transformer operates at 50 Hz, the presence of inter-harmonic components causes the core to saturate or even over-saturate prematurely, leading to a significant rise in losses and directly hindering the normal operation of the equipment.

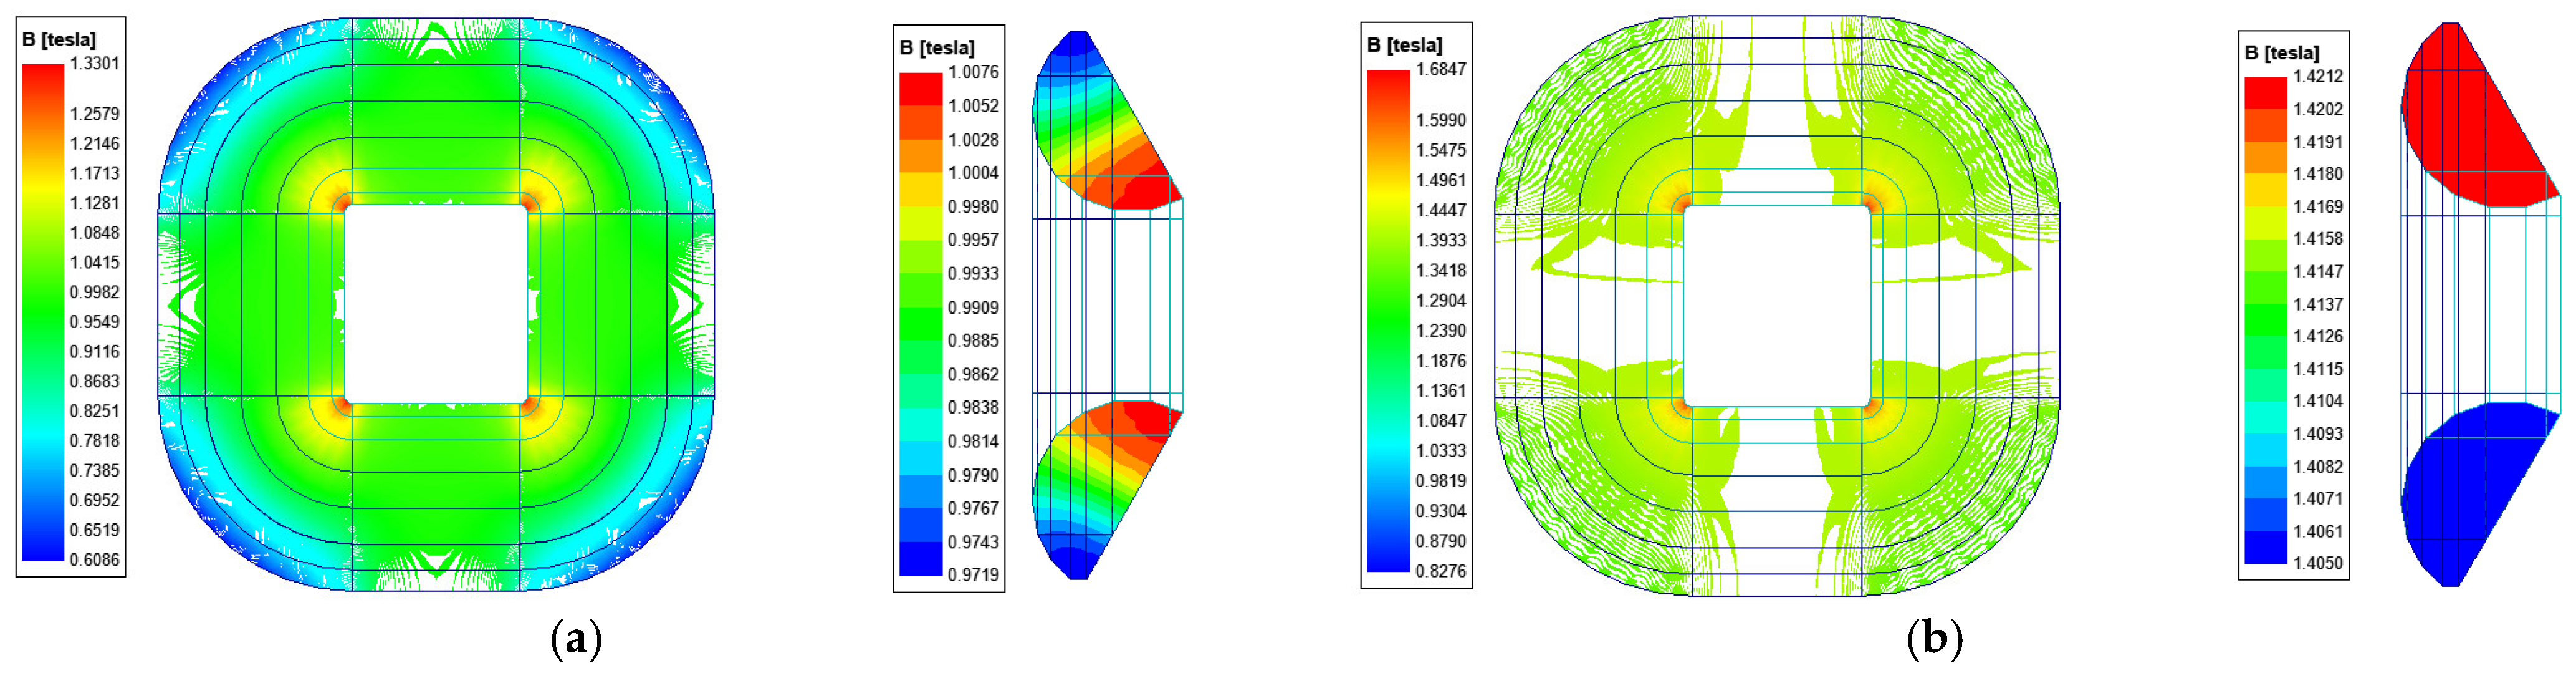
4. Core Rotational Magnetization

When a transformer is in operation, the magnetic flux distribution and variation laws within the core differ. Since the amorphous alloy core is manufactured by winding, the magnetic flux density is divided into the rolling direction and the non-rolling direction. To precisely delineate the variation law of the magnetic flux density in different positions of the transformer core, in accordance with the distribution of the magnetic field lines of the amorphous 3D wound core, the upper yoke section and the corner section of the core are intercepted as illustrated in Figure 8. Each core section is partitioned into six solution domains, and characteristic points A, B, C, D, E and F are selected within each solution domain, as shown in Figure 9.
Figure 10 presents the magnetic flux density variation curves in the rolling direction and the non-rolling direction of different characteristic points on the selected upper yoke section over two cycles. It can be clearly observed that both curves exhibit a sinusoidal waveform, suggesting that the magnetic field strength varies periodically in these two directions. Meanwhile, the magnetic flux density in both the rolling direction and the non-rolling direction gradually rises from the outer frame towards the inner frame, reflecting the non-uniformity of the magnetic field distribution in the cross-section and indicating that the magnetic field strength in the central region is stronger than that in the outer region.
P Fe = i = 1 n ( K h ν f 0 B r ν α + K c ν 2 f 0 2 B r ν 2 + K e ν 1.5 f 0 1.5 B r ν 1.5 ) + i = 1 n ( K h ν f 0 B θ ν α + K c ν 2 f 0 2 B θ ν 2 + K e ν 1.5 f 0 1.5 B θ ν 1.5 )
It can be inferred from the aforementioned simulation calculation results that characteristic points A to F are all subject to the effects of rotational magnetization as well as alternating magnetization. Nevertheless, the extents of influence on the characteristic points within different solution domains vary considerably. For the magnetic flux traveling from the outer frame to the inner frame of the core, it continuously augments due to the length of the magnetic circuit. Owing to the structure of the wound core, the magnitudes of the radial magnetic flux density and the tangential magnetic flux density at the inflection point are essentially identical.
Therefore, the proportions of the influences exerted by rotational magnetization and alternating magnetization within each solution domain of the amorphous wound core differ. In the computation of iron loss, if only the impact of alternating magnetization is taken into account, the calculation error will be augmented. Given that the stator winding current provided by the frequency converter contains a considerable quantity of harmonics, the magnetic flux density waveform of each characteristic point can be disassembled into the aggregate of the fundamental wave and individual harmonics, as demonstrated in Figure 11. Subsequently, the fundamental wave and harmonic constituents of the characteristic points are respectively plugged into Equation (12) for calculation. After that, the resultant values are superposed to derive the iron loss of this particular solution domain.
Figure 12 shows the distribution of hysteresis loss, eddy current loss and residual loss under four operating conditions. According to the calculated data, it can be seen that the core losses of the amorphous alloy single-frame core under the four operating conditions of 0.5 T, 1.0 T, 1.2 T and 1.45 T are 2.01 W, 6.54 W, 9.67 W and 14.5 W, respectively, among which the hysteresis loss accounts for the largest proportion of the total loss.

5. Conclusions

A comprehensive and in-depth exploration regarding the loss characteristics of the wound cores within amorphous alloy transformers utilized in photovoltaic inverters is carried out. The characteristics of loss and rotation magnetization under sinusoidal and non-sinusoidal excitation are included, which are verified by experimental tests. The main conclusions are summarized as follows:
  • Using the Brockhaus magnetic characteristic experimental measurement platform, we obtained the magnetization and loss characteristics of the amorphous alloy core under sinusoidal excitations at different frequencies. Results show that as frequency increases, the B-H curve slope decreases, and loss increases at the same magnetic flux density.
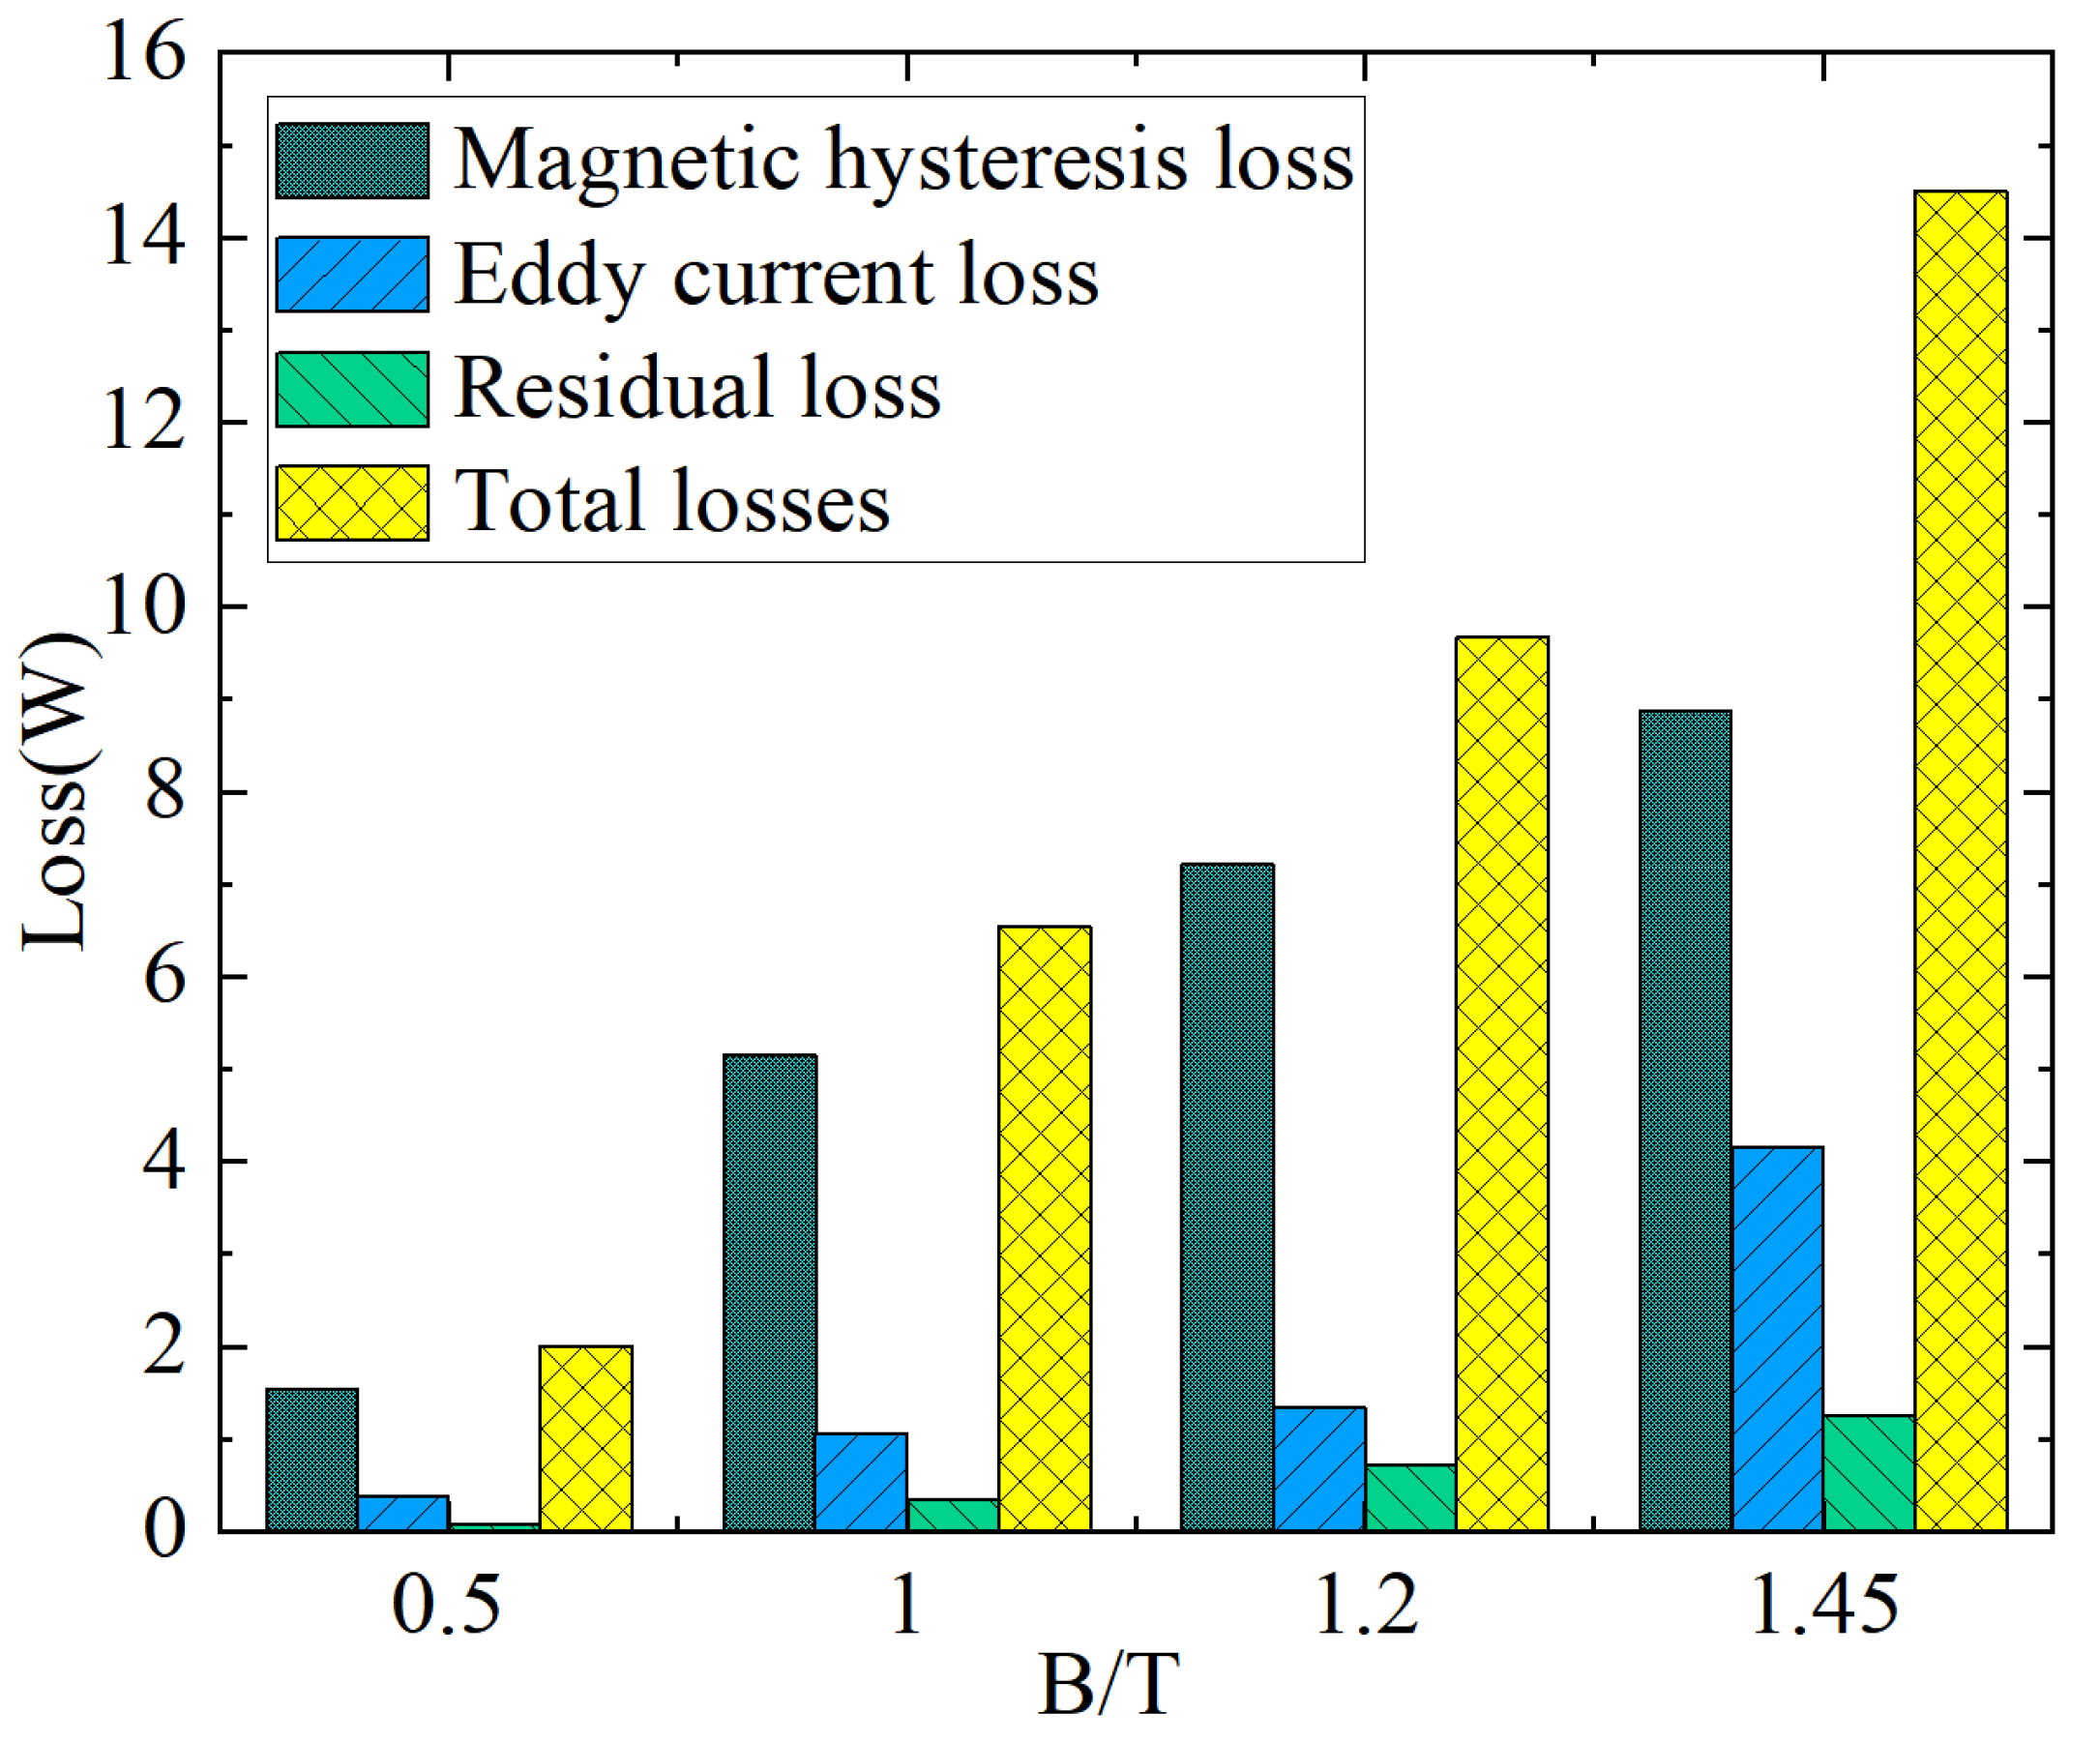
  • Our proposed loss separation model for transformer cores can effectively separate hysteresis, eddy current, and residual losses after parameter fitting via the Levenberg–Marquardt optimization algorithm. Separated losses at different frequencies were obtained. The eddy current loss of the amorphous alloy is relatively small, while the hysteresis loss grows exponentially with the magnetic flux density peak.
  • In an inter-harmonic environment, inter-harmonic components increase the transformer’s peak magnetic flux density, worsen saturation, and cause a large loss increase, hindering normal operation. Notably, core loss under inter-harmonic excitation is much greater than under sinusoidal excitation.
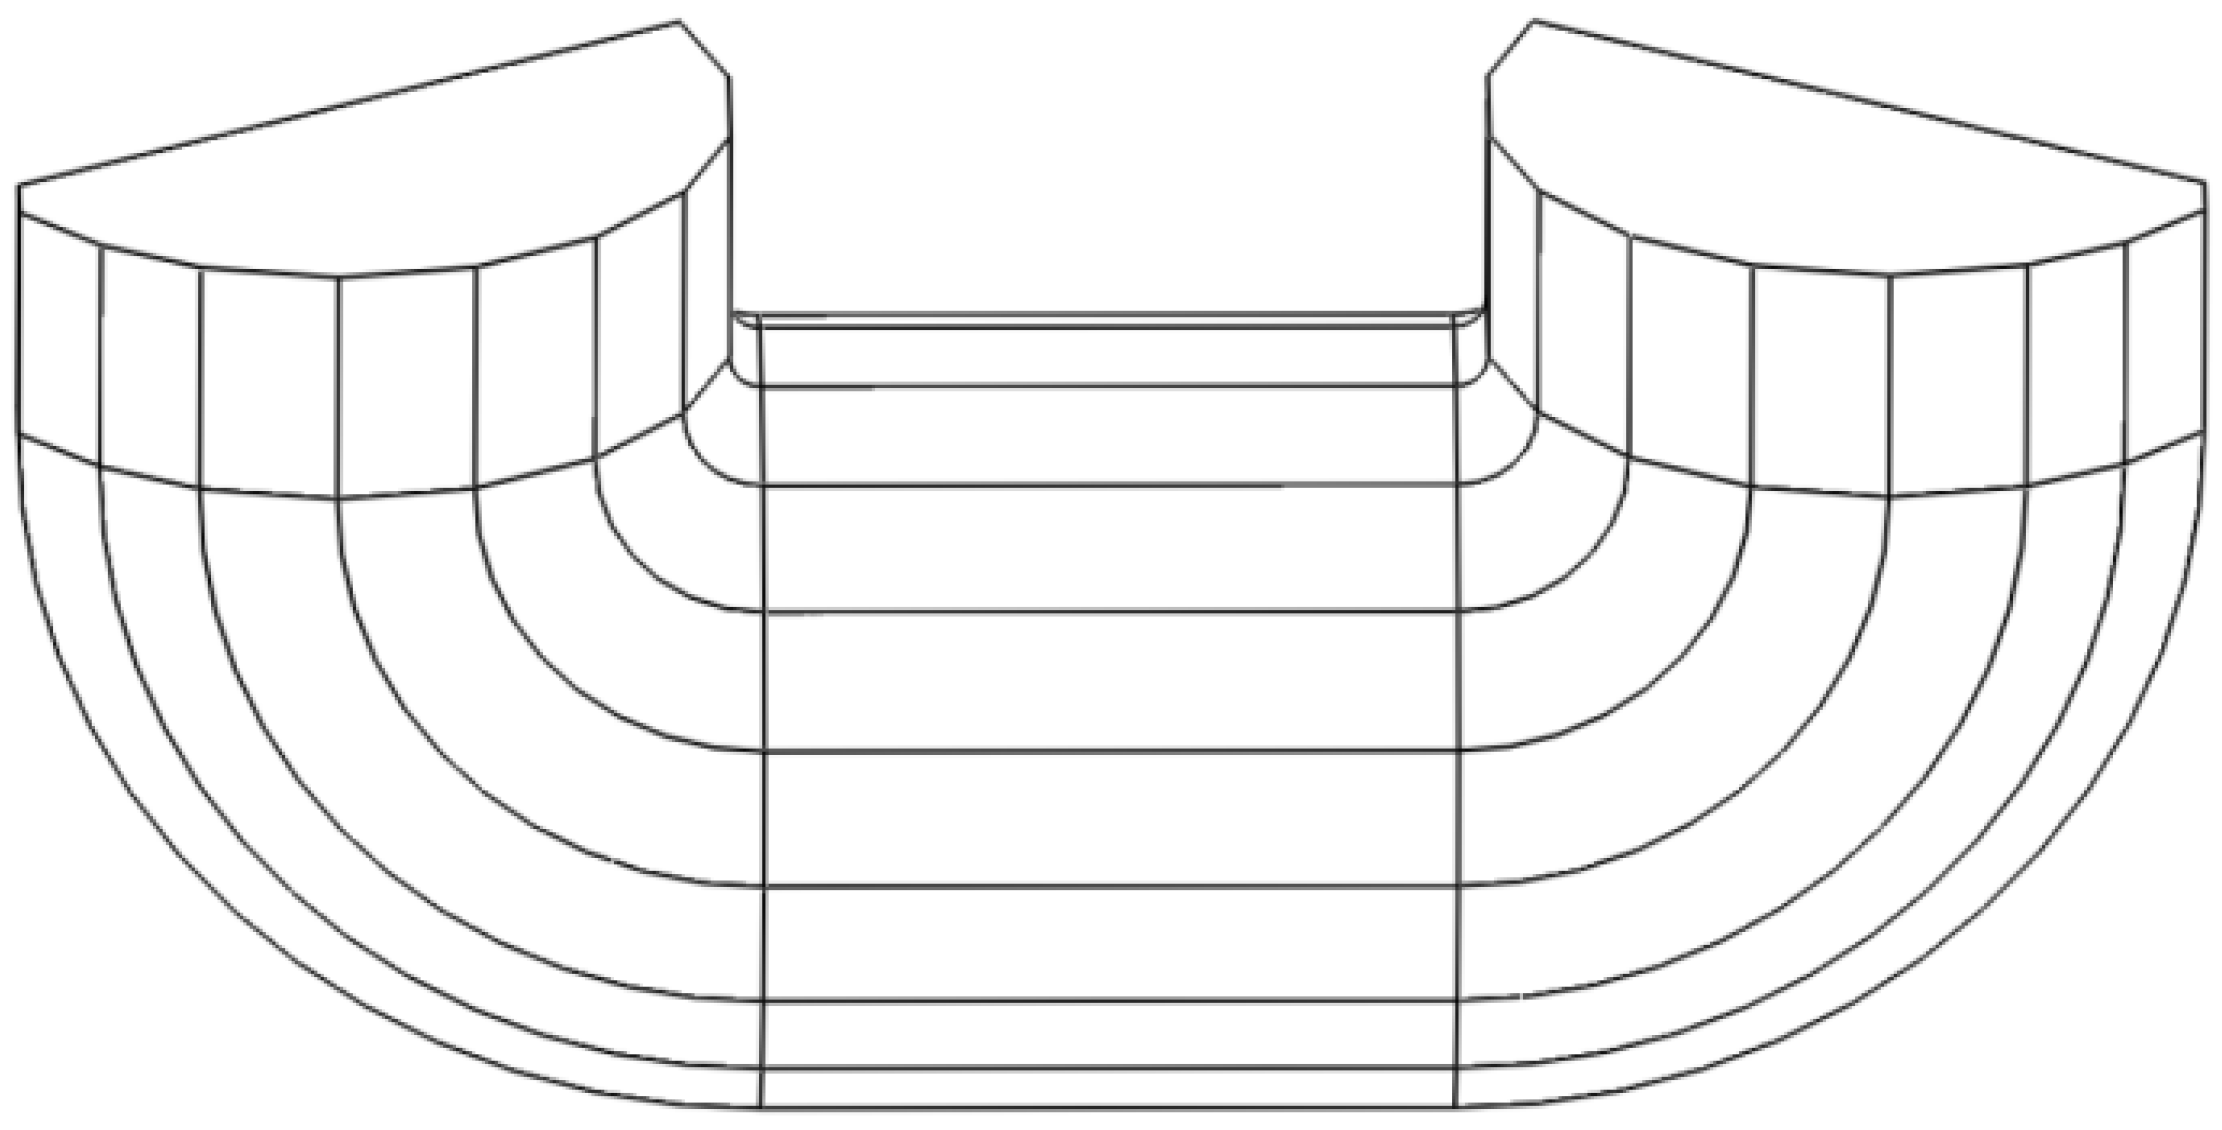
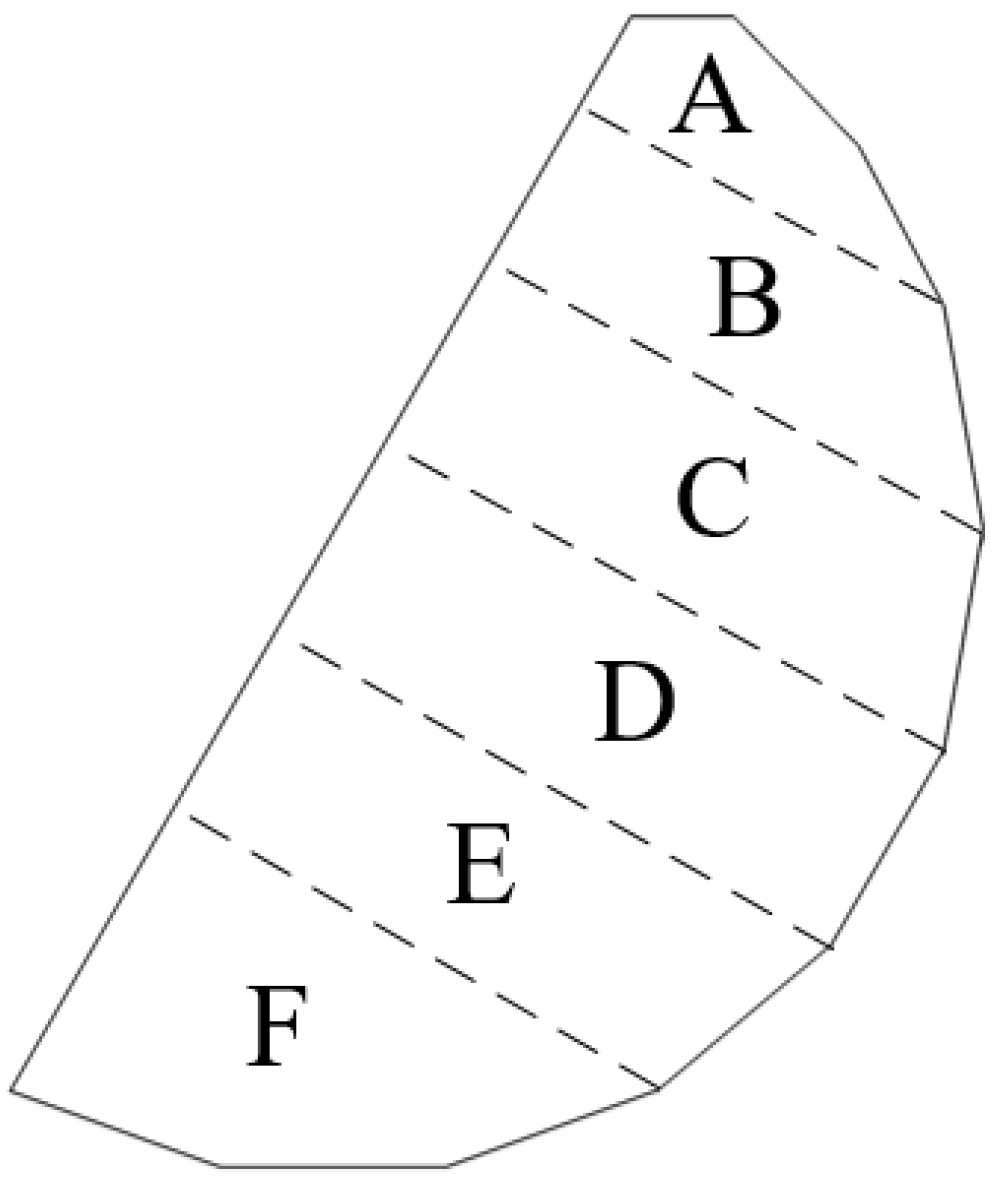
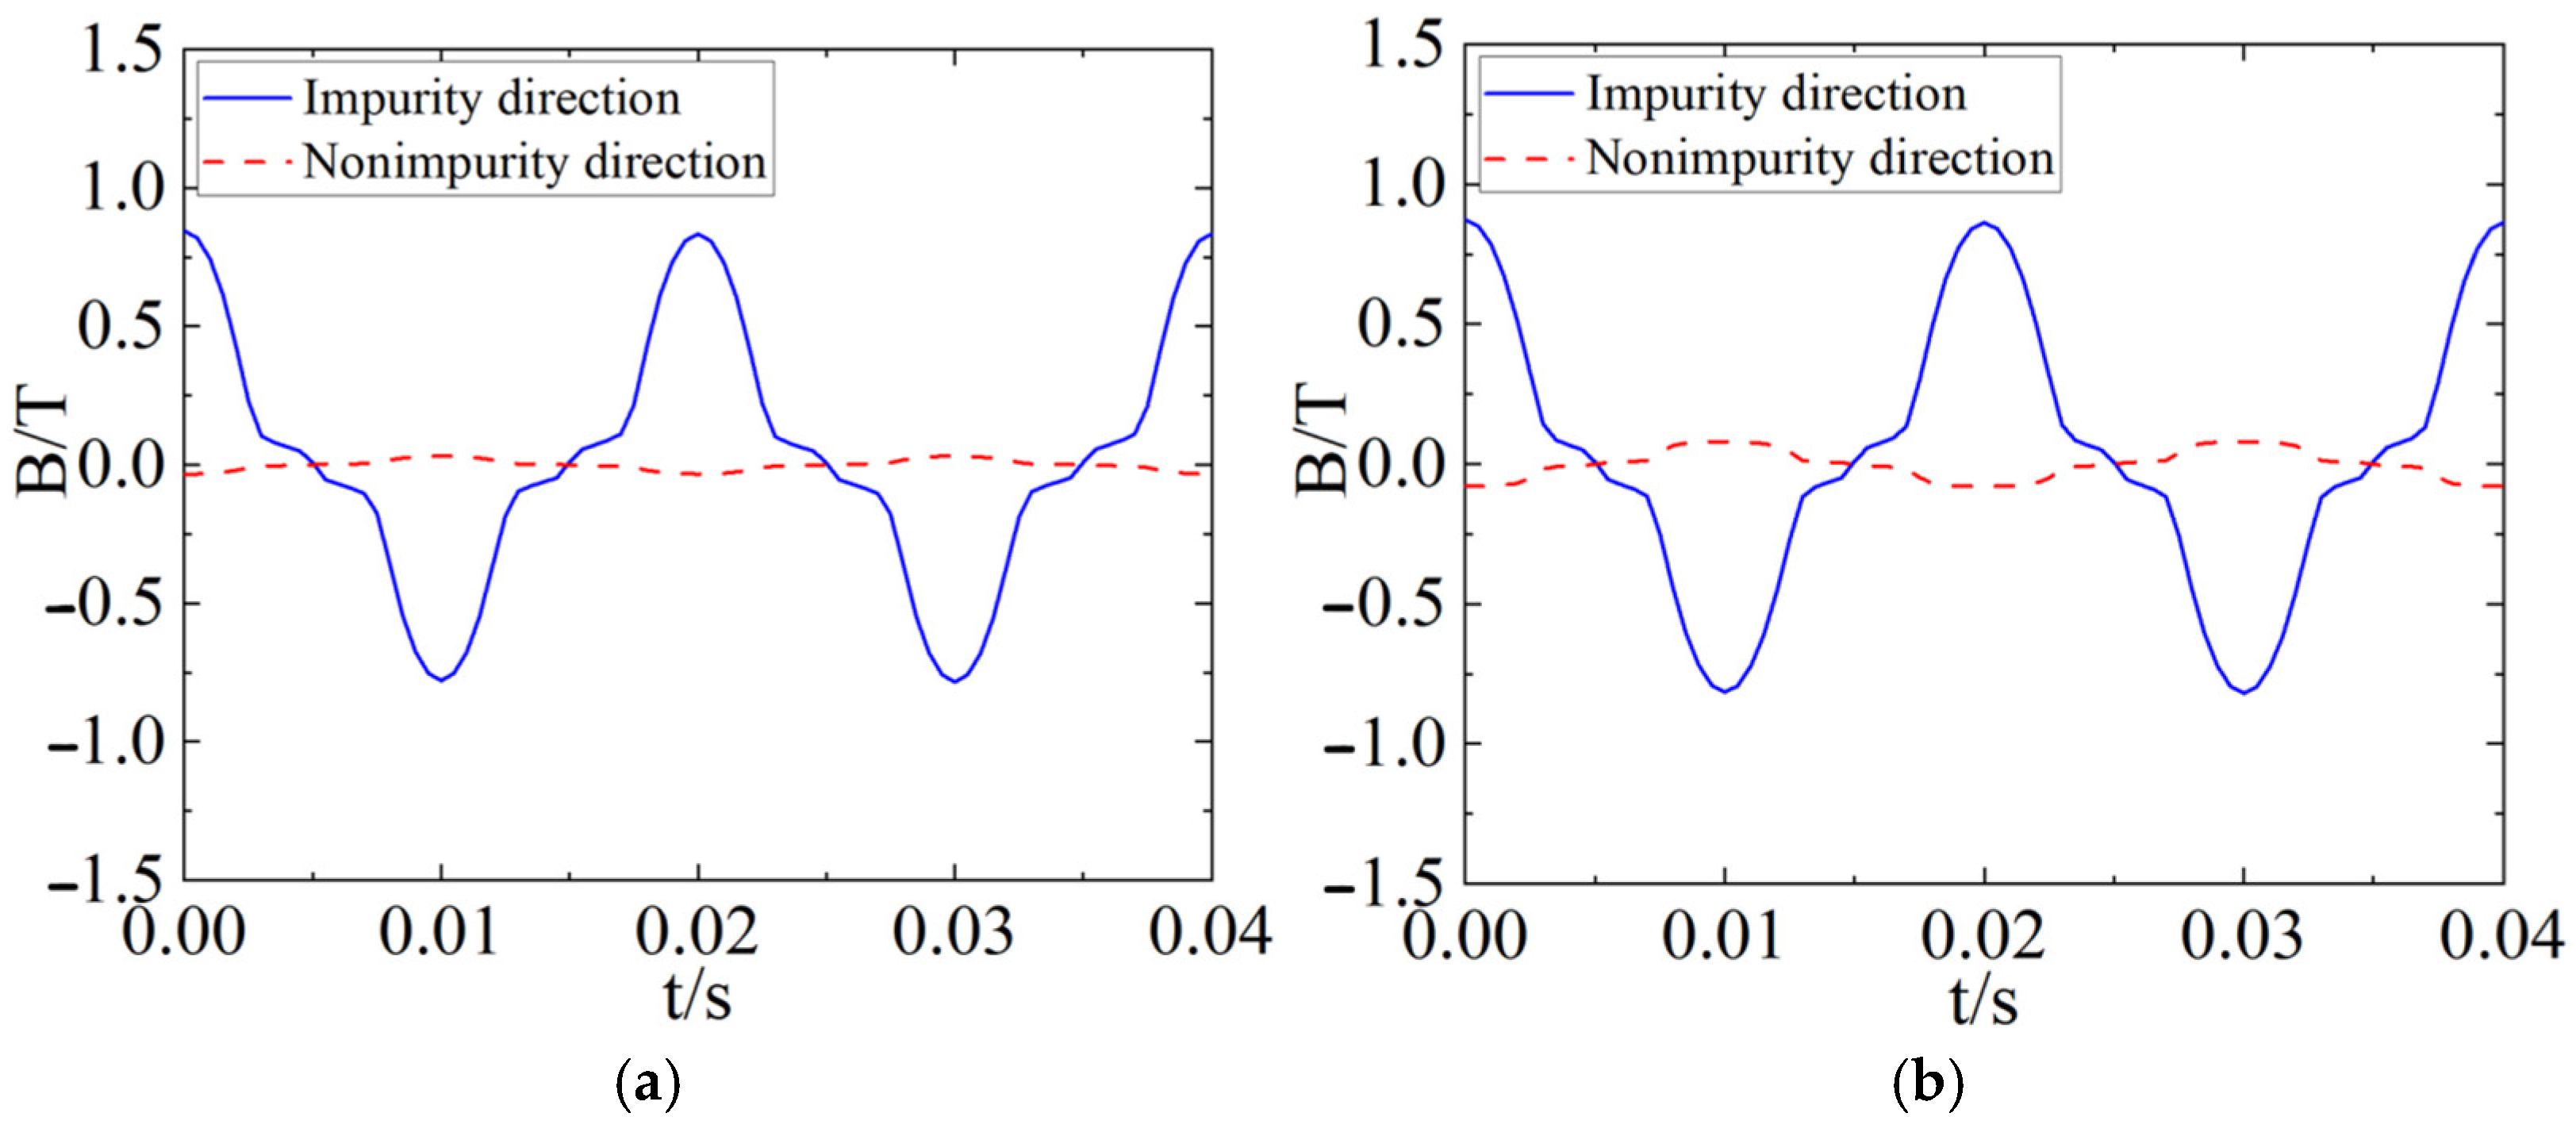
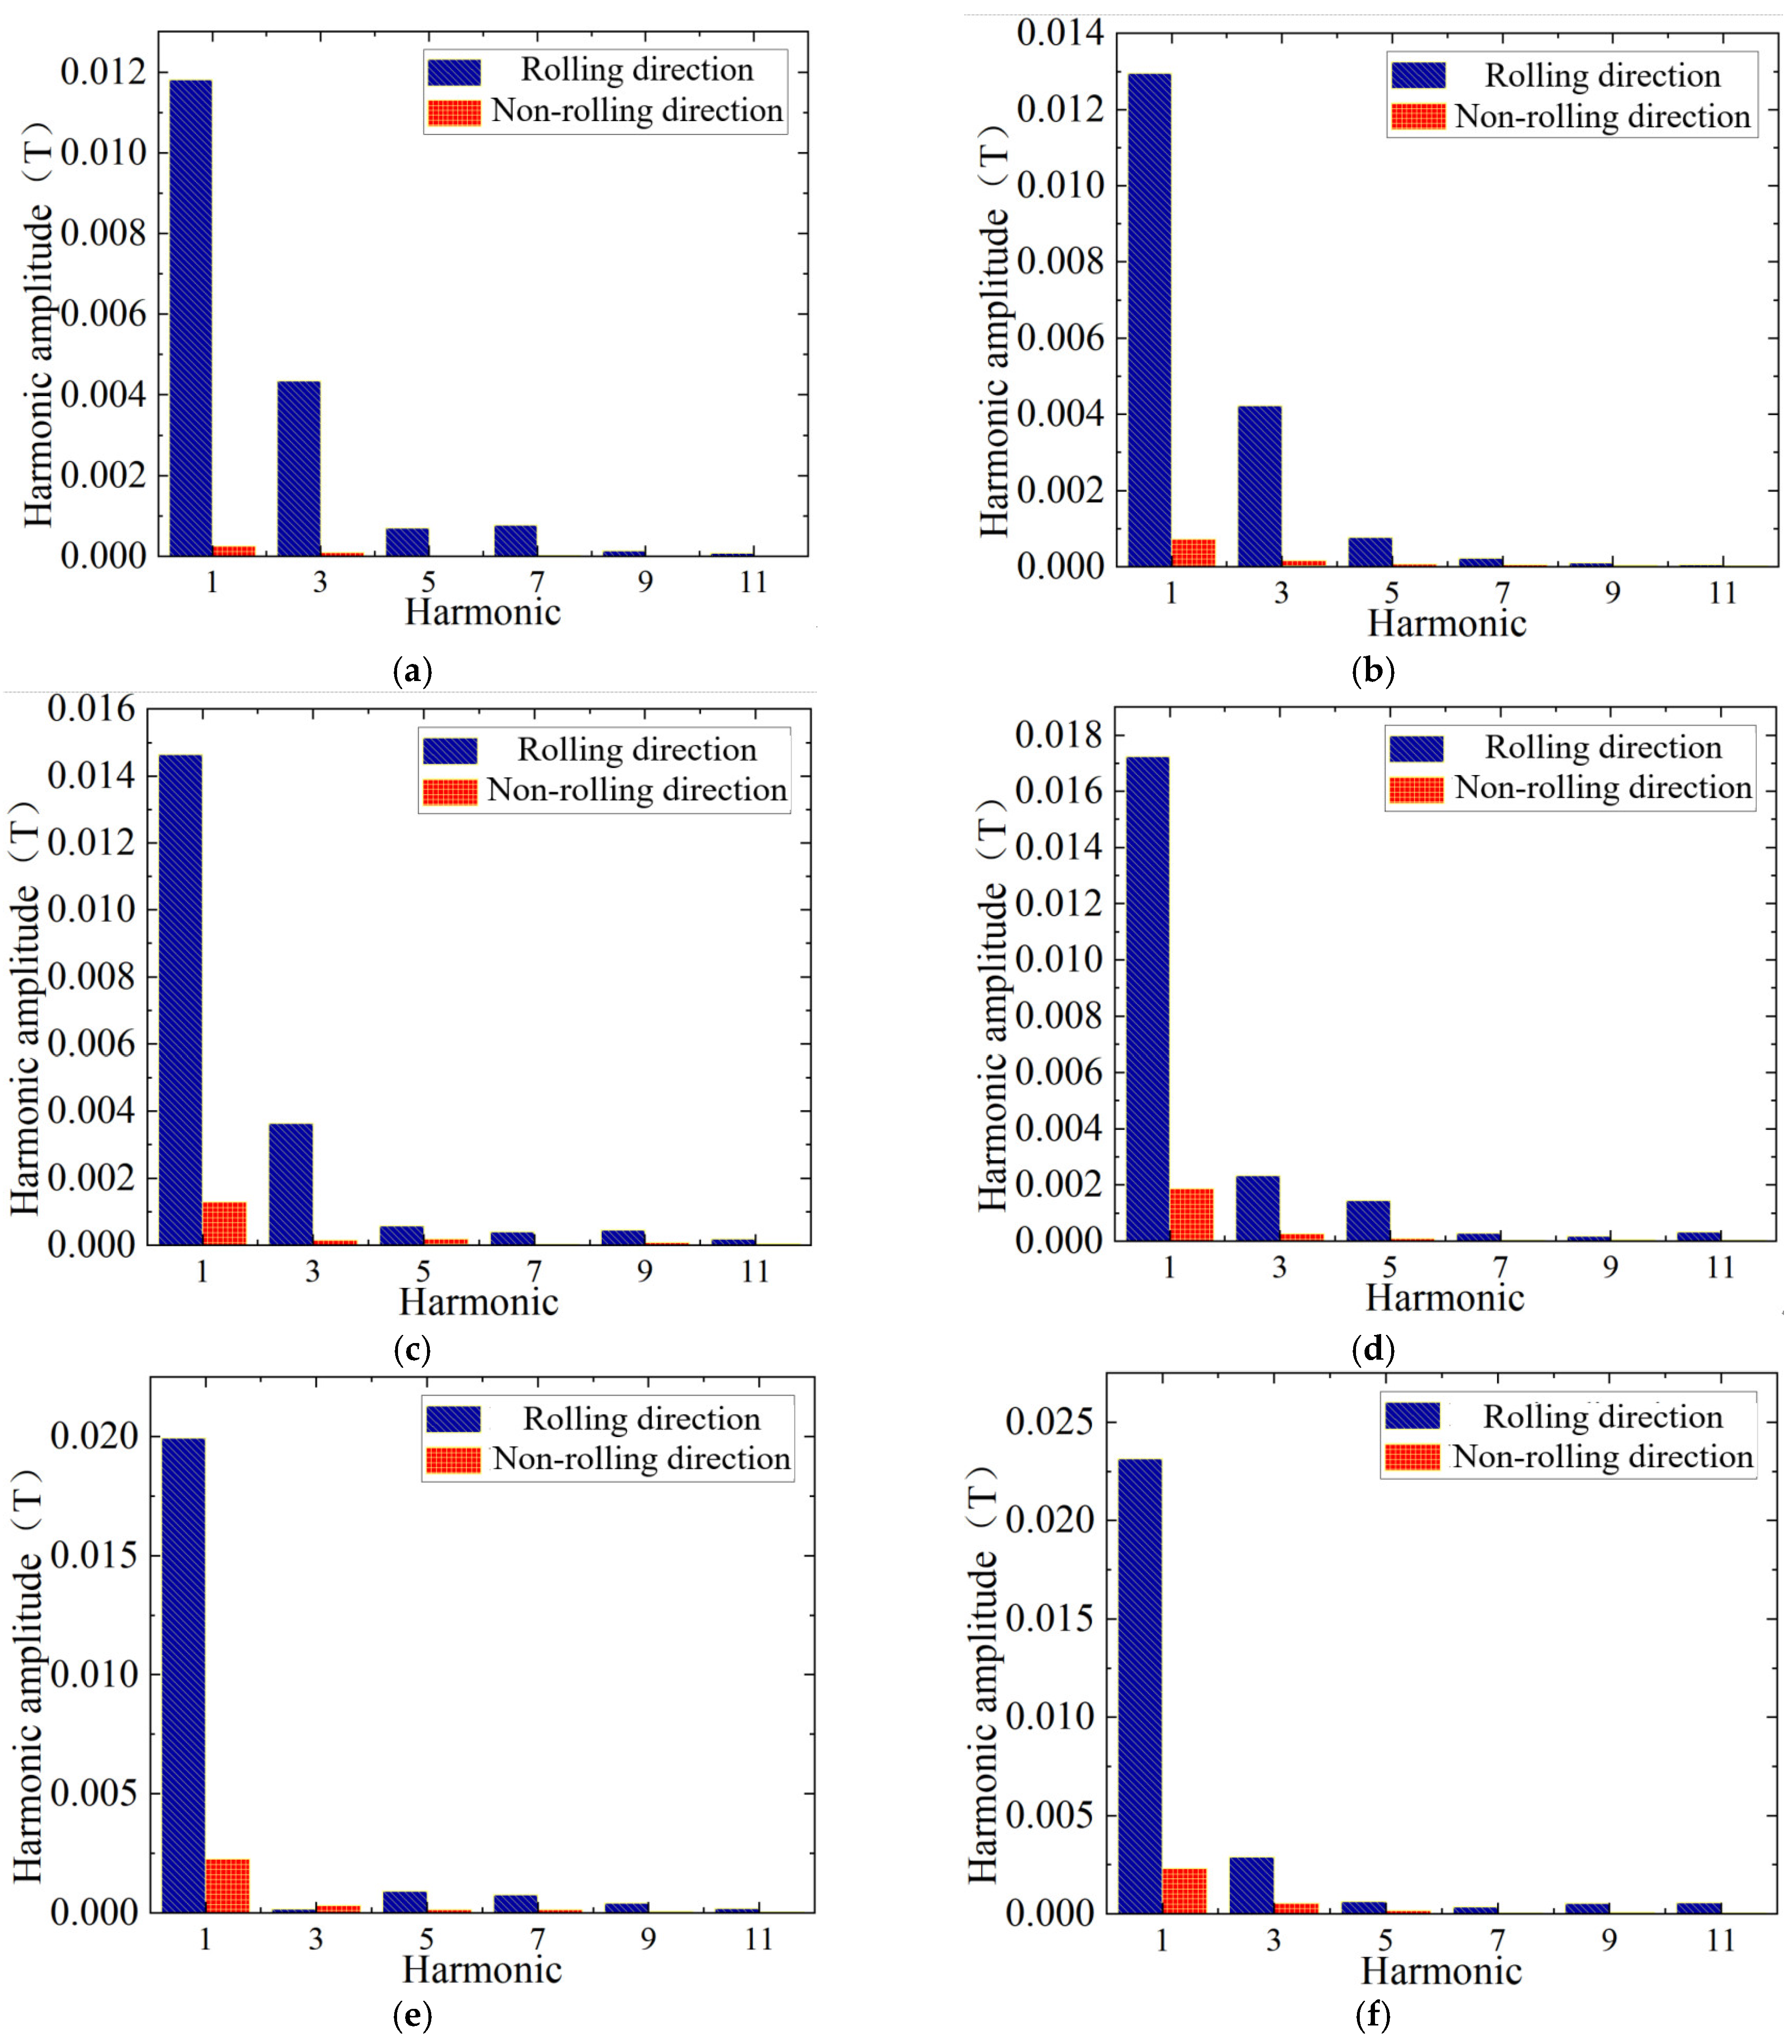
  • In transformer cores, rotational and alternating magnetization occur. Analyzing the magnetization curves of characteristic points on different sections of the amorphous 3D wound core reveals that although the magnetic flux density at each point is sinusoidal, the radial and tangential magnetic flux density distributions are non-uniform. Their variation patterns differ across sections and from the outer to inner frame, and the influence extents of the two magnetization types on characteristic points also vary. This means that considering only alternating magnetization in core loss calculation increases error, and rotational magnetization of the amorphous core should be considered.

Author Contributions

Software, P.C., X.W. and Y.Y.; Formal analysis, J.H.; Investigation, Z.Z.; Writing—original draft, L.Z. and H.L.; Writing—review & editing, X.Y. and Z.Y. All authors have read and agreed to the published version of the manuscript.

Funding

This research received no external funding.

Data Availability Statement

The original contributions presented in this study are included in the article. Further inquiries can be directed to the corresponding author.

Conflicts of Interest

Authors Peng Chen, Jianwei Han, Xinglong Yao and Zhe Zhao were employed by the Longyuan New Energy Co., Ltd. Authors Xiaohui Wang, Yunfei Yan and Lisong Zhang were employed by the Xi’an Thermal Power Research Institute Co., Ltd. The remaining authors declare that the research was conducted in the absence of any commercial or financial relationships that could be construed as a potential conflict of interest.

Abbreviations

The following abbreviations are used in this manuscript:
3Dthree-dimensional wound core
J-AJosephson–Anderson
PWMpulse width modulation
Bmagnetic induction
Hmagnetic field strength

References

  1. Krings, A.; Boglietti, A.; Cavagnino, A.; Sprague, S. Soft Magnetic Material Status and Trends in Electric Machines. IEEE Trans. Ind. Electron. 2017, 64, 2405–2414. [Google Scholar] [CrossRef]
  2. Li, Y.; Zhu, L.; Zhu, J. Core Loss Calculation Based on Finite-Element Method With Jiles–Atherton Dynamic Hysteresis Model. IEEE Trans. Magn. 2018, 54, 1300105. [Google Scholar] [CrossRef]
  3. Zhao, H.; Ragusa, C.; de la Barrière, O.; Khan, M.; Appino, C.; Fiorillo, F. Magnetic Loss Versus Frequency in Non-Oriented Steel Sheets and Its Prediction: Minor Loops, PWM, and the Limits of the Analytical Approach. IEEE Trans. Magn. 2017, 53, 2003804. [Google Scholar] [CrossRef]
  4. Du, R.; Robertson, P. Dynamic Jiles–Atherton Model for Determining the Magnetic Power Loss at High Frequency in Permanent Magnet Machines. IEEE Trans. Magn. 2015, 51, 7301210. [Google Scholar]
  5. Hwang, S.; Lim, M.; Hong, J. Hysteresis Torque Estimation Method Based on Iron-Loss Analysis for Permanent Magnet Synchronous Motor. IEEE Trans. Magn. 2016, 52, 8204904. [Google Scholar] [CrossRef]
  6. Wei, W.; Nysveen, A.; Magnusson, N.; Nilssen, R. Fourier-based effective permeability for transformer iron losses computation under saturation. IET Electr. Power Appl. 2020, 14, 2609–2615. [Google Scholar]
  7. Li, Y.; Liu, H.; Sun, H.; Wan, Z. High-Frequency Loss Modeling of Amorphous and Nanocrystalline Cores With Different Air Gaps. IEEE Trans. Magn. 2022, 58, 8400105. [Google Scholar] [CrossRef]
  8. Zhu, L.; Fan, B.; Han, X.; Tang, R. Effects of shrink fitting on iron losses of a permanent magnet synchronous motor with an amorphous core. IET Electr. Power Appl. 2022, 16, 996–1003. [Google Scholar] [CrossRef]
  9. Xu, X.; Zhu, T.; Zhao, Z.; Liu, W. Loss calculation and temperature prediction method for High-Speed amorphous alloy PMSM considering the coupling effect of Multi-Physical field factors. J. Magn. Magn. Mater. 2025, 614, 172689. [Google Scholar] [CrossRef]
  10. Zhou, Y.; Sun, A. Simplified ferrite core loss separation model for switched mode power converter. IET Power Electron. 2016, 9, 529–535. [Google Scholar]
  11. Kampen, D.; Owzareck, M.; Beyer, S.; Parspour, N.; Schmitt, S. Analytical core loss models for electrical steel in power electronic applications. In Proceedings of the 2012 13th International Conference on Optimization of Electrical and Electronic Equipment (OPTIM), Brasov, Romania, 24–26 May 2012; pp. 109–117. [Google Scholar]
  12. Pfützner, H.; Shilyashki, G.; Christodoulou, N. Standardisation concept for rapid testing of effects of cutting on losses of electric steel and amorphous ribbon. IET Electr. Power Appl. 2024, 18, 1164–1173. [Google Scholar] [CrossRef]
  13. Barg, S.; Ammous, K.; Mejbri, H.; Ammous, A. An Improved Empirical Formulation for Magnetic Core Losses Estimation Under Nonsinusoidal Induction. IEEE Trans. Power Electron. 2017, 32, 2146–2154. [Google Scholar] [CrossRef]
  14. Seyedshenava, S.; Ahmadpour, A. Finite element method for optimal transformer connection based on induction motor characteristics analysis. Ain Shams Eng. J. 2021, 12, 1943–1957. [Google Scholar] [CrossRef]
  15. Deng, X.; Mecrow, B.; Martin, R.; Gadoue, S. Effects of Winding Connection on Performance of a Six-Phase Switched Reluctance Machine. IEEE Trans. Energy Convers. 2018, 33, 166–178. [Google Scholar] [CrossRef]
  16. Moses, P.S.; Masoum, M.A.S. Three-Phase Asymmetric Transformer Aging Considering Voltage-Current Harmonic Interactions, Unbalanced Nonlinear Loading, Magnetic Couplings, and Hysteresis. IEEE Trans. Energy Convers. 2012, 27, 318–327. [Google Scholar] [CrossRef]
  17. Monteiro, T.C.; Martinz, F.O.; Matakas, L.; Komatsu, W. Transformer Operation at Deep Saturation: Model and Parameter Determination. IEEE Trans. Ind. Appl. 2012, 48, 1054–1063. [Google Scholar] [CrossRef]
  18. Li, D.; Wang, W.; Liu, T.; Li, L.; Lu, Z. Reducing the Core Losses of Fe-Si-B Amorphous Alloy Ribbons by High Cooling Rate Planar Flow Casting. Materials 2022, 15, 894. [Google Scholar] [CrossRef] [PubMed]
  19. Dawood, K.; Komurgoz, G.; Isik, F. Modeling of Distribution Transformer for Analysis of Core Losses of Different Core Materials Using FEM. In Proceedings of the in 2019 8th International Conference on Modeling Simulation and Applied Optimization (ICMSAO), Manama, Bahrain, 15–17 April 2019; pp. 1–5. [Google Scholar]
Figure 1. Magnetic property measuring device for 3D wound core. (a) Core to be tested. (b) Output and input voltage waveforms. (c) Test device.
Energies 18 02698 g001
Figure 2. Magnetization curves and loss curves at different frequencies. (a) Magnetization curves. (b) Loss curves.
Energies 18 02698 g002
Figure 3. Loss separation curves of the core model under sinusoidal excitation at different frequencies: (a) 50 Hz; (b) 100 Hz; (c) 150 Hz; (d) 200 Hz.
Energies 18 02698 g003
Figure 4. Amorphous alloy single-frame core 3D model.
Energies 18 02698 g004
Figure 5. Distribution of magnetic flux density under different working conditions: (a) 1.0 T; (b) 1.45 T.
Energies 18 02698 g005
Figure 6. Comparison curves of experimental test and finite element simulation.
Energies 18 02698 g006
Figure 7. Curves under harmonic conditions. (a) Sinusoidal. (b) Non-sinusoidal. (c) Curve for non-sinusoidal condition.
Energies 18 02698 g007
Figure 8. Schematic diagram of the cross-section of single-frame amorphous alloy core.
Energies 18 02698 g008
Figure 9. Schematic diagram of the area division of single-frame amorphous alloy core.
Energies 18 02698 g009
Figure 10. The curve of magnetic flux density variation. (a) Harmonic of magnetic flux density at point A. (b) Harmonic of magnetic flux density at point B. (c) Harmonic of magnetic flux density at point C. (d) Harmonic of magnetic flux density at point D. (e) Harmonic of magnetic flux density at point E. (f) Harmonic of magnetic flux density at point F.
Energies 18 02698 g010aEnergies 18 02698 g010b
Figure 11. Harmonic analysis of magnetic flux density at each characteristic point. (a) Point A. (b) Point B. (c) Point C. (d) Point D. (e) Point E. (f) Point F.
Energies 18 02698 g011
Figure 12. Separation of core losses under different magnetic flux densities.
Energies 18 02698 g012
Table 1. Main parameters of transformer with a capacity of 50 kVA.
ParameterValue
Rated capacity (kV)10 × (1 ± 5%)/0.4
Capacity (kVA)50
Connection modeDyn11
Core radius (mm)80.0
Number of turns in primary side winding30
Number of turns of secondary side winding15
Low-voltage winding radius (mm)208/173
High-voltage winding radius (mm)288/218
Short-circuit impedance (%)4.26
Table 2. Fitting parameters for core loss under sinusoidal excitation.
Sinusoidal CoreParameterSinusoidal CoreParameter
Kh0.045α2−6.114
β10.547α30.421
β26.221α42.054
β3−11.151α5−2.247
β46.124α64.698
α19.012
Disclaimer/Publisher’s Note: The statements, opinions and data contained in all publications are solely those of the individual author(s) and contributor(s) and not of MDPI and/or the editor(s). MDPI and/or the editor(s) disclaim responsibility for any injury to people or property resulting from any ideas, methods, instructions or products referred to in the content.

