Article

Two-Stage Optimization Strategy for Market-Oriented Lease of Shared Energy Storage in Wind Farm Clusters

1
Guangdong Power Grid Co., Ltd., Guangzhou 510600, China
2
School of Automation, Guangdong University of Technology, Guangzhou 510006, China
*
Author to whom correspondence should be addressed.
Energies 2025, 18(11), 2697; https://doi.org/10.3390/en18112697
Submission received: 11 April 2025 / Revised: 13 May 2025 / Accepted: 19 May 2025 / Published: 22 May 2025
(This article belongs to the Section A3: Wind, Wave and Tidal Energy)

Abstract

Diversified application scenarios and business models are effective ways to improve the utilization and economic benefits of energy storage systems. In response to the current problems of single application scenarios, high idle rates, and imperfect price formation mechanisms faced by energy storage on the power generation side, a robust two-stage optimization operation strategy for shared energy storage is proposed, taking into account leasing demand and multiple uncertainties, from the perspective of the sharing concept. A multi-scenario application framework for shared energy storage is established to provide leasing services for wind farm clusters, as well as auxiliary services for participating in the electric energy markets and frequency regulation markets, and the participation sequence is streamlined. Based on the operating and opportunity costs of shared energy storage, a pricing mechanism for leasing services is designed to explore the driving forces of wind farm clusters participating in leasing services from the perspective of cost assessment. Considering the uncertainty of wind power output and market electric prices, as well as the market operational characteristics, an optimized operation model for shared energy storage in the day-ahead and real-time stages is constructed. In the day-ahead stage, a Stackelberg game model is introduced to depict the energy sharing between wind farm clusters and shared energy storage, forming leasing prices, leasing capacities, and energy storage pre-scheduling plans at different time periods. In the real-time stage, the real-time prediction results of wind power output and electric prices are integrated with scheduling decisions, and an improved robust optimization model is used to dynamically regulate the pre-scheduling plan for leasing capacity and shared energy storage. Based on actual data from the electricity market in Guangdong Province, effectiveness verification is conducted, and the results showed that diversified application scenarios improve the utilization rate of shared energy storage in the power generation side by 52.87%, increasing economic benefits by CNY 188,700. The proposed optimized operation strategy has high engineering application value.

1. Introduction

Building a new power system with a high proportion of new energy is an effective way for the power industry to accelerate energy transformation and achieve the dual carbon goals. With the continuous increase in the penetration rate of new energy, while bringing green and low-carbon energy supply to the power system, the stability and safety of the system are facing severe challenges [1,2,3].
With transfer characteristics of the flexible energy, energy storage has broken through the various limitations of power transmission, effectively tracking the dispatch needs of the power grid, and playing a diverse role in smoothing new energy fluctuations and responding to the regulation needs of the power grid [4]. However, the high construction costs and relatively single application scenarios severely constrain the large-scale layout of energy storage systems [5]. As the largest integration scenario for new energy connecting to the grid, the power generation side requires high-capacity and high-frequency energy storage, which puts higher demands on the business model of energy storage. In this context, the business model of energy storage based on the concept of sharing has attracted the attention of scholars. For example, some experts have analyzed the feasibility of the sharing model from the perspectives of the concept, advantages, business model, and application scenarios of shared energy storage [6,7,8,9]. In 2023, the scale of China’s shared energy storage grid connection further expanded, with an increase of 12.41 GW/24.42 GWh, accounting for 54.91% of the newly put into operation new energy storage projects in 2023 (calculated by power scale). According to Wood Mackenzie data, the installed capacity of energy storage in the United States in 2023 was 8.74 GW/25.98 GWh, of which the installed capacity of new energy distribution and independent storage reached 7.91 GW/24 GWh, accounting for over 90% of the total installed capacity.
With the large-scale development of shared energy storage, the application scenarios of shared energy storage have gradually developed from single to diversified, which provides the basis for the multi-scenario operation of shared energy storage at the generation side, which takes into account the consumption of new energy and the provision of grid regulation services. However, the interaction between shared energy storage and wind power cluster is full of challenges. On the one hand, how to determine the lease price of shared energy storage and wind power cluster is related to whether the lease is reached. On the other hand, the high uncertainty of wind power cluster output will lead to dynamic changes in lease demand, and the optimal scheduling of shared energy storage in multiple application scenarios will also be full of uncertainty.
A sound pricing mechanism for leasing services of shared energy storage is conducive to promoting the consumption of new energy and mutual revenue between the two sides. Reference [10] uses bilateral negotiation to determine the leasing price of shared energy storage, and selects the leasing price based on the opportunity cost of shared energy storage. The formation process of the leasing price is relatively simple and it is difficult to reflect the supply and demand relationship between the leasing parties. References [11,12,13] consider the profit-seeking nature of leasing on both sides and introduce a Stackelberg game model to characterize the interactive game process of leasing on both sides, resulting in more reasonable leasing prices for shared energy storage. Reference [14] uses auction mechanism to characterize the transaction demands of both parties in leasing, and then determines the leasing price of shared energy storage. However, the above research focuses more on the process of price formation and neglects the motivation analysis of both sides of leasing, resulting in a lack of effective quantification of the leasing price range, and the accuracy of the leasing prices formed for shared energy storage capacity in various time periods needs to be discussed. In addition, the time-varying nature of leasing demand for new energy stations is difficult to reflect too much on leading prices, and the rationality of leading prices needs to be improved.
The effective quantification of uncertain factors is conducive to improving the effectiveness and feasibility of the operation strategy of shared energy storage. The robust optimization model is a commonly used method for dealing with the output uncertainty of wind and solar power at present. References [15,16,17] take into account the output uncertainty of the short time scale in the output modeling of wind power and photovoltaic power, and describe the output process through the box-type robust optimization model to achieve the optimal operation of shared energy storage under the worst scenarios. However, the box-type robust optimization model is mainly controlled through robust factors, resulting in the formed optimization results being overly conservative and lacking objectivity, and the economy is somewhat reduced. To reduce the conservatism degree of the robust optimization model, reference [18] introduces polyhedrons to construct the uncertainty set of wind power output of the robust optimization model, and dynamically adjusts the conservatism degree through the constraint of the uncertainty set. On this basis, reference [19] connects the wind and solar prediction results in the microgrid with the constraints of the uncertainty set, and represents the degree of conservatism through the interval probability uncertainty set, thereby effectively taking into account both the economy and robustness of the microgrid dispatching operation. The above-mentioned research explores the application of robust optimization models in the modeling of uncertainties of multiple types of elements, providing a reference for the quantification of uncertainties of different factors in diverse application scenarios of shared energy storage. However, the operational requirements for shared energy storage in different application scenarios vary. When depicting the uncertainties of elements such as wind and solar output, differentiated adjustments need to be made based on the actual application scenarios.
In summary, under the background of decentralized layout of shared energy storage at the generation side, in order to deal with the key issues such as the high uncertainty of wind power cluster output and the rationality of the formation of shared energy storage lease price, and further promote the optimization of the shared energy storage business model, this paper proposes a two-stage optimal operation strategy of shared energy storage considering the rental demand of wind farms and multiple uncertainties. The main contributions of this paper are as follows:
(1)
The participation sequence of shared energy storage in multiple application scenarios is clarified, and the driving force for wind farm clusters to participate in leasing services is analyzed from the perspective of assessment costs. Based on considering opportunity costs, a comprehensive pricing mechanism for leasing services of shared energy storage is formed, effectively guiding wind farm clusters to lease shared energy storage on demand.
(2)
Fully considering the autonomy and profitability of wind farm clusters and shared energy storage, a Stackelberg game model is introduced to characterize the energy sharing and interactive game between the two, and the time-varying leasing demand of wind farm clusters is transformed into a relaxation factor to optimize the leasing price mechanism of shared energy storage.
(3)
A two-stage optimized operational model for day-ahead and real-time markets of shared energy storage is constructed, taking into account the operational characteristics of electric energy market and wind power output forecasting. Considering the multiple uncertainties of wind power output and market electric prices, confidence methods and improved robust optimization models are proposed in stages to reconstruct the optimization operation model of shared energy storage, effectively improving the accuracy of optimization scheduling decisions for shared energy storage.

2. Operating Framework for Shared Energy Storage in Diverse Application Scenarios

2.1. Multi-Type Business Model of Energy Storage

At present, there are two mainstream forms of energy storage configuration for new energy on the power generation side. One is that new energy stations invest in and build their own energy storage facilities, which are only used internally by the new energy stations and are not associated with other new energy stations or users. They meet relevant policy requirements through self-built energy storage. The second type involves multiple new energy stations or third-party investors participating in the construction of power side energy storage, with diversified investment characteristics. New energy stations obtain shared energy storage capacity through leasing or bundling to meet relevant policy requirements.
The “self-built energy storage” mode is mainly controlled by individual new energy stations owned by energy storage owners. In the event of wind and solar power curtailment, energy storage is used for charging operations, and during peak electricity consumption periods, it is used for discharging operations. The amount of new energy abandoned is transferred to the peak period for sale to generate revenue, effectively promoting the consumption of new energy, reducing the rate of wind and solar power curtailment, and forming a typical “one charge one discharge” method for self-built energy storage on the power side. However, the “one charge, one discharge” method only allows energy storage to be charged and discharged during certain periods, while the rest of the time is idle, resulting in low utilization of self-built energy storage in new energy stations, slow cost recovery, and even losses, which damages the interests of new energy stations. The “shared energy storage” model of power side energy storage is the construction of relatively large-scale energy storage power stations through joint ventures of new energy stations or the introduction of third-party investment, with diversified investment characteristics. Compared to the 1-to-1 application scenario of self-built energy storage in new energy stations, “shared energy storage” transforms the application scenario into 1-to-N. “Shared energy storage” can serve multiple new energy stations, and new energy stations obtain partial capacity of “shared energy storage” through bilateral negotiations or leasing to meet relevant policy requirements. In the “shared energy storage” model, adopting a lease to build an approach for new energy stations is beneficial in reducing the cost of configuring energy storage for individual new energy stations and minimizing the waste of social resources.
Through the shared energy storage model, the utilization rate of energy storage facilities is improved, diversified value is provided, flexible adaptation to the electricity market environment is achieved, and the optimization of centralized and decentralized energy storage resources is also realized.

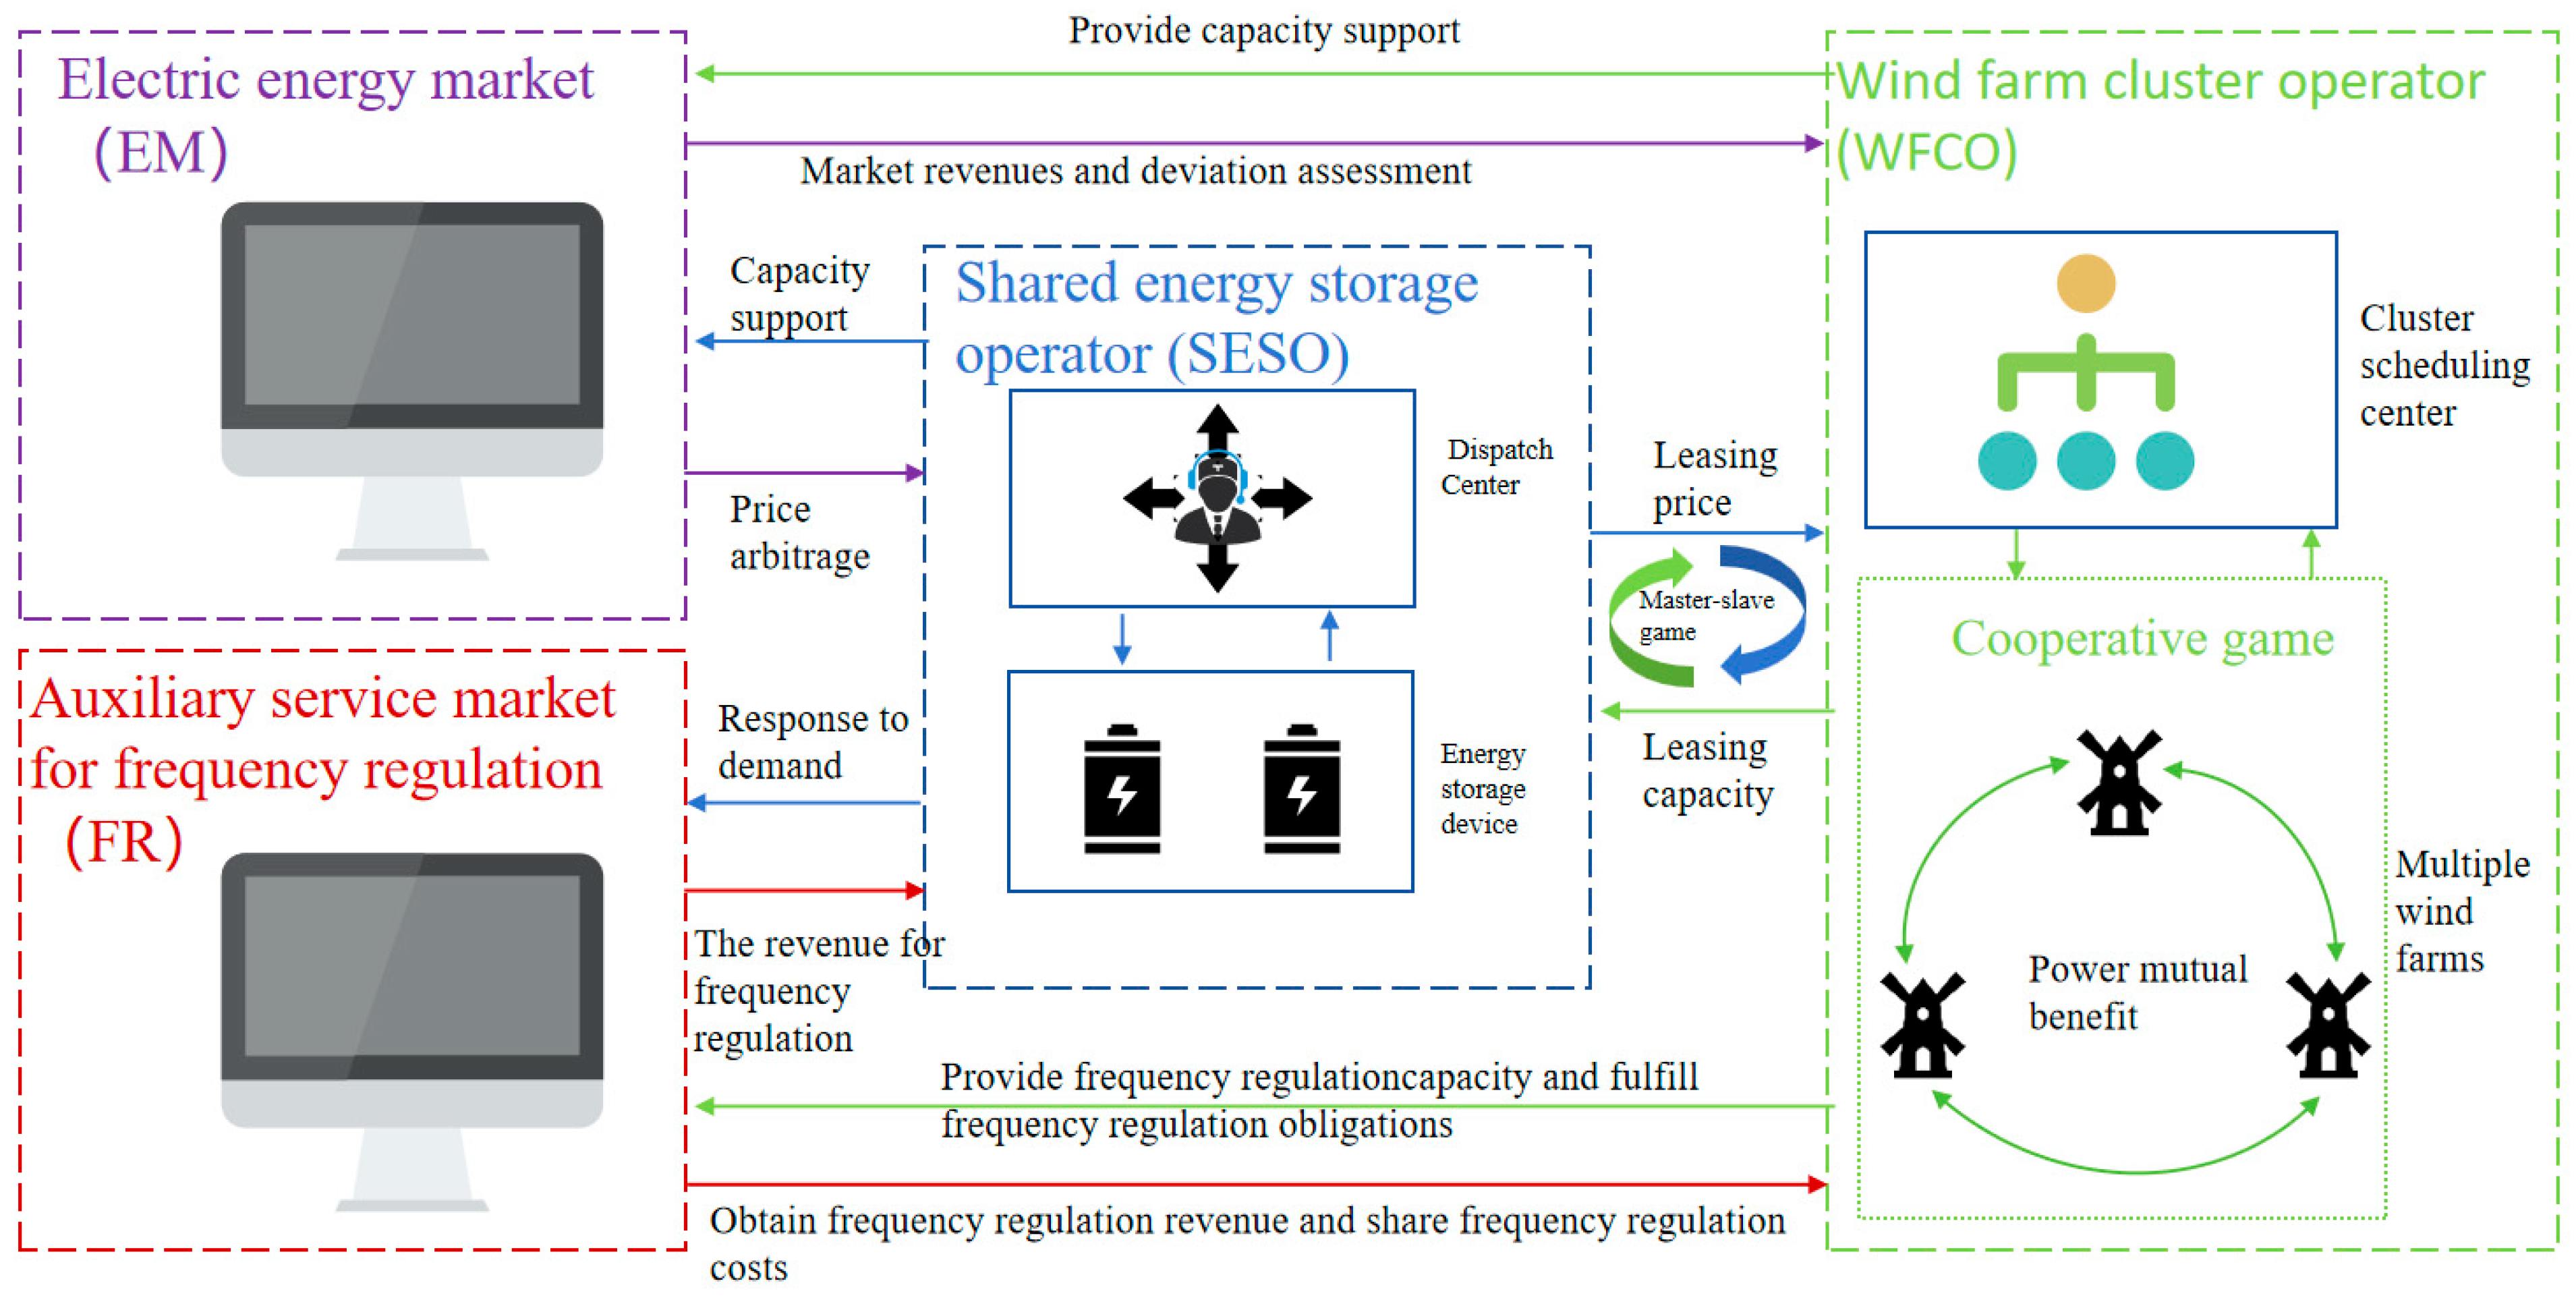
2.2. Shared Energy Storage Operation Architecture in Multiple Scenarios

To further enhance the utilization rate and economic revenue of shared energy storage in the power generation side, a diversified application scenario for cluster leasing of wind farms and participation in market transactions of electric energy and frequency regulation is constructed, as shown in Figure 1. In multiple application scenarios, the following entities are included: wind farm operator (EM), frequency regulation market (FRM), wind farm cluster operator (WFCO), and shared energy storage operator (SESO). The operational behaviors and interactive relationships of different entities will be introduced separately.
EM: The electric energy market is a place responsible for organizing various types of power sources to conduct electricity trading on multiple time scales. This paper only involves the spot market. Under this market mechanism, it is encouraged for new energy stations to participate in full electricity consumption and allows energy storage that meets market entry barriers to participate (mostly through price arbitrage models).
FRM: The frequency regulation market is a trading venue responsible for organizing various types of frequency regulation resources to participate in frequency regulation declaration, bidding, and clearing. Under this market mechanism, new energy and energy storage are encouraged to participate in the frequency regulation market, enriching the types of frequency regulation resources while enhancing the system’s frequency regulation capability.
WFCO: Wind farm cluster operators are responsible for organizing different wind farms with the same internet access point to form clusters through cooperative game theory, utilizing the complementary spatiotemporal characteristics of each wind farm to reduce the assessment costs faced during operation, with the goal of maximizing economic revenue during the operation cycle. At the same time, energy sharing is achieved through leasing service models and shared energy storage, converting assessment fees into capacity lease fees for shared energy storage to improve operational efficiency. In addition, selling abandoned wind power at low prices to shared energy storage operators can promote their own consumption while enhancing economic revenue.
SESO: Shared energy storage operators are responsible for optimizing and scheduling the operation of shared energy storage, with the goal of maximizing economic revenue. On the one hand, shared energy storage operators can provide balanced services to wind farm clusters through leasing models to obtain capacity lease revenue. On the other hand, shared energy storage operators can invest their capacity in the electric energy and frequency regulation market for trading, providing regulation services for the power grid while obtaining market-oriented revenue. The maximum absorption of abandoned wind power is also an effective way to reduce charging costs through shared energy storage.

3. SESO Two-Stage Optimization Operation Strategy Considering Leasing Demand and Multiple Uncertainties

According to the participation timing setting of SESO in multiple application scenarios, the optimization operation strategy of SESO should prioritize providing leasing services and invest the remaining capacity into the electric energy and frequency regulation market for economic dispatch. The pricing mechanism of leasing services is equally crucial for the development of SESO’s operational strategy, which will affect the capacity lease decisions of wind farm clusters.

3.1. Price Formation Mechanism for Leasing Services of Shared Energy Storage

Different pricing models reflect the differences in demand for shared energy storage among leasing users, and a single pricing model is difficult to effectively reflect the diverse value of SESO. Considering that the potential revenue of SESO include charging and discharging revenue and opportunity costs, the fairness and economy of WFCO and SESO needs to be effectively balanced in the capacity lease process.
This paper draws on the two-part pricing model of mileage price and capacity price in the FM auxiliary service market, and expresses the price formation mechanism of the SESO leasing model as mileage price and capacity price, which can be expressed as follows:
γ t = γ t c a p + γ t m a i l
where γ t is the total leasing price of SESO during time period t ; γ t c a p is the capacity lease price of SESO during time period t ; γ t m a i l is the mileage leasing price of SESO during time period t .

3.2. Two-Stage Operation Strategy for Shared Energy Storage Considering Multiple Uncertainties

Considering the operational characteristics of the electric energy market and the time scale of output forecasting in wind farms, the SESO optimization operation strategy is divided into two stages: day-ahead market and real-time market, in order to reduce the impact of wind output power forecasting deviation on actual scheduling decisions. Simultaneously incorporating the uncertainty of wind output power and market electric prices into the considerations of both day-ahead and real-time markets can further enhance the effectiveness of SESO’s operational strategy.

3.2.1. Economic Operation Strategy of Shared Energy Storage in Day-Ahead Stage Based on Stackelberg Game Theory

In the day-ahead stage, taking into account the profit seeking and autonomous nature of WFCO and SESO, a Stackelberg game model is introduced to characterize the energy sharing and complementary game between WFCO and SESO, forming leasing prices and leasing capacities at different time periods.
Considering the uncertainty of wind power output on the WFCO leasing capacity in the day-ahead market, which in turn affects SESO leasing prices and operational strategies in the day-ahead market, WFCO focuses more on the SESO capacity required to stabilize fluctuations in the predicted wind power output in the day-ahead market when calculating leasing capacity in each time period [20,21]. Ignoring the impact of prediction error and assessment costs in the interactive game process often leads to significant deviations between the leasing prices formed in the day-ahead market and real-time prices in each time period. To avoid the distortion of leading demand at different time periods and the significant regulation of WFCO leasing capacity in the real-time market caused by the prediction error of wind power output, this paper uses the normal distribution method to quantify the probability distribution of the deviation degree of wind power output prediction in the day-ahead stage, and achieves accurate calculation of WFCO leading demand by using the confidence method [22,23,24].
(1)
Leader: SESO
According to the day-ahead electric energy frequency modulation market electricity price forecast results and the WFCO leasing capacity expectation, the leasing strategy is formulated with the maximization of the economic benefits of the capacity leasing scenario within the day-ahead scheduling cycle of SESO as the objective function, and the leasing price of each period is formed and distributed to WFCO.
The objective function of SESO in the application scenario of leasing services can be expressed as follows:
max I S E S O d , 1 = I S E S O d , L C l o s s d , 1
I S E S O d , L = t = 1 24 γ t c a p L t d + λ t m a i l H t d
C l o s s d , 1 = t = 1 24 λ P t d , 1 , c + P t d , 1 , d
where I S E S O d , 1 represents the total operating revenue of SESO in the capacity lease scenario in the day-ahead stage; H t d is the total charging and discharging mileage of WFCO in the day-ahead stage during time period t ; λ is the loss cost of SESO unit charging and discharging power; P t d , 1 , c and P t d , 1 , d are the charging power and discharging power of SESO for the capacity lease scenario during time period t in the day-ahead stage.
The optimization model includes SESO charging and discharging power constraints:
0 P t d , 1 , c P c
0 P t d , 1 , d P d
S O C t = S O C t 1 + P t d , 1 , c η c P t d , 1 , d / η d E S E S Δ t
S O C min S O C t S O C max
S O C o = S O C e
where P c and P d are the rated charging power and rated discharging power of SESO, respectively. S O C t and S O C t 1 are the state of charge values of SESO during time periods t and t - 1 , respectively; η c and η d are the charging and discharging efficiencies of SESO, respectively; E S E S is the rated capacity of SESO; Δ t is the time interval, taken as 1 h in this paper; S O C min and S O C max are the maximum and minimum SOC values pre-set by SESO, respectively; S O C o and S O C e are the initial SOC value of SESO and the SOC value at the end of one operating cycle (24 h), respectively.
(2)
Followers WFCO
Utilizing the complementary characteristics of different wind farms within the cluster in time and space, SESO leasing demand is reduced using cooperative game theory. Based on the forecast results of wind power output in the day-ahead stage, the prediction errors of the normal distribution method and confidence method are used to quantitatively calculate the leasing demand in each time period. Using the initial leasing prices issued by SESO for each time period, a leasing strategy is formulated with the objective function of minimizing the assessment cost within the scheduling period in the day-ahead stage, forming the leasing capacity for each time period and reporting it to SESO.
The objective function of WFCO leasing SESO capacity may be expressed as follows:
min C W d = C W d , b + C W d , y + C S E S O d , L
C W d , b = t = 1 24 C b , t d = t = 1 24 α × R b , t d
C W d , y = t = 1 24 C y , t d = t = 1 24 β × R y , t d
C S E S O d , L = t = 1 24 γ t c a p L t d + γ t m a i l H t d
where C W d represents the total cost of WFCO in the day-ahead stage under capacity lease scenarios; C W d , b is the assessment cost incurred by WFCO during grid connection in the day-ahead stage due to fluctuations in power generation; C W d , y is the assessment cost formed by the prediction error of WFCO’s power generation in the day-ahead stage; α and β are the unit assessment costs incurred by WFCO during grid connection due to fluctuations in power generation and the unit assessment costs incurred due to forecast deviations in power generation, respectively; R b , t d and R y , t d are, respectively, the assessment capacity formed by the fluctuation of power generation during grid connection after WFCO leases SESO capacity in the day-ahead stage, and the assessment capacity formed by the prediction error of power generation.
The optimization problem includes the following constraints:
0 P w , t A P w , t L
0 P w , m , t d P w , m , t E
0 P w , t d , Q max P w , t d , F - P w , t L , 0
where P w , t L is the maximum grid-connected power of WFCO during time period t ; P w , t A is the online power of WFCO during time period t . P w , m , t d is the predicted power of WFCO’s m th wind farm during time period t in the day-ahead market, 1 m M ; P w , m , t E is the rated power of WFCO’s m th wind farm during time period t . P w , t d , Q is the maximum wind power curtailment of WFCO during time period t in the day-ahead market; P w , t d , F is the predicted power of WFCO in the day-ahead market during time period t .

3.2.2. Real-Time Rolling Optimization Strategy for Collaborative Operation of Shared Energy Storage Based on Improved Robust Optimization

In the real-time stage, dynamic regulations are made to WFCO leasing capacity, SESO leasing prices, and charging and discharging plans using real-time predicted values of wind power output, electric energy market prices and frequency regulation market prices.
Considering the impact of prediction errors in real-time output of wind power on SESO real-time scheduling decisions, and the subjective and conservative parameter selection of the robustness evaluation index for the box-type robust optimization model, it is easy to reduce the economic efficiency of SESO operation strategies. To this end, the key probability indicators (mean and variance) of the real-time output prediction results of wind power are used to construct the uncertainty set of the robust optimization model, and the prediction results are incorporated into the real-time scheduling decision-making process, in order to enhance objectivity and reduce the conservatism of traditional robust optimization models [19], and effectively ensure the robustness of the SESO operation strategy. Using improved robust optimization models to describe the degree of deviation in the real-time output prediction results of wind power is beneficial for enhancing the effectiveness of SESO optimization scheduling decisions.
① Rolling regulation of WFCO leasing capacity: By utilizing the real-time prediction results of wind power, the leasing prices of various time periods transmitted by the market, and the uncertainty set constraints in the improved robust optimization model, WFCO formulates leasing strategies with the objective function of maximizing economic revenue within the real-time scheduling period. It can dynamically adjust the leasing capacity of each time period and upload it to SESO.
② SESO Real-time Rolling Optimization Strategy: Utilizing leasing capacity adjusted by WFCO at different time periods, the predicted values of real-time electric prices in the electric energy and frequency regulation markets, and the constraints of the uncertainty set in the improved robust optimization model, SESO formulates a real-time rolling optimization strategy with the objective function of maximizing economic revenue within the real-time scheduling period.
In the improved robust optimization model, the correlation analysis between the predicted output of wind power and the real-time scheduling decision of SESO can effectively reduce the conservatism of the existing box-type robust optimization model and improve the operational economy and robustness of SESO. In addition, considering that the probability distribution of prediction errors between wind power output and market electric prices is close to a normal distribution, this paper adopts the normal distribution method to describe the error distribution between wind power output and market electric prices in the real-time stage.
The uncertainty set in the improved robust optimization model may be represented by the following equation:
p ¯ w s , F z α / 2 σ ¯ w s , F n < P w s , F < p ¯ w s , F + z α / 2 σ ¯ w s , F n p ¯ E M s z α / 2 σ ¯ E M s n < p E M s < p ¯ E M s + z α / 2 σ ¯ E M s n p ¯ F R M s z α / 2 σ ¯ F R M s n < p F R M s < p ¯ F R M s + z α / 2 σ ¯ F R M s n
where P w s , F , p E M s , and p F R M s are the predicted values of wind power output, clearing prices in the electric energy market, and clearing prices in the frequency regulation market during real-time stage, respectively; p ¯ w s , F , p ¯ E M s , and p ¯ F R M s are the average predicted results of wind power output, clearing prices in the electric energy market, and clearing prices in the frequency regulation market during real-time stage, respectively; σ w s , F 2 , σ E M s 2 , and CC σ F R M s 2 are the variances of the predicted results for wind power output, clearing prices in the electric energy market, and clearing prices in the frequency regulation market during the real-time stage, respectively; z α / 2 is the upper and lower quantile point of the standard normal distribution, α is the confidence level, and the conservative degree of the robust optimization model may be controlled by adjusting the values 0 < α < 1 ; n is the sample size.

4. Two-Stage Optimization Model for Market-Oriented Leasing of Shared Energy Storage

4.1. SESO Optimization Scheduling Model in Day-Ahead Stage

4.1.1. A Pricing Model for SESO Leasing Services Based on Stackelberg Game Theory

In the day-ahead stage, a Stackelberg game optimization model may be used to map the pricing process of leasing services of shared energy storage. The Stackelberg game optimization model can be expressed as follows:
G = N ; S S E S O ; S W F C O ; I S E S O d , 1 ; C W d
The Stackelberg game optimization model consists of three main elements:
(1)
Participants: The participants in the Stackelberg game are WFCO and SESO, with a set of N = SESO WFCO .
(2)
Strategy: The strategy of SESO is used to determine the leasing price γ t = γ t c a p , γ t m a i l and the interactive power L t d = P t d , 1 , c , P t d , 1 , d of WFCO. The policy set of SESO may be represented by the following equation:
S S E S O = γ t c a p , γ t m a i l , P t d , 1 , c , P t d , 1 , d , t
The strategy of WFCO is used to determine the leasing capacity AA, the assessment cost BB caused by the prediction error of power generation in the day-ahead stage, and the assessment cost CC caused by the prediction error in the day-ahead stage. The strategy set of the subject WFCO can be represented by the following equation:
S W F C O = R t , C W d , b , C W d , y , t
(3)
Revenue: The revenues of SESO and WFCO are calculated using Equations (2) and (10), respectively.

4.1.2. SESO Optimization Scheduling Model Considering Leasing Demand in Day-Ahead Stage

In the day-ahead stage, when SESO uses a Stackelberg game to determine leasing capacity, considering SOC capacity limitations, the remaining capacity is invested in the electric energy market and frequency regulation market for trading. The SESO market optimization scheduling model considering leasing demand aims to maximize the economic revenue of SESO in multiple application scenarios, with the decision variable being the charging and discharging power at each time period.
The objective function includes
max I S E S O d = I S E S O d , 1 + I S E S O d , 2
I S E S O d , 2 = I S E S O d , E M + I S E S O d , F R M C l o s s d , 2 C w Q
I S E S O d , E M = t = 1 24 p E M , t d × P t d , E M
I S E S O d , F R M = t = 1 24 p F R M , t d × P t d , F R M
C l o s s d , 2 = t = 1 24 λ P t d , 2 , c + P t d , 2 , d
C w Q = t = 1 24 p w , t Q , d × P w , t Q , d
where I S E S O d represents the total operating revenue of SESO in multiple application scenarios during the day-ahead stage; I S E S O d , 2 represents the total operating revenue of SESO in the market trading application scenario during the day-ahead stage; I S E S O d , E M represents the revenue obtained by SESO from the electric energy market in the day-ahead stage; I S E S O d , F R M is the revenue obtained by SESO from the frequency regulation market in the day-ahead stage; C l o s s d , 2 represents the operational cost loss of SESO in the market trading application scenario during the day-ahead stage; C w Q is the cost of wind power curtailment charging for SESO in the day-ahead stage; p E M , t d and p F R M , t d are the predicted clearing prices for the electric energy market and frequency regulation market during time period t , respectively; P t d , E M and P t d , F R M are the pre-scheduled power of SESO in the electric energy market and frequency regulation market during time period t , respectively; P t d , 2 , c and P t d , 2 , d are the charging power and discharging power of SESO in the market trading scenario during time period CT in the day-ahead stage; p w , t Q , d is the wind power charging price for SESO during time period t in the day-ahead stage; P w , t Q , d is the abandoned wind power charging for SESO during time period t in the day-ahead stage.
The constraints include
P t d , 1 , c + P t d , 2 , c + P w , t Q , d P t d , 1 , d P t d , 2 , d = P t d , c P t d , d
H t d = P t d , 1 , c + P t d , 1 , d P t d , c P t d , d = 0 P t d , 1 , c P t d , 1 , d , P t d , 2 , d = 0 P t d , 2 , c P t d , 1 , d , P t d , 2 , d = 0 P t Q , d P t d , 1 , d , P t d , 2 , d = 0
where P t d , c and P t d , d are the total charging power and discharging power of SESO during time period t , respectively is an operator that means at least one of the left and right parameters will be 0.

4.2. SESO Real-Time Rolling Optimization Scheduling Model

In the real-time stage, SESO utilizes the corrected values of WFCO’s leasing capacity at various time periods, real-time predicted values of market electric prices, abandoned wind power, etc., to construct a SESO real-time rolling optimization model, with the goal of maximizing economic revenue.
The total operating revenue of SESO in the real-time stage is the algebraic sum of SESO’s revenue in the leasing service application scenario in the real-time stage, SESO’s revenue in the electric energy market in the day-ahead stage, SESO’s revenue in the frequency regulation market in the day-ahead stage, SESO’s revenue in the electric energy market in the day-ahead stage, minus SESO’s operating cost loss in the real-time stage, and SESO’s wind power charging cost in the real-time stage. The goal of SESO real-time rolling optimization considering market electric price uncertainty is to minimize the total operating revenue of SESO in the real-time stage:
max I S E S O s = I S E S O s , L + I S E S O s , E M + I S E S O s , F R M C l o s s s C w Q , s
where I S E S O s is the total operating revenue of SESO in the real-time stage; I S E S O s , L represents SESO’s revenue in the leasing service application scenario during the real-time stage; I S E S O s , E M represents SESO’s revenue in the day-ahead stage of the electric energy market; I S E S O s , F R M represents SESO’s revenue in the frequency regulation market during the day-ahead period; C l o s s s represents the operational cost loss of SESO in the real-time stage; C w Q , s represents the cost of wind power curtailment charging for SESO in the real-time stage.
The various elements of the total operating revenue of SESO in the real-time stage may be calculated using the calculation method in the day-ahead stage, and only the predicted results of wind power output, clearing prices in the electric energy market, and clearing prices in the frequency regulation market in the day-ahead stage need to be rolled forward and corrected to the predicted results in the real-time stage.
Similarly, the constraints of SESO in the real-time stage may be adjusted using Equations (5) to (9) and (27) to (28), simply by rolling forward the predicted results of wind power output, clearing prices in the electric energy market, and clearing prices in the frequency regulation market in the day-ahead stage to the predicted results in the real-time stage.
The objective function of the first stage is to maximize the leasing income of SESO in the real-time stage considering the loss of SESO operating costs and the cost of abandoned wind charging. The objective function of the second stage is to maximize the SESO market income in the worst-case scenario during the real-time stage, including electric energy market income and frequency regulation market income. Considering the uncertainty of the predicted output of wind power in the real-time stage [25,26], as well as the predicted clearing prices of electric energy market and frequency regulation market, an improved robust optimization model may be used to update Equation (30):
max I S E S O s = max I S E S O s , L C l o s s s C w Q , s + max κ min ϕ Θ I S E S O s , E M + I S E S O s , F R M
where κ is the worst-case scenario for market electric prices; ϕ is the charging and discharging power of SESO in the worst-case scenario.

4.3. Solving Method

In the day-ahead stage, due to the large number of nonlinear constraints in the pricing model of SESO leasing services based on Stackelberg games, and the interactive game between master–slave sides, this paper introduces the cuckoo optimization algorithm to solve the Stackelberg game optimization model. With the main SESO leasing in the previous stage as the core, the fitness function of the cuckoo optimization algorithm is constructed, and the CPLEX commercial solver is embedded into the cuckoo optimization algorithm to obtain the leasing price and capacity in each time period of the day-ahead stage. The SESO optimization scheduling model considering leasing demand is generally a mixed degradation integer linear programming problem, which may be directly solved using the CPLEX commercial solver. Due to the widespread application of the current cuckoo optimization algorithm in solving Stackelberg game models, the specific solving process will not be repeated.
In the real-time stage, due to the fact that both WFCO rolling optimization model and SESO rolling optimization model are two-stage optimization problems, heuristic optimization algorithms such as the cuckoo optimization algorithm are difficult to effectively solve. The column and constraint algorithm (C&CG) is a commonly used and effective solution method for solving two-stage optimization problems. The basic solving principle is to split the original model into main and sub-problems and perform interactive iterative solving. The C&CG method has the advantages of fast solving speed and strong convergence. This paper uses column and constraint algorithms and CPLEX solvers to jointly solve a two-stage optimization model. Considering the mature application of existing column and constraint algorithms, the specific solving process will not be repeated.

5. Validating Cases

5.1. Data Sources and Parameter Settings

In the simulation example, three wind farms and one shared energy storage are set up. Wind farms and shared energy storage engage in interactive games and energy sharing using cooperative gaming. The electric price data for the electric energy market and frequency regulation market come from historical data of a regional node in Guangdong Province. The output of the wind farm is predicted based on historical output data and relevant influencing factors. The output forecast power curves of each wind farm in day-ahead and real-time stages, the output forecast power curves of wind farm clusters, the forecast curves of clearing prices in the electric energy market and real-time clearing prices in the frequency regulation market, as well as the maximum capacity power curves of wind farm clusters at grid-connected nodes, are shown in Figure A1, Figure A2, Figure A3, Figure A4 and Figure A5 in Appendix A.
(1)
Parameter settings for wind farm clusters
The installed capacities of wind farms 1–3 are 80 MW, 85 MW, and 100 MW, respectively. The unit assessment cost caused by grid connected power fluctuations is 0.3654 CNY/kWh, and the unit assessment cost caused by prediction power deviation is 0.1250 CNY/kWh [19].
(2)
Data setting for market electric prices
The charging price of shared energy storage during the wind farm cluster abandonment period is 50% of the clearing price in the spot market during that period, and the charging price of shared energy storage in idle state is 80% of the clearing price in the spot market during that period. In the frequency regulation market, market transaction settlement is based on a two-part electric price system. The frequency regulation mileage electric price is determined by market clearing, and the capacity electric price for frequency regulation is set at 3.56 CNY/MW according to the current rules of the frequency regulation market in Guangdong Province.
(3)
Parameter settings for shared energy storage
Considering that the proportion of energy storage scale in the electric energy market and frequency regulation market is not sufficient to change the existing market clearing price, this paper uses shared energy storage as a price taker to participate in grid power supply and auxiliary services. The parameter settings for shared energy storage participating in multiple application scenarios are shown in Appendix A, Table A1.

5.2. Strategic Analysis of the Economic Optimization Operation of Shared Energy Storage in the Day-Ahead Stage

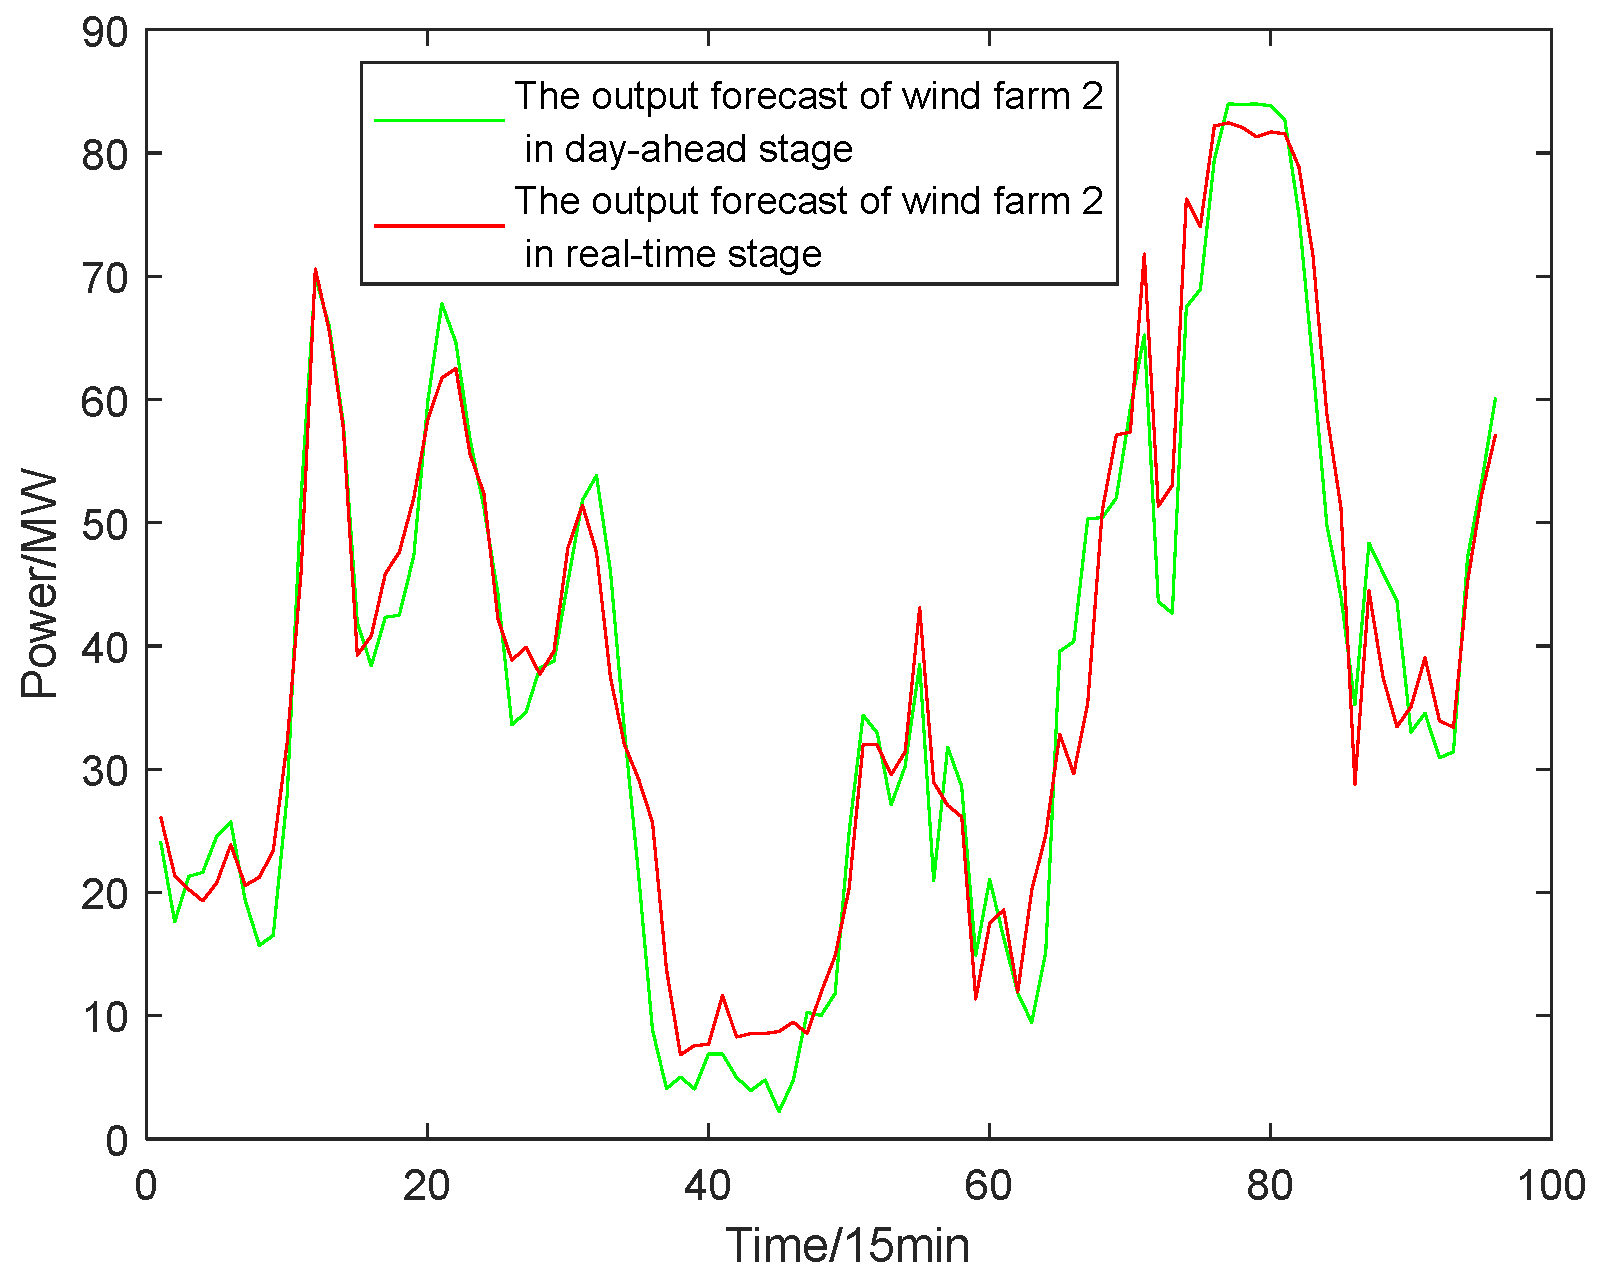
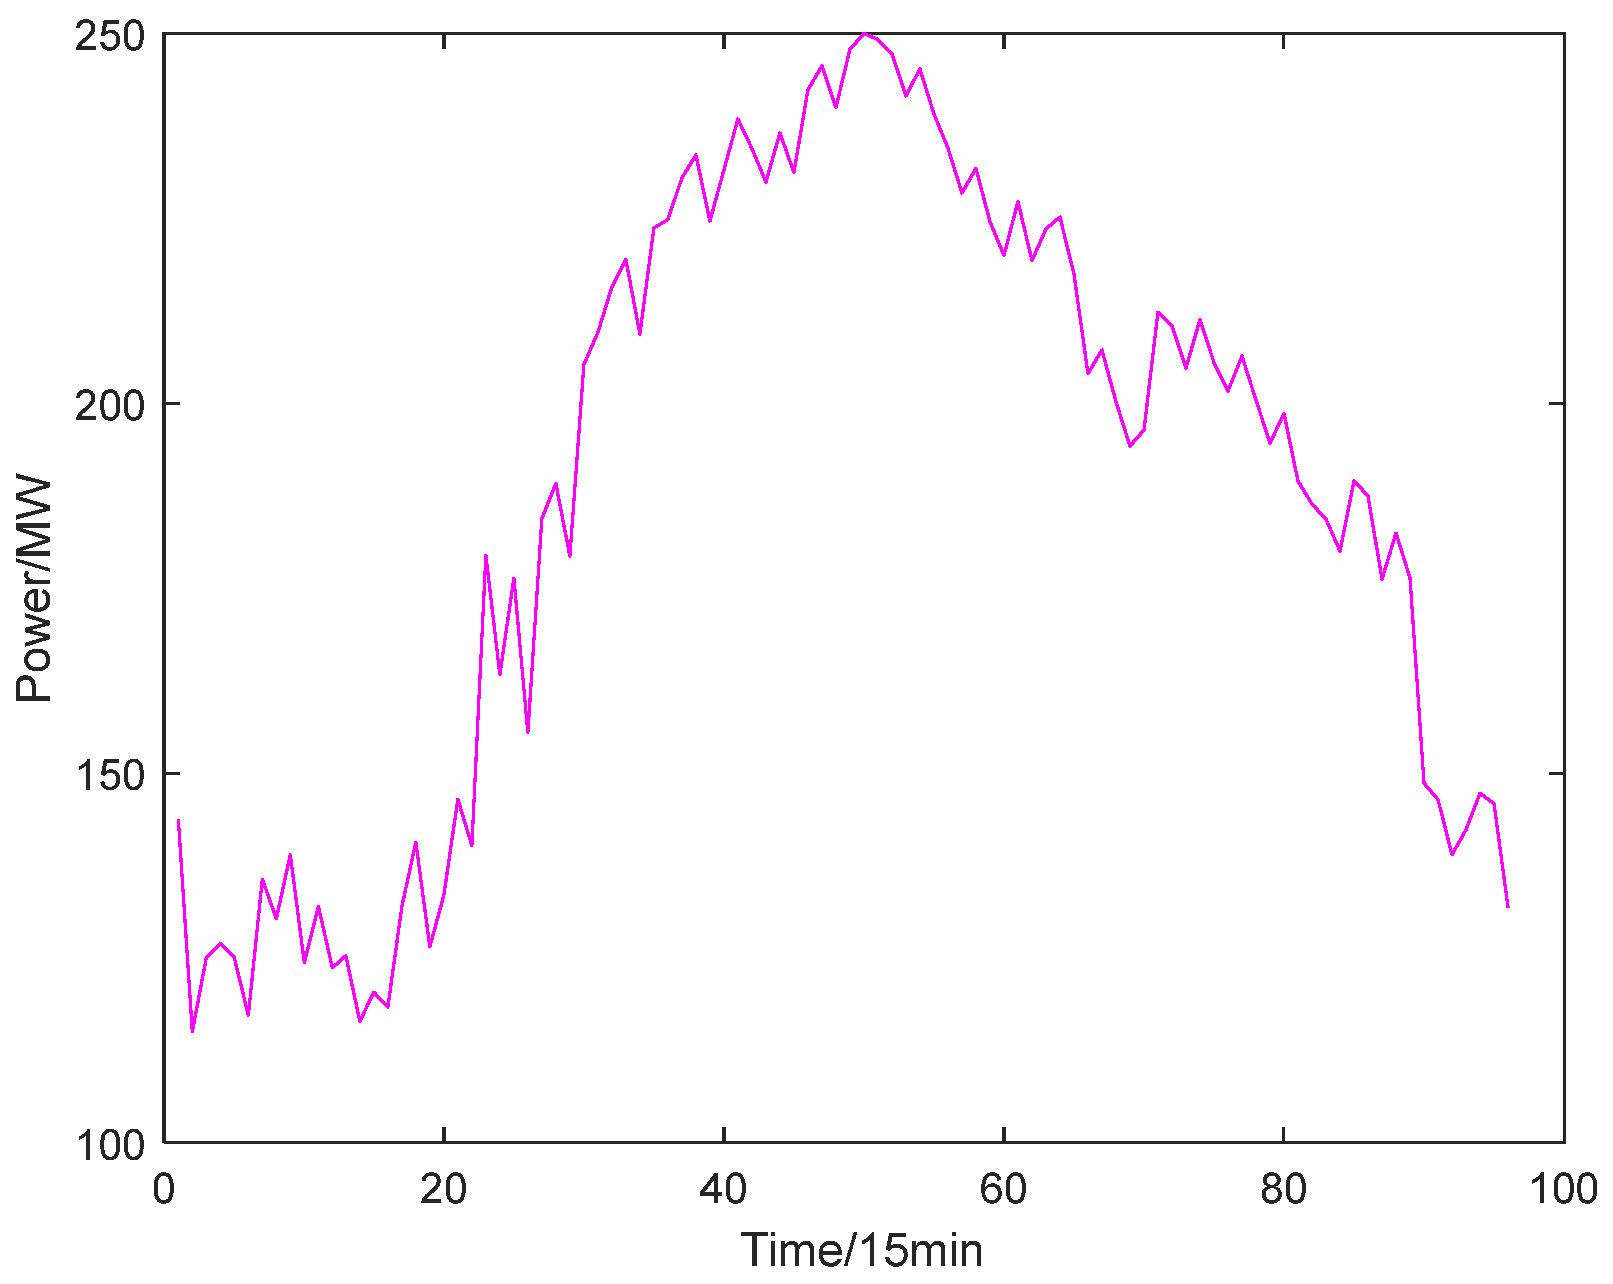
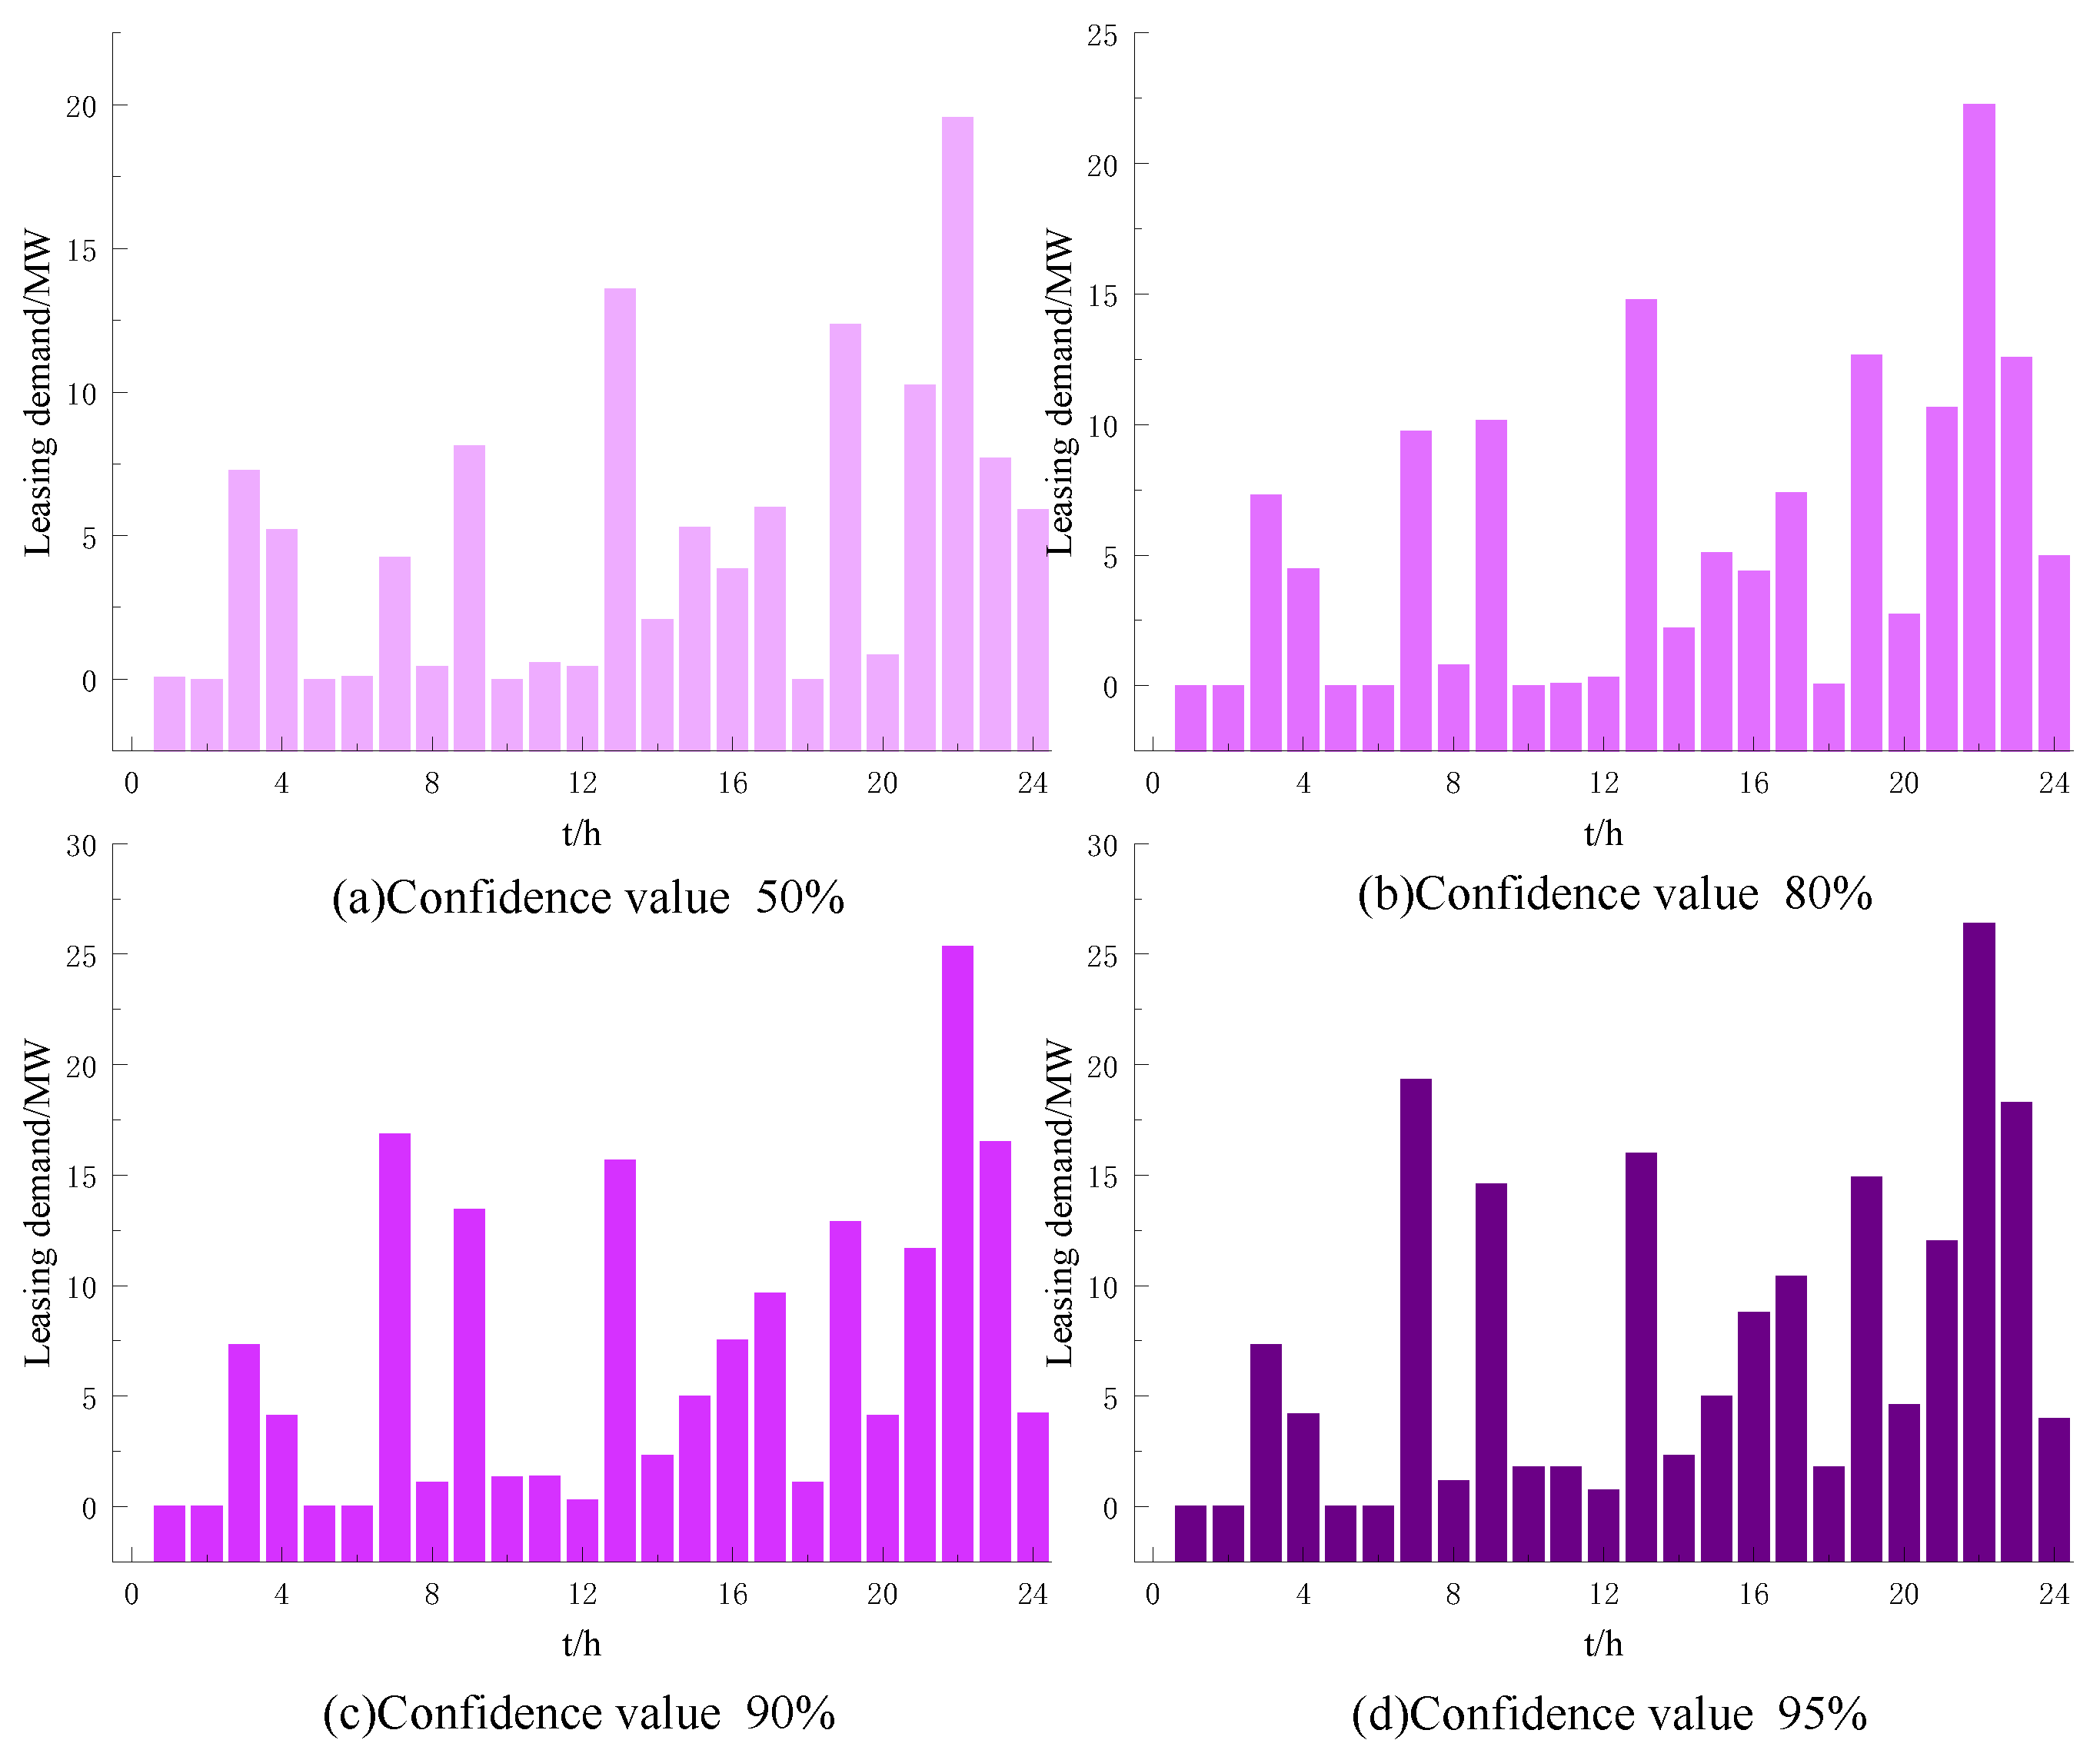
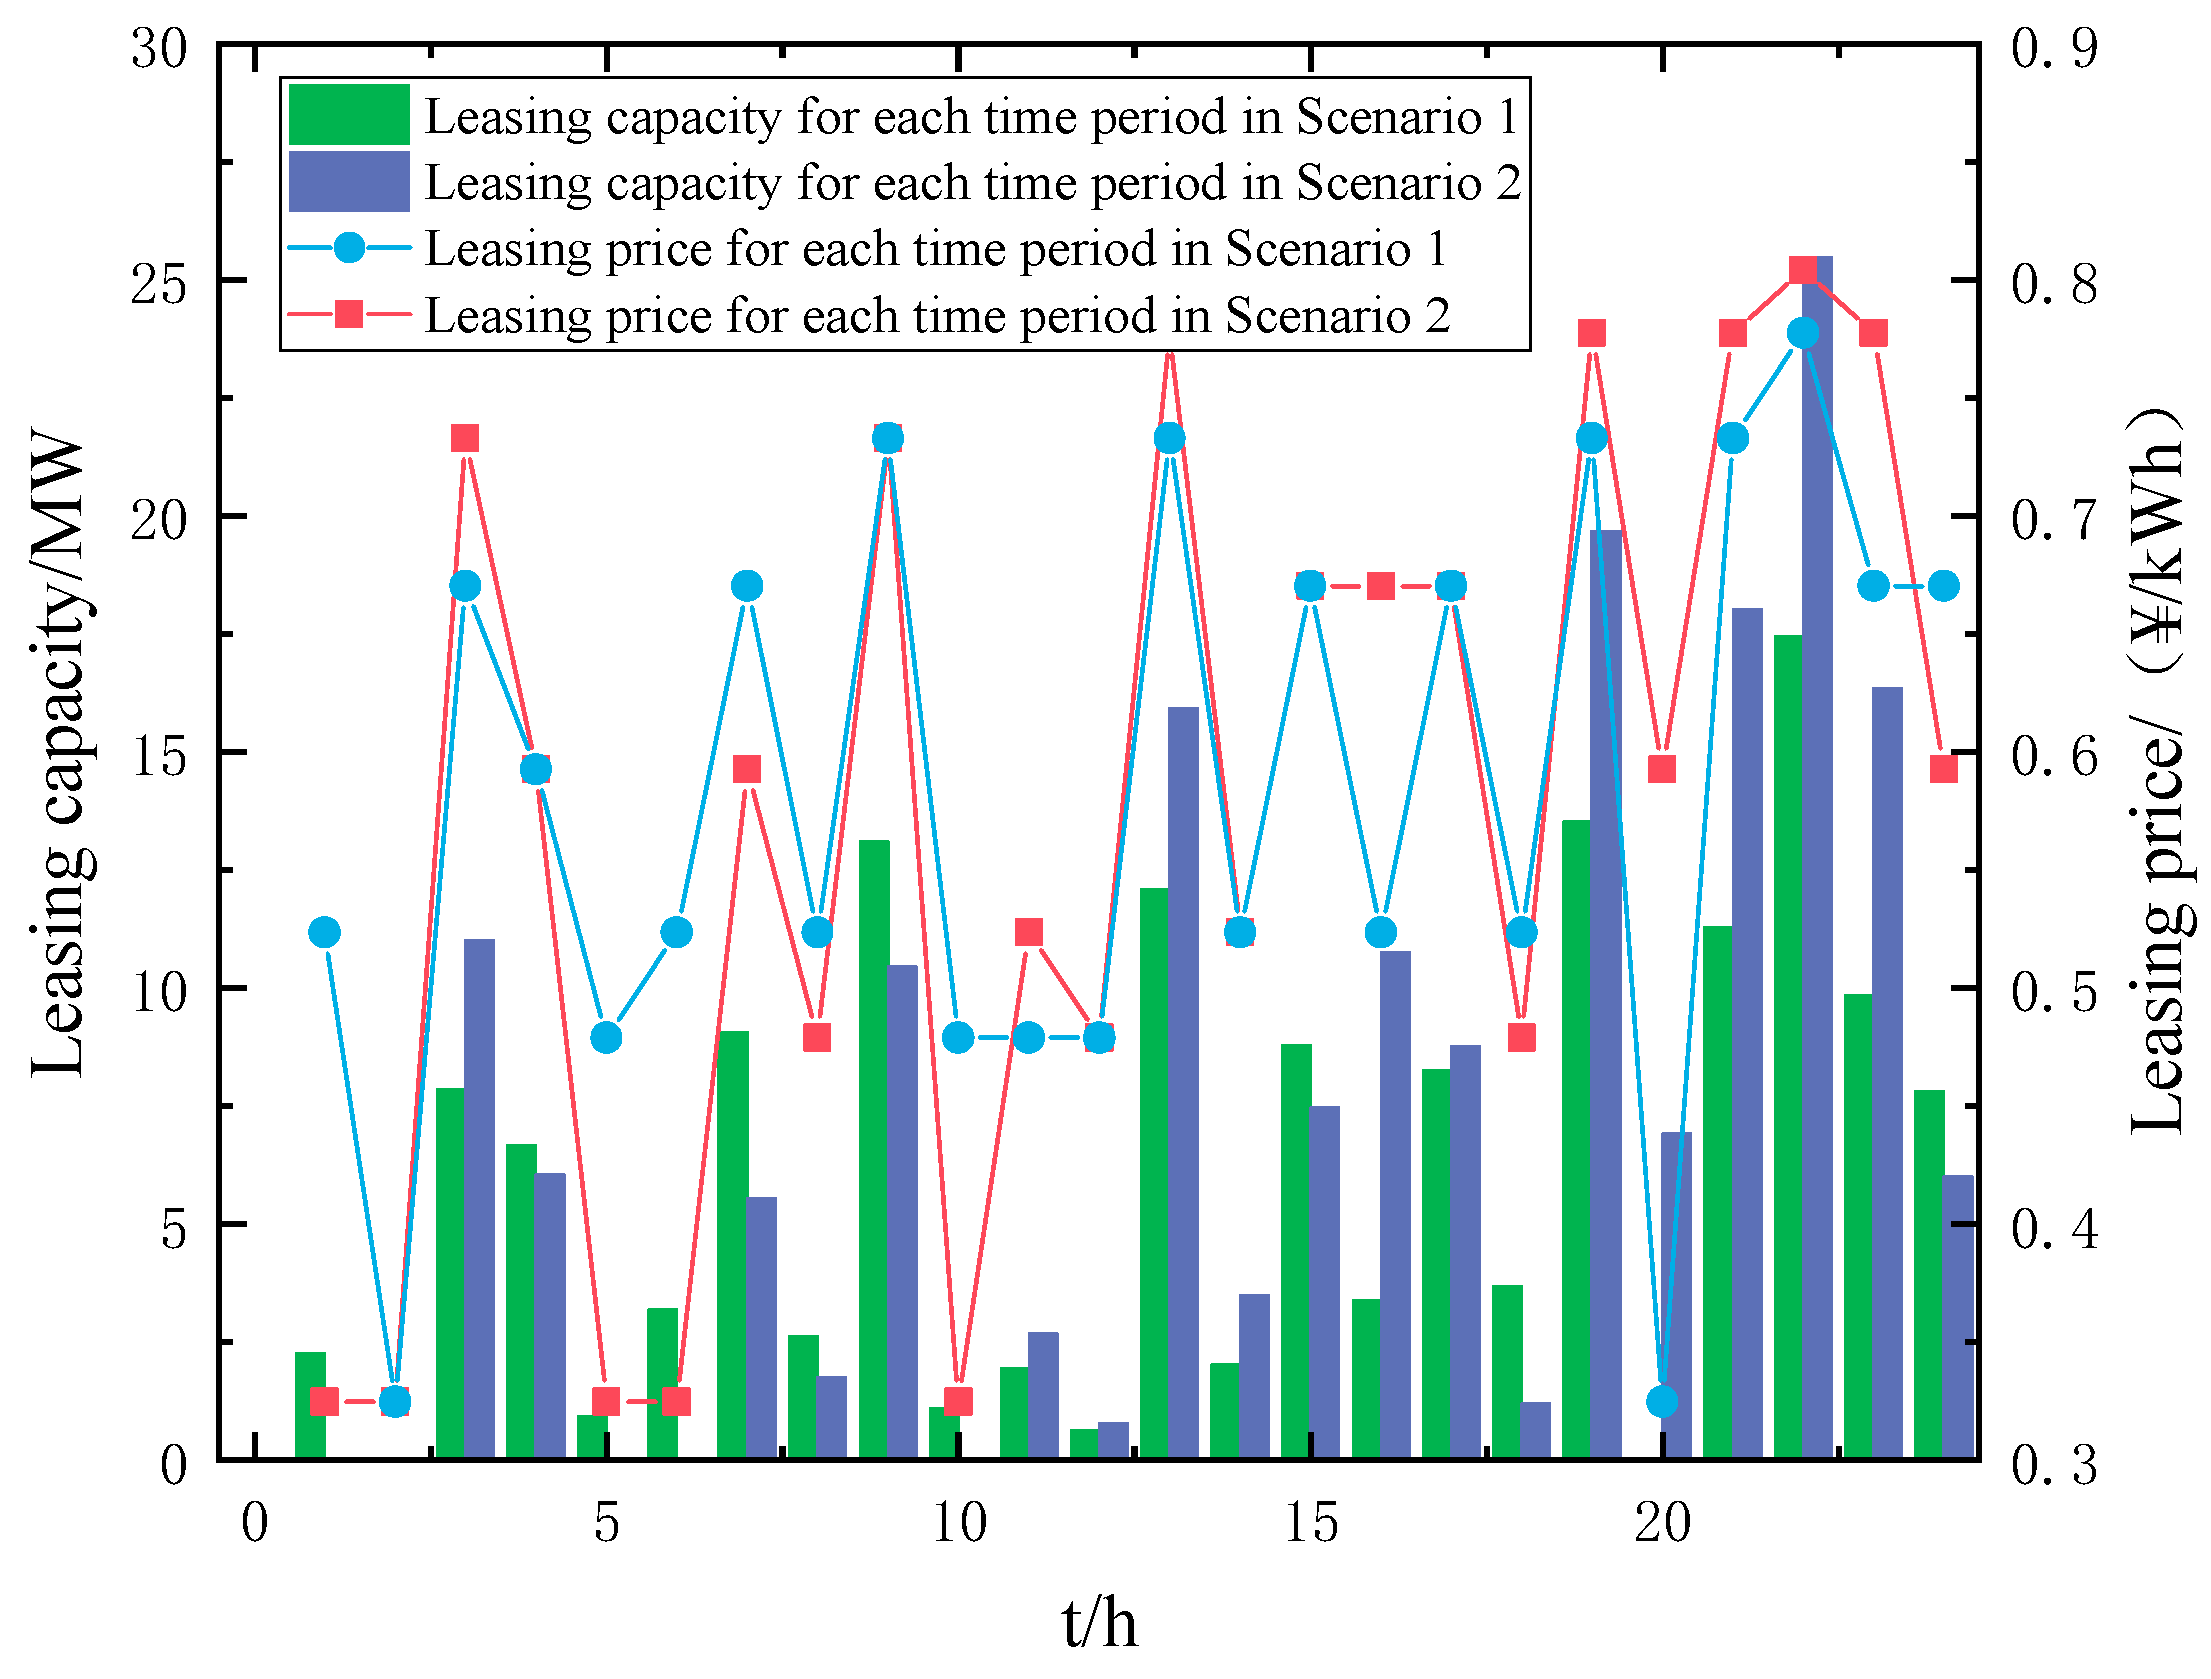
5.2.1. Leasing Demand Analysis Considering Uncertainty in Wind Power Output

Considering the impact of the probability distribution of prediction errors in wind power output is beneficial for improving the simulated accuracy of SESO leasing capacity and leasing price in the day-ahead stage. By using normal distribution and confidence theory, the deviation degree between the predicted values of wind power output in the day-ahead stage and real-time stage may be determined. The settings of relevant key parameters are shown in Table A2 of Appendix A.
The difference in confidence values will lead to different leasing demands for WFCO in different time periods. The confidence values are set to 50%, 80%, 90%, and 95%, respectively, and conduct sensitivity analysis as shown in Figure 2.
From Figure 2, it may be observed that as the confidence value increases, the leasing demand for shared energy storage by WFCO in each time period also increases. The assessment cost caused by prediction error has a particularly significant impact on the increase in leasing demand. In addition, as the confidence level approaches 95%, the increase in leasing demand for shared energy storage in each time period tends to slow down. The average leasing demand for each time period at a confidence level of 95% only increased by 0.5620 MW compared to 90%. The analysis shows that a confidence value of 95% in this paper can basically cover the majority of the difference in the prediction error of wind power output in the day-ahead stage, effectively characterizing the impact of prediction error on WFCO leasing demand. In fact, when the confidence value is set to 100%, it may include the difference between the predicted output of wind power in the day-ahead stage and the predicted result in the real-time stage in historical data. However, the confidence values in the range of 95% to 100% contain very small probability events and do not have typicality or generality. If the confidence value is increased across the entire range, it may lead to potential distortion risks in leasing capacity, as well as more regulations in leasing capacity during the real-time stage.
To analyze the impact of the uncertainty of wind power output on SESO’s leasing prices in different time periods during the day-ahead stage, two scenarios were set up for comparative analysis. Scenario 1: Using the method described in reference [19], the leasing results formed by the assessment cost without considering the prediction error caused by wind power uncertainty in the day-ahead stage. Scenario 2: The method proposed in this paper uses the probability distribution of prediction errors to determine the leasing results formed by the prediction error of wind power output, with a confidence level of 95%. The leasing capacity and leading prices of SESO in different scenarios are shown in Figure 3, and the leasing prices of capacity and mileage in each time period are shown in Appendix A, Table A3.
From Figure 3, it may be observed that in most time periods, the leasing capacity of scenario 1 is lower than that of scenario 2, especially in time period 22. Compared with scenario 1, the leasing capacity of scenario 2 has increased by 8.0283 MW, indicating that the leasing capacity of WFCO has improved to a certain extent after considering the impact of prediction error in the day-ahead stage. For the leasing prices in different time periods, scenario 2 has a much higher degree of fluctuation than scenario 1, with more drastic changes and a more distinct leasing price signal. The highest leasing price of scenario 2 increased by 0.0266 CNY/kWh compared to scenario 1, indicating that the increased demand for leasing due to prediction error assessment will exacerbate the frequency of leasing price fluctuations in different time periods.
To further validate the effectiveness of considering the uncertainty of wind power output in the day-ahead stage for optimizing leasing results, the SESO leasing demand value based on the predicted wind power output in the real-time stage was used as the target value for dynamic regulation of WFCO leasing capacity in the day-ahead stage. The differences in capacity regulation between the two scenarios in the real-time stage were compared and analyzed, and the analysis results are shown in Figure 4.
From Figure 4, it may be observed that in scenario 2, compared to scenario 1, the demand for SESO capacity lease during most time periods is closer to the demand for WFCO capacity lease during the real-time stage. In scenario 1, there is not much difference in the demand for SESO capacity lease between the periods of low leasing demand and the real-time stage, while the difference is significant in the periods of high capacity lease demand, much lower than that in scenario 2. In addition, the regulation value of leasing demand in scenario 2 is significantly lower than that in scenario 1 during most of the time periods, such as in time periods 1–6, where the regulation value of leasing demand in scenario 2 is close to zero. The regulation of leasing demand in scenario 2 is relatively stable in each time period, with only significant changes in time periods 7 and 9, and smaller fluctuations in other time periods compared to scenario 1. Analysis shows that in the day-ahead stage, the calculation of demand values for SESO capacity lease considering WFCO prediction error assessment is effective, which is conducive to improving the consistency of SESO leasing demand between the day-ahead stage and the real-time stage, effectively reducing the regulation value of WFCO’s leasing demand in the real-time stage, and promoting the formation of more reasonable and accurate leasing prices in each time period.

5.2.2. SESO Revenue Analysis in Different Application Scenarios

Diversified application scenarios are beneficial for improving the utilization rate and economy of shared energy storage. The SESO utilization rate may be calculated using the following equation:
ς = 1 24 t = 1 24 R t L + R t E M + R t F R M + R t O R t R
where ς is the utilization rate of SESO; R t E M is the input capacity of SESO in the electric energy market during time period t ; R t F R M represents SESO’s investment capacity in the frequency regulation market during time period t ; R t O is the charging and discharging capacity of SESO in non-application scenarios during time period t ; R t R is the total operational capacity of SESO during time period t , which can be calculated based on the upper and lower limits of SOC.
To verify the rationality and economy of the multi-scenario application of shared energy storage providing leasing services for wind farm clusters and participating in the electric energy market and frequency regulation markets, this paper sets up three schemes for comparative analysis. Scheme 1: SESO only participates in the application scenario of providing leasing services for wind farm clusters. Scheme 2: SESO will invest the remaining capacity in the electric energy market for price arbitrage based on its participation in providing leasing services for wind farm clusters. Scheme 3: This is the application scenario proposed in this article. The pre-scheduling results of SESO with different schemes in the day-ahead stage are shown in Figure 5.
From Figure 5, it may be observed that with the diversification of application scenarios, the charging and discharging power of shared energy storage and SOC change frequency gradually increase. For Scheme 1, only the WFCO capacity lease scenario was considered, and the charging and discharging power of shared energy storage was centered around the leasing demand of WFCO in various time periods. The SOC value curve did not fluctuate significantly, and it fluctuated repeatedly below 0.5 during the 1–21 time periods. For Scheme 2, based on Scheme 1, the remaining capacity will be invested in the electric energy market, and the charging and discharging power of shared energy storage will peak during the highest electric price period in the electric energy market. For example, in periods 10 and 21, the discharging power of shared energy storage in the electric energy market is close to 30 MW; In the non-electric energy market, during the peak electric price period, the charging and discharging action of shared energy storage are more commonly used for WFCO capacity lease scenarios, thereby improving the overall utilization rate and economic revenue of SESO. For Scheme 2, the SOC values exhibit peak valley characteristics similar to those in the electric energy market, and the frequency of occurrence of SOC upper and lower limits is much higher than that in Scheme 1. For Scheme 3, introducing the frequency regulation market into the application scenario of shared energy storage, its charging and discharging action are more frequent compared to Scheme 2 and Scheme 1, and the charging and discharging power in each time period is closer to the upper and lower limits of rechargeable and dischargeable power, significantly improving the utilization rate of shared energy storage in each time period. Moreover, the number and magnitude of changes in the SOC value curve between the upper and lower limits of SOC have significantly increased, which indirectly confirms that the application scenarios of the frequency regulation market are conducive to significantly improving the operating power of shared energy storage in various time periods. Analysis shows that the frequency regulation market is an important scenario for reducing idle rates through shared energy storage. Rich application scenarios can effectively leverage the diverse value of shared energy storage and improve operational revenue.
The revenue and utilization rates of SESO in various application scenarios under different schemes are shown in Table 1.
From Table 1, it may be observed that there are significant differences in the utilization rate and economic benefits of shared energy storage among different schemes. Scheme 1 is a single application scenario for capacity lease in wind farm clusters, with a utilization rate of only 32.46%. The leasing income in Scheme 1 decreased by CNY 2998 and CNY 7561, respectively, compared to Scheme 2 and Scheme 3. This is because the leasing demand of WFCO in different time periods is random, resulting in continuous charging or discharging action of shared energy storage in multiple time periods. Due to the inherent characteristics of SOC of shared energy storage (capacity limitation of shared energy storage), SESO is unable to fully meet the leasing demand of WFCO in a few time periods. In Scheme 2, a new application scenario for the electric energy market has been added, which utilizes the arbitrage method of peak valley price difference to encourage SESO to perform full power charging during the periods when WFCO has charging leasing demand (close to or in the valley time period), and to perform full power discharge during peak period of electric price (under the premise of meeting subsequent leasing demand), thereby increasing the period and capacity that meet WFCO’s capacity lease demand. Compared with Scheme 1, which has a single application scenario, the leasing income has increased by 3.6707%, and the total income and utilization rate have increased by CNY 325.59 million and 3.43% respectively. For option 3, incorporating the frequency regulation market with good energy storage revenue in the current market environment into the application scenario significantly improves utilization, with a 52.87% increase compared to Scheme 1. The frequency regulation revenue is much higher than the leasing revenue.
It is worth noting that the high regulation and high price requirements of the frequency regulation market are more closely related to the energy storage system. With the continuous increase in the installed capacity of new energy and its gradual transformation into core power sources, the assessment costs it faces will become more complex and enormous, and the demand for leasing shared energy storage will increase accordingly. It may be expected that the severe assessment issues faced by new energy will provide greater bidding space and economic benefits for leasing scenarios of shared energy storage, which will be equally important or even more important than the application scenarios in the frequency regulation market. Meanwhile, effectively controlling the fluctuations and prediction deviations of new energy before grid connection is beneficial for reducing its impact on the safe and stable operation of the power grid.

5.3. Rolling Optimization Strategy Analysis for Real-Time Shared Energy Storage

In the real-time stage, based on wind power output and the prediction results of market electric price, an improved robust optimization method is used to determine the deviation of the prediction results, thereby achieving dynamic regulation of WFCO’s leasing capacity and SESO charging and discharging plan in each time period. The mean and variance of the real-time forecast results of wind power output and market electric prices are shown in Table A4 of Appendix A.

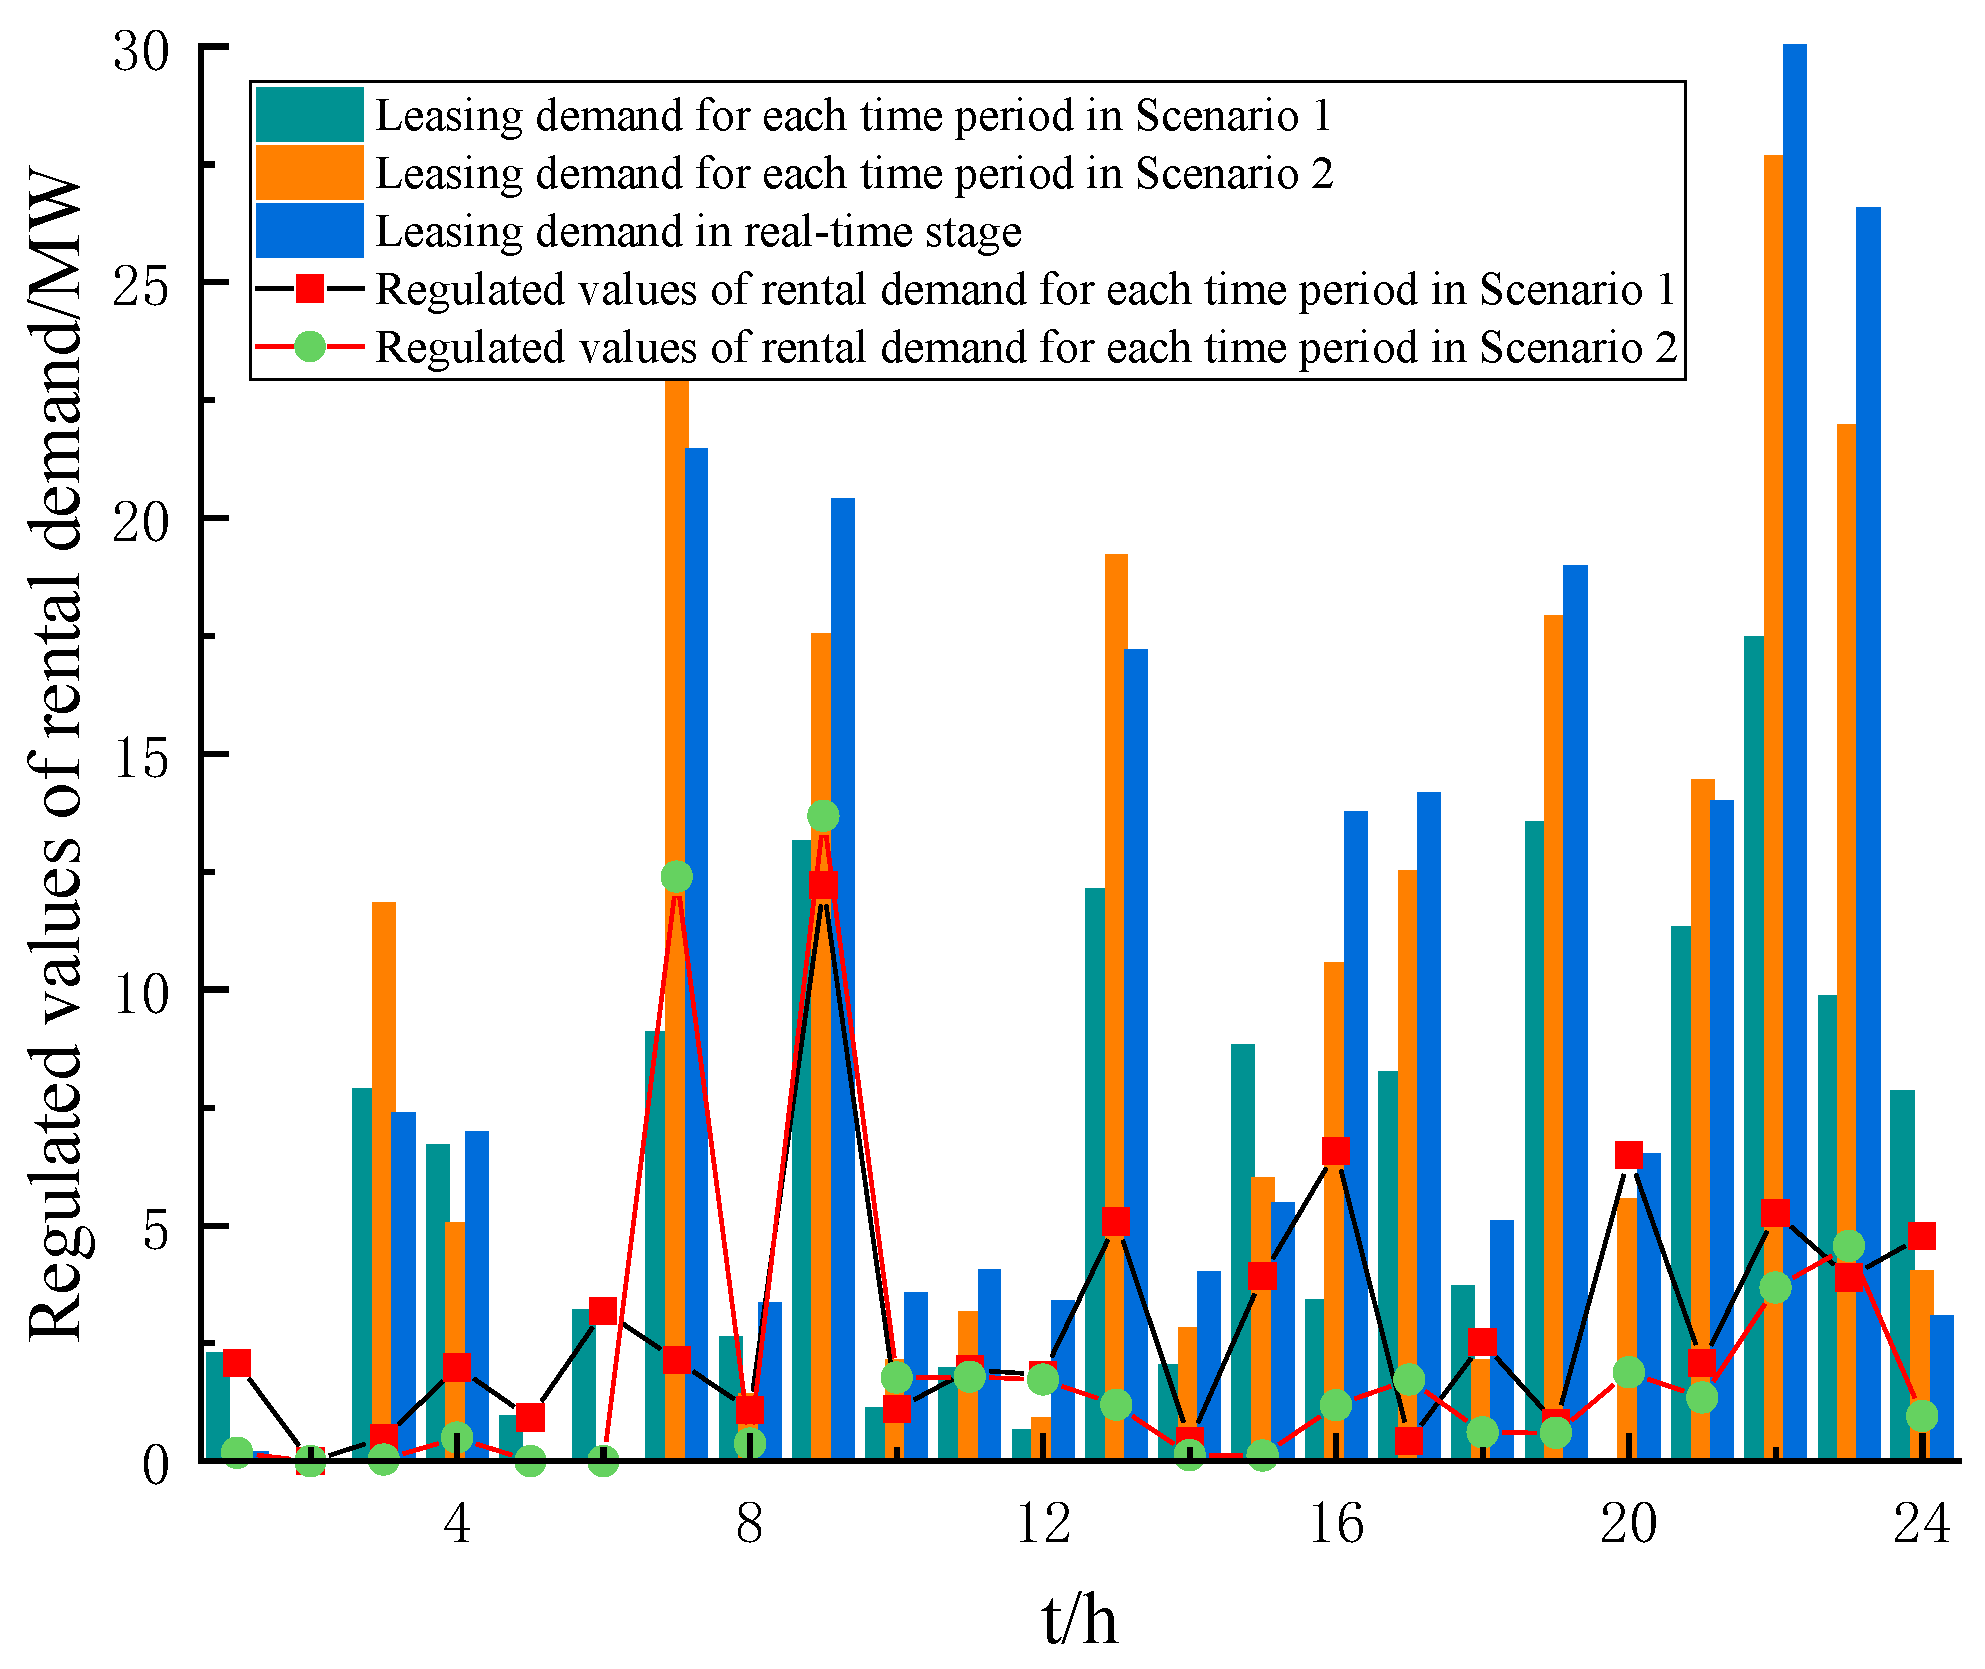
5.3.1. Rolling Regulation Analysis of WFCO Leasing Strategy

WFCO calculates the mean and variance of the predicted sequence of real-time wind power output based on the leasing prices in each time period during the day-ahead stage, updates the prediction results using an improved robust optimization method, and calculates the regulation value of WFCO’s leasing capacity in each time period.
To verify the effectiveness and rationality of considering wind power output uncertainty in optimizing WFCO leasing demand adjustment during the real-time phase, three scenarios were set up for comparative analysis. Scenario 1: Directly using real-time wind power output prediction results to calculate the WFCO assessment cost for SESO capacity leasing adjustments in each period. Scenario 2: Considering the uncertainty of wind power output, the classical robust optimization method is used to quantify the prediction deviation. Based on the real-time wind power output prediction correction results, the SESO capacity leasing adjustment for each period is calculated to form the WFCO assessment cost [15]. Scenario 3: The method proposed in this article quantifies prediction bias using an improved robust optimization approach, and calculates the WFCO assessment cost based on the real-time wind power output prediction correction results for SESO capacity leasing adjustments in each period. Scenario 4: Using deep learning methods to calculate the WFCO assessment cost generated by SESO capacity leasing adjustments at each time period [27]. The assessment costs of WFCO in different scenarios during the real-time stage are shown in Table 2.
From the table, it can be seen that the total assessment cost of scenario 1 is lower than that of scenarios 2 and 3, with a reduction of CNY 17,268 and CNY 11,641, respectively, which is in line with the adjustment results of leasing capacity in different scenarios during the real-time stage. The real-time prediction results that do not consider the uncertainty of wind power output are too idealized, and the insufficient or excessive adjustment of leasing capacity in the real-time stage results in WFCO’s leasing capacity being unable to effectively cope with the additional assessment costs caused by the deviation between actual wind power output and prediction results in the real-time stage. There is a potential risk of increasing the total assessment cost of WFCO. Scenarios 2 and 3 take into account the uncertainty of wind power output, and consider the worst-case scenario of actual wind power output through robust optimization and improved robust optimization methods, thereby enhancing the robustness and effectiveness of WFCO’s real-time leasing capacity adjustment results. Scenario 3 integrates real-time wind power output prediction results with leasing capacity adjustment decisions, resulting in a total assessment cost reduction of CNY 5627 compared to scenario 2. This indicates that the improved robust optimization method is more objective and accurate, and can balance the economic benefits of WFCO while ensuring the robustness of leasing capacity adjustment results. In addition, compared to scenario 4, scenario 3 only increased the total assessment cost by CNY 874, indicating that the method proposed in this paper is similar in effectiveness to scenario 4 using deep reinforcement learning, effectively reducing the difficulty of model solving while ensuring the accuracy of calculation results.

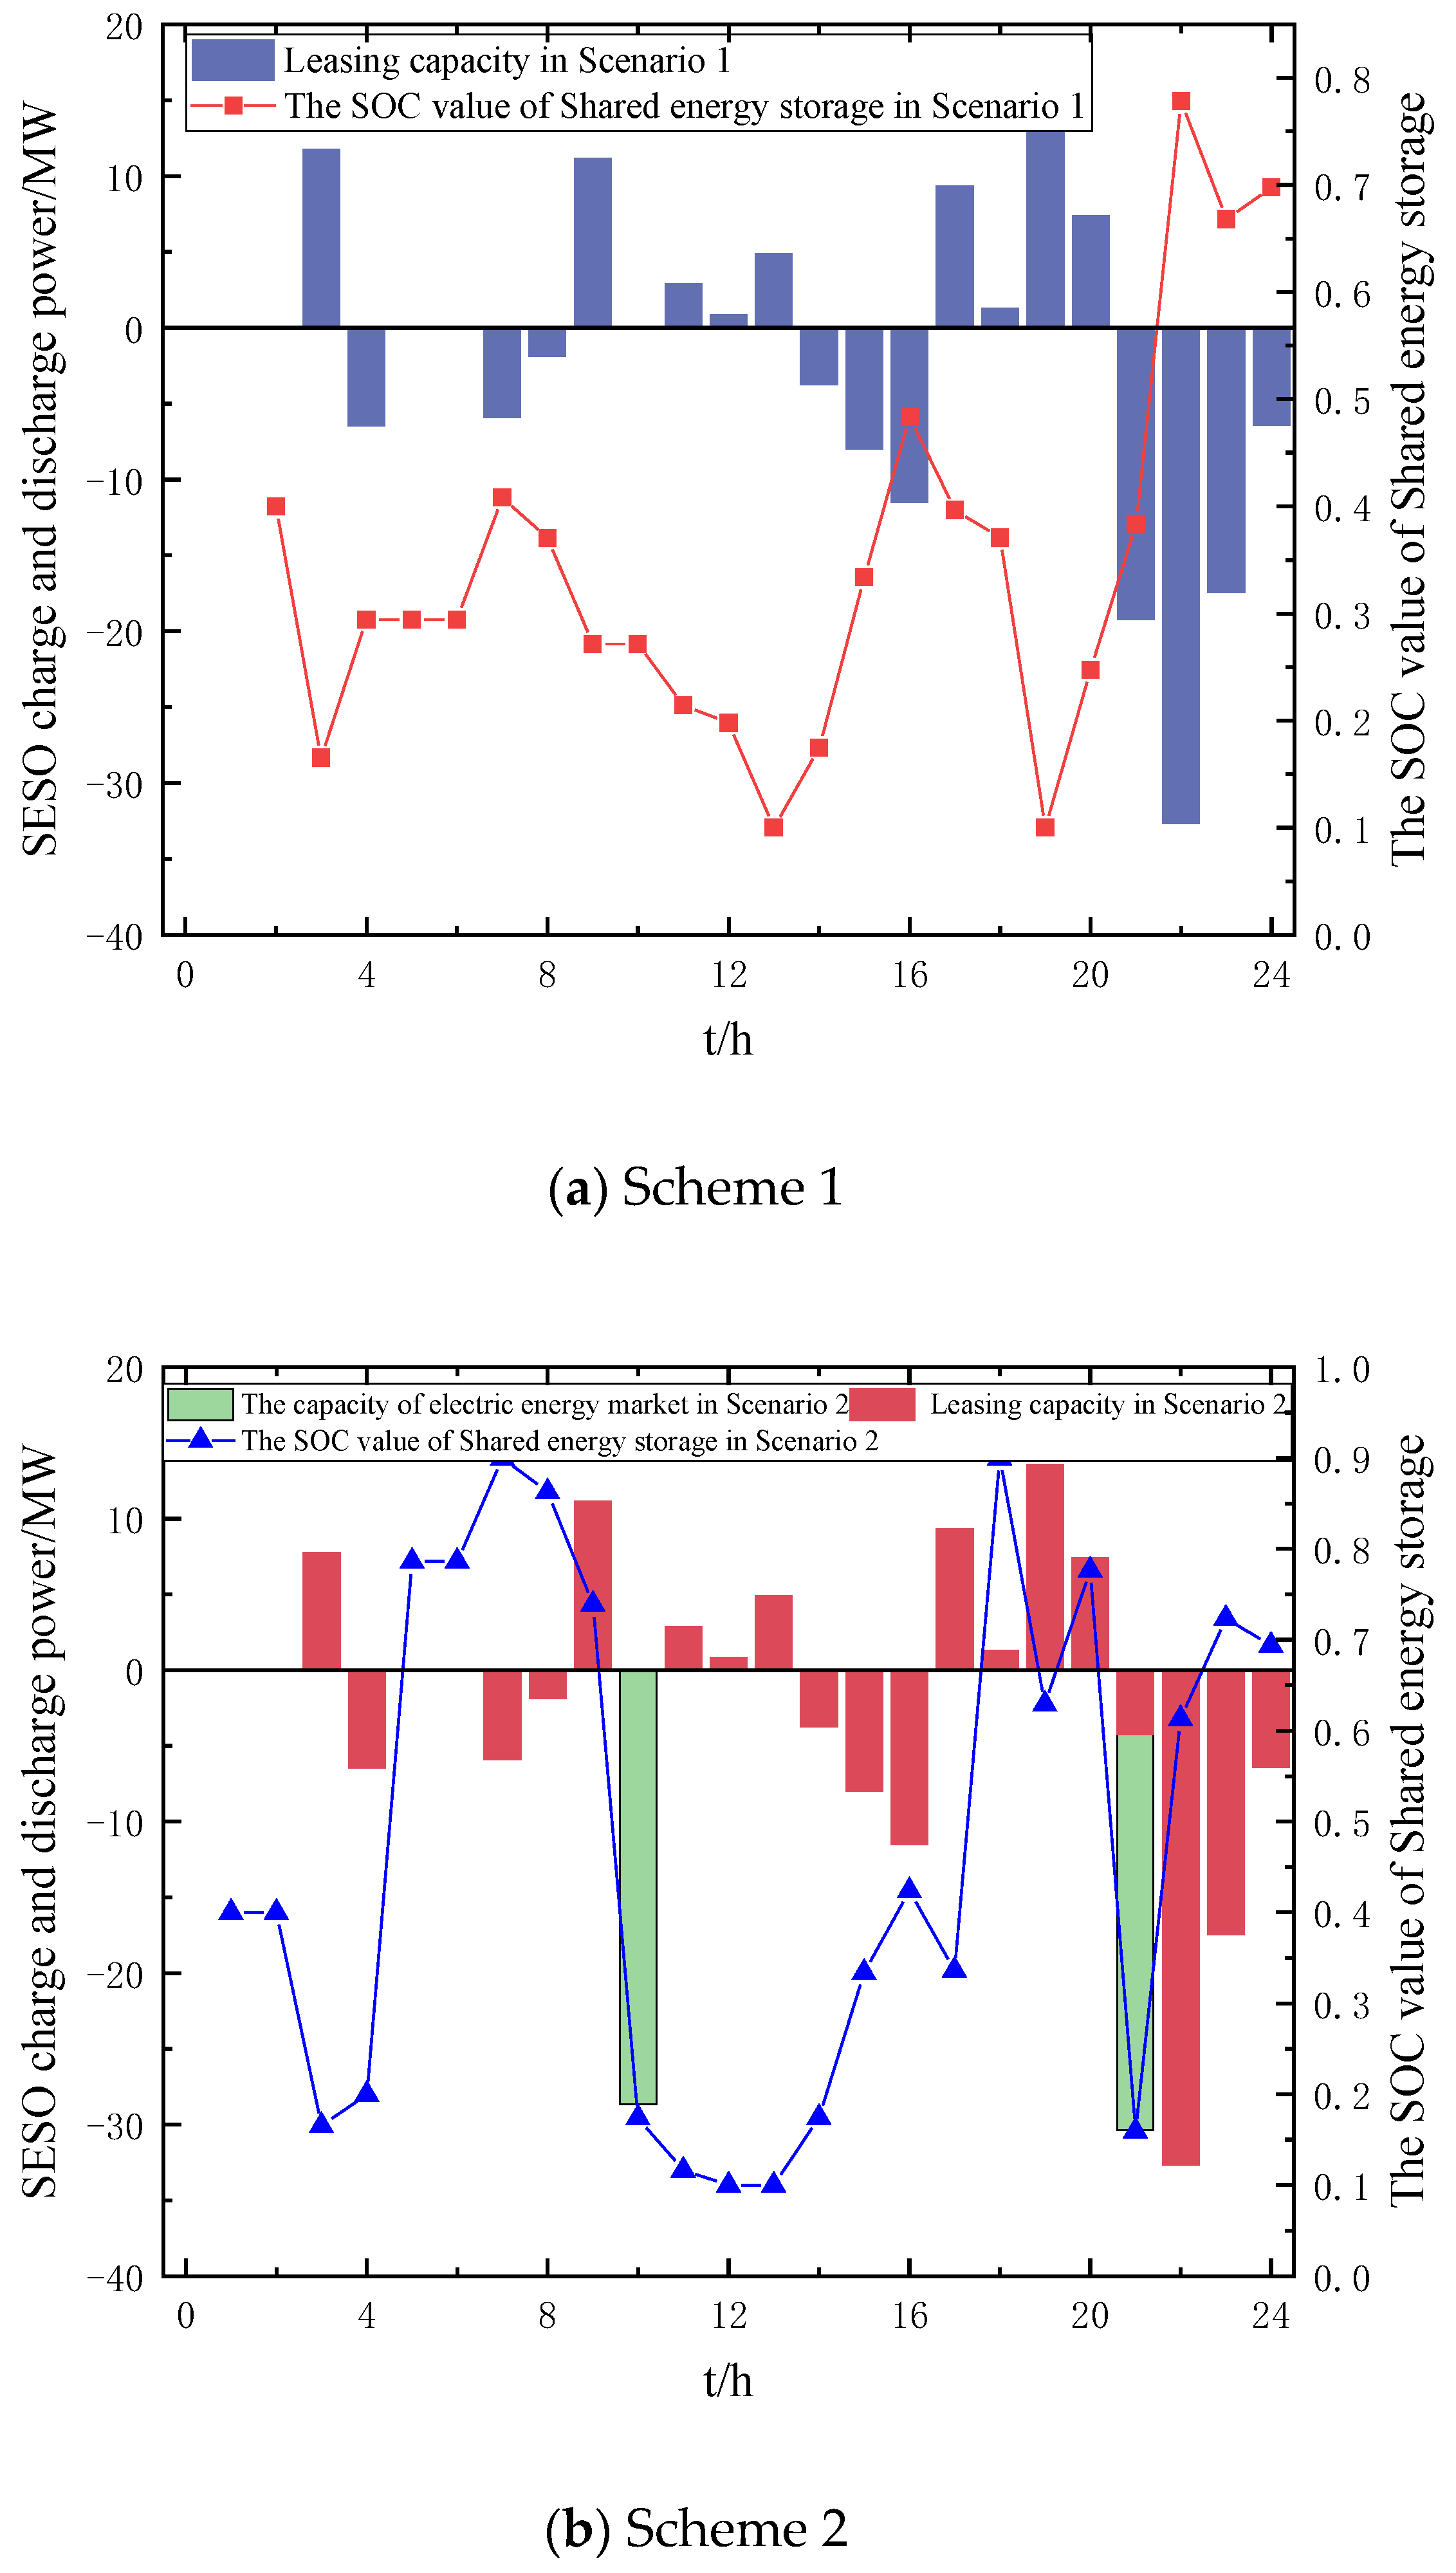
5.3.2. Rolling Regulation Analysis of SESO Charging and Discharging Strategy

SESO calculates the mean and variance of the predicted sequence of clearing prices for the electric energy market and frequency regulation market in the real-time stage based on the regulation results of WFCO’s leasing capacity in each time period. An improved robust optimization method is used to update the predicted results and determine the charging and discharging plan for shared energy storage in each time period.
To verify the effectiveness and rationality of considering price uncertainty of market electricity in the real-time stage for improving the SESO rolling optimization operation strategy, three scenarios are set up for comparative analysis. Scenario 1: Directly using the forecasting results of the electric price in the real-time market to develop operational strategies for SESO rolling optimization at various time periods. Scenario 2: Considering the uncertainty of wind power output, the classical robust optimization method is used to quantify prediction deviation, and the correction results of electric price prediction in the real-time market are used to determine the SESO rolling optimization operation strategy in each time period. Scenario 3: This is the method proposed in this paper, which uses an improved robust optimization method to quantify prediction deviation, and uses the correction results of electric price prediction in the real-time market to determine the operational strategy of SESO rolling optimization in each time period. In scenario 2, the robustness factors are all set to 6; In scenario 3, the confidence level is set to 1.2 and 1.2 [26], respectively. The costs and benefits of SESO in different scenarios during the real-time stage are shown in Table 3.
From Table 3, it may be observed that there are significant differences in the total operating revenue of SESO under different scenarios. The capacity leasing revenue is the same in all three scenarios, but the differences are concentrated in market revenue and operating costs. The total operating profit is highest in scenario 1, with an increase of 7.8568% and 5.8883% compared to scenarios 2 and 3, respectively. This indicates that in the real-time stage, without considering the uncertainty of market electric prices, using the real-time market electric price prediction results to determine the SESO optimization operation strategy is not robust. When there is a certain degree of difference between the clearing price in the actual electricity market and frequency modulation market and the predicted value of the real-time market electric price, the SESO rolling optimization operation strategy is prone to face certain economic losses. In scenarios 2 and 3, the SESO real-time rolling optimization strategy is determined based on the error space between the predicted real-time electric price and the actual clearing price, resulting in a charging and discharging plan with stronger risk resistance. Compared to scenario 2, scenario 3 has increased the total operating revenue by 2.1364%. It uses key indicators of the prediction results of real-time electric price to determine the upper and lower limits of error space, which improves the objectivity and robustness of the quantified results of market electric price uncertainty while ensuring the economic viability of SESO’s rolling optimization operation plan.

6. Conclusions

With a single application scenario, it is difficult to effectively leverage the diverse value of shared energy storage. In order to enhance economic benefits, this paper constructs a diversified application scenario of shared energy storage for lease-electric energy-frequency regulation, and uses a Stackelberg game model and probability distribution method of prediction error to optimize the pricing mechanism of the leasing mode. Considering multiple uncertainties has improved the robustness and economy of SESO charging and discharging plans. The effectiveness of the model and proposed method constructed in this paper was validated using operational data from the Guangdong electricity market, and the following conclusions were drawn:
(1)
Multiple application scenarios can effectively leverage the capacity support and rapid regulation value of shared energy storage. Compared with a single capacity leasing scenario, the utilization rate and economic benefits of shared energy storage in the multiple scenarios built in this paper increased by 52.87% and CNY 158,700, respectively, which is conducive to promoting wind power consumption and improving the economic benefits of shared energy storage.
(2)
A reasonable price formation mechanism is the key to increasing the willingness of shared energy storage to provide balanced services for various wind farms. The Stackelberg game model can effectively characterize the energy sharing and interactive game between capacity leasing parties. Compared to the fixed electricity price model, the Stackelberg game model constructed in this paper may increase the revenue of the wind farm by CNY 13,632, and the resulting leasing price signal can effectively map the leasing demand of WFCO in various periods.
(3)
In the process of forming leasing prices in the day-ahead stage, considering the uncertainty of wind power output can more accurately quantify the leasing demand of WFCO in various periods, effectively reducing the regulation value of WFCO leasing capacity in the real-time stage, thus forming a more distinct and accurate leasing price signal, which is conducive to guiding WFCO to lease shared energy storage capacity on demand.
(4)
The improved robust optimization method that integrates prediction results and scheduling decisions is adopted to determine the degree of deviation between wind power output and market electric prices in real-time prediction results with higher accuracy, resulting in a 2.1364% increase in SESO revenue compared to traditional robust optimization methods. This approach ensures the robustness of SESO’s real-time rolling charging and discharging plan while also considering economic benefits.
With the continuous increase in the penetration rate of shared energy storage, the bidding behavior of shared energy storage in the electricity market and auxiliary service market will significantly affect the market clearing price. The hypothesis proposed in this paper is that shared energy storage serves as a price receiver in the electricity market and needs to be reset, and optimization scheduling models and methods under different scenarios of shared energy storage penetration rate can be explored in the future. In addition, with the increase and complexity of shared energy storage application scenarios, the optimization model proposed in this paper faces a series of problems such as difficulty in determining the order of scene participation and difficulty in solving them. In the future, advanced methods such as evolutionary game theory or dynamic optimal control can be explored to solve the problems of shared energy storage and business model innovation.

Author Contributions

Conceptualization, J.W.; Methodology, J.W.; Software, Z.L.; Formal analysis, J.W.; Investigation, Z.L.; Resources, Z.L.; Data curation, J.L.; Writing—original draft, Z.L.; Writing—review & editing, Z.L.; Visualization, Z.L.; Funding acquisition, J.L. All authors have read and agreed to the published version of the manuscript.

Funding

This work is supported by the Technology Planning Project of Guangdong Power Grid Co., Ltd. (030000QQ 00230002).

Data Availability Statement

The original contributions presented in the study are included in the article, further inquiries can be directed to the corresponding authors.

Conflicts of Interest

Author Junlei Liu was employed by the Guangdong Power Grid Co., Ltd. The remaining authors declare that the research was conducted in the absence of any commercial or financial relationships that could be construed as a potential conflict of interest.

Abbreviations

SymbolDefinition
SESshared energy storage
SESOshared energy storage operators
WFCOwind farm cluster operators
EMthe electric energy market
FRMthe frequency regulation market
γ t the total leasing price of SESO during time period t
γ t c a p the capacity lease price of SESO during time period t
γ t m a i l the mileage leasing price of SESO during time period t
I S E S O d , 1 the total operating revenue of SESO in the capacity lease scenario in the day-ahead stage
H t d the total charging and discharging mileage of WFCO in the day-ahead stage during time period t
λ the loss cost of SESO unit charging and discharging power
P t d , 1 , c the charging power of SESO for the capacity lease scenario during time period t in the day-ahead stage
P t d , 1 , d the discharging power of SESO for the capacity lease scenario during time period t in the day-ahead stage
P c the rated charging power power of SESO
P d the rated discharging power of SESO
S O C t the state of charge values of SESO during time periods t
S O C t 1 the   state   of   charge   values   of   SESO   during   time   periods   t - 1
η c the charging efficiencies of SESO
η d the discharging efficiencies of SESO
E S E S the rated capacity of SESO
Δ t the time interval, taken as 1 h in this paper
S O C min the maximum SOC values pre-set by SESO
S O C max the minimum SOC values pre-set by SESO
S O C o the initial SOC value of SESO
S O C e the SOC value at the end of one operating cycle (24 h)
C W d the total cost of WFCO in the day-ahead stage under capacity lease scenarios
C W d , b the assessment cost incurred by WFCO during grid connection in the day-ahead stage due to fluctuations in power generation
C W d , y the assessment cost formed by the prediction error of WFCO’s power generation in the day-ahead stage
α the unit assessment costs incurred by WFCO during grid connection due to fluctuations in power generation
β the unit assessment costs incurred due to forecast deviations in power generation
R b , t d the assessment capacity formed by the fluctuation of power generation during grid connection after WFCO leases SESO capacity in the day-ahead stage
R y , t d the assessment capacity formed by the prediction error of power generation.
P w , t L the maximum grid connected power of WFCO during time period t
P w , t A the online power of WFCO during time period t
P w , m , t d the   predicted   power   of   WFCO s   m th wind farm during time period t in the day-ahead market
P w , m , t E the   rated   power   of   WFCO s   m th wind farm during time period t
P w , t d , Q the maximum wind power curtailment of WFCO during time period t in the day-ahead market
P w , t d , F the predicted power of WFCO in the day-ahead market during time period t
P w s , F the predicted values of wind power output
p E M s the predicted values of clearing prices in the electric energy market
p F R M s the predicted values of clearing prices in the frequency regulation market during the real-time stage
p ¯ w s , F the average predicted results of wind power output
p ¯ E M s the average predicted results of clearing prices in the electric energy market
p ¯ F R M s the average predicted results of clearing prices in the frequency regulation market during the real-time stage
σ w s , F 2 the variances of the predicted results for wind power output
σ E M s 2 the variances of the predicted results for clearing prices in the electric energy market
σ F R M s 2 the variances of the predicted results for clearing prices in the frequency regulation market during the real-time stage
z α / 2 the upper and lower quantile point of the standard normal distribution
I S E S O d the total operating revenue of SESO in multiple application scenarios during the day-ahead stage
I S E S O d , 2 the total operating revenue of SESO in the market trading application scenario during the day-ahead stage
I S E S O d , E M the revenue obtained by SESO from the electric energy market in the day-ahead stage
I S E S O d , F R M the revenue obtained by SESO from the frequency regulation market in the day-ahead stage
C l o s s d , 2 the operational cost loss of SESO in the market trading application scenario during the day-ahead stage
C w Q the cost of wind power curtailment charging for SESO in the day-ahead stage
p E M , t d the predicted clearing prices for the electric energy market during time period t
p F R M , t d the predicted clearing prices for the frequency regulation market during time period t
P t d , E M the pre-scheduled power of SESO in the electric energy market during time period t
P t d , F R M the pre-scheduled power of SESO in the frequency regulation market during time period t
P t d , 2 , c the charging power of SESO in the market trading scenario during time period in the day-ahead stage
P t d , 2 , d the discharging power of SESO in the market trading scenario during time period in the day-ahead stage
p w , t Q , d the wind power charging price for SESO during time period t in the day-ahead stage
P w , t Q , d the abandoned wind power charging for SESO during time period t in the day-ahead stage
P t d , c the total charging power of SESO during time period t
P t d , d the total discharging power of SESO during time period t
an operator that means at least one of the left and right parameters will be 0

Appendix A

Figure A1. Output prediction curve of wind farm 1 in day-ahead stage and real-time stage.
Energies 18 02697 g0a1
Figure A2. Output prediction curve of wind farm 2 in day-ahead stage and real-time stage.
Energies 18 02697 g0a2
Figure A3. Output prediction curve of wind farm 3 in day-ahead stage and real-time stage.
Energies 18 02697 g0a3
Figure A4. Output prediction curves of wind farm clusters in day-ahead and real-time stages.
Energies 18 02697 g0a4
Figure A5. Maximum power capacity of wind farm clusters at grid-connected nodes.
Energies 18 02697 g0a5
Table A1. Parameter settings for shared energy storage participating in multiple application scenarios.
Parameter TypeParameter Values
Rated power/MW40
Rated capacity/MWh40
Charge/discharge efficiency0.95/0.95
Initial value of SOC0.3
Maximum/minimum value of SOC0.9/0.1
Conversion factor0.85
Unit operating cost loss/CNY/kWh0.1542
Comprehensive frequency regulation performance indicators2.7
Table A2. Key parameters of normal distribution of errors in WFCO output prediction in various time periods during day-ahead stage.
TimeMean ValueVariance
134.2393 89.6526
219.2634 37.2033
324.9932 53.9232
452.2001 278.6746
5−15.3283 284.3623
6−26.8151 58.0981
794.1020 540.3911
8−8.7919 5.3743
960.7938 342.3677
1032.8836 102.3540
1121.7613 41.3698
1218.6338 38.6720
13−6.7217 3.1433
1433.1149 95.4252
15−33.4131 101.3509
165.4930 2.1563
17−30.7271 93.1988
1840.8384 137.1739
1958.4960 293.1762
20−22.7332 46.3279
2135.3781 98.5644
22−36.4167 102.3767
23−33.6615 96.4484
24−1.2299 0.15367
Table A3. Leasing prices for SESO capacity in different scenarios.
TimeCapacity PriceMileage Price
Scenario 1Scenario 2Scenario 1Scenario 2
10.32480.32480.19880
20.32480.324800
30.32480.32480.34550.4081
40.32480.32480.26780.2678
50.32480.32480.15420
60.32480.32480.19880
70.32480.32480.34550.2678
80.32480.32480.19880.1542
90.32480.32480.40810.4081
100.32480.32480.15420
110.32480.32480.15420.1988
120.32480.32480.15420.1542
130.32480.32480.40810.4527
140.32480.32480.19880.1988
150.32480.32480.34550.3455
160.32480.32480.19880.3455
170.32480.32480.34550.3455
180.32480.32480.19880.1542
190.32480.32480.40810.4527
200.32480.324800.2678
210.32480.32480.40810.4527
220.32480.32480.45270.4527
230.32480.32480.34550.4527
240.32480.32480.34550.2678
Table A4. Mean and variance of real-time forecast results of wind power output and market electric prices.
TypeMean ValueVariance
Wind power output/MW140.9584604.6776
Electric prices in electric energy market/CNY/kWh0.54920.187
Electric prices in frequency regulation market/CNY/kWh10.59683.2643

References

  1. Anand, H.; Verma, A.; Narang, N.; Dhillon, J.S. A novel scheduling approach of stochastic cogeneration model in power system environment using improved civilized swarm search algorithm to reduce cost and carbon emission. J. Clean. Prod. 2024, 434, 140277. [Google Scholar] [CrossRef]
  2. Zhang, T.; Xin, L.; Wang, S.; Guo, R.; Wang, W.; Cui, J.; Wang, P. A novel approach of energy and reserve scheduling for hybrid power systems: Frequency security constraints. Appl. Energy 2024, 361, 122926. [Google Scholar] [CrossRef]
  3. Yin, L.; Lin, C. Matrix Wasserstein distance generative adversarial network with gradient penalty for fast low-carbon economic dispatch of novel power systems. Energy 2024, 298, 131357. [Google Scholar] [CrossRef]
  4. Dai, B.; Wang, H.; Li, B.; Li, C.; Tan, Z. Capacity model and optimal scheduling strategy of multi-microgrid based on shared energy storage. Energy 2024, 306, 132472. [Google Scholar] [CrossRef]
  5. Pu, Y.; Li, Q.; Huo, S.; Breaz, E.; Chen, W.; Gao, F. Optimal configuration for shared electric-hydrogen energy storage for multiple integrated energy systems with mobile hydrogen transportation. Renew. Energy 2024, 237, 121828. [Google Scholar] [CrossRef]
  6. Kalathil, D.; Wu, C.; Poolla, K.; Varaiya, P. The sharing economy for the electricity storage. IEEE Trans. Smart Grid 2019, 10, 556–567. [Google Scholar] [CrossRef]
  7. Dai, R.; Esmaeilbeigi, R.; Charkhgard, H. The utilization of shared energy storage in energy systems: A comprehensive review. IEEE Trans. Smart Grid 2021, 12, 3163–3174. [Google Scholar] [CrossRef]
  8. Kang, C.; Liu, J.; Zhang, N. A new form of energy storage in future power system: Cloud energy storage. Power Syst. Autom. 2017, 41, 2–8+16. [Google Scholar]
  9. Yan, D.; Chen, Y. Review of shared energy storage business model and pricing mechanism. Power Syst. Autom. 2022, 46, 178–191. [Google Scholar]
  10. Wang, X.; Zhang, Z.; Zhang, S.; Zhang, S. Power market game analysis considering new energy generators leasing shared energy storage. Power Grid Technol. 2024, 48, 3269–3277. [Google Scholar]
  11. Qiao, J.; Mi, Y.; Shen, J.; Lu, C.; Cai, P.; Ma, S.; Wang, P. Optimization schedule strategy of active distribution network based on microgrid group and shared energy storage. Appl. Energy 2024, 377, 124681. [Google Scholar] [CrossRef]
  12. Wang, D.; Fan, R.; Yang, P.; Du, K.; Xu, X.; Chen, R. Research on floating real-time pricing strategy for microgrid operator in local energy market considering shared energy storage leasing. Appl. Energy 2024, 368, 123412. [Google Scholar] [CrossRef]
  13. Wang, Y.; Chen, J.; Zhao, Y.; Xu, B. Incorporate robust optimization and demand defense for optimal planning of shared rental energy storage in multi-user industrial park. Energy 2024, 301, 131721. [Google Scholar] [CrossRef]
  14. He, L.; Zhang, J. A Community Sharing Market with PV and Energy Storage: An Adaptive Bidding-Based Double-Side Auction Mechanism. IEEE Trans. Smart Grid 2021, 12, 2450–2461. [Google Scholar] [CrossRef]
  15. Gao, M.; Xiang, L.; Zhu, S.; Lin, Q. Scenario probabilistic data-driven two-stage robust optimal operation strategy for regional integrated energy systems considering ladder-type carbon trading. Renew. Energy 2024, 237, 121722. [Google Scholar] [CrossRef]
  16. Duan, J.; Gao, Q.; Xia, Y.; Tian, Q.; Qin, B. MMD-DRO based economic dispatching considering flexible reserve provision from concentrated solar power plant. Energy 2024, 308, 132875. [Google Scholar] [CrossRef]
  17. Gao, J.; Shao, Z.; Chen, F.; Lak, M. Robust optimization for integrated energy systems based on multi-energy trading. Energy 2024, 308, 132302. [Google Scholar] [CrossRef]
  18. Hu, J. Dynamic Output Feedback MPC of Polytopic Uncertain Systems: Efficient LMI Conditions. IEEE Trans. Circuits Syst. II Express Briefs 2021, 68, 2568–2572. [Google Scholar] [CrossRef]
  19. Wang, C.; Zhang, X.; Ling, K.; Xi, L.; Chen, R.; Wang, A.; Chu, S.; Tian, F.; Li, X. Two-stage adaptive robust optimal scheduling of microgrid based on interval probability uncertainty set. Proc. CSEE 2024, 44, 1750–1764. [Google Scholar]
  20. Song, X.; Zhang, H.; Fan, L.; Zhang, Z.; Peña-Mora, F. Planning shared energy storage systems for the spatio-temporal coordination of multi-site renewable energy sources on the power generation side. Energy 2023, 282, 128976. [Google Scholar] [CrossRef]
  21. Xu, X.; Li, G.; Yang, H.; Liu, D.; Wang, J.; Zhang, Z.; Zhao, L.; Zhang, X. Pricing method of shared energy storage bias insurance service based on large number theorem. J. Energy Storage 2023, 69, 107726. [Google Scholar] [CrossRef]
  22. Shukla, A.; Singh, S. Clustering based unit commitment with wind power uncertainty. Energy Convers. Manag. 2016, 111, 89–102. [Google Scholar] [CrossRef]
  23. Shi, Y.; Wang, L.; Chen, W.; Guo, C. Distributed robust energy storage unit commitment based on wind power prediction error clustering. Power Syst. Autom. 2019, 43, 3–12+121. [Google Scholar]
  24. Dong, W.; Wang, Q.; Yang, L. Coordinated dispatching model of virtual power plant and distribution company with wind, solar and water. Power Syst. Autom. 2015, 39, 75–81+207. [Google Scholar]
  25. Lu, S.; Gao, W.Z.; Liu, Y. HFTL-KD: A new heterogeneous federated transfer learning approach for degradation trajectory prediction in large-scale decentralized systems. Control. Eng. Pract. 2024, 153, 106098. [Google Scholar] [CrossRef]
  26. Liu, Q.; Shang, Z.; Lu, S.; Liu, Y.; Liu, Y.; Yu, S. Physics-guided TL-LSTM network for early-stage degradation trajectory prediction of lithium-ion batteries. J. Energy Storage 2024, 106, 114736. [Google Scholar] [CrossRef]
  27. Su, Y.; Teh, J.; Fang, S.; Dai, Z.; Wang, P. Two-stage optimal dispatch framework of active distribution networks with hybrid energy storage systems via deep reinforcement learning and real-time feedback dispatch. J. Energy Storage 2025, 108, 115169. [Google Scholar] [CrossRef]
Figure 1. Scenario framework for diverse applications of shared energy storage.
Energies 18 02697 g001
Figure 2. WFCO leasing demands with different confidence values.
Energies 18 02697 g002
Figure 3. SESO leasing capacity and leasing prices in different scenarios.
Energies 18 02697 g003
Figure 4. Regulation values of SESO leasing demand in different scenarios during real-time stage.
Energies 18 02697 g004
Figure 5. SESO optimization results for different schemes.
Energies 18 02697 g005aEnergies 18 02697 g005b
Table 1. SESO revenue and utilization rates under different schemes.
Different SchemeUtilization RateSESO Revenue/CNY 10,000
Leasing RevenueRevenue from Electric Energy MarketRevenue from Frequency Regulation Market
Scheme 1 32.46%8.167300
Scheme 235.89%8.46712.95610
Scheme 385.33%8.92342.379815.7329
Table 2. Assessment costs of WFCO in different scenarios during the real-time stage.
Different ScenarioThe Various Costs of WFCO/CNY 104Total Assessment Cost
Assessment Costs Caused by Fluctuations in Grid-Connected PowerAssessment Costs Caused by Prediction DeviationCapacity Leasing Cost
Scenario 10.14310.67099.08279.8967
Scenario 20.23550.834610.553411.6235
Scenario 30.21880.823710.018311.0608
Scenario 40.22720.81439.931910.9734
Table 3. Costs and benefits of SESO in different scenarios during real-time stage.
Different ScenarioThe Various Costs of WFCO/CNY 10,000Operation CostTotal Operation Revenue
Capacity Leasing RevenueRevenue from Electric Energy MarketRevenue from Frequency Regulation Market
Scenario 110.01832.139214.52657.187619.4964
Scenario 210.01831.790412.79416.638217.9646
Scenario 310.01831.934013.28766.891518.3484
Disclaimer/Publisher’s Note: The statements, opinions and data contained in all publications are solely those of the individual author(s) and contributor(s) and not of MDPI and/or the editor(s). MDPI and/or the editor(s) disclaim responsibility for any injury to people or property resulting from any ideas, methods, instructions or products referred to in the content.

