Article

A Bayesian Network Approach to Predicting Severity Status in Nuclear Reactor Accidents with Resilience to Missing Data

1
College of Nuclear Science and Technology, Naval University of Engineering of PLA, Wuhan 430033, China
2
Wuhan Second Ship Design and Research Institute, Wuhan 430000, China
3
Third Military Representative Office Stationed in Wuhan, Wuhan 430000, China
4
Sino-German College of Intelligent Manufacturing, Shenzhen Technology University, Shenzhen 518118, China
*
Authors to whom correspondence should be addressed.
Energies 2025, 18(11), 2684; https://doi.org/10.3390/en18112684
Submission received: 26 March 2025 / Revised: 23 April 2025 / Accepted: 16 May 2025 / Published: 22 May 2025
(This article belongs to the Special Issue Operation Safety and Simulation of Nuclear Energy Power Plant)

Abstract

:
Nuclear energy is a cornerstone of the global energy mix, delivering reliable, low-carbon power essential for sustainable energy systems. However, the safety of nuclear reactors is critical to maintaining operational reliability and public trust, particularly during accidents like a Loss of Coolant Accident (LOCA) or a Steam Line Break Inside Containment (SLBIC). This study introduces a Bayesian Network (BN) framework used to enhance nuclear energy safety by predicting accident severity and identifying key factors that ensure energy production stability. With the integration of simulation data and physical knowledge, the BN enables dynamic inference and remains robust under missing-data conditions—common in real-time energy monitoring. Its hierarchical structure organizes variables across layers, capturing initial conditions, intermediate dynamics, and system responses vital to energy safety management. Conditional Probability Tables (CPTs), trained via Maximum Likelihood Estimation, ensure accurate modeling of relationships. The model’s resilience to missing data, achieved through marginalization, sustains predictive reliability when critical energy system variables are unavailable. Achieving R2 values of 0.98 and 0.96 for the LOCA and SLBIC, respectively, the BN demonstrates high accuracy, directly supporting safer nuclear energy production. Sensitivity analysis using mutual information pinpointed critical variables—such as high-pressure injection flow (WHPI) and pressurizer level (LVPZ)—that influence accident outcomes and energy system resilience. These findings offer actionable insights for the optimization of monitoring and intervention in nuclear power plants. This study positions Bayesian Networks as a robust tool for real-time energy safety assessment, advancing the reliability and sustainability of nuclear energy production.

1. Introduction

Nuclear energy is a vital pillar of global energy production, providing a low-carbon, reliable power source to meet rising energy demands and combat climate change. However, the safety of nuclear power plants is paramount, as accidents can disrupt energy supply, incur significant economic losses, and undermine public confidence in nuclear energy as a sustainable option. Accurate and timely assessment of accident severity is crucial for guiding emergency response and mitigating risks [1,2,3,4]. Scenarios such as the Loss of Coolant Accident (LOCA) [5] and Steam Line Break Inside Containment (SLBIC) [6] exemplify the complexities of nuclear reactor accidents, in which rapid changes in system dynamics and data uncertainties pose significant challenges to predictive modeling.
Over the past several decades, various methodologies have been developed to analyze and predict nuclear accident scenarios [1,7,8,9]. Traditional approaches, such as deterministic models [10,11] and fault tree analysis [12,13], have been widely used for risk assessment but often fall short in addressing the inherent uncertainties and causal complexities of nuclear accidents. Probabilistic Safety Assessment (PSA) methods [14,15,16], including Event Tree Analysis (ETA) and Monte Carlo simulations [17,18,19], provide a probabilistic framework but lack the adaptability to dynamically update predictions when new evidence arises.
Recently, Bayesian Networks (BNs) have emerged as a promising tool for risk analysis in complex systems [20,21,22]. Studies such as Chow [20] demonstrated the application of BNs in nuclear safety to model causal relationships and dynamically infer accident probabilities. For example, Pyy [20] applied BNs to predict nuclear plant system failures, highlighting their ability to handle conditional dependencies effectively. However, a major challenge in applying BNs to real-world problems like nuclear safety is the presence of missing data. Missing data is a common issue in safety-critical scenarios, in which real-time data may be incomplete due to sensor failures or communication delays. Compared to traditional methodologies, the Bayesian Network (BN) framework has demonstrated significant advancements in predicting nuclear accident severity. Deterministic models [10,11] rely on static assumptions, struggling with dynamic uncertainties. PSA methods [14,15], while probabilistic, lack real-time adaptability. In contrast, a BN dynamically updates predictions, handles missing data via marginalization, and identifies critical variables through sensitivity analysis. These features enhance accuracy and responsiveness, making the BN ideal for real-time nuclear safety management.
Addressing missing data is critical for ensuring reliable predictions in nuclear safety analysis. Techniques such as marginalization and imputation have been explored in various contexts [23,24]. Marginalization, as discussed by Zhang [25], allows probabilistic models to account for unobserved variables by summing over their possible states. Andrea [26] proposed a method for estimating missing values by leveraging observed data and statistical patterns. Despite the advances made in handling missing data in static and time-dependent systems, the application of these techniques to complex hierarchical structures, like those required in nuclear safety analysis, remains underexplored.
This study builds upon and extends the existing body of work by developing a hierarchical Bayesian Network framework to predict the severity of the LOCA and SLBIC scenarios. The structure of the BN is based on a detailed analysis of the physical mechanisms involved in these accidents. The model incorporates robust mechanisms to handle missing data through marginalization, ensuring reliable predictions even under incomplete-data conditions. By integrating sensitivity analysis, the model identifies critical variables influencing accident outcomes, enhancing energy safety management. This research contributes to the reliability of nuclear energy production by offering a tool that improves predictive accuracy and supports informed decision-making.
The objectives of this study are threefold: (1) to develop a Bayesian Network capable of accurately predicting accident severity, (2) to demonstrate the model robustness under missing-data conditions, and (3) to provide actionable insights for nuclear safety management through sensitivity analysis. The remainder of this manuscript is organized as follows: Section 2 describes the methodology, including data preprocessing, Bayesian Network construction, and analysis steps. Section 3 presents the results for the LOCA and SLBIC scenarios, including performance metrics and sensitivity analysis. Section 4 discusses the conclusions and potential implications for nuclear energy safety.

2. Materials and Methods

2.1. Data

The dataset used in this study was derived from the Nuclear Power Plant Accident Data (NPPAD) [27], an open-access repository developed using the PCTRAN simulator. PCTRAN, a widely validated tool for modeling the dynamics of Pressurized Water Reactors (PWRs), provides detailed data under both normal and accident conditions. The NPPAD dataset, derived from PCTRAN, contains 1217 samples. To ensure representativeness across diverse accident scenarios, the simulations were designed to encompass a wide range of severity levels, initial conditions (e.g., varying TAVG (Temp RCS Average), PSGA (Pressure Steam Generator A)), and system states (e.g., different WHPI (Flow High-Pressure Injection)), as detailed by Qi et al. [27]. Representativeness was verified by analyzing the distribution of key variables (e.g., TAVG, LVPZ (Level Pressurizer)) across the samples, confirming the coverage of realistic nuclear accident scenarios. Given the high stakes involved in nuclear safety, statistical power analysis was conducted to validate the sufficiency of datasets. The dataset contains time-series snapshots, with each sample representing a simulation captured at 10 s intervals, providing dynamic data on the progression of the accident. The dataset is suitable for training robust BNs capable of making accurate and reliable predictions in high-risk nuclear safety applications. The NPPAD dataset includes 97 monitored parameters, capturing a wide range of system states and dynamics. While the database contains data from 97 sensors, the selection of monitoring nodes was guided by the physical processes relevant to each type of accident. Specifically, for the Loss of Coolant Accidents (LOCA), detailed monitoring nodes and their roles are described in Section 2.4.1, and for the Steam Line Break Inside Containment (SLBIC) accidents, detailed monitoring nodes and their roles are described in Section 2.4.2.
Data preprocessing involved normalization and discretization to enable compatibility with Bayesian Network analysis. Normalization transformed variables into a range of [0, 1] to ensure consistency, while discretization into 10 levels reflected the range of system states with sufficient granularity. The choice of 10 discretization levels was based on preliminary experiments with the NPPAD dataset [27], balancing granularity and computational efficiency. Levels 5 through 20 were tested, and a level of 10 achieved high accuracy without excessive computational cost. Coarser levels (e.g., 5) risked the oversimplification of dynamics, reducing accuracy, while finer levels (e.g., 20) increased complexity, with minimal accuracy gains. This optimizes real-time applicability, though optimal levels may vary by dataset.

2.2. Bayesian Model

Bayesian Networks (BNs) are powerful tools for modeling uncertainty and causal relationships in complex systems, making them highly suitable for real-time risk analysis in nuclear reactor scenarios. Unlike traditional methods such as fault tree analysis, BNs dynamically update probabilities when new evidence is introduced. This adaptability is particularly advantageous in addressing missing or incomplete data, which frequently occurs in real-world accident scenarios.
A Bayesian Network is represented by a Directed Acyclic Graph (DAG), in which nodes correspond to random variables and directed edges represent conditional dependencies. The quantitative relationships between nodes are defined using Conditional Probability Tables (CPTs), which specify the probabilities of a node’s states given the states of its parent nodes. Figure 1 illustrates a simple BN structure.
For a node Y with parent nodes from X1 to Xn, the CPT specifies probabilities P (Y∣X1, X2, …, Xn) for all combination states of parent nodes. CPTs play a crucial role in Bayesian inference. When new evidence is introduced, the probabilities of all nodes are updated by propagating this information throughout the network. For example, the posterior probability of Y is calculated using
P ( Y X 1 , X 2 , , X n ) = P ( Y ; X 1 , X 2 , , X n ) P ( X 1 , X 2 , , X n )
where P ( Y X 1 , X 2 , , X n ) is derived from the CPTs and the joint probabilities of the parent nodes. In this study, the CPTs were trained using the method of Maximum Likelihood Estimation (MLE). This approach leverages the dataset to estimate the conditional probabilities that maximize the likelihood of the observed data. The choice of MLE for training the CPTs was driven by the method’s simplicity, computational efficiency, and suitability for the large, well-structured Nuclear Power Plant Accident Data (NPPAD) dataset [27]. MLE estimates conditional probabilities by maximizing the likelihood of observed data through frequency counts, as shown in Equation (2). This data-driven approach contributed to the BN’s high predictive accuracy and was compatible with the discretized variables, facilitating the rapid training and inference critical for real-time nuclear safety applications. Alternative methods, such as Bayesian estimation with Dirichlet priors or expectation-maximization (EM) [21], were considered but deemed less suitable. Bayesian estimation requires the specification of prior distributions, introducing a subjectivity and complexity that were unnecessary given the size and coverage of the present dataset, which provided sufficient empirical evidence for parameter estimation. EM, while effective for datasets with significant missing data, was not required, as the marginalization technique (Section 2.3, Equation (4)) robustly handled missing data during inference. However, MLE assumes complete data for frequency counts, which could be a limitation in datasets with an extensive number of missing values. In our study, the comprehensive coverage NPPAD dataset and the marginalization approach mitigated this. Future work could explore hybrid approaches, combining MLE with Bayesian priors. Specifically, for each node X and its parents, the conditional probabilities were calculated as
P ( X = x P a r e n t s ( X ) = p ) = C o u n t ( X = x , P a r e n t s ( X ) = p ) C o u n t P a r e n t s X = p
where Count (⋅) represents the frequency of occurrences in the dataset. This data-driven approach ensures that the CPTs accurately reflect the relationships among variables observed in nuclear accident scenarios.
In this study, the Bayesian Network was constructed to model accident scenarios, predict severity probabilities, and identify critical causal events. Key variables, such as TAVG, PSGA, and LVPZ, were integrated as nodes in the DAG, while their causal relationships formed the edges. The structure of the network was guided by expert knowledge and simulation models, ensuring that the network captured the dynamics of nuclear reactor accidents. Missing-data considerations were seamlessly incorporated into the inference process, enhancing the model’s reliability in real-world applications, a factor which will be discussed in the next section.
The hierarchical BN structure was constructed using expert knowledge, drawing on nuclear safety principles and the physical mechanisms of the LOCA and SLBIC scenarios [23,27]. Experts selected key variables (e.g., TAVG, LVPZ, and WHPI) and defined causal relationships, organizing them into layers (e.g., initial conditions, early dynamics, system response, and accident severity) to reflect accident progression. While this approach ensures physical interpretability and operational relevance, it may introduce subjectivity by prioritizing relationships deemed critical by experts, potentially overlooking statistically significant but less obvious connections. To address this, the structure was validated against the NPPAD dataset [24], ensuring alignment with empirical dynamics, as evidenced by high predictive accuracy. Sensitivity analysis further confirmed the importance of expert-selected variables, mitigating concerns about subjectivity.
A purely data-driven structure-learning approach would derive the DAG from statistical patterns in the dataset. This could uncover novel relationships, such as an association between feedwater flow (WFWA) and reactor building temperature (TRB), However, inherent noisy in real-world data elevates risks of overfitting or spurious edges induction. For example, a data-driven model might include a direct edge between steam flow (WSTA) and coolant volume (VOL), disrupting the physically informed hierarchy. Such changes could simplify layers (e.g., the merging of early dynamics and system response) or complicate the structure with redundant edges, impacting computational efficiency and interpretability. The expert-guided approach, validated empirically, balanced physical fidelity and statistical rigor, ensuring robust, interpretable predictions for real-time nuclear safety. Future work could explore hybrid structure learning to combine expert priors with data-driven insights.

2.3. Analysis Steps of the Bayesian Network

The analysis framework for Bayesian Networks in this study consists of 6 systematic steps, as outlined in Figure 2. These steps guide the process of constructing, training, and applying the Bayesian Network to predict accident severity and identify critical causal events.
Step 1: Data Collection Relative to Accident Severity.
Data from nuclear accident simulations [27], including the Loss of Coolant Accident (LOCA) and the Steam Line Break Inside Containment (SLBIC) scenarios, were collected. Key variables such as TAVG (Reactor Coolant System Temperature), PSGA (Steam Generator A Pressure), and LVPZ (Pressurizer Level) were identified based on their relevance to accident progression.
Step 2: Identification of Top, Intermediate, and Primary Events.
The accident severity was defined as the top event, while intermediate and primary events were identified through expert knowledge and physical analysis, which will be discussed in Section 2.4 in detail. These events form the hierarchical structure of the Bayesian Network, with causal relationships guiding the design network.
Step 3: Normalization and Discretization of Events.
Prior to integration into the Bayesian Network (BN), continuous variables in the Nuclear Power Plant Accident Data (NPPAD) dataset, such as Reactor Coolant System Average Temperature (TAVG), and Pressure in Steam Generator A (PSGA), were normalized and discretized to facilitate probabilistic modeling. Normalization is a critical preprocessing step that standardizes variables to a common scale, mitigating biases from differing measurement units or ranges. This ensures consistent conditional probability estimation in subsequent steps, enhancing the ability to model complex relationships in these scenarios. To facilitate Bayesian inference, the continuous variables are normalized and discretized. The discretization ensures compatibility with the Conditional Probability Tables (CPTs) in the Bayesian Network.
x i d i s c r e t e = r o u n d ( x i x m i n x m a x x m i n · N )
where xi is the original value, xmin and xmax are the range boundaries, and N is the number of discrete levels. In this study, all variables were discretized into 10 levels, reflecting the range of possible system states. This normalization and discretization, applied to all continuous variables in the NPPAD dataset, supports robust Conditional Probability Table (CPT) training (Step 4) and accurate severity predictions (Step 5), as shown in Figure 2.
Step 4: Construction, Training, and Prediction Using the Bayesian Network.
A Directed Acyclic Graph (DAG) is constructed to represent the causal relationships among primary, intermediate, and top events. Expert knowledge determines the hierarchical structure. The Bayesian Network is trained with pre-processed discrete data to derive the Conditional Probability Tables (CPTs). The Conditional Probability Tables (CPTs) were trained using Maximum Likelihood Estimation (MLE) [26] based on the observed dataset, as described in Section 2.2.
Step 5: Severity Prediction and Conditional Probability Inference.
Using the trained Bayesian Network, forward prediction calculates the probabilities of accident severities given observed conditions. Backward diagnosis assesses the posterior probabilities of specific causes based on observed outcomes, providing insights into critical causal events.
Step 6: Estimation of Top Event Considering Missing Data.
This study specifically evaluated the model performance under missing-data conditions by estimating the top event (severity) in scenarios where key variables were partially unavailable. Missing data in the Bayesian framework are handled using marginalization, a process that calculates probabilities by summing over the possible states of the missing variables [25]. For example, if variable Xm is missing, the probability of top outcome Y is computed as
P ( Y ) = X m P Y X 1 , X 2 , X m , X n P ( X m )
where P(Y) is the probability of the accident severity, and the summation is over all possible states of the missing variables. Sensitivity analysis using mutual information (MI) highlighted the most influential variables, ensuring robust predictions even with incomplete data. This ensures that the inference process remains robust, leveraging the conditional independence properties to minimize the impact of incomplete data.
To complement the treatment of missing data, mutual information (MI) [27] was employed to evaluate the importance of the primary and intermediate events relative to the top event (severity). MI quantifies the reduction in uncertainty about one variable given knowledge of another. It is defined as
I ( X ; Y ) = x i X y j Y p ( x i , y i ) lg p ( x i , y i ) p ( x i ) p ( y i )
where p(xi, yi) is the join probability distribution function of X and Y, and p(x) and p(y) are the marginal probability distribution functions of X and Y, respectively. Variables with the highest MI were deemed critical to the progression of accident scenarios, offering actionable insights for safety interventions. By identifying variables with the highest MI values, the model pinpoints the most influential factors in accident progression. This insight is particularly valuable in scenarios with missing data, as it highlights variables that should be prioritized for monitoring and recovery to minimize uncertainty in severity estimation. Mutual information (MI), as defined in Equation (5), quantifies the reduction in uncertainty relative to accident severity given the knowledge of each variable, identifying critical factors influencing the LOCA and SLBIC outcomes. MI quantifies shared information between severity and variables like TAVG, LVPZ, or WHPI, with higher values indicating greater influence. Unlike correlation-based methods, MI captures both linear and nonlinear dependencies without distributional assumptions, making it ideal for complex nuclear accident dynamics. However, relying solely on MI may introduce biases. MI estimates depend on variable discretization, in which coarser or finer levels could under- or overestimate dependencies. MI also lacks causal directionality, potentially overemphasizing correlated but non-causal variables. For instance, steam flow (WSTA) might exhibit high MI due to correlation with severity but may not directly drive outcomes, risking mis-prioritization of interventions. To mitigate these risks, the BN structure was expert-informed, aligning MI results with physical mechanisms. Future work could integrate other approaches, such as variance-based Sobol indices or perturbation analysis, to enhance sensitivity analysis robustness, ensuring reliable identification of critical variables for nuclear safety applications.
The marginalization technique used for missing data computes probabilities by summing over possible states of unobserved variables, leveraging the BN’s structure to maintain accuracy without assuming data distributions. Unlike imputation-based methods (e.g., mean imputation or expectation-maximization [24]), which estimate missing values and risk bias if data are not missing at random, marginalization relies solely on observed data. However, this can be computationally intensive for large networks, and accuracy depends on the BN’s structure and CPTs, mitigated here by expert-informed design and validated data [27]. By integrating these methods, the Bayesian Network offers a comprehensive framework for real-time nuclear accident analysis, capable of handling data uncertainties while maintaining predictive reliability.

2.4. Case Studies

2.4.1. The Bayesian Network Structure for the LOCA

To accurately predict the severity of a Loss of Coolant Accident (LOCA), a hierarchical Bayesian Network (BN) was constructed. The structure of this network is based on the physical mechanisms and dynamic processes involved in the accident, ensuring that the model not only captures complex causal relationships but also reflects the system’s behavior at different stages. In constructing the BN, an analysis of the physical processes underlying a LOCA identified key variables and their interactions at each stage. This approach allowed for the division of the accident progression into several layers, with each layer representing an important phase of the event. By following the physical mechanisms, the BN can more accurately simulate the evolution of the accident and provide a robust foundation for risk assessment. Figure 3 illustrates the Bayesian Network structure for a LOCA, highlighting the causal relationships between variables and the flow of information across layers. Table 1 gives the description of the event nodes for a LOCA.
Layer 1: Initial Conditions
The first layer represents the initial system conditions before the accident occurs. This layer includes directly measured or controlled variables such as the average reactor coolant system temperature (TAVG), the pressures of steam generators A and B (PSGA and PSGB), and the steam flows (WSTA and WSTB). These variables characterize the thermal and hydraulic states of the system and lay the foundation for understanding the accident’s progression. For example, TAVG indicates system thermal performance and directly impacts variables like the thermal hydraulic analyzers (THA and THB), while PSGA and PSGB play crucial roles in maintaining pressure and heat transfer.
Layer 2: Early Dynamics
The second layer captures the early dynamics of the accident. This intermediate layer bridges the initial conditions with the system’s evolving state by focusing on critical parameters such as the liquid levels in steam generators A and B (LSGA and LSGB) and the feedwater flows (WFWA and WFWB). These variables are influenced by the interactions of steam flows and thermal hydraulic changes, providing detailed insights into the accident’s progression. For instance, changes in steam flow rates directly affect feedwater levels, which are vital for maintaining cooling efficiency.
Layer 3: System Response
The third layer reflects the system’s response to the accident by integrating intermediate variables and highlighting critical parameters that dictate the severity of the event. Variables like the pressurizer level (LVPZ), coolant leak rate (WLR), and the flow rates associated with high-pressure injection (WHPI) and the emergency core cooling systems (WECS) are crucial at this stage. These parameters refine the understanding of the accident trajectory and indicate the effectiveness of emergency responses. For example, a low pressurizer level combined with a high coolant leak rate signals a potentially severe situation requiring immediate action.
Layer 4: Accident Severity
The fourth and final layer consolidates all the information from the previous layers into a single node representing accident severity. This node synthesizes the cumulative impact of the variables, providing a comprehensive evaluation of the accident’s consequences. For instance, simultaneous indications of low coolant levels, high leak rates, and diminished emergency flow rates result in a high-severity prediction, prompting decisive action by operators. By aggregating complex data into a single output, this layer enhances the interpretability and usability of the Bayesian Network.
This hierarchical Bayesian Network provides a structured yet flexible framework for analyzing LOCA scenarios. The integration of initial conditions, dynamic changes, and system responses ensures a robust predictive capability, enabling both forward predictions of severity and backward diagnostics which can be used to identify critical causes. The Bayesian Network structure in Figure 3 illustrates the causal relationships and data flow across the layers. This approach not only enhances the accuracy of severity predictions but also supports real-time decision-making, making it a powerful tool for nuclear safety management.

2.4.2. The Bayesian Network Structure for an SLBIC

Steam Line Break Inside Containment (SLBIC) scenarios pose significant challenges due to rapid changes in system dynamics and containment conditions. To address these complexities, a Bayesian Network (BN) was constructed to model SLBIC progression, predict accident severity, and identify critical factors influencing outcomes. The hierarchical structure of the BN, shown in Figure 4, organizes variables into layers, reflecting their causal relationships and temporal evolution. Table 2 gives the description of the event nodes for an SLBIC.
Layer 1: Initial Conditions
The input layer represents the initial conditions of the system, before the accident occurs. These variables include critical parameters such as the average reactor coolant system temperature (TAVG), the flow rates of reactor coolant loops A and B (WRCA and WRCB), and the steam generator pressures (PSGA and PSGB). Additional variables unique to SLBIC scenarios, such as the void fraction in the Reactor Coolant System (VOID) and the temperature of the reactor building (TRB), are also included. These parameters collectively define the system’s baseline state and influence subsequent dynamics.
Layer 2: Intermediate Events
The intermediate layer focuses on thermal and flow dynamics during the early stages of the accident. Variables such as the pressurizer level (LVPZ), steam generator steam flows (WSTA and WSTB), and emergency core cooling system (WECS) flow rates are key indicators of how the system adapts to the accident. For instance, the steam flows from the generators impact turbine loads and downstream systems, while the WECS flow rate plays a critical role in mitigating core damage. This layer bridges the input conditions with the system’s evolving response, capturing the cascading effects of the accident.
Layer 3: Accident Severity
The output layer consists of a single node representing accident severity. This node synthesizes information from the intermediate layer to provide an overall evaluation of the accident’s impact. For instance, a combination of reduced pressurizer levels, elevated containment temperature (TRB), and increased void fraction (VOID) signals a high-severity scenario. By integrating multiple risk indicators, this layer simplifies the assessment of complex accident dynamics, aiding operators in making informed decisions.
Figure 4 illustrates the Bayesian Network structure for the SLBIC, showcasing the causal relationships between variables and the hierarchical flow of information. This model enables forward predictions to evaluate the likelihood of various severity levels and backward diagnoses which can be used to identify critical contributing factors. By dynamically updating probabilities with new evidence, the Bayesian Network offers a powerful tool for real-time analysis and decision-making in SLBIC scenarios, enhancing nuclear plant safety and operational resilience.

3. Results and Discussion

This section evaluates the performance of the Bayesian Network models developed for predicting the severity of nuclear accidents, focusing on the Loss of Coolant Accident (LOCA) and Steam Line Break Inside Containment (SLBIC) scenarios. The results include determinations of model accuracy, error analysis under varying conditions, sensitivity analysis, and critical event identification.

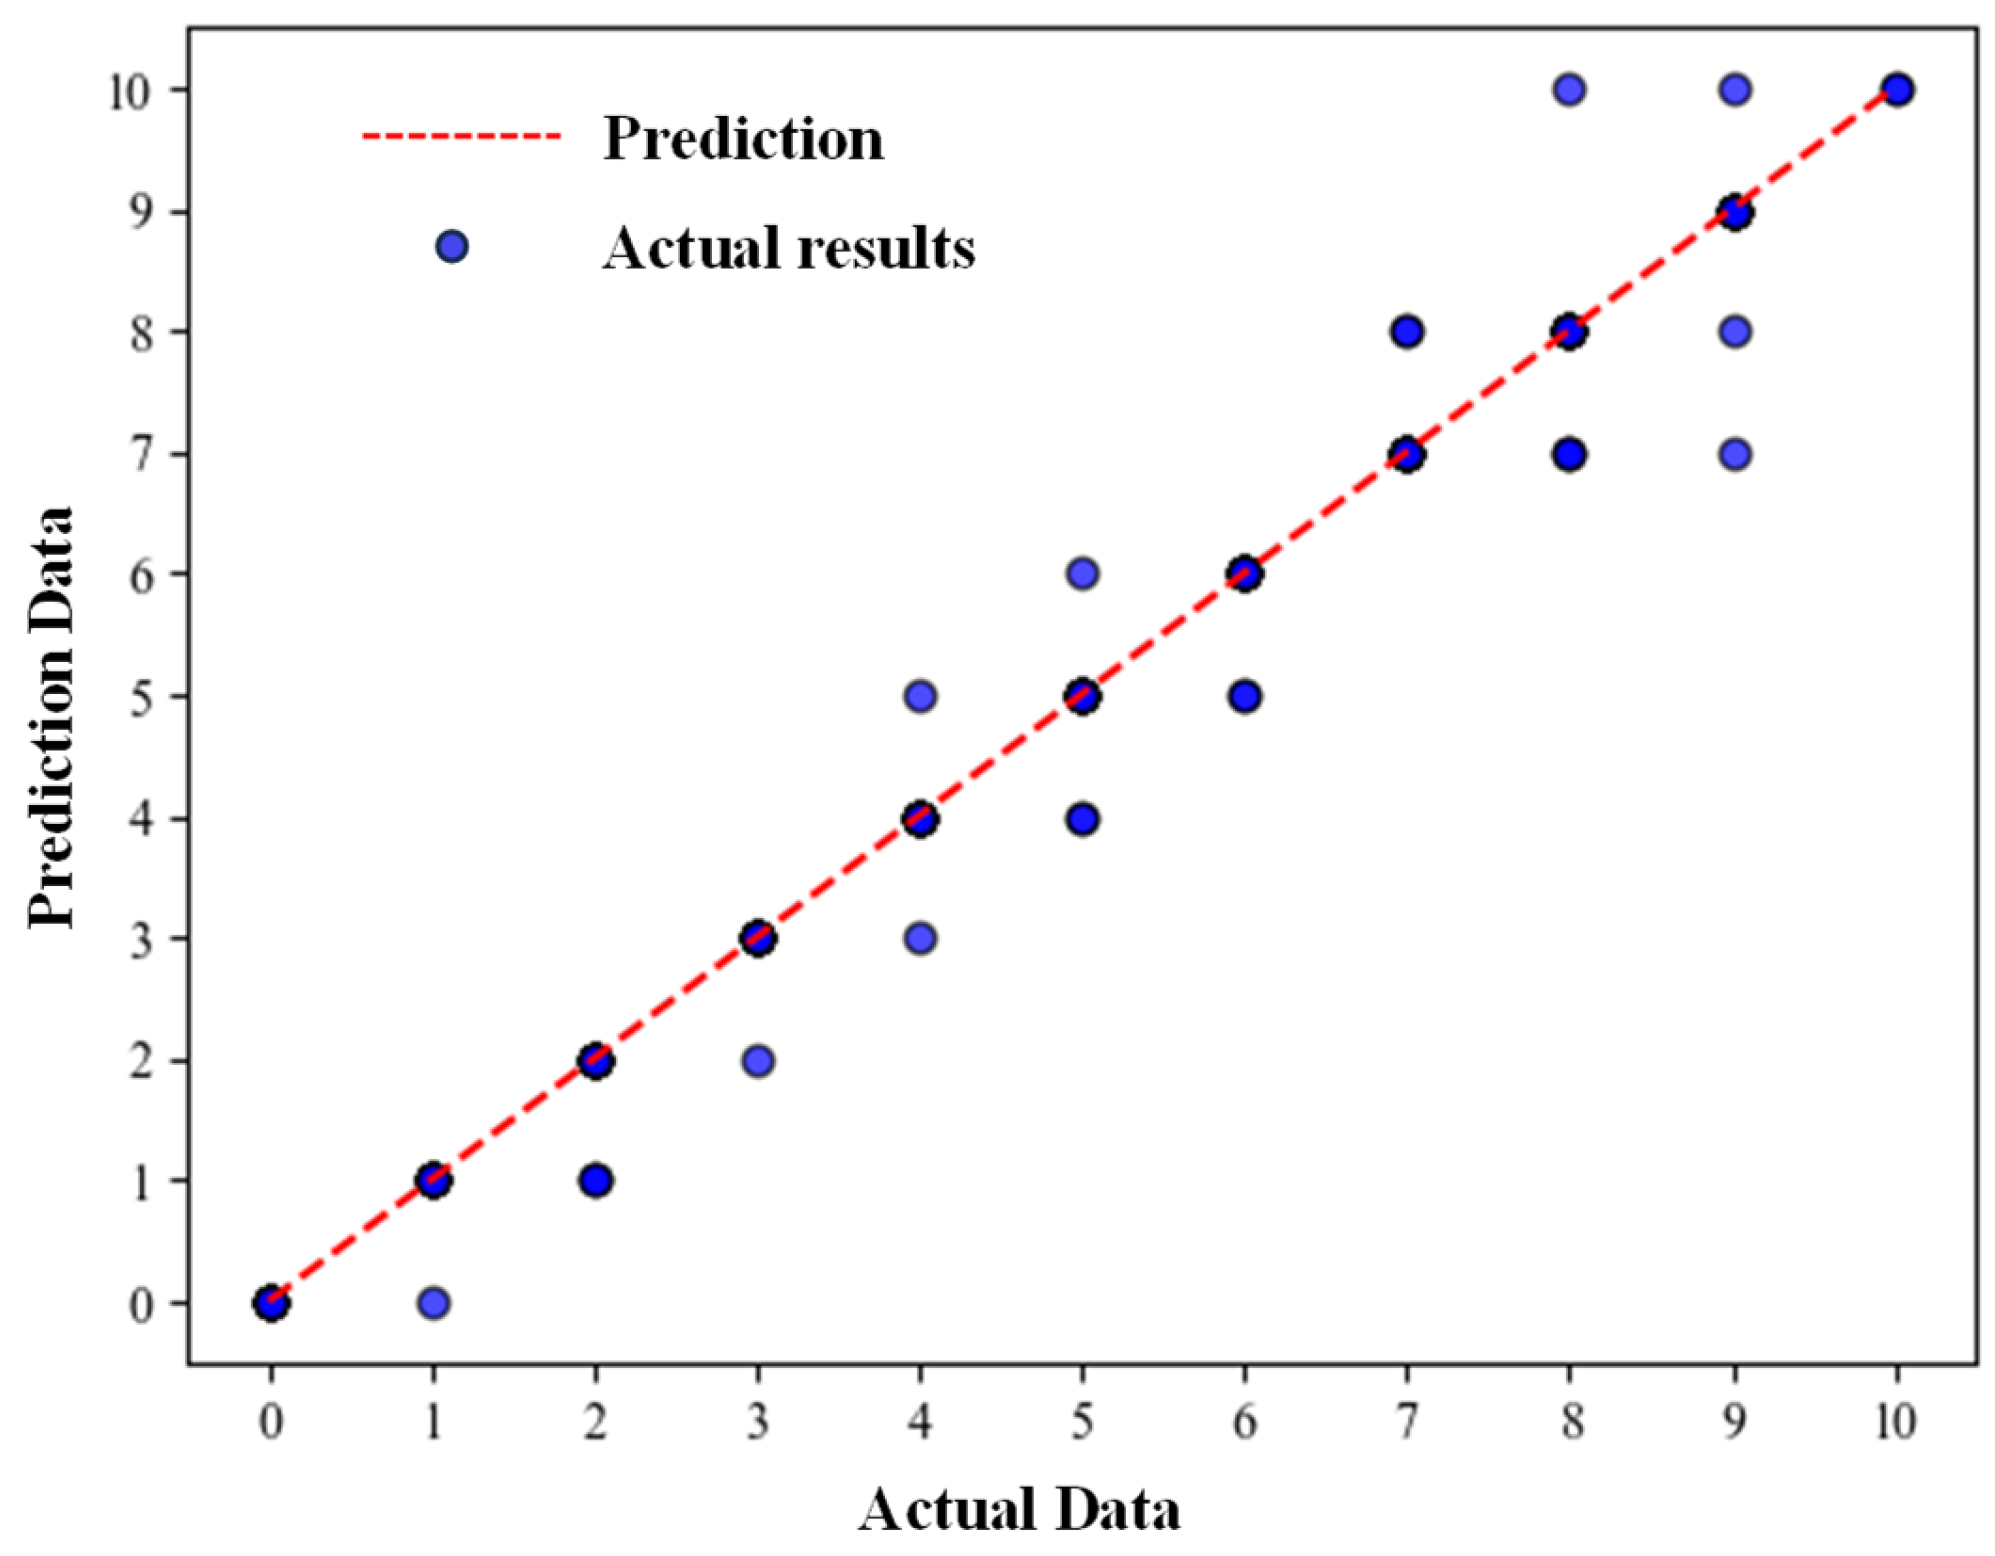
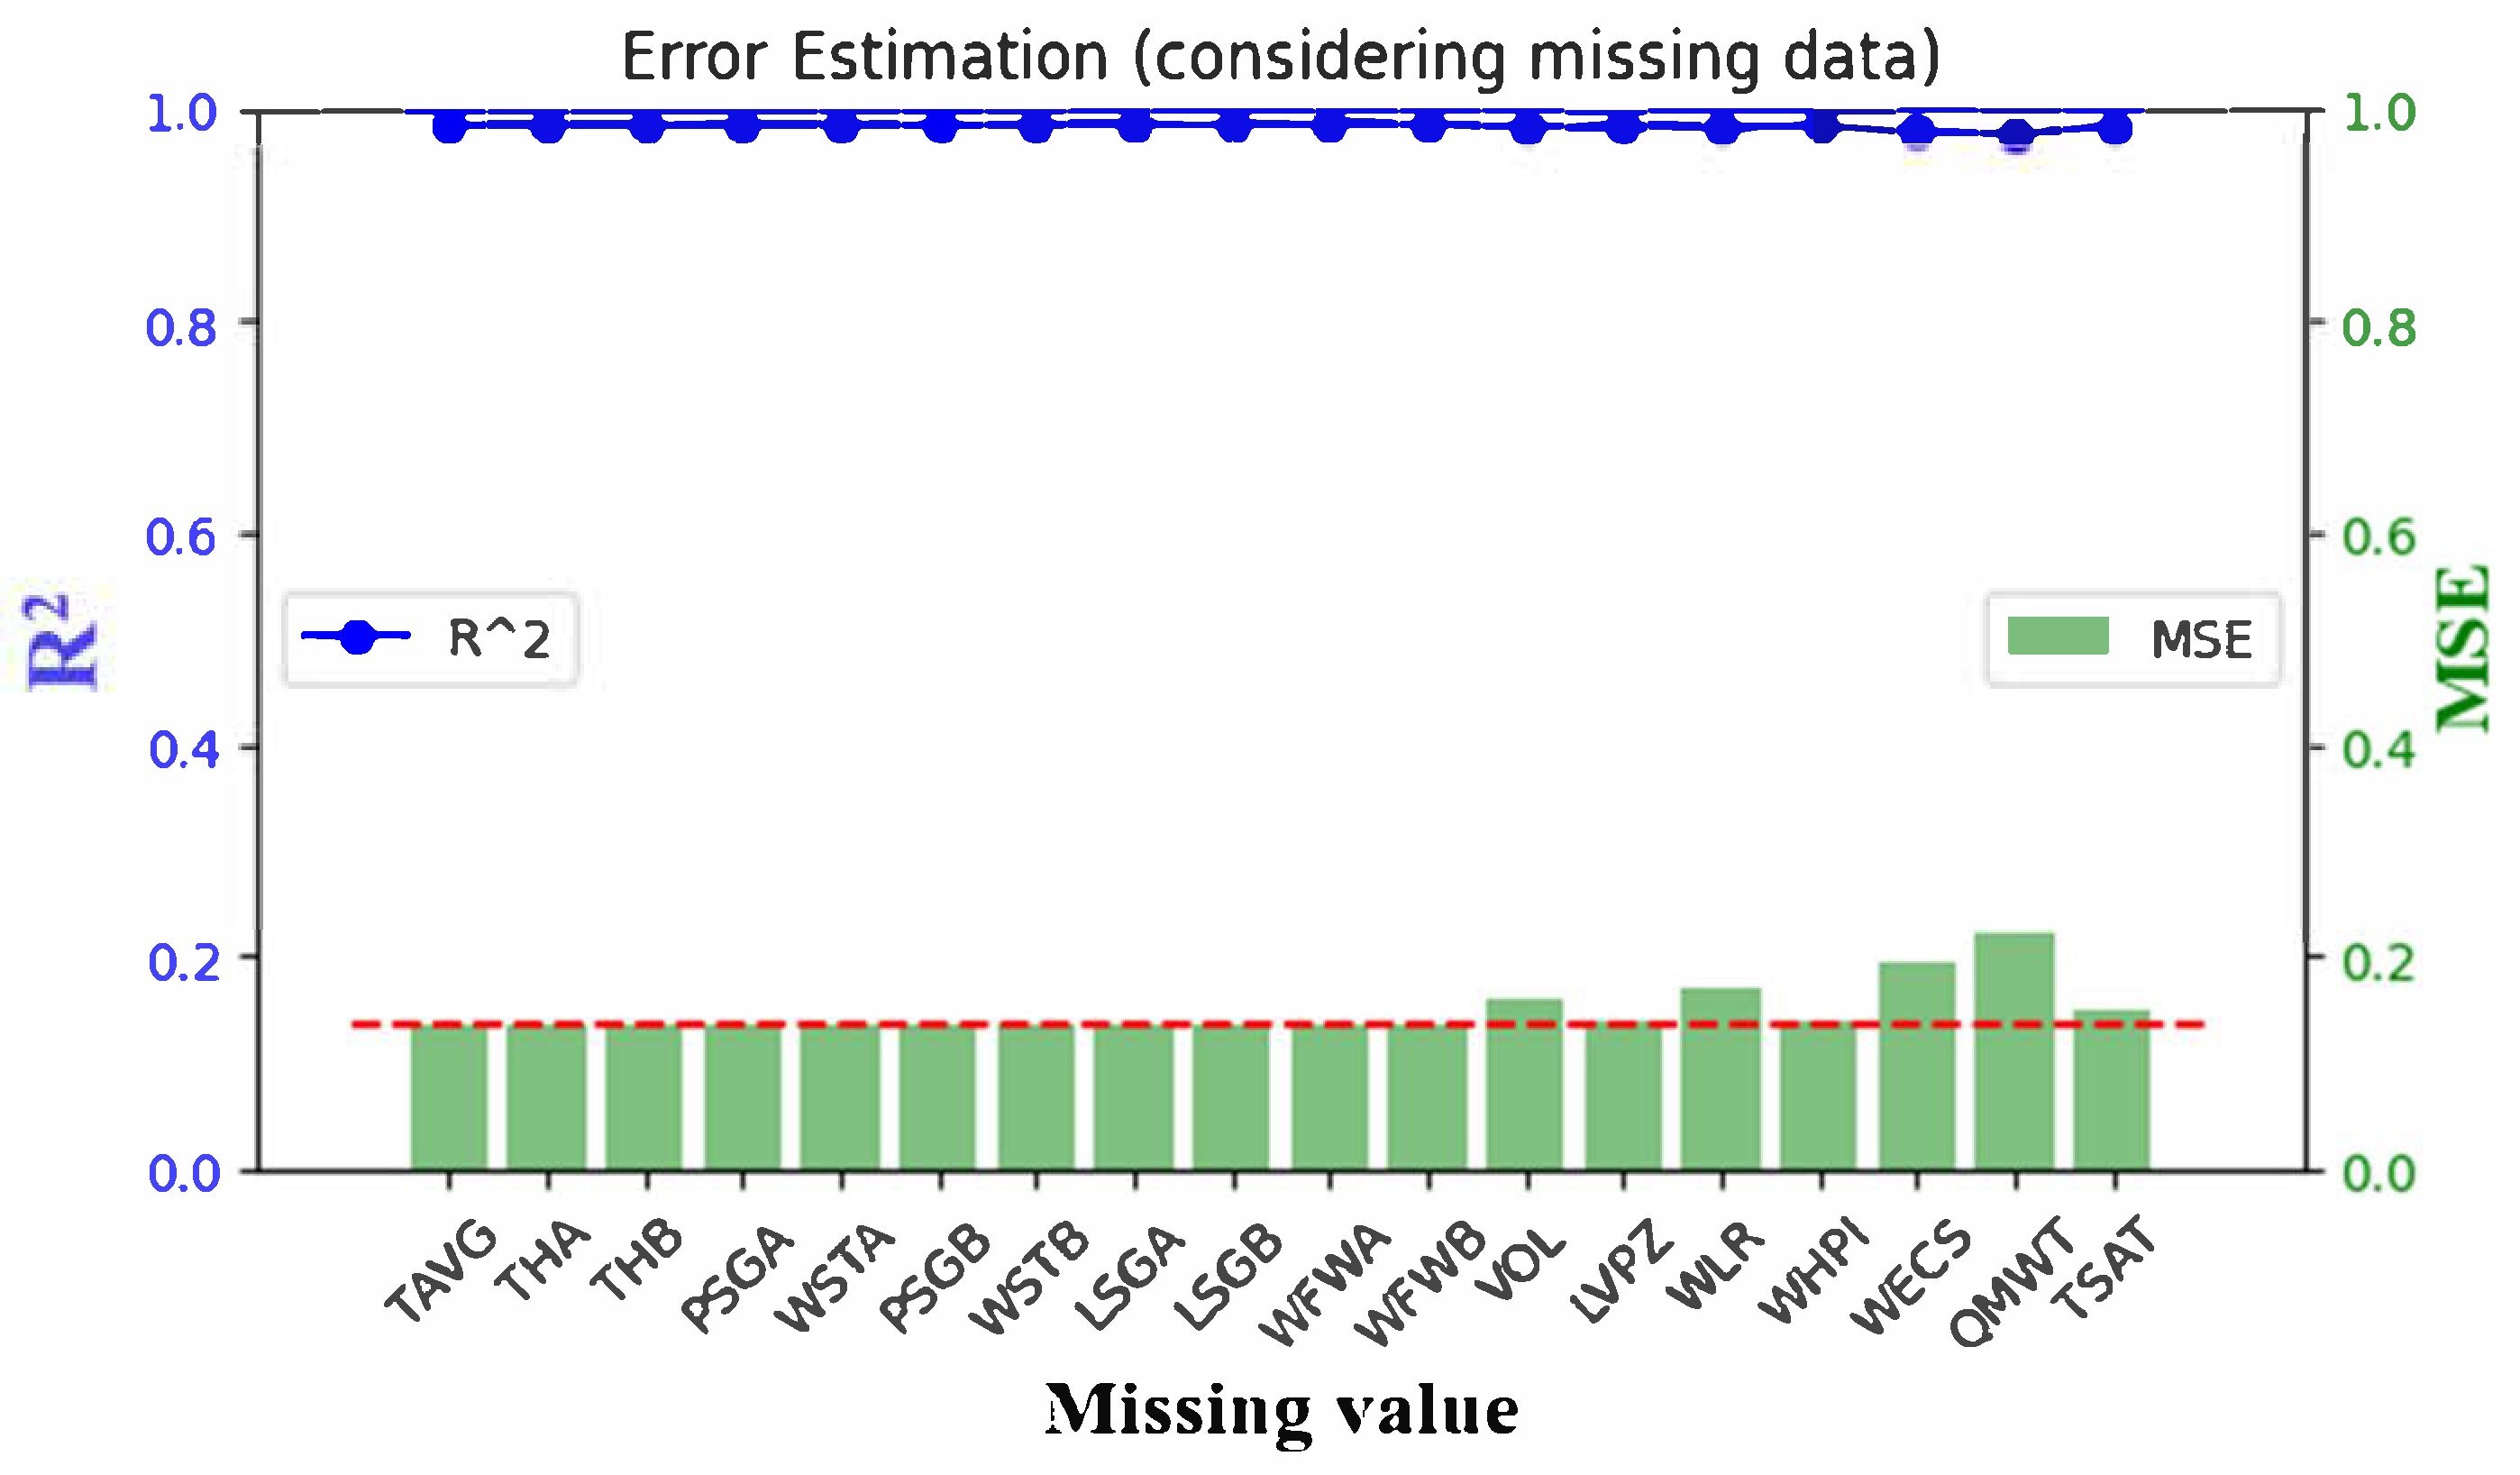
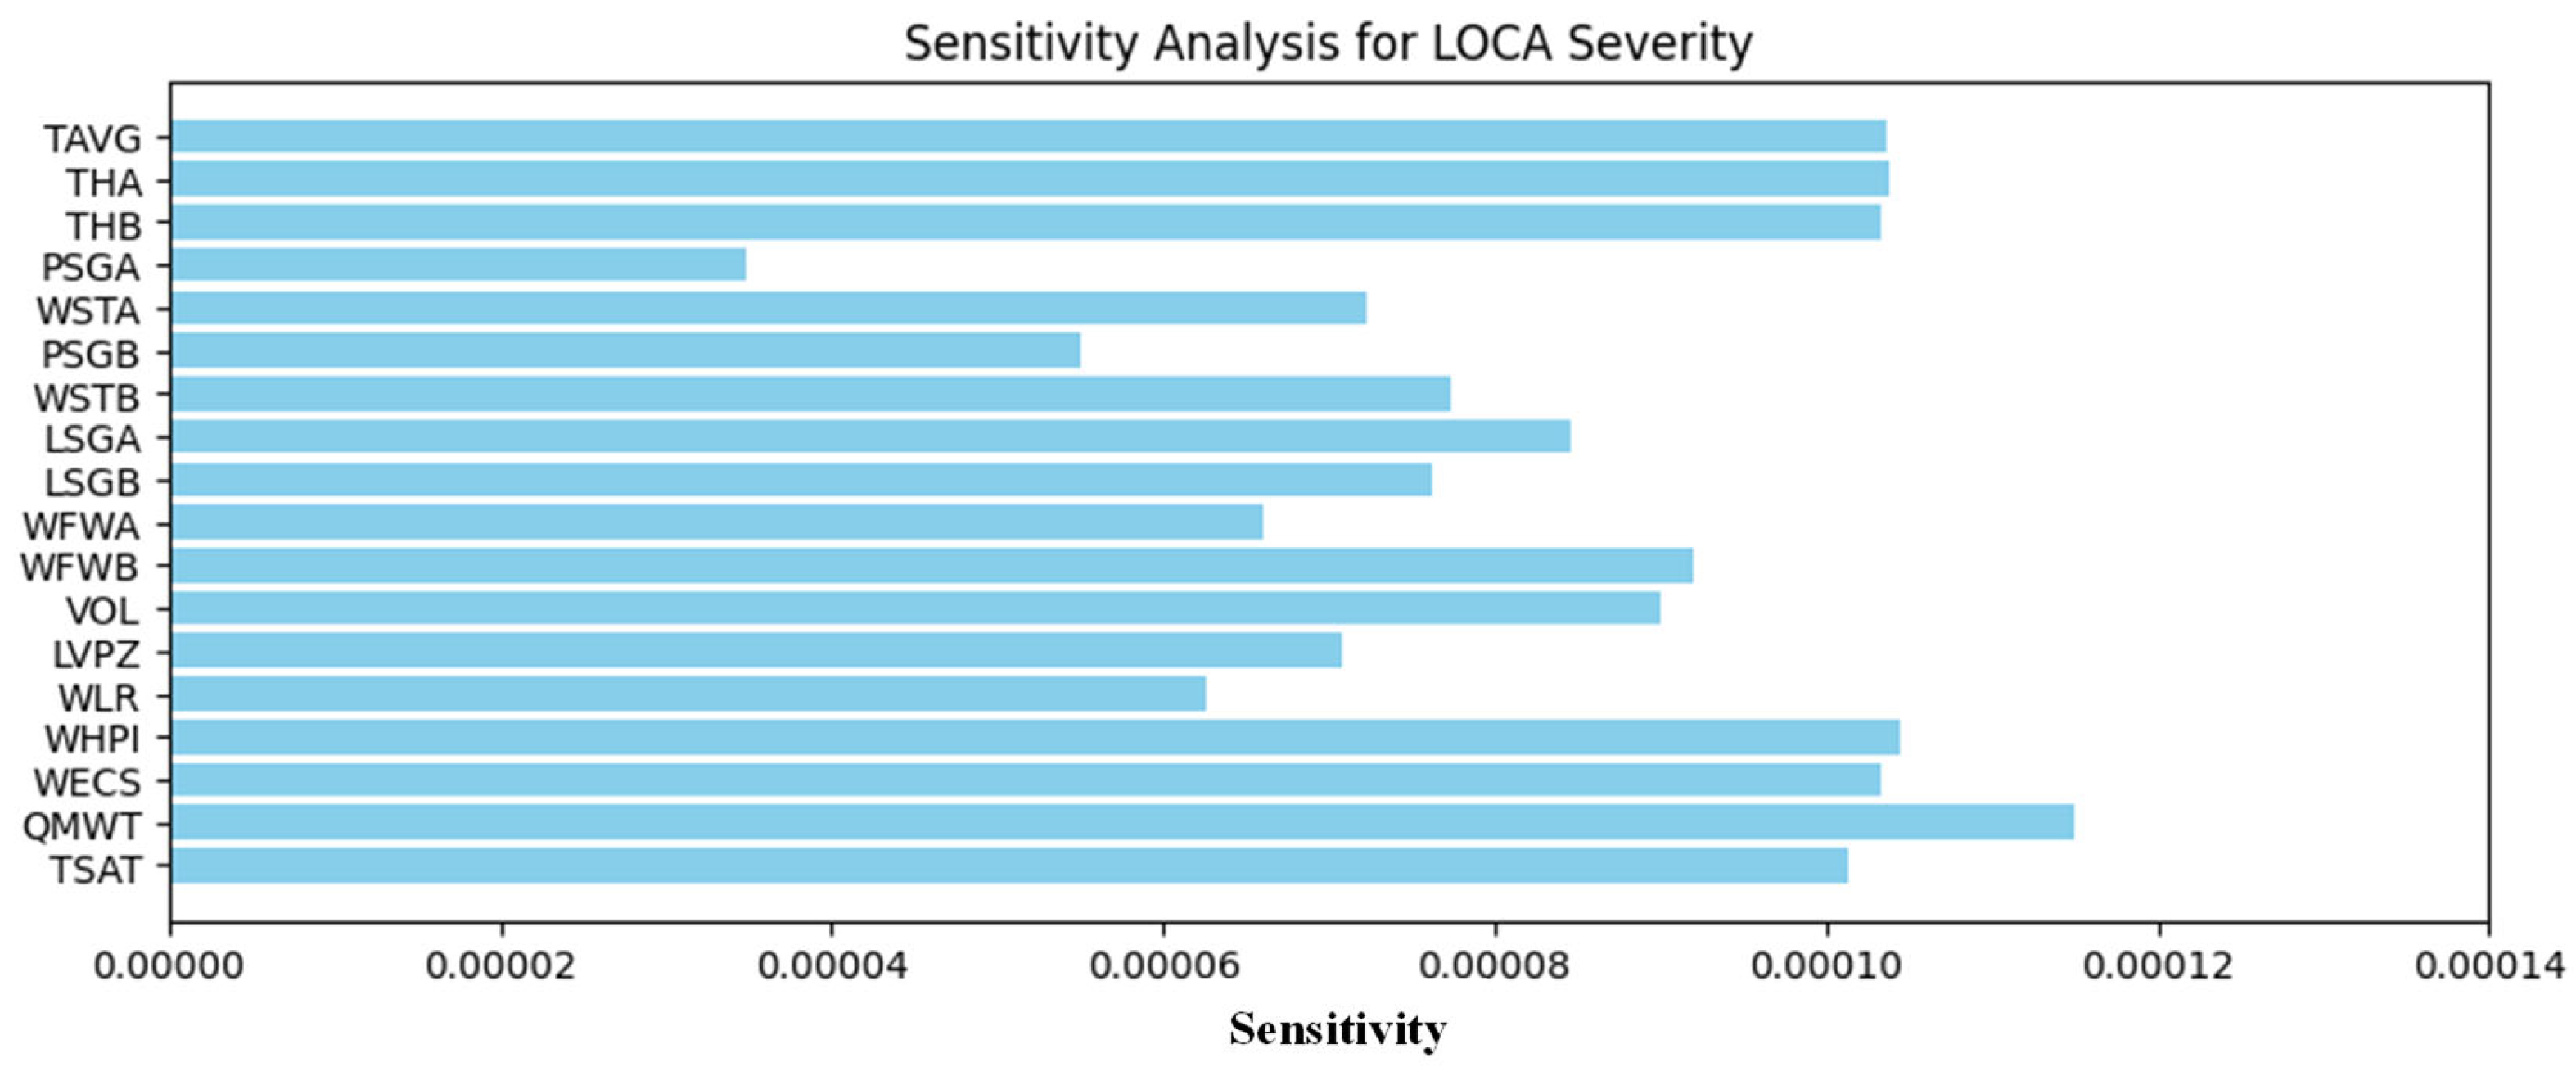
3.1. Results for the LOCA

(1) Model Performance
The predictive performance of the Bayesian Network (BN) for the LOCA is illustrated in Figure 5, which shows a scatter plot of predicted vs. actual severity. The red dashed line, labeled as “prediction” in the figure, represents the identity line, at which the predicted severity values equal the actual values (y = x). Points closely aligned with this line indicate high predictive accuracy, as evidenced by the R2 value of 0.98. This tight alignment, validated using the Nuclear Power Plant Accident Data (NPPAD) dataset [27], demonstrates the BN’s ability to accurately predict LOCA severity across a range of scenarios, supporting its utility in real-time nuclear safety applications.
The Bayesian Network (BN) demonstrated high predictive accuracy for accident severity in the LOCA (R2 = 0.98, Figure 5), with scatter plots showing a tight alignment of predicted vs. actual severity along the identity line. However, a slight underprediction bias is observed for some data points, in which predicted results are marginally lower than actual values. This bias may arise from several factors. First, the discretization of continuous variables (e.g., TAVG, and LVPZ) into 10 levels, as described in Step 3 (Section 2.3, Equation (3)), may smooth extreme values, leading to conservative probability estimates being associated with high-severity events. Second, MLE used for CPT training (Section 2.2) relies on frequency counts from the NPPAD dataset, which may underrepresent rare, catastrophic scenarios, skewing predictions toward lower severities. Finally, the BN structure, guided by expert knowledge, may prioritize common causal pathways over less frequent but severe ones, limiting the model’s sensitivity to extreme cases.
The implications of underprediction are minor given the high R2 values, indicating robust overall performance. However, in nuclear safety, underpredicting severity could delay critical interventions, such as the activation of emergency cooling systems, necessitating caution in operational contexts. To mitigate this bias, future work could employ finer discretization and hybrid CPT training combining MLE with Bayesian priors to better capture rare events. These strategies would enhance the sensitivity of BN to extreme scenarios.
(2) Robustness under Missing Data
The impact of missing data on Bayesian Network (BN) predictions for the LOCA is illustrated in Figure 6, which presents 18 subgraphs comparing predicted vs. actual severity probabilities when data from any single one of the 18 event nodes (e.g., High-Pressure Injection Flow, WHPI; Mass Flow Rate in Main Steam Line, QMWT; Emergency Core-Cooling System Flow Rate, WECS) are missing. As illustrated in Figure 6, predictions remained consistent, with only a slight decrease in accuracy.
Notably, 15 of these subgraphs appear to be nearly identical, indicating that the missing data for those variables (e.g., THA, THB, and TAVG) have minimal impacts on prediction accuracy. This similarity arises from the BN marginalization technique (Section 2.3, Step 6, Equation (4)), which compensates for missing data by summing over correlated states of variables in the NPPAD dataset. For instance, THA and THB, both measuring core thermal conditions, share similar dependencies, allowing the BN to maintain its accuracy when either is missing. In contrast, the subgraphs for QMWT, WECS, and WLR show significant deviations, reflecting their critical influence on LOCA severity. These variables, identified as highly influential via sensitivity analysis (mutual information, MI, Equation (5)), drive prediction outcomes due to their direct roles in coolant loss and emergency response. The similarity among 15 subgraphs thus demonstrates the BN’s robustness to missing data for less critical variables, as validated by minimal discrepancies in Figure 7, while the three distinct subgraphs highlight variables which are key in safety interventions. Retaining the comprehensive format of Figure 6 ensures all impacts of variables are shown, with this discussion clarifying the observed similarities and differences. Future work could explore visualizations focusing on QMWT, WECS, and WLR to further emphasize their unique contributions.
Error analysis results, shown in Figure 7, quantify the impact of missing data on model performance. The left y-axis represents the R2 values, while the right y-axis depicts the Mean Squared Error (MSE). In most cases, the predicted outcomes under missing-data conditions were closely aligned with values obtained without the missing data. However, variables such as WLR (Reactor Coolant System Leak Rate), WECS (Emergency Core-Cooling System Flow Rate), and QMWT (Total Reactor Thermal Power) exhibited slightly higher discrepancies. Nonetheless, these differences were minimal, demonstrating the model’s resilience to incomplete data.
The higher discrepancies observed for WLR and WECS in Figure 7 likely stem from their critical roles in LOCA progression and their complex dependencies within the BN. WLR, which quantifies coolant loss, exhibits high variability, amplifying uncertainty when missing, while WECS, governing emergency cooling, depends on multiple system states (e.g., pump availability), increasing error under data absence. To mitigate these discrepancies, several steps can be implemented. First, enhancing data quality by increasing the sampling frequency of WLR and WECS in the NPPAD dataset [27] would provide richer training data, improving Conditional Probability Table (CPT) accuracy. Second, deploying redundant sensors for these variables in nuclear power plants could reduce the likelihood of missing data, ensuring continuous monitoring during emergencies. Conducting targeted sensitivity analysis on WLR and WECS interactions could identify specific conditions (e.g., high leak rates) in which errors are pronounced, enabling tailored model adjustments. These steps leverage the BN’s flexibility in order to enhance robustness, particularly for critical variables like WLR and WECS, which significantly influence LOCA severity. Future work could explore these strategies to optimize the BN for real-time nuclear safety applications.
(3) Sensitivity Analysis and Critical Variable Identification
Sensitivity analysis using mutual information (MI) highlighted the variables which are most influential in determining accident severity. As shown in Figure 8, variables such as TAVG (average reactor coolant system temperature), THA and THB (thermal hydraulic analyzers A and B), WHPI (high-pressure injection flow rate), WECS, and TSAT (pressurizer saturation temperature) had the highest mutual information with the severity node. This highlights their pivotal roles in the progression of LOCA scenarios.
The LVPZ shows an anomalously low MI value, suggesting a minimal direct influence on severity predictions. The low MI for LVPZ likely arises from its high correlation with variables like WHPI and WECS, which capture overlapping coolant dynamics, reducing the unique contribution of LVPZ to severity in the NPPAD dataset. The BN structure (Section 2.2) positions LVPZ as an intermediate node, with its influence mediated by other variables, further lowering its direct MI. The low MI may underprioritize LVPZ in safety interventions, potentially overlooking its importance in extreme scenarios. Future work could use finer discretization or alternative sensitivity metrics to better capture the influence of LVPZ.
Figure 9 further illustrates the correlation between severity and key event nodes, providing insights into causal dependencies within the Bayesian Network. The results showed that TAVG, THA, THB, WHPI, WECS, QMWT, and TSAT have the highest correlations with the top events in the results, confirming the significance of these variables in driving accident outcomes.
The results demonstrate the effectiveness of our method in predicting LOCA severity and handling incomplete data. The identification of critical variables provides actionable insights for the improvement of reactor safety protocols. For example, ensuring reliable monitoring of WHPI and WECS can significantly enhance the early detection and mitigation of severe LOCA scenarios. By combining high predictive accuracy, robustness to missing data, and detailed sensitivity analysis, this model offers a powerful tool for real-time nuclear safety management.

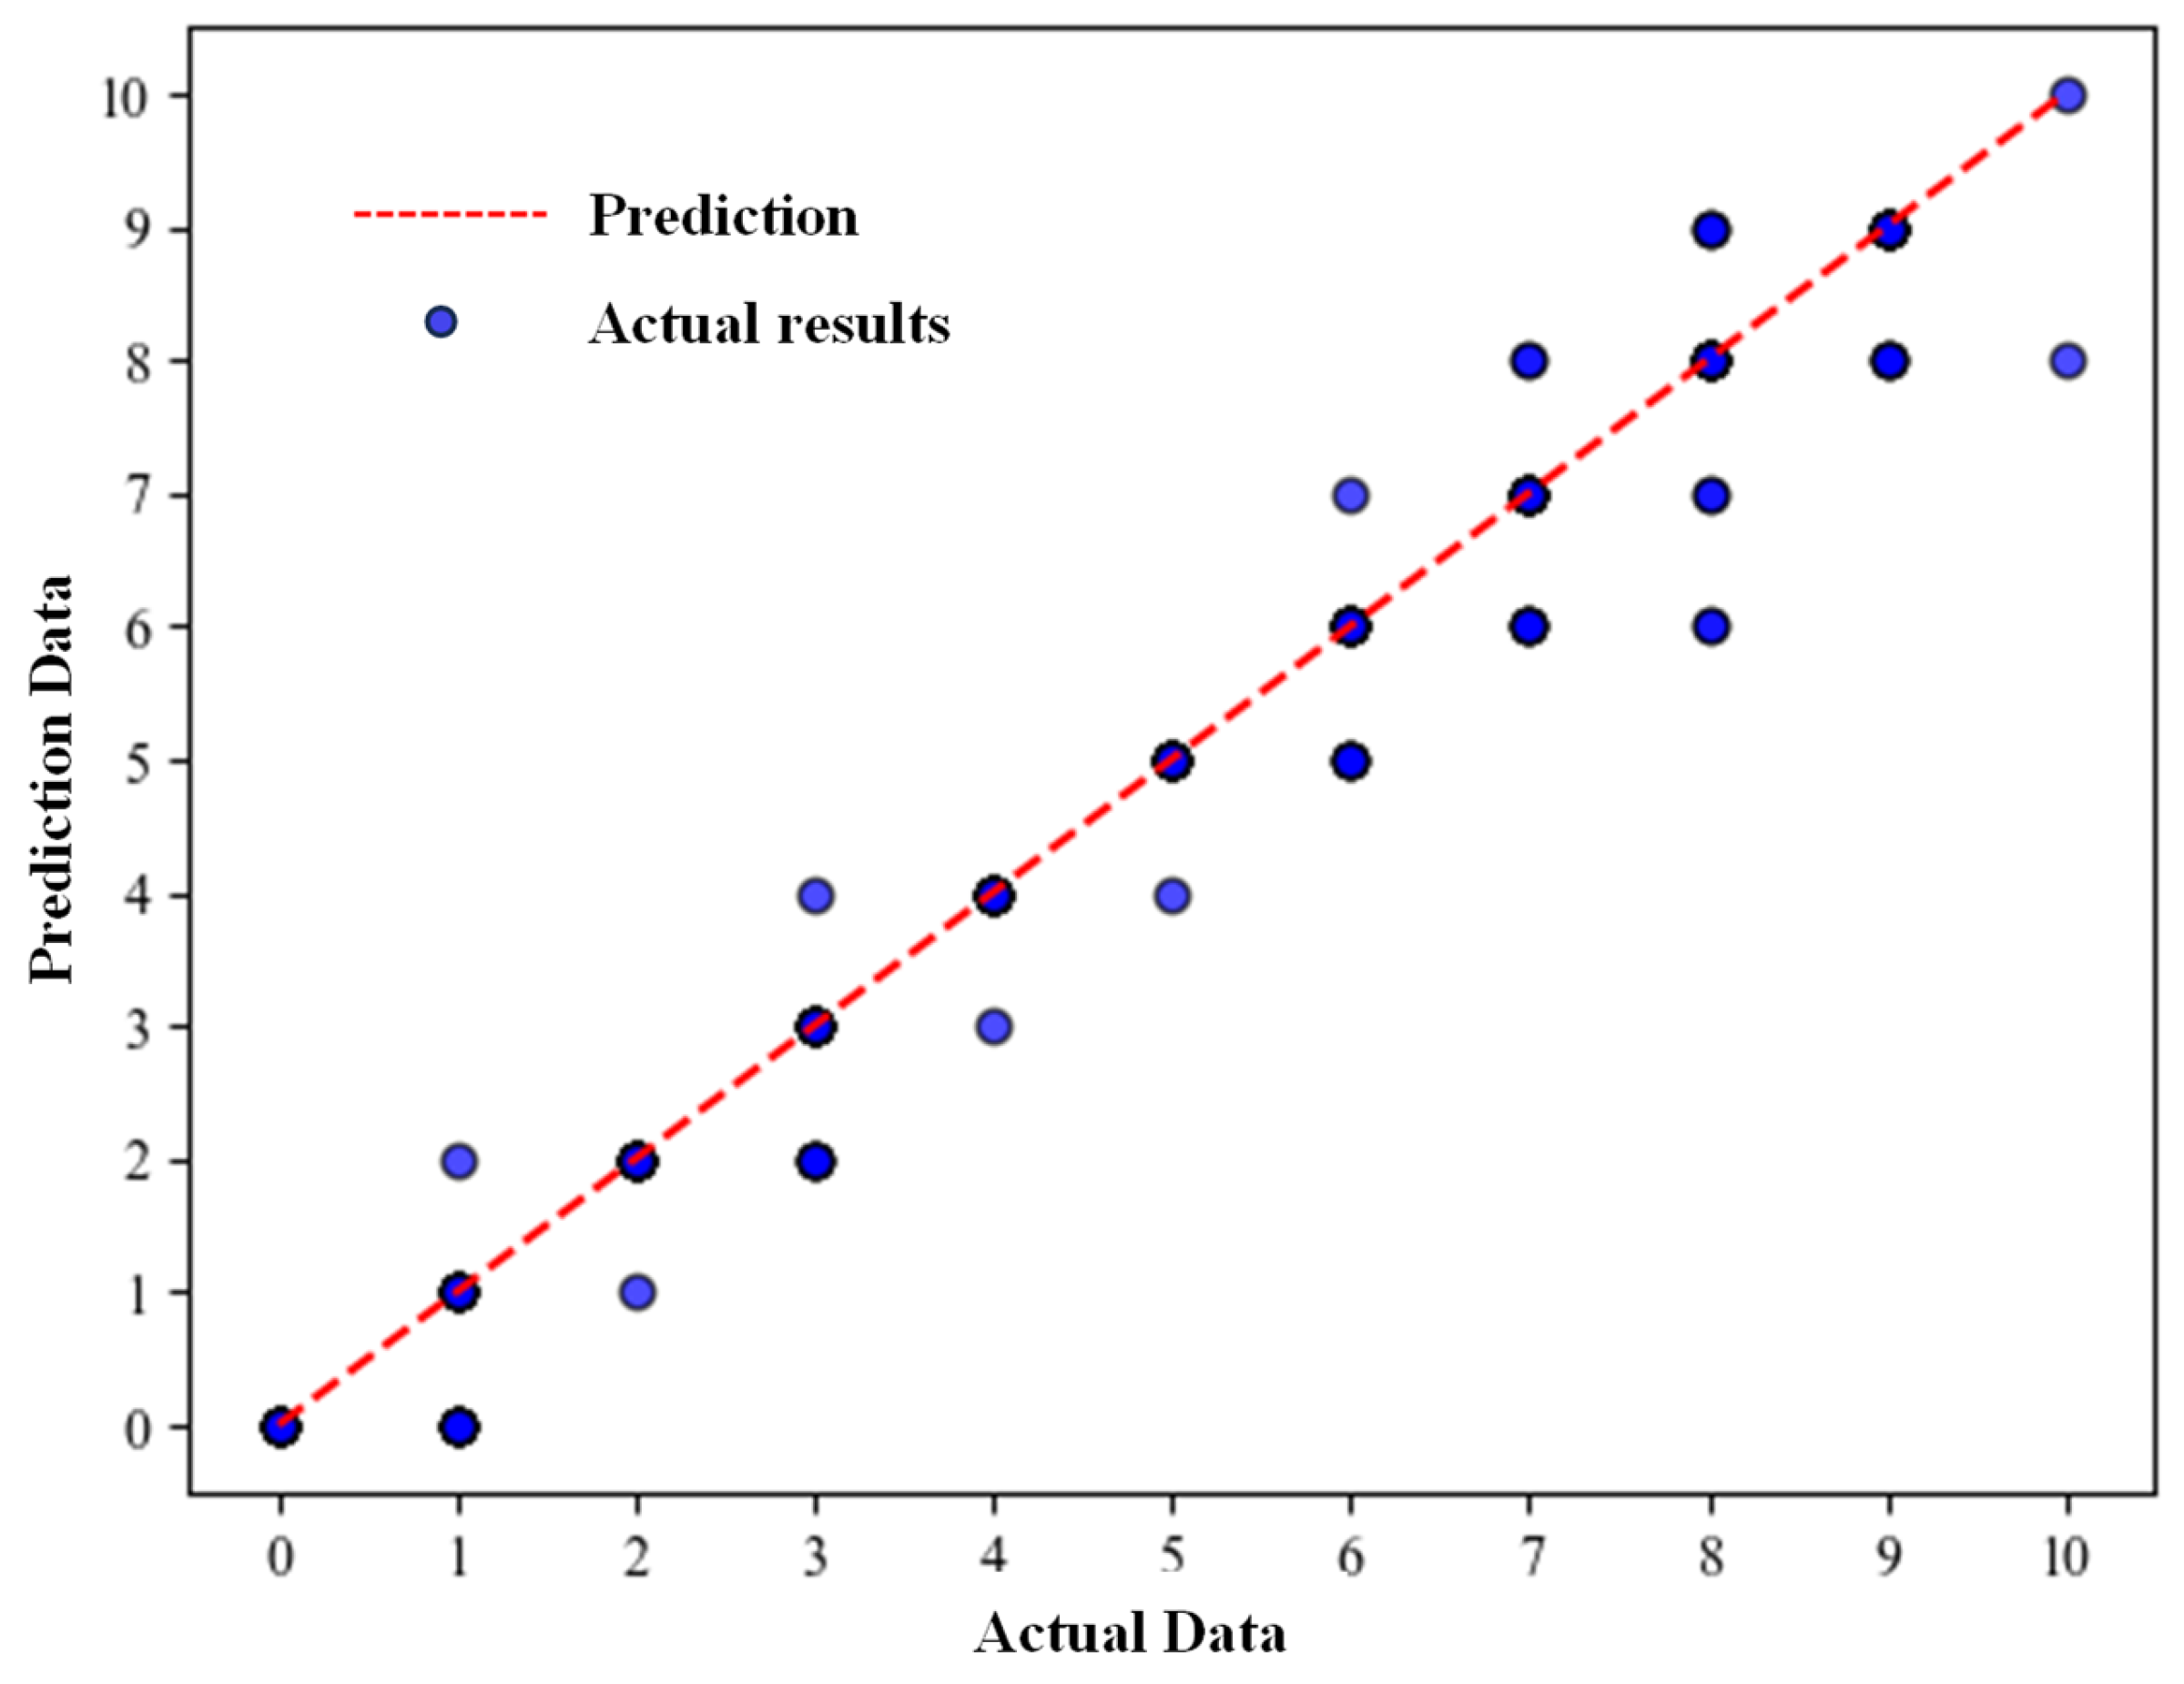
3.2. Results for the SLBIC

(1) Model Performance
For the SLBIC, Figure 10 presents a scatter plot of predicted vs. actual severity probabilities. The red dashed line, labeled as “prediction” in the figure, represents the identity line, at which the predicted severity probabilities equal the actual values (y = x). The tight clustering of points around this line indicates robust performance, with an R2 value of 0.96. This clustering, validated using the Nuclear Power Plant Accident Data (NPPAD) dataset, underscores the BN reliability in predicting SLBIC severity under varying conditions, enhancing its applicability in nuclear safety management.
(2) Robustness under Missing Data
To assess robustness, the model was evaluated under missing-data conditions. Figure 11 illustrates the comparison between predicted and actual results with various missing-data scenarios. Despite minor discrepancies, the model maintained consistent performance. Most subgraphs appear nearly identical, indicating that missing data for those variables have minimal impacts on prediction accuracy. This similarity results from the BN marginalization technique (Section 2.3, Step 6, Equation (4)), which compensates for missing data by leveraging correlated variables in the NPPAD dataset, maintaining high accuracy. The subgraphs for critical variables show distinct patterns, reflecting their significant influence on SLBIC severity, a determination which will be confirmed by sensitivity analysis in Figure 13.
Figure 12 provides an error analysis. For most missing-data scenarios, the model predictions were comparable to those with complete data. Exceptions, such as LVPZ, WSTA and WSTB, showed slightly reduced accuracy. However, these differences were minimal, further validating the model’s resilience.
(3) Sensitivity Analysis and Critical Variable Identification
Sensitivity analysis using mutual information (MI) identified key variables influencing SLBIC severity. As shown in Figure 13, LVPZ (pressurizer level) and WSTA (steam flow from Steam Generator A) exhibited the highest MI values, indicating their significant roles in accident progression.
Figure 14 corroborates these results, showing strong correlations between severity and these critical variables. Monitoring these variables in real time can significantly improve safety outcomes by enabling the early detection and mitigation of severe scenarios. The findings demonstrate the ability of the Bayesian Network to accurately predict SLBIC severity and handle incomplete data. The identification of critical variables provides actionable insights for the enhancement of reactor safety. For example, ensuring the reliable monitoring of LVPZ and WSTA can mitigate the impacts of severe SLBIC events.
These results demonstrate the Bayesian Network’s effectiveness in predicting SLBIC severity and identifying key factors that influence accident outcomes. The identified critical variables, such as LVPZ and WSTA, provide valuable insights for the improvement of safety measures. For example, ensuring the functionality of emergency core-cooling systems and maintaining pressurizer saturation levels are crucial for mitigating the impacts of SLBIC events. This robust framework offers a reliable tool for nuclear safety assessment and real-time decision-making during containment-related accidents.
The Bayesian Network (BN) framework offers distinct advantages over machine learning models, such as neural networks, for nuclear accident prediction. Neural networks excels at recognizing and capturing complex patterns in large datasets. However, the probabilistic structure of a BN, with explicit causal relationships defined by Conditional Probability Tables (CPTs), provides superior interpretability. For instance, operators can trace how variables like high-pressure injection (WHPI) or pressurizer level (LVPZ) influence severity, enabling actionable interventions during LOCA or SLBIC emergencies. Neural networks, despite their predictive power, often act as “black boxes,” obscuring decision pathways, which is a significant drawback in nuclear safety, in which transparency is critical. In terms of computational efficiency, the use of marginalization and pre-trained CPTs enables rapid inference, which is ideal for real-time applications in resource-constrained environments like nuclear control rooms. Neural networks, conversely, require substantial computational resources for training and may be slower for inference, particularly with large architectures. The resilience of a BN to missing data, achieved through marginalization, further enhances its utility in emergencies, in which sensor failures are common, whereas neural networks typically rely on complete datasets or imputation, risking bias. While neural networks may outperform BNs in scenarios with massive datasets or complex pattern recognition tasks (e.g., image-based diagnostics), their data demands and lack of interpretability limit their suitability for real-time nuclear safety management. Future work could explore hybrid models combining the interpretability of a BN with pattern recognition capabilities of neural networks to further enhance performance.

4. Conclusions

This study developed a Bayesian Network framework to predict the severity of nuclear reactor accidents, with a focus on Loss of Coolant Accident (LOCA) and Steam Line Break Inside Containment (SLBIC) scenarios. The model demonstrated strong predictive accuracy, achieving R2 values of 0.98 and 0.96 for the LOCA and SLBIC, respectively, highlighting its ability to capture the complex causal relationships underlying accident progression. By minimizing the risk of energy supply disruptions and costly accidents, this work supports nuclear power’s role as a sustainable energy source.
A key feature of this work is its robustness under missing-data conditions. By leveraging the marginalization process inherent in the Bayesian framework, the model accurately estimated severity even when critical variables were partially unavailable. Sensitivity analysis using mutual information further identified key variables—such as WHPI, WECS, LVPZ, and WSTA—that drive accident outcomes and energy system stability. These insights guide resource prioritization, strengthening energy safety protocols.
The hierarchical structure of the Bayesian Network, coupled with its ability to integrate expert knowledge and physical process, ensures its applicability in real-time nuclear safety management. It enables both forward predictions of severity and backward diagnostics which can be used to pinpoint failure causes, enhancing decision-making in nuclear energy management. The ability of this framework to handle missing data and identify key variables marks a significant advancement in nuclear energy safety, fostering resilience in uncertain conditions.
The BN framework enhances real-time decision-making in nuclear power plants during emergencies like the LOCA and SLBIC. Its rapid severity predictions, which are robust, even with missing data, enable operators to prioritize interventions, such as the optimization of high-pressure injection (WHPI) or monitoring pressurizer levels (LVPZ). Sensitivity analysis highlights critical variables, guiding resource allocation and improving emergency response efficiency. The BN’s 10-level discretization and expert-defined structure may smooth extreme values and miss rare interactions, while the NPPAD dataset may underrepresent high-severity events. Future work will include finer discretization, hybrid CPT training, and dataset augmentation. Applying the BN to other accidents could broaden its utility, enhancing nuclear safety across diverse scenarios.
In conclusion, this research underscores potential of Bayesian Networks to elevate nuclear energy safety and reliability. By delivering precise severity predictions and actionable insights, it contributes to the sustainable operation of nuclear power plants, which are vital for meeting global energy demands. The methodology’s adaptability suggests future applications in other energy systems, paving the way for broader energy-sector resilience.

Author Contributions

Conceptualization, K.L. and L.C.; methodology, X.C.; software, C.X.; validation, Y.L. and S.L.; formal analysis, W.W.; investigation, L.J. and K.L.; resources, G.W.; data curation, K.L.; writing—original draft preparation, K.L.; writing—review and editing, G.W.; visualization, L.J.; supervision, L.J.; project administration, G.W.; funding acquisition, G.W. All authors have read and agreed to the published version of the manuscript.

Funding

This research was funded by National Natural Science Foundation of China (Grant No. 12405360), Natural Science Foundation of Top Talent of SZTU (Grant No. GDRC202407), Shenzhen Science and Technology Program (Grant No. KCXFZ20240903092603005), Shenzhen Science and Technology Program (Grant No. KJZD20230923114117032), Shenzhen Science and Technology Program (Grant No. JCYJ20241202124703004), and Guangdong Province Key Construction Discipline Scientific Research Capacity Improvement Project (Grant No. 2022ZDJS114). The APC was funded by National Natural Science Foundation of China (Grant No. 12405360).

Data Availability Statement

Data available on request from the authors.

Conflicts of Interest

The authors declare no conflict of interest.

References

  1. Na, M.G.; Shin, S.H.; Lee, S.M.; Jung, D.W.; Kim, S.P.; Jeong, J.H.; Lee, B.C. Prediction of major transient scenarios for severe accidents of nuclear power plants. IEEE Trans. Nucl. Sci. 2004, 51, 313–321. [Google Scholar] [CrossRef]
  2. Sun, J.; Shi, X.; Lin, S.; Wang, H. Research on hydrogen risk prediction in probability safety analysis for severe accidents of nuclear power plants. Nucl. Eng. Des. 2024, 417, 112798. [Google Scholar] [CrossRef]
  3. Chabook, M.; Tashakor, S. Design of emergency solar energy system adjacent the nuclear power plant to prevent nuclear accidents and increase safety. Microelectron. J. 2024, 3, 100092. [Google Scholar] [CrossRef]
  4. Alhamadi, F.; An, B.; Yi, Y.; Alameri, S.A.; Choi, D. Evaluation of high-temperature oxidation behaviour of ATF claddings during severe accidents in nuclear power plants. Nucl. Eng. Des. 2024, 426, 113388. [Google Scholar] [CrossRef]
  5. Brandt, T.; Lestinen, V.; Toppila, T.; Kaehkoenen, J.; Timperi, A.; Paettikangas, T.; Karppinen, I. Fluid-structure interaction analysis of large-break loss of coolant accident. Nucl. Eng. Des. 2010, 240, 2365–2374. [Google Scholar] [CrossRef]
  6. Macdonald, P.E.; Shah, V.N.; Ward, L.W.; Ellison, P.G. Steam Generator Tube Failures; NUREG/CR—6365; Nuclear Regulatory Commission: Washington, DC, USA, 2017. [Google Scholar]
  7. Fagerlind, H.; Heinig, I.; Matias, V. Analysis of accident data for test scenario definition in the ASSESS project. In Proceedings of the 4th International Conference ESAR—Expert Symposium on Accident Research, Hannover, Germany, 16–18 September 2010. [Google Scholar]
  8. Fichot, F.; Adroguer, B.; Volchek, A.; Zvonarev, Y. Advanced treatment of zircaloy cladding high-temperature oxidation in severe accident code calculations: Part III. Verification against representative transient tests. Nucl. Eng. Des. 2004, 232, 97–109. [Google Scholar] [CrossRef]
  9. Saltbones, J.; Foss, A.; Bartnicki, J. Severe Nuclear Accident Program (SNAP)—A Real Time Model for Accidental Releases. In Air Pollution Modeling and Its Application XI; Air & Waste Management Association: Pittsburgh, PA, USA, 1996. [Google Scholar]
  10. D’Auria, F.; Gabaraev, B.; Soloviev, S.; Novoselsky, O.; Moskalev, A.; Uspuras, E.; Galassi, G.M.; Parisi, C.; Petrov, A.; Radkevich, V. Deterministic accident analysis for RBMK. Nucl. Eng. Des. 2008, 238, 975–1001. [Google Scholar] [CrossRef]
  11. Haruyuki, O.; Takeshi, I.; Takatoshi, H. Verification of screening level for decontamination implemented after Fukushima nuclear accident. Radiat. Prot. Dosim. 2012, 151, 36–42. [Google Scholar] [CrossRef]
  12. Doytchev, D.E.; Szwillus, G. Combining task analysis and fault tree analysis for accident and incident analysis: A case study from Bulgaria. Accid. Anal. Prev. 2009, 41, 1172–1179. [Google Scholar] [CrossRef] [PubMed]
  13. Kohda, T.; Inoue, K. Fault-tree analysis considering latency of basic events. In Proceedings of the Annual Reliability and Maintainability Symposium. 2001 Proceedings. International Symposium on Product Quality and Integrity, Philadelphia, PA, USA, 22–25 January 2001. [Google Scholar] [CrossRef]
  14. Zubair, M.; Zhang, Z.; Aamir, M. A Review: Advancement in Probabilistic Safety Assessment and Living Probabilistic Safety Assessment. In Proceedings of the Power & Energy Engineering Conference, Chengdu, China, 28–31 March 2010. [Google Scholar] [CrossRef]
  15. Siu, N.; Marksberry, D.; Cooper, S.; Coyne, K.; Stutzke, M. PSA technology challenges revealed by the Great East Japan Earthquake. In Proceedings of the PSAM Topical Conference in Light of the Fukushima Dai-Ichi Accident, Tokyo, Japan, 15–17 April 2013. [Google Scholar]
  16. Hayashi, Y.; Hayashi, K.; Segawa, S.; Sekine, K.; Matsuoka, S. Research on Consequence Analysis Method for Probabilistic Safety Assessment of Nuclear Fuel Cycle Facilities (VI). J. At. Energy Soc. Jpn. 2010, 9, 339–346. [Google Scholar] [CrossRef]
  17. Wood, D.; O’Riordain, S. Monte Carlo Simulation Methods Applied to Accident Reconstruction and Avoidance Analysis. SAE Trans. 1994, 103, 893–901. [Google Scholar] [CrossRef]
  18. Marseguerra, M.; Zio, E.; Devooght, J.; Labeau, P.E. A concept paper on dynamic reliability via Monte Carlo simulation. Math. Comput. Simul. 1998, 47, 371–382. [Google Scholar] [CrossRef]
  19. Clairand, I.; Trompier, F.; Bottollier-Depois, J.F.; Gourmelon, P. Gourmelon EX vivo ESR measurements associated with Monte Carlo calculations for accident dosimetry: Application to the 2001 Georgian accident. Radiat. Prot. Dosim. 2006, 119, 500–505. [Google Scholar] [CrossRef]
  20. Chow, T.C.; Oliver, R.M.; Vignaux, G.A. A Bayesian Escalation Model to Predict Nuclear Accidents and Risk. Oper. Res. 1990, 38, 265–277. [Google Scholar] [CrossRef]
  21. Abbess, C.; Jarrett, D.; Wright, C.C. Bayesian Methods Applied to Road Accident Blackspot Studies. J. R. Stat. Soc. Ser. Stat. 1983, 32, 181. [Google Scholar] [CrossRef]
  22. Pyy, P. An analysis of maintenance failures at a nuclear power plant. Reliab. Eng. Syst. Saf. 2001, 72, 293–302. [Google Scholar] [CrossRef]
  23. Friedman, N.; Koller, D. Being Bayesian About Network Structure. A Bayesian Approach to Structure Discovery in Bayesian Networks. Mach. Learn. 2003, 50, 95–125. [Google Scholar] [CrossRef]
  24. Zhang, Z.; Dong, F. Fault detection and diagnosis for missing data systems with a three time-slice dynamic Bayesian network approach. Chemom. Intell. Lab. Syst. 2014, 138, 30–40. [Google Scholar] [CrossRef]
  25. Ruggieri, A.; Stranieri, F.; Stella, F.; Scutari, M. Hard and Soft EM in Bayesian Network Learning from Incomplete Data. Algorithms 2020, 13, 329. [Google Scholar] [CrossRef]
  26. Qi, B.; Xiao, X.; Liang, J.; Po, L.C.; Zhang, L.; Tong, J. An open time-series simulated dataset covering various accidents for nuclear power plants. Sci. Data 2022, 9, 766. [Google Scholar] [CrossRef]
  27. Ninng, L.; Yu, X. Fault diagnosis in TE process based on feature selection via second order mutual information. J. Chem. Ind. Eng. Soc. China 2009, 60, 2252. [Google Scholar]
Figure 1. The simple BN model.
Energies 18 02684 g001
Figure 2. Diagram of risk analysis methodology within the Bayesian Network (BN) framework.
Energies 18 02684 g002
Figure 3. Bayesian network for the LOCA.
Energies 18 02684 g003
Figure 4. Bayesian network of an SLBIC.
Energies 18 02684 g004
Figure 5. Comparison between model predictions and the actual results for the LOCA.
Energies 18 02684 g005
Figure 6. Comparisons between model predictions and actual results, considering different missing data for the LOCA (The red dashed line represents prediction value, and the scatter-point graph represents actual results).
Energies 18 02684 g006
Figure 7. Error analysis for the model prediction, considering different missing data within the LOCA (left y axes: r2 value, right y axes: MSE value, the red dotted line represents the prediction without missing data).
Energies 18 02684 g007
Figure 8. Mutual information associated with severity and event node for LOCA (The dotted line represents the average MI value).
Energies 18 02684 g008
Figure 9. Correlation between severity and event node (LOCA).
Energies 18 02684 g009
Figure 10. Comparison between model prediction and actual results for an SLBIC.
Energies 18 02684 g010
Figure 11. Comparison between model prediction and actual results, considering different missing data for an SLBIC (The red dashed line represents prediction value, and the scatter-point graph represents actual results).
Energies 18 02684 g011
Figure 12. Error analysis for the model prediction, considering different missing data, for an SLBIC (left y axes: r2 value, right y axes: MSE value, the red dotted line represents the prediction without missing data).
Energies 18 02684 g012
Figure 13. Mutual information associated with severity and event node for SLBIC(The dotted line represents the average MI value).
Energies 18 02684 g013
Figure 14. Correlation between severity and event node for an SLBIC.
Energies 18 02684 g014
Table 1. Description of the event nodes for a LOCA.
NameDescriptionNameDescription
TAVGTemp RCS AverageLSGALevel Steam Generator A
THAThermal Hydraulic Analyzer ALSGBLevel Steam Generator B
THBThermal Hydraulic Analyzer BWFWAFlow SG A Feedwater
PSGAPressure Steam Generator AWFWBFlow SG B Feedwater
PSGBPressure Steam Generator BVOLVolume RCS Liquid
WSTAFlow SG A SteamLVPZLevel Pressurizer
WSTBFlow SG B SteamWLRFlow RCS Leak
WHPIFlow High-Pressure InjectionWECSFlow Emergency Cooling System
QMWTPower Total Megawatt ThermalTSATTemp Przr Saturation
WRCBFlow Reactor coolant loop BTCATemp Cold leg A
VOIDVoid of RCSTCBTemp Cold leg B
LVCRLevel Core waterTSATTemp Przr saturation
Table 2. Description of the event nodes for an SLBIC.
NameDescriptionNameDescription
TAVGTemp RCS averageVOIDVoid of RCS
WRCAFlow Reactor Coolant Loop ATRBTemp Reactor Building
WRCBFlow Reactor Coolant Loop BLVPZLevel Pressurizer
PSGAPressure Steam Generator AWSTAFlow SG A Steam
PSGBPressure Steam Generator BWSTBFlow SG B Steam
WFWAFlow SG A FeedwaterWECSFlow Total ECCS
WFWBFlow SG B FeedwaterTSATTemp Przr Saturation
QMWTPower Total Megawatt ThermalWHPIFlow High-Pressure Injection
VOLVolume RCS Liquid
Disclaimer/Publisher’s Note: The statements, opinions and data contained in all publications are solely those of the individual author(s) and contributor(s) and not of MDPI and/or the editor(s). MDPI and/or the editor(s) disclaim responsibility for any injury to people or property resulting from any ideas, methods, instructions or products referred to in the content.

