Article

Energy Cost Centre-Based Modelling of Sector Coupling in Local Communities

1
Jozef Stefan Institute, Jamova Cesta 39, SI-1000 Ljubljana, Slovenia
2
Jozef Stefan International Postgraduate School, Jamova Cesta 39, SI-1000 Ljubljana, Slovenia
3
SIJ Acroni, d.o.o., Cesta Borisa Kidriča 44, SI-4270 Jesenice, Slovenia
*
Author to whom correspondence should be addressed.
Energies 2025, 18(11), 2688; https://doi.org/10.3390/en18112688
Submission received: 8 April 2025 / Revised: 15 May 2025 / Accepted: 19 May 2025 / Published: 22 May 2025
(This article belongs to the Section B: Energy and Environment)

Abstract

:
This paper presents an analysis of energy use and sector coupling in a local energy community using a model based on energy cost centres (ECCs), functional units for decentralised responsibility and optimisation of energy use within defined system boundaries. The ECC model enables structured identification and optimisation of energy and material flows in complex industrial and urban settings. It was applied to a case study involving an energy-intensive steel plant and its integration with the surrounding community. The study assessed the potential for renewable electricity production (7914 MWh annually), green hydrogen generation, battery storage, and the reuse of 11,440 MWh of excess heat. These measures could offset 9598 MWh of grid electricity through local production and savings, reduce natural gas use by 4,116,850 Nm3, and lower CO2 emissions by 10,984 tonnes per year. The model supports strategic planning by linking sectoral actions to measurable sustainability indicators. It is adaptable to data availability and stakeholder engagement, allowing both high-level overviews and detailed analysis of selected ECCs. Limitations include heterogeneous data sources, uneven stakeholder participation, and the need for refinement of sub-models. Nonetheless, the approach offers a replicable framework for integrated energy planning and supports the transition to sustainable, decentralised energy systems.

1. Introduction

The global energy transition, propelled by the increased adoption of renewable energy sources (RES), digitalisation, and the decentralisation of energy systems, introduces new challenges in cost management and system optimisation. In this context, energy communities have gained prominence, enabling local energy production, sharing, and consumption, thereby contributing to sustainability and reducing reliance on centralised energy sources [1,2]. Their role in promoting energy democracy and decentralisation is crucial [3]. Energy communities hold significant potential for advancing renewable energy adoption and achieving sustainability goals [4]. Sustainable development necessitates efficient energy management and continuous environmental stewardship. Achieving ambitious environmental and energy targets requires systematic planning of sustainable energy infrastructure, integration of energy sectors, and active involvement of local energy communities. Local authorities must support improved spatial planning and long-term investment policies for sustainable projects. Moreover, all stakeholders must collaborate in developing a portfolio of feasible sustainable projects and leverage their practical experience to propose regulatory changes that enhance the achievement of environmental and energy goals [5]. Realising these goals requires a systematic approach based on the analysis of the business environment, development plans, complex modelling, and simulations to determine the optimal configuration of energy systems. Sector coupling and coordinated infrastructure investment are central to achieving both environmental and economic viability [6,7].
Recent literature highlights the importance of integrating technological innovation, community involvement, and cooperative models to advance sustainable energy systems. A comprehensive review by Gjorgievski et al. [1] discusses trends in energy system modelling, business models, and optimisation objectives within energy communities, while Auders et al. [4] explore the evolving concept of energy communities in the European context. These studies underscore the need for multidisciplinary cooperation across nations and research disciplines. As noted by Mišljenović et al. [8], energy management systems and appropriate organisational structures for prosumers are essential for the efficient operation of energy communities. Optimising their performance requires suitable economic evaluation methods. Bohvalovs et al. [9] propose differential evolutionary optimisation as a tool for improving cost efficiency. Organisational and economic mechanisms for enhancing energy cost management in the industrial sector have also been explored [10], providing a reference framework for analysing the cost structures of energy communities. In the industrial sector, energy cost management is of paramount importance [11,12,13]. The concept of energy cost centres (ECCs), which enable decentralised management and analysis of energy flows within clearly defined system boundaries, facilitates detailed energy cost tracking and optimisation at various organisational levels [14,15]. Despite their effectiveness in industry, ECCs have not yet been systematically applied in energy communities or sector coupling. Their integration could provide a more precise quantification of economic synergies and support the development of viable business models. Existing modelling approaches used to evaluate energy communities and sector integration differ significantly in terms of scope, analytical depth, and stakeholder involvement. Table 1 provides a comparative overview of selected models drawn from recent literature, highlighting their advantages and limitations in relation to technical, economic, and governance aspects.
As the table shows, classical approaches such as pinch analysis and linear programming remain valuable for thermodynamic and techno-economic optimisation, but they often lack the flexibility to address decentralised or multi-actor systems. Conversely, newer methods such as ECC-based modelling and AI/IoT-enhanced frameworks offer greater adaptability but face challenges related to data quality, granularity, and stakeholder integration. This paper builds on the strengths of ECC modelling, adapting it for energy communities to address key gaps in economic analysis and sectoral interconnection. Despite progress in energy community research, several critical questions remain unresolved. Current evaluation methods often emphasise macroeconomic indicators or investment costs, while overlooking operational costs and internal cost structures [16]. Lode et al. [17] further note that economic aspects are frequently neglected in favour of technical and social factors. Additionally, research on sector coupling tends to focus on physical and grid-related synergies, with limited attention to economic interactions [18]. Comprehensive economic analysis is crucial for assessing the long-term sustainability of energy and climate policy in the EU [19].
Table 1. Comparison of selected modelling approaches for energy communities and sector coupling.
Modelling
Approach
Scope of
Application
Main
Advantages
Main
Limitations
Ref.
Pinch AnalysisIndustrial energy systems; heat and energy integrationIdentifies thermodynamic limits; helps minimise energy wasteRequires detailed process data; traditionally not adapted to decentralised or community systems[7,15,19]
Differential Evolution OptimisationMulti-objective optimisation of community energy flowsGood for complex, non-linear optimisation; supports hybrid RES and storage analysisRequires careful parameter tuning; computationally intensive[9]
Multi-Actor Multi-Criteria AnalysisDesign of pilot energy communitiesIntegrates stakeholder preferences; transparent decision-makingSubjective weighting of criteria; limited to early planning stages[17]
Energy Cost Centre (ECC) ModellingIndustrial and local community cost allocationAllows decentralised cost tracking; scalable to complex systemsDepends on data availability and stakeholder cooperation; modelling depth varies per ECC[10,14]
Linear ProgrammingCommunity-scale energy system designSuitable for detailed techno-economic analysis; widely usedAssumes linearity; often lacks flexibility for social or behavioural factors[1,6]
Agent-Based ModelsSocio-technical dynamics in energy communitiesCaptures individual behaviour; suitable for policy testingHigh data and modelling effort; difficult to validate[3,4]
IoT/AI-enhanced monitoring and control modelsReal-time energy management in smart communitiesEnables adaptive control and predictive maintenance; supports sector couplingRelies on digital infrastructure and advanced data analysis capabilities[6,18]
This article addresses the following research question: How can the concept of ECCs contribute to a more precise evaluation and optimisation of cost structures in energy communities, and how can its integration enhance analysis in the context of energy sector coupling? The main objective of this article is to assess the applicability of the ECC model within the context of energy communities and sector coupling, with the aim of improving cost transparency, financial management, and strategic planning in decentralised energy systems. Specifically, this article explores:
  • Adaptation of the ECC model to the specific cost structures of energy communities;
  • Application of ECCs to support integrated analysis across electricity, heating, gas, hydrogen, and RES;
  • Development of a methodological framework to quantify sectoral synergies and assess economic benefits at the local level.

2. Materials and Methods

At the outset of sustainable energy planning, it is essential to define key processes and energy conversions to be addressed, along with all relevant sources, sinks, and stakeholders. This step establishes the system boundaries of the intended project environment. Processes and flows may be represented using various modelling approaches. In this study, the ECC structure was adopted (Figure 1), offering a systematic framework for visualising and optimising energy and material flows.

2.1. Presentation of Systems with the Structure of Energy Cost Centres

In production environments, environmental impacts primarily arise from the use of energy and materials. Where such use is absent or optimised, environmental burdens are reduced. A production process comprises people, equipment, raw materials, and operating procedures within environmental constraints. The dynamics of these factors determine energy efficiency and environmental performance. The process is also a data source for evaluating efficiency and impacts [14]. Effective energy and environmental management relies on regular measurements, performance benchmarks, and the allocation of responsibility across the production chain. When energy costs can be quantified directly through metering, cost responsibility centres—designated ECCs—can be established, enabling accountability for energy performance and continuous improvement [14].
Process analysis typically involves energy flow diagrams and process flow diagrams. Energy flow diagrams provide an overview of energy forms, production, and use across the system. Process flow diagrams trace materials and energy through each stage of production and highlight opportunities for responsibility allocation. When combined, these diagrams offer insights into energy demand and provide the basis for defining ECCs. ECCs are often aligned with control boundaries such as departments or discrete energy systems (e.g., boiler rooms or compressor stations). While there are no strict rules for defining ECCs, several criteria may guide their establishment [14]:
  • The process must have a measurable output;
  • Energy use or environmental impacts must be metered;
  • Measurement costs should not exceed 10%–20% of annual related costs;
  • ECCs must align with legal environmental requirements;
  • Responsibility must be assignable;
  • A standard performance metric should be defined;
  • Measurable and realistic improvement targets must be feasible.
The ECC model supports structured analysis and optimisation of energy use. However, its structure should be tested for sensitivity to variations in seasonal demand, energy prices, and changes in industrial technologies.

2.2. Model for Energy Use Analysis Based on Energy Cost Centres

Within the defined boundaries of the project, the energy field is integrated into process flow diagrams, which form the basis for decisions on the establishment of ECCs, the fundamental elements of the entire sustainable energy project model. At the conceptual level, the ECC-based approach falls into the family of integrated process planning or process synthesis methods [20]. Due to its simplicity and successful use in numerous industrial applications worldwide, pinch analysis is the most commonly used methodology for integrated process planning [21,22]. According to [20], an ECC can be any department, part of a department, or machine that converts large amounts of energy or creates significant environmental impacts. With the ECC structure, material and energy flows through the production process under consideration, their basic conversions, and input–output connections with the environment can be schematically represented. The ECC model structure is defined by a set of signals determined for each system segment. Modelling and process integration based on ECCs are often used to improve production control, explore flexibility, and record current operational conditions [20]. The ECC structure can also be used to identify environmental impacts from individual parts of the production process where various energy sources are used. The goal of designing sustainable energy projects is also to have a positive impact on the economic and social standing of people in the local community while simultaneously reducing negative environmental impacts. Therefore, the ECC structure can also include social and sociological impacts of the sustainable energy project. If, for a given ECC, the input energy is defined as the sum of all incoming energy carriers ( E i n ( t 1 t 2 ) ) , material inflows ( M ( t 1 t 2 ) ) , output energy ( E o u t ( t 1 t 2 ) ) , and material production outputs ( P t 1 t 2 ), various performance indicators can be derived. For example, energy efficiency can be expressed as:
E i n t P t   o r   E i n t M t
Environmental protection indicators may be formulated as:
E o u t t P t   o r   E o u t t M t  
Material efficiency is represented as:
P t M t
Moreover, identifying interactions between ECCs enables the detection of synergies, such as excess heat reuse, which may enhance overall energy efficiency. The integration of ECCs into advanced simulation environments has recently gained attention as a critical method for optimising energy systems. As demonstrated by Sučić et al. [23], simulation tools based on ECC structures allow for accurate tracking of energy flows and realistic evaluation of efficiency improvement potential in both existing and planned systems. Their findings underline that the ECC approach—through detailed breakdowns of consumption and production, and its integration with control and analytical tools—facilitates the detection and elimination of inefficiencies in complex urban networks. Furthermore, their study highlights the importance of engaging diverse stakeholders, including building operators, energy experts, local community representatives, and investors. Such collaboration enhances transparency and enables tailored adjustments to energy solutions in response to changing conditions. The results confirm that a multidisciplinary approach combining ECC-based modelling and simulation provides a robust basis for designing sustainable, flexible energy systems, which is essential for advancing energy community projects.

2.3. Case Study: Improving Energy Efficiency, Increasing RES Generation, and Reducing CO2 Emissions in the Local Community in Slovenia

The research was focused on improving energy efficiency, increasing electricity production from RES, and reducing emissions in energy-intensive industries in cooperation with the local community. The local community under consideration comprises 21,735 inhabitants (data for 2022). According to the Sustainable Energy and Climate Action Plan (SECAP) of the local community [24], the total final energy consumption in 2021 amounted to 1,063,662 MWh. Of this, the industrial and service sectors accounted for 813,765 MWh, households for 114,324 MWh, municipal public buildings for 8225 MWh, transport (excluding transit traffic) for 126,820 MWh, and public lighting for 528 MWh. Among energy sources, natural gas ranked first in terms of energy quantity with 460,004 MWh, followed by electricity with 397,660 MWh, liquid fuels with 141,792 MWh, district heating with 38,421 MWh, and woody biomass with 25,786 MWh. The dominant use of natural gas and 88% of electricity consumption is primarily due to the needs of the energy-intensive industrial sector. Steel production, one of the most energy-intensive industrial processes [25], prevails in this sector.
The development of the steel industry is largely influenced by decisions made by public institutions that regulate new standards and stimulate demand through investment in public infrastructure and construction [26]. The concept of joint planning of sustainable energy projects and energy infrastructure was tested through the collaboration between a major steel producer in Slovenia and the local community in which it operates. The steel plant and the local district heating operator provided a real-life testing environment and all the necessary data to validate the proposed concept. Furthermore, the project team participated in drafting the community’s SECAP. This particular steel plant is among the most advanced in Europe in terms of energy use and environmental impact. Nonetheless, even in such large-scale systems, there remains room for improvement. Due to intense international competition, all steel plants are seeking ways to optimise production processes and reduce operational costs. According to [27], the steel plant in question has succeeded in lowering CO2 emissions, reaching only 373 kg of CO2 per tonne of steel products in 2021. This achievement was made possible through measures aimed at improving energy efficiency and deploying the best available technologies. However, additional CO2 emission reductions are still feasible through on-site renewable electricity generation, local green hydrogen production, electricity cost reduction via demand-side management and improved forecasting, and especially through the reduction of natural gas and electricity consumption by utilising excess heat from the production process. A portion of this excess heat could be used in the community’s district heating system. Most residential and commercial buildings currently use natural gas-fuelled district heating systems for space heating and domestic hot water preparation.

3. Results

At the beginning of the study, a series of structured interviews was conducted with representatives of the steelworks, local authorities, network operators, and residents. The energy analysis encompassed all relevant resources: electricity, natural gas, heat, and hydrogen.

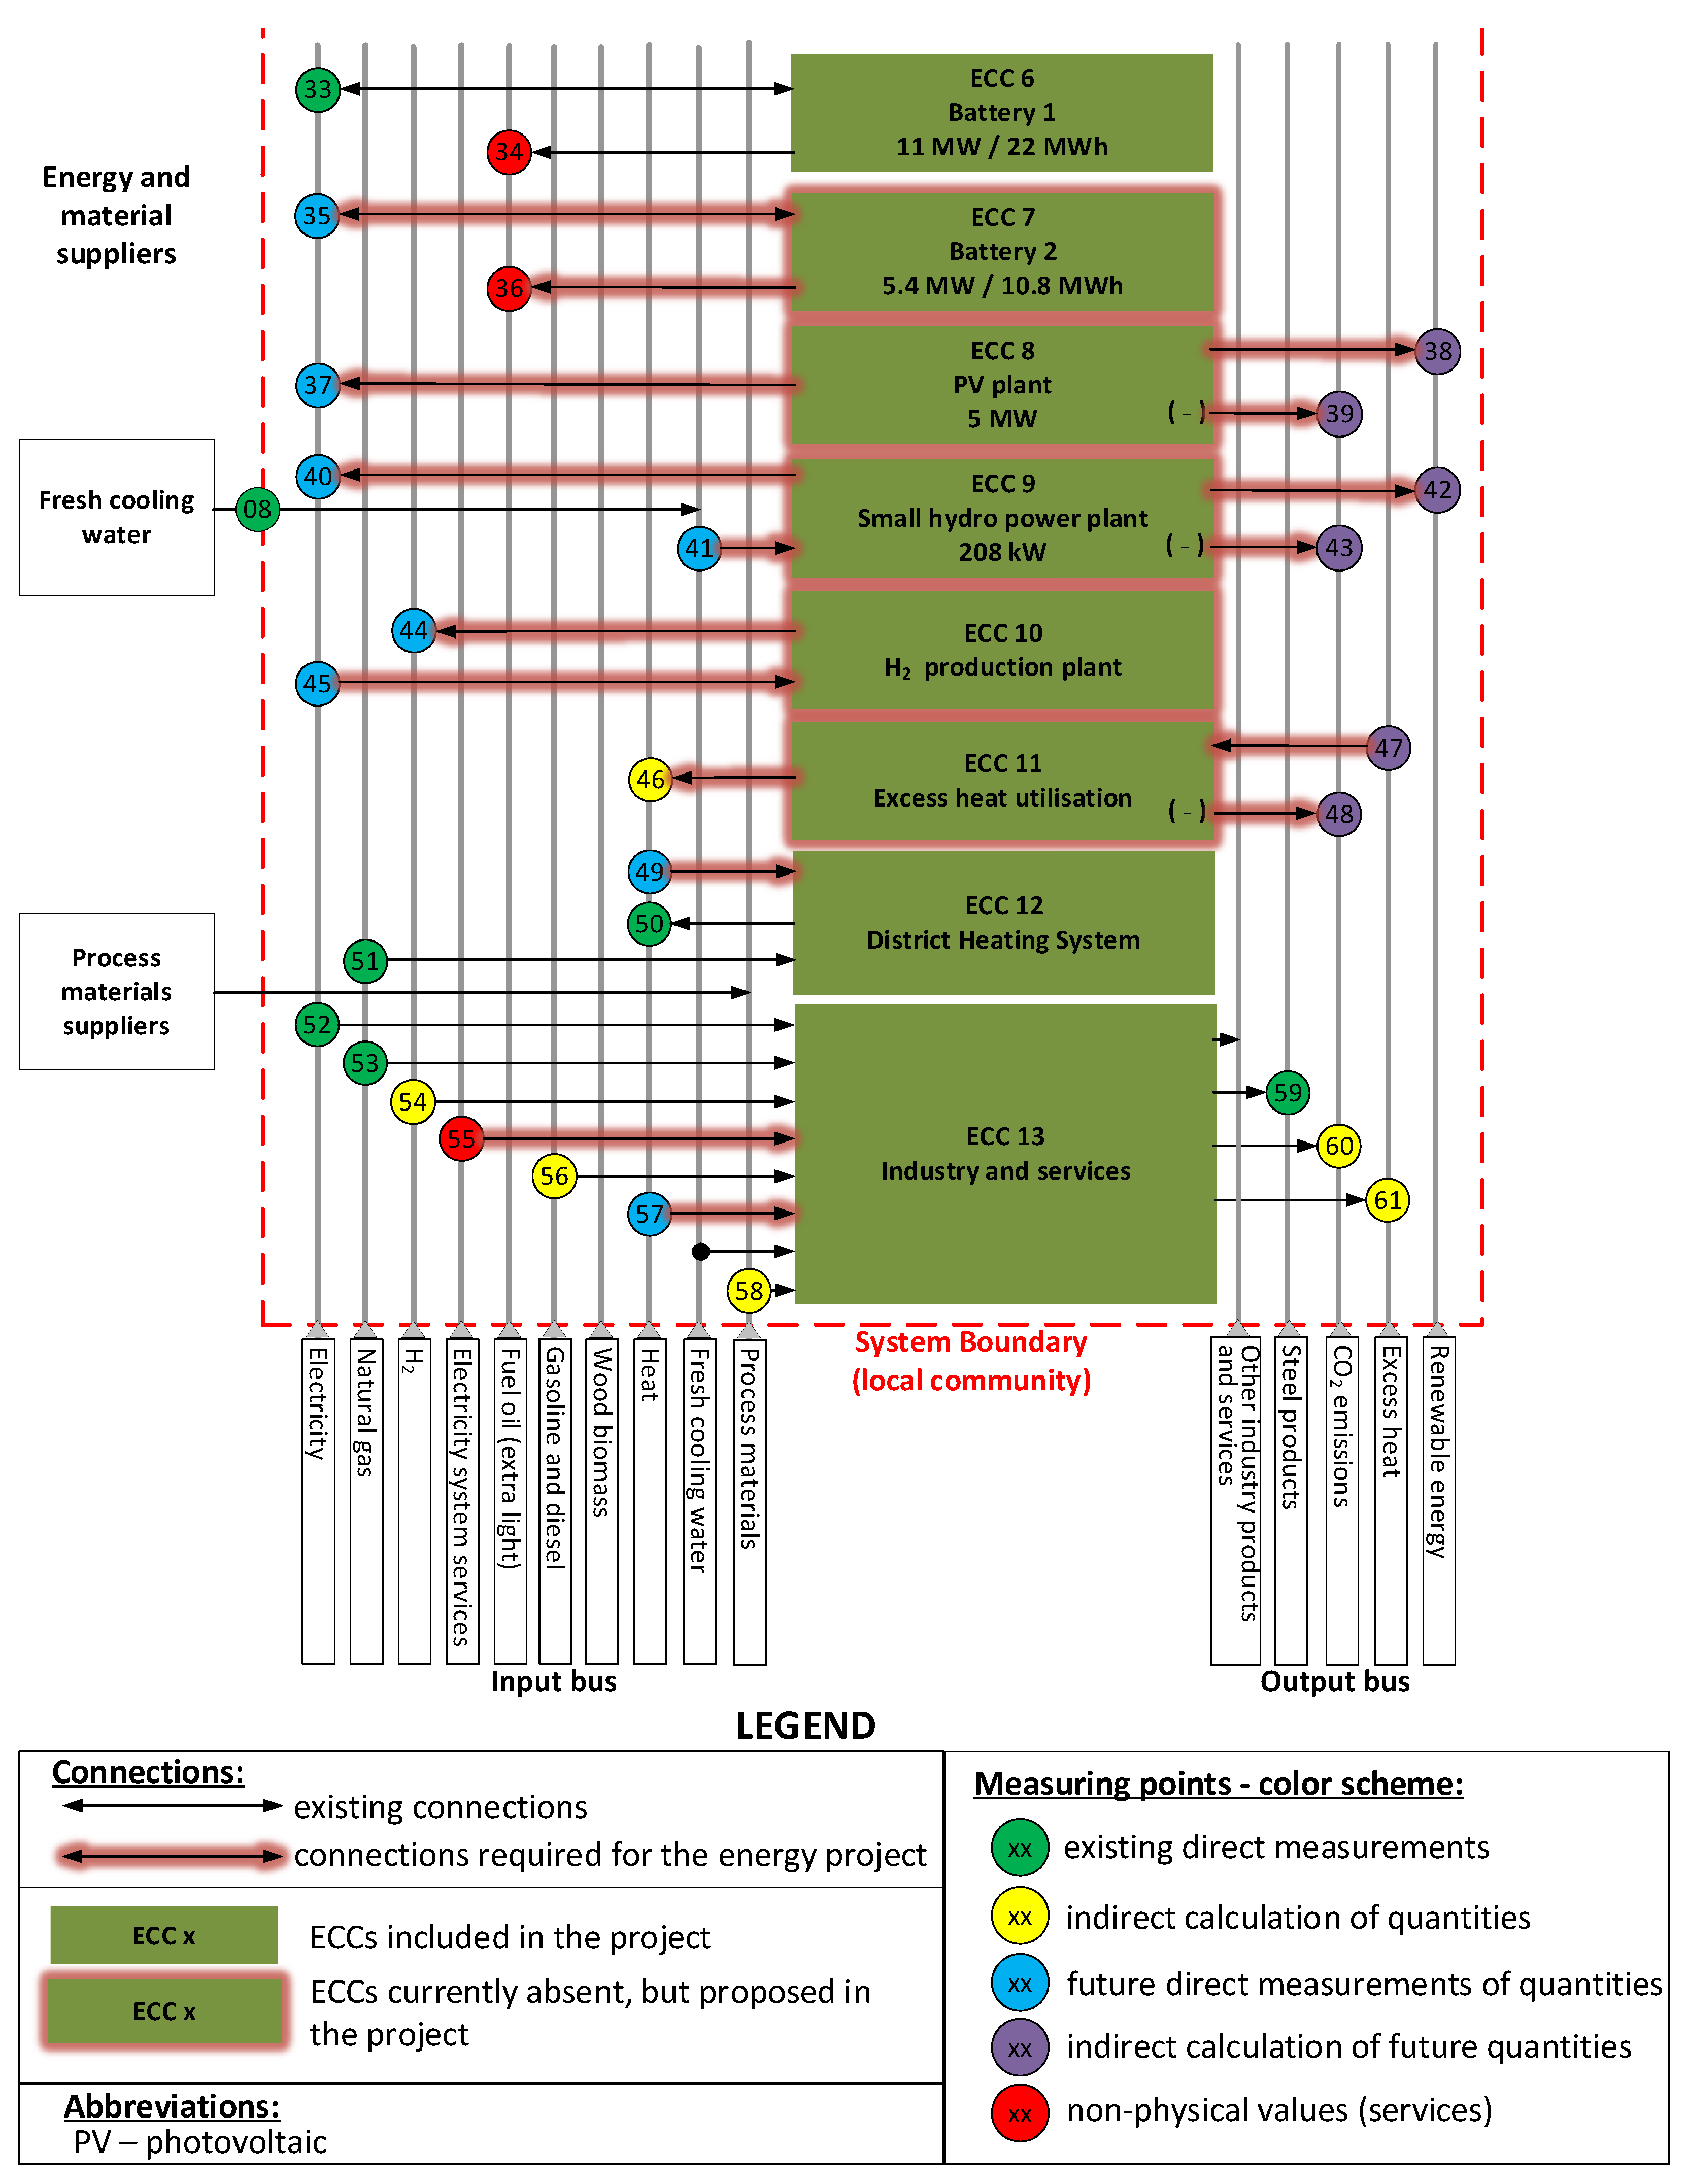
3.1. Identification of Energy and Material Flows and Representation Using the ECC Structure

Optimisation of production activities can be particularly successful if during the analysis of the current situation and search for potential improvements, new methodologies and a broader, perhaps different context are considered than those used previously. The research objectives were therefore as follows:
  • To assess the feasibility of producing electricity from RES (solar, hydro potential);
  • To explore the possibility of producing green hydrogen;
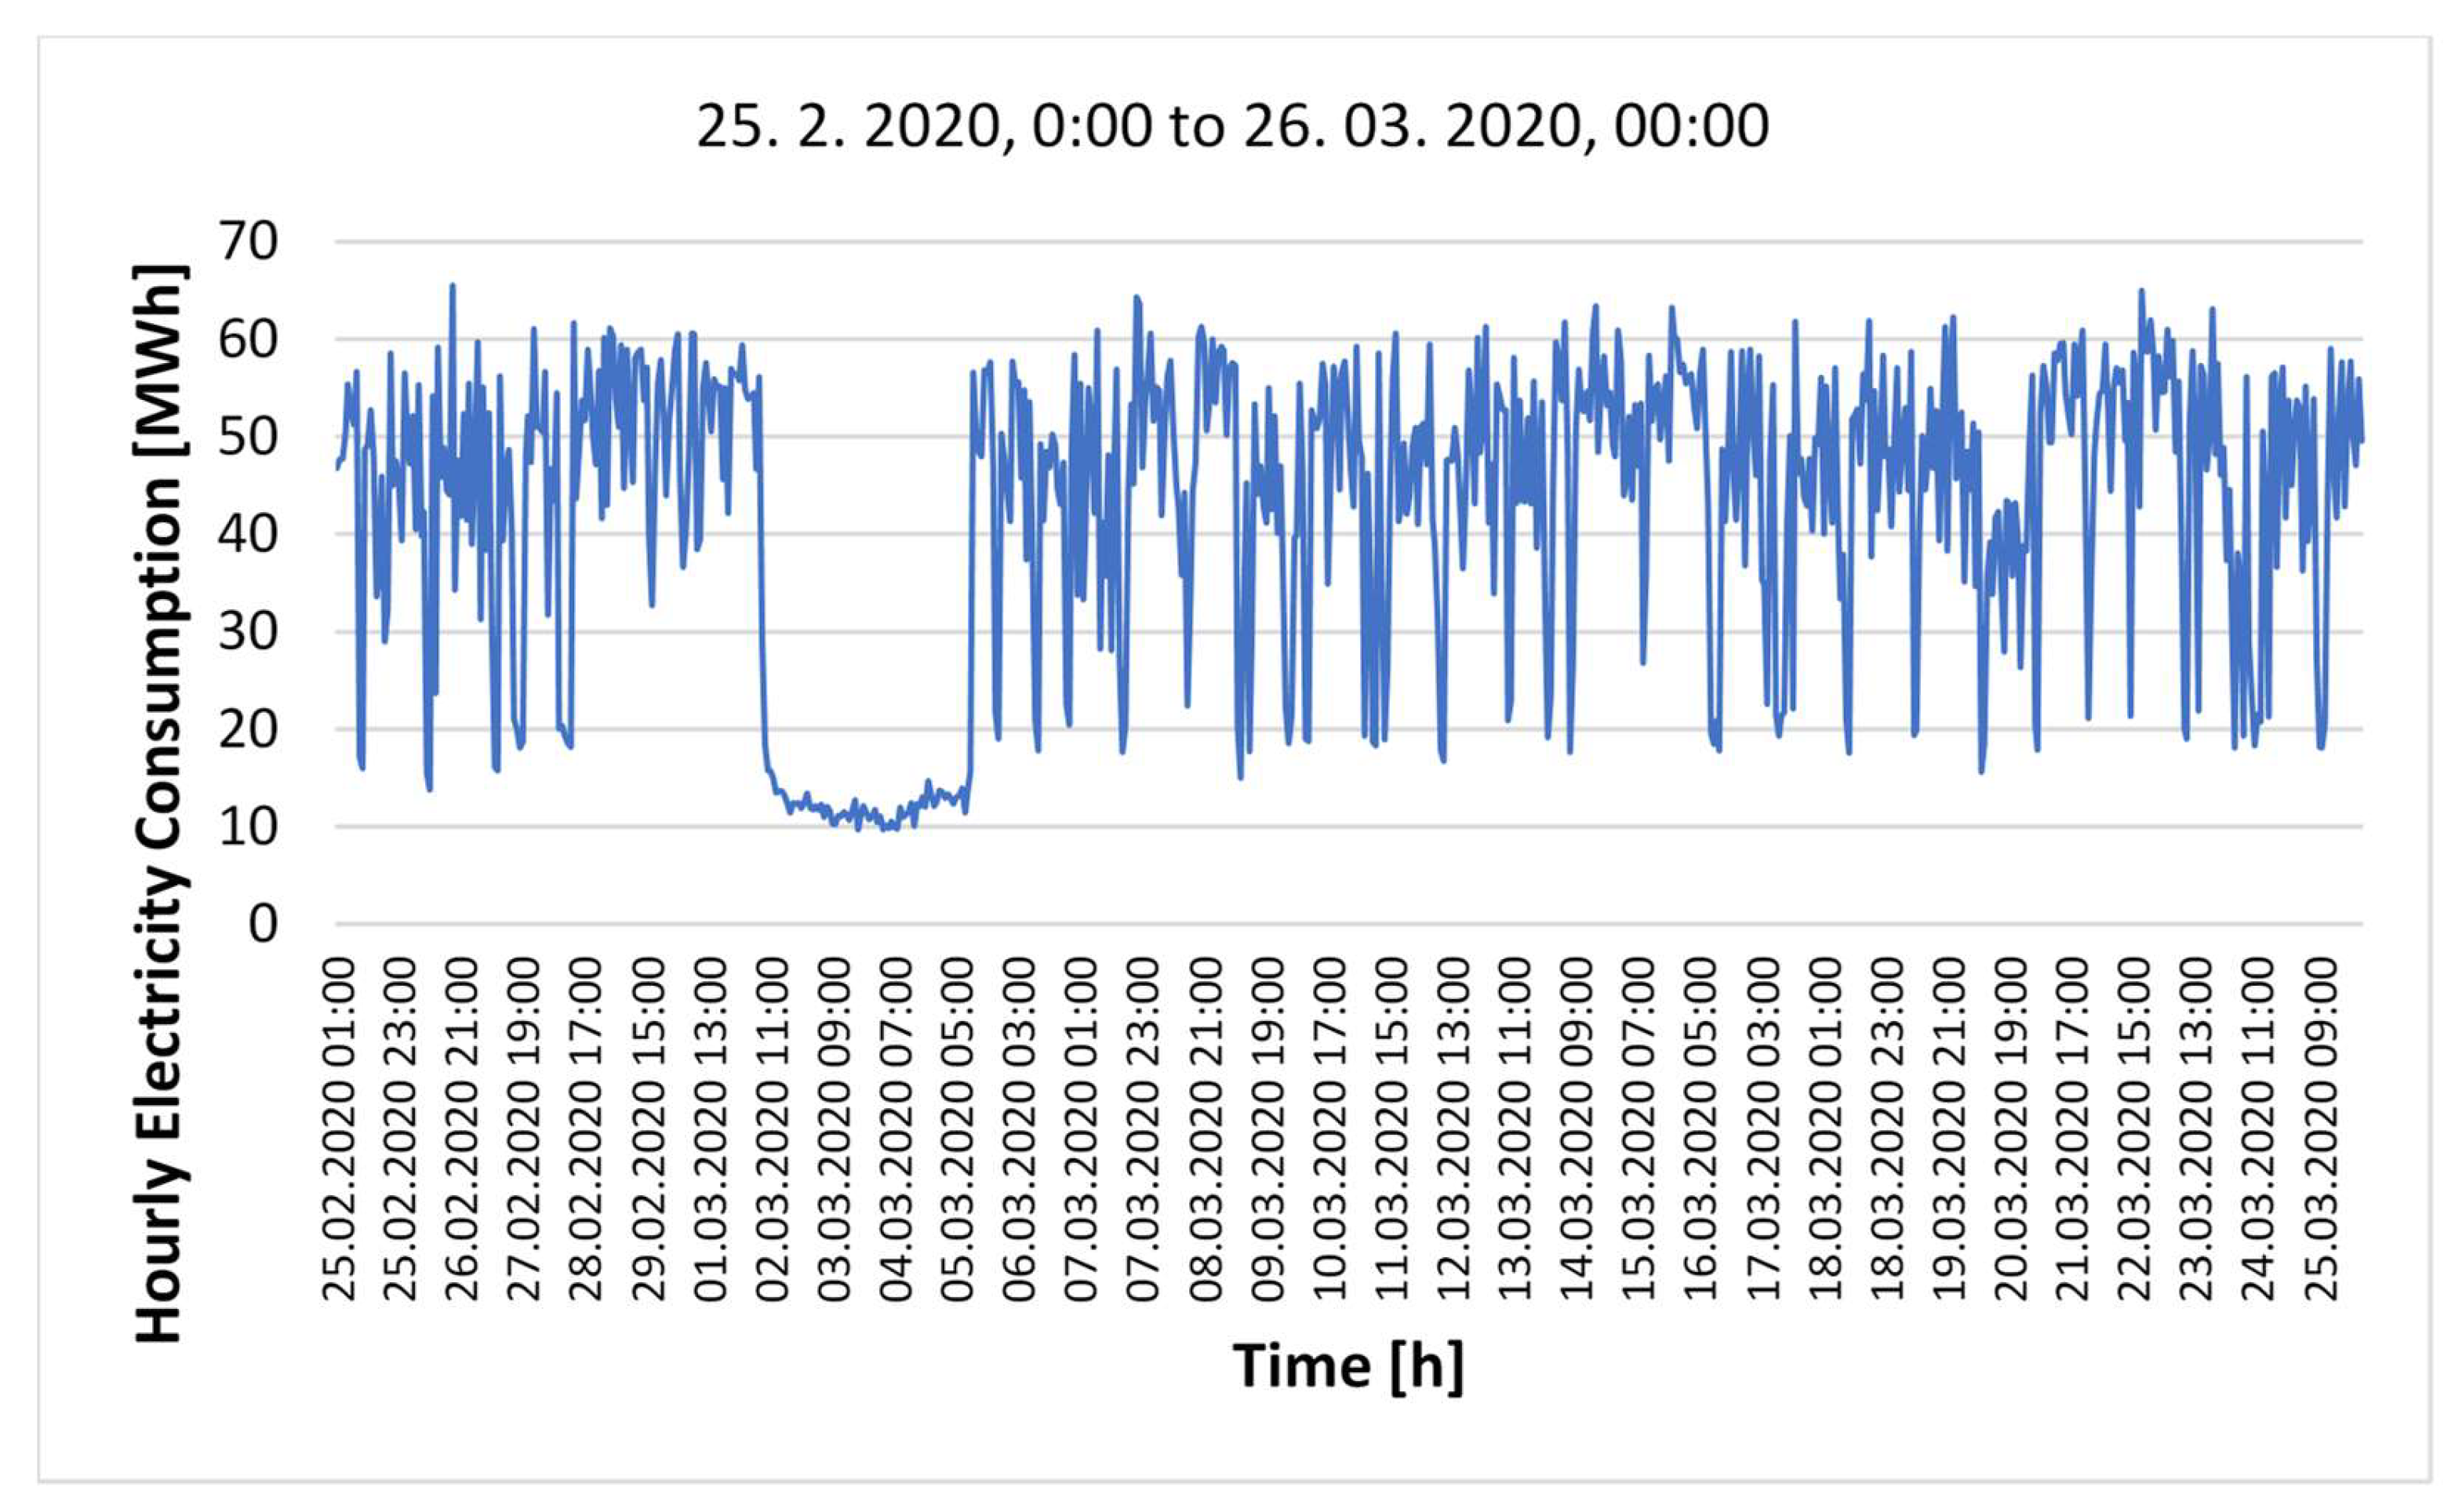
  • To examine the potential for regulating electricity demand;
  • To determine whether the proposed concept, supported by data from the district heating operator, could be used to upgrade the existing district heating system and as a decision-making tool for the steelworks to enhance their production processes.
A schematic representation of energy and material flows was developed based on the ECC framework. This depiction of the target system configuration is presented in Figure 2 and Figure 3. Elements currently absent but proposed as part of the sustainable system are highlighted (glow).
ECCs not directly included in the sustainable project but forming an important part of the local community (ECC 1 to ECC 5) are marked in light green (Figure 2). These elements remain relevant to the project, as its outcomes have an indirect impact on them—for example, by increasing the availability of affordable heat within the district heating system, enhancing the share of RES, and reducing the community’s carbon footprint. Elements that were either directly involved in the project or identified as prospective for implementation within the local community—particularly in the broader area surrounding the steel plant—are marked in dark green (ECC 6 to ECC 13—Figure 3). The diagram simplifies complex technological systems, focusing on relevant energy transformations without altering core industrial processes. Included are RES installations: photovoltaic power plant (PV), small hydropower plant (SHP), hydrogen production (for internal use and grid injection), and demand management via a planned battery storage system. An existing third-party battery system, though not owned by the steelworks, is also represented due to its influence on demand and system services. Additionally, material flows and emissions, along with potential for heat reuse in district heating, are highlighted.
Energy, material, and service flows are systematised in the ECC framework. Input flows enter through measurement points—covering primary energy sources, materials, and services—while outputs are linked to end users or emission sinks. The boundary of the proposed project is delineated with a red dashed line. Each crossing is equipped with a measurement point, detailed in Table 2, which indicates the type and source of data, including physical meters (green), calculated points (yellow), planned meters (blue), projected indirect values (purple), and non-physical service indicators (red).
The ECC-based model is supported by a set of analytical expressions that quantify system-wide energy use, emissions, and renewable integration. Total final energy consumption is defined as:
E t o t a l = i I E i j J E j
where I = 01 , 04 , 05 , 06 , 07 , 28 , 33 , 35 , 37 , 40 , 44 , 46 and J = 03 , 10 .
Total CO2 emissions, including reductions from renewables and waste heat, are given by:
C O 2 t o t a l = k K C k l L C l
where K = 16 , 22 , 27 , 32 , 60 and L = 30 , 39 , 43 , 48 .
Electricity from renewable sources is:
E R E S = E 29 + E 38 + E 42 and   its   share   is   f R E S = E R E S E t o t a l
Negative values (marked ‘–’ in figures) represent reductions, particularly in emissions, and are considered in net calculations. The examples above represent only a subset of possible indicators that can be readily formulated from the ECC structure. They demonstrate the model’s applicability for scenario-based analysis of local energy systems, including assessment of renewable integration, sector coupling, and decarbonisation strategies within defined community boundaries.
The approach aimed to evaluate the realistic potential of on-site energy production and optimisation in a large industrial facility. It links RES generation to local consumption, thereby avoiding unnecessary grid costs. Data analysis included small-scale PV test sites, dust impact assessments, evaluation of roof areas near transformer stations, and grid capacity assessments. The methodology supports energy efficiency improvements, advanced data use from smart metering systems, and the development of tailored business models for innovative energy services and management.

3.1.1. ECCs Not Directly Included in the Sustainable Project (ECC 1 to ECC 5)

The majority of the population in the studied local community resides in a densely populated area served by both the electricity grid and an extensive natural gas distribution network, as well as a district heating system. Additionally, 14% of households—mostly in rural areas—use woody biomass for heating. Households are represented by ECC 1 in Figure 2. In 2021, household energy consumption was as follows: electricity (MP 11)—44,753 MWh; natural gas (MP 12)—9991 MWh; heating oil (MP 13)—14,956 MWh; woody biomass (MP 14)—25,786 MWh; and district heating (MP 15)—18,826 MWh. Considering the emission factors for 2021 (Table 3), household energy use resulted in 25,004 tonnes of CO2 emissions (MP 16).
Most municipal public buildings (ECC 2)—schools, kindergartens, hospitals, sports halls, etc.—are connected to the district heating system, which represented the primary energy source in 2021 with 5830 MWh (MP 21). To a lesser extent, heating oil (15 MWh, MP 19), electricity (2367 MWh, MP 17), and natural gas (13 MWh, MP 18) were also used. Total CO2 emissions from energy consumption in municipal buildings in 2021 amounted to 1908 tonnes (MP 22). In the transport sector (ECC 3), fossil liquid fuels remained the dominant energy source in 2021, with total consumption of 126,821 MWh (MP 26). The use of electricity in transport is gradually increasing, but was limited to just 7 MWh at public charging stations in 2021 (MP 23). Total CO2 emissions from transport in 2021 amounted to 33,417 tonnes (MP 27). The local community is predominantly located in a narrow east–west-oriented Alpine valley, which generally limits its suitability for solar energy utilisation. Wind potential is modest and mostly confined to high-altitude areas, which lack appropriate grid infrastructure for connection. The region is, however, rich in small watercourses, which has historically led to the development of several SHPs. In 2021, the total electricity production from RES (ECC 4) reached 9086 MWh (MP 28, MP 29), thereby reducing CO2 emissions by 3180 tonnes (MP 30). In 2021, public lighting (ECC 5) consumed 528 MWh of electricity (MP 31), resulting in 185 tonnes of CO2 emissions (MP 32).

3.1.2. Demand Management with Battery Energy Storage—ECC 6 and ECC 7

The steelworks under consideration is one of the largest electricity consumers in Slovenia, with an annual consumption of 323,442 MWh in 2020. Together with other facilities in the sector, it forms a single balancing group, which consumed 478,617 MWh that year, with a measured peak load of 120.4 MW. One of the key tasks for the steelworks’ energy managers is minimising the cost of imbalances within the balancing group. In addition to improved forecasting—challenging due to the variability of industrial processes—an effective strategy is the deployment of battery energy storage systems (BESSs). A BESS owned by an external partner is already connected to the internal network and is represented as ECC 6, with electricity exchange measured at MP 33 and system services recorded at MP 34. The owner could also offer balancing services to the steelworks. The study also simulated a scenario where the steelworks installs its own BESS, represented as ECC 7. Electricity exchange with the grid is measured at MP 35, while system services that the steelworks could either sell on the market or use for internal demand balancing are recorded at MP 36. To assess the balancing potential, a rule-based simulation model was developed at 15 min resolution. For each timestep t, the model compares actual and forecast consumption:
E t = E t r e a l   E t f o r e c a s t  
Battery compensation is limited by available capacity:
E t b a t = m i n m a x C t , E t , C m a x C t
where C t is the state of charge at time t and C m a x is the maximum battery capacity. The battery-corrected deviation is:
E t c o r r = E t + E t b a t
with the battery’s state of charge updated as:
C t + 1 = C t E t b a t .
The simulation used a C-rate of 0.5, 85% charging/discharging efficiency, and a depth of discharge of 60% (from 20% to 80%). Two battery sizes were tested: 10.8 MWh and 22.0 MWh. In the base case (no battery), TAPE ranged from 22.9% to 27.0%. The term TAPE, while not a formal acronym, is used here as an analogy to the historical ‘ticker tape’ that recorded financial transactions throughout the trading day. In this study, ‘TAPE difference’ refers to the relative deviation between the actual and forecast electricity consumption within each 15 min interval, aggregated monthly. It serves as an indicator of short-term forecasting accuracy and a basis for quantifying the effectiveness of BESSs. With a 10.8 MWh battery, deviations were reduced by 23.4%, with TAPE ranging from 17.2% to 21.3%. A larger 22.0 MWh system further reduced deviations by 41.5%, lowering TAPE to 12.8%–17.1%.
An economic analysis evaluated the feasibility of BESS investment. Key assumptions included EUR 600/kWh CAPEX (capital expenditure), EUR 20/kWh/year OPEX (operational expenditure), and a 10-year depreciation period. Under a scenario with moderate imbalance settlement prices (EUR 70/MWh), the 22 MWh BESS could generate net annual savings of approximately EUR 660,000, yielding a payback period of 9.7 years. If capital costs fall to EUR 450/kWh, the payback period shortens to 6.5 years. The analysis confirms that battery storage can significantly reduce system imbalance costs and enhance grid flexibility. Its economic viability improves with falling battery costs and evolving electricity market conditions.

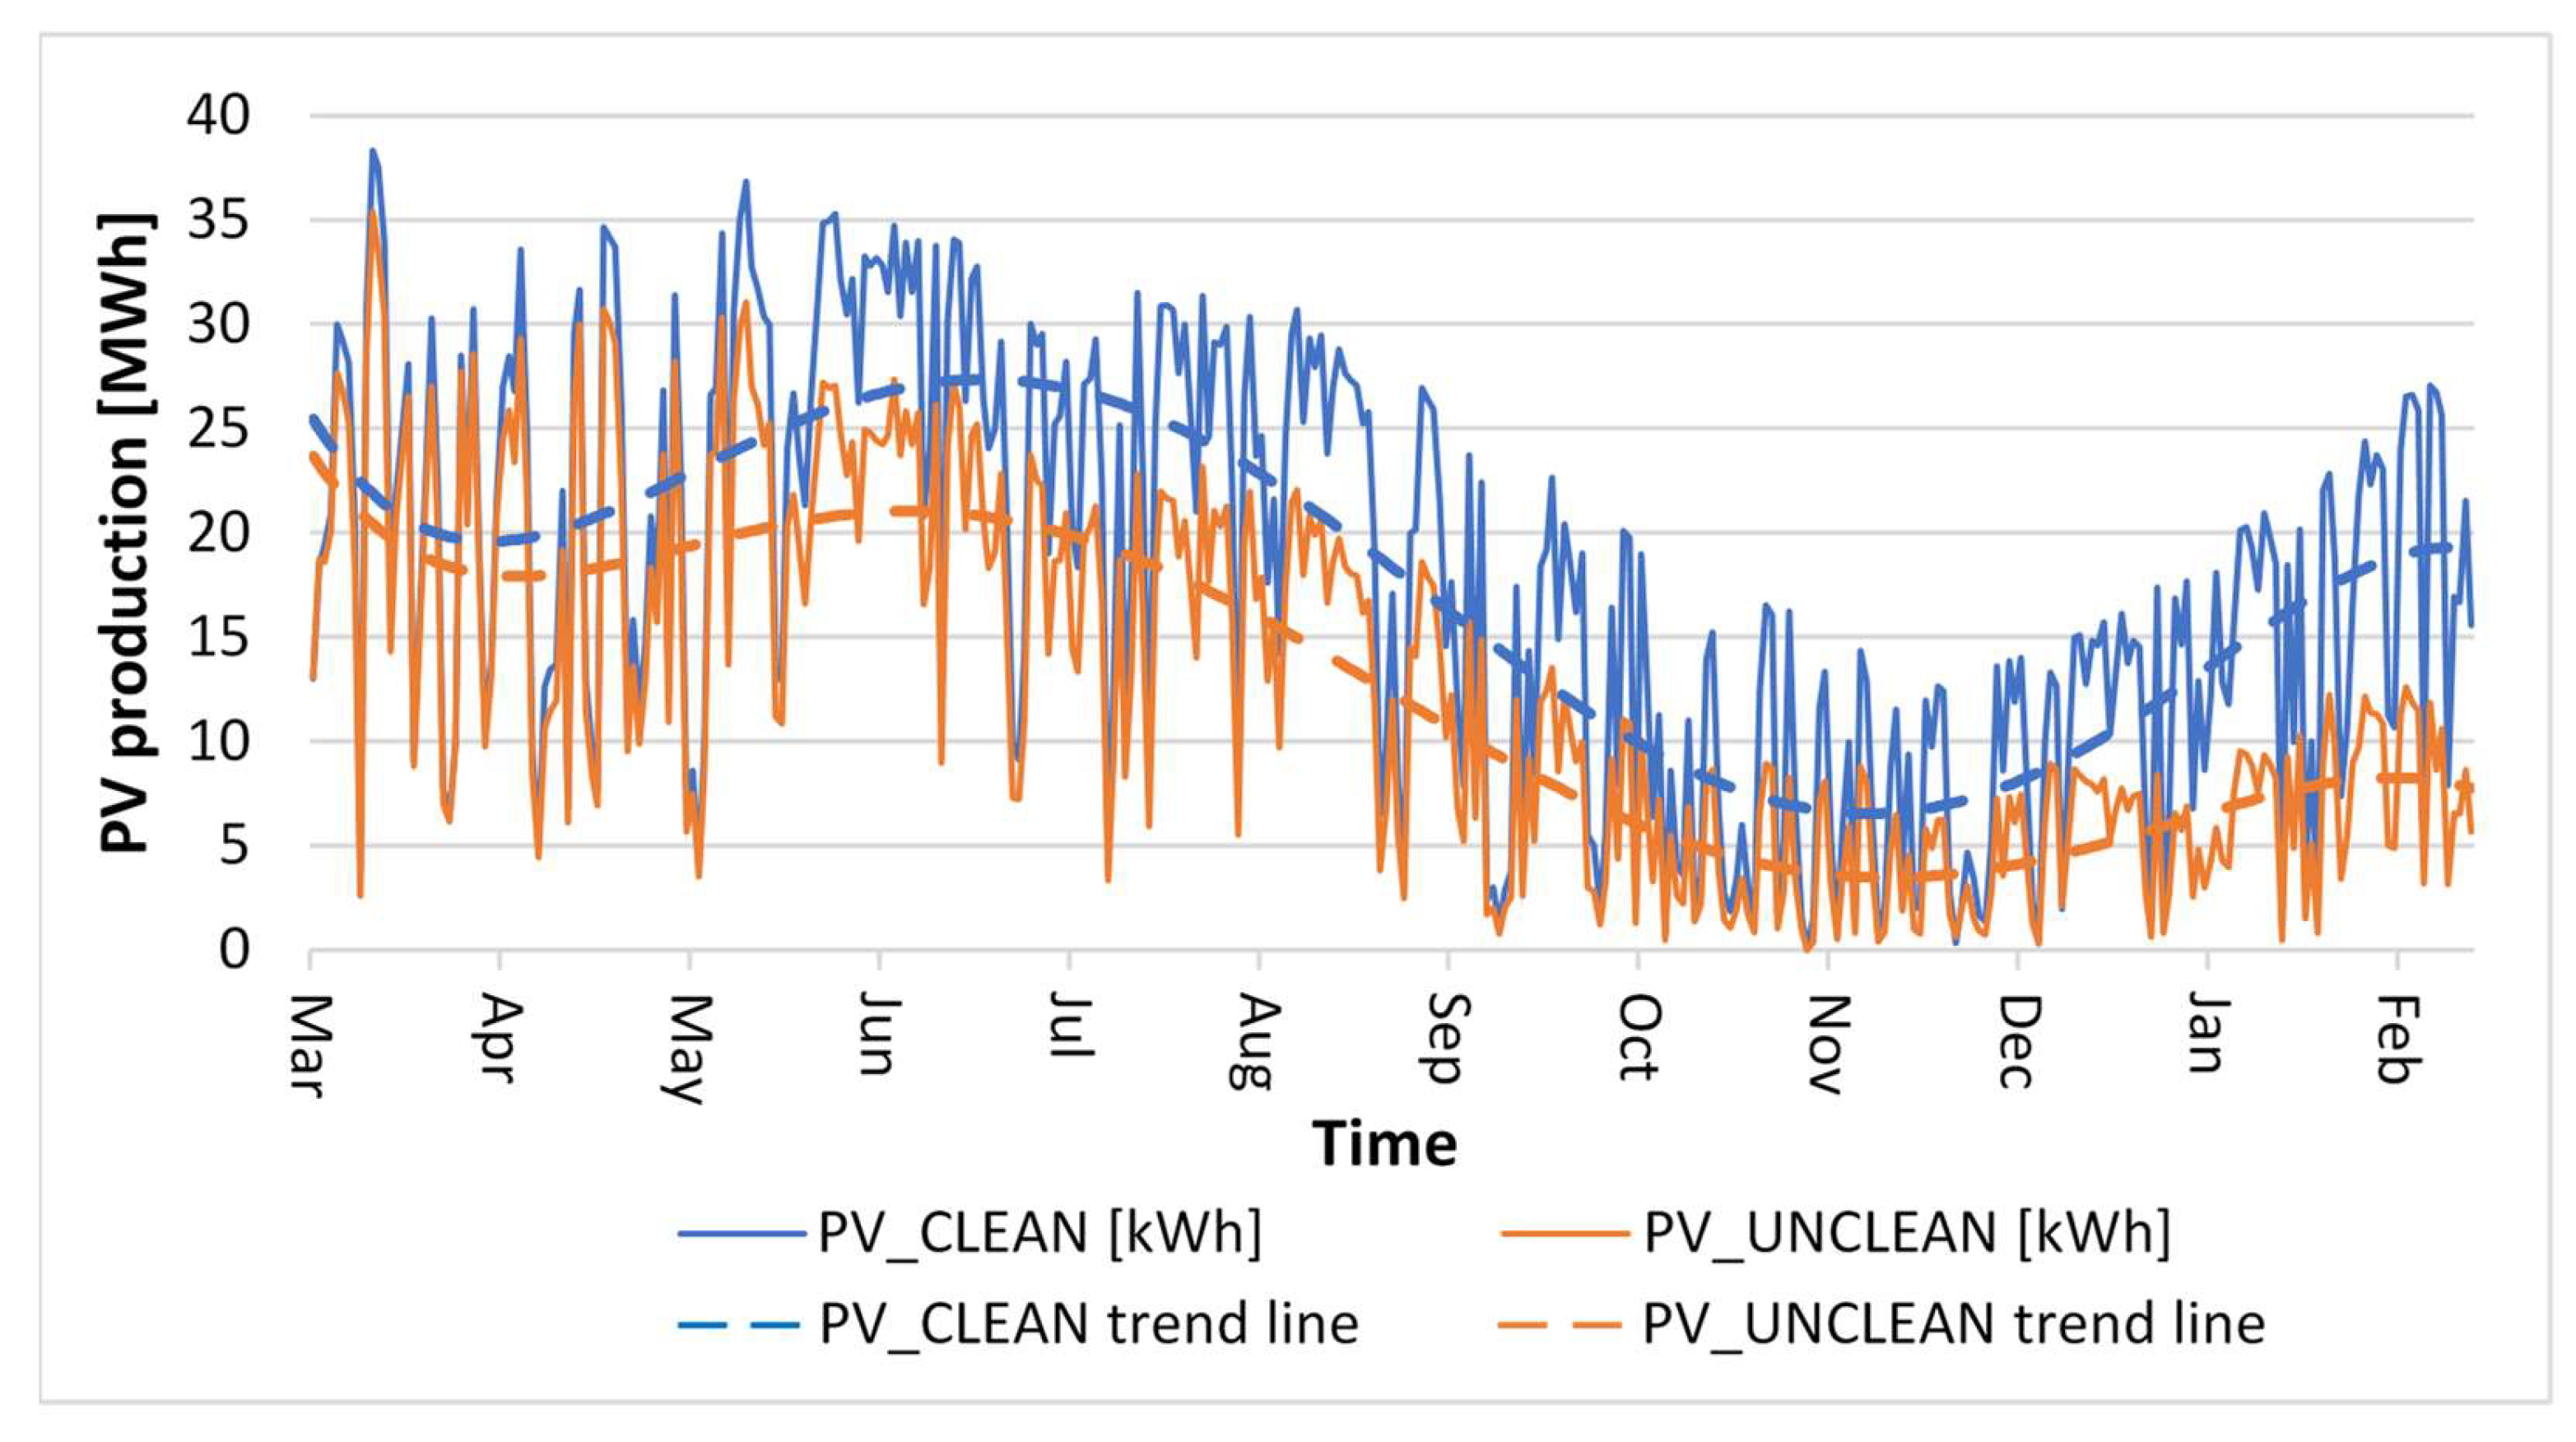
3.1.3. Photovoltaic Power Plant—ECC 8

The steelworks is the most suitable site in the local community for a large rooftop PV installation, with direct access to the 110 kV transmission grid. As shown in Figure 4, its typical daily electricity consumption can absorb the output of a 10 MW PV system without requiring grid infrastructure upgrades. Realistically, up to 5 MW can be installed based on available roof space (ECC 8).
Installing PV would enhance the steelworks’ public image and open the door to establishing a renewable energy community, allowing local stakeholders—including residents, employees, and small to medium-sized local businesses—to participate in ownership, consistent with the National Energy and Climate Plan (NECP).

Industrial Specifics and Empirical Basis for Simulation

Due to the complexity of industrial sites, the choice of installation locations must consider investment risk, irradiation levels, dust impact, and maintenance needs. To assess PV performance in this environment, three test systems (each 2 × 280 Wp modules) were installed on different rooftops. One site included a weather station measuring irradiance and temperature, enabling validation of the simulation model. A long-term study assessed dust accumulation over three phases. The test showed up to a 29% reduction in annual yield if modules are not cleaned, with the cleaned system generating 6460 MWh/year versus 4587 MWh/year without cleaning. The results of the one-year measurements are shown in Figure 5. Differences in production between the modules can be observed, with temporary reductions following heavy rainfall, yet a gradual long-term increase in disparity.
Applying these results to the 5 MW system yields annual generation (cleaned) of 6460 MWh (MP 37), increased community RES share (MP 38), and CO2 emission reduction of 2261 tonnes/year (MP 39). A follow-up study testing nanocoating showed no significant benefit under local dust conditions.

Economic Feasibility and Sensitivity Analysis of PV Plant

A financial model based on a 5 MW PV plant estimates total investment costs at EUR 4.69 million. With average annual savings of EUR 828,270 (from avoided electricity purchases) and assuming no subsidies, the net present value (NPV) over 15 years at a 5% discount rate is EUR 3.91 million. The payback period is under six years. The key assumptions were: an electricity price of EUR 130/MWh (including grid charges), combined annual operational, maintenance, and insurance costs of EUR 16/kW, and no investment support. Sensitivity analysis shows that the investment remains economically viable even with lower electricity prices (down to EUR 110/MWh) or higher operational costs, although the payback period would be extended. The first 166 kW system was installed in 2023, and further investment is under consideration using the validated model.

3.1.4. Small Hydropower Plant—ECC 9

The steel plant requires large quantities of cooling water for its operations. This plant is situated at the foot of a mountain range rich in water sources. A reservoir has been constructed on one of the streams, which, together with a pressure pipeline and the necessary equipment, ensures a stable and continuous supply of cooling water. The spatial integration and infrastructure development required for SHPs pose significant challenges; therefore, the feasibility of installing an SHP within the cooling water supply system was investigated. The SHP is represented as ECC 9 in Figure 3.
Between the accumulation reservoir with a capacity of 12,000 m3 and the steel plant, there is a height difference of 50 metres, which is sufficient for the installation of an SHP. A portion of the water is currently used for technological purposes, while the remaining water overflows into the nearby riverbed. The powerhouse of the SHP would be positioned above the first cooling water basin, thereby fully utilising the available hydropower potential. The maximum water flow is 550 l/s (MP 41). Considering a system efficiency of 0.77, the theoretical potential amounts to 208 kW. Based on hydrological data, the SHP could operate for 7000 h per year, generating 1454 MWh of electricity (MP 40). The hydrological calculations are based on publicly available long-term flow data for the relevant watercourse, collected between 2012 and 2022 from the official archive of the Slovenian Environment Agency (ARSO). Electricity production from SHP would increase RES production of the community (MP 42) and reduce CO2 emissions by 509 tonnes (MP 43).
To strengthen the reliability of the modelled results, a sensitivity analysis was conducted for two typical operating scenarios with flow rates of 0.050 m3/s and 0.550 m3/s. The analysis examined the influence of ±25% variations for three key input parameters—turbine efficiency, annual operating hours, and flow rate—on electricity generation. The results showed that production output is most sensitive to changes in flow rate and turbine efficiency, while operating hours had a more linear, but still significant impact. These findings confirm that the estimated electricity production of 1454 MWh per year lies within a robust range even under moderate parameter uncertainty.

3.1.5. Green Hydrogen Production—ECC 10

The proposed green hydrogen production unit (ECC 10) is intended primarily to cover internal demand at the steel plant, where approximately 30 tonnes of grey hydrogen are currently consumed annually as a technical gas. A secondary objective is to inject a portion of the produced hydrogen into the natural gas grid (monitored at MP 03). The planned measurements include electricity consumption (MP 44) and hydrogen production (MP 45). This initiative supports the objectives of Slovenia’s National Energy and Climate Plan (NECP) [28], which foresees up to 10% renewable gas in the natural gas system by 2030. Due to the site’s location at the interface of electricity and gas infrastructure, the hydrogen plant could provide added value through sector coupling, flexibility services, or decarbonisation of local transport.
A techno-economic assessment was carried out for a 660 kW electrolyser operating 4000 h annually, yielding approximately 54 tonnes of hydrogen per year: 32 tonnes for use as a technical gas and 22 tonnes for injection into the natural gas grid. Electricity demand for this production would total around 2.64 GWh annually. Sensitivity analyses explored the effects of varying electricity prices and levels of government support. At current prices (EUR 100/MWh) and without subsidies, the levelised cost of hydrogen (LCOH) is estimated at EUR 10.9/kg, making the investment economically challenging. However, if 50% of the capital cost is covered by subsidies and electricity is procured at EUR 50/MWh, the LCOH drops to EUR 5.7/kg, indicating significantly improved viability. These calculations were based on public electricity pricing data and standardised investment assumptions, and were implemented using structured spreadsheet modelling.
While hydrogen production has not yet been physically implemented, this preliminary analysis—carried out as part of strategic planning—demonstrates how ECC modelling can incorporate economic feasibility and scenario-based sensitivity analysis to guide future investment decisions.

3.1.6. Reuse of Excess Heat in Energy-Intensive Production and District Heating—ECC 11 to ECC 13

The potential for reusing excess heat from energy-intensive production processes was assessed for both internal recovery and integration into the district heating system. From the perspective of district heating operators, alternative upgrades—such as the replacement of natural gas-based cogeneration units with biomass or heat-pump systems—were also considered. However, in accordance with the energy efficiency hierarchy defined in Slovenia’s National Energy and Climate Plan (NECP) [28], the reuse of industrial excess heat is prioritised wherever it is economically feasible. Sector coupling between industry and district heating providers is promoted through a set of government incentives, although under the current policy framework, investments by industry must still be justified by revenues from heat sales, which remains a notable barrier. A successful domestic example has already been demonstrated, where industrial excess heat is integrated into district heating without public subsidies [29].
In the steelworks, various processes generate excess heat (ECC 13, MP 61). This heat is utilised (MP 47) and stored using dedicated infrastructure (ECC 11), and subsequently reused within the production process in the form of hot water or steam (MP 57), primarily to displace electricity and natural gas consumption, thereby reducing CO2 emissions (MP 48). Any surplus heat is supplied to the local district heating network (ECC 12, MP 49), contributing to a reduction in natural gas usage for municipal heating.

Dynamic Modelling and Scenario Simulation

A comprehensive simulation model was developed in the Matlab environment, incorporating 31 first-order delay and dead-time transfer functions, two first-order delay transfer functions, eight thermal storage units, 33 two-position controllers, 22 measurement inputs (at 15 min intervals), and 236 adjustable parameters. Simulation scenarios were selected via a dashboard interface, enabling the inclusion or exclusion of specific sources and sinks. Several utilisation scenarios were modelled, clearly demonstrating the effect of different configurations on system efficiency and economic outcomes. To support the identification of optimal configurations, pinch analysis was applied. This confirmed that the ECC model provides a suitable structure for incorporating classical thermodynamic optimisation methods. As such, the ECC framework was shown to be compatible with both high-level system design and detailed intra- and inter-ECC optimisation. A full technical account of this modelling approach is available in [30], and only key findings are summarised here. The simulations indicated that up to 11,440 MWh of excess heat could be recovered annually, resulting in savings of 1684 MWh of electricity and 817,174 Nm3 of natural gas within the steelworks. Furthermore, 3,299,676 Nm3 of natural gas could be saved in the district heating system, corresponding to approximately 68.4% of the community’s annual heating demand.

Economic Feasibility and Sensitivity Analysis of Excess Heat Reuse

The economic analysis was conducted for three promising reuse configurations. The most favourable scenario included the full utilisation of all identified industrial sources and their integration with both urban and suburban district heating networks. The total investment cost for this configuration was estimated at EUR 22.5 million. Annual energy savings were projected at EUR 3,562,371, while annual maintenance costs, calculated at 5% of investment value, amounted to EUR 1,125,000, resulting in net annual savings of EUR 2,437,371. The analysis was based on a 15-year depreciation period and a 5% discount rate. Prices were set at EUR 130/MWh for electricity (including grid charges), EUR 0.60/Nm3 for natural gas, EUR 70/MWh for heat sales, and EUR 80 per tonne for CO2. Under these assumptions, NPV was calculated at EUR 2.80 million, with a simple payback period of 9.2 years. In a variant scenario assuming 50% investment support—such as from national or EU energy programmes—the required capital investment was reduced to EUR 11.25 million, while annual savings remained unchanged. This yielded a shortened payback period of 4.6 years and a significantly higher NPV of EUR 14.05 million. These results indicate that large-scale integration of industrial excess heat into local heating systems can represent a viable and cost-effective low-carbon investment, particularly when supported by appropriate policy mechanisms.

3.2. The Overall Contribution of the Energy Community to Achieving Sustainability Goals

A PV plant with a capacity of 5 MW, when installed in an optimal location with low dust accumulation or maintained through regular cleaning, would be expected to generate approximately 6460 MWh of electricity annually. An SHP would contribute an additional 1454 MWh per year under average hydrological conditions. Combined, PV and SHP would account for 7914 MWh of renewable electricity generation, representing an increase of up to 87% compared to the local community’s total electricity production in 2021 (9086 MWh). In addition, an electricity saving of 1684 MWh per year would be realised through the use of excess heat, resulting in a total annual saving of 9598 MWh. Based on Slovenia’s electricity mix for the same year, with an emission factor of 0.35 tonnes CO2 per MWh, this saving would correspond to a reduction of 3359 tonnes of CO2 emissions annually. The reuse of excess heat within the steel plant would lead to a reduction in natural gas consumption of 817,174 Nm3, while its utilisation in the district heating system would result in an additional saving of 3,299,676 Nm3. In total, this represents 4,116,850 Nm3 of natural gas saved. Using an emission factor of 0.00185215 tonnes CO2 per Nm3, a further reduction of 7625 tonnes of CO2 emissions per year would be achieved.
Altogether, the planned measures within the energy community would result in an annual CO2 emissions reduction of 10,984 tonnes. When compared to the total energy-related CO2 emissions in the community in 2021—25,004 tonnes from households (ECC 1), 1908 tonnes from public buildings (ECC 2), 33,417 tonnes from transport (ECC 3), and 207,833 tonnes from industry (ECC 13)—the realisation of the project would deliver an overall reduction of approximately 4%.

3.3. Results of the Economic Feasibility Analysis

The ECC structure enabled a modular assessment of the economic viability of each project segment. By framing the analysis at the level of the entire local community, mutual interactions among individual ECCs were taken into account, thus supporting integrated investment planning. For instance, in the case of green hydrogen production, potential synergies were explored between its use in steel manufacturing, injection into the gas grid, and the provision of balancing services. The results of the economic analysis for the most relevant project components are summarised below.
  • The provision of system-balancing services through a dedicated battery storage system (ECC 7), assuming a 10-year operational lifetime, a discount rate of 5%, and standard maintenance costs, resulted in a net present value (NPV) of EUR 3.84 million. The corresponding payback period was calculated at 5.7 years.
  • The 5 MW photovoltaic system (ECC 8), based on a 15-year investment horizon, a 5% discount rate, and including annual operational, maintenance, and insurance costs, achieved an NPV of EUR 3.91 million. The payback period was estimated at 6.0 years.
  • The small hydropower plant (SHP, ECC 9), with a 30-year economic lifetime and under average hydrological conditions, yielded an NPV of EUR 2.68 million with a payback period of 8 years, assuming no investment subsidies and a 5% discount rate.
  • Under current market conditions, green hydrogen production (ECC 10) was not found to be economically viable, even when assuming 100% investment support. High electricity prices and limited income from hydrogen sales currently result in a negative NPV. However, if periods of low or negative electricity prices due to RES surpluses become more frequent or if additional support schemes are introduced, the investment could become justified, particularly as a means of providing flexibility services to the grid.
  • For the reuse of excess heat (ECC 11 to ECC 13), three implementation scenarios were evaluated, involving different configurations of internal reuse and district heating integration. In the most favourable case, assuming full recovery and connection to both urban and suburban district heating systems, the payback period was 9.2 years and the NPV reached EUR 2.80 million. With 50% investment support, the payback period was reduced to 4.6 years and the NPV increased to EUR 14.05 million.
These results confirm that the combined application of ECC-based modelling and scenario analysis enables effective investment prioritisation, especially when applied to complex, sector-coupled energy systems at the local community level.

4. Discussion

The aim of this research, which addresses energy use analysis and sector coupling in the energy community, was to demonstrate through both conceptual framework- and scenario-based modelling how targeted efforts can foster collaboration among key stakeholders in the local environment and improve the process of developing viable sustainable energy projects. The study has provided valuable insights into the effective modelling and feasibility assessment of complex local energy projects involving multiple energy vectors.
The practical application of the developed energy consumption analysis model based on the ECC framework has confirmed that effective communication and data accessibility are critical challenges and key success factors in planning complex energy communities. These findings are consistent with the conclusions of Billereck et al. [31]. Standardised data collection protocols and the establishment of reliable data-sharing platforms could mitigate these challenges and further enhance the model’s replicability and scalability [32].
In the examined case study, key stakeholders recognised the need for coordinated actions and joint efforts in addressing national energy and climate challenges. The findings are aligned with those of Fischer et al. [33], who emphasize the importance of involving different actors in energy efficiency planning. The review of Slovenia’s NECP also highlighted the necessity of a holistic approach to long-term energy infrastructure planning and project optimisation, as confirmed by Ceglia et al. [34].
The results of the proposed approach contribute to increasing the utilisation of RES, hydrogen production, battery storage systems, and—most notably—the integration of industrial excess heat within the local community. Despite the model’s success in the analysed case, challenges remain regarding its replicability, primarily due to the required precision of input data and the reluctance of some industrial entities to share information. Future research should prioritise developing automated data-collection and -processing systems, as well as the integration of advanced digital tools such as artificial intelligence and machine learning. A more in-depth examination of the role of the Internet of Things (IoT), artificial intelligence (AI), and machine learning in real-time energy consumption monitoring is urgently required. These technologies hold the potential to significantly improve the ECC model’s accuracy and responsiveness, leading to more effective decision-making in operational environments, in line with the findings of Olabi et al. [32].
A key premise of the ECC model is the concept of ownership over individual cost centres—not in a legal sense, but in terms of dedicated and competent responsibility for their operation and continuous improvement. This also extends to efforts in establishing ECCs identified as optimal additional components of the energy community. Both in the modelling phase and during implementation, public engagement has proven essential, following a transparent communication strategy that facilitates social acceptance and ensures a more equitable distribution of benefits among community members [35]. Furthermore, educational campaigns should be designed to enhance understanding and support for energy efficiency measures [36].
The ECC model structure employed in the case study consisted of a macro-level community assessment (ECC 1 to ECC 5 and ECC 12, ECC 13) alongside a focused evaluation of units pertinent to the project (ECC 6 to ECC 11, and partly ECC 12 and ECC 13). This configuration enabled a streamlined overview of the entire community while simultaneously allowing detailed examination of new elements and their impacts. In future analyses, additional components—as well as novel energy and material vectors—could be incorporated, thereby adapting the ECC model’s scope to meet evolving evaluative needs. Moreover, this structure supports the calculation of several notable sustainability indicators.
An additional benefit of the ECC-based approach lies in its compatibility with established thermodynamic optimisation methods. In the modelling of excess heat reuse, pinch analysis was applied to identify optimal source–sink configurations. This demonstrated that ECCs can effectively serve as a structural foundation for integrating both high-level planning and detailed thermodynamic optimisation techniques. The ability to couple the systemic modularity of ECCs with classical methods such as pinch analysis [7,15,19] substantially enhances the practical applicability of the model, particularly in complex industrial environments. It also confirms that the ECC framework is not limited to strategic or conceptual modelling, but can support fine-grained engineering analysis within and between individual cost centres.
The proposed approach to sustainable energy planning incorporates advanced community-level energy consumption analysis (covering both energy sources and demand) using sophisticated ECC-based models. The integration of energy sectors, such as electricity and heat supply, necessitates the development of complex models for analysing the potential of excess heat recovery, renewable energy deployment, and energy conversion and energy storage. The study particularly underscores the importance of continuous and structured collaboration among key stakeholders in the pursuit of sustainable solutions, the development and testing of tools for improved local infrastructure planning, and the integration of energy sectors.
A known limitation of the ECC-based model lies in the heterogeneity and occasional incompleteness of available data across different energy cost centres. While some subsystems are equipped with detailed monitoring infrastructure, others rely on aggregate statistics or expert estimates. To mitigate this, the model incorporates proxy values and scenario-based assumptions to compensate for missing or unreliable data. Although this allows continued analysis under imperfect conditions, it inevitably introduces uncertainty into the results. Consequently, transparency in data sourcing and sensitivity testing becomes critical. Future implementations would benefit from enhanced data granularity and broader deployment of real-time monitoring systems, particularly in decentralised industrial environments.
Despite the advantages demonstrated by the ECC-based model in supporting integrated energy planning, several limitations emerged during its practical application. First, the heterogeneity of subsystems within the local community results in uneven data quality. While certain infrastructure components are equipped with modern monitoring systems, others rely solely on annual statistical reports. This discrepancy hinders uniform model granularity and introduces uncertainty in aggregated assessments. Second, the accessibility and completeness of data across different energy cost centres vary significantly. Some datasets are publicly available and well structured, while others are fragmented or proprietary. This not only complicates modelling efforts but also limits the replicability of the approach without local institutional support. Third, stakeholder engagement proved to be inconsistent. While some actors actively supported strategic planning efforts, many remained hesitant to engage or share operational data. The success of the model is therefore strongly dependent on trust-building and communication strategies at the community level. Finally, due to the model’s modular design, it allows for in-depth analysis of selected ECCs while maintaining a broader system overview. However, simplifications within non-prioritised ECCs may obscure their full potential for energy savings or emissions reduction. These areas warrant further investigation in future research.

5. Conclusions

The feasibility of jointly planning sustainable energy projects between industrial stakeholders and local communities has been examined through a detailed case study. The ECC-based model has been shown to enable structured identification and evaluation of energy flows, as well as to support integrated decision-making at the community level.
Measurable impacts—such as electricity and natural gas savings and CO2 reductions—have been demonstrated, and the model’s flexibility has allowed for the tailoring of analytical detail to the quality and availability of data for each ECC.
However, several limitations must be acknowledged. The successful implementation of the model has been found to depend on the availability of high-resolution data, the maturity of digital infrastructure, and the willingness of stakeholders to participate in transparent planning processes. Simplifications required for certain ECCs may limit the accuracy of aggregate sustainability indicators.
Future work should be directed towards automating data acquisition through IoT systems, expanding digital tools such as AI and machine learning for real-time monitoring and forecasting, and developing policy instruments to incentivise data sharing and stakeholder collaboration.
To support broader deployment, the creation of publicly accessible model templates and a modular knowledge base has been identified as a potential next step. Moreover, guidance for policymakers and planners on adapting the ECC model to different regulatory or socio-economic contexts should be developed in future research.

Author Contributions

Conceptualisation, E.K.; methodology, E.K. and B.S.; software, E.K.; validation, E.K., B.S., M.L. and T.S.; formal analysis, E.K., B.S., M.L. and T.S.; investigation, E.K., M.L. and T.S.; resources, B.S.; data curation, E.K., B.S., M.L. and T.S.; writing—original draft preparation, E.K.; writing—review and editing, E.K., B.S., M.L. and T.S.; visualisation, E.K. All authors have read and agreed to the published version of the manuscript.

Funding

This research received no external funding.

Data Availability Statement

Data available on request due to restrictions (privacy).

Acknowledgments

The authors would like to thank the European Commission, the partners of the European Union’s Horizon 2020 research and innovation programme project CREATORS—CREATing cOmmunity eneRgy Systems (https://cordis.europa.eu/project/id/957815 (accessed on 25 February 2025)) and the Slovenian Research and Innovation Agency (ARIS) under research program P2-00075 (Modelling and environmental impact assessment of processes and energy technologies) for their support.

Conflicts of Interest

The authors declare no conflicts of interest.

Abbreviations

The following abbreviations are used in this manuscript:
AIartificial intelligence
ARSOSlovenian Environment Agency
BESSbattery energy storage system
CAPEXcapital expenditures
CO2carbon dioxide
ECCenergy cost centre
IoTInternet of Things
IPCCIntergovernmental Panel on Climate Change
kg/skilogram per second
LCOHlevelised cost of hydrogen
m3/scubic metre per second
MPmeasurement point
MWhmegawatt hour
NECPNational Energy and Climate Plan
NPVnet present value
Nm3normal cubic metre—the amount of dry gas that occupies a volume of one cubic meter at a temperature of 273.15 K
OPEXoperational expenditure
PVphotovoltaic power plant
RESrenewable energy sources
SHPsmall hydropower plant
TAPEdeviation indicator between forecast and actual electricity consumption, named after historical ticker tape systems used to record market transactions
tonnemetric ton = 1000 kg
TSOtransmission system operator
Wpwatt-peak

References

  1. Gjorgievski, V.Z.; Cundeva, S.; Georghiou, G.E. Social arrangements, technical designs and impacts of energy communities: A review. Renew. Energy 2021, 169, 1138–1156. [Google Scholar] [CrossRef]
  2. Heldeweg, M.A.; Saintier, S. Renewable energy communities as ‘socio-legal institutions’: A normative frame for energy decentralization? Renew. Sustain. Energy Rev. 2020, 119, 109518. [Google Scholar] [CrossRef]
  3. Dóci, G.; Vasileiadou, E.; Petersen, A.C. Exploring the transition potential of renewable energy communities. Futures 2015, 66, 85–95. [Google Scholar] [CrossRef]
  4. Auders, M.; Lapuke, S. Evolving Concept of Energy Communities in the European Union. Latv. J. Phys. Tech. Sci. 2024, 61, 53–60. [Google Scholar] [CrossRef]
  5. Lowitzsch, J.; Hoicka, C.E.; Tulder, F.J. Renewable energy communities under the 2019 European Clean Energy Package—Governance model for the energy clusters of the future? Renew. Sustain. Energy Rev. 2020, 122, 109489. [Google Scholar] [CrossRef]
  6. Li, N.; Okur, Ö. Economic analysis of energy communities: Investment options and cost allocation. Appl. Energy 2023, 336, 120706. [Google Scholar] [CrossRef]
  7. Kemp, I.C. Pinch Analysis and Process Integration: A User Guide on Process Integration for the Efficient Use of Energy, 2nd ed.; Elsevier/Butterworth-Heinemann: Amsterdam, The Netherlands, 2007. [Google Scholar]
  8. Mišljenović, N.; Žnidarec, M.; Knežević, G.; Šljivac, D.; Sumper, A. A Review of Energy Management Systems and Organizational Structures of Prosumers. Energies 2023, 16, 3179. [Google Scholar] [CrossRef]
  9. Bohvalovs, G.; Vanaga, R.; Brakovska, V.; Freimanis, R.; Blumberga, A. Energy Community Measures Evaluation via Differential Evolution Optimization. Environ. Clim. Technol. 2022, 26, 606–615. [Google Scholar] [CrossRef]
  10. Makatora, D.; Makatora, A.; Zenkin, M.; Mykhalko, A.; Shostachuk, O. Organizational and Economic Mechanism of Improving Energy Costs in the Technological and Process Constant of the Printing Industry. Manag. Theory Stud. Rural. Bus. Infrastruct. Dev. 2024, 46, 609–618. [Google Scholar] [CrossRef]
  11. Mickovic, A.; Wouters, M. Energy costs information in manufacturing companies: A systematic literature review. J. Clean. Prod. 2020, 254, 119927. [Google Scholar] [CrossRef]
  12. Teplická, K.; Khouri, S.; Mehana, I.; Petrovská, I. Energy Cost Reduction in the Administrative Building by the Implementation of Technical Innovations in Slovakia. Economies 2024, 12, 260. [Google Scholar] [CrossRef]
  13. Sola, A.V.H.; Mota, C.M.M. Influencing factors on energy management in industries. J. Clean. Prod. 2020, 248, 119263. [Google Scholar] [CrossRef]
  14. Morvaj, Z.; Gvozdenac, D.; Tomšić, Ž. Sustavno Gospodarenje Energijom i Upravljanje Utjecajima na Okoliš u Industriji; Energetika marketing: Zagreb, Croatia, 2016; pp. 130–135. [Google Scholar]
  15. Linnhoff, B.; Hindmarsh, E. The pinch design method for heat exchanger networks. Chem. Eng. Sci. 1983, 38, 745–763. [Google Scholar] [CrossRef]
  16. Tutak, M.; Brodny, J.; Bindzár, P. Assessing the Level of Energy and Climate Sustainability in the European Union Countries in the Context of the European Green Deal Strategy and Agenda 2030. Energies 2021, 14, 1767. [Google Scholar] [CrossRef]
  17. Lode, M.L.; Heuninckx, S.; Boveldt, G.; Macharis, C.; Coosemans, T. Designing successful energy communities: A comparison of seven pilots in Europe applying the Multi-Actor Multi-Criteria Analysis. Energy Res. Soc. Sci. 2022, 90, 102671. [Google Scholar] [CrossRef]
  18. Bovera, F.; Schiavo, L.L. From energy communities to sector coupling:a taxonomy for regulatory experimentation in the age of the European Green Deal. Energy Policy 2022, 171, 113299. [Google Scholar] [CrossRef]
  19. Linnhoff, B. Use pinch analysis to knock down capital costs and emissions. Chem. Eng. Prog. 1994, 90, 33–57. [Google Scholar]
  20. Morvay, Z.K.; Gvozdenac, D.D. Applied Industrial Energy and Environmental Management; Wiley & Sons: Chichester, UK, 2008. [Google Scholar]
  21. Mikulčić, H.; Baleta, J.; Klemeš, J.J.; Wang, X. Energy transition and the role of system integration of the energy, water and environmental systems. J. Clean. Prod. 2021, 292, 126027. [Google Scholar] [CrossRef]
  22. Klemeš, J.J.; Lam, H.L. Process integration for energy saving and pollution reduction. Energy 2011, 36, 4586–4587. [Google Scholar] [CrossRef]
  23. Sučić, B.; Košnjek, E.; Đorić, M.; Al_Mansour, F.; Matkovič, M.; Damjan, T. Innovative approach to implementing advanced energy projects in urban areas—From comprehensive simulation to actual implementation. In Proceedings of the 16th International Conference on Sustainable Energy & Environmental Protection, Vienna, Austria, 9–12 September 2024. [Google Scholar]
  24. Občina Jesenice, Lokalni Energetski Koncept Občine Jesenice za Obdobje 2022 do 2032. 2022. Available online: https://www.jesenice.si/obcina-jesenice/razvojni-dokumenti/item/24404-lokalni-energetski-koncept-2022-2032 (accessed on 10 March 2025).
  25. The International Energy Agency (IEA). World Energy Outlook 2021; IEA/OECD: Paris, France, 2021; Available online: https://www.iea.org/reports/world-energy-outlook-2021 (accessed on 25 February 2025).
  26. Rootzén, J.; Johnsson, F. CO2 emissions abatement in the Nordic carbon-intensive industry—An end-game in sight? Energy 2015, 80, 715–730. [Google Scholar] [CrossRef]
  27. The International Energy Agency (IEA). Iron and Steel Technology Roadmap: Towards more Sustainable Steelmaking; IEA: Paris, France, 2020; Available online: https://www.iea.org/reports/iron-and-steel-technology-roadmap (accessed on 25 February 2025).
  28. Ministry of Environment, Climate and Energy; Updated Integral National Energy and Climate Plan of the Republic of Slovenia, Ljubljana, 18 December 2024. Available online: https://www.energetika-portal.si/fileadmin/dokumenti/publikacije/nepn/dokumenti/nepn2024_final_dec2024.pdf (accessed on 5 February 2025).
  29. Malinauskaite, J.; Jouhara, H.; Egilegor, B.; Al-Mansour, F.; Ahmad, L.; Pusnik, M. Energy efficiency in the industrial sector in the EU, Slovenia, and Spain. Energy 2020, 208, 118398. [Google Scholar] [CrossRef]
  30. Košnjek, E.; Sučić, B.; Kostić, D.; Smolej, T. An energy community as a platform for local sector coupling: From complex modelling to simulation and implementation. Energy 2024, 286, 129478. [Google Scholar] [CrossRef]
  31. Billerbeck, A.; Fritz, M.; Aydemir, A.; Manz, P. Strategic Heating and Cooling Planning to Shape Our Future Cities. In Proceedings of the European Council for an Energy-Efficient Economy (ECEEE Summer Study)—Panel 5: Towards Sustainable and Resilient Communities, Hyères, France, 6–11 June 2022. [Google Scholar]
  32. Olabi, A.G.; Abdelkareem, M.A.; Jouhara, H. Energy digitalization: Main categories, applications, merits, and barriers. Energy 2023, 271, 126899. [Google Scholar] [CrossRef]
  33. Fischer, J.; Alimi, D.; Knieling, J.; Camara, C. Stakeholder Collaboration in Energy Transition: Experiences from Urban Testbeds in the Baltic Sea Region. Sustainability 2020, 12, 9645. [Google Scholar] [CrossRef]
  34. Ceglia, F.; Esposito, P.; Marrasso, E.; Sasso, M. From smart energy community to smart energy municipalities: Literature review, agendas and pathways. J. Clean. Prod. 2020, 254, 120118. [Google Scholar] [CrossRef]
  35. Farid, H.M.A.; Iram, S.; Shakeel, H.M.; Hill, R. Enhancing stakeholder engagement in building energy performance assessment: A state-of-the-art literature survey. Energy Strategy Rev. 2024, 56, 101560. [Google Scholar] [CrossRef]
  36. Biegańska, M. IoT-Based Decentralized Energy Systems. Energies 2022, 15, 7830. [Google Scholar] [CrossRef]
Figure 1. Development of a model for energy use analysis based on the ECC structure.
Energies 18 02688 g001
Figure 2. Material and energy flows represented using the ECC structure (part one).
Energies 18 02688 g002
Figure 3. Material and energy flows represented using the ECC structure (part two).
Energies 18 02688 g003
Figure 4. Typical hourly electricity consumption diagram of the steelworks.
Energies 18 02688 g004
Figure 5. Impact of dust particles on electricity production of the test PV system.
Energies 18 02688 g005
Table 2. Measurement points of the model for energy usage analysis based on ECC.
MPDescription of the Measurement Point (MP) ParameterData Source/
Calculation Responsibility
01Electricity consumption from the electricity transmission gridElectricity TSO
02Provision/use of electricity system services by the TSOElectricity TSO
03Locally produced hydrogen injected into the gas transmission networkGas TSO
04Use of natural gas in the heating stations of the district heating systemGas TSO
05Supply of ‘grey’ hydrogenH2 suppliers/project team
06Energy supply in the form of wood biomassSuppliers/SECAP team
07Energy supply in the form of gasoline and dieselSuppliers/SECAP team
08Cooling water flowSteelworks
09Reduction in CO2 emissions due to new RES and the use of excess heatSECAP team/project team
10The overall contribution of the project to achieving the national RES targetSECAP team/project team
11Electricity consumption in householdsElectricity TSO
12Natural gas consumption in householdsGas TSO
13Energy use in the form of heating oil in householdsSuppliers/SECAP team
14Energy use in the form of wood biomass in householdsSuppliers/SECAP team
15Heat use from district heating systems in householdsDistrict heating operator
16CO2 emissions from energy use in householdsSECAP team/project team
17Electricity consumption in municipal public buildingsElectricity TSO
18Natural gas consumption in municipal public buildingsGas TSO
19Energy use in the form of heating oil in municipal public buildingsMunincipality/SECAP team
20Energy use in the form of wood biomass in municipal public buildingsSECAP team/project team
21Heat use from district heating systems in municipal public buildingsDistrict heating operator
22CO2 emissions from energy use in municipal public buildingsSECAP team/project team
23Electricity consumption in transportElectricity TSO
24Natural gas consumption in transportSuppliers/SECAP team
25Hydrogen consumption in transportSuppliers/SECAP team
26Energy use in the form of gasoline and diesel in transportSuppliers/SECAP team
27CO2 emissions from energy use in transportSECAP team/project team
28Electricity generation from existing RESElectricity TSO
29Contribution of existing sources to achieving the national RES targetSECAP team/project team
30Reduction in CO2 emissions due to the use of RESSECAP team/project team
31Electricity use for public lightingElectricity TSO
32CO2 emissions from electricity use for public lightingSECAP team/project team
33Electricity consumption and discharge from battery storage unit 1Electricity TSO
34Provision of system services with battery storage unit 1Electricity TSO
35Electricity consumption and discharge from battery storage unit 2Steelworks
36Provision of system services with battery storage unit 2Steelworks
37Electricity production in the PVElectricity TSO
38Contribution of the PV power plant to achieving the national RES targetSteelworks/project team
39Reduction of CO2 emissions due to electricity production in the PVSteelworks/project team
40Used cooling water flow for operating an SHPSteelworks
41Electricity production in the SHPSteelworks
42Contribution of the SHP to achieving the national RES targetSteelworks/project team
43Reduction of CO2 emissions due to electricity production in the SHPSteelworks/project team
44Electricity consumption for hydrogen productionSteelworks
45Hydrogen productionSteelworks
46Total amount of useful excess heat usedSteelworks/project team
47Utilised excess heatSteelworks/project team
48Reduction in CO2 emissions due to the use of excess heatSteelworks/project team
49Heat discharged into the district heating systemSteelworks
50Heat supply to district heating systemDistrict heating operator
51Natural gas consumption in the DH systemDistrict heating operator
52Electricity consumption in industry and servicesElectricity TSO
53Natural gas consumption in industry and servicesGas TSO
54Hydrogen consumption in industry and servicesIndustry/SECAP team
55Use of system services in industry and servicesIndustry
56Energy use in the form of heating oil in industry and servicesIndustry/SECAP team
57Heat use in industry and servicesDistrict heating operator
58Supply of raw materials for steel productionSteelworks
59Quantity of steel products producedSteelworks
60CO2 emissions from in industry and servicesSECAP team/project team
61Generated excess heat in industry and servicesIndustry/project team
Table 3. CO2 emission factors by energy carrier for Slovenia (2021).
Energy CarrierCO2 Emission Factor
Electricity0.350 tonnes CO2/MWh
Natural Gas0.184 tonnes CO2/MWh; 0.00185215 tonnes CO2/Nm3
Gasoline0.249 tonnes CO2/MWh
Diesel0.267 tonnes CO2/MWh
Heating Oil0.270 tonnes CO2/MWh
Woody Biomass0 tonnes CO2/MWh (non-net source of CO2 according to IPCC 1)
1 Intergovernmental Panel on Climate Change.
Disclaimer/Publisher’s Note: The statements, opinions and data contained in all publications are solely those of the individual author(s) and contributor(s) and not of MDPI and/or the editor(s). MDPI and/or the editor(s) disclaim responsibility for any injury to people or property resulting from any ideas, methods, instructions or products referred to in the content.

