2. Research Gap
Despite numerous studies on the reliability of electricity supply in the European Union countries, there is a lack of detailed comparative analyses of SAIDI and SAIFI indicators between Poland and other Member States. Such comparisons are necessary for understanding the specificity of the Polish energy distribution system and for identifying areas requiring improvement [
4]. Currently, the biggest challenge for the smart network management sector is the introduction of AI solutions and integral IoT. In this respect, we notice that the literature lacks current empirical studies on the impact of modern technologies, such as network automation or intelligent management systems, on the indicators of the reliability of energy supply. The problem affects not only the Polish market but also the international market. There is a need to analyse the effectiveness of these technologies in the context of distribution systems. The first comments on this topic appeared fragmentarily in Andrzej Grzybowski’s dissertation. The author concludes that one should agree that a solution that would radically improve the indicators of power continuity would be to abandon overhead lines, replace them with cable lines and introduce remotely controlled switches in all the required network points. However, due to the costs and location problems of the lines in the field, this will not happen in the foreseeable future, hence the appeal to remember the general technical condition of the distribution network or the modernised section when introducing the latest technologies for the construction of new and especially the modernisation of older overhead lines. The often-proposed latest technical solutions, especially in the area of control and supervision, can only lead to an apparent improvement in power continuity indicators. The best example here is the discussed problem of introducing radio-controlled switches to the network, which, by reducing the time of interruptions in certain conditions, can cause a shortening of the operating time of cable lines [
5,
6]. Additionally, the authors in the collective study of the Polish Academy of Sciences from 2024 also came to the conclusion that there is a lack of comprehensive economic analyses of the effects of these interruptions on the Polish economy. It is particularly important to understand the impact of interruptions on various industrial sectors and households [
7]. Current classifications of power outages focus mainly on duration and frequency. However, there is a lack of approaches that take into account both these parameters and their economic effects, which would allow for more precise network management and minimisation of losses. There is also a noticeable lack of parameters for the analysis of supply reliability indicators that take into account the specifics of urban and rural areas. There is a need for comparative studies that will allow for the identification of unique challenges and the development of tailored strategies for different types of areas [
8]. In the era of dynamically developing renewable sources and the growing number of prosumers, the structure of the energy network is becoming increasingly decentralised. However, there is a lack of studies analysing how this decentralisation affects the SAIDI and SAIFI indicators and what challenges and benefits it brings to distribution system operators.
The Ordinance of the Minister of Economy of 4 May 2007 on detailed conditions for the operation of the power system also determines the maximum duration for individual interruptions in energy supply (by individual groups of customers). In the case of entities supplied with voltage below 1 kV, the maximum duration of a single outage cannot be greater than 16 h for a planned outage and 24 h for an unplanned outage. The duration of interruptions per year, which is the sum of the duration of single long and very long interruptions, is limited to 35 h for planned interruptions and 48 h for unplanned ones. Customers connected to voltages higher than 1 kV have the above times set individually and are adapted to the business profile of the respective companies [
8]. The types of energy supply interruptions are shown in
Table 2.
Outages resulting from the maintenance schedule are referred to as planned outages, and their duration is counted from the moment the breaker is opened until the energy supply is resumed. Seven days in advance, using available media and posting appropriate notices in publicly accessible places or notifying (by letter, telephone) each customer individually, but only if they are connected to a network with a rated voltage higher than 1 kV. If the DSO fails to comply with the above obligation, then an unplanned outage is assumed to occur and the management process related to minimising the consequences of the outage is shown in
Figure 1 [
9,
10].
In summary, the identified gaps include (1) a lack of comparative analyses of SAIDI and SAIFI across EU countries, especially for Poland, (2) insufficient integration of economic impact assessment with technical outage metrics, (3) underrepresentation of urban–rural distinctions in reliability analysis and (4) a limited focus on the combined effect of decentralisation and automation on reliability indices. The proposed methodology directly addresses these challenges by offering an integrated, quantitative model that incorporates economic, geographic and technological dimensions.
3. Materials and Methods
In order to fully characterise the transmission and distribution networks in terms of the reliability parameter, detailed analyses and calculations are necessary. A quantitative method is necessary, as well as a qualitative assessment of the failure rate. Both methods are necessary for the entire medium-voltage and low-voltage distribution networks but also for their component parts (elements/devices). An important element of energy management is its instantaneous availability on the network. In contrast to this characteristic, the so-called installed capacity is also distinguished. In order to be able to characterise the reliability parameters associated with energy distribution, it is first necessary to define the technical measures associated with generation sources. J. Paska identifies basic measures characterising the current technical state of generation sources, as shown in Equation (1), where the following is true:
ta—emergency stoppage time per year [h/a],
tpi—annual operating time [h/a]
n—number of blocks
- 1.
Avaibility factor:
where the following is true:
tki—calendar time per year [h/a];
tpi—downtime in reserve per year [h/a].
- 2.
Capacity utilisation rate:
where the following is true:
Nz—installed capacity.
- 3.
Capacity utilisation rate:
where the following is true:
No—available power.
After carrying out an indicator analysis for the period 2000–2016, a steady increase in the failure rate of about 3.5 percentage points can be seen. Consequently, a decrease in the availability rate to about 80% was observed in 2015, while during the period presented, the installed capacity rate took values in the range of 53–58%, and the available capacity rate decreased by 4 percentage points (from 83% to 79%). These parameters clearly indicate a significant increase in distributed sources (RES) and a longer operating time for all sources in the generation pool. The entire structure of installed capacity in 2018–2020, on the other hand, is presented in
Table 3. The total installed capacity over the three years presents itself at 141 975 MW. An increase in this capacity of 860 MW in 2019 and of 2439 MW, respectively, is observed in each year.
An important aspect of the operation of the transmission system is the question of the use of all kinds of equipment and machinery. Reliability studies of power equipment can be carried out using three research methods: analytical, empirical or statistical. In the analytical method, the physical, chemical and other processes that occur in the group of equipment under study are analysed. In the empirical method, reliability studies are carried out under laboratory conditions that are close to the real world. Due to the problems of simulating real operating conditions in laboratory conditions and the long duration of phenomena and processes in the field of reliability, this method is rarely used. The statistical method, on the other hand, involves the collection of statistical data from the operation of electrical power equipment. Despite the common problems with access to reliable empirical data, this method is the most widely used research method [
11]. The most important aspects to be analysed are causes of the outage, seasonality (seasons), temperature, metering analysis of equipment (metering time), restoration period (restoration of the outage), consequences of the outage, value of electricity not supplied to consumers and loss costs incurred as a result of the incident. The independent parameters and the determination methodology for main power substations, medium voltage, MV/LV substations and LV networks are presented below. The breakdown takes into account urban and rural networks. The causes of failure are directly related to weather anomalies referred to as the seasonality of failure. A polynomial of this characteristic, taking into account its approximation function, is presented below. This function can be defined as a mathematical function and has the following form:
where the following is true:
On the basis of the results obtained and historical data, it is possible to identify the sensitive months with the highest and lowest number of incidents, respectively. From the DSO’s point of view, this is very important information that enables appropriate planning and implementation of repairs and periodic inspections during the period with the lowest number of failures. This is because there is a much lower probability of damage to the remaining equipment operating on the network. In addition, this analysis makes it possible to better organise the work of the maintenance and standby brigades for the period with an increased frequency of negative events. A contributing factor of sorts is the external ambient temperature for network equipment. Another indicator of reliability is the operating time of the equipment until a failure occurs T
pr. This period is measured from the start of the standard operation of the device until the event occurs [
12]. The next important indicator is the total failure duration t
a, also referred to as fault clearance time or restoration time. This is related to the determination of the renewed fitness of the equipment to operate correctly on the network. For the DSO, this parameter provides information about the severity of the failure and the potential economic impact on the designated area. The duration of an outage t
pis usually relatively shorter than the total duration of the outage. This is due to two factors: the first is the possibility of a backup power supply, while the second allows the network to operate without some of the equipment, which currently remains faulty. These include, e.g., current and voltage transformers, lightning arresters or capacitor banks. The duration of an emergency outage t
wa is another indicator in the analysis presented here. It is the period of time counted from the moment an object is de-energised (automatically or by a crew) as a result of a fault until that object is energised (after it has been repaired). This time is often not equivalent to the duration of the fault since, after an ad hoc repair of the fault, the equipment itself can be switched on, even though it is still in a faulted state, provided that it can perform partial functions and does not pose a risk to staff, and the final work can be carried out live. A theoretical relationship that can be used to plot the average fault intensity is shown as follows [
13]:
where the following is true:
On the other hand, the failure rate should be presented as follows [
6]:
whereby, knowing the parameters
λ and
q, it is possible to determine the average renewal intensity:
For the conditions outlined above, it can also determine the average intensity of power supply interruptions to consumers λ
p the power supply restoration intensity μ
p or the unreliability coefficient relating to customer outages q
p—indicating the ratio of the total duration of interruptions to customers during the operation of the network. An important economic indicator that determines the losses incurred by the DSO as a result of an outage is the potential of undelivered energy. The value of this parameter is directly dependent on the duration of the interruption of supply to customers, as well as on the consumption of power from the network where the outage occurred. In the event of such an event, customers are not supplied with energy:
where the following is true:
In order to protect against energy shortages with suppliers, this parameter can be secured by means of explicit and implicit reserves. The essence of preventing failures is to avoid the costs associated with them. These costs for the DSO result, as already mentioned, primarily from the lack of energy supply, i.e., loss of profit from the service provided. The costs that are the most important factors in removing failures are the following:
The costs of purchasing new equipment and materials to replace damaged components;
Labour costs for construction equipment, cable lab, etc.;
The labour costs of fitters and other persons involved in fault clearing (man–hour costs);
The cost of travel to the site of the power outage by ambulance and construction equipment (logistics).
Opportunity costs can be determined as follows [
13]:
where the following is true:
The cost of purchasing new equipment will depend on the scale of the incident and can vary widely. As A. Chojnacki describes, in the case of damage to ties, terminals, bridges or other minor network components, the costs are small. Slightly higher are the costs of purchasing equipment such as insulators, lightning arrestors, fuse bases, capacitor banks or switches. In order to reduce the cost of failure, the most expensive equipment is very often not replaced in its entirety but repaired where possible. Therefore, the cost is not always equal to the market price of new equipment. In addition, DSOs very often keep old equipment that breaks down in storage, which has then been overhauled in the relevant factories or reconditioned in-house. The use of such equipment also reduces the material costs of failure. During repairs, specialised equipment is also used, which includes excavators, cranes, skips, loggers and others. The work of this equipment must also be factored into the total cost of removing the breakdown, as well as the human labour factor. Ambulance teams are required to operate the above-mentioned machines and equipment, as well as for many manual jobs (e.g., assembly work). Ultimately, the total cost of a breakdown can be expressed as follows:
where the following is true:
In exceptional situations, the costs of discounts and rebates due to customers in connection with the failure [
8]. should also be taken into account. These losses vary according to the customer, i.e., industrial or municipal customers, and are expressed for industrial customers as [
13]:
Losses due to non-performance or untimely production;
Losses associated with the time needed to restart the process;
Losses resulting from the destruction of raw materials and materials used in production;
Losses resulting from the need to provide studios.
Furthermore, they are expressed for municipal customers [
13]:
Losses resulting from the forced inaction of residents;
Damage losses to perishable foodstuffs;
Losses due to deterioration of sanitary and health conditions;
Losses resulting from the loss of enjoyment of national income while at home.
Economic losses resulting from a curtailment of supply can be determined by factors such as the value of the cost of losses occurring during a supply disruption, the determination of the characteristics of the cost of losses
Kl(
ta) or determining the economic equivalent of undersupplied energy. Correspondingly, for industrial consumers, the cost of losses has the following form [
11]:
where the following is true:
In contrast, ancillary costs in this view include the following:
Additional staff and material and energy costs associated with starting the shutdown;
Costs of damage to raw materials and materials resulting from unexpected shutdown of process equipment;
Costs of repairing damaged production machinery;
The costs of losses resulting from the deterioration of product quality after the process has resumed;
The cost of indirect losses occurring at cooperating plants due to the lack of supply of raw material from the affected plant.
The above relationships can also be presented in unit values, i.e., as cost per unit of product not produced. Taking into account the few cases where additional costs are charged, the unit loss costs are expressed as follows:
where the following is true:
Based on the analysis made by A. Chojnacki, who took the additional value, the unit cost of materials and raw materials
γ is as follows:
The figure for the cost of losses takes the following value:
Moreover, the value of the equivalent of the undelivered energy (assuming that the time of the production interruption and the time of the customer’s power supply interruption are the same) takes the following form:
On the basis of the cited indicators and the aforementioned analysis, it can present the optimal lifetime of electricity facilities, i.e., the minimum unit cost of their use. The unit of time for such a calculation is usually one year:
where the following is true:
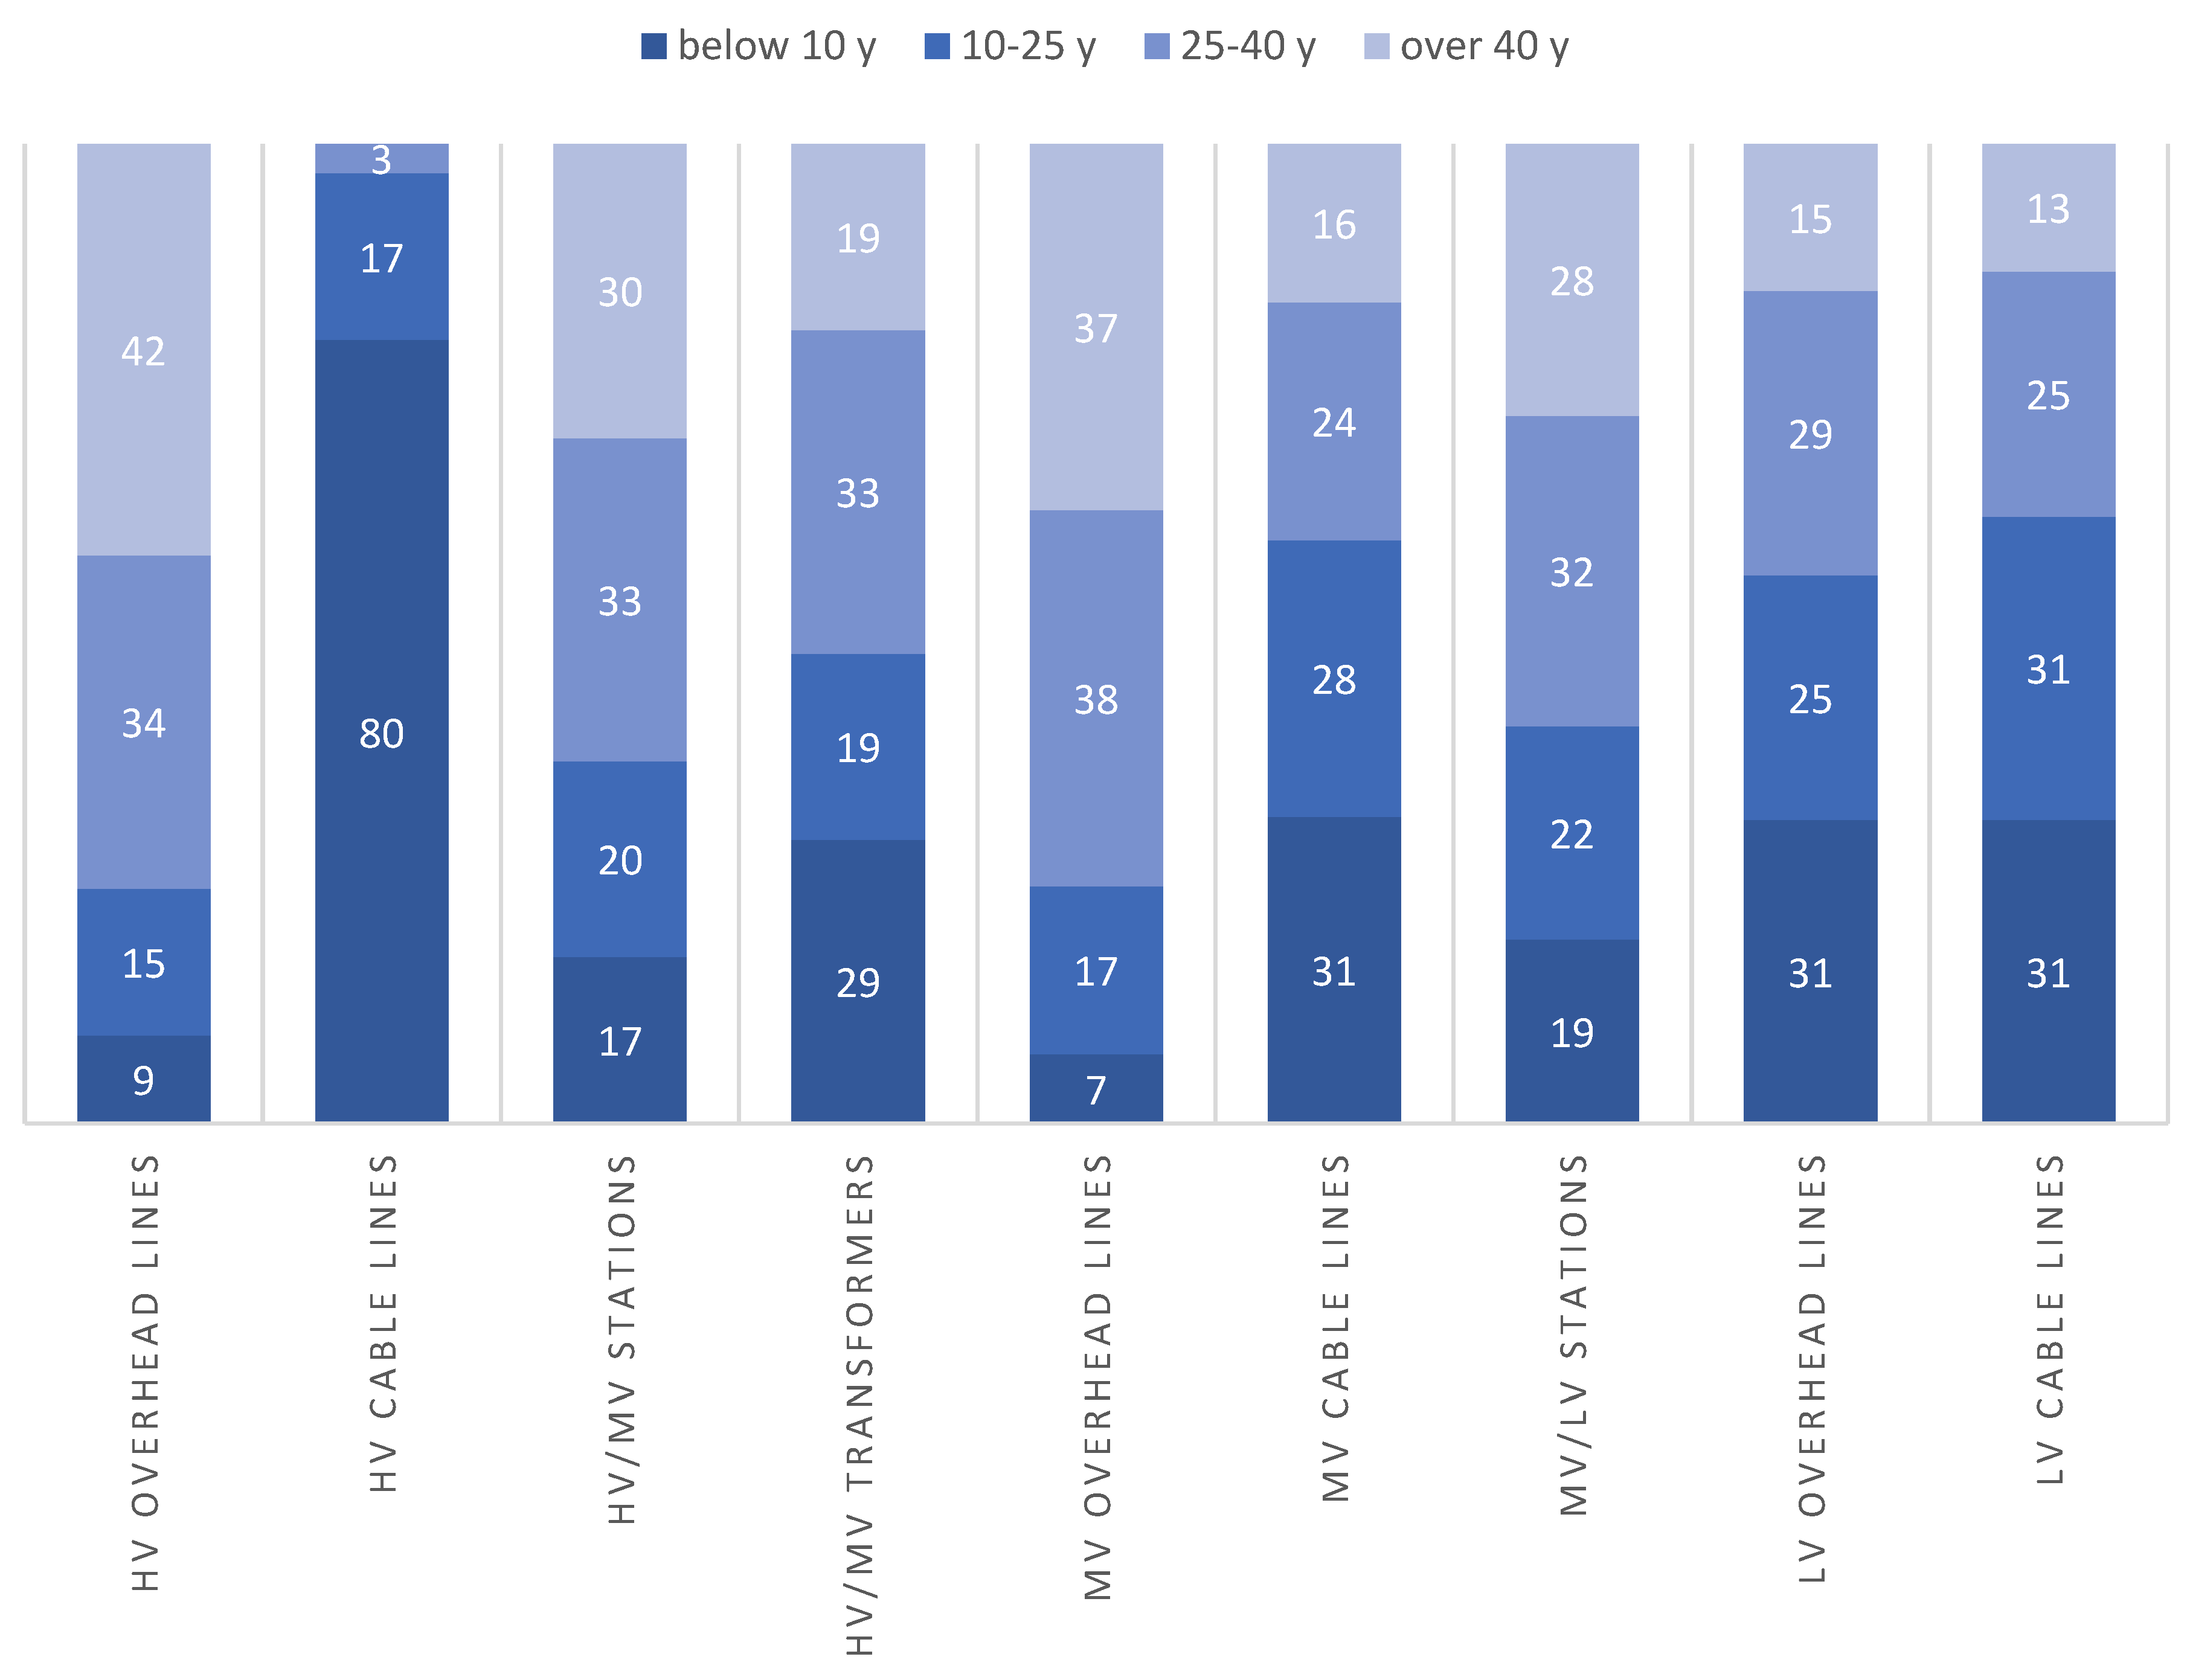
The reliability of the network is directly influenced by its state of wear and tear defined as its ageing state. Analysing the presented
Figure 2, one can speak of an ageing network infrastructure. The greatest degree of wear and tear is characterised by 110 kV and MV overhead lines. Less than 80 per cent of these lines were built more than 25 years ago and since then, due to legal obstacles and a lack of resources (mainly financial), they have largely not been upgraded and have only undergone the required repairs and inspections. The age of less than 25 years is characterised only by HV, MV and LV cable lines. All energy groups have implemented or are planning major investments to replace overhead lines with cable lines. The extent of these investments will depend on financial outlays, commitments and also regulatory rules.
Another important aspect that directly influences the level of reliability of the MV network is the process of its automatic operation and rapid response. Such a possibility is provided by solutions based on innovative IT devices equipped with telemechanical, protection or monitoring elements. Particularly important is the construction of radio-controlled switches cooperating with the dispatching system. Since 2011, there has been a steady increase in the number of such switches, as shown in
Figure 3. At the end of 2017, there were more than 21,000 of them, of which around 90 per cent are switches installed deep in the network, with a ratio of 9.52 switches per 100 km of line, which indicates that the networks will be fully marked with appropriate switches in the coming years.
The automation of MV/LV substations is also gaining attention. At the beginning of 2017, less than 2 per cent of substations were equipped with telemechanics, but this process is accelerating. However, by the end of 2017, a record number of substations had gained such functionality—more than 1300. In 2018 and 2019, there was an increase of nearly 2000 controllers. By contrast, by the end of 2020, their number was just under 25,000 across all surveyed DSOs, an increase of more than 70 per cent. Nowadays, the concept of quality of energy supply has become extremely important and boils down to certain parameters. This does not only refer to the physical delivery of energy to the consumer (i.e., ensuring that the supply voltage is appropriate) but also to the reliability of such delivery (i.e., the time and number of interruptions occurring during the supply). Outages are categorised according to the time of their occurrence. The shortest ones include those in the range of milliseconds and seconds. They are defined as transient changes in voltage amplitude as a result of changes in network load. An additional factor that also plays a major role is the commercial relationship between supplier and customer. The first two elements relate to technical solutions and their development is directly determined by technological development, while the second is determined by the constant increase in expectations on the part of customers. According to I. Wasiak, the issue of maintaining adequate power quality in consumer networks to which distributed energy sources are connected is particularly complex. Such sources, on the one hand, behave as disturbing receivers and, thus, deteriorate the quality of electricity; on the other hand, they can be used to improve this quality [
10,
14]. In addition, the International Technical Commission has adopted provisions for standardisation in the area of power quality. It follows from this definition that power quality compatibility relates both to the immunity of equipment to disturbances in the environment in which it operates and to the emission of these events. The interrelation between the level of emission and immunity makes it possible to define the level of electrical compatibility for a specific disturbance and, according to the PN-T-01030:1996 standard, this is the maximum level of disturbance that can affect a device without causing it to lose its utility functions [
6,
15]. The basic document defining both the quality standards of customer service and the technical parameters of the supply voltage in the national power system is the Regulation of the Minister of Economy of 4.05.2007 on detailed conditions for the operation of the power system, Journal of Laws No. 93 constituting an executive act to the Energy Law, Act of 10 April 1997 as amended (Dz. U. 2009.215.1664) [
6]. In addition, there are a number of values characterising the quality parameters:
- A.
Voltage deviation: Expressed as a relative value of the difference between the rms value of the voltage measured and averaged over the measurement interval
UL to the value of the so-called declared voltage
UC, which is usually the rated voltage of the network:
- B.
Frequency deviation: The frequency in the electricity system is fixed, with a nominal value of 50 Hz. The change in frequency is the result of a change in the active power of the loads. Frequency deviation is defined as the relative difference of the frequency measured and averaged over an interval of the
fL measurement interval in relation to its rated value
fn:
- C.
Long-lasting flicker: i.e., flicker is the sensation of unstable visual perception caused by fluctuations in the luminous flux of light sources. The cause of the flicker phenomenon is voltage fluctuations. Fluctuations are called rapid, repeated changes in the rms value of the voltage caused by the operation of certain consumers such as arc furnaces, welding machines, etc. Unsettled receivers can be connected to networks with different voltage levels. Flicker is the result of fluctuations being transmitted to the low-voltage consumer network. Measuring the flicker phenomenon is an indirect way of assessing voltage fluctuations. The output signal is a measure of human response, and statistically processed and averaged over a measurement interval, it provides an indicator of short-term flicker severity P
st (short-term flicker severity). From a further 12 indicators P
st a standardised long-term flicker severity index P(
lt) (long-term flicker severity):
- D.
In an ideal voltage curve, only the fundamental harmonic at 50 Hz is present. The cause of the distortion of the voltage curve is non-linear consumers, e.g., transformers, fluorescent lamps and converter devices. The currents drawn by these devices are distorted and, therefore, contain higher harmonics. These harmonics flowing through the power network cause voltage dips to appear from these harmonics and consequently distort the voltage at network nodes and are expressed as follows:
Furthermore, as already mentioned, the electricity sector is a strictly regulated area. Since 2013, work has been underway on the implementation of the so-called quality regulation, whose aim, above all, was to improve the quality of services offered to customers and optimise the charges borne by customers rather than to increase the benefits for the entrepreneur [
6]. This document defined the obligation of the most important DSOs in the country to use balancing meters in Sn/nN transformer stations in such a quantity that, by the end of 2015, this would enable 51% of the country’s customers to be covered by this metering and then, by the end of 2018, at least 80% of customers. This perspective would provide opportunities for precise estimation of indicators such as the duration of supply interruptions on the LV side and, as a result, raising the quality of distribution services on the DSO side. Such meters will form the basis for the creation of smart grids, the so-called smart city (further on). To assess the quality of supply in the Polish literature, such indicators are also used [
16,
17,
18]:
SAIFI (System Average Interruption Frequency Index): i.e., a system-wide index of the average number (frequency) of interruptions per customer, defined as the number of all unplanned interruptions per year divided by the number of customers connected to the network. Unless otherwise specified, SAIFI excludes short interruptions of less than 3 min (or 1 min, depending on the convention adopted);
SAIDI (System Average Interruption Duration Index): i.e., a system-wide index of the average (mean) duration of interruptions per year, determined as the sum of the duration of all interruptions per year (in min.) divided by the number of customers connected to the network;
CAIFI (Customer Average Interruption Frequency Index): i.e., the average number of interruptions per affected customer, defined as the number of all unscheduled interruptions during the year divided by the number of customers switched off;
MAIFI (Momentary Average Interruption Frequency Index): i.e., an index of the average number of momentary interruptions for a customer, defined as the average over a year of the number of short interruptions of less than 3 min or less than 1 min that a customer can expect. It is calculated as the ratio of the number of all short interruptions during the year to the number of customers connected to the network;
CAIDI (Customer Average Interruption Duration Index)-i.e., the average duration of an interruption. This is the average time taken to restore power to a customer in the event of unplanned outages. Calculated as the sum of the duration of all customer interruptions (in minutes) divided by the number of all customer outages. CAIDI does not include short interruptions of less than 3 min (or 1 min);
ASUI (Average Service Unavailability Index): i.e., the power supply unavailability index, defined as the ratio of the time during the year (in receiver hours) when power was unavailable to the time when it was required;
AENS (Average Energy Not Supplied): The average (expected) annual amount of energy not supplied, defined as the ratio of energy not supplied to consumers during the year to the number of consumers connected to the network;
ASAI (Average Service Availability Index): An indicator of power supply availability, defined as the ratio of the time during the year (in receiver hours) when power was available to the time when it was demanded.
Proposed Theoretical Solution
Automation of power grids is one of the key areas of transformation in modern power distribution systems. In traditional power grid management models, the processes of monitoring, fault detection and their removal are carried out largely manually, which resulted in significant delays in response to disruptions and translated into high indicator values. In the face of the growing demand for reliable energy supplies, the development of modern automation technologies has become a priority for distribution system operators (DSOs). Network automation refers to a wide range of technologies that enable dynamic management of energy flow, faster fault detection and increased operational efficiency. Key solutions include intelligent network management systems (smart grids), artificial intelligence (AI) algorithms and the Internet of Things (IoT) infrastructure. Their integration allows for a transition from a reactive model of fault removal to proactive network management, in which disruptions are predicted and eliminated before the actual power outage occurs. Modern automation technologies enable more effective management of network reliability, influencing three key aspects [
19]:
Monitoring and diagnostics—IoT systems and smart meters enable continuous monitoring of network parameters, detection of anomalies and quick identification of potential threats;
Automatic fault detection and isolation—FLISR (Fault Location, Isolation, and Service Restoration) systems enable the identification of fault locations and automatic load switching, which reduces downtime;
Failure prediction and network optimisation—AI algorithms analyse historical disruption data and, on this basis, predict potential threats, allowing their elimination before failures occur.
However, the implementation of advanced technologies is associated with new challenges. First of all, it requires significant investments in infrastructure modernisation, which may constitute a financial barrier for operators. In addition, the integration of IoT and AI systems generates large amounts of data, which requires advanced analytical systems and efficient IT solutions for their processing. There is also a cybersecurity problem, as network automation increases the risk of hacker attacks on energy control systems. Despite these challenges, the implementation of intelligent automation solutions brings significant benefits. A number of studies indicate that network modernisation using smart grids and predictive systems can reduce the values of SAIDI and SAIFI indicators by up to 30–50% compared to manually managed networks [
20,
21,
22,
23,
24,
25]. In the long-term context, this means not only improved reliability but also reduced operating costs for operators and greater network resistance to extreme weather events. In order to examine the impact of modern systems on the reliability indicators of power networks, it is necessary to distinguish technologies that can significantly improve parameters, such as SAIDI and SAIFI. These technologies can be divided into three main groups:
Each of these technologies should be analysed for its impact on network reliability, along with a quantitative assessment of efficiency. Recognising the limitations and gaps present in previous studies, we propose a complementary theoretical approach that aims to fill these voids and enhance the understanding of automation’s impact on grid reliability. The two proposed solutions represent an original and innovative approach to the quantitative analysis of how automation influences power grid reliability, offering a novel perspective not commonly found in the existing literature:
A. SAIDI and SAIFI reduction model:
where the following is true:
, —indicator values before implementing automation;
—level of smart grids implementation (e.g., percentage of SCADA network coverage);
—effectiveness of AI models in predicting failures (e.g., % of correct predictions);
;
;
.
B. Failure Risk Prediction Model
To estimate the probability of failure as a function of the degree of automation, we can use a probabilistic model:
where the following is true:
In this formulation, the technology variables are normalised and combined under a shared decay parameter δ, assuming equal influence on failure probability. The additive structure of the SAIDI/SAIFI models assumes that each automation technology contributes independently and proportionally to reliability improvements. This assumption simplifies estimation and interpretation but may not capture all interaction effects. The model is, thus, intended as a first-order approximation, with the understanding that future versions may incorporate interaction terms or non-linear formulations as empirical data become available. Although the model assumes independence among explanatory variables, in real applications, multicollinearity may occur due to overlapping implementation strategies (e.g., Smart Grids and IoT). Researchers applying this model are advised to test for such effects and consider statistical remedies where necessary.
The novelty of these models lies in the inclusion of different levels of automation technology implementation in the regression model of the impact of automation on SAIDI and SAIFI. In the literature, there are analyses of the impact of individual technologies, but an approach encompassing a comprehensive assessment of many technologies simultaneously (smart grids, AI, IoT, FLISR) is not common. Moreover, the probabilistic model is extended to include the impact of AI and IoT on the probability of failure. Probabilistic models are used in reliability analyses (e.g., Markov models), but the proposed version integrates the impact of specific automation solutions on the risk of failure. This is complemented by the possibility of empirical testing of models through multiple regression and statistical significance analysis, which allows for quantitative confirmation of hypotheses based on real data from distribution networks.
For the purpose of interpretation, the following is considered:
If are statistically significant and negative, it means that AI effectively reduces SAIDI and SAIFI;
If are important, FLISR should be an investment priority;
High R2 regression means that automation has a significant impact on network reliability.


