Article

Accounting Factors and Spatio-Temporal Differences of the Carbon Footprint Factor in China’s Power System

1
College of Environmental Science and Engineering, Beijing Forestry University, Beijing 100083, China
2
Inner Mongolia Mengtai Buliangou Coal Industry Co., Ltd., Ordos 017000, China
3
Huadian Coal Industry Group Digital Intelligence Technology Co., Ltd., Beijing 102400, China
*
Author to whom correspondence should be addressed.
Energies 2025, 18(10), 2663; https://doi.org/10.3390/en18102663
Submission received: 14 March 2025 / Revised: 10 May 2025 / Accepted: 18 May 2025 / Published: 21 May 2025
(This article belongs to the Section B: Energy and Environment)

Abstract

:
The carbon footprint factor of a power system is a crucial basis for calculating carbon emissions from electricity consumption. However, the current carbon footprint factor of China’s power system faces several issues, such as a limited spatial range, outdated updates, an incomplete accounting scope, and unclear accounting methods. To make the power system’s carbon footprint accounting method and its temporal and spatial scope more comprehensive, this study reconstructs the accounting method based on the emission factor method, adding factors such as transmission losses, power transmission across spatial ranges, and Sulfur hexafluoride (SF6) gas leakage. This study’s analysis reveals that these three accounting factors have a significant impact on the power system’s carbon footprint factor. In terms of the time dimension, the carbon footprint factor has decreased by more than 20% over the past 18 years, and when the time interval is refined to a monthly scale, the carbon footprint factor exhibits significant seasonal fluctuations. In the spatial dimension, the coefficient of variation (CV) for regional and provincial power system carbon footprint factors reached 27.38% and 29.98%, respectively, in 2022. For the same geographic location, the difference in carbon footprint factors between provincial and regional levels ranged from −73.98% to 119.95%. This study shows that the current carbon footprint factor of the power system has limitations, and there is an urgent need to improve the accounting factors, establish multi-level spatial division standards for provincial and regional scales, and shorten the update intervals while ensuring data timeliness. This will enhance the temporal and spatial accuracy of the carbon footprint factor, providing scientific support for precise carbon emission management.

1. Introduction

Standards and requirements for carbon emission accounting systems are becoming increasingly stringent due to global climate change and national carbon neutrality commitments. As the world’s largest emitter of carbon, China must establish an accurate and reliable carbon measurement system to achieve its “dual carbon” goals. Currently, the power sector, as the largest single industry contributing to China’s total carbon emissions, accounts for more than 40% of global emissions [1]. Existing studies have shown that the carbon emissions from China’s power industry have been on the rise, with a growth rate of 261% from 2001 to 2021 [2]. In 2020, the carbon emissions from the power industry reached 4.624 billion tons, accounting for 45.10% of the total carbon emissions in the country [3]. At the same time, international carbon footprint accounting standards [4,5] explicitly require the inclusion of indirect carbon emissions resulting from electricity consumption, and their accurate calculation has a significant impact on cross-border carbon footprint information exchange [6]. Therefore, the carbon footprint factor of a power system has become the cornerstone of product carbon footprint and carbon accounting work.
The carbon footprint factor of a power system refers to the life-cycle emissions per unit of electricity during its generation, transmission, and delivery processes. It must include the overall carbon emissions from various stages such as fuel extraction, including coal mining [7], equipment manufacturing, engineering construction, production operations, power grid construction, and transmission [8], which distinguishes it from the commonly used carbon dioxide factor for electricity. Only by using local, timely, and comprehensive power system carbon footprint factors can the accuracy of carbon emissions from electricity consumption in carbon footprint calculations be improved.

1.1. Deficiencies in Existing Research and Contributions of This Study

The more authoritative carbon footprint factors for a power system mainly originate from recognized databases and government sources. Currently, internationally recognized life-cycle databases (such as Ecoinvent, Gabi, etc.) generally include power system carbon footprint factors. However, the data for China are mostly estimated based on models and data from other countries, with poor data timeliness [9], which results in China’s power carbon footprint factors being generally higher and not meeting the accuracy requirements for precise accounting [10]. In China, the Ministry of Ecology and Environment (MEE) released the national power carbon footprint factor values and calculation methods for the first time in January 2025 [11]. However, issues such as limited spatial scope, outdated updates, incomplete accounting scope, and unclear accounting methods prevent it from fully meeting practical application needs.
Research on China’s power system carbon footprint factors is still insufficient, as shown in Table 1. Among them, the Ministry of Ecology and Environment of the People’s Republic of China has set its own calculation formula, considering the life-cycle emissions of both the power generation system and the transmission and distribution system infrastructure, but it only includes nationwide data, and the accounting scope has certain limitations. Ning et al. used the emission factor method to calculate the carbon footprint factors for power systems in various regions and provincial-level power grids in China in 2020. Their study refined the spatial scope and considered more comprehensive accounting elements, but there were errors in the data selection [12]. Tian et al., based on the accounting results of existing studies, used the emission factor method to calculate and analyze the national power system’s carbon footprint factor from 2011 to 2021. However, they did not include transmission and distribution in their power system calculations [3]. Zhang et al., based on carbon footprint accounting standards, considered five types of power generation methods and calculated the national carbon footprint factor for China’s power system in 2021, but both the spatial scope and accounting scope had flaws [13]. Li et al., using the life cycle assessment method, accounted for and summarized the main emission sources in China’s transmission and distribution system, including power transmission losses, infrastructure construction, and SF6 gas leakage, but did not link it with the power generation system [14].

1.2. Objectives and Significance of the Study

China is currently at a critical stage of energy transition [15]. An accurate power system carbon footprint factor can improve the precision of product carbon footprint accounting, objectively reflect the low-carbon achievements of China’s energy transition, and provide scientific support for emission reduction optimization in the power system, thereby promoting the realization of green and sustainable development goals. This study aims to refine the spatial scope based on existing power system carbon footprint factor accounting methods, identify and improve missing accounting elements, and construct a more comprehensive power system carbon footprint factor accounting method based on the emission factor method. Additionally, by considering the relevant characteristics of China’s power system, this study analyzes the impact of missing accounting elements on the power system carbon footprint factor calculation results. From both temporal and spatial dimensions, this study explores the temporal–spatial differences in the power system carbon footprint factor. Finally, through case studies, the influence of power system carbon footprint factors in different dimensions on carbon emission accounting for electricity consumption is discussed. Through a series of research results, this study provides a scientific basis for optimizing power system carbon footprint factor accounting methods and offers scientific support for more efficient carbon emission management and the establishment of a high-precision carbon emission factor database.

2. Methods and Data

2.1. Functional Unit and Accounting Scope

This study aims to assess the carbon footprint factor of the electricity supply side of the power system. Therefore, the functional unit is defined as 1 kilowatt-hour (kWh) of electricity produced by the power system. The scope of accounting for the electricity supply side is set as follows:
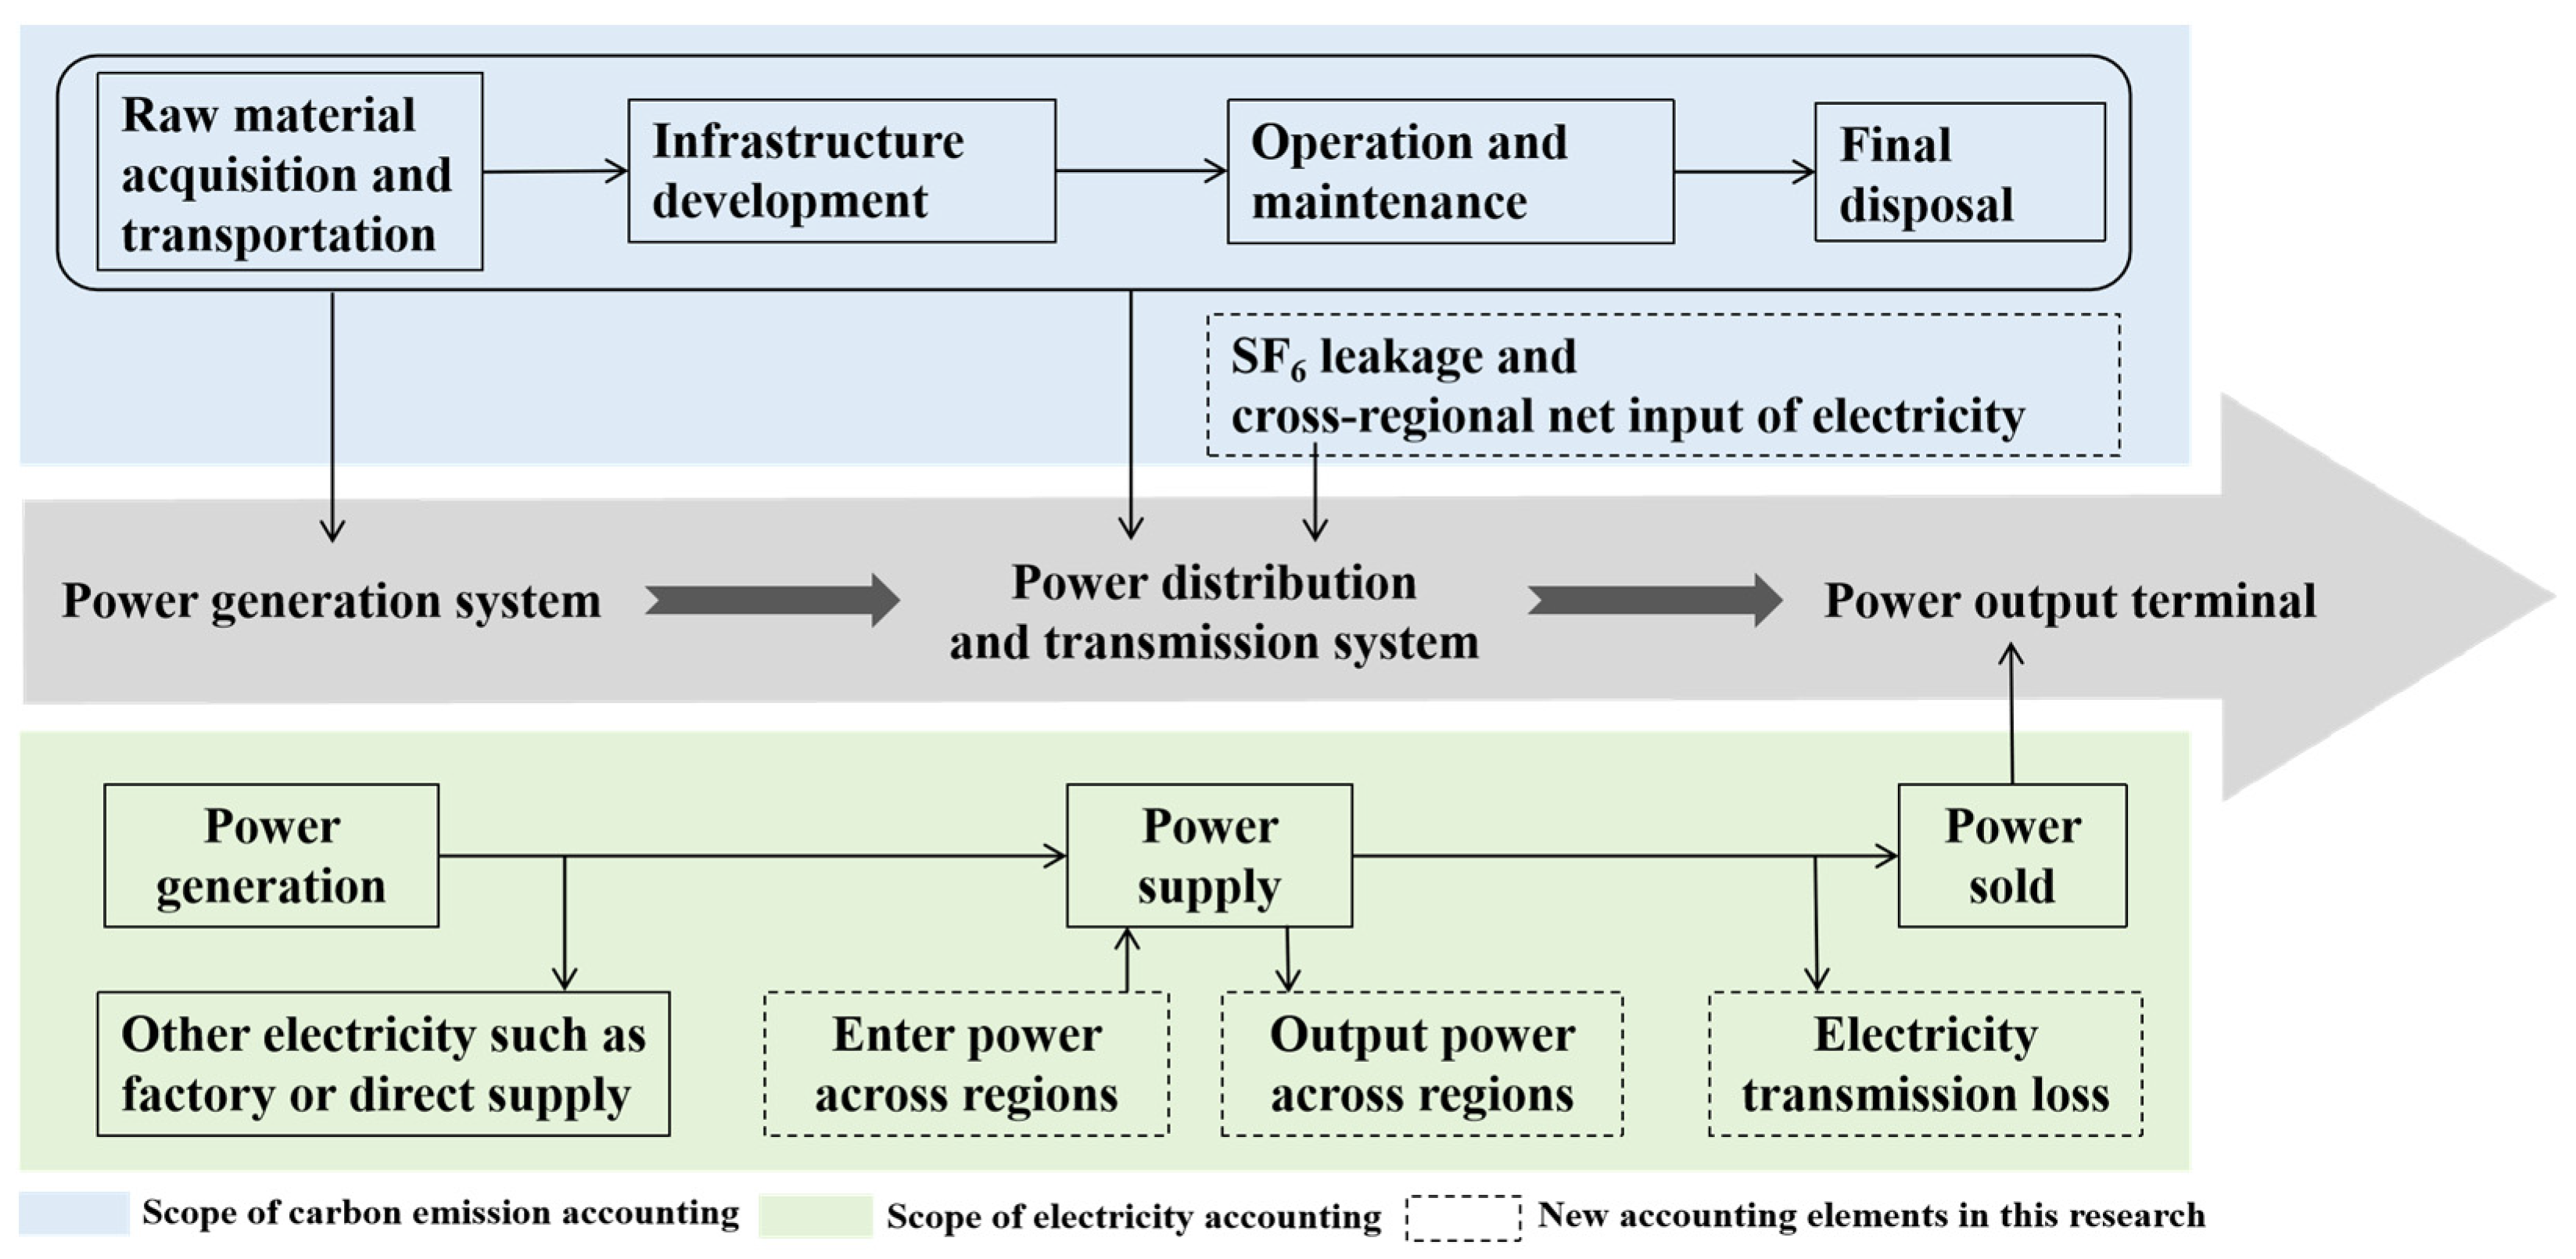
  • The power system includes both the power generation and transmission and distribution systems, covering the process from power generation, to transmission, to output, as shown in Figure 1. The accounting scope of carbon emissions includes life-cycle emissions from the power generation system, as well as emissions from the infrastructure construction of the transmission and distribution system, SF6 leakage, and emissions from the transmission of electricity across spatial boundaries. The final electricity output refers to the amount of electricity sold by the power system, considering electricity transmission across spatial boundaries and electricity losses.
  • Carbon emissions are standardized to carbon dioxide equivalent (CO2e).
  • Since energy storage technologies are not yet fully mature and remain in the development phase, with limited reference studies on their carbon footprint, this study does not consider the impact of energy storage on the carbon footprint of the electricity system.

2.2. Accounting Methods

2.2.1. Power System Carbon Footprint Factor

The power system carbon footprint factor refers to the ratio of the total carbon emissions within the power system region to the final electricity output, and is used to assess the average emission level of the power system, as shown in Formula (1). This method is based on the requirements for the life-cycle stages of product carbon footprints outlined in the “Quantification Requirements and Guidelines for Product Carbon Footprints” issued by the State Administration for Market Regulation of China [16], while also referencing the power system carbon footprint factor calculation method in the “2023 National Power System Carbon Footprint Factor Calculation Guidelines” published by the Ministry of Ecology and Environment [11], as well as the regional power system accounting scope provided in the “2021 Power System Carbon Dioxide Emission Factor Calculation Guidelines” [16]. It comprehensively considers accounting elements such as the power generation structure, emissions from the transmission and distribution system, cross-spatial transmission power, and transmission loss power.
C F E = E m P G + E m T & D + E m i m p E s o l d
where C F E is the power system carbon footprint factors; E m P G is the carbon emissions from the power generation system; E m T & D is the carbon emissions from transmission and distribution systems; E m i m p is the carbon emissions from net input electricity across regions; and E s o l d is the electricity sold by the power system.
In this study, China’s power system is divided into three levels: national, regional, and provincial. Based on the “2021 Power System Carbon Dioxide Emission Factor Calculation Guidelines” published by the Ministry of Ecology and Environment and the National Bureau of Statistics [16], as well as the distribution of regional power grids in China and data availability, the grid boundaries are uniformly divided into the North China, Northeast, East China, Central China, Northwest, South China, and Southwest grids, excluding Tibet Autonomous Region, Hong Kong Special Administrative Region, Macau Special Administrative Region, and Taiwan Province. Among these, the eastern and western parts of Inner Mongolia belong to the Northeast and North China grids, respectively. However, due to the unavailability of detailed data distinguishing the eastern and western parts of Inner Mongolia, it is treated as part of the North China grid based on the “2019 China Regional Power Grid Benchmark Emission Factor” issued by the Ministry of Ecology and Environment [17]. The specific coverage of China’s regional power systems is shown in Table 2.

2.2.2. Carbon Emissions

The carbon emissions of each part are calculated using the emission factor method, which is the product of activity data and the emission factor. The calculation method for power generation system carbon emissions is shown in Formulas (2) and (3).
E m P G = ( E F m × E m ) ,
E F m = ( A n × E F n ) ,
where E F m is the carbon emissions of power source type m producing 1 kWh of electricity; E m is the power generation of the power supply type m during the accounting period; A n is the activity data of the material n required to produce 1 kWh of electricity; E F n is the life cycle emission factor of material n; m is the main types of power sources in China including thermal power, hydroelectric power, nuclear power, wind power, and photovoltaic [18]; and n is the material used in the life cycle of power generation.
Based on the literature related to carbon emissions from transmission and distribution systems [14,19,20], the main carbon emissions in the transmission and distribution system come from the life-cycle emissions of infrastructure construction and SF6 gas leakage. Therefore, its calculation method is organized into Formulas (4)–(6).
E m T & D = ( E m C o n + E m S F 6 ) × E s u p p l y ,
E m C o n = ( A C × E F C ) ,
E m S F 6 = A S F 6 × G W P S F 6 ,
where E m C o n and E m S F 6 are the carbon emissions generated by the infrastructure construction and the leakage of SF6 gas in the transmission of 1 kWh of electricity in the power distribution system; E s u p p l y is the amount of power supplied to the power system; A C is the activity data on materials needed for grid infrastructure construction; E F C is the life cycle emission factors of the required materials; A S F 6 is the amount of SF6 leaked; and G W P S F 6 is the global warming potential of SF6.
The carbon emissions generated from cross-spatial transmission power should also be considered, and the calculation method is shown in Formulas (7) and (8). This accounting element varies depending on the spatial scope of the power system: at the national level, it refers to cross-border net power imports; at the regional level, it includes both cross-border and cross-regional net power imports; at the provincial level, it includes cross-border, cross-regional, and cross-provincial net power imports.
E m i m p , j = ( E i m p , j × E F j ) ,
E F j = E m P G , j E s u p p l y , j
where E i m p , j is the net amount of electricity input from power system j in other spatial ranges; E F j is the emission factor of power system j; E m P G , j is the carbon emissions of the power generation system within the spatial scope j of the power system; and E s u p p l y , j is the electricity supply of power system j.

2.2.3. Electricity

In the power system, the electricity at the final output end is the electricity sold, and the calculation method is shown in Formula (9). The electricity sold includes the sum of the electricity supplied within the spatial scope of the power system and the net imported electricity from other power systems. In addition, the impact of power transmission losses on the amount of electricity should also be fully considered, and this factor is mainly reflected by the line loss rate.
E s o l d = ( E s u p p l y + E i m p ) × ( 1 L R ) ,
where LR is the transmission line loss rate.

2.3. Analytical Methods

2.3.1. Uncertainty Analysis

The quantification of power system carbon footprint factors incorporates two primary datasets: carbon emissions and electricity generation data. The electricity generation data, typically sourced from government and industry reports, exhibit relatively low uncertainty. In contrast, carbon emission data are derived through computational analysis of activity data and emission factors obtained from case studies and databases, which inherently necessitate certain estimations and consequently introduce measurable uncertainty [21]. To systematically evaluate the uncertainty levels in emission data, this study employs an error propagation method specifically applicable to relatively independent datasets [22,23]. This methodological approach is formally recommended in the Good Practice Guidance and Uncertainty Management in National Greenhouse Gas Inventories of IPCC [24], with the corresponding computational formulae presented below.
L t o t a l = ( L N i × N i ) 2 | N i |
L N i = ( L T ) 2 + ( L R ) 2
where L t o t a l is the total uncertainty, L N i is the uncertainty of production stage i, N i is the carbon emissions of stage i, L T is the uncertainty of the life-cycle emission factor of the material j, and L R is the uncertainty of the activity data of the material j used in the production process i. If L t o t a l ≤ 5%, then the estimations are deemed as excellent. If 5% < L t o t a l ≤ 15%, the rate of the results falls within the acceptable level. If 15%< L t o t a l ≤ 30%, the results reach the general level. If L t o t a l > 30%, the uncertainty level of the results is rated as high, indicating that the estimation results are unstable and unreliable [25].

2.3.2. Differences Analysis

In this study, the quarterly variations in the power system carbon footprint factor and the differences between regions and provinces are analyzed using one-way analysis of variance (ANOVA) with SPSS 27 software and the coefficient of variation for statistical analysis. The formula for calculating the discrepancy in the power system carbon footprint factor at the same geographic location due to different spatial scopes is shown as follows [26]:
D = P r o v i n c i a l   p o w e r   s y s t e m   c a r b o n   f o o t p r i n t   f a c t o r R e g i o n a l / N a t i o n a l   p o w e r   s y s t e m   c a r b o n   f o o t p r i n t   f a c t o r R e g i o n a l / N a t i o n a l   p o w e r   s y s t e m   c a r b o n   f o o t p r i n t   f a c t o r

2.4. Data Sources

2.4.1. Activity Data

Based on a comprehensive consideration of factors such as technological heterogeneity, data completeness, and regional differences, in order to ensure the scientific and representativeness of the research conclusions, this study selects typical power generation units that reflect the industry’s average emission levels as the analysis objects. The specific types are shown in Table 3.
This study selects representative case data from the references the activity data for the carbon footprint of the power generation system, with data sourced from the relevant literature, as shown in Table 4. In this study, thermal power is represented by coal-fired units, with reference to existing life cycle assessment studies on coal power [33,34,35,36], and a 600 MW coal-fired unit was selected. This type of unit is widely used in China and is commonly chosen as a research case. For hydroelectric power, a mixed-flow turbine is selected as the representative unit. More than 50% of China’s hydroelectric power installed capacity comes from the Yangtze River Basin [37]. The Three Gorges Hydroelectric Station, as the most representative mixed-flow turbine hydroelectric station in the basin, has significant technological and influential importance both domestically and internationally. Therefore, the Three Gorges Hydroelectric Station is chosen as a case study. For nuclear power, pressurized water reactor units are selected as the representative unit. Most of China’s nuclear power plants are located in the eastern coastal areas [38]. The Daya Bay Nuclear Power Station, located in the Dapeng Peninsula of Shenzhen, is China’s first large-scale commercial pressurized water reactor nuclear power station and an important benchmark for the development of nuclear power in China. Therefore, Daya Bay Nuclear Power Station is chosen as a case study. For wind power, a 1.5 MW wind turbine is selected as the representative unit. According to research data, most of China’s wind power installations are located in Inner Mongolia [39], which has rich wind energy resources and is an important base for wind power development. Therefore, a wind farm in Inner Mongolia using a 1.5 MW wind turbine is chosen as the wind power case study. For photovoltaic power, polycrystalline silicon solar cells are selected as the representative unit. This study uses case study data for polycrystalline silicon solar cells, considering multiple regions and factories. For the transmission and distribution system, national grid-related research representing the average level in China is chosen as the case. Due to the complexity and decentralization of China’s transmission and distribution system, it is currently difficult to obtain data for the operation and maintenance stage. Studies have shown that the carbon emissions from this part contribute relatively little, so this study considers life cycle emissions from infrastructure construction and SF6 leakage as the primary emission sources [13].
Electricity-related data are sourced from the China Electric Power Yearbook and the Statistical Compilation of the Electric Power Industry.

2.4.2. Emission Factors

Emission factor data for production materials are sourced from the China Product Carbon Footprint Database (CPCD) [56] and the Ecoinvent database. Global warming potential (GWP) values are derived from the IPCC Sixth Assessment Report, Working Group III, Climate Change 2022: Mitigation of Climate Change. Some provinces import electricity from Russia, Myanmar, and North Korea. The greenhouse gas emission factors for electricity from Russia and Myanmar are obtained from the International Renewable Energy Agency (IRENA) [57]. Due to limited publicly available data for North Korea, its electricity emission factor is estimated based on relevant reports and is used solely for calculating the carbon emissions from cross-border net electricity imports in this study. The electricity generation data come from the 2022–2026 Investment Outlook and Risk Analysis Report of North Korea’s Power Sector [58], and the carbon emission data are sourced from Comprehensive Economic and Industrial Data (CEIC) [59].

3. Results and Analysis

3.1. Usability and Uncertainty Analysis of Accounting Results

Table 5 presents the life-cycle carbon emission accounting results for the power generation and transmission–distribution systems, and compares them with existing studies and data released by the Ministry of Ecology and Environment to verify their usability. The results show that the life-cycle carbon emissions of the five power generation types fall within the reasonable range reported by existing studies (with accounting boundaries largely consistent with those of this study); the differences compared with data from the Ministry of Ecology and Environment are all within 10%. SF6 leakage is not included in the Ministry’s calculation scope, and the deviation from the reference literature is 5.56%. These results demonstrate strong usability and are, therefore, adopted in the power system carbon footprint accounting. However, there is a significant difference between the calculated carbon emissions from infrastructure construction in the transmission and distribution system and the data published by the Ministry of Ecology and Environment. This discrepancy may result from outdated case study data or incomplete accounting boundaries. Due to the difficulty in obtaining up-to-date and detailed data on China’s transmission and distribution system, this study adopts the Ministry’s published data in calculating the power system carbon footprint factor. As the data used in this study are based on representative cases, and it is challenging to acquire the latest data on transmission and distribution infrastructure and SF6 leakage, the study assumes that the above results remain stable over time and across regions, unaffected by these variable factors.
As the IPCC guidelines do not provide specific requirements regarding uncertainties of activity data and emission factors, this study established the uncertainties of activity data and emission factors at 5% and 10%, respectively, with reference to the uncertainty analysis case using error propagation equations in the Provincial Greenhouse Gas Inventory Compilation Guidelines issued by China’s National Development and Reform Commission (NDRC). These uncertainty values were also adopted in accordance with relevant studies [68,69]. Table 6 presents the uncertainty levels of carbon emission accounting results for power generation and transmission–distribution systems, which were calculated using Equations (10) and (11). The uncertainties in carbon emission accounting were determined to be 10.87% for thermal power, 8.88% for hydroelectric power, 7.60% for nuclear power, 7.84% for wind power, 6.53% for photovoltaic power, and 7.21% for the transmission and distribution system. All values fall within acceptable ranges, demonstrating the stability and reliability of the accounting results.

3.2. Impact of Newly Added Accounting Elements on the Power System Carbon Footprint Factor and Sensitivity Analysis

The impact of transmission losses on the power system carbon footprint factor is shown in Figure 2. The “percentage difference” in the figure refers to the proportion of the difference between the carbon footprint factors calculated with and without considering power losses, relative to the factor that includes power losses. The results indicate that accounting for power losses leads to an increase in the carbon footprint factor. From a temporal perspective, the influence of transmission losses on the carbon footprint factor shows a generally decreasing trend, though the proportion remains relatively high. In all years except 2022, the impact of power losses exceeded 5%. From a spatial distribution perspective, using provincial-level power systems as an example, the impact of power losses on the carbon footprint factor varies significantly across provinces. In seven provinces, the influence exceeded 5%, with the highest reaching 7.39%. This regional variation is mainly attributed to differences in local grid structures, transmission methods, equipment conditions, and the loss rates of transmission and distribution lines. For instance, provinces like Heilongjiang, with long transmission distances and aging infrastructure, experience higher transmission losses, thereby exerting a greater influence on the carbon footprint factor. In contrast, areas with well-developed grid infrastructure and higher transmission efficiency are less affected. With the ongoing development of smart grid technology and ultra-high-voltage transmission, transmission and distribution losses are gradually decreasing, reducing their impact on the carbon footprint factor. However, at present, power losses remain an important factor influencing the calculation of the power system carbon footprint.
The transmission of electricity across spatial boundaries is complex. Taking the provincial power systems in 2022 as an example, interprovincial electricity flows are illustrated in Figure 3. Among the 30 provinces considered in this study, 26 acted as electricity exporters and 26 as importers. Though the numbers are the same, the specific provinces differ. Fujian, Ningxia, Yunnan, and Guizhou served exclusively as electricity exporters, while Beijing, Tianjin, Liaoning, and Shanghai functioned solely as electricity importers. The remaining provinces both exported electricity and received it from other provinces. It is particularly noteworthy that electricity flows between most provinces are not unidirectional but rather exhibit branching and intersecting patterns, reflecting a high level of complexity. For example, from the perspective of electricity exports, the power system in the Inner Mongolia Autonomous Region supplies not only its own province but also transmits electricity to eight other provinces. From the perspective of electricity imports, Guangdong is the largest recipient, relying on power from six other provincial systems. This pattern of electricity flow highlights the dependence of economically developed regions on external electricity sources, especially during periods of high demand, interprovincial electricity imports play a crucial role in ensuring stable power supplies.
Figure 4 shows the proportion of carbon emissions from cross-spatial electricity transmission (including cross-border, cross-regional, and cross-provincial transmission) in the total carbon emissions of provincial power systems in 2022. In provincial power systems, the share of carbon emissions from cross-spatial electricity transmission varies widely, ranging from 0% to 71.27%. Notably, in 14 provinces such as Beijing, Hebei, and Shanghai, the proportion of carbon emissions from cross-spatial transmission exceeds 20%, indicating a high reliance on imported electricity from other spatial scopes and a significant impact of external electricity transmission on their power system carbon footprint factors. At the same time, it is observed that the proportion of carbon emissions from cross-spatial transmission does not show a positive correlation with the proportion of electricity volume. Among the provincial power systems, 16 provinces have a higher electricity share than emission share for cross-spatial electricity transmission, while the remaining provinces (excluding those not receiving cross-spatial electricity) show a higher emission share than electricity share. For example, in Chongqing, the cross-spatial transmitted electricity accounts for 56.05% of total electricity consumption, but the corresponding carbon emissions account for only 34.42%, which is lower than the electricity share. This is because Chongqing receives a large amount of low-carbon electricity from Sichuan Province, which influences its overall power mix. This discrepancy reflects the uncertainty in the impact of cross-spatial electricity transmission on the carbon footprint factor of power systems, as this factor is influenced by multiple variables such as transmission volume, electricity sources, and electricity demand. It also provides a new perspective for reducing the carbon footprint factor of power systems. Therefore, cross-spatial electricity transmission should be fully considered in carbon footprint factor calculations to improve the accuracy of assessments.
SF6 gas, widely used as an insulating gas in electrical equipment, has been extensively applied in power systems around the world [70]. The results of this study shows that SF6 leakage accounts for 34.55% of the total emissions from the transmission and distribution system, reaching a non-negligible level. Moreover, SF6 was listed as one of the major greenhouse gases by the Kyoto Protocol issued in 1998, and among all greenhouse gases, it has the highest global warming potential (GWP), with an atmospheric lifetime of up to 3200 years. Studies have shown that from 2008 to 2018, the global annual SF6 emissions increased by approximately 24%, reaching 9000 tons. These data clearly indicate that SF6 leakage from power systems can have serious environmental impacts [71,72]. Meanwhile, with the continuous expansion of China’s power grid construction and the increasing demand for electrical equipment, reducing SF6-related emissions has become a significant challenge [73]. At present, it remains difficult to obtain up-to-date and detailed data on SF6 leakage in power systems. Therefore, this study provides a preliminary analysis of SF6 leakage based on case study data to highlight its importance. Existing research has also explored monitoring methods for SF6 leakage in power systems [74,75,76], suggesting that with policy support, it would be feasible to obtain detailed SF6 leakage data for use in future carbon footprint factor accounting of power systems. In summary, SF6 leakage should not be overlooked in the calculation of power system carbon footprint factors. Including it in the accounting scope not only fully reflects its greenhouse effect but also provides scientific support for setting emission reduction targets in power systems.

3.3. Spatio-Temporal Differences of Carbon Footprint Factors of Power Systems

The accuracy of the power system carbon footprint factor is influenced not only by accounting elements but also by temporal and spatial differences. Although there may be interactions between the temporal and spatial dimensions, this study analyzes them separately in order to clarify their individual impacts on the power system carbon footprint factor. At the same time, this study assumes that the variation in the power system carbon footprint factor over time is primarily determined by the energy structure and technological level of the given year, with low historical dependency.

3.3.1. Time Dimension

The annual variation trend of the national power system carbon footprint factor is shown in Figure 5. As illustrated, from 2005 to 2022, the national power system carbon footprint factor exhibited a clear downward trend, ranging from 0.6727 kgCO2e/kWh to 0.8604 kgCO2e/kWh, with a cumulative decrease of over 20% and an average year-on-year change of 0.0103 kgCO2e/kWh. This trend reflects China’s sustained efforts and achievements in reducing emissions within the power system. Notably, since 2013, the rate of decline in the carbon footprint factor has accelerated significantly. This accelerated trend is closely associated with policy changes aimed at optimizing the energy structure, including the increased share of renewable energy and the development of cleaner coal-fired power technologies, both of which have driven the decarbonization and green transformation of the power system. Furthermore, the study found that the national power system carbon footprint factor closely mirrors the trend in the proportion of thermal power generation, with a strong negative correlation (r = −0.98). This result indicates that the power generation structure is a decisive factor affecting the national carbon footprint factor, and that increasing the share of renewable energy plays a significant role in reducing the carbon footprint of the power system.
Previously, whether in reports by the Ministry of Ecology and Environment or in related cutting-edge studies, power system carbon footprint factor has been calculated using year as the time unit, and no research has yet analyzed the monthly carbon footprint factor of the power system. Therefore, this study takes 2020, 2021, and 2022 as examples to explore the monthly variation in the national power system carbon footprint factor during these three years, as shown in Figure 6.
The results show that when using the month as the time unit, the power system carbon footprint factor exhibits clear seasonal fluctuations. According to the data for 2020, 2021, and 2022, the monthly national power system carbon footprint factor ranged from 0.6713 kgCO2e/kWh to 0.7903 kgCO2e/kWh, 0.6813 kgCO2e/kWh to 0.7690 kgCO2e/kWh, and 0.6442 kgCO2e/kWh to 0.7606 kgCO2e/kWh, respectively. It was found that although the specific values vary by year, the carbon footprint factor of the power system in each month shows the same seasonal fluctuation pattern across the three years, specifically with a decrease in March, an increase in August, another decrease in September, and a rise in November. To verify this pattern, this study conducted one-way ANOVA using quarters as the unit, and found that the differences among the four quarters in 2020, 2021, and 2022 were statistically significant (p = 0.007, 0.039, and 0.010, all less than 0.05), indicating that the power system carbon footprint factor shows significant variation across quarters. This seasonal characteristic suggests that the power system carbon footprint factor is indirectly influenced by climate change. This is because most renewable energy generation depends on the natural conditions. For example, hydroelectric power contributes a higher share during the wet season but drops significantly in the dry season; wind power is more active in spring and autumn, but generation decreases notably in summer due to weaker wind speeds; and photovoltaic power relies on sunlight, which is more abundant in summer due to longer days and stronger solar radiation, while winter has shorter daylight hours and weaker sunlight, leading to lower generation.

3.3.2. Spatial Dimension

Taking 2022 as an example, the carbon footprint factors of power systems in different regions and provinces of China are shown in Figure 7. At the regional level, the carbon footprint factor of the power system exhibits a clear north–south disparity. From highest to lowest, the order is: North China, East China, Northwest, Central China, Northeast, South China, and Southwest power grids, with values ranging from 0.2893 kgCO2e/kWh to 0.7934 kgCO2e/kWh, and a maximum difference of 0.5041 kgCO2e/kWh. At the provincial level, the differences in power system carbon footprint factors are even more pronounced, with values ranging from 0.1324 kgCO2e/kWh to 0.9064 kgCO2e/kWh, spanning 0.7740 kgCO2e/kWh. The CV for regional and provincial power system carbon footprint factors are 27.38% and 29.98%, respectively, indicating a moderate level of dispersion [77]. Among them, provinces dominated by thermal power generation—such as Tianjin, Anhui, and Beijing—have significantly higher carbon footprints than provinces that rely more on clean energy sources, such as Yunnan, Qinghai, and Sichuan. This variation mainly stems from the imbalances in energy structure, power generation technology, and stages of economic development across provinces. In addition, interprovincial power dispatching practices, energy efficiency, and the degree of implementation of low-carbon transition policies in different regions are also key factors influencing provincial power system carbon footprint factors.
The spatial variation in power system carbon footprint factors is not only reflected in differences between geographic locations, but also within the same location due to differences in the spatial scope considered—namely, national, regional, and provincial levels. These scopes range from broad to fine-grained. When calculating the carbon footprint factor, differences in spatial scope involve variations in energy structure, sources and proportions of cross-spatial electricity imports, and line loss rates [60]. In this study, the smallest spatial scope is the province; therefore, provinces are used as the baseline for comparison with regional and national data. The resulting differences are shown in Figure 8.
The difference between provincial and regional power system carbon footprint factors ranges from −73.98% to 119.95%. Provinces where the provincial carbon footprint factor is higher than the regional level are mainly located in Central China, while those where the provincial factor is lower than the regional level are primarily concentrated in the western and northern regions. Among them, Chongqing shows the largest discrepancy, with its provincial power system carbon footprint factor being 2.20 times that of the Southwest regional power system to which it belongs. The main reasons are as follows: First, Chongqing’s power structure is dominated by thermal power, which accounts for 75.56%. At the regional level, however, the Southwest grid benefits from unique mountainous terrain, abundant water systems, and precipitation, making hydroelectric power the primary source; clean energy accounts for more than two-thirds of the electricity mix. Second, net interprovincial electricity imports into Chongqing account for about 30% of its total electricity consumption, and provinces such as Hubei and Guizhou, which supply electricity to Chongqing, have higher carbon footprint factors than the Southwest grid average. Third, Chongqing’s electricity generation only accounts for 16.67% of the total generation in the Southwest grid, which is not enough to significantly influence the carbon footprint level of the entire regional grid.
The differences between the provincial and national power system carbon footprint factors exhibit a distribution pattern distinct from that of provincial versus regional comparisons. Provinces with relatively higher provincial carbon footprint factors are distributed from Central China to the north-central regions, while provinces with relatively lower factors have shifted from the western and northern regions to the southwest. Among them, in 20 provinces including Beijing, Tianjin, and Shanghai, the difference between the provincial power system carbon footprint factor and the national level is greater than that between the provincial and regional levels. Meanwhile, in 8 provinces such as Chongqing, Inner Mongolia, and Jilin, the differences show an alternating pattern of positive and negative values.
These results indicate that, for the same geographic area, the power system carbon footprint factor is significantly influenced by the spatial scope. The higher the spatial resolution, the more accurately the carbon footprint factor reflects the region’s resource endowment and energy structure. However, as the spatial scope expands, local characteristics are gradually replaced by regional commonalities, resulting in a corresponding reduction in the accuracy of the carbon footprint factor.

3.4. Analysis of the Impact of Power System Carbon Footprint Factor—A Case Study of the Chemical Industry

The power system carbon footprintfactor (abbreviated as CFE in Figure 9) plays an important role in life cycle impact assessment studies and product carbon footprint accounting, providing key parameters for energy consumption and carbon emission evaluation. This study takes China’s largest energy-consuming industry, the chemical raw materials and chemical products manufacturing industry (hereinafter referred to as the chemical industry), as an example. This study analyzes the impact of changes in the power system carbon footprint factor on the electricity-related carbon emissions of this industry in 2022 from both time and space perspectives. The results are shown in Figure 9. In terms of time variation, the annual analysis is conducted at 5-year intervals, selecting the national electricity system carbon footprint factors for 2012, 2017, and 2022. The quarterly analysis includes May, August, October, and January/February, representing typical months in spring, summer, autumn, and winter, respectively. In terms of spatial differences, the 2022 provincial, regional, and national electricity system carbon footprint factors are used.
In terms of time range, the carbon emission difference caused by the power system carbon footprint factor lagging by five years ranges from 20,300 tCO2e to 4.937 million tCO2e. Among them, Shandong Province, as the largest electricity consumer in the chemical industry, accounts for 9.14% of the total carbon emissions from the industry’s electricity consumption in 2022. The difference due to a ten-year lag ranges from 45,800 tCO2e to 11.158 million tCO2e, indicating that the lagging power system carbon footprint factor can lead to an overestimation of electricity-related carbon emissions, thereby affecting the accurate assessment of product carbon footprints. Due to factors like climate, the power system carbon footprint factor fluctuates between different seasons, with spring and autumn having relatively lower values, while summer and winter have higher values. Among these, the months with the largest carbon emission differences due to the power system carbon footprint factor are January, February, and May, ranging from 38,400 tCO2e to 9.344 million tCO2e. The impact of the power system carbon footprint factor in different months even exceeds the impact of a five-year lag, highlighting the necessity of monthly accounting and reporting of the power system carbon footprint factor. Fully considering seasonal variations and timeliness is crucial for improving the accuracy of power system carbon footprint assessments. In terms of spatial range, the emission difference due to the expansion of the power system carbon footprint factor’s spatial range increases significantly. The carbon emission difference between the provincial and regional power system carbon footprint factors ranges from −5.641 million tCO2e to 3.9416 million tCO2e. The difference between using provincial and national power system carbon footprint factors ranges from −14.8698 million tCO2e to 11.2876 million tCO2e. Especially in provinces like Yunnan and Qinghai, the carbon emission differences caused by different spatial ranges of the power system carbon footprint factor even exceed the total electricity-related carbon emissions of these provinces. This phenomenon indicates that it is essential to improve the spatial precision of the power system carbon footprint factor. Only with carbon emission factors precise to the provincial or regional level can the actual carbon emissions of different regions be more accurately reflected.

4. Conclusions

The power system carbon footprint factor is a key parameter for calculating the indirect carbon emissions of product carbon footprints. This study analyzed the differences in power system carbon footprint factors from both temporal and spatial dimensions, examined the missing elements in existing calculation methods, and conducted an impact analysis based on case studies. The main conclusions are as follows:
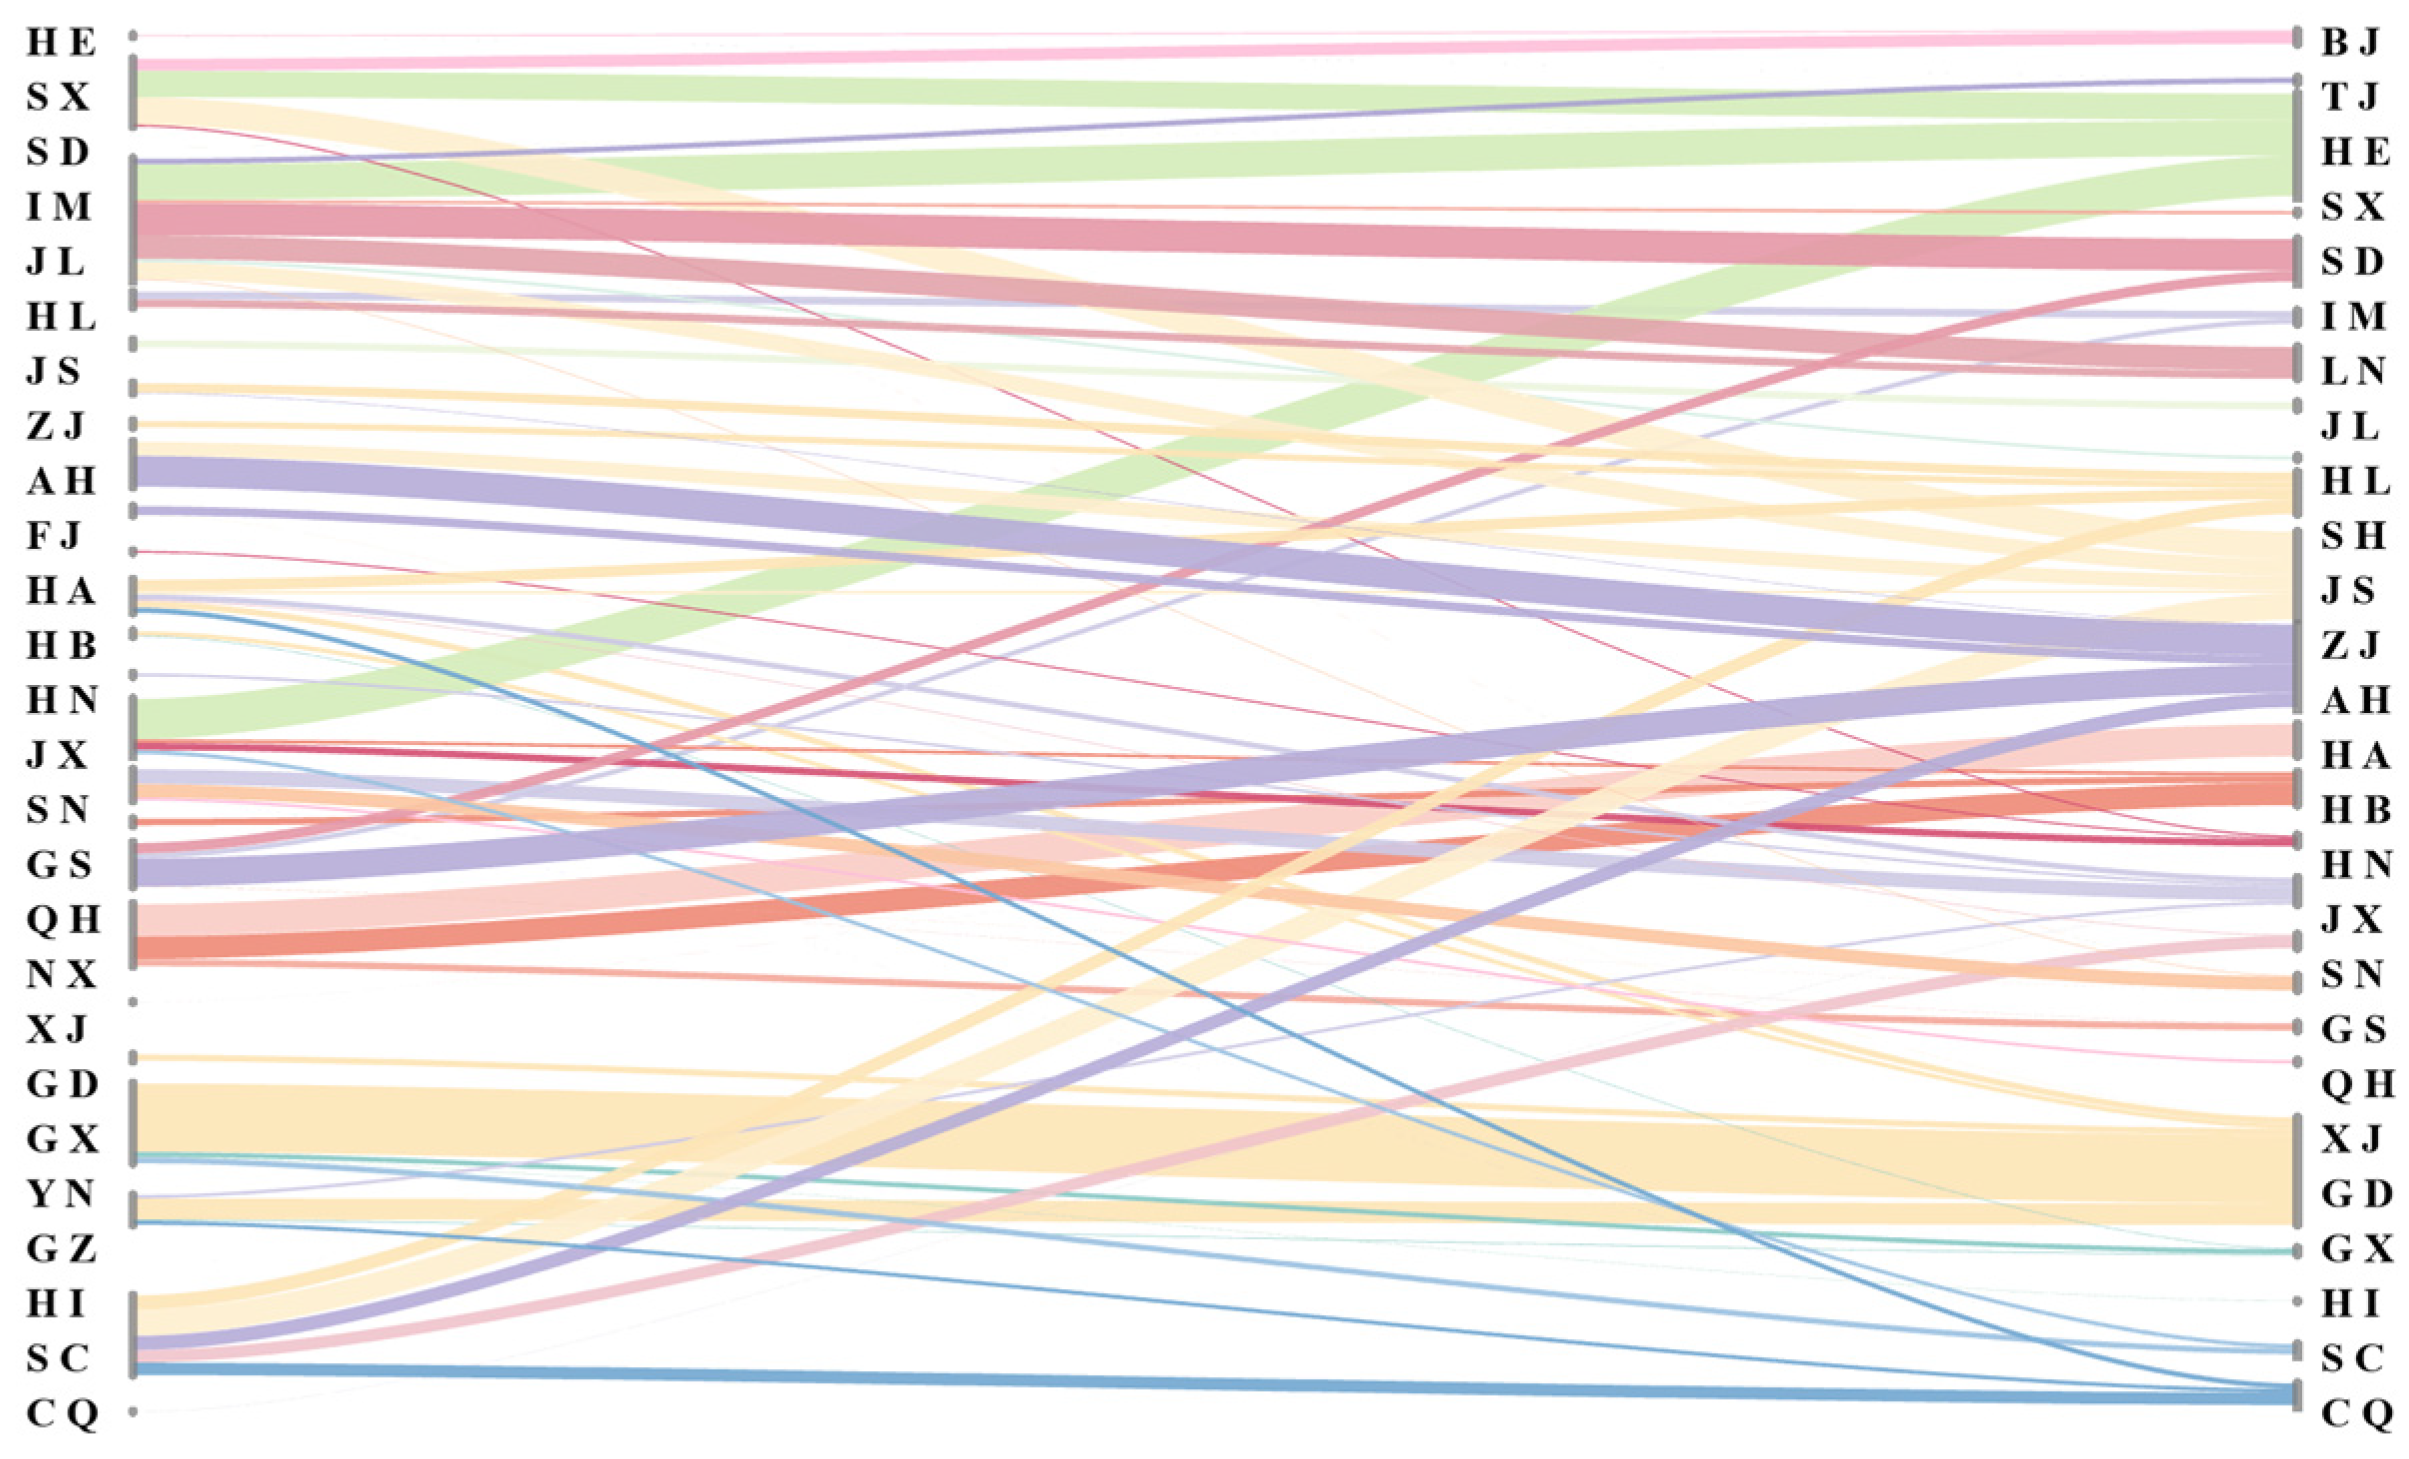
  • Regarding the newly added accounting elements: Over the past 18 years, transmission and distribution losses have only fallen below 5% in 2022, yet in that year, 7 provinces still exceeded the 5% threshold. In provincial power systems, carbon emissions from cross-spatial electricity transmission accounted for as much as 71.27% of total emissions, and the relationship between emissions and electricity volume was not proportional. Carbon emissions caused by SF6 gas leakage represented 34.55% of the total emissions from the transmission and distribution system. Based on the above results, none of these three accounting elements should be ignored when calculating the carbon footprint factor of the power system.
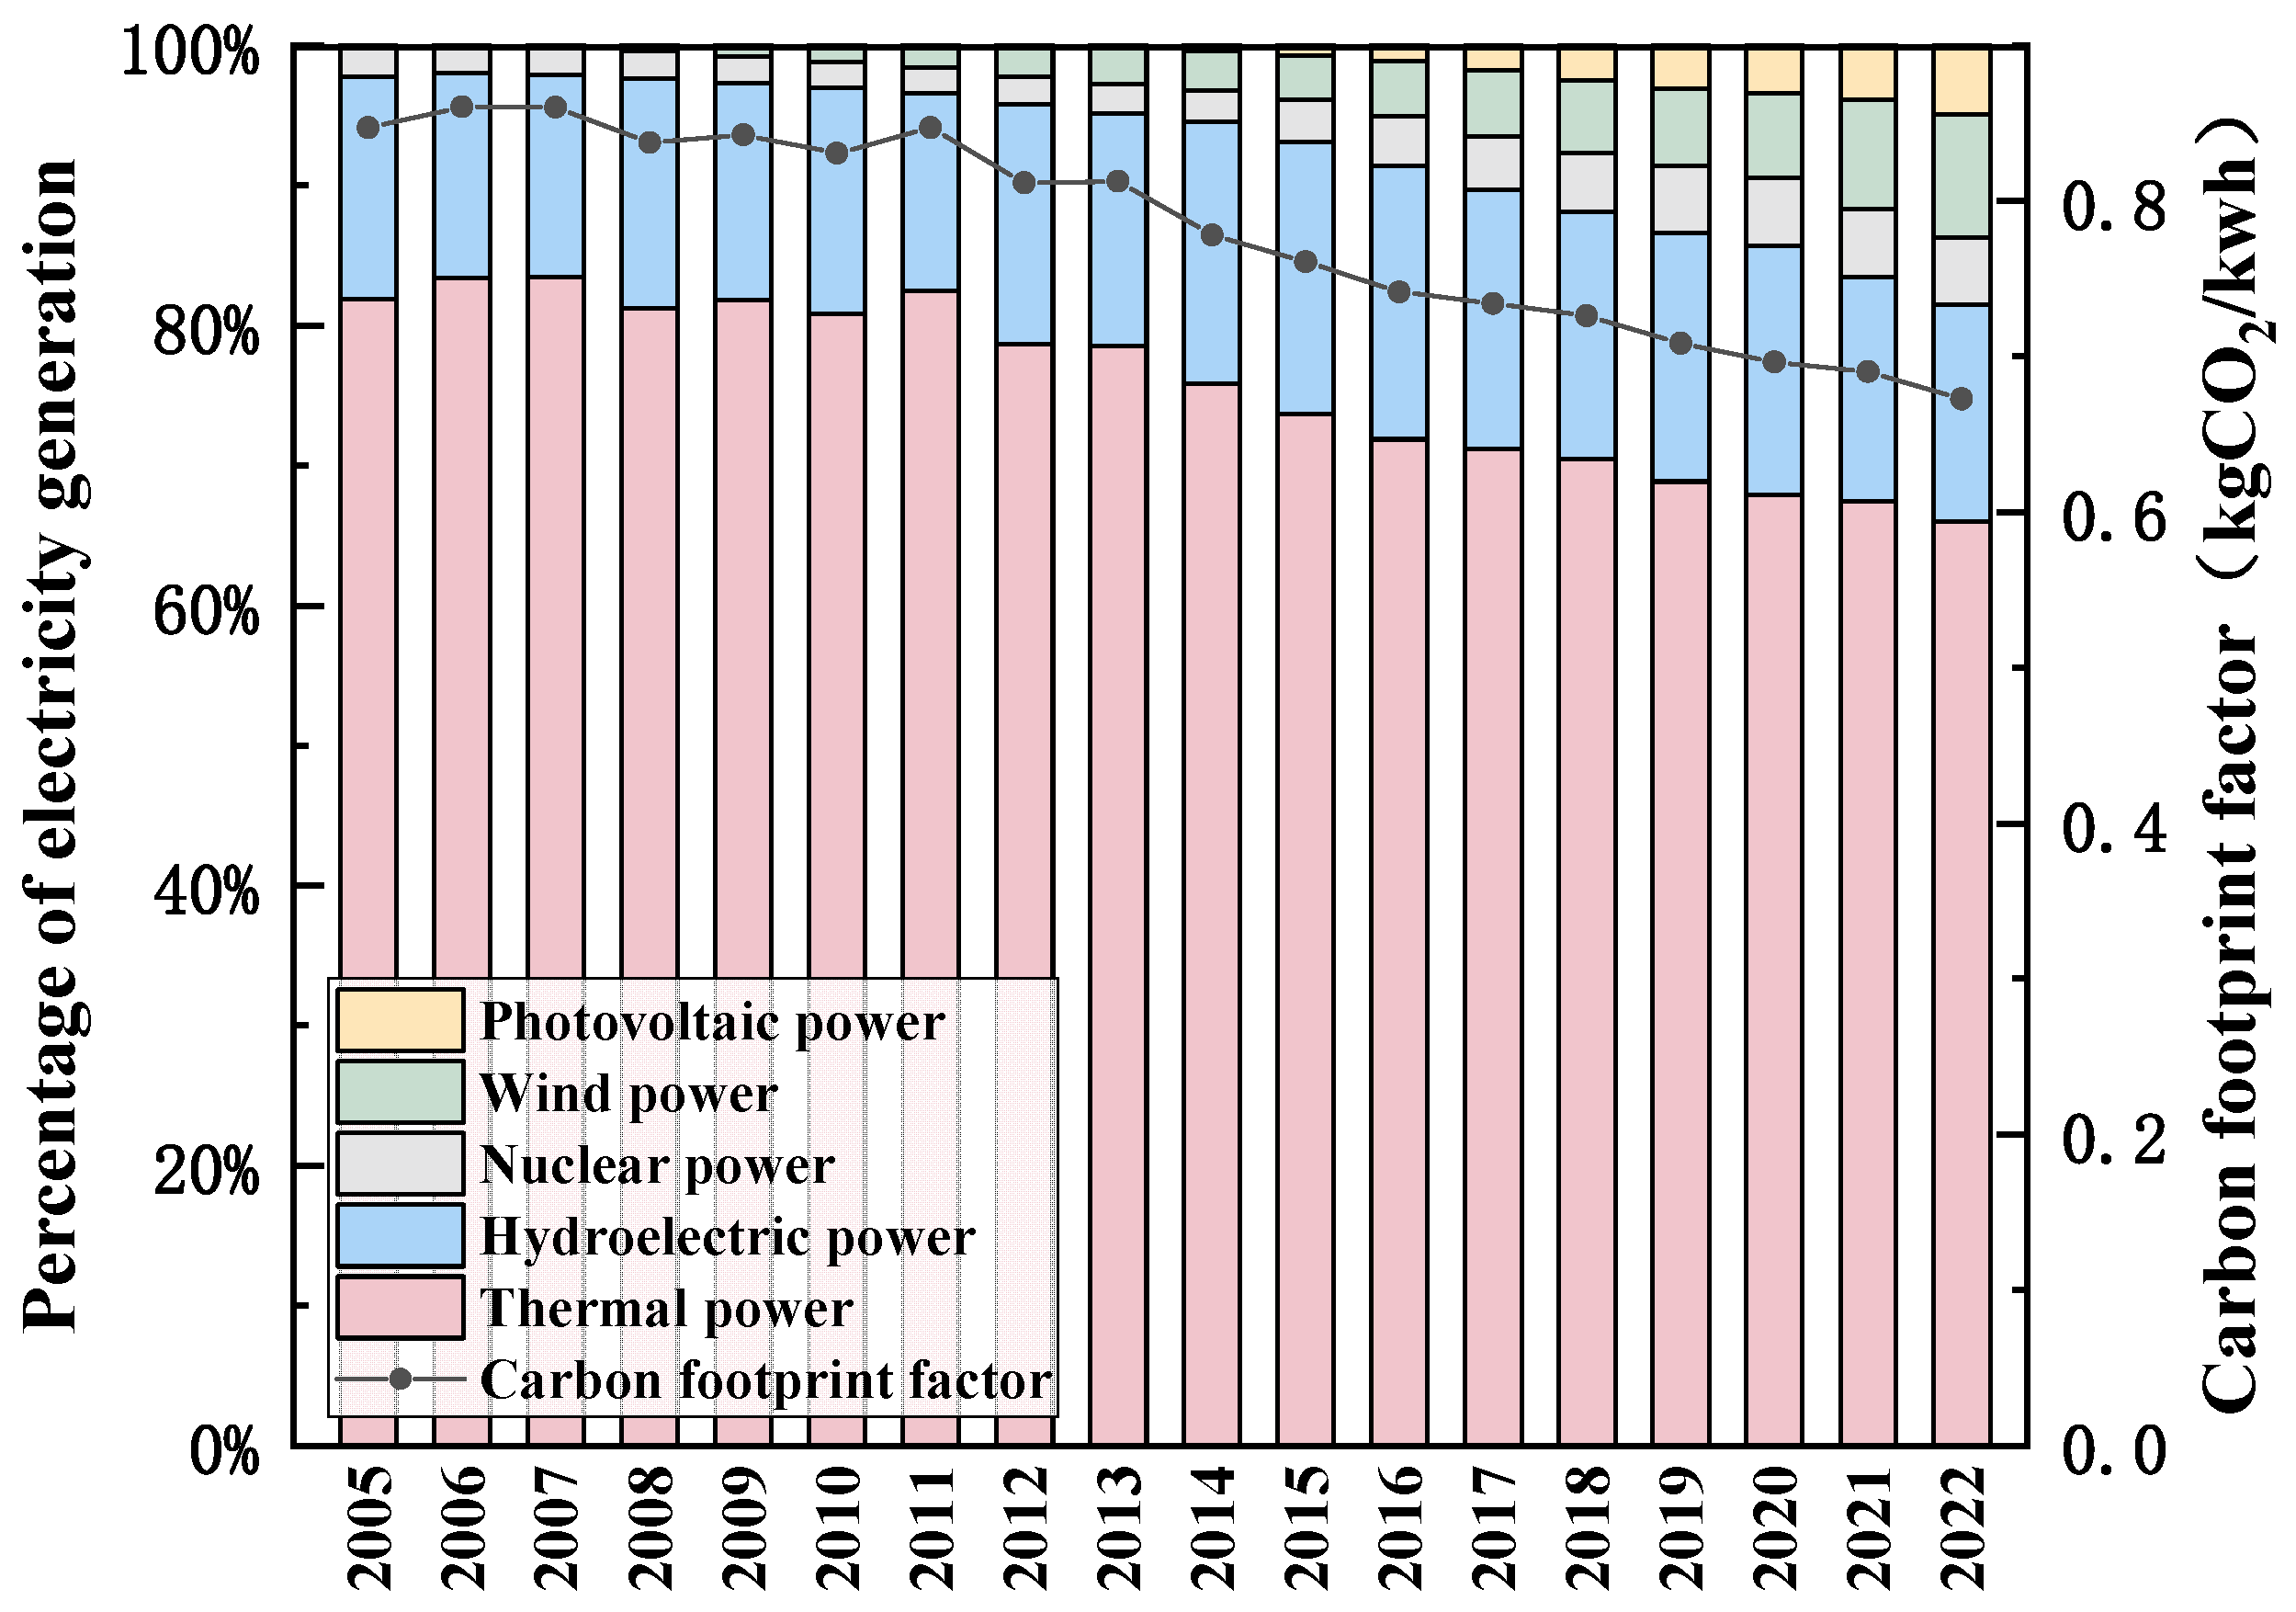
  • Regarding the temporal variation in the power system carbon footprint factor: On an annual scale, the carbon footprint factor shows a clear downward trend, with a cumulative decline of over 20% and an average annual change of 0.0103 kgCO2e/kWh. On a monthly scale, from 2020 to 2022, the differences in carbon footprint factors across quarters were statistically significant (p = 0.007, 0.039, 0.010), exhibiting a seasonal fluctuation pattern. Based on case study analysis, the impact of seasonal variation in the carbon footprint factor on electricity-related carbon emissions is greater than that of using five-year lagged data. Therefore, it is essential to account for and publish power system carbon footprint factors using quarterly, monthly, or even more refined temporal units.
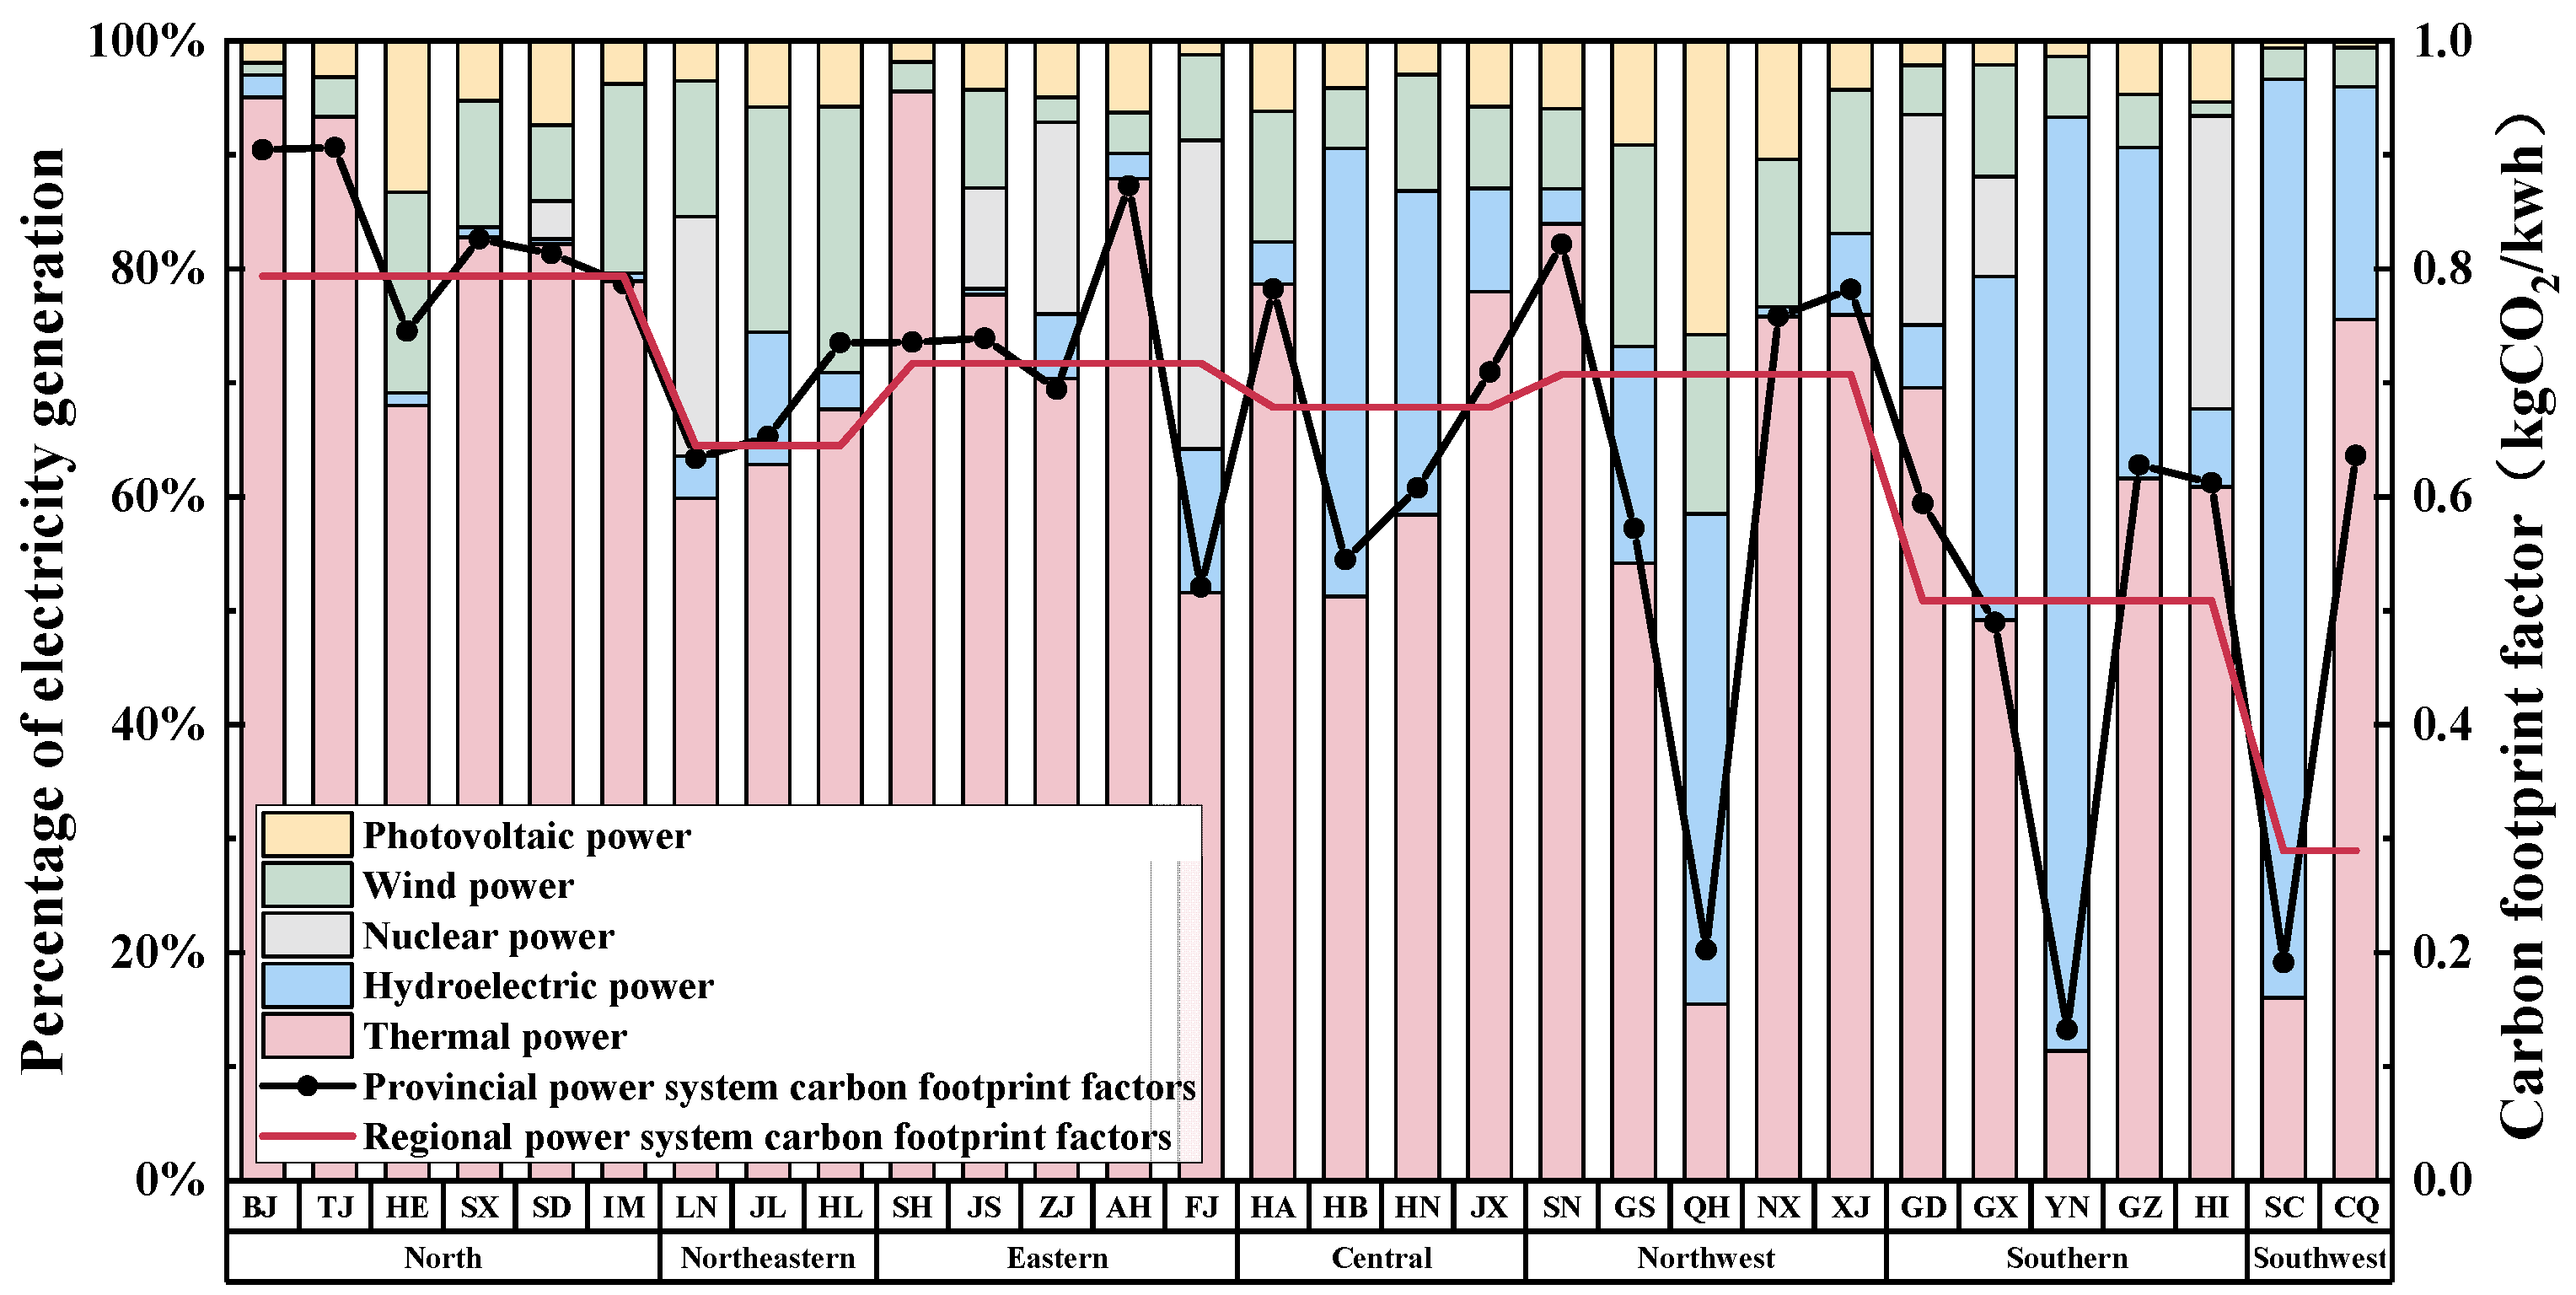
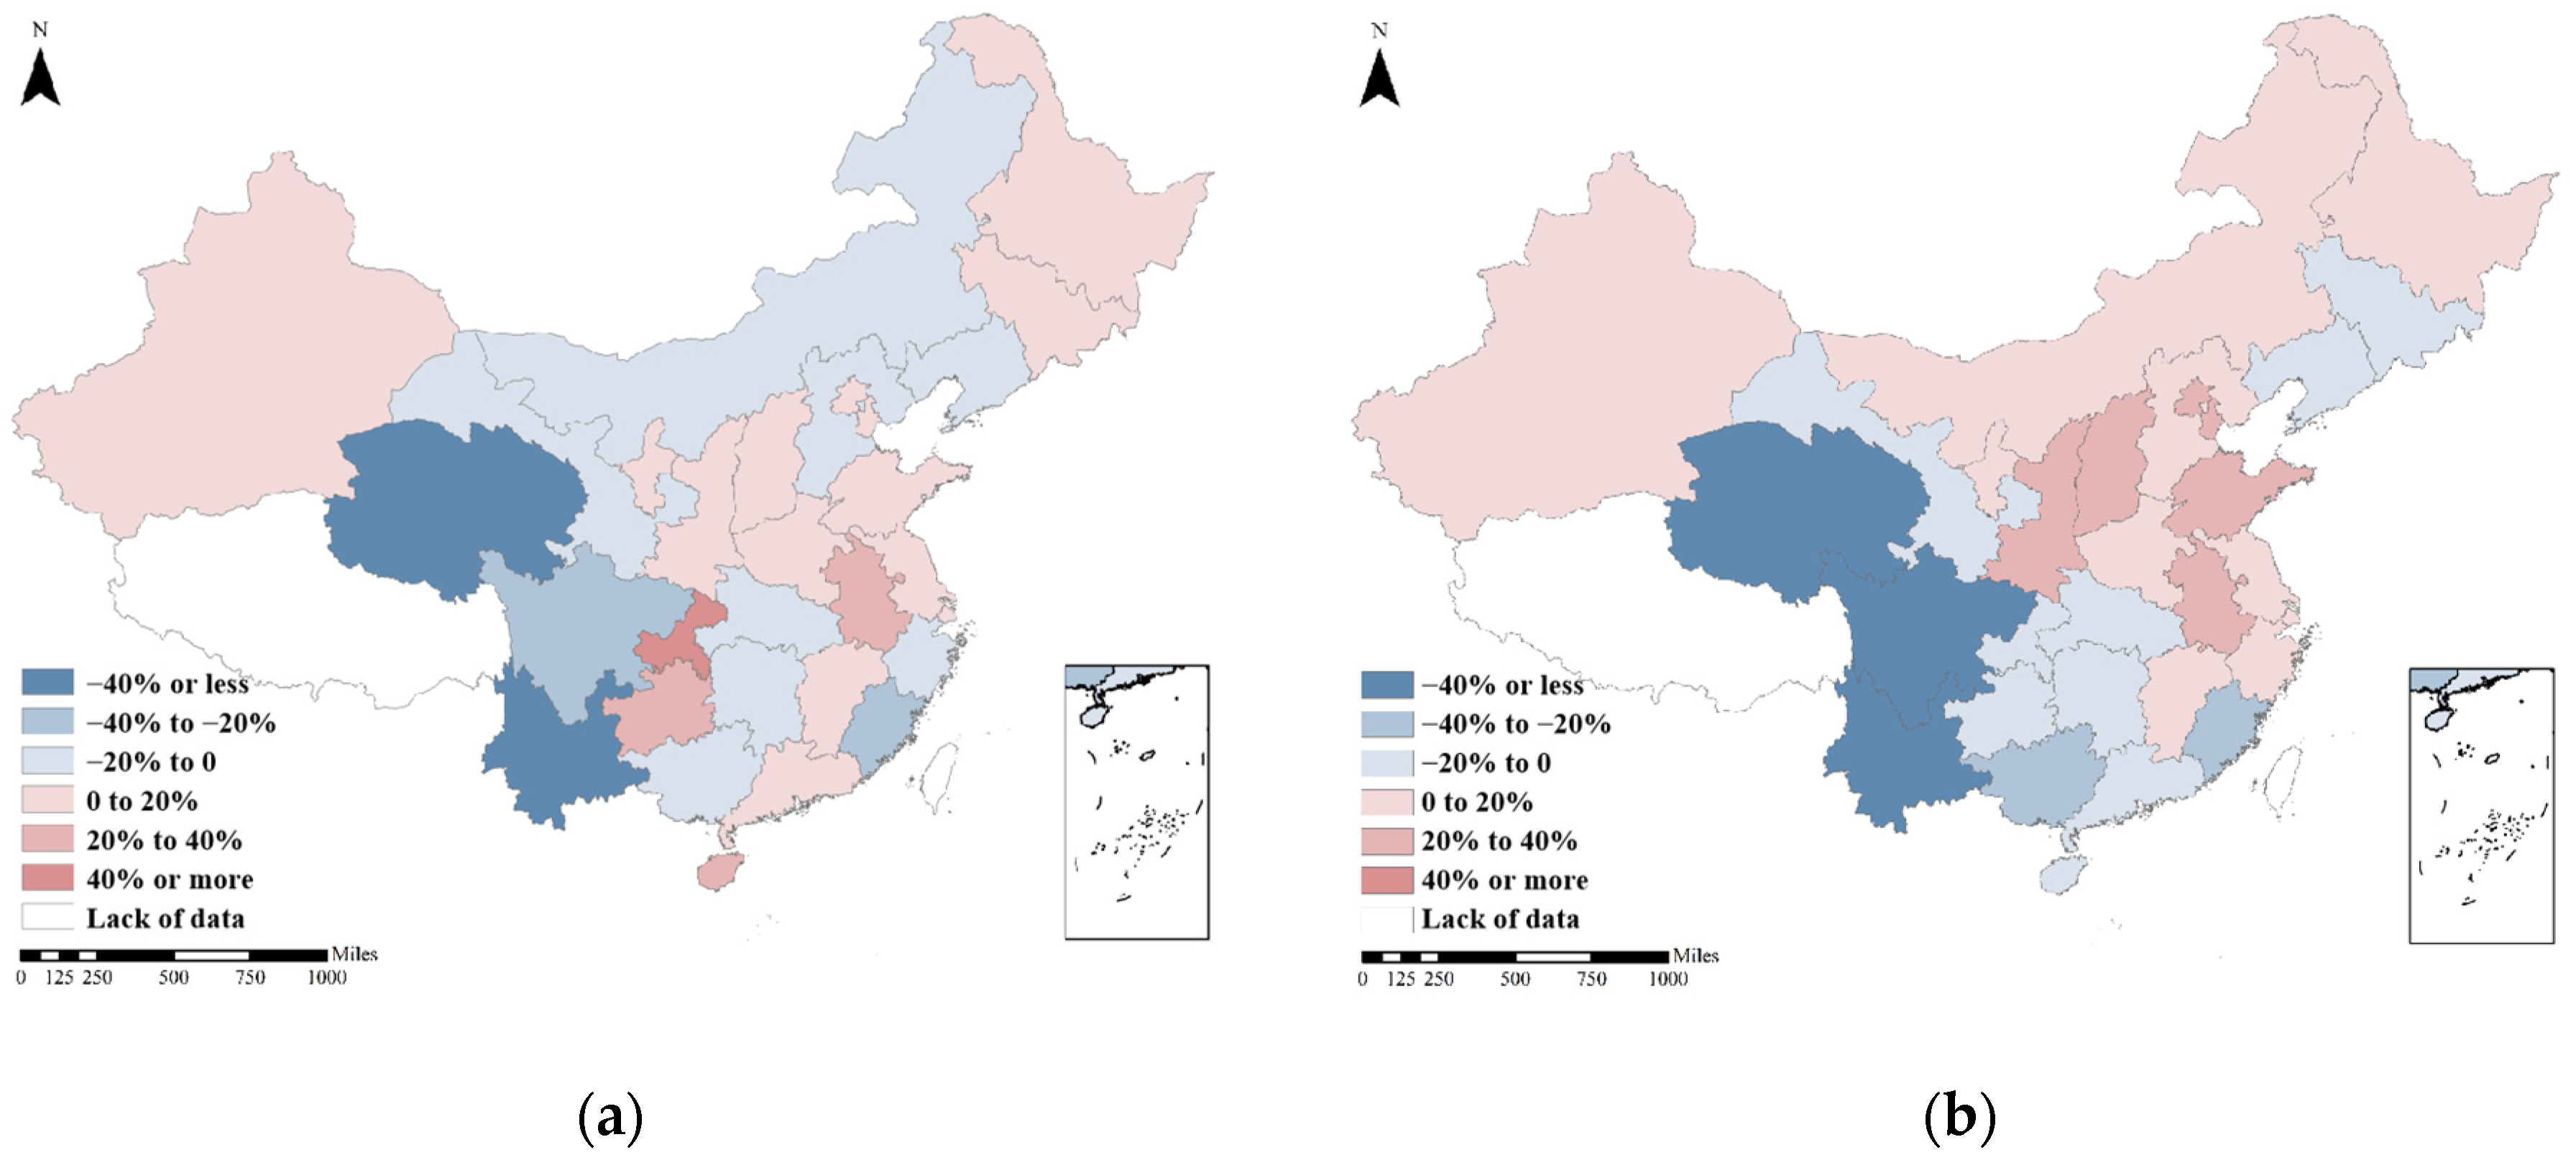
  • Regarding the spatial variation in the power system carbon footprint factor: In 2022, the coefficients of variation for the regional and provincial power system carbon footprint factors were 27.38% and 29.98%, respectively, indicating a moderate level of dispersion. At the same geographic location, the differences between provincial and regional power system carbon footprint factors ranged from −73.98% to 119.95%. When the spatial scope is expanded to the national level, the differences for 20 provinces become even greater than those observed at the regional level.
In summary, the current national-level power system carbon footprint factor in China is insufficient to meet the requirements of carbon emission verification. It is necessary to further improve the calculation methodology, ensure timely updates with shorter update cycles, and refine the spatial scope of the power system.

5. Suggestions

To improve the accuracy of electricity-related carbon emissions accounting in China, based on the conclusions of the above study, the following suggestions are proposed:
  • Strengthen the dynamic monitoring and updating mechanism for power system carbon footprint factors. With the rapid increase in the proportion of clean energy, the evaluation and release cycle of power system carbon footprint factors should be shortened to ensure the timeliness of carbon footprint emissions factors. This can be achieved through technologies such as power automation systems, smart meters, and power communication gateways to enable real-time monitoring of electricity data. These technologies will improve the reliability and immediacy of data acquisition, storage, accounting, and verification. It is recommended that relevant departments establish a dynamic monitoring mechanism and regularly update power system carbon footprint factor data to provide strong support for accurate electricity carbon emissions accounting.
  • Provide high-resolution localized power system carbon footprint factors to improve the matching of used electricity and emission factors. On the basis of national-level planning, it is recommended to gradually refine the spatial scope of the power system carbon footprint factor. By establishing a database of regional- and provincial-level power system carbon footprint factors, or even more refined levels, we can provide precise data support for local carbon emissions accounting and policy development. By leveraging advanced technologies such as the Internet of Things, big data, and artificial intelligence, the accurate identification of electricity sources and types should be realized. Based on this information, the most accurate power system carbon footprint factor should be matched to improve the accuracy and reliability of carbon footprint accounting.
  • Optimize the accounting methods for power system carbon footprint factors, incorporating key accounting elements such as power transmission losses, cross-regional electricity transmission, and SF6 gas leakage. This will help build a more detailed and refined power system carbon footprint accounting system. Additionally, a comprehensive data collection, storage, and management mechanism should be established to strengthen the collection, storage, and sharing of carbon emissions-related data. This will provide a solid data foundation for accurately accounting for power system carbon footprints.
  • In global energy-related greenhouse gas emissions, the share attributed to electricity and heat has remained above 50% over the past two decades. Therefore, improving the accuracy of power system carbon footprint factors at the global level is essential for the precise accounting of electricity-related carbon emissions, which, in turn, enables a clearer assessment of each country’s efforts in power system decarbonization. The calculation method used in this study is based on fundamental power system structures and domestic statistical data, and, thus, can also serve as a reference for other countries.

Author Contributions

Methodology, A.L.; formal analysis, A.L.; investigation, A.L.; resources, Z.W.; data curation, A.L.; writing—original draft preparation, A.L.; writing—review and editing, Z.W.; supervision, X.S. and F.M.; project administration, Z.W. All authors have read and agreed to the published version of the manuscript.

Funding

This research was funded by Inner Mongolia Autonomous Region Science and Technology Program, grant number 2022YFHH0071.

Data Availability Statement

The original contributions presented in the study are included in the article, further inquiries can be directed to the corresponding author.

Conflicts of Interest

Author Xingyu Sun was employed by the company Inner Mongolia Mengtai Buliangou Coal Industry Co., Ltd. Author Fei Ma was employed by the company Huadian Coal Industry Group Digital Intelligence Technology Co., Ltd. The remaining authors declare that the research was conducted in the absence of any commercial or financial relationships that could be construed as a potential conflict of interest.

References

  1. Li, Y. Peaking Simulation and Regional Reduction Potential of Carbon Emissions in Chinese Power Industry. Ph.D. Thesis, Nanchang University, Nanchang, China, 2024. [Google Scholar]
  2. Lei, S.; Tong, C.; Xiao, B.; Fan, H. Spatiotemporal distribution and influencing factors of carbon emissions in China’s power industry. Meas. Sci. Technol. 2024, 68, 29–33+70. [Google Scholar]
  3. Tian, P.; Liang, X.; Guan, Y.; Zhao, Y.; Mao, B.; Xue, T. Life cycle carbon emissions of China’s power grid and transition pathway planning for power generation structure. Adv. Clim. Chang. Res. 2024, 20, 97–106. [Google Scholar]
  4. ISO 14067:2018; Greenhouse Gases—Carbon Footprint of Products. International Organization for Standardization: Geneva, Switzerland, 2024.
  5. World Resources Institute. GHG Protocol: Product Standard; World Resources Institute: Washington, DC, USA, 2011. [Google Scholar]
  6. Yan, Y.; Li, X.; Wang, R.; Zhao, Z.; Jiao, A. Decomposing the carbon footprints of multinational enterprises along global value chains. Struct. Chang. Econ. D 2023, 66, 13–28. [Google Scholar] [CrossRef]
  7. Wang, Z. Carbon emission factors of China’s power sector objectively reflect the achievements in low-carbon transition. China Environmental News. Available online: https://www.cenews.com.cn/news.html?aid=1190069 (accessed on 9 September 2024).
  8. Su, N. China clarifies calculation methodology for power sector emission factors for the first time. China Energy News 2014, 10. [Google Scholar] [CrossRef]
  9. Zou, L. Research on the application status of LCA databases for carbon footprint certification. China Qual. 2023, 92–95. [Google Scholar] [CrossRef]
  10. Ministry of Ecology and Environment of the People’s Republic of China. Announcement on the Release of 2023 Power Sector Carbon Footprint Factor Data; Ministry of Ecology and Environment of the People’s Republic of China: Beijing, China, 2025.
  11. Ning, L.; Ren, J.; Zhang, Z.; Cai, B.; Zhou, C. Research on 2020 provincial and regional grid carbon footprints in China. Environ. Eng. 2023, 41, 229–236. [Google Scholar]
  12. Zhang, Q.; Qiao, K.; Hu, C.; Su, P.; Cheng, O.; Yan, N.; Yan, L. Study on life-cycle carbon emission factors of electricity in China. Int. J. Low-Carbon. Tec. 2024, 19, 2287–2298. [Google Scholar] [CrossRef]
  13. Li, X.; Li, W.; Dong, Y. Importance of reducing GHG emissions in power transmission and distribution systems. Energy Rep. 2024, 11, 3149–3162. [Google Scholar] [CrossRef]
  14. Yuan, T.; Zhang, W. A review of research on source-storage-load coordinated planning for new power system. Proc. CSEE 2024, 1–20. [Google Scholar] [CrossRef]
  15. National Public Service Platform for Standard Information. Greenhouse Gases Product Carbon Footprint Quantification Requirements and Guidelines Released. Available online: https://www.samr.gov.cn/xw/sj/art/2024/art_c178f30369d046bd90f7e969294552d5.html (accessed on 9 September 2024).
  16. Ministry of Ecology and Environment of the People’s Republic of China. Announcement on the release of CO2 Emission Factors for Electricity in 2021. Available online: https://www.mee.gov.cn/xxgk2018/xxgk/xxgk01/202404/t20240412_1070565.html (accessed on 9 September 2024).
  17. Ministry of Ecology and Environment of the People’s Republic of China. Baseline Emission Factor for the Regional Power Grid in China for the 2019 Emission Reduction Project. Available online: https://www.mee.gov.cn/ywgz/ydqhbh/wsqtkz/202012/t20201229_815386.shtml (accessed on 9 September 2024).
  18. National Energy Administration. Blue Book for the Development of New Power Systems. Available online: https://www.nea.gov.cn/2023-06/02/c_1310724249.htm (accessed on 9 September 2024).
  19. Zhu, J.; Zhou, J.; Zhang, D. Review of full life-cycle carbon footprints accounting of clean energy and power systems. Proc. CSEE 2024, 1–21. [Google Scholar] [CrossRef]
  20. Sun, Q.; Kong, X.; Chen, Y.; Xiang, T.; Gao, B.; Luo, S. An overview of carbon emission accounting methods for the whole chain of the power system. Autom. Electr. Power Syst. 2024, 1–14. Available online: http://kns.cnki.net/kcms/detail/32.1180.TP.20240410.1325.002.html (accessed on 9 September 2024).
  21. Chu, J.; Zhou, Y.; Cai, Y.; Wang, X.; Li, C.; Liu, Q. A life-cycle perspective for analyzing carbon neutrality potential of polyethylene terephthalate (PET) plastics in China. J. Clean. Prod. 2022, 330, 129872. [Google Scholar] [CrossRef]
  22. Tang, C.; Leng, Y.; Wang, P.; Feng, J.; Zhang, S.; Yi, Y.; Li, H.; Tian, S. Study on carbon emissions of a small hydropower plant in Southwest China. Front. Environ. Sci-Switz. 2024, 12, 1462571. [Google Scholar] [CrossRef]
  23. Xu, Y.; Lu, W.; Wang, Z.; Jia, S.; Wang, H.; Pan, Z. Stochastic simulation of groundwater contamination considering parameter and boundary condition uncertainties. China Environ. Sci. 2022, 42, 3244–3253. [Google Scholar]
  24. IPCC. Good Practice Guidance and Uncertainty Management in National Greenhouse Gas Inventories; IPCC: Geneva, Switzerland, 2001. [Google Scholar]
  25. Zhang, L.; Ruiz-Menjivar, J.; Tong, Q.; Zhang, J.; Yue, M. Examining the carbon footprint of rice production and consumption in Hubei, China: A life cycle assessment and uncertainty analysis approach. J. Environ. Manag. 2021, 300, 113698. [Google Scholar] [CrossRef]
  26. Wei, X.; Tan, X.; Ruan, J.; Lin, M.; Qin, L.; Sun, G.; Xiang, K.; Chu, Y. Research on carbon emission factors of regional and provincial power grids from 2005 to 2021. Adv. Clim. Chang. Res. 2024, 20, 337–350. [Google Scholar]
  27. National Energy Administration of China. 2021 National Electric Power Reliability Annual Report; National Energy Administration of China: Beijing, China, 2021.
  28. National Energy Administration of China. 2021 National Electric Power Reliability Annual Report; National Energy Administration of China: Beijing, China, 2022.
  29. National Energy Administration of China. 2021 National Electric Power Reliability Annual Report; National Energy Administration of China: Beijing, China, 2023.
  30. China Nuclear Strategic Planning Research Institute; World Nuclear Association. Report on the Operational Performance of the World’s Nuclear Power Plants. Available online: https://nnsa.mee.gov.cn/ywdt/hyzx/202308/t20230816_1038692.html?utm_source=chatgpt.com (accessed on 16 August 2024).
  31. Global Wind Energy Council. Global Wind Report 2024. Available online: https://www.gwec.net/reports/globalwindreport/2024 (accessed on 5 January 2025).
  32. Xu, L.; Zhang, S.; Yang, M.; Li, W.; Xu, J. Environmental effects of China’s solar photovoltaic industry during 2011-2016: A life cycle assessment approach. J. Clean Prod. 2018, 170, 310–329. [Google Scholar] [CrossRef]
  33. Li, H.; Jiang, H.; Dong, K.; Wei, Y.; Liao, H. A comparative analysis of the life cycle environmental emissions from wind and coal power: Evidence from China. J. Clean. Prod. 2020, 248, 119192. [Google Scholar] [CrossRef]
  34. Zhao, X.; Cai, Q.; Zhang, S.; Luo, K. The substitution of wind power for coal-fired power to realize China’s CO2 emissions reduction targets in 2020 and 2030. Energy 2017, 120, 164–178. [Google Scholar] [CrossRef]
  35. Yuan, L.; Xu, C. Life Cycle Assessment of low-rank coal utilization for power generation and energy transportation. Energies 2019, 12, 2365. [Google Scholar] [CrossRef]
  36. Sammarchi, S.; Li, J.; Izikowitz, D.; Yang, Q.; Xu, D. China’s coal power decarbonization via CO2 capture and storage and biomass co-firing: A LCA case study in Inner Mongolia. Energy 2022, 261, 125158. [Google Scholar] [CrossRef]
  37. Qin, P.; Xu, H.; Liu, M.; Xiao, C.; Forrest, K.E.; Samuelsen, S.; Tarroja, B. Assessing concurrent effects of climate change on hydropower supply, electricity demand, and greenhouse gas emissions in the Upper Yangtze River Basin of China. Appl. Energ. 2020, 279, 115694. [Google Scholar] [CrossRef]
  38. Wang, L.; Wang, Y.; Du, H.; Zuo, J.; Li, R.Y.M.; Zhou, Z.; Bi, F.; Garvlehn, M.P. A comparative life-cycle assessment of hydro, nuclear and wind power: A China study. Appl. Energ. 2019, 249, 37–45. [Google Scholar] [CrossRef]
  39. Xia, F.; Song, F. Evaluating the economic impact of wind power development on local economies in China. Energ. Policy 2017, 110, 263–270. [Google Scholar] [CrossRef]
  40. Peng, Y.; Yang, Q.; Wang, L.; Wang, S.; Li, J.; Zhang, X.; Zhang, S.; Zhao, H.; Zhang, B.; Wang, C.; et al. VOC emissions of coal-fired power plants in China based on life cycle assessment method. Fuel 2021, 292, 120325. [Google Scholar] [CrossRef]
  41. Wang, J.; Wang, R.; Zhu, Y.; Li, J. Life cycle assessment and environmental cost accounting of coal-fired power generation in China. Energ. Policy 2018, 115, 374–384. [Google Scholar] [CrossRef]
  42. Liu, Y.; Ren, P.; Zheng, Y.; Gao, F.; Sun, B.; Gong, X. Life cycle assessment and regionalized carbon footprint analysis of hydropower generation. J. Beijing Univ. Technol. 2024, 50, 282–289. [Google Scholar]
  43. Li, X.; Gui, F.; Li, Q. Can hydropower still be considered a clean energy source compelling evidence from a middle-sized hydropower station in China. Sustainability 2019, 11, 4261. [Google Scholar] [CrossRef]
  44. Li, Y.; Qin, Y.; Yang, L.; Li, Z.; Lu, L. Estimation and analysis of carbon emissions from the large-and medium-sized reservoirs in the upper reaches of Changjiang River: On the basis of the IPCC National Greenhouse Gas Inventory. J. Lake Sci. 2023, 35, 131–145. [Google Scholar]
  45. Wang, L. Environmental Effects Evaluation of Power energy in China from the Perspective of Environmental Footprints. Master’s Thesis, Tianjin University, Tianjin, China, 2019. [Google Scholar]
  46. Jiang, Z.; Pan, Z.; Xing, J.; Yu, F. Greenhouse gas emissions from nuclear power chain life cycle in China. China Environ. Sci. 2015, 35, 3502–3510. [Google Scholar]
  47. Gao, C.; Zhu, S.; An, N.; Na, H.; You, H.; Gao, C. Comprehensive comparison of multiple renewable power generation methods: A combination analysis of life cycle assessment and ecological footprint. Renew. Sust. Energ. Rev. 2021, 147. [Google Scholar] [CrossRef]
  48. Gao, C.; Na, H.; Song, K.; Dyer, N.; Tian, F.; Xu, Q.; Xing, Y. Environmental impact analysis of power generation from biomass and wind farms in different locations. Renew. Sust. Energ. Rev. 2019, 102, 307–317. [Google Scholar] [CrossRef]
  49. Du, Y.; Huang, H.; Liu, H.; Zhao, J.; Yang, Q. Life cycle assessment of abandonment of onshore wind power for hydrogen production in China. Sustainability 2024, 16, 5772. [Google Scholar] [CrossRef]
  50. Fu, Y. Life Cycle Assessment of Multi-Crystalline Silicon Photovoltaic System in China. Master’s Thesis, Nanjing University, Nanjing, China, 2013. [Google Scholar]
  51. Hu, J. Research on Carbon Emission of Photovoltaic Generation with Life Cycle Assessment. Master’s Thesis, Nanjing University of Aeronautics and Astronautics, Nanjing, China, 2017. [Google Scholar]
  52. Li, Y. Life Cycle Assessment of Crystalline Silicon Modules in China. Master’s Thesis, Shanghai Jiao Tong University, Shanghai, China, 2015. [Google Scholar]
  53. Li, Y.; Yu, S. Life cycle assessment of photovoltaic sysstem in China. Environ. Eng. 2014, 32, 119–124. [Google Scholar]
  54. Guo, X.; Dong, Y.; Ren, D. CO2 emission reduction effect of photovoltaic industry through 2060 in China. Energy 2023, 269, 126692. [Google Scholar] [CrossRef]
  55. Ding, N.; Pan, J.; Liu, J.; Yang, J. An optimization method for energy structures based on life cycle assessment and its application to the power grid in China. J. Environ. Manag. 2019, 238, 18–24. [Google Scholar] [CrossRef]
  56. China Products Carbon Footprint Factors Database (CPCD). Available online: https://lca.cityghg.com/ (accessed on 7 January 2025).
  57. IRENA (International Renewable Energy Agency). Available online: https://www.irena.org/ (accessed on 7 January 2025).
  58. Silk Road Impression Korea Division. Report on Investment Outlook and Risk Forecast for North Korea’s Energy Industry in the Post-Epidemic Era, 2026–2031. Available online: https://www.zcqtz.com/KP/nydl/235956.html (accessed on 30 January 2014).
  59. Comprehensive Economic and Industry Data (CEIC). Available online: https://www.ceicdata.com.cn/zh-hans (accessed on 7 January 2025).
  60. Wang, Y.; Zhou, S.; Yao, Z.; Ou, X. Modeling of life-cycle CO2 and air pollutant emission interactions of coal power generation in China. Electr. Power 2021, 54, 128–135. [Google Scholar]
  61. Zhang, Y.; Dong, X.; Wang, X.; Zhang, P.; Liu, M.; Zhang, Y.; Xiao, R. The relationship between the low carbon industrial model and human well-being: A case study of the electric power industry. Energies 2023, 16, 1357. [Google Scholar] [CrossRef]
  62. Huang, Y.; Liu, Y.; Xu, W.; Li, J. Life cycle carbon emissions of water reservoir and hydroelectric projects: A case study of the Quanmutang project. J. Tsinghua Univ. Sci. Technol. 2022, 62, 1366–1373. [Google Scholar]
  63. International Hydropower Association. 2018 Hydropower Status Report. Available online: https://www.hydropower.org/publications/2018-hydropower-status-report. (accessed on 9 September 2024).
  64. Mu, X.; Xu, Q.; Liu, Y.; Hu, G. Environmental effect analysis of nuclear power based on life cycle assessment. J. Saf. Environ. 2022, 22, 2775–2781. [Google Scholar]
  65. Liu, P.; Liu, L.; Xu, X.; Zhao, Y.; Niu, J.; Zhang, Q. Carbon footprint and carbon emission intensity of grassland wind farms in Inner Mongolia. J. Clean. Prod. 2021, 313, 127878. [Google Scholar] [CrossRef]
  66. Zhang, J.; Zhu, G. Comparative studies of photovoltaic power generation and coal-fired power generation base on life cycle assessment. Environ. Sci. Manag. 2014, 39, 86–90. [Google Scholar]
  67. Liao, X.; Tan, Q.; Zhang, W.; Ma, X.; Ji, J. Analysis of life cycle greenhouse gas emission reduction potentialand cost for China’s power generation sector. Acta Sci. Nat. Univ. Pekin. 2013, 49, 885–891. [Google Scholar]
  68. Song, X.; Du, S.; Deng, C.; Xie, M.; Shen, P.; Zhao, C.; Chen, C.; Liu, X. Life cycle carbon emission accounting and reduction potential assessment for the iron and steel industry. Environ. Sci. 2023, 44, 6630–6642. [Google Scholar]
  69. Zhang, X.; Zhuang, G.; Liu, J. Uncertainty analysis of urban greenhouse gas inventories. J. Environ. Econ. 2018, 3, 8–18+149. [Google Scholar]
  70. Li, H.; Li, L.; Chen, M.; Li, X.; Zhang, K.; Pan, S.; Fan, X.; Yang, Z.; Zou, Z. Safety evaluation of ventilation system on indoor gas insulated switchgear. Power Syst. Big Data 2016, 19, 25–27+32. [Google Scholar]
  71. Simmonds, P.G.; Rigby, M.; Manning, A.J.; Park, S.; Stanley, K.M.; McCulloch, A.; Henne, S.; Graziosi, F.; Maione, M.; Arduini, J.; et al. The increasing atmospheric burden of the greenhouse gas sulfur hexafluoride. Atmos. Chem. Phys. 2020, 20, 7271–7290. [Google Scholar] [CrossRef]
  72. Billen, P.; Maes, B.; Larrain, M.; Braet, J. Replacing SF6 in electrical gas insulated switchgear: Technological alternatives and potential life cycle greenhouse gas savings in an EU-28 perspective. Energies 2020, 13, 1807. [Google Scholar] [CrossRef]
  73. Lv, Z.; Xidao, X. Sulfur hexafluoride: A forgotten greenhouse gas. China Strateg. Emerg. Ind. 2014, 82–84. [Google Scholar] [CrossRef]
  74. Dai, J. The design of SF6 das state monitoring system of high voltage circuit breaker. Master’s Thesis, Dalian University of Technology, Dalian, China, 2018. [Google Scholar]
  75. Liu, C. Research and development of online monitoring technology for gil fault gas. Master’s Thesis, Southwest Jiaotong University, Chengdu, China, 2017. [Google Scholar]
  76. Zhang, Z. Design and implementation of distributed GISD is tribution room gas safety monitoring system. Master’s Thesis, Hangzhou Dianzi University, Hangzhou, China, 2023. [Google Scholar]
  77. Zhang, Z.; Wang, D.; Wu, X.; Wu, X.; Li, T.; Zheng, Z.; He, J.; Liu, L.; Zang, S. Distribution characteristics of soil carbon at different depths in permafrost regions of the Greater Khingan Mountains. Sci. Geogr. Sin. 2024, 44, 534–542. [Google Scholar]
Figure 1. The scope of carbon emissions and electricity accounting for the carbon footprint factor of the power system in this study.
Energies 18 02663 g001
Figure 2. The impact of power transmission loss on the accounting of carbon footprint factors of the power system. (a) Impact of considering transmission losses on the national power system carbon footprint factor from 2005 to 2022; (b) impact of considering transmission losses on provincial power system carbon footprint factors in 2022.
Energies 18 02663 g002
Figure 3. Interprovincial electricity transmission flows in provincial power systems in 2022.
Energies 18 02663 g003
Figure 4. Proportion of cross-spatial electricity transmission and associated carbon emissions in provincial power systems in 2022.
Energies 18 02663 g004
Figure 5. Changes in power generation structure and carbon footprint factor of the national power system from 2005 to 2022.
Energies 18 02663 g005
Figure 6. Monthly changes in power generation structure and carbon footprint factor of the national power system from 2020 to 2022: (a) 2020, (b) 2021, (c) 2022.
Energies 18 02663 g006
Figure 7. Power generation structure and variation in regional and provincial power system carbon footprint factors across provinces in 2022.
Energies 18 02663 g007
Figure 8. Differences in carbon footprint factor values at the same geographic location due to variations in power system spatial scope in 2022: (a) provincial vs. regional, (b) provincial vs. national.
Energies 18 02663 g008
Figure 9. Impact of temporal and spatial variations in power system carbon footprint factors on electricity-related carbon emissions in the chemical industry: (a) lagged factors (2012, 2017, 2022); (b) off-season factors (May, August, October, January–February); (c) factors with different spatial scopes (provincial, regional, national).
Energies 18 02663 g009
Table 1. Research on power system carbon footprint factors.
ResearchMethodsPower System Spatial ScopeData YearsAccounting ScopeGaps
MEE [11]Formula methodNational2023Life-cycle emissions of power generation system and transmission and distribution system infrastructureSingle spatial scope, incomplete accounting scope of transmission and distribution system, and failure to account for line losses
Ning et al. [12]Emission factor methodRegional, provincial2020Direct emissions from thermal power generation, life-cycle emissions of renewable energy power generation, cross-spatial transmission power emissions, and power lossesNon-full life cycle of the power generation process, and emissions from renewable energy power generation sourced from databases
Tian et al. [3]Emission factor methodNational, regional, provincialNational: 2011–2021,
regional, provincial: 2021
Life-cycle emissions of power generation systemExclusion of the transmission and distribution system
Zhang et al. [13]Emission factor methodNational2021Life-cycle emissions of power generation systemSingle spatial scope, exclusion of the transmission and distribution system
Li et al. [14]Emission factor methodNationalnoneLife-cycle emissions of transmission and distribution system (including infrastructure construction, SF6 leakage, and power losses)Exclusion of the power generation system
This workEmission factor methodNational, regional, provincialNational: 2005–2022,
regional, provincial: 2022.
Temporal precision refined to a monthly scale
Life-cycle emissions of power generation system and transmission and distribution system (including infrastructure construction, SF6 leakage, and power losses), cross-spatial transmission power emissions, and power lossesExclusion of the impact of energy storage technologies
Table 2. Regional division of electric power system in China.
Regional Power GridCoverage Area
NorthBeijing, Tianjin, Hebei, Shanxi, Shandong, Inner Mongolia.
NortheasternLiaoning, Jilin, Heilongjiang
EasternShanghai, Jiangsu, Zhejiang, Anhui, Fujian.
CentralHenan, Hubei, Hunan, Jiangxi.
NorthwestShaanxi, Gansu, Qinghai, Ningxia, Xinjiang.
SouthernGuangdong, Guangxi, Yunnan, Guizhou, Hainan.
SouthwestSichuan, Chongqing.
Table 3. Type of power supply unit representative.
Power Supply TypeType of RepresentationReason
Thermal powerCoal-fired unitCoal-fired units account for 92.38%, 92.08%, and 92.08% of the installed capacity of thermal power units in 2021, 2022, and 2023, respectively [27,28,29].
Hydroelectric powerFrancis turbineFrancis turbine units account for 81.09%, 90.08%, and 78.47% of the installed capacity of hydroelectric power units in 2021, 2022, and 2023, respectively [27,28,29].
Nuclear powerPressurized water reactor unitPressurized water reactors account for more than 70% of all operable reactors in China [30].
Wind power1.5 MW wind turbine1.5 MW wind turbines are the most common type of wind turbine in the Chinese wind power market [31].
Photovoltaic powerMulticrystalline silicon solar cellThe environmental impact of polycrystalline and monocrystalline solar photovoltaic products does not differ much, but studies related to the carbon footprint of polycrystalline silicon are more mature [32].
Transmission and distribution systemNational average power gridThe national average power grid represents the average level of China’s transmission and distribution system.
Table 4. Activity data sources.
Data NameData Sources
Thermal power[33,34,35,36,37,38,39,40,41]
Hydroelectric power[42,43,44]
Nuclear power[45,46]
Wind power[38,47,48,49]
Photovoltaic power[50,51,52,53,54]
Grid infrastructure development and SF6 leakage[13,55]
Table 5. Carbon emissions from power generation and transmission and distribution systems.
Power Supply TypeExisting Research (kgCO2e/kWh)Ministry of Ecology and Environment (kgCO2e/kWh)This Study (kgCO2e/kWh)
Thermal power0.8336 [60], 0.9734 [61]0.94400.9509
Hydroelectric power0.0128 [62], 0.0185 [63]0.01430.0148
Nuclear power0.0034 [64], 0.0124 [38]0.00650.0071
Wind power0.0066 [65], 0.0314 [33]0.03360.0305
Photovoltaic power0.0288 [66], 0.0500 [67]0.05450.0517
Transmission and distribution systems
Infrastructure development
0.0018 [13]0.00360.0019
SF6 leakage0.0018none0.0019
Table 6. Uncertainty analysis results of power generation and transmission–distribution systems.
Carbon Emission SourcesUncertainty
Thermal power10.79%
Hydroelectric power8.89%
Nuclear power7.62%
Wind power7.83%
Photovoltaic power11.91%
Transmission and distribution system
(including infrastructure and SF6 leakage)
6.47%
Disclaimer/Publisher’s Note: The statements, opinions and data contained in all publications are solely those of the individual author(s) and contributor(s) and not of MDPI and/or the editor(s). MDPI and/or the editor(s) disclaim responsibility for any injury to people or property resulting from any ideas, methods, instructions or products referred to in the content.

