1. Introduction
There is an international growing global imperative to reduce greenhouse gas emissions to minimize the risks associated with severe climate change. Currently, global annual emissions total approximately 50 billion tons of CO
2 equivalent, with energy use accounting for nearly 75% of these emissions [
1]. Between 1990 and 2008, worldwide energy demand rose by 40%, and today, about 68% of that demand continues to be met through fossil fuels [
2].
As urbanization increases worldwide, the construction industry is expanding, leading to significant consumption of natural resources and carbon emissions. Research from the International Energy Agency (IEA) indicates that the buildings and construction sector accounted for 36% (the largest share) of global final energy use and 39% of energy-related CO2 emissions in 2018; hence, this sector plays a central role in efforts to curb greenhouse gas emissions.
An investigation [
3] employed a refined version of the Kaya model to explore the dynamic links between carbon emissions, energy consumption, and economic growth in the context of China’s construction field.
The Kaya model is a mathematical formula that expresses CO
2 emissions from human sources as a product of four factors: population, energy use per unit of economic output (energy intensity), per capita GDP, and carbon intensity. The findings of [
3] revealed that energy consumption serves as the predominant factor driving the sector’s increase in carbon emissions. This paper will further emphasize and spotlight this outcome.
Figure 1 illustrates global carbon emission trends and shows the share of global energy consumption attributed to the building sector in 2022, along with its associated carbon emissions, which amount to 37%, broken down into 27% operational emissions and 6% embodied emissions, which are relevant to the segment of the construction industry focused on manufacturing building materials such as cement, steel, and glass [
4]. According to the GHG Protocol, direct emissions—commonly known as Scope 1—originate from sources that are owned or controlled by the reporting organization, such as emissions from fuel combustion. In contrast, indirect emissions arise from sources not owned or directly managed by the company, such as emissions associated with purchased electricity, heating, or cooling.
The entire life cycle of buildings, including construction, operation, maintenance, and dismantling, accounts for substantial carbon emissions; hence, urgent interventions should take place to mitigate these emissions and avoid continuing to significantly increase GHG emissions and worsen the global warming crisis. However, without an accurate method for the measurement of carbon emissions that is based on a standardized approach across the sector, reductions cannot be precisely measured or achieved. Identifying a unified approach will not only support this objective, but also allow comparability between different organizations and sectors and may substantially influence how results are interpreted, as well as the credibility of subsequent policy adjustments and strategic planning [
2,
4]. A notable gap in construction industry research is the absence of robust, comprehensive data spanning the full life cycle of construction projects, which is essential for accurately determining baseline energy use and carbon emission intensities for future developments. In response to this limitation and to support the advancement of knowledge in this area, this paper introduces a case study carried out in Abu Dhabi, United Arab Emirates.
Climate change science involves numerous and recurring measurements, monitoring, and validation of carbon emissions, whether at a global or an organizational level. Over the last two decades, carbon accounting has transitioned from a niche activity performed primarily by specialized economists and scientists into a broad and diverse set of practices involving a wide range of stakeholders from various fields. Establishing a shared understanding of carbon accounting is essential, as it fundamentally involves the measurement of both direct and indirect greenhouse gas emissions—past and present. These data underpin the science of climate change, serving as the foundation for developing predictive models that forecast future climate conditions and their potential impacts, and many international policies rely on quantitative targets, which, in turn, rely on precise accounting and reduction measurement methodologies, hence emphasizing the need for an accurate and standardized carbon accounting method that can be used and applied at a global level.
To understand carbon accounting specifically in the construction sector, currently used methods must be reviewed and analyzed to define the variations and competence based on the outcomes to identify a standardized strategy and approach that can be used across the sector. Hence, this paper is systematically structured to review relevant existing studies, providing both quantitative and qualitative comparisons and variations. It presents a case study of four residential construction projects in the United Arab Emirates, analyzing energy consumption data collected throughout the construction phase. This location-specific analysis offers insights tailored to the United Arab Emirates’s construction practices, energy sources used, and climate conditions, filling a geographic and contextual research gap. The analysis, which identifies key patterns of energy use and their associated emissions, leads to the calculation of carbon emission intensity based on energy use. While conventional LCA studies often present cradle-to-gate and cradle-to-grave emission assessments, this paper introduces energy-based carbon emission intensity as a benchmarking tool for construction projects. This metric quantifies emissions directly associated with energy consumption rather than solely material-based emissions, offering a fresh perspective. This distinction highlights energy use as a key determinant of carbon intensity. This contributes to the existing literature on the significance of construction’s impact on the built environment’s life cycle carbon emissions. Additionally, this case study establishes actionable insights into optimizing energy-related decisions and presents a benchmark for future projects, offering a valuable reference for stakeholders such as developers, architects, and policymakers. This benchmark enables the evaluation of the environmental impact of construction activities and aids in the establishment of carbon reduction targets for future projects.
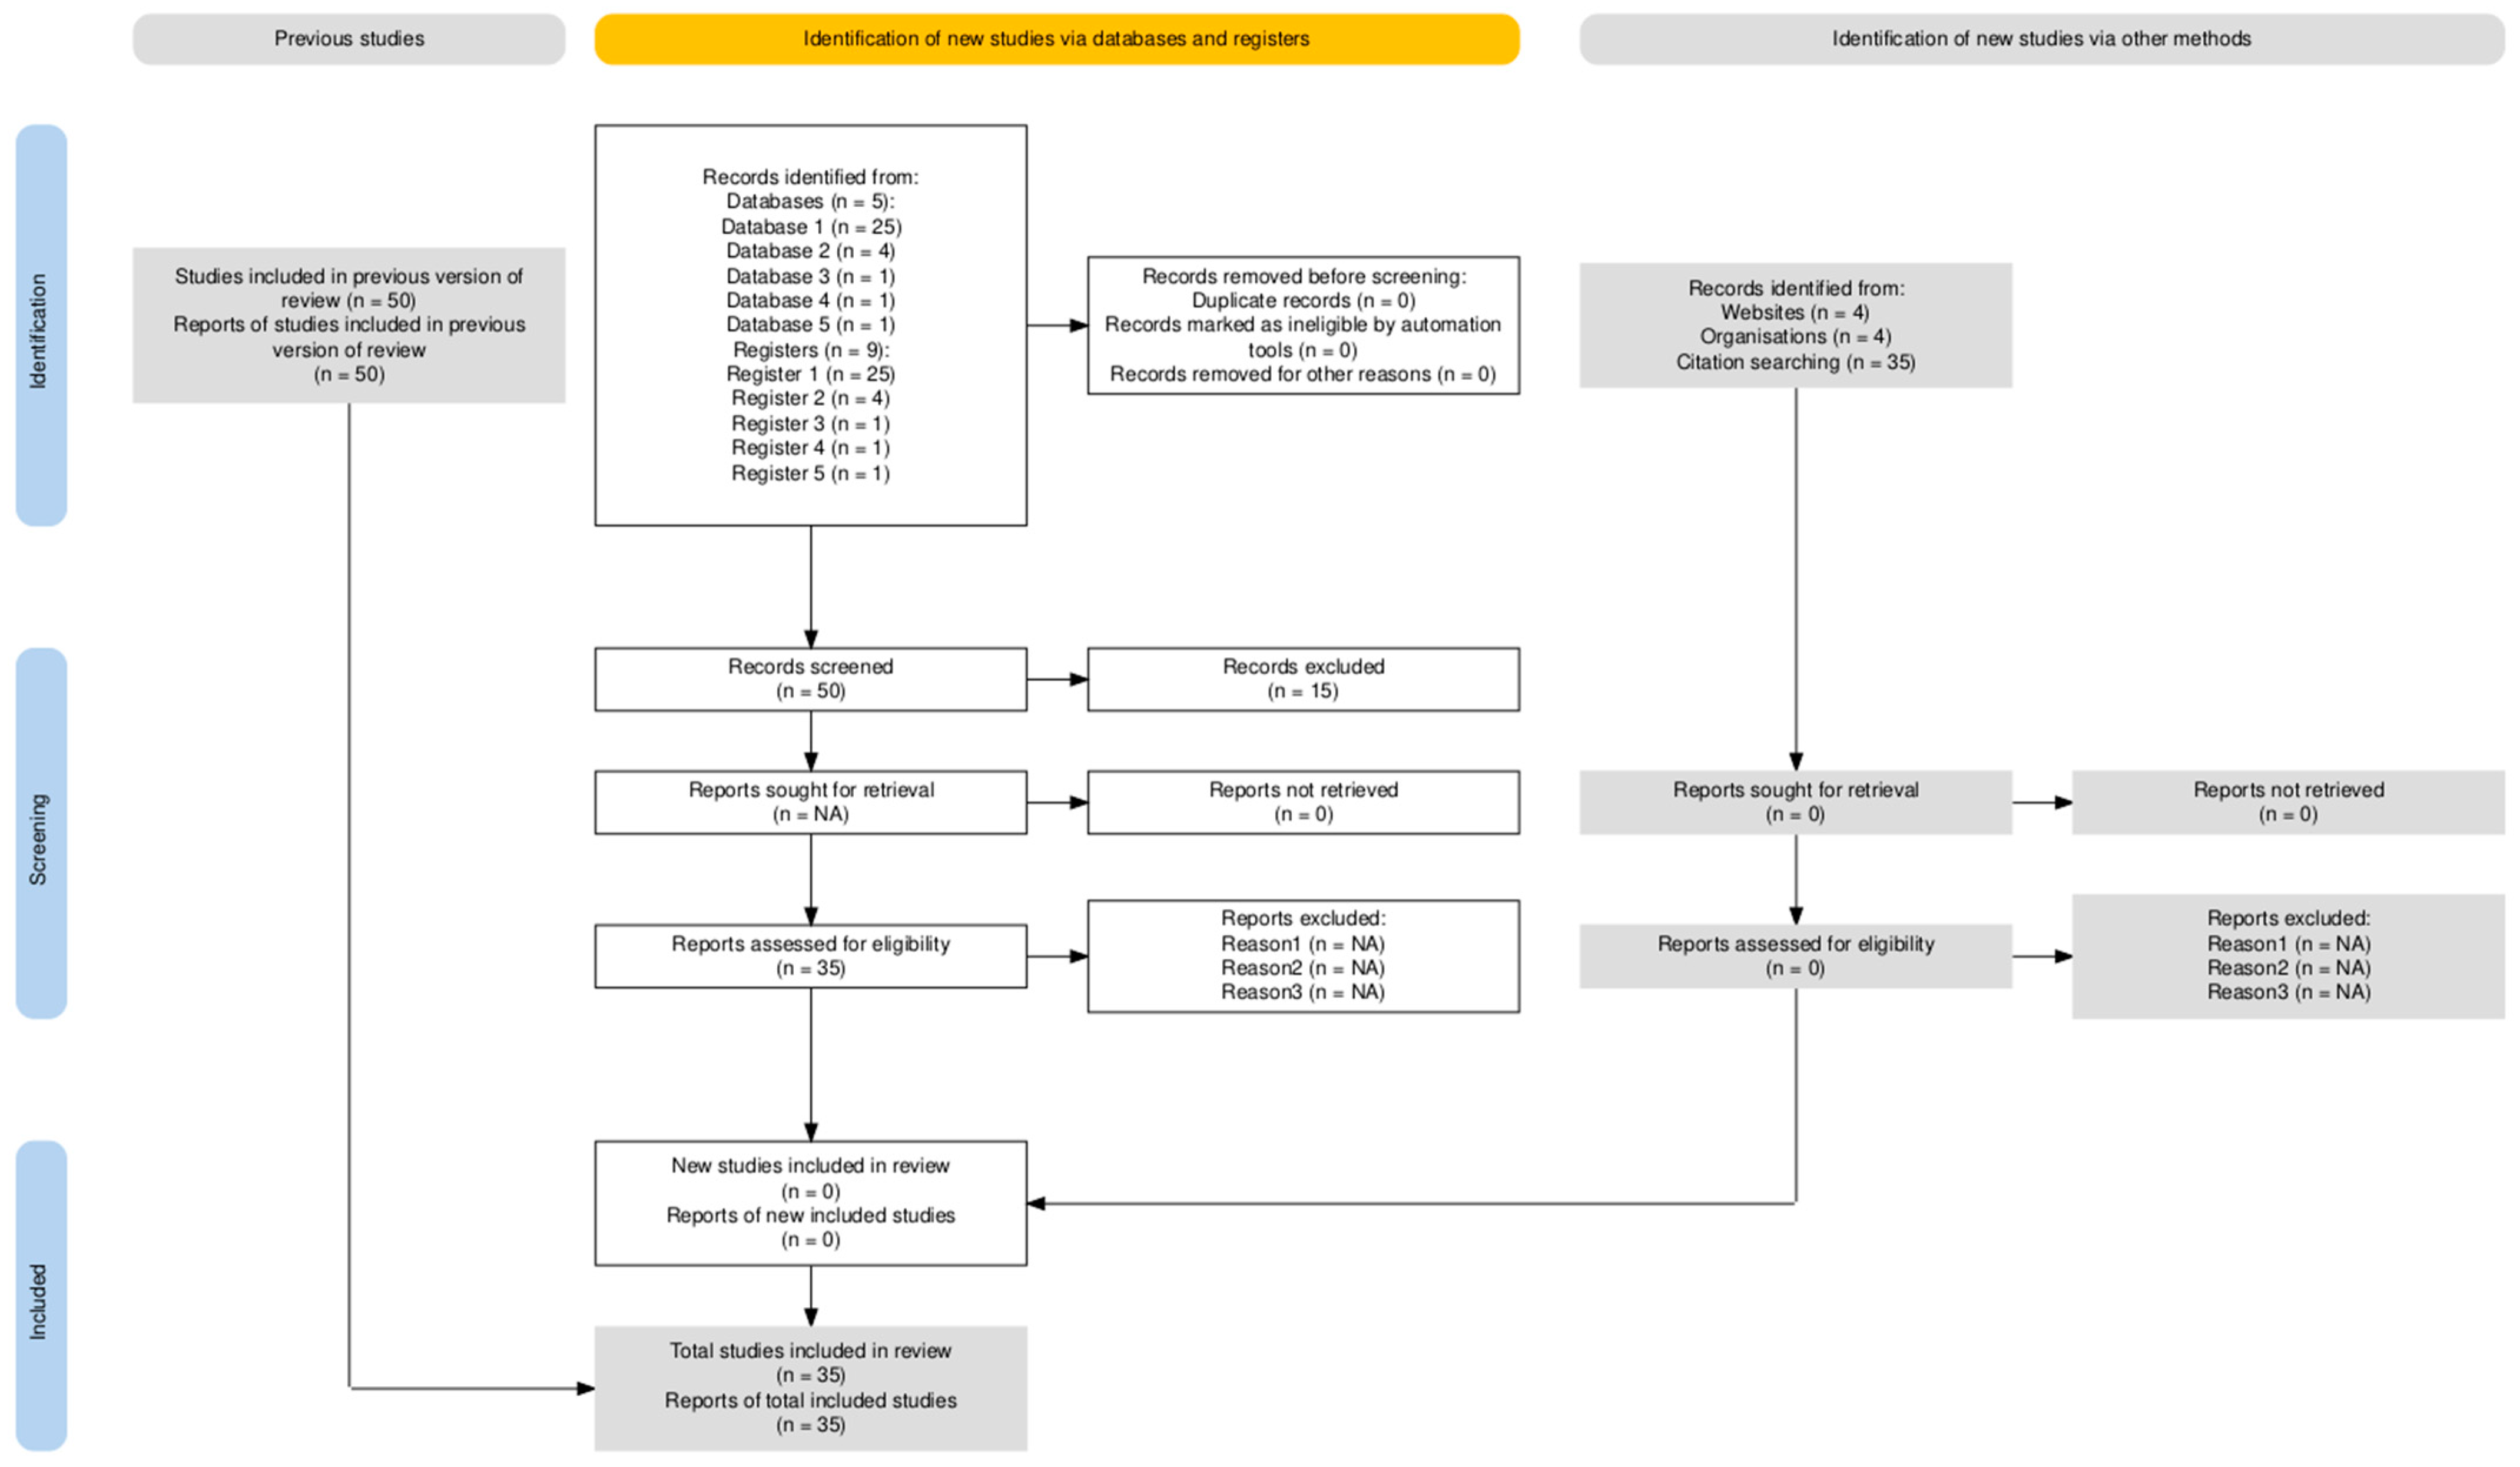
The critical review is partially aligned with the PRISMA framework to enhance methodological rigor and ensure consistency. The flow chart presented in
Figure 2 details the selection process. The selection criteria primarily relied on Elsevier, the primary database available at Heriot-Watt University, leading to the analysis of 34 review papers. However, some papers were sourced from Taylor & Francis, >Chemical Engineering Transactions (CET), the Centre for Independent Studies, and various online research engines to complement and enrich the collected data. These registers are automatically aligned with databases including Scopus and Google Scholar.
The study selection process involved study-specific keyword searches and filters to identify relevant literature covering carbon accounting, its historical context, and key contributors to construction-related emissions, particularly energy sources and materials, to identify the most recent and relevant literature addressing advancements in the field. A global perspective was adopted for the literature review, while the case study focused on the United Arab Emirates. Studies were selected based on relevance, recency, and alignment with the research objectives. The review was conducted by the authors, with one researcher handling the search and another conducting the review, ensuring independent evaluation. No automation tools were used for study selection. To mitigate bias, only credible sources were considered, with full citations and links provided for verification. Duplication was avoided through an extensive review process. This study does not include detailed comparisons of international Life Cycle Assessment (LCA) frameworks and standards. Instead, it focuses on energy-related carbon emissions during the construction phase, utilizing meta-analysis to synthesize its findings.
2. Review of Previous Studies
2.1. Life Cycle Assessments
Several previous works were reviewed to understand the current stance on carbon accounting, and the common gap observed was the uncertainties in data quality and completeness in addition to the significant discrepancy discovered between the outcomes generated by employing the two standard LCA techniques, the process-oriented LCA and the input–output model, hence leading us to question whether LCAs can inform and support decision and policy making, as input–output (IO) LCA takes a top-down view and Process LCA takes a bottom-up approach [
6].
Life Cycle Assessment (LCA) is a scientific approach to analyzing the environmental impacts of a product or service throughout its entire lifespan. This comprehensive evaluation considers the consumption of energy and raw materials, along with all related processes, emissions, and waste, across each stage of a building or project’s life cycle. The method quantifies environmental impacts across multiple categories, such as climate change, resource depletion, and ecological toxicity.
The IO LCA (top-down approach) uses aggregated data from large-scale sources like national statistics or industry reports, distributing them across specific processes within system boundaries based on factors such as production volume or energy use. However, it faces challenges like data gaps, a lack of transparency, and allocation difficulties in multi-process facilities. In contrast, a Process LCA (bottom-up approach) involves collecting detailed, process-specific data, providing a comprehensive and accurate inventory focused on specific technologies. While this method ensures precision and clarity, it requires extensive systems engineering knowledge and often relies on assumptions to model processes effectively [
7].
Earlier studies have shown that hybrid LCA, an approach that merges process-oriented and input–output Life Cycle Assessments, can minimize the limitations and overcome the challenge of providing accurate data revolving around embodied energy (EE) and carbon (EC) associated with processes and materials [
8]. The different LCA methods and their advantages, limitations, and applications are presented in
Table 1.
Embodied energy represents the cumulative energy consumed during a product’s creation, including activities such as raw material extraction, transportation, and manufacturing. Similarly, embodied carbon accounts for the total greenhouse gas emissions generated during these stages of production, reflecting the carbon footprint associated with energy use in the extraction, transport, and manufacturing processes. To calculate embodied carbon, the energy consumed at each stage is categorized by source, with the greenhouse gas emissions linked to each energy source being calculated. These emissions are then converted into their CO
2 equivalent, offering precise quantification of the carbon footprint associated with the production process [
9].
Table 1.
Primary LCA methods [
10].
Table 1.
Primary LCA methods [
10].
| Method | Advantages | Limitations | Applications |
|---|
| I-O Method | Has a complete system boundary | A black box with little information on model assumptions | A screening or scoping tool for high-level decisions |
| Process Method | More specific data derived from the industrial processes within the life cycle of a product, and the logistics flows connecting them enable more detailed and comprehensive analyses | May result in incomplete outcomes because of the complexity of the data requirements for upstream goods and services. Narrowed boundaries may lead to underestimation of the life cycle impacts, and there is a circularity effect when precursor products are used in a final product | Analysis of a specific product or process |
| Hybrid Method | Combines the advantages of the above two methods and minimizing their limitations | Less established and needs to be explored and further developed. | Analysis of a specific product or process |
Common tools employed for LCA measurement include One Click LCA, GaBi, Athena, Tally, the Embodied Carbon Calculator for Construction (EC3), and SimaPro, all of which utilize Process LCA methodologies. Other tools, such as BEES, Building for Environmental and Economic Sustainability, adopt the input–output (I-O) LCA methodology. Process LCA is more widely adopted due to its ability to establish clear system boundaries, which help effectively limit the scope of a project and reduce the workload and duration of data gathering. While this makes it suitable for managing LCA projects, it may lead to an underestimation of the full life cycle impacts. However, when addressing circularity effects, implementing the Process LCA method can be challenging. For example, in cases where multiple precursor products are involved in the manufacturing of a final product, the LCA must account for the life cycle impacts of all contributing materials and processes before completing the assessment for other materials or processes.
2.2. ISO Standards and Their Relation to LCA Framework
Between 1997 and 2000, the International Organization for Standardization (ISO) introduced a series of structured frameworks for conducting Life Cycle Assessment (LCA), resulting in the publication of ISO 14040, 14041, 14042, and 14043 [
11,
12]. In 2006, these standards underwent revision to enhance language precision and clarity, particularly in ISO 14040 and the newly consolidated ISO 14044. Each standard originally addressed distinct phases of the LCA process: ISO 14040 outlined goal and scope definition; ISO 14041 focused on life cycle inventory (LCI) analysis; ISO 14042 dealt with life cycle impact assessment (LCIA); and ISO 14043 covered the interpretation phase. The 2006 revision merged ISOs 14041, 14042, and 14043 into ISO 14044, which now comprehensively outlines the methodological requirements and principles for conducting LCAs. This consolidation streamlined the framework without modifying the fundamental requirements of the original standards [
11,
12].
The establishment of these standards was prompted by the increasing acknowledgment of Life Cycle Assessment (LCA) as an essential methodological approach for systematically identifying environmental aspects within the Environmental Management Systems (EMS) framework defined by ISO 14001. This framework provides a comprehensive platform to guide organizations in adopting a holistic approach to achieving institutional environmental compliance and continuous improvement [
13].
The steps of an LCA study are illustrated in
Figure 3 below, which is based on ISO 14040, 2006. The LCA guidelines based on ISO 14040 have been established to standardize approaches, and ensure results from various LCA studies can be reliably compared. According to the ISO standards, Life Cycle Assessment (LCA) is structured into four main phases: goal and scope definition, inventory analysis, impact assessment, and interpretation of results. The goal and scope phase outlines the study’s purpose, intended application, and target audience. It also defines key parameters such as functional units, emission factors, system boundaries, impact assessment methodologies, data sources, and any limitations. The life cycle inventory (LCI) forms the foundation of the LCA methodology, as it entails the actual data collection, validation, and calculation which aims to examine the product or process using impact categories and indicators. Characterization models are instrumental in translating inventory data into quantifiable impact indicators. For the assessment of global warming potential (GWP), a commonly adopted model is that of the Intergovernmental Panel on Climate Change (IPCC), which standardizes the reporting of greenhouse gas (GHG) emissions by converting them into carbon dioxide equivalents (CO
2eq), thereby enabling consistent comparison across different emission sources [
14].
Figure 3 illustrates ISO 14040 in relation to other ISO platforms, as the structure of ISO 14040 follows the same pattern as that established in 14001, and the description of the LCA process is built using the criteria provided by the international standards [
2]. The ISO 14040 series was developed as a complementary tool to support the broader Environmental Management System (EMS) framework, ISO 14001. One of its key objectives is to provide insights that align with ISO 14001’s emphasis on continuous improvement to ensure ongoing compliance with environmental standards. The findings from the LCA process can be utilized to refine and enhance product designs, contributing to a continuous improvement cycle. This iterative process not only enhances environmental performance but also supports eventual product or service certification under ISO 14040 [
12].
The assessments according to ISO 14040 standard and its sub-sections examine energy and material flows for procuring materials, processing, manufacturing, distribution, use, maintenance and repair, recycling, and waste management.
LCA’s application in buildings can be challenging due to difficulties in collecting data on the life cycle inventory, the complexity of the process, and the time and resources required to conduct the work [
15]. During the inventory analysis stage, practitioners frequently utilize standardized datasets to represent industrial operations. However, these datasets may not fully reflect regional differences or inherent natural fluctuations, which can introduce uncertainty. As a result, this variability can accumulate, potentially leading to systematic deviations and inconsistencies across assessments conducted by different LCA practitioners [
12].
2.3. Development of Environmental Product Declarations for Construction Materials
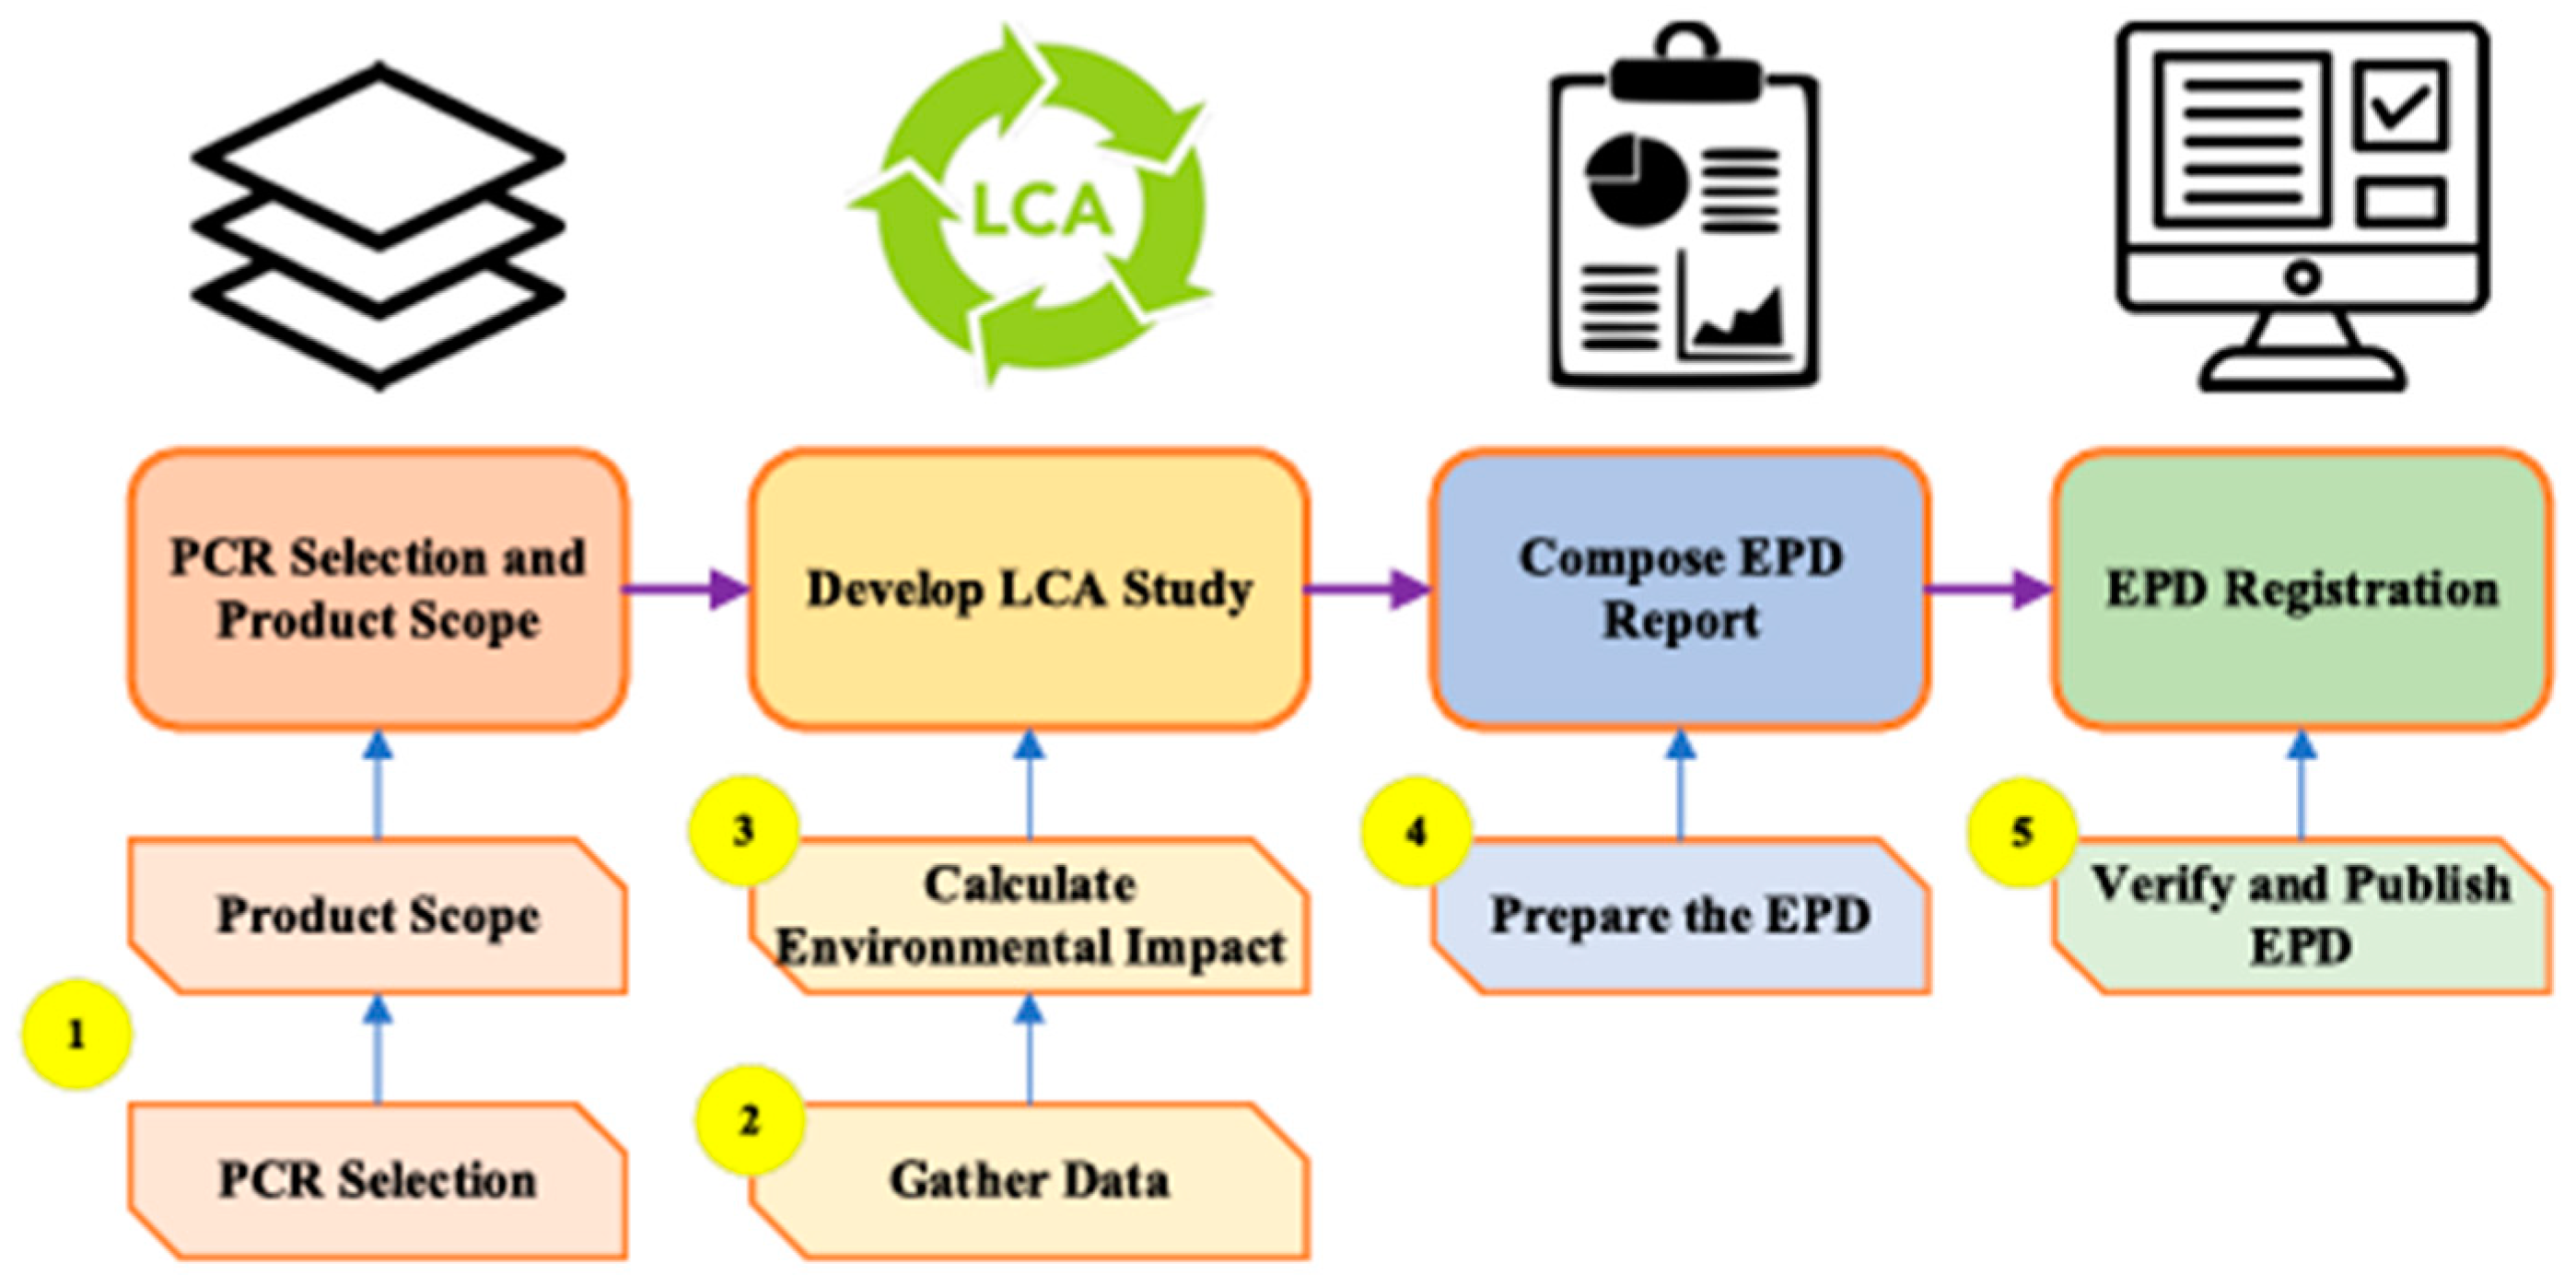
Environmental product declarations (EPDs) serve as foundational tools for quantifying and evaluating the environmental impacts of construction materials within the context of Whole Building Life Cycle Assessment (WBLCA). As the construction industry increasingly adopts principles of sustainable development, EPDs have become essential instruments in supporting transparent and standardized environmental reporting. They declare, in detail, the environmental impact of a product to provide support in reporting its sustainability performance, and they support product comparison to enable us to make sustainable decisions. Developing an EPD for construction products is complex and involves examining and collecting information associated with the material’s performance in terms of greenhouse gas emissions, measured in kg CO2eq, from energy consumption, water consumption, waste production, and other relevant activities throughout the product’s life span.
At the final stage of EPD development, the declaration is typically validated in accordance with internationally recognized standards, such as ISO 14040:2006. EPDs are therefore considered a formal and verified publicly accessible result of a product’s LCA [
16].
Figure 4 illustrates the development process of an EPD.
2.4. Embodied Emission Intensity Associated with Construction Materials
A study investigated the range of variability in the embodied energy and embodied carbon intensities of construction materials and highlighted how these metrics are shaped by multiple influencing elements such as advancements in production technology, energy pricing dynamics, conversion factors for primary energy, levels of material disaggregation, emission coefficients, and fluctuations in material market values. The core objective was to explore how these factors affect hybrid Life Cycle Assessment (LCA) models, especially regarding the production phase of materials. Comparisons were drawn with earlier studies utilizing input–output (I-O) data from countries like Australia, New Zealand, and Malaysia. Despite the growing use of hybrid models, the methodological nuances of integrating process-based LCA with I-O approaches have not yet been explored in depth from a qualitative standpoint. These findings point out that more than 90% of energy consumption and carbon emissions arise from upstream processes linked to material production in the supply chain [
17].
Given the time-intensive and labor-demanding nature of upstream inventory analysis, conventional LCA methods frequently rely on secondary data sources from established commercial databases such as Ecoinvent, GaBi, SimaPro, and Athena. In contrast to the bottom-up process of the LCA approach, input–output (I-O) LCA adopts a top-down perspective, encompassing a broader system boundary that includes the full extent of the economic supply chain. However, I-O-based assessments are subject to several limitations, including data uncertainty, aggregation, generalized assumptions, outdated datasets, and the exclusion of capital equipment specifics. The discrepancies in energy use and carbon emissions observed across the life cycle of construction materials are often attributed to uncertainties—stemming from both stochastic variability and incomplete knowledge regarding exact parameter values.
Generally, Hybrid Life Cycle Assessment (LCA) is subject to five primary categories of uncertainty: limitations in inventory data, system boundary truncation errors, the aggregation of sectors or products, and temporal and geographical uncertainties. This study aimed to identify the key factors contributing to variations in embodied energy and carbon by using a developed hybrid LCA model and comparing the results with previous studies. The study revealed that the most influential factors affecting embodied energy (EE) and embodied carbon (EC) intensities include advancements in technology, rising energy prices, and fluctuations in material costs. In contrast, variables such as primary energy factors, emissions coefficients, and the use of disaggregation constants were found to have only marginal effects. The primary energy factor (PEF), which accounts for losses during energy conversion, is used to translate delivered energy into its primary form. Energy tariffs refer to the average cost of energy provided by a specific energy sector. Notably, the coal industry exhibited the highest variability, with changes reaching 42.11% in Australia and 33.47% in Malaysia. These substantial disparities within the energy sector highlight their significance as a critical factor influencing the accuracy and sensitivity of hybrid LCA models. These variations are primarily attributed to technological advancements, often assessed through the production inducement effect—a metric that affects the extent of economic activity stimulated by production. Among the sectors analyzed, manufacturing and construction demonstrated the highest inducement values, ranging from 2.88 to 0.75, respectively. As a result, differences in production technologies and the types of energy utilized during manufacturing processes can lead to substantial discrepancies in both embodied energy and carbon emissions [
8].
Another study [
7] suggested that variations are relevant to industry confidentiality concerns, because processes that have unique proprietary value may obstruct the primary data collection and, in general, can be scarce for emerging technologies. The study also mentioned that life cycle inventory (LCI) modeling within process simulations can introduce significant levels of data uncertainty, which arises from the use of input data collected from diverse secondary sources, leading to potential variability in both model parameters and input data. However, the findings from the reviewed literature indicate that uncertainty reporting is not a widespread practice. Merely 36% of the reviewed studies explicitly addressed uncertainty in model parameters by incorporating sensitivity analyses or scenario-based evaluations. Researchers have therefore recommended incorporating uncertainty into future studies [
18]. This outcome emphasizes that conducting uncertainty and sensitivity analyses is essential, particularly for studies supporting comparative claims, as outlined by ISO standards, and was a key reason for performing sensitivity analyses in some of the reviewed studies. The study further addressed data gaps and uncertainties by employing process simulation-based life cycle inventory (LCI) analysis, a method that has gained traction in recent LCA research.
Figure 5 illustrates the methodological framework for process simulation-driven LCI modeling, designed to support the Life Cycle Assessment of industrial processes. In accordance with ISO standards, it is crucial that the goal definition phase clearly articulates the justification for incorporating process-based LCA—whether due to limitations in available data or to improve the accuracy and optimization of process evaluation [
7].
To address the inherent limitations of traditional LCA and minimize uncertainty, a study [
8] adopted a hybrid approach that first calculated the embodied energy (EE) and embodied carbon (EC) intensities of various materials and products at the production stage. Subsequently, the study estimated the EE and EC of the entire building—or its individual components—by utilizing the actual quantities of materials, energy consumption, and construction equipment through detailed process data. This hybrid model demonstrated greater flexibility and consistency, offering a more robust means of reducing variability. It also effectively mitigates the substantial discrepancies in EE and EC intensities that commonly arise from the dependence on aggregated economic sectors within input–output (I-O) databases.
Another study [
19] examined the divergence between input–output (I-O) Life Cycle Assessment and process-based LCA methodologies. It concluded that the bottom-up approach provides critical insights into consumer behavior, which has a direct effect on the lifespan of products, patterns of material use, and disposal routes. The UKGBC followed a bottom-up approach to estimate embodied emissions for all materials, construction processes, transportation, and other activities relevant to construction in the UK, which was 43MtCO
2e. In their process-based top-down approach, the result was 36.5 MtCO
2e, representing almost 15% lower emissions, which is probably due to the differences in the embodied carbon coefficients. Focusing the comparison on materials only, the emissions using the top-down approach were lower by approximately 9%.
Table 2 below shows the differences in materials’ embodied emissions between both approaches.
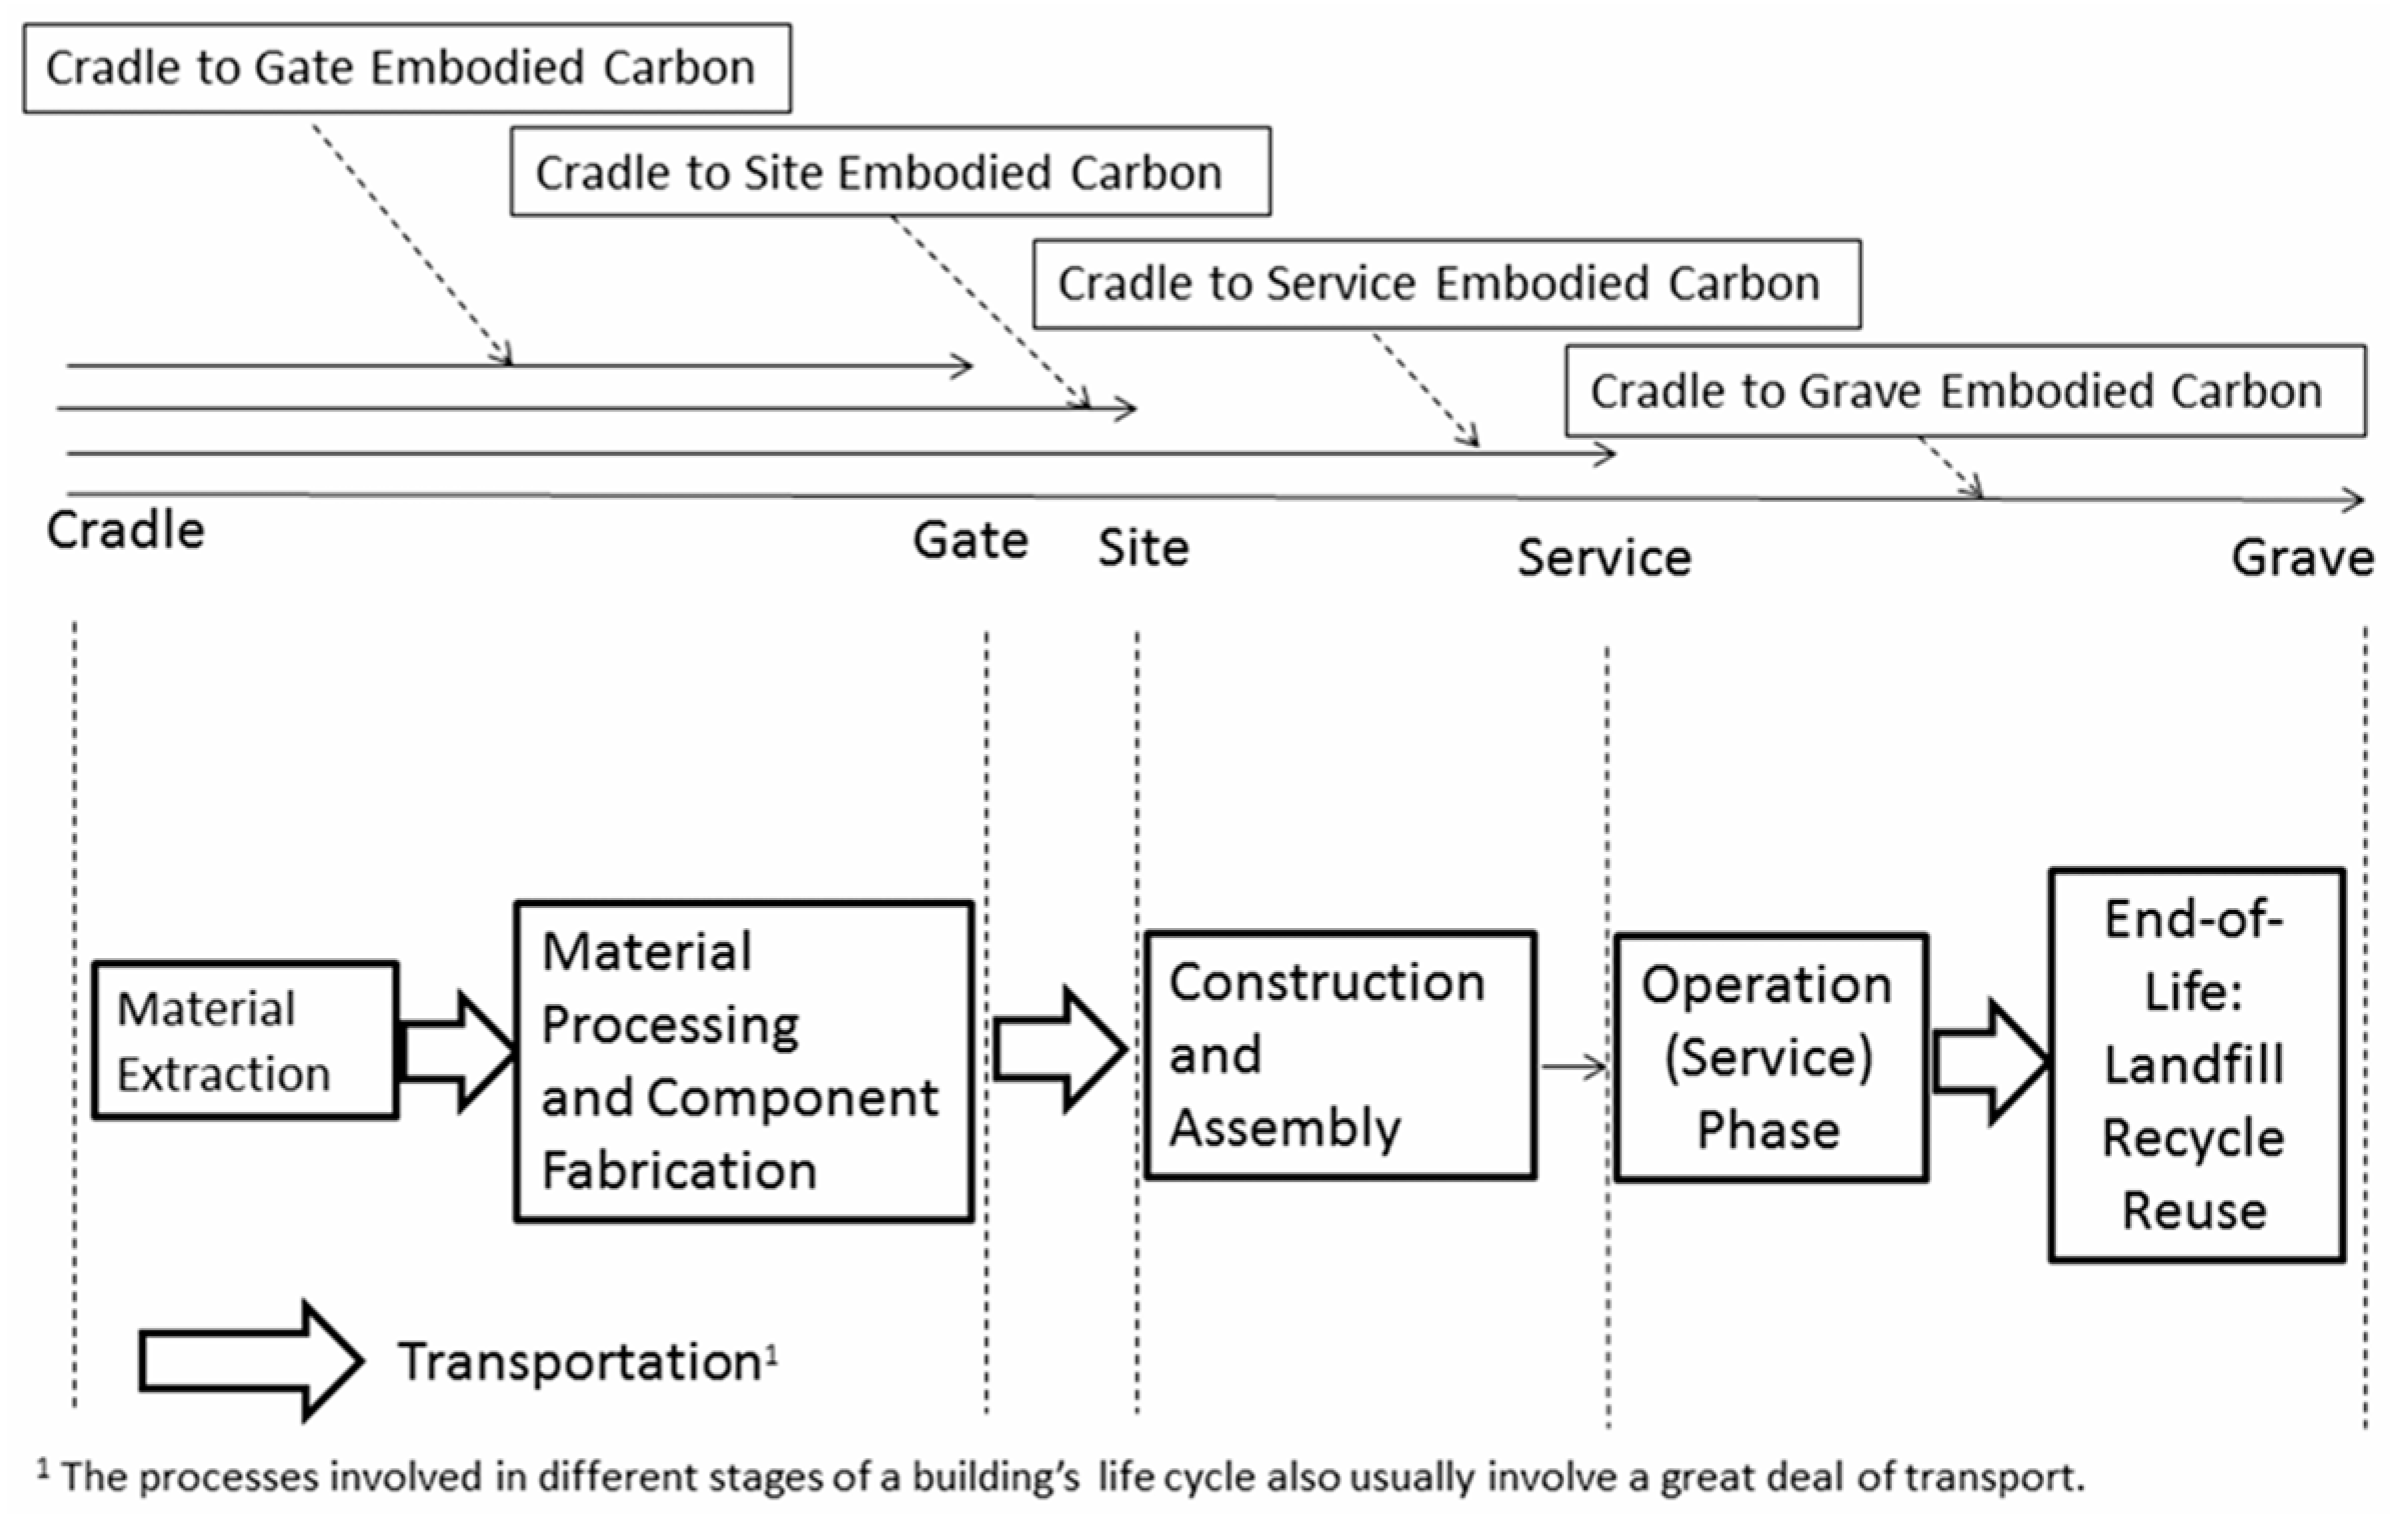
To clarify a building’s life cycle phases, the following graph, obtained from [
20], identifies four phases: cradle-to-gate embodied carbon, cradle-to-site embodied carbon, cradle-to-service embodied carbon, and cradle-to-grave embodied carbon, as shown in
Figure 6; this partially corresponds to the GHG protocol and BS EN 15978 and EN15643 whole life cycle definitions, which explain the phases of a building’s whole life cycle according to global standards and are typically used by LCA specialists and sustainability consultants in the construction industry.
The relative contribution of embodied carbon and operational carbon to the total life cycle emissions of buildings is influenced by numerous factors, including location, climate, energy sources, building orientation, and size. In some cases, embodied emissions constitute as little as 20% of life cycle emissions in conventional buildings, while in others, such as washhouses, they can account for up to 80% [
20].
With the implementation of stricter energy efficiency regulations, green building rating systems, and updated building codes, operational carbon emissions have significantly decreased. Consequently, the proportion of embodied carbon in the total life cycle emissions of buildings has risen. This shift has redirected research and industry focus toward schemes for minimizing embodied emissions in buildings to address the growing proportion of these emissions in sustainable construction practices.
With more focus nowadays on embodied carbon emissions, a study was carried out [
21] to assess the progress of carbon peaking within the building sector in the region of Central China and proposed a carbon emission prediction model framework that included three parts. Part 1 consisted of the selection of methods and models of the study/project location, selecting a suitable carbon accounting method and improving it, establishing methods for assessing impact factors and techniques for carbon emission forecasting, and finally, developing the carbon accounting model and improving the STRIPTAT (Structured Tool for Rapid Prototyping of Advanced Technologies). Part 2 involved creating a predictive framework to estimate when carbon emissions in the building sector may peak. It included identifying five groups of key drivers that influence emissions, forming the basis of a dataset specific to the Central China building sector. Using these data, seven dynamic forecasting models were developed to simulate future emission trends. Part 3 involved the interpretation of results and the proposal of policy recommendations to enable a detailed classification of the provinces and the results, an analysis of carbon reduction pathways, and making policy recommendations for different national and regional industries. Overall, the framework represents a structured framework that integrates modeling techniques and impact factor analysis that reinforces the need for data-driven decision-making and offers a roadmap for policymakers and industry stakeholders to implement targeted carbon reduction strategies, particularly in regions with high emissions [
21].
There is scope for future studies to further enhance such frameworks by incorporating real-time data wherever feasible and leveraging predictive models to address data gaps or challenges in measuring certain variables. Moreover, expanding the applicability of these frameworks to other regions would facilitate their adoption on a global scale, enabling more widespread implementation and comparison across diverse contexts. This broader applicability would contribute to the development of universally relevant methodologies for assessing and mitigating the environmental impact of construction processes worldwide.
2.5. Embodied Emission Intensity Associated with Energy Sources
Within the framework of Life Cycle Assessment (LCA), one study [
14] categorized energy use into two primary forms: thermal energy and electrical energy. Thermal energy, serving as the final output, is typically quantified in kilojoules (kJ) or megajoules (MJ), while electrical energy is considered an input required for electricity production and is measured in kilowatt-hours (kWh). The main primary energy carriers—such as coal, natural gas, and petroleum—are each characterized by distinct calorific values.
2.5.1. Energy Intensity of Fossil Fuels
Coal: Emissions are generated from the operation of mining equipment, which primarily relies on diesel fuel and electricity. Additionally, fugitive emissions—those unintentionally released during extraction—are also considered. The overall emission factor is determined based on the energy consumption needed to extract one ton of coal, referred to as the functional unit in Life Cycle Assessment (LCA).
Gas: Coal seam gas (CSG) has emerged as a significant energy source and a potential substitute for coal in electricity generation, primarily due to its comparatively lower greenhouse gas (GHG) emissions in the USA and Canada for many years. When cooled, it produces liquified natural gas (LNG). The majority of GHG emissions are reported to come from the end use of combustion in the process of generating power. However, recently, the media has revealed uncertainties regarding this statement, where upstream and downstream processing, in addition to seepage from gas fields, leakage from pipes, and maintenance and construction, as well as fugitive emissions, are all responsible for overall GHG emissions. Compared to conventional fossil fuels, LNG energy sources have been less extensively studied, resulting in notable data gaps and limited understanding across their full life cycle.
Petroleum and diesel: A typical industry value chain comprises several stages, beginning with exploration and extraction, progressing through processing and refinement, and culminating in the distribution and supply of energy for end uses such as heating, power generation, and transportation.
Results: Life cycle greenhouse gas (GHG) emissions are often assessed per 1 megawatt-hour (MWh) of electricity delivered to end users. Emission factors and datasets, typically expressed in kilograms of CO
2 per MWh, are commonly applied in LCA and GHG inventories for various products. Several variables influence the final energy output, including the fuel’s heating value, its calorific content—dependent on its purity, carbon composition, and physical–chemical characteristics—and its combustion efficiency and extent of heat recovery [
14].
2.5.2. Energy Intensity of Renewable Energy
While renewable energy systems do not emit carbon dioxide during energy generation, emissions still occur throughout their life cycle, particularly during infrastructure development and installation. These include emissions from the production of construction materials and the energy consumed by supporting equipment like pumps. Despite these factors, LCA findings suggest that renewable sources are responsible for under 10% of total global greenhouse gas emissions [
14].
2.5.3. Energy Intensity of Nuclear Energy
An LCA study examining nuclear power generation using the uranium fuel cycle estimated life cycle greenhouse gas emissions to be around 34 kg CO
2 per megawatt-hour for uranium ore with a grade of 0.15% U
3O
8—substantially lower than emissions from fossil-fuel-based electricity. However, this advantage is expected to diminish over time as declining ore grades may require more extensive mining, especially if nuclear power’s share in global electricity generation continues to rise [
14].
Economic Benefits of Renewable Energy Sources
In the future, the world will increasingly rely on renewable energy sources, including solar, wind, bioenergy, and groundwater. Currently, energy production is dominated by fossil fuels, nuclear power, and renewable resources. Renewable energy technologies can reduce air pollution and carbon dioxide emissions, making them environmentally friendly options for meeting household power demands. Implementing renewable energy systems can address issues like inadequate local power and water supply, improve quality of life, and boost the local economy in rural areas. Using sustainable power in distributed networks offers a dependable, low-cost, and eco-friendly solution for isolated communities. A description of the economic benefits of renewable energy sources is described in the sections below, summarizing the findings of [
15]. While the installation of renewable energy facilities can be costly, it is a crucial step toward protecting global resources and reducing carbon emissions. It is essential for both governmental bodies and private sector stakeholders to place a stronger emphasis on prioritizing and advancing renewable energy sources, including hydropower, biogas, geothermal, solar, and wind. Preserving natural resources and mitigating negative impacts are essential to ensure the sustainable development of future generations.
Solar Energy
Solar energy presents substantial economic advantages for sustainable development, especially in low-income regions, where photovoltaic (PV) systems are vital for meeting power needs efficiently. Interest in concentrated solar power is growing due to its environmental compatibility, widespread availability, and adaptability. As it neither exhausts natural resources nor emits harmful pollutants, solar energy stands out as an optimal renewable energy source. As fuel costs rise, solar energy becomes a more competitive option compared to traditional fossil fuels. Implementing solar technologies like solar water heaters can effectively harness the sun’s energy, especially in sunny desert regions, providing a sustainable and eco-friendly power source.
Wind Energy
Wind energy is a cost-effective and consistent alternative power source, with increasing turbine sizes contributing to its viability. Although it accounts for a small portion of global electricity, certain regions, such as Iowa, Germany, and Denmark, generate a significant share of their power from wind energy. Wind farms built on cultivated land have minimal ecological impact and can generate the energy needed for their production within three days of operation, lasting for 20–25 years [
15]. Despite some drawbacks, like noise and potential harm to birds, wind power has a positive environmental impact by reducing pollution and carbon dioxide emissions.
Hydropower
Hydropower produces electricity by utilizing the kinetic energy of flowing water and contributes approximately 16% to the world’s total electricity generation. As a renewable energy source, it is cost-effective and is projected to grow by 3.1% annually [
15]. However, hydroelectric facilities impact local climates and ecosystems due to the creation of reservoirs, which affect weather patterns and water cycles. These environmental changes can lead to issues such as increased evaporation, higher salt concentrations, and the disruption of land and sea migratory routes. Despite these challenges, hydropower provides economic benefits by supporting local economies and infrastructure development, although it may also affect social traditions and biodiversity if not properly managed.
Nuclear Energy
The nuclear energy sector is evolving rapidly to address the increasing demand for power, driven by fast-paced economic growth, safety considerations, and environmental challenges. Global collaboration in research and development, alongside competition in clean energy technologies, offers valuable opportunities to accelerate innovation and meet climate goals. As a safe, efficient, and low-carbon energy source, nuclear power has made considerable progress in leading countries, positively impacting efforts to mitigate climate change. However, to expedite decarbonization and energy innovation, increased public investment in nuclear energy R&D is essential. One study [
22] advocates that the nations of the Organisation for Economic Co-operation and Development (OECD) should enhance their funding for nuclear energy to foster the development of sustainable technologies and improve power distribution systems.
Nuclear power typically incurs higher costs than renewable alternatives such as wind and solar energy. As per the 2024 GenCost report, the levelized cost of electricity (LCOE) for nuclear power ranges from USD 155/MWh to USD 252/MWh. In contrast, firmed renewables, which include wind and solar combined with storage, have an LCOE between USD 100/MWh and USD 143/MWh. This indicates that nuclear power can cost up to 1.8 times more than renewable energy, highlighting the economic advantages of renewables for electricity generation [
23].
2.5.4. Material-Related Embodied Carbon Emissions
A study [
24] conducted to assess the embodied carbon of green building materials revealed that reinforced concrete accounts for 78% of the emissions, while insulation materials contribute only 2%. Alternative solutions examined that are more sustainable included using heavyweight cast concrete and autoclaved aerated concrete, which were able to reduce up to 23% and 50%, respectively, of total embodied carbon emissions.
A thorough investigation revealed that replacing conventional materials with those that have lower embodied carbon could result in a 30% reduction in a building’s total CO
2 emissions [
20]. Another study found that cement, hollow concrete blocks, and steel accounted for 94% of embodied energy and 98% of total CO
2 emissions. These studies prove critical in the design of sustainable buildings by using low-carbon embodied materials; this is why most green building rating systems, including LEED, BREEAM, and Green Star, include EC mitigation measures in their reduction strategies [
24].
Table 3 presents the quantified GHG emissions per kilogram of material in a study conducted on buildings in Shanghai [
25]. It represents the same indicator but per m
2 of the unit material based on the average EPDs obtained.
LCA is employed to evaluate the environmental impacts of construction materials, serving as a decision-making tool for identifying and selecting options with the lowest embodied carbon emissions. However, it is crucial to acknowledge that the selection process is not driven exclusively by environmental considerations; it is also significantly influenced by economic factors and resource availability. Various economic challenges and constraints emerge when opting for environmentally preferable low-carbon materials. For example, the cost of steel is influenced by regional factors such as fuel and electricity prices, scrap prices, and the higher production costs of recycled steel relative to primary steel. Additionally, modern techniques, such as the use of green hydrogen through the Direct Reduced Iron (DRI) process, tend to incur higher costs than traditional methods. In the case of aluminum, the cost of low-carbon variants remains high due to the considerable initial investment required for manufacturing infrastructure. Regarding cement, although supplementary cementitious materials (SCMs) are available and the use of lower-carbon cement can be economically feasible depending on the desired carbon emission reductions, the implementation of energy-saving measures and efficiency improvements in production often necessitates plant shutdowns and modifications to existing processes, resulting in both time and financial investments [
26].
2.5.5. Embodied Carbon Emissions from Construction Works
A study [
1] stated that the environmental impact of the construction stage of the built environment is rarely taken into consideration in the literature, and, hence, aimed to identify opportunities and obstacles that are encountered in the quest to achieve carbon neutrality in construction, the CO
2eq on-site emission system boundaries and key processes, and the CO
2eq contribution of each construction stage, and compared the outcomes with buildings’ other life cycle stages. It was found that in the case of the new construction of residential buildings, the embodied emissions were 41 kg CO
2eq/m
2 GFA, accounting for 6 to 12% of the total embodied emissions (5 to 9% for transportation and 1 to 3% for on-site activities).
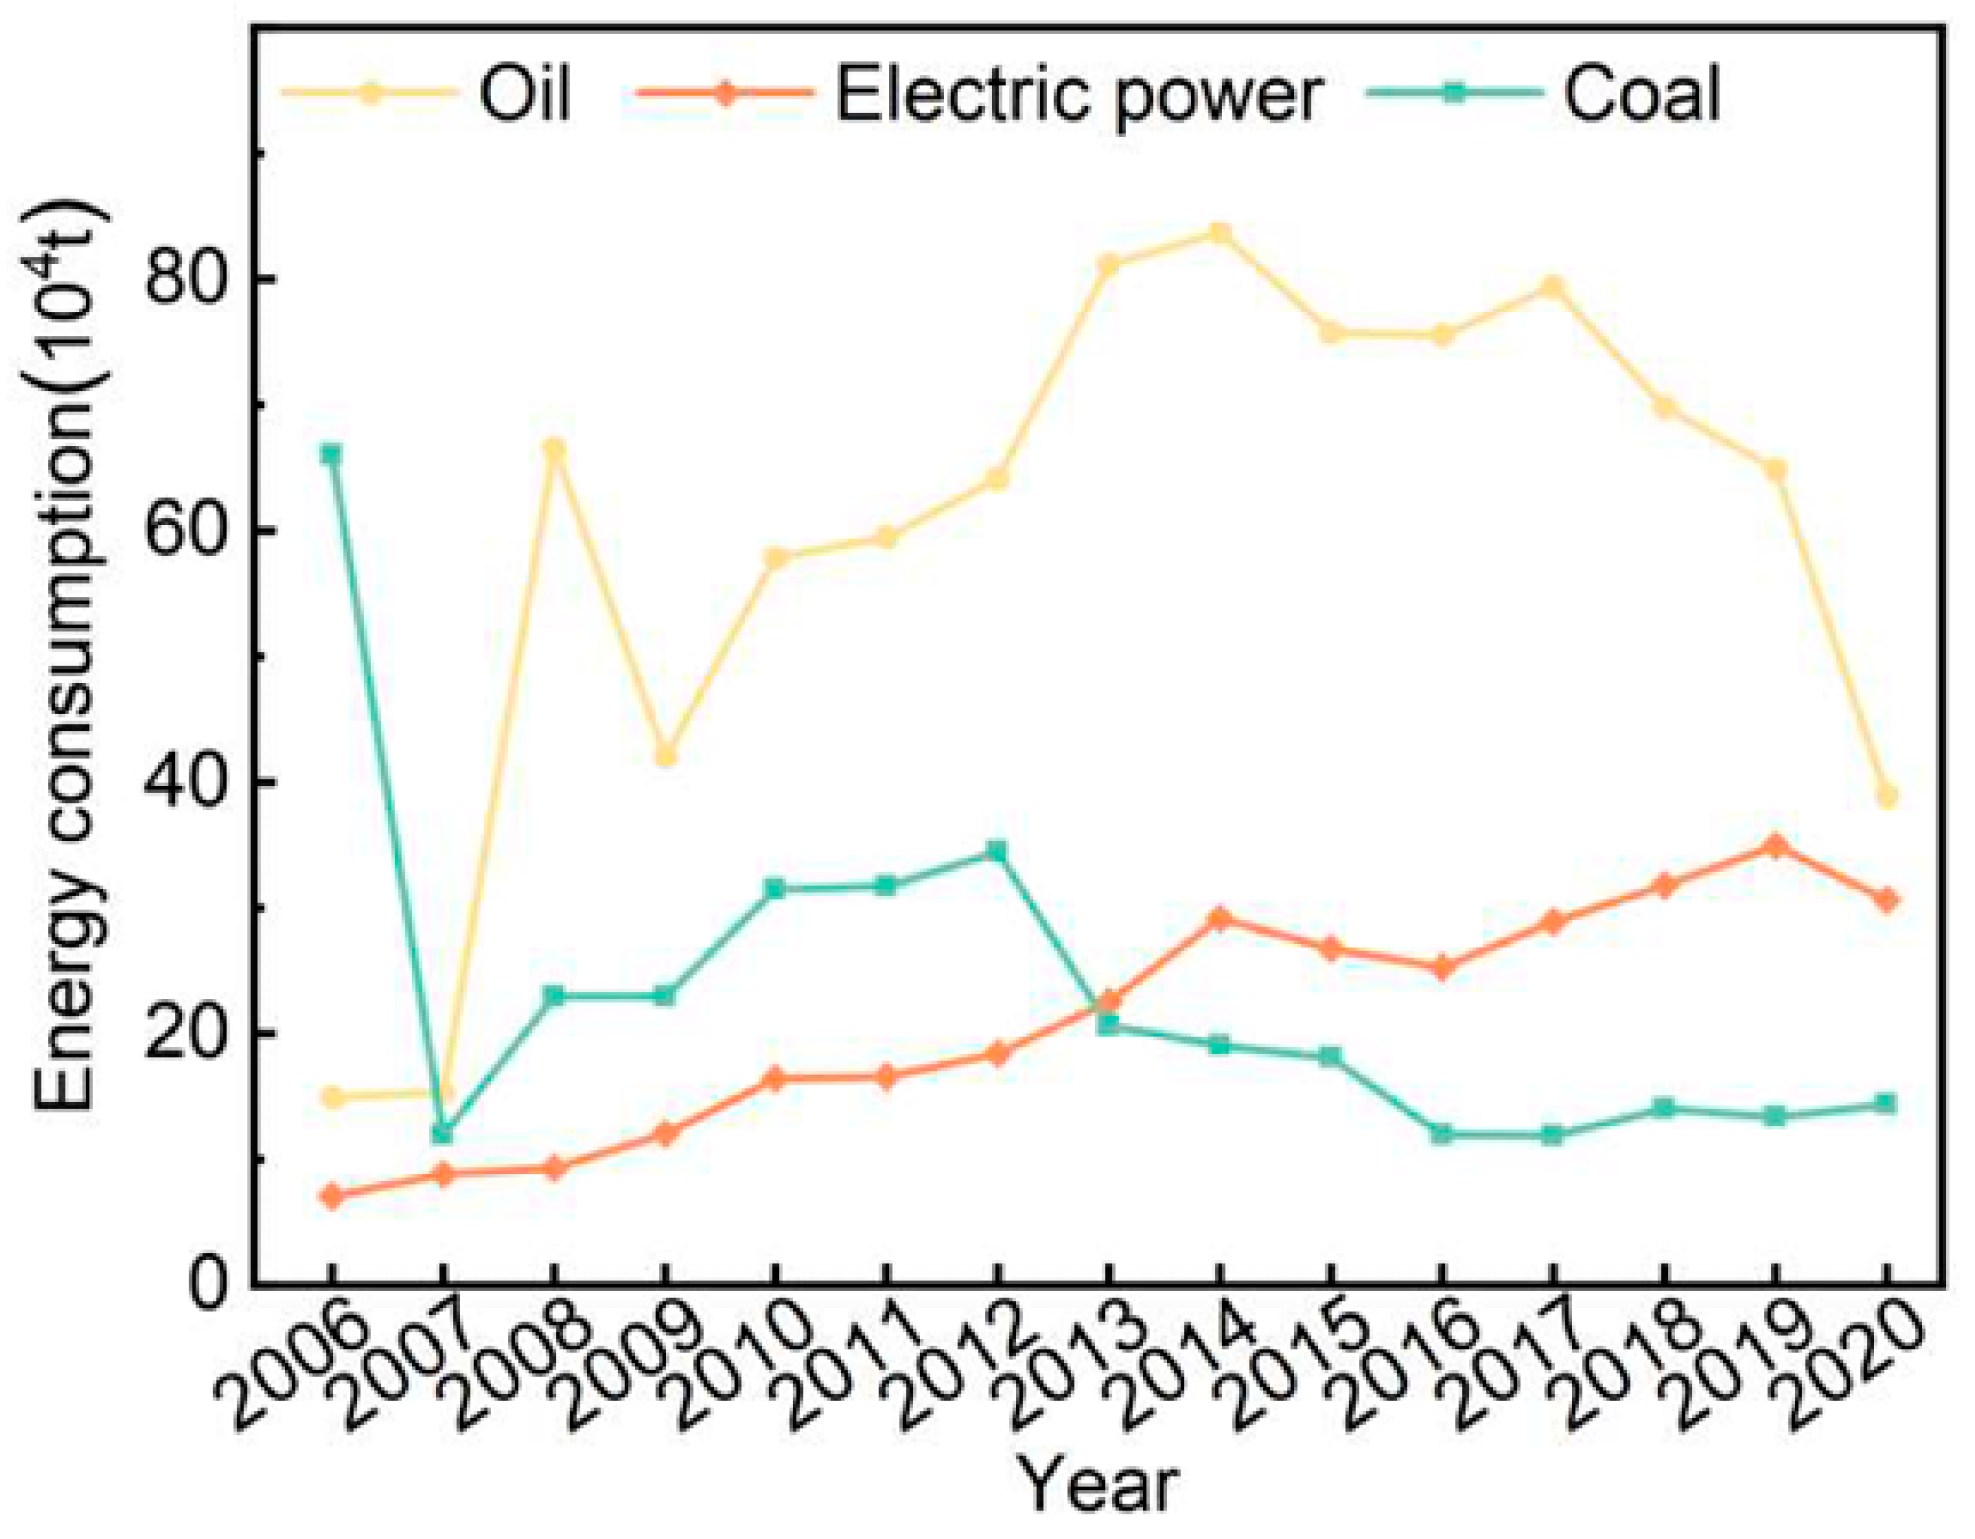
At a broader level, a case study [
27] was conducted on the multi-factor dynamic correlation and prediction of carbon peaking in the building sector. This research analyzed carbon emissions from construction industries across 40 countries, revealing that the sector emitted 5.7 billion tons of CO
2 in 2009, with China being the largest emitter. The case study focused on Shaanxi province, examining the trends in energy consumption during the construction and demolition phases. Prior to 2006, coal was the primary energy source used for heating and powering machinery in construction. However, with advancements in construction technology, oil began to replace coal, resulting in a decline in coal usage and an increase in oil consumption, which reached 83 × 104 t in 2014. Conversely, electricity consumption rose steadily from 7.1 × 10⁴ t in 2006 to 30.6 × 10⁴ t in 2020, eventually becoming the dominant energy source during the construction and demolition phases, as shown in
Figure 7. These patterns reflect advancements in technology and equipment, alongside a shift in the overall energy consumption structure.
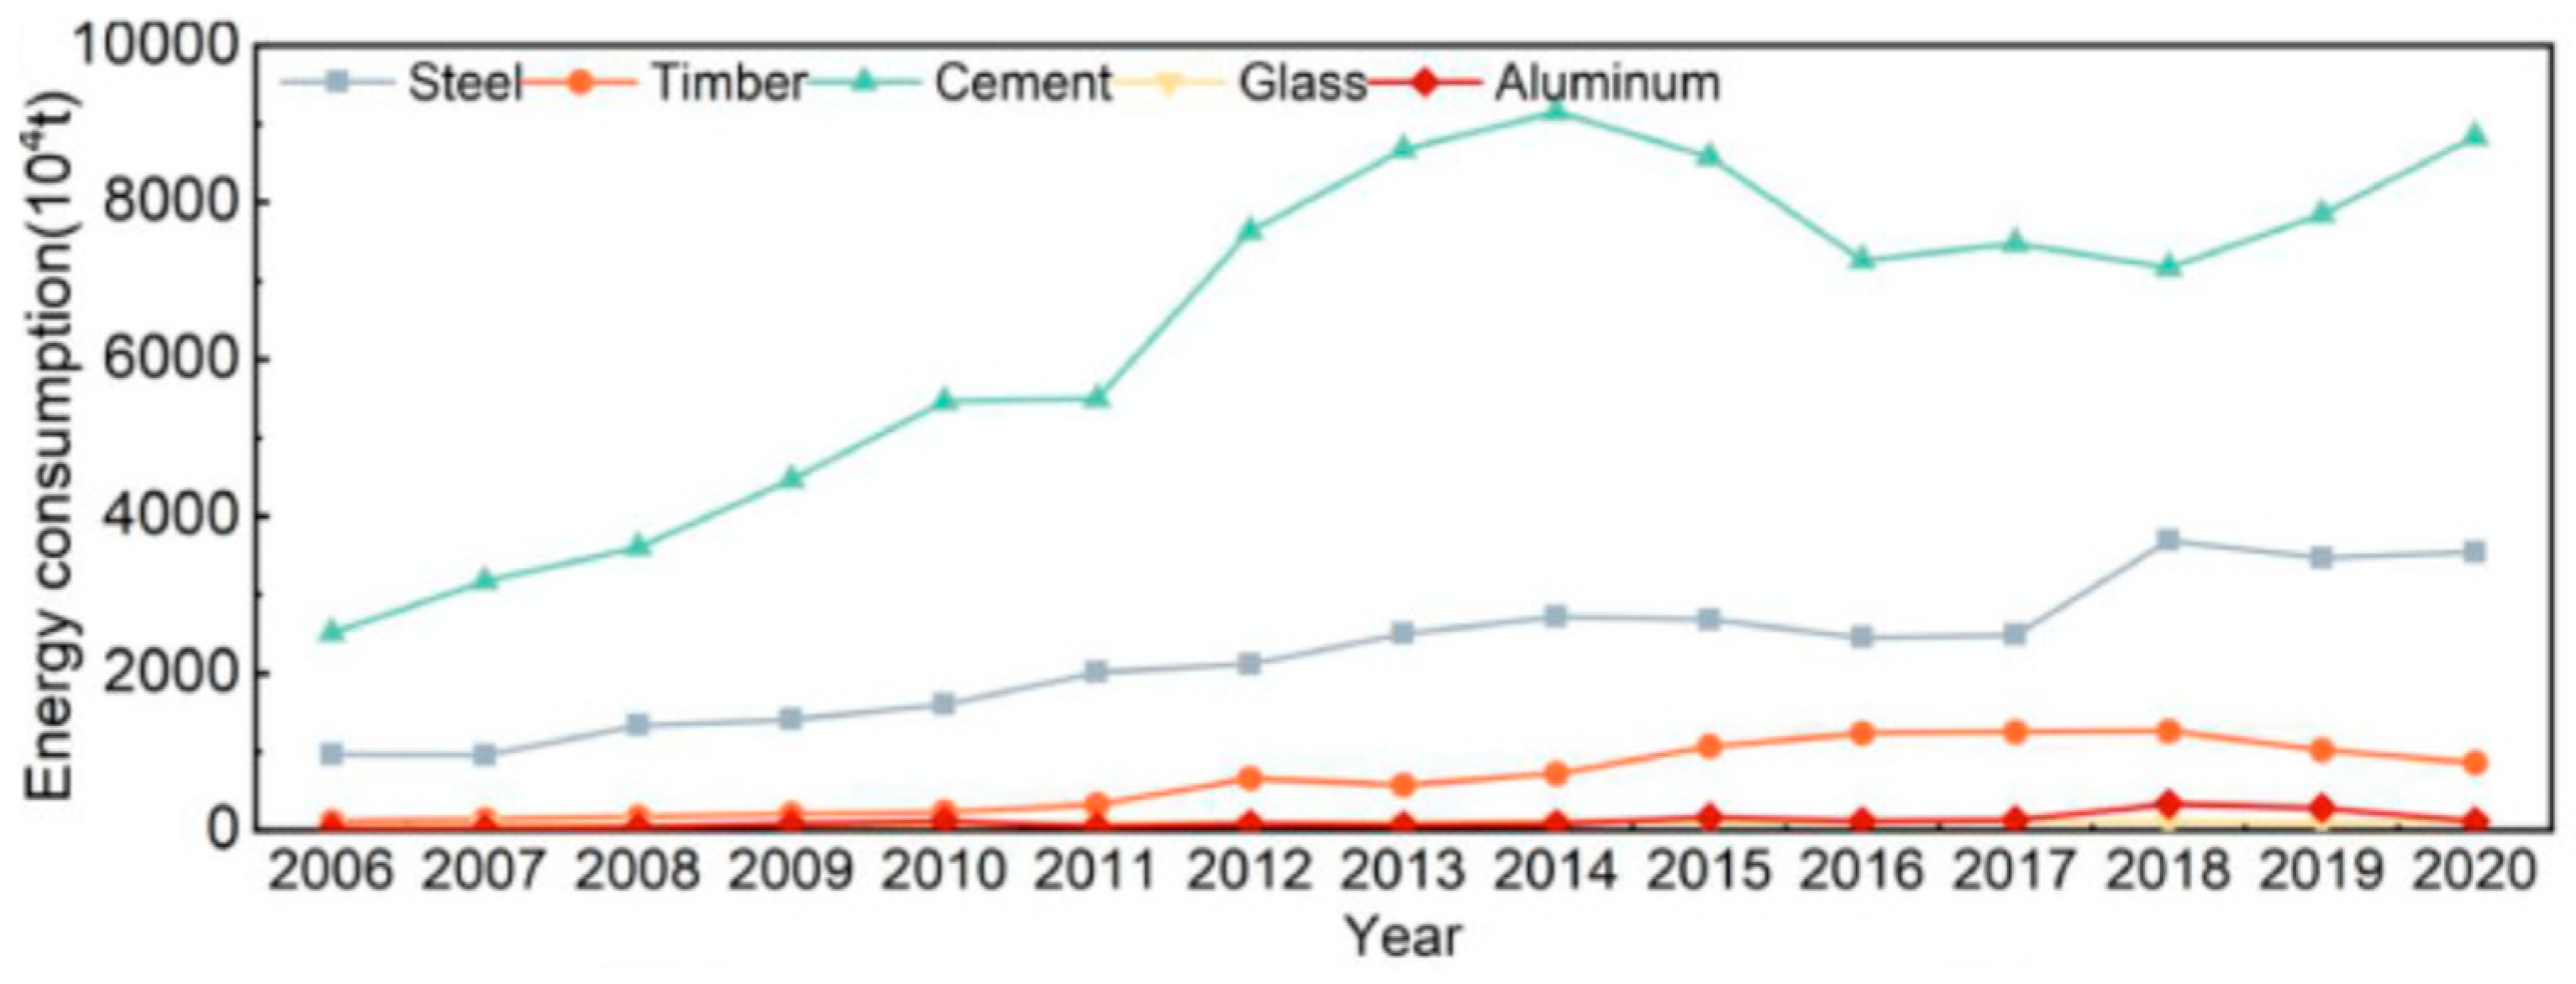
The study focused on material consumption, specifically examining five key materials: steel, cement, timber, aluminum, and glass. It highlights an increase in the usage of these materials, as depicted in
Figure 8. This figure illustrates the correlation between energy consumption in the manufacturing each of these materials within the same case study as addressed in the research.
In [
28], the embodied and operational carbon emission shares in buildings (both commercial and residential) were presented over the life cycle stages of 20 selected building cases in different countries. The average results indicate that the building use stage accounts for the largest share, representing 67%, followed by the production and construction stage at 31%. The end-of-life stage contributes the smallest portion, averaging only 2%.
However, the case study presented earlier [
24] demonstrated that construction stage represents 6% to 12% of the overall embodied carbon emissions, which aligns with the results of 3 of the 20 building cases reviewed. This demonstrates that the variations in LCA results are influenced by the geographic location of the case study, which is affected by design codes and the energy use intensities associated with different building uses.
3. Case Study: Actual Data Representing the Carbon Emission Intensity and Energy Intensity of Residential Construction Projects in the United Arab Emirates
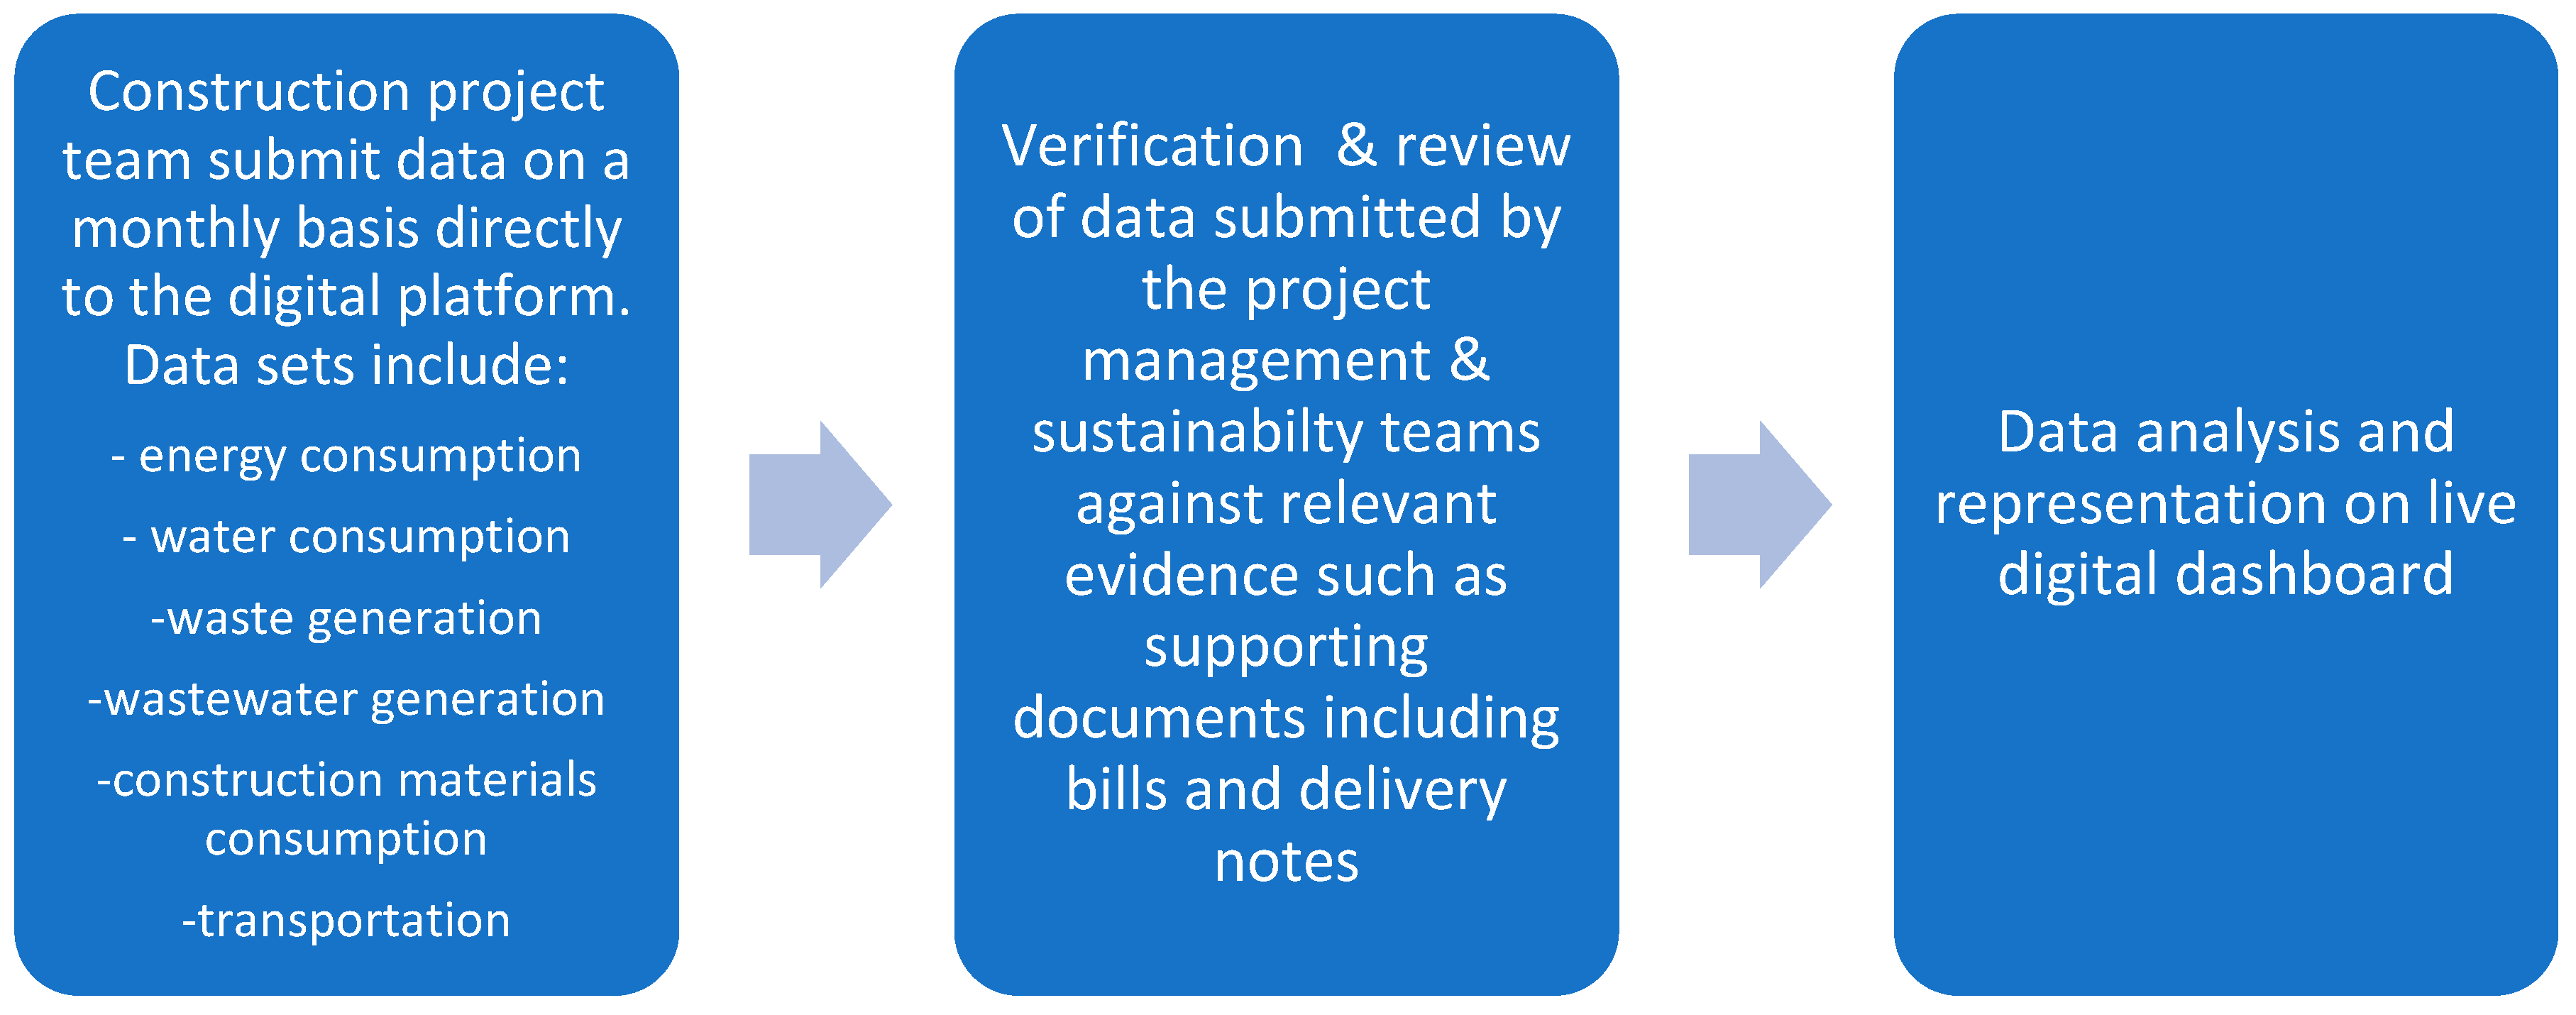
This case study examines four residential projects in the United Arab Emirates, where carbon emission data were collected throughout the entire construction process, from start to finish. The main objective of the case study is to unequivocally demonstrate the significant contribution of energy consumption during the construction stage to the overall carbon intensity of typical low-rise residential projects. Furthermore, it seeks to establish a crucial benchmark for energy intensity specifically in construction projects within the United Arab Emirates. This benchmark is based on four projects of similar scope and similar scale, all undertaken concurrently from the year 2021 to 2024. This benchmark will be instrumental in guiding future projects towards more sustainable practices. Another added value of this case study lies in its analysis of energy consumption patterns across key milestones of a construction project. By mapping these trends, the study explores the relationship between energy use and project phases, offering insights into when peak energy consumption typically occurs in a residential construction project. This understanding can help optimize energy efficiency strategies and better manage resource allocation throughout the project life cycle. The data collection was conducted by the project teams following the workflow presented in
Figure 9.
The data collection protocol was standardized across the projects to ensure comparability and methodological consistency. It followed a structured framework that delineated stakeholder roles and responsibilities, the data management system employed, and the training provided to project teams to facilitate accurate data entry and utilization. The protocol also established the carbon emission conversion factors applied, which were systematically used and documented within a method statement to ensure transparency. Furthermore, supporting documentation was mandated to validate the accuracy and reliability of the collected data. This rigorous approach was reinforced by the project developer’s policies, acknowledging the fundamental role of robust data collection in decarbonization efforts, as meaningful emission reduction targets cannot be effectively set or monitored without precise and verifiable data.
The digital platform was tailored to support efficient data validation and revision processes among various stakeholders, incorporating an embedded tool that facilitates the identification and resubmission of erroneous data. Upon completion of the dataset, a comprehensive review was conducted by a specialized team to identify and assess any outliers or atypical fluctuations in the values. Any detected anomalies were subjected to an investigation, where each value was either substantiated with a valid explanation or corrected, thereby ensuring the consistency and integrity of the dataset.
The case study focuses on four residential low-rise villa projects. Project 1 had a Gross Floor Area (GFA) of 212,638 m2 and started on October 2021 and ended in March 2024, Project 2 had a GFA of 1,767,786 m2 and started on October 2021 and ended in August 2023, Project 3 had a GFA of 446,297 m2 and started on December 2022 and will be ending in February 2025, and Project 4 had a GFA of 46,031 m2 and started on August 2022 and have ended on April 2024. The energy intensity in the case study fully focused on energy consumption to power site offices and construction operations and excluded transportation emissions.
The projects depended on diesel generators, highlighting the construction sector’s prevalent reliance on fossil fuels in the region. This dependency was further intensified by the slow adoption of electrification and integration of renewable sources in the construction operations. However, in recent years, there has been an increasing shift toward renewable energy solutions, with solar hybrid energy systems emerging as a viable and increasingly favored option for construction projects in the region. These systems primarily harness solar energy while using diesel as a backup, providing a more sustainable alternative to traditional generators. Their increasing adoption is driven by factors such as market availability, ease of installation, cost savings amid rising diesel prices and transportation costs, and a service-based fee and business model that eliminates the need for contractors to purchase the system outright. Over time, these hybrid systems are expected to transition from diesel backup to battery storage, further enhancing sustainability by minimizing emissions, depending on the decreasing cost of battery technology, which must reach parity with diesel to become a practical alternative. To accelerate the adoption of such sustainable solutions, it is essential to implement awareness programs for contractors and project stakeholders, promoting a shift from conventional construction methods to innovative approaches that deliver economic, environmental, and social benefits.
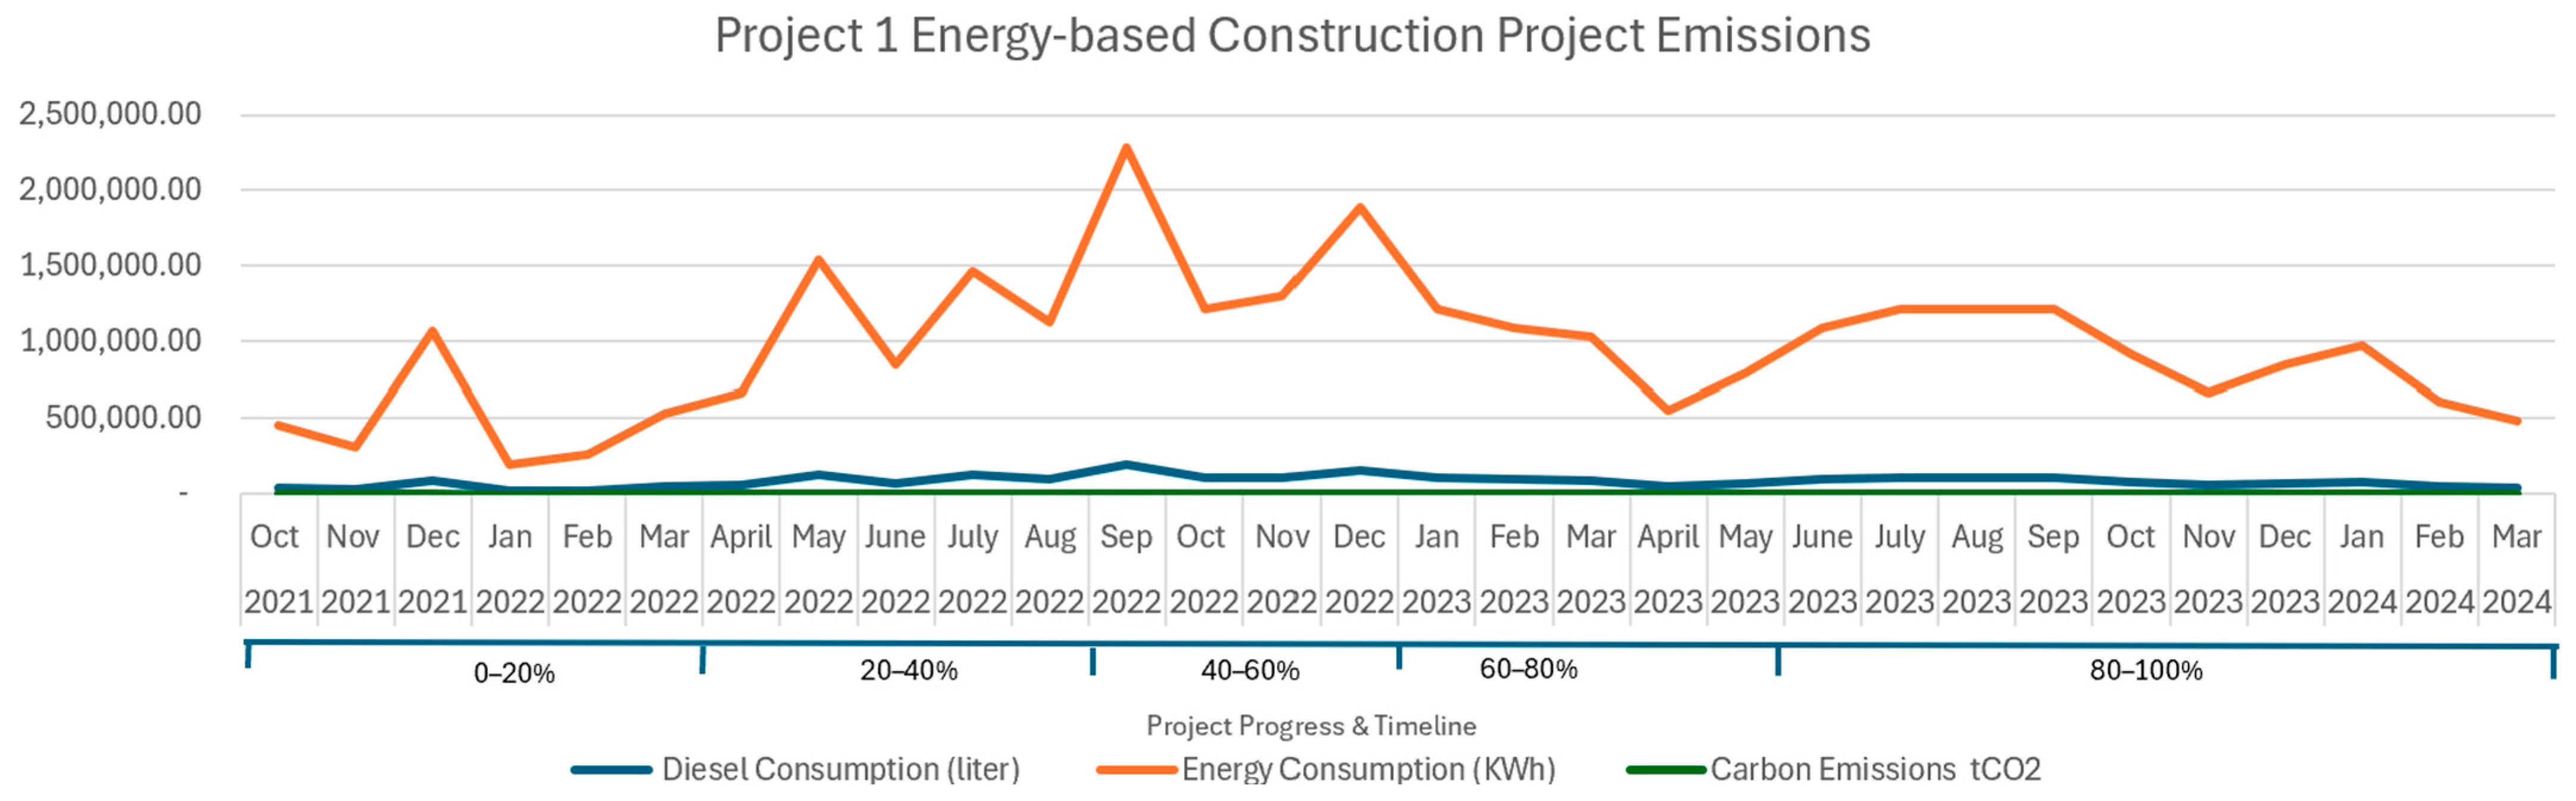
Figure 10,
Figure 11,
Figure 12 and
Figure 13 presents the energy-related carbon emissions for the four projects, where emissions are plotted throughout the entire construction project duration, offering a visualization of emission patterns, typically aligned with construction stages, and highlighting the periods of peak emissions and plots the energy consumption data for each project over the project duration; for this analysis, diesel fuel usage was converted into energy consumption, expressed in kilowatt-hours (kWh), using a standardized conversion factor of 11.9 kWh per liter of fuel oil. The associated carbon emissions were calculated using an emission factor of 0.0732 kg CO
2 per kWh. These calculations adhere to the methodologies outlined in the 2012 Guidelines of Defra/DECC’s Greenhouse Gas Conversion Factors for Company Reporting and the Digest of UK Energy Statistics 2011 (DUKES), ensuring consistency and alignment with established reporting standards. The values on the
y-axis represent whole numbers corresponding to the various legends for Diesel consumption in liters, energy consumption in kWh, and carbon emissions in tCO
2.
The analysis indicates that peak emissions occur at approximately 45% of the construction progress for Projects 1 and 2, at 25% for Project 3, and at 65% for Project 4, with an average of 45%. This suggests that emissions typically peak during the middle of construction projects’ duration, coinciding with the period of highest activity and operational intensity.
The energy intensity for Project 1 was calculated at 137 kWh/m2, Project 2 exhibited a significantly higher value of 634 kWh/m2, Project 3’s energy intensity was 135 kWh/m2, and the energy intensity of Project 4 was 276.18 kWh/m2. This substantial difference may be attributed to factors such as generator efficiency, consumption behaviors considering that each project was constructed by a different construction contractor, and the mass and type of buildings under construction. On average, the energy intensity for a typical residential villa project powered by conventional diesel generators is approximately 295.5 kWh/m2. Regarding carbon emission intensity, Project 1 utilized 10 kg CO2/m2, compared to 46.47 kg CO2/m2 for Project 2, 9.89 kg CO2/m2 for project 3, and 20.22 kg CO2/m2 for Project 4, resulting in an average carbon intensity of 21.7 kg CO2/m2. These figures provide a baseline for construction projects operating under conventional conditions in the region, emphasizing the potential benefits of adopting sustainable energy sources, such as renewable energy, in improving baseline performance and achieving considerable progress in reducing emissions.
4. Results Summary
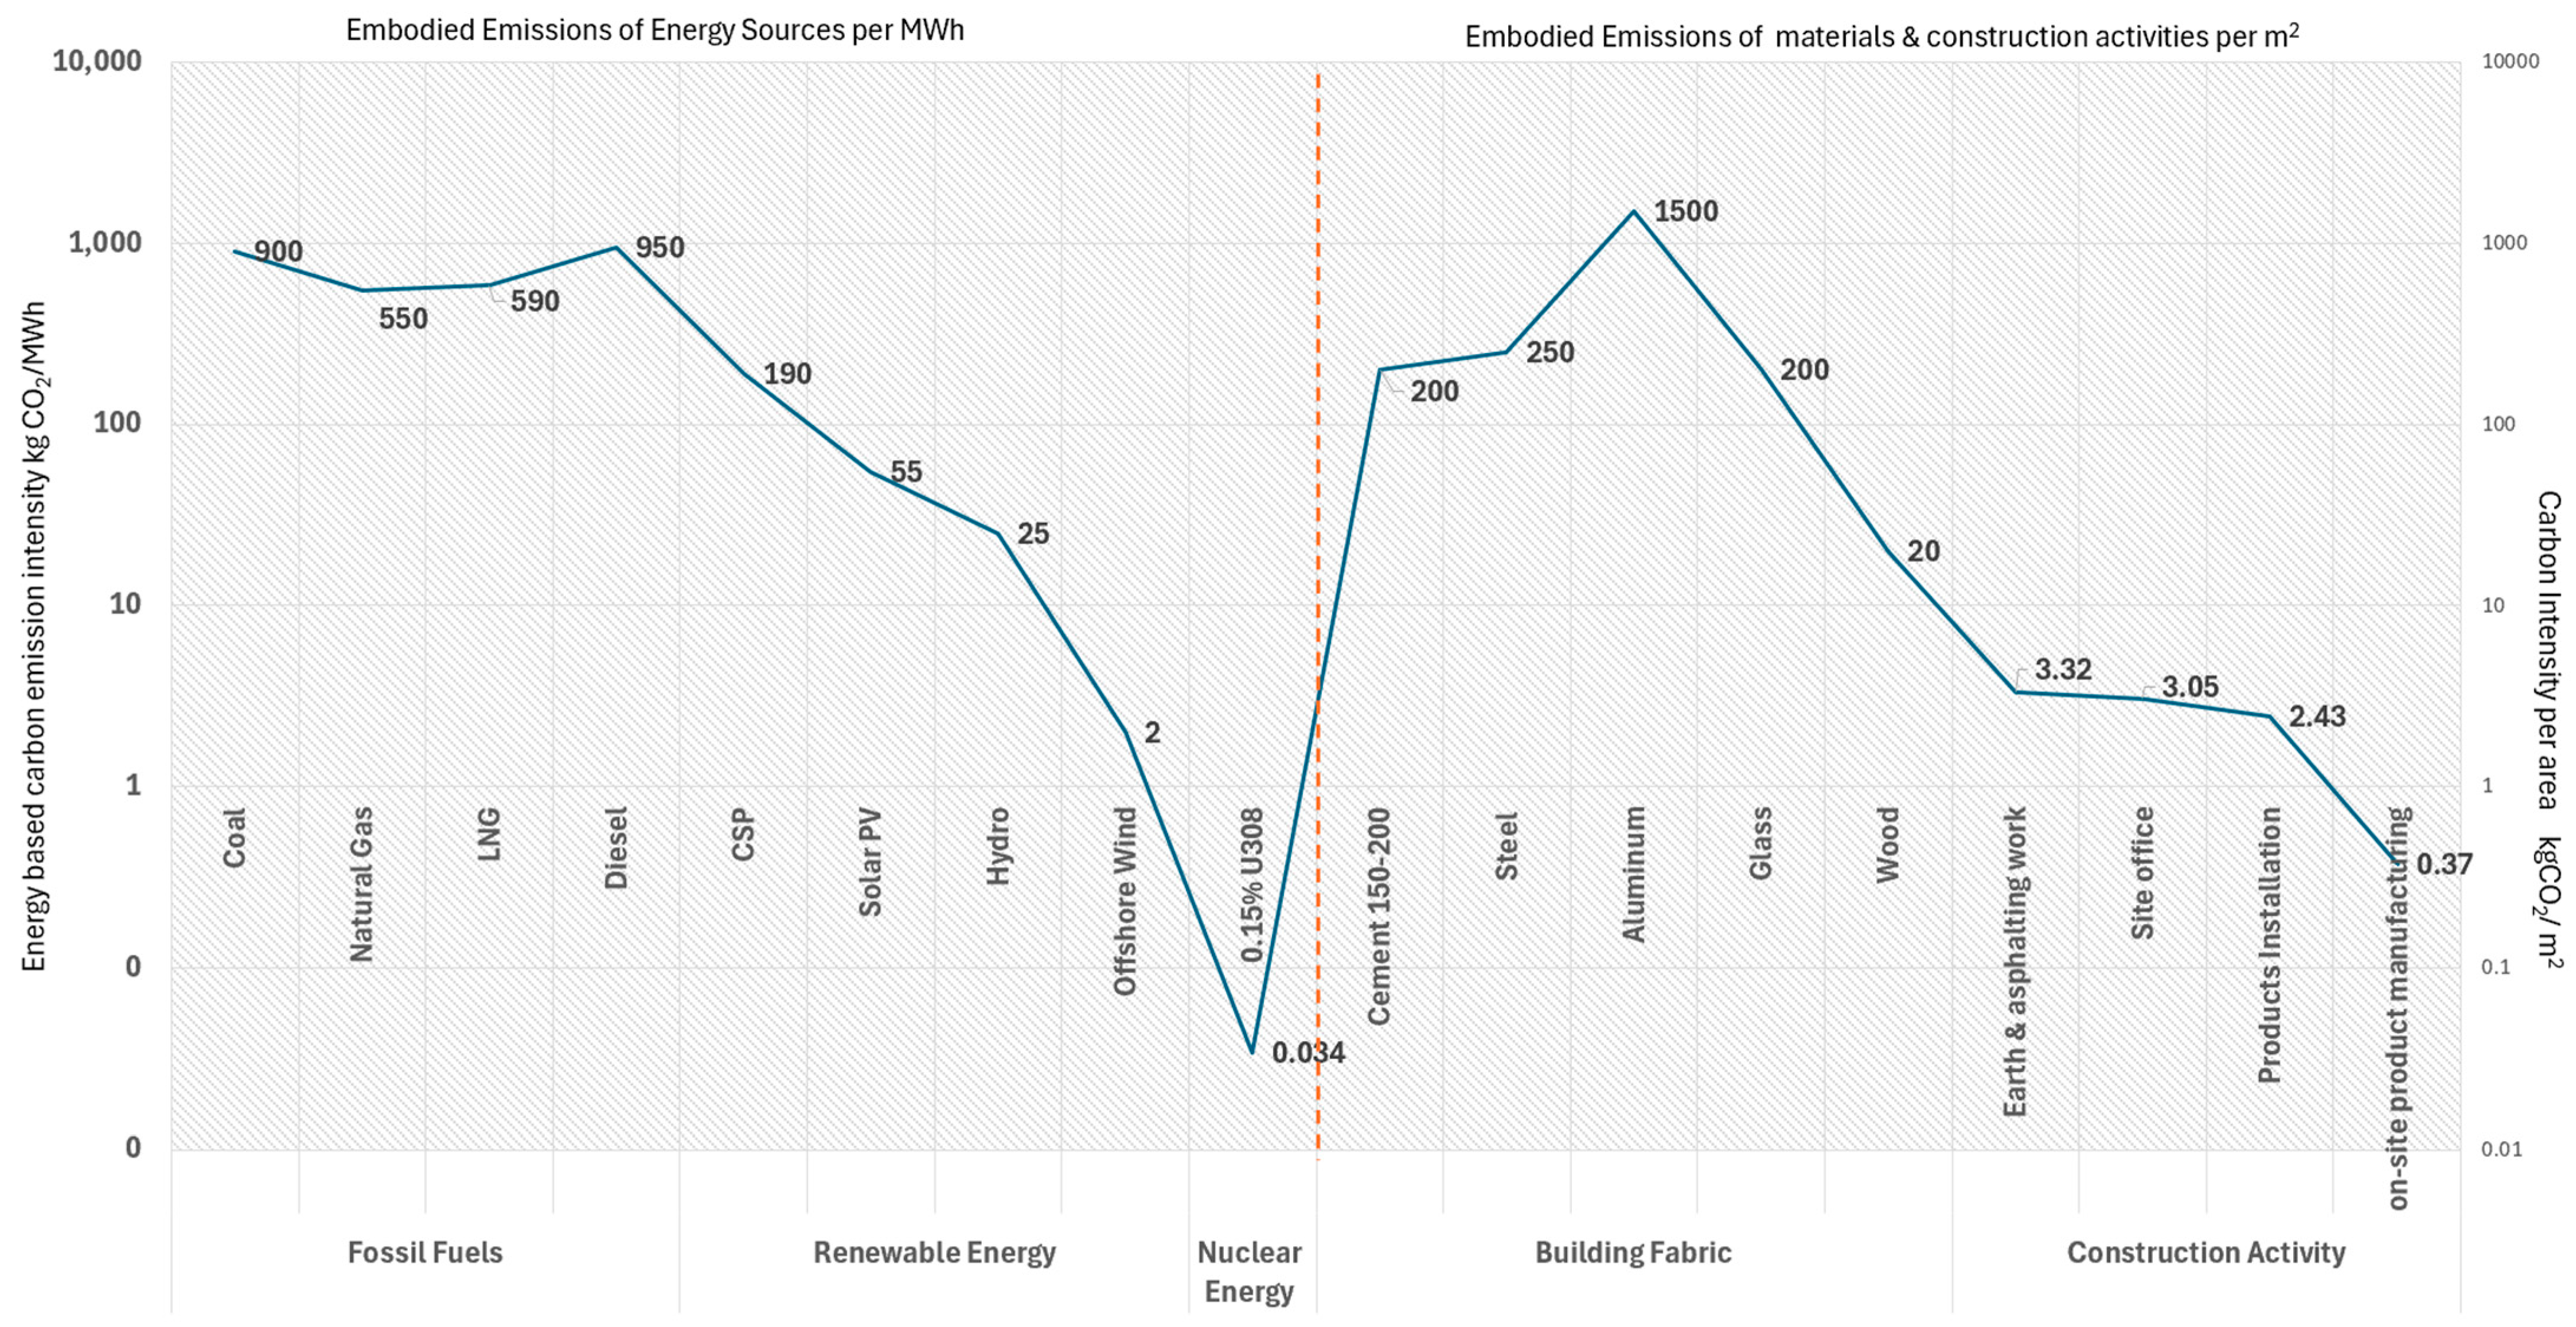
Based on the quantitative findings from the reviewed studies relevant to the objective of this paper, the mapping in
Figure 14 was created to illustrate the expected variations in the embodied emission intensities of the different sources of emissions that can be typically used in construction, such as the types of fossil fuels, renewable energy, building materials, and construction activities. These variations are represented using two metrics: kg CO
2/kWh, which reflects the energy source emission intensity per 1 kWh, and kg CO
2/m
2, which serves as an indicator of emission intensity associated with materials and construction activities per square meter of construction area (GFA).
Embodied emissions for materials are typically expressed by subject matter experts in the field in terms of kg CO
2 per unit mass (e.g., kg CO
2/kg), representing the total greenhouse gas emissions produced throughout a material’s life cycle. However, in this chart, emissions are quantified as kg CO
2/m
2 to introduce a spatial perspective, enabling a clearer analysis of emissions related to materials and construction activities. Additionally, the metric kg CO
2/kWh is incorporated to focus exclusively on emissions stemming from energy consumption, establishing a direct connection between embodied emissions and the energy sources utilized. This dual-axis framework effectively identifies emission hotspots, supports the comparison of alternative options, and aids in prioritizing processes and materials through a straightforward, data-driven analysis [
29,
30].
The findings indicate that the choice of energy sources used significantly influences emissions from construction activities such as material production, equipment operation, and generator use. Natural gas stands out among fossil fuels for its lower carbon intensity, offering a potential reduction of 65% in emissions compared to diesel. However, renewable energy, particularly solar, proves to be the most sustainable alternative, reducing emissions by over 90% compared to natural gas. While nuclear energy achieves the lowest emissions, its application is limited due to its complexity, low availability, and regional regulations.
In terms of embodied emissions, aluminum exhibits the highest carbon intensity among materials. However, the extensive use of steel and concrete, despite their lower per-unit emissions, makes them the largest contributors to overall emissions. This is primarily due to the sheer volume of these materials used in construction projects. The large-scale deployment of these materials underscores their significant impact.
Figure 14 evaluates the carbon emission intensity per kWh of various energy sources, as well as the carbon emission intensity per square meter of typical construction activities, based on a literature review. This analysis aims to identify the most effective alternatives and guide decision-making processes toward more sustainable construction methods. The chart integrates insights into embodied emissions and the impact of energy sources on the carbon footprint of products and processes. By enabling comparisons based on carbon intensity, it indicates key opportunities for reducing energy consumption and emissions across various products and processes. This approach provides a valuable tool for identifying decarbonization strategies and advancing sustainable practices.
Recent research has revealed a notable shift in the distribution of emissions, with the construction phase now contributing a greater share to a building’s total life cycle emissions than the operational phase. This shift emphasizes the critical need for focused strategies and policies that target emission reductions during construction while also addressing early-stage emissions, which significantly impact the overall carbon footprint of buildings. Such initiatives are vital in meeting the growing demand for climate change mitigation and offer actionable insights for promoting a more sustainable construction industry. It is recommended that policy measures be customized for the diverse stakeholders involved in a typical project, including the government, enterprises, and individuals. These measures can integrate tax incentives, subsidy policies, and updated technical standards and regulations that support the transition to a low-carbon economy. Furthermore, the development of practical guidelines is recommended, clarifying the roles and responsibilities of architects, engineers, and construction teams. This will enable a collaborative and integrated approach to optimizing building design, selecting low-carbon materials, and implementing energy-saving systems.
5. Conclusions
This critical review has highlighted considerable variations in the embodied emissions associated with products and materials, with differences largely attributable to the LCA methods applied, the boundaries defined for the assessment (e.g., cradle-to-gate versus cradle-to-cradle), the inclusion or exclusion of specific life cycle phases such as transportation, the geographic location, and the emission factors used.
The mapping presented in
Figure 14 supports decarbonization efforts within the construction sector by stressing the urgent need to transition from fossil fuel-based energy sources and the importance of identifying alternatives to carbon-intensive materials. These alternatives offer substantial emission reductions while maintaining feasibility for implementation. Additionally, our findings present more complex options like nuclear energy, which, while promising in terms of emission reduction, require further research to address challenges related to feasibility, regulatory frameworks, and infrastructure. These insights underscore the need for continued innovation and targeted research to advance the practical application of low-carbon solutions in construction activities.
The case study presented utilized real, recent data from actual residential low-rise construction projects in Abu Dhabi, offering a valuable analysis of energy intensity per square meter of Gross Floor Area (GFA) and energy-based carbon emissions per square meter of GFA. It provides a baseline for conventional construction methods that rely on diesel to power activities and operations. These insights are crucial for future research and contribute to the existing body of knowledge in this field. Notably, this case study is unique in its focus, particularly within the Middle East and Gulf region, where similar studies are limited. Additional projects need to be analyzed to identify the intensity convergence that is specific to construction activities, thereby making the convergence increasingly accurate, as well as breaking it down into different project typologies such as infrastructure projects, high-rise projects, road projects, etc., to make the comparison more reliable and effective.
The existing literature on the carbon–energy nexus within the construction sector’s embodied emissions provides an in-depth exploration of the intricate relationship between energy consumption and carbon emissions throughout the construction process. A critical review of these studies reveals that, while substantial progress has been made in understanding the role of embodied emissions, challenges remain due to the lack of standardized methodologies for measuring and mitigating these impacts, as well as the absence of real-time data for use as a reference and baseline. The literature highlights the need for more precise and real-time data and advanced models to fully capture the extent of embodied carbon, alongside the development of innovative strategies to reduce energy consumption and optimize material use. Additionally, key gaps in knowledge are identified, including the variability in emissions across different regions, construction processes, and technologies, which remain areas for future research. Overall, these findings underscore the importance of integrating energy and carbon metrics into life cycle analyses of construction projects to drive meaningful reductions in the sector’s environmental impact.


