Article

Numerical Simulation of a 330 MW Tangentially Fired Boiler by a Model Coupling CFD and Hydrodynamic Calculation

1
Huayuan Power Plant, State Grid Energy Hami Coal and Power Co., Ltd., Hami 839000, China
2
Shanghai Power Equipment Research Institute Co., Ltd., Shanghai 200240, China
3
State Key Laboratory of Multiphase Flow in Power Engineering, School of Energy and Power Engineering, Xi’an Jiaotong University, Xi’an 710049, China
*
Author to whom correspondence should be addressed.
Energies 2025, 18(10), 2585; https://doi.org/10.3390/en18102585
Submission received: 9 April 2025 / Revised: 11 May 2025 / Accepted: 13 May 2025 / Published: 16 May 2025

Abstract

:
The interaction mechanism of multi-physical fields in a 330 MW tangentially fired boiler is explored by coupling the CFD (computational fluid dynamics) model and the working fluid side hydrodynamic model under steady-state conditions. The research focuses on the flue gas flow field, the hydrodynamic safety of the water wall, the variation of the working fluid parameters and the formation and distribution characteristics of sulfide (SO2, H2S) under different steady loads (35%, 50%, 75%, 100% Boiler Maximum Continuous Rating). The results show that under high load, the flue gas attaches to the wall. The overall stagnation differential pressure ratio (1.85–2.07) and reversal differential pressure ratio (1.22–1.30) of the G1 tube group with the lowest heat flux are higher than the safety threshold (1.05), proving reliable operational safety under equilibrium conditions. The temperature distribution of the furnace center obtained by numerical simulation is consistent with the actual situation. The mass fraction of sulfide increases significantly with the increase in load. SO2 is mainly distributed in the wall area of the middle and upper burners, while H2S is mainly distributed in the wall area between the secondary air and the main burner. The maximum mass fractions of SO2 and H2S at 330 MW are 0.120% and 0.0524%, respectively. It is suggested that a wall-attached air system be added to inhibit the enrichment of corrosive gases. This work may provide theoretical support and engineering guidance for multi-objective optimization design and high temperature corrosion prevention and control of tangentially fired boilers.

1. Introduction

Driven by the strategic goal of “2030 carbon peak, 2060 carbon neutral” in China, coal-fired power plants, as the main force of traditional energy supply, are facing severe challenges [1]. The installed capacity of new energy with volatility and intermittency has exceeded 800 million kilowatts, more than 50% of the total installed capacity [2]. Consequently, coal-fired power units are increasingly undertaking deep load cycling operations [3]. The tangentially fired boiler represents an ideal technical route to meet the demand due to its thermodynamic superiority: (1) Enhanced particle residence (15–20% extension) and combustion efficiency (>98.5% burnout rate) through vortex formation [4,5,6]; and (2) superior thermal homogeneity mitigating slagging and NOx formation [7,8,9]. However, the coupled gas-particle dynamics, temperature distribution, and high-temperature corrosion mechanisms in tangential-firing boilers require systematic investigation [10].
Recent advancements in computer hardware have enabled significant progress in computational fluid dynamics (CFD) simulations of boiler combustion processes, with expanded applications [11,12,13]. Previous studies [14,15,16] have employed numerical simulations to investigate the thermal and flow fields, as well as the heat flux distribution characteristics within tangentially fired boilers under various operating conditions. However, the models’ approaches exhibit significant limitations in thermal-structural analysis [17]. These models employ simplified one-dimensional height-dependent heat allocation coefficients and empirical charts to decouple fluid flow/heat transfer calculations from wall temperature predictions. This reductionist framework fundamentally fails to capture the three-dimensional flow field’s genuine impact on heat flux distribution. Critical three-dimensional phenomena—including combustion inhomogeneity and structural variations across tube panels—remain artificially constrained within oversimplified two-dimensional zonal assumptions, resulting in systematic deviations in localized wall temperature predictions [18]. Such empirical methodologies relying on geometric simplification inherently obscure the intrinsic coupling mechanisms between complex three-dimensional flow dynamics and heat transfer processes.
The three-dimensional CFD-hydrodynamic coupling methodology effectively resolves these limitations. This advanced approach integrates numerically simulated flue gas-side heat transfer with water-wall working fluid-side thermal calculations, enabling comprehensive prediction of wall temperature distributions in boiler water walls across varying operational loads [19,20]. Yu et al. [21] demonstrate this methodology through three-dimensional numerical simulation of furnace combustion to obtain heat flux distributions in platen superheaters. They establish an iterative computational framework where initial wall temperature distributions derived from hydrodynamic calculations feed back as boundary conditions for subsequent heat flux simulations. This closed-loop iteration continues until convergence of superheater wall temperature solutions. The three-dimensional coupled strategy eliminates error accumulation inherent in traditional decoupled models caused by empirical assumptions and dimensional reduction, thereby providing a more reliable numerical foundation for the safety evaluation of heat exchange surfaces.
Furthermore, prevailing research predominantly addresses isolated physical phenomena, with critical gaps persisting in multiphysics coupling mechanisms governing combustion stability, hydrodynamic integrity, and sulfide-induced high-temperature corrosion. In this study, a three-dimensional CFD steady-state model is established for a 330 MW tangentially fired boiler, coupling the hydrodynamic calculation to enhance the prediction accuracy of flue gas behavior and working fluid dynamics. The investigation systematically addresses: (1) Tangential flow field under varying Boiler Maximum Continuous Rating (BMCR) loads (35–100%); (2) the hydrodynamic safety; and (3) the corrosion characteristics of walls. This method strategically prioritizes the hydrodynamic equilibrium analysis under steady-state operating conditions while maintaining computational tractability, thereby establishing a critical theoretical foundation for subsequent investigations of dynamic transient processes. These findings establish a mechanistic framework for optimizing combustion aerodynamics and implementing corrosion-resistant design strategies in high-temperature boiler systems.

2. Materials and Methods

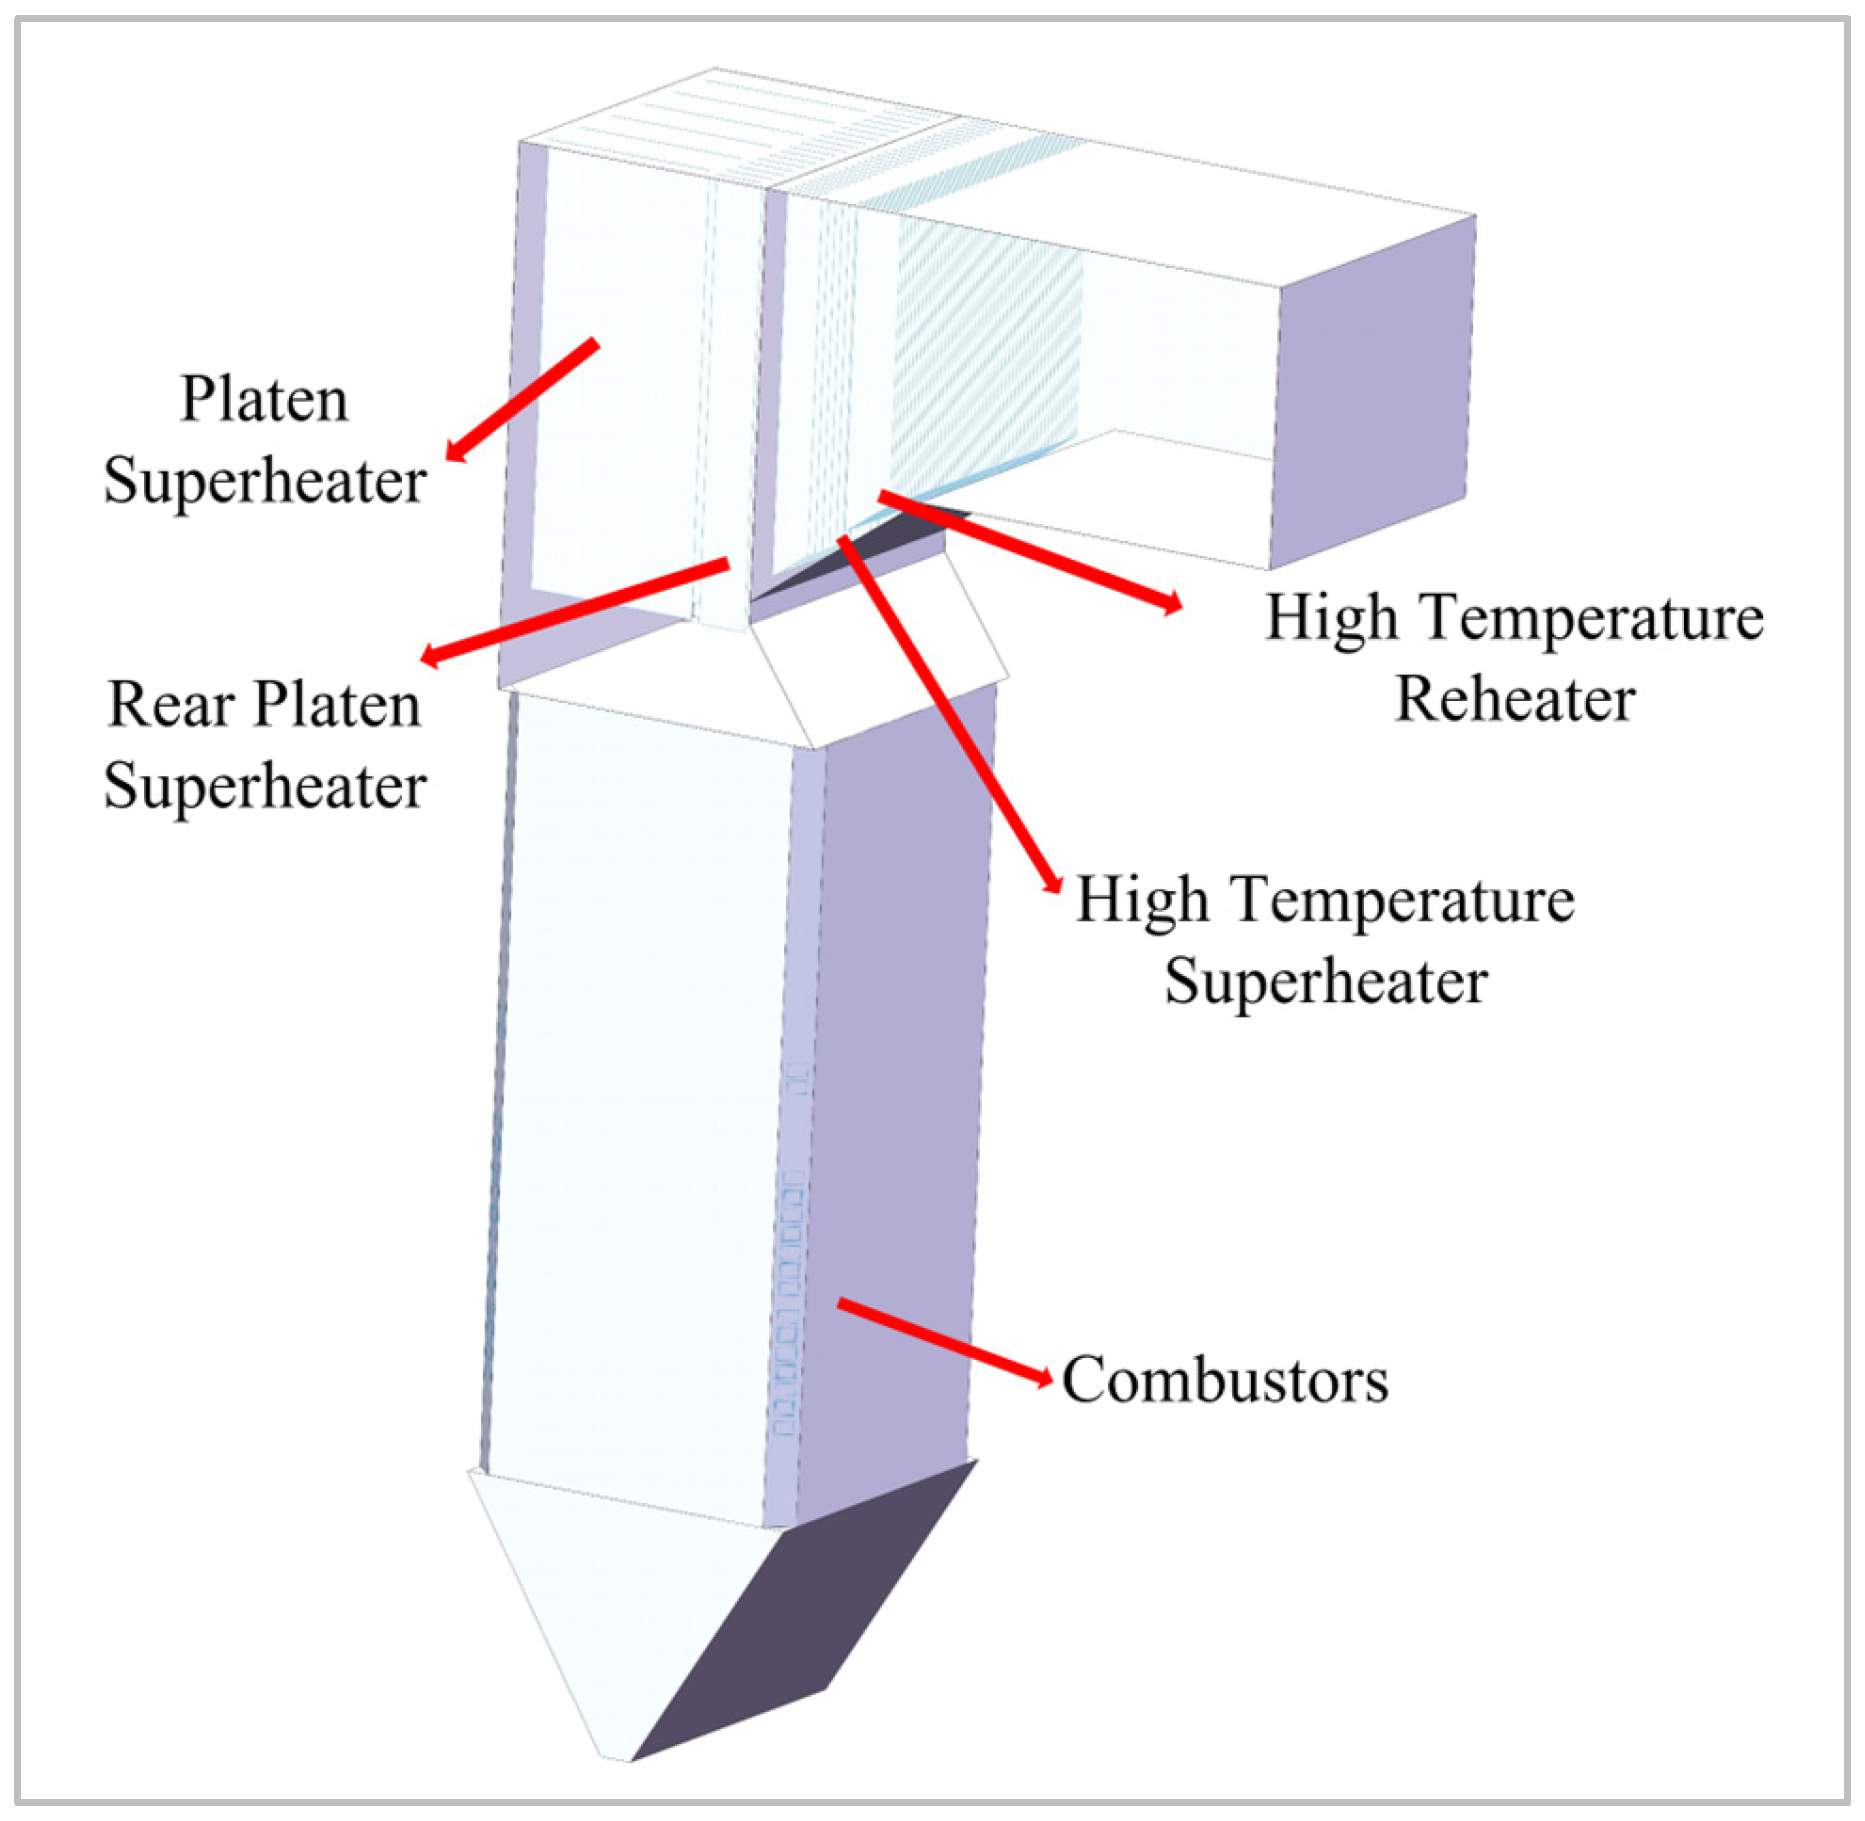
2.1. Research Object

A subcritical 330 MW four-corner tangential-fired coal-fired boiler is selected as the research object. The furnace is equipped with fully welded membrane water-cooled walls. The furnace width and depth are both 12.80 m, with the lower header of water-cooled walls at an elevation of 7.50 m and the upper header at 64.90 m. The furnace bottom features a cold ash hopper with a 55° inclination angle. The upper furnace houses the platen superheater and the rear platen superheater, while the high-temperature superheater and reheater are arranged in the horizontal flue. Each corner combustor comprises 16 layers of nozzles: 6 layers of primary air nozzles, 2 layers of separately arranged over-fire air nozzles, and 8 layers of secondary air nozzles. The main design parameters are listed in Table 1, and the coal quality parameters of the burning coal are shown in Table 2. Table 3 shows the main parameters of the calculation conditions.

2.2. CFD Numerical Simulation Method

2.2.1. Physical Modeling and Meshing

In this study, a systematic geometric modeling of the boiler is carried out, where the cold ash hopper, furnace, platen superheater, tail flue, and other structures are restored in a ratio of 1:1. The established physical model is shown in Figure 1. ICEM software Ansys ICEM CFD 2022 R1 is used to divide structured grids, and the grids of the combustor nozzle area are encrypted. The mesh division of the model is shown in Figure 2. The mesh illustrates distinct regions through colors automatically assigned by the meshing software. The red arrow marks the location of burners, while the dashed red box emphasizes the refined mesh area for enhanced resolution. And the red parallelogram box emphasizes the mesh of the cross-section of the burner area.

2.2.2. Numerical Modeling

Flow dynamics and combustion processes within the furnace are simulated using ANSYS fluent computational fluid dynamics software (Ansys FLUENT 2022 R1 version). The flow inside the furnace is described by the standard k-ε two-equation model. On the premise of ensuring the accuracy requirements of engineering applications, the model ensures good computational economy and stability [22,23]. Radiation heat transfer is modeled with the Discrete Ordinates (DO) method [24], while gas-phase absorption coefficients are determined using the Weighted-Sum-of-Gray-Gases (WSGGM) approach [25]. The model of finite rate/eddy dissipation and the model of kinetic/diffusion-controlled reaction rate are utilized to simulate the gas combustion and carbon combustion, respectively [26,27]. Under the condition that the detailed equation of sulfide reaction is not completely written, using the probability density function to describe the distribution of sulfides can simplify the interaction between turbulence and chemical reaction [28,29]. After the combustion calculation in the furnace converges, the corrosion rate of each tube is calculated using the fluent self-embedded Oka model [30,31]. The model comprehensively considers the collision characteristics, such as the velocity and angle of the collision particles, and takes into account the material hardness of the collision wall.

2.2.3. Boundary Conditions

Inlet boundary conditions are established according to the boiler design specifications. The primary and secondary air flow rates are determined through stoichiometric calculations based on coal properties, feed rates, and excess air ratios. Table 4 details the operational parameters at 100% BMCR load, including air flow rates, temperatures, velocities, and nozzle dimensions. Variations in coal feed rates, excess air coefficients, and primary air ratios enabled the derivation of air flow parameters for three additional load levels, which are subsequently implemented in the numerical simulations. Thermal boundaries employed fixed wall temperatures (averaged from inlet/outlet measurements) with a surface emissivity of 0.8. The standard wall functions are employed. Outlet boundaries utilized pressure conditions to simulate open atmospheric discharge.

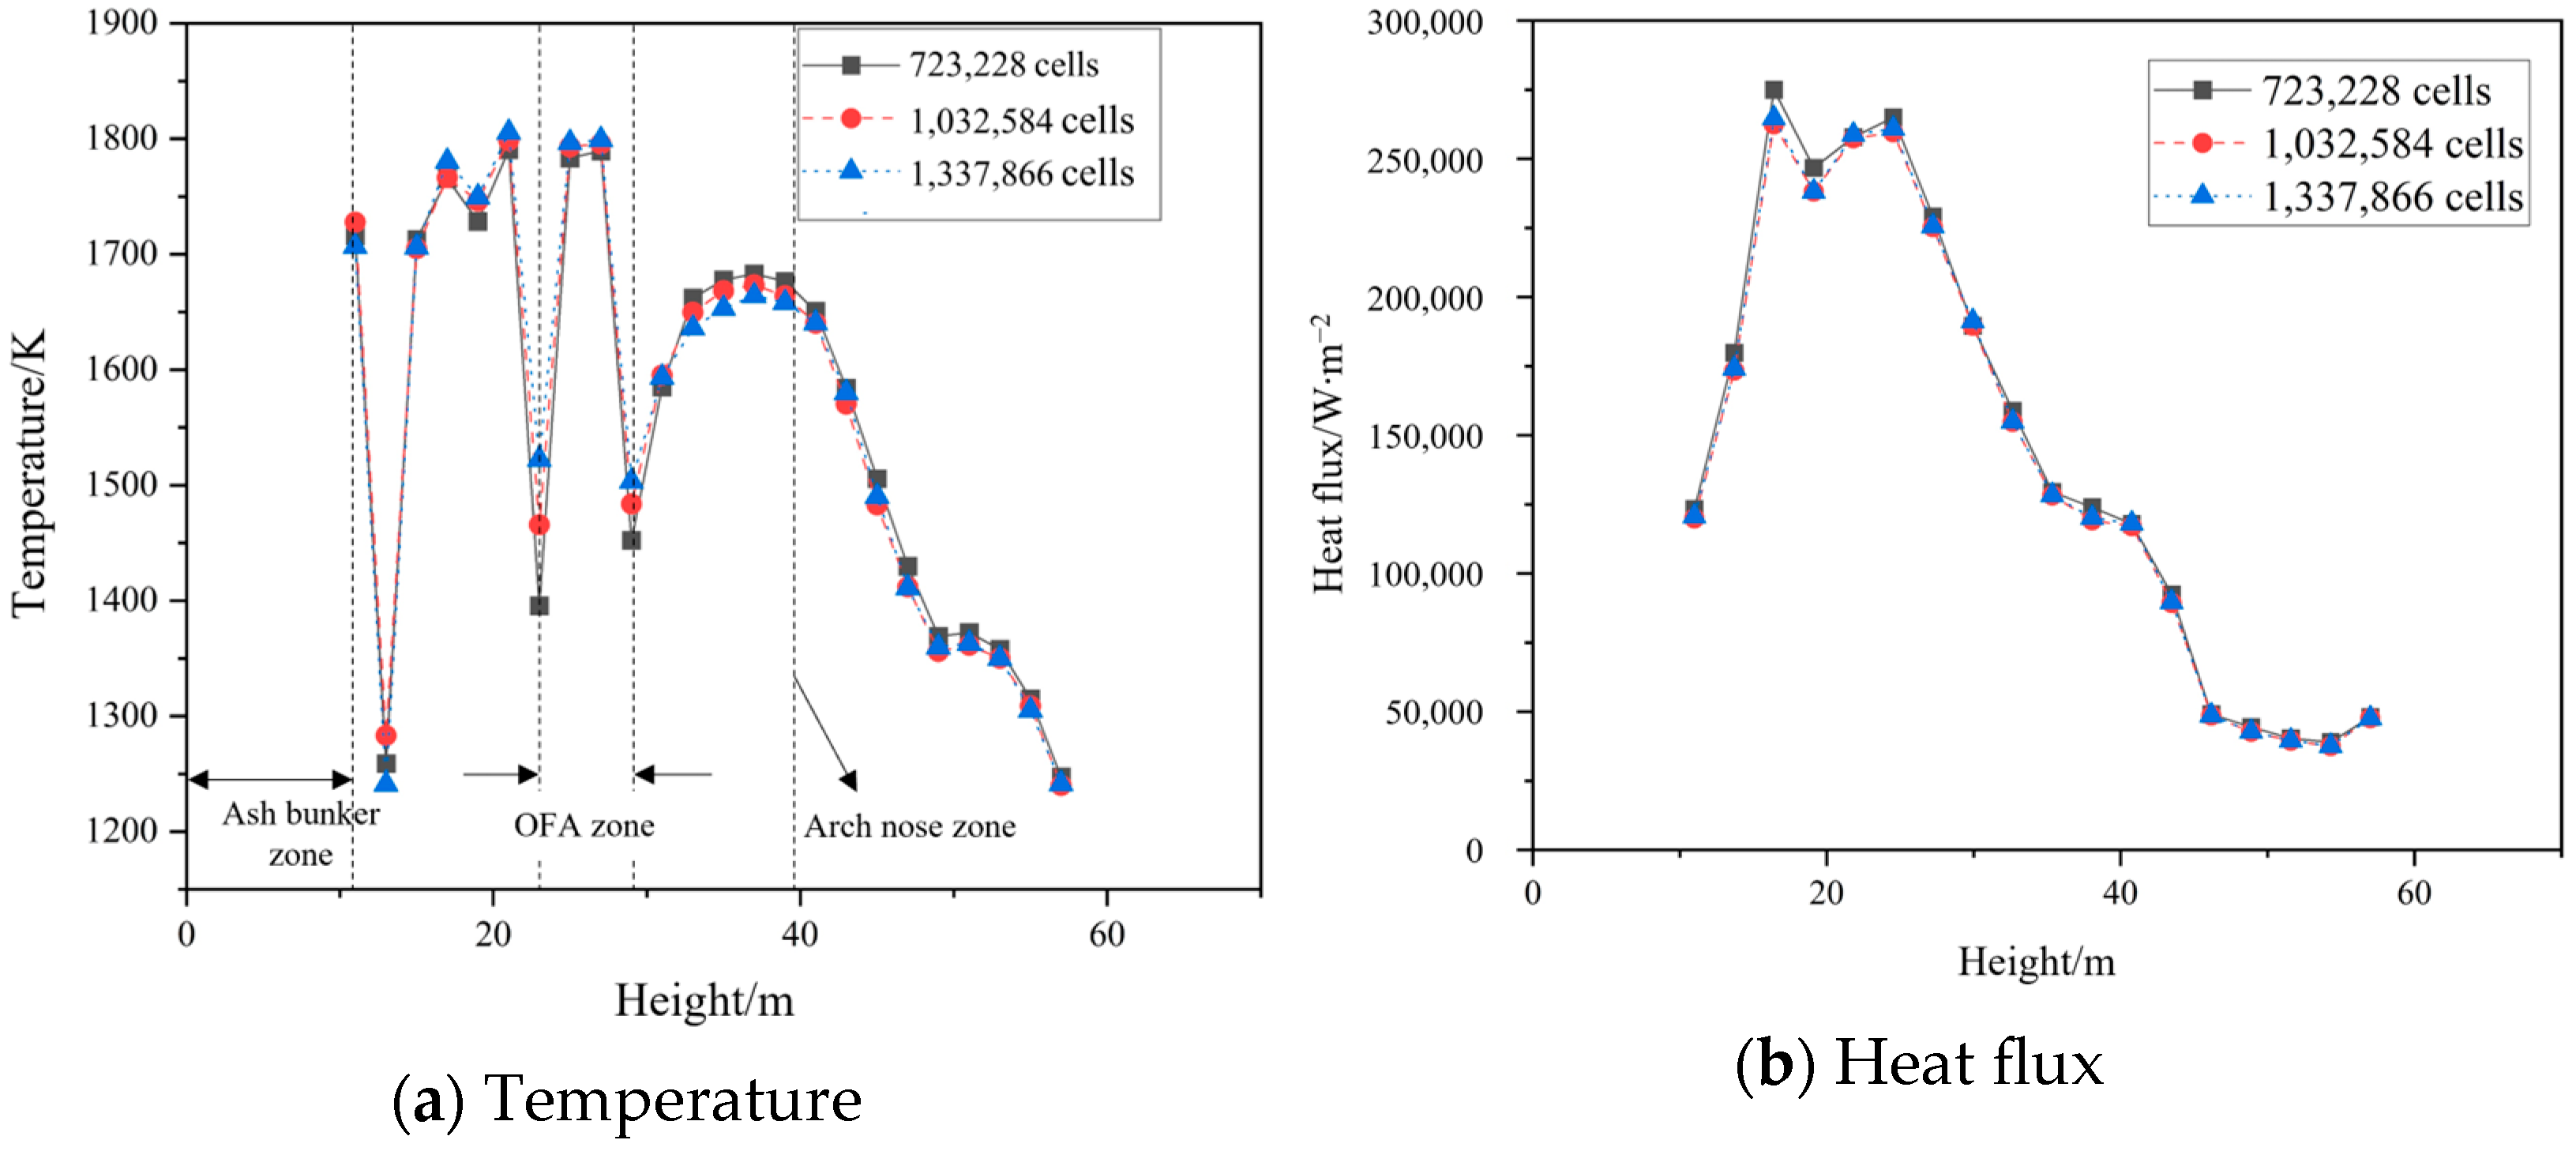
2.2.4. Mesh Independence Verification

A mesh independence study is conducted to identify the optimal mesh configuration that balances computational accuracy and efficiency. Figure 3 demonstrates temperature and heat flux profiles along furnace height for three mesh systems (0.83 million, 1.03 million, and 1.33 million nodes). The results from the 1.03 million-node mesh match the finest mesh’s thermal trends while reducing computational load by 37%. Subsequent simulations, therefore, adopt this validated mesh resolution.

2.3. Hydrodynamic Calculation Model

The division of the tube group of the boiler water wall is shown in Figure 4. Except for the rear wall, the other water walls are divided into 10 sections along the transverse direction and 18 sections along the longitudinal direction. The rear wall is divided into 12 sections in the height direction, and then connected with the outlet header through the flame angle tube, the suspension tube, and the side wall extension tube. The height of each tube section is 2.20 m.
The differential pressure phenomenon occurring during heat-transfer medium circulation within tubes primarily stems from multiple resistive factors. These pressure losses can be classified into four distinct categories: frictional resistance pressure drop, local resistance pressure drop, gravity pressure drop, and accelerated pressure drop. Empirical observations from industrial boiler operations indicate that the accelerated pressure drop typically constitutes negligible proportions within the total pressure differential system and is therefore commonly omitted from practical engineering calculations. The calculation formulas for the other pressure drops are as follows:
Δ P f = λ × l d in × ω 2 2 × ρ
Δ P 1 = ξ × ω 2 2 × ρ
Δ P g = ± h   ×   g   ×   ρ
where p f , p l , and p g represent frictional resistance pressure drop, local resistance pressure drop, and gravity pressure drop, MPa, respectively; λ indicates the thermal conductivity of the working fluid, W/(m·K); ξ corresponds to the local resistance coefficient; l, din, and h are the length, inner diameter, and height difference of the tube, respectively, m; and ω shows the working fluid flow rate, m/s.
The inner wall temperature of each tube group is:
t m = t f + β q / h
where tf represents the fluid temperature in the calculation tube group, K; β indicates the ratio of outer diameter to inner diameter of the tube; q is the heat load of the outer wall of the tube, and W/m2; h is the convective heat transfer coefficient of the tube wall, W/(m2·K).
The outer wall temperature of the tube is:
t ont =   t in + q δ / λ tube 2 β / β + 1
where δ is the tube wall thickness, m; and λ tube is the thermal conductivity of the tube wall, W/(m·K).

2.4. Sulfide Formation Model

The sulfidation corrosion of ferrous alloy waterwall tubes by H2S at elevated temperatures represents a critical degradation mechanism in boiler systems [32]. Quantitative modeling of sulfur species necessitates rigorous characterization of H2S generation-transformation dynamics within furnace environments. During devolatilization, sulfur-containing compounds in fuel volatiles are primarily released as H2S, whereas char-bound sulfur undergoes oxidative evolution as SO2 through coke gasification processes. The respective liberation kinetics of H2S and SO2 are mathematically described by the following rate equations.
S H 2 S = α S ar V ar × 1000 r vol M w , S V cell
S S O 2 = ( 1 α γ ) S ar FC ar × 1000 r c P c , comb M w , S V cell
P c , comb = k c , O 2 / k c , O 2 + k c , CO 2 + k c , H 2 O
where α and γ denote the sulfur mass fractions in volatiles and ash phases, respectively, with experimentally determined values of 0.55 and 0.1. rvol and rc are the devolatilization rate and char combustion rate, respectively, kg·s−1. Mw,S represents sulfur’s molar mass, kg·mol−1. Vcell is the control volume, m3. Pc,comb is the fractional contribution of oxidation reactions to char consumption. Equation (8) calculates the proportion of char consumed by combustion. The denominator sums the reaction rates of char with O2, CO2, and H2O, while the numerator specifically represents the char-O2 oxidation rate.
The detailed parameters of the sulfide formation model are shown in Reference [13].

2.5. Coupled Model

As mentioned above, the CFD model on the gas side of the boiler needs the temperature distribution of the working fluid in the tube (Ts) from the hydrodynamic model on the working fluid side to calculate the wall heat flux distribution (q); in turn the hydrodynamic model requires q from the CFD model to calculate Ts. Therefore, the coupling calculation model expects data interaction between the two models, through which q and Ts can be calculated simultaneously after iterative calculation.
The computational process is initiated by assuming uniform Ts, corresponding to the economizer outlet feedwater temperature specified in Table 1. This thermal boundary condition is applied in the three-dimensional CFD model to calculate q, which subsequently feeds into the hydrodynamic calculation model. The model computes steam temperature rise and outlet conditions along each water wall tube segment based on q. These results establish inlet temperature conditions for subsequent components. This workflow enables comprehensive temperature evolution tracking throughout the steam circuit. Following the hydrodynamic computation, steam temperature profiles along individual tube segments are mapped to corresponding spatial coordinates in the CFD domain through parametric profile files. These updated thermal boundary conditions reinitialize the fluent simulation for subsequent iterations. Convergence criteria are satisfied when absolute temperature differences between two consecutive iterations fall below a defined threshold (e.g., 1 K), ensuring solution stability and numerical accuracy. The coupling iterative calculation process is shown in Figure 5.

2.6. Model Verification

In order to verify the accuracy of the model, the combustion simulation results are compared with the actual operation data, and the comparison results are listed in Table 5. The deviations of the flue gas temperature in the furnace, the pressure drop of the water wall, the temperature of the working medium of the separator, and the flue gas composition at the outlet of the economizer are all within the acceptable limits. This illustrates that the current technique is reliable for simulating the characteristics of a tangentially fired boiler.

3. Results and Discussion
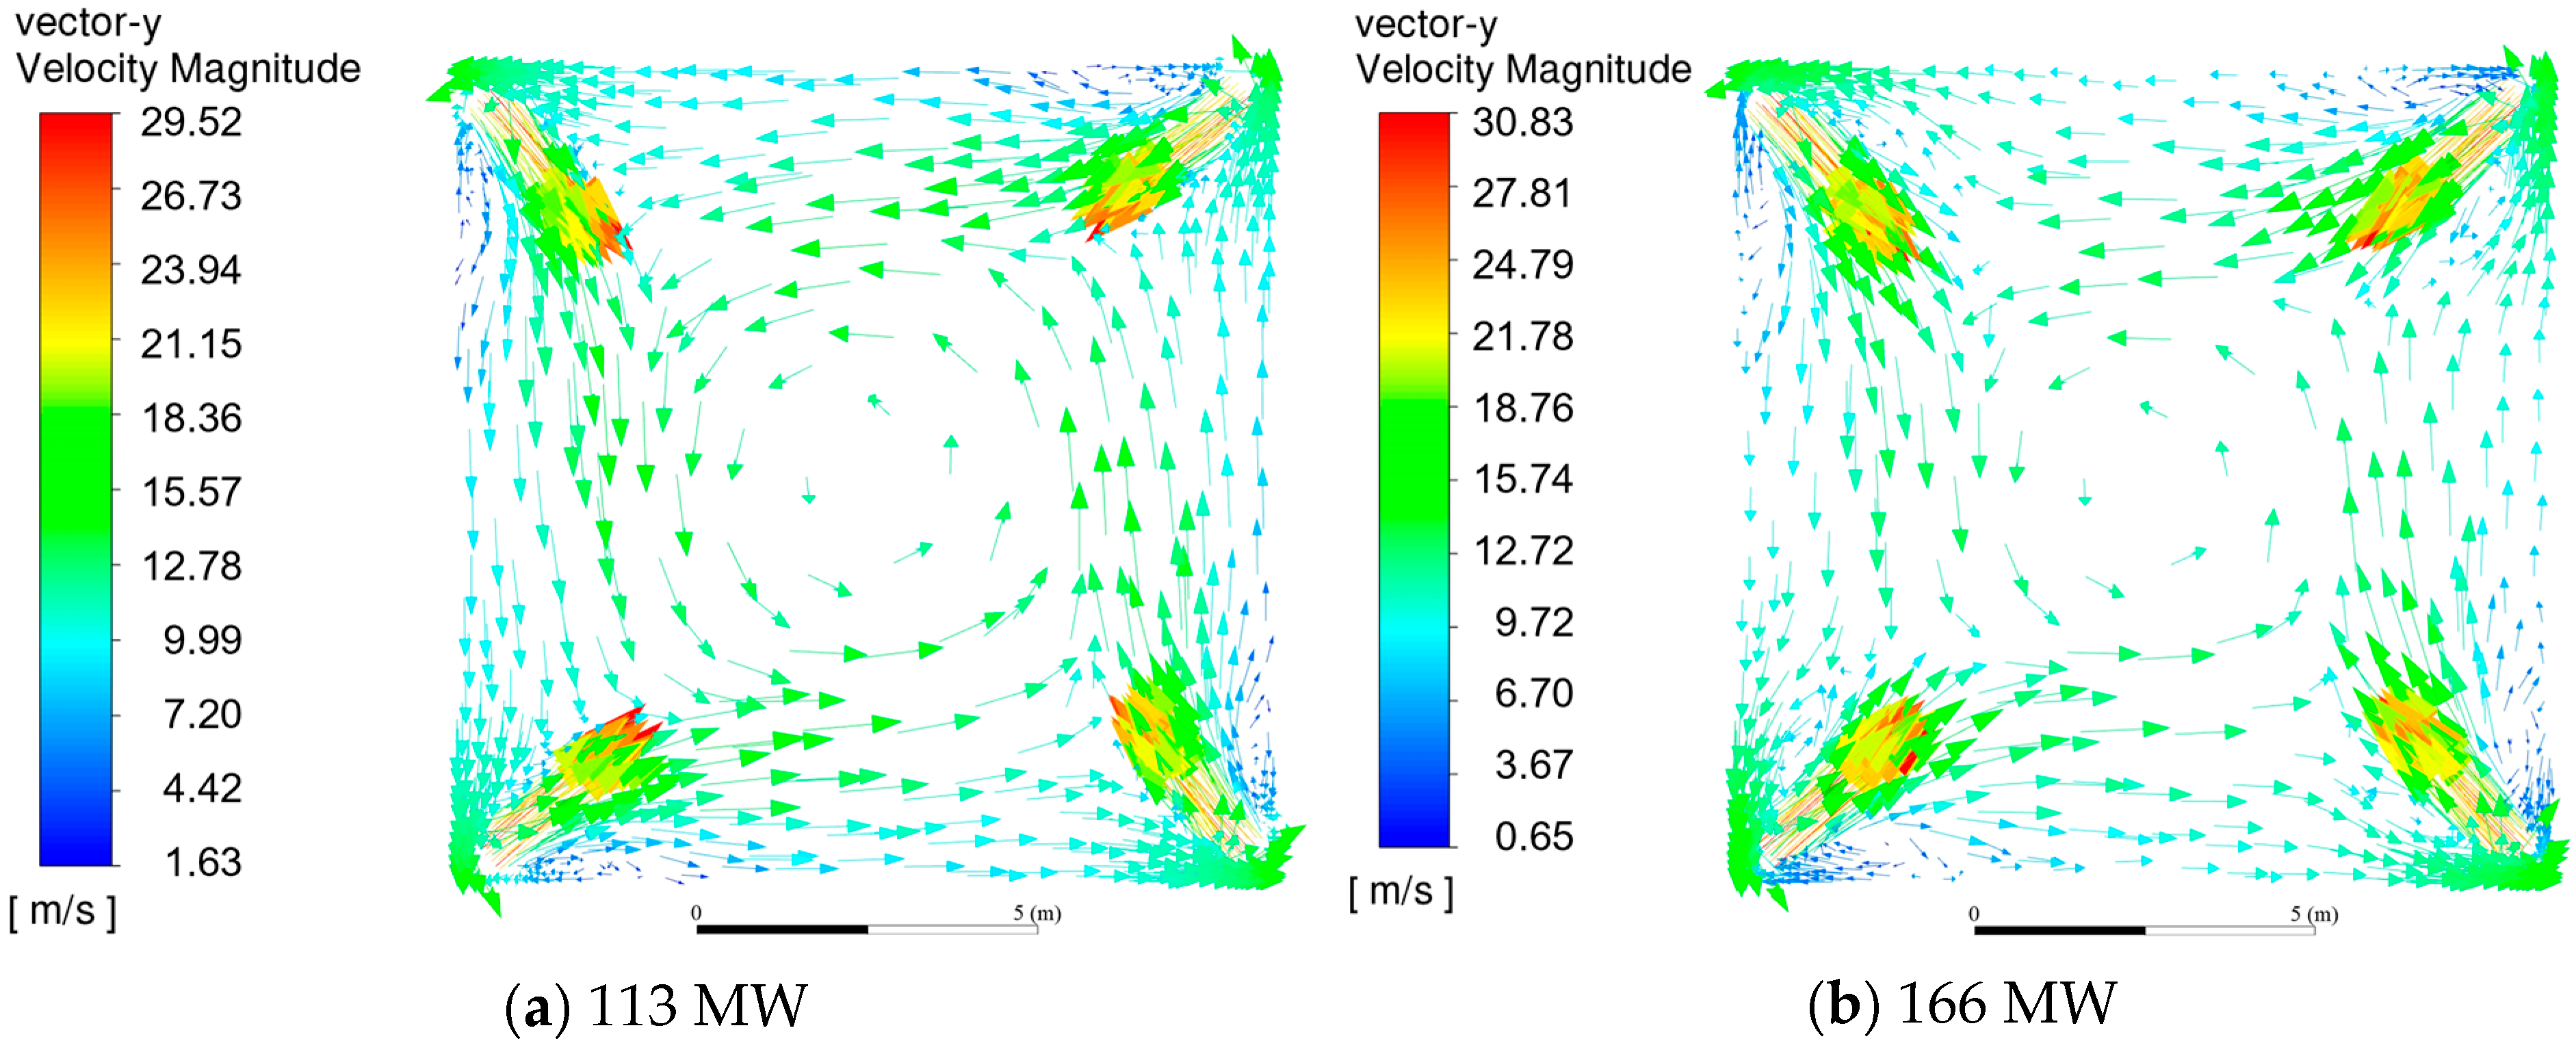
3.1. Flue Gas Field

Figure 6 shows the flue gas velocity vector distribution in the cross-section of the nozzle under varying loads. The results demonstrate that the air flow in the furnace rotates strongly to form a set of obvious concentric circles. The established aerodynamic swirl facilitates heating of pulverized coal streams from individual corner burners through upstream high-temperature flame impingement, thereby promoting rapid ignition propagation that sequentially initiates combustion in downstream burner jets. Under low loads (113 MW and 166 MW), the swirl intensity of the flue gas is minimal, and the jet of the burner is limited by the lateral momentum of the mainstream swirling airflow. The deflection angle of the jet trajectory is less than 8°, which basically maintains the design incident direction. As the load increases to 248 MW and above, the swirl intensity of the flue gas is significantly enhanced, and the generated transverse thrust causes a significant deflection of the jet at the outlet of the burner. Under the condition of 248 MW, the jet deflection angle increases to 18°, and further expands to 32° at 330 MW, increasing the possibility of flame washout of water-cooled walls, which may cause the tubes to slag seriously.

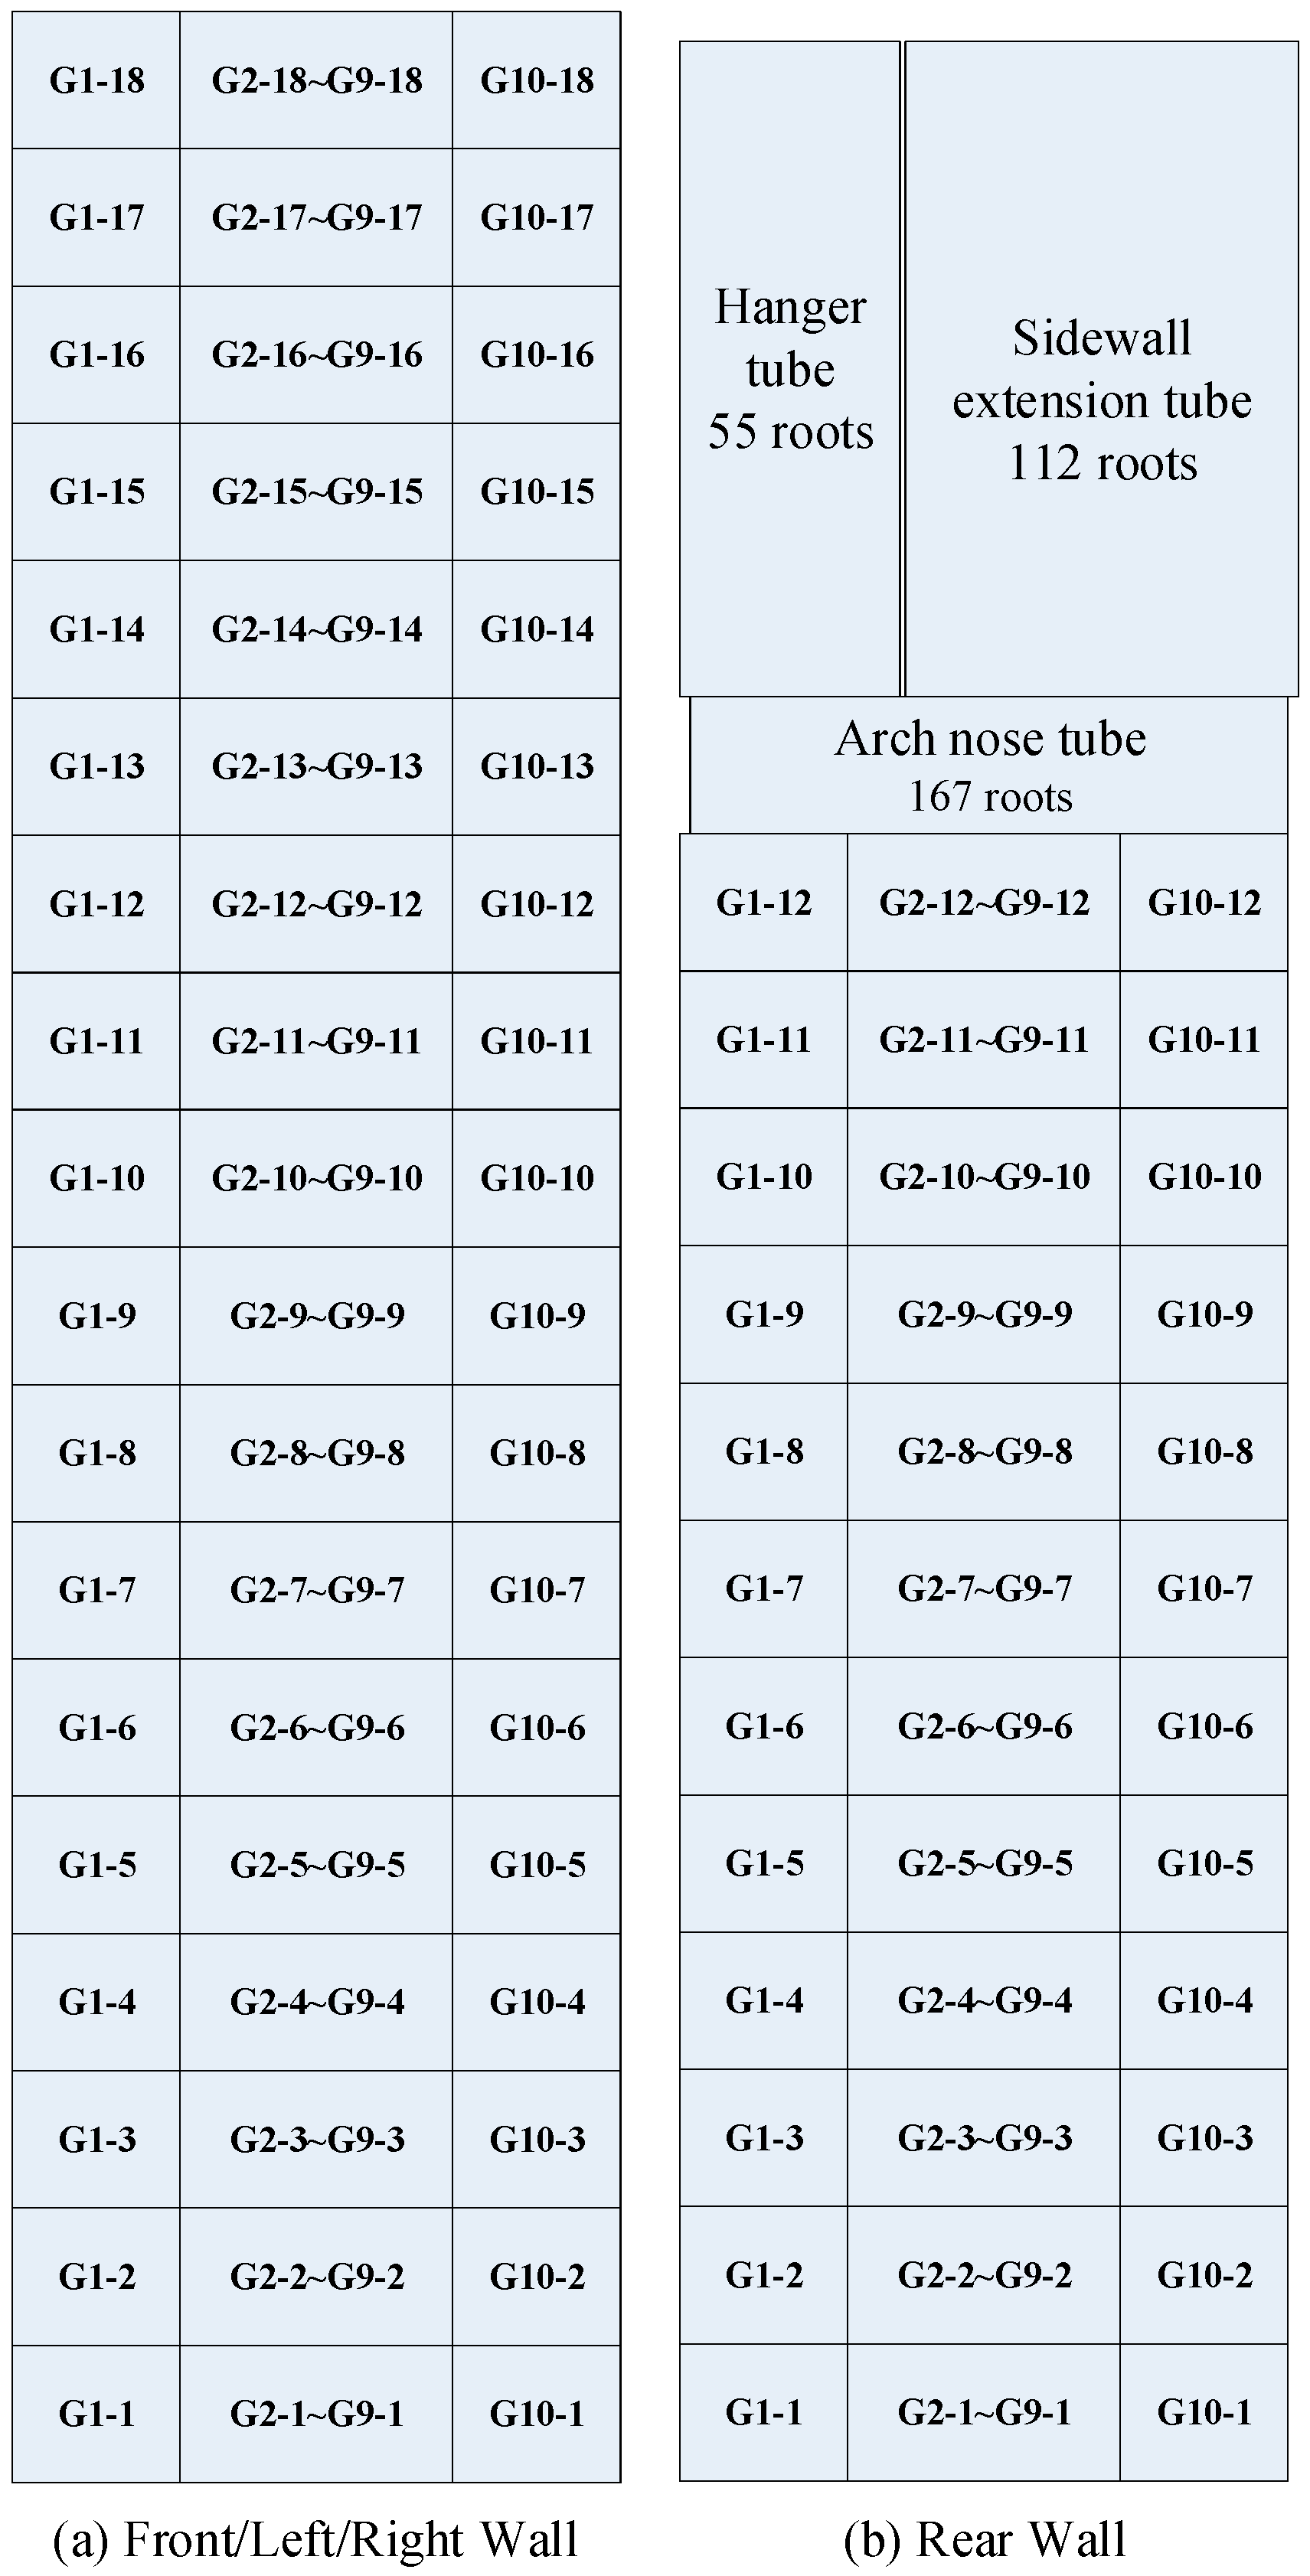
3.2. Hydrodynamic Safety Inspection

Hydrodynamic instabilities, particularly flow stagnation and reversal phenomena, may manifest within the water-cooled wall systems of boiler installations [33]. Usually, the condition at which the inlet flow rate G of riser is equal to the outlet steam output D, i.e., the recirculation ratio K = 1, is referred to as stagnation; when the working fluid in the heated riser changes the flow direction and flows downward, it is called flow reversal [34]. Hydrodynamic safety can be measured by stagnation differential pressure ratio (DPR) R s and reversal DPR R r . The calculation formula is as follows:
R s = P 0 P s
R r = P 0 P r
where P 0 is the working pressure difference of the riser, MPa; P s is the stagnation pressure difference, indicating the pressure difference when the riser just stagnates, MPa; and P r is the reversal pressure difference, representing the pressure difference when the reversal occurs exactly, MPa.
During the operation of the boiler, once R s is less than 1, stagnation will occur; and once R r is less than 1, the reversal phenomenon will occur [35]. To prevent flow stagnation or backflow in the tubu, the safety coefficients R s and R r must maintain threshold values exceeding 1.05. The working reliability of the tube with the lowest heat flux is poor, and it is most prone to cycle stagnation and reversal [36]. Taking the right wall as an example, Figure 7 presents the outlet enthalpy distribution across tube groups under varying operational loads. Analysis reveals that the G1 tube exhibits the minimum outlet enthalpy value, demonstrating significantly reduced heat flux absorption compared to adjacent tubes. This thermal performance discrepancy originates from the peripheral positioning of the G1 tube within the membrane wall assembly, where increased radial distance from the combustion core results in attenuated radiation heat transfer intensity. Therefore, the G1 tube requires stagnation and reversal checkouts.
Figure 8 shows the values of stagnation DPR ( R s ) and reversal DPR ( R r ) of G1-1 to G1-18 under different loads. R s of the low tube G1-2 is 1.03, slightly lower than the critical value of 1.05, and the R r values of the G1-1 to G1-8 tubes range from 1.02 to 1.06, which is close to the critical value. The DPR at the remaining positions is much higher ( R s , max = 2.62 ,   R r , max = 1.55 ).
Combined with the statistical data of the overall DPR of the G1 tube group in Table 6 ( R s , total     1.85 , R r , total     1.22 ), a conclusion can be drawn that although the local DPR is close to the critical value, the overall DPR of the system always meets the engineering safety criterion of R > 1.05, indicating that risk of flow stagnation or reversal does not exist under the current design conditions. In order to further improve the operational reliability, the following optimization measures are recommended [37,38]: (1) Reduce the loop flow resistance by optimizing the tube layout and tube diameter matching; (2) and strengthen the downcomer steam-water separation device to prevent the phenomenon of steam carrying.

3.3. Hydrodynamic Analysis

Figure 9 and Figure 10 show the profiles of temperature, enthalpy, pressure, and dryness of the working fluid in the G6 tube along the height of the water wall at 330 MW load. Results show a phased change rule. The pressure inside the tube gradually decreases from the initial 17.80 MPa to 17.57 MPa, with a decrease of about 1.3%. In the height range of 0~4.4 m, the dryness of the working fluid remains 0, because the working medium is still in the single-phase liquid heating stage. The enthalpy value increases from the initial 2850 kJ/kg to 3050 kJ/kg, and the temperature increases from 355.97 °C to the saturation temperature 356.04 °C (corresponding to the pressure 17.78 MPa). When the working fluid rises to 4.4 m, it reaches saturation and enters the evaporation stage. Since then, the dryness shows a linear increasing trend, but due to the gradual decrease of pressure, the saturation temperature decreases slightly to 355.01 °C (corresponding pressure 17.57 MPa). Additionally, in the height range of 26.4~28.4 m, the high-speed jet of secondary air strengthens the combustion reaction between unburned gas (CO, H2) and residual carbon, resulting in a sharp rise in local furnace temperature, a significant increase in the radiation heat transfer intensity of the water wall, an increase in the growth rate of the enthalpy of the working fluid, and a rapid increase in the dryness from 0.1055 to 0.1308. In the area above 28.4 m, the combustion tends to be complete, and the flame temperature drops back, attenuating thermal transfer of the working medium. The final outlet temperature is 355.01 °C, and the dryness is 0.159, which is in line with the design expectation of the subcritical boiler.

3.4. Temperature Distribution Inside the Furnace

Figure 11 illustrates the temperature field of the vertical midplane of the furnace and six typical cross-sections (A~F) under the 330 MW load condition. Figure 11a reveals pronounced thermal stratification within the burner zone along the vertical furnace. Figure 11b demonstrates a progressive intensification of combustion dynamics, with mean temperatures in zones A–D ascending from 1768.6 K to 1956.2 K (ΔT = +187.6 K). This height-dependent thermal evolution confirms enhanced reaction kinetics in the primary combustion region. Subsequent secondary air injection induces turbulent mixing with ascending flue gases, resulting in a decrease in temperature. This is mainly because the secondary air temperature (design temperature 588.8 K) is lower than the flue gas temperature, reducing the average flue gas temperature. However, secondary air provides oxygen oxidizers, which promotes the combustion of a large amount of unburned carbon and unburned gas, increasing the gas temperature in cross section F to 1818.3 K. As the height of the furnace continues to rise, the temperature of the furnace gradually decreases. It can be further found from the cross-section temperature cloud diagram in Figure 11b that the temperature field exhibits a typical four-corner tangential distribution, the circumferential temperature gradient is the largest (ΔT ≈ 480 K∙m−1), with a high-temperature zone around the outlet of the combustors (peak temperature > 2100 K). Meanwhile, the temperature field at the hypothetical tangent circle position is uniform (ΔT < 50 K∙m−1), indicating that the airflow rotates fully and the flame fills well. It is worth noting that local high temperature areas (T > 1850 K) exist in the middle of the walls on both sides section D, which may induce the risk of ash melting and coking and high temperature corrosion of FeS, which needs to be alleviated by optimizing the air distribution or adding wall soot blowing device.

3.5. High Temperature Corrosion

Sulfur in coal combustion in the furnace mainly generates SO2, H2S, which constitute the primary contributors to high-temperature sulfur corrosion on heat-transfer surfaces [39]. The water wall usually has a continuous three-layer oxidation protective film (Fe2O3 → Fe3O4 → FeO) from the surface to the inside. H2S will react with Fe2O3 and produce a certain crack, so that H2S can continue to react with FeO as follows:
FeO + H 2 S     FeS + H 2 O
After the oxide film is destroyed, H2S can react with the substrate Fe to form FeS:
Fe + H 2 S     FeS + H 2
In addition, if there is a certain concentration of SO2 and H2S in the area near the metal tube, [S] can be generated:
2 H 2 S + SO 2     2 H 2 O + 3 [ S ]
H2S can also react with oxygen to form [S]:
2 H 2 S + O 2     2 H 2 O + 2 [ S ]
Free [S] can directly penetrate the oxide film, penetrate into the interior, and react with the matrix iron. The chemical reaction equation is:
Fe + S     FeS
The spatial distribution of SO2 and H2S species at water-cooled wall interfaces directly governs the thermodynamic propensity and progression rate of high-temperature corrosion (HTC). Quantitative characterization to mass fraction of corrosive gas near wall enables predictive assessment of HTC risks, forming the basis for implementing targeted passivation strategies in boiler combustion systems.
Figure 12 and Figure 13 show the spatial distribution characteristics of SO2 and H2S mass fractions in the front and right walls of the furnace under different load conditions. The results illustrate that the mass fractions of SO2 and H2S increase significantly with boiler load rising (R2 > 0.92). This is because the improvement of thermodynamic conditions accelerates the reaction rate between activated molecules, promoting the formation of SO2 and H2S. Additionally, taking Figure 12a as an example, SO2 is mainly concentrated on the wall area of the upper and middle burners, and the peak mass fraction (0.120%) appears near the burner, which is closely related to the high temperature turbulent mixing in the main combustion zone. H2S is mainly distributed in the area between the secondary air and the main burners, but its mass fraction peak (0.0524%) is still located in the near wall area of the burners. This is due to the low local oxygen concentration at the interface between the secondary air and the main burners, forming a strong reducing atmosphere, which provides favorable thermodynamic conditions for the formation of H2S. Meng et al. [40] also found that with the decrease of oxygen concentration in flue gas, the reducibility of flue gas was enhanced, which would promote the formation of H2S. Based on the above analysis, the wall area between the secondary air nozzles and the main combustors is regarded as a high-risk area of HTC. To alleviate this problem, the wall-attached air technology is recommended to be employ to improve the local oxidation environment through trace oxygen supplementation on the side of the furnace, while taking into account the optimization of low-load combustion stability and thermal efficiency [41,42,43,44].

4. Conclusions

Based on the three-dimensional numerical simulation method, this study systematically analyzes a 330 MW tangentially pulverized coal boiler through multi-physical field coupling calculation, and reveals the correlation mechanism between combustion structure, hydrodynamic characteristics, and corrosion risk in the tangentially pulverized coal boiler. It provides a theoretical basis for optimizing combustion parameters, improving water wall safety and prolonging boiler life. The main conclusions are as follows:
(1)
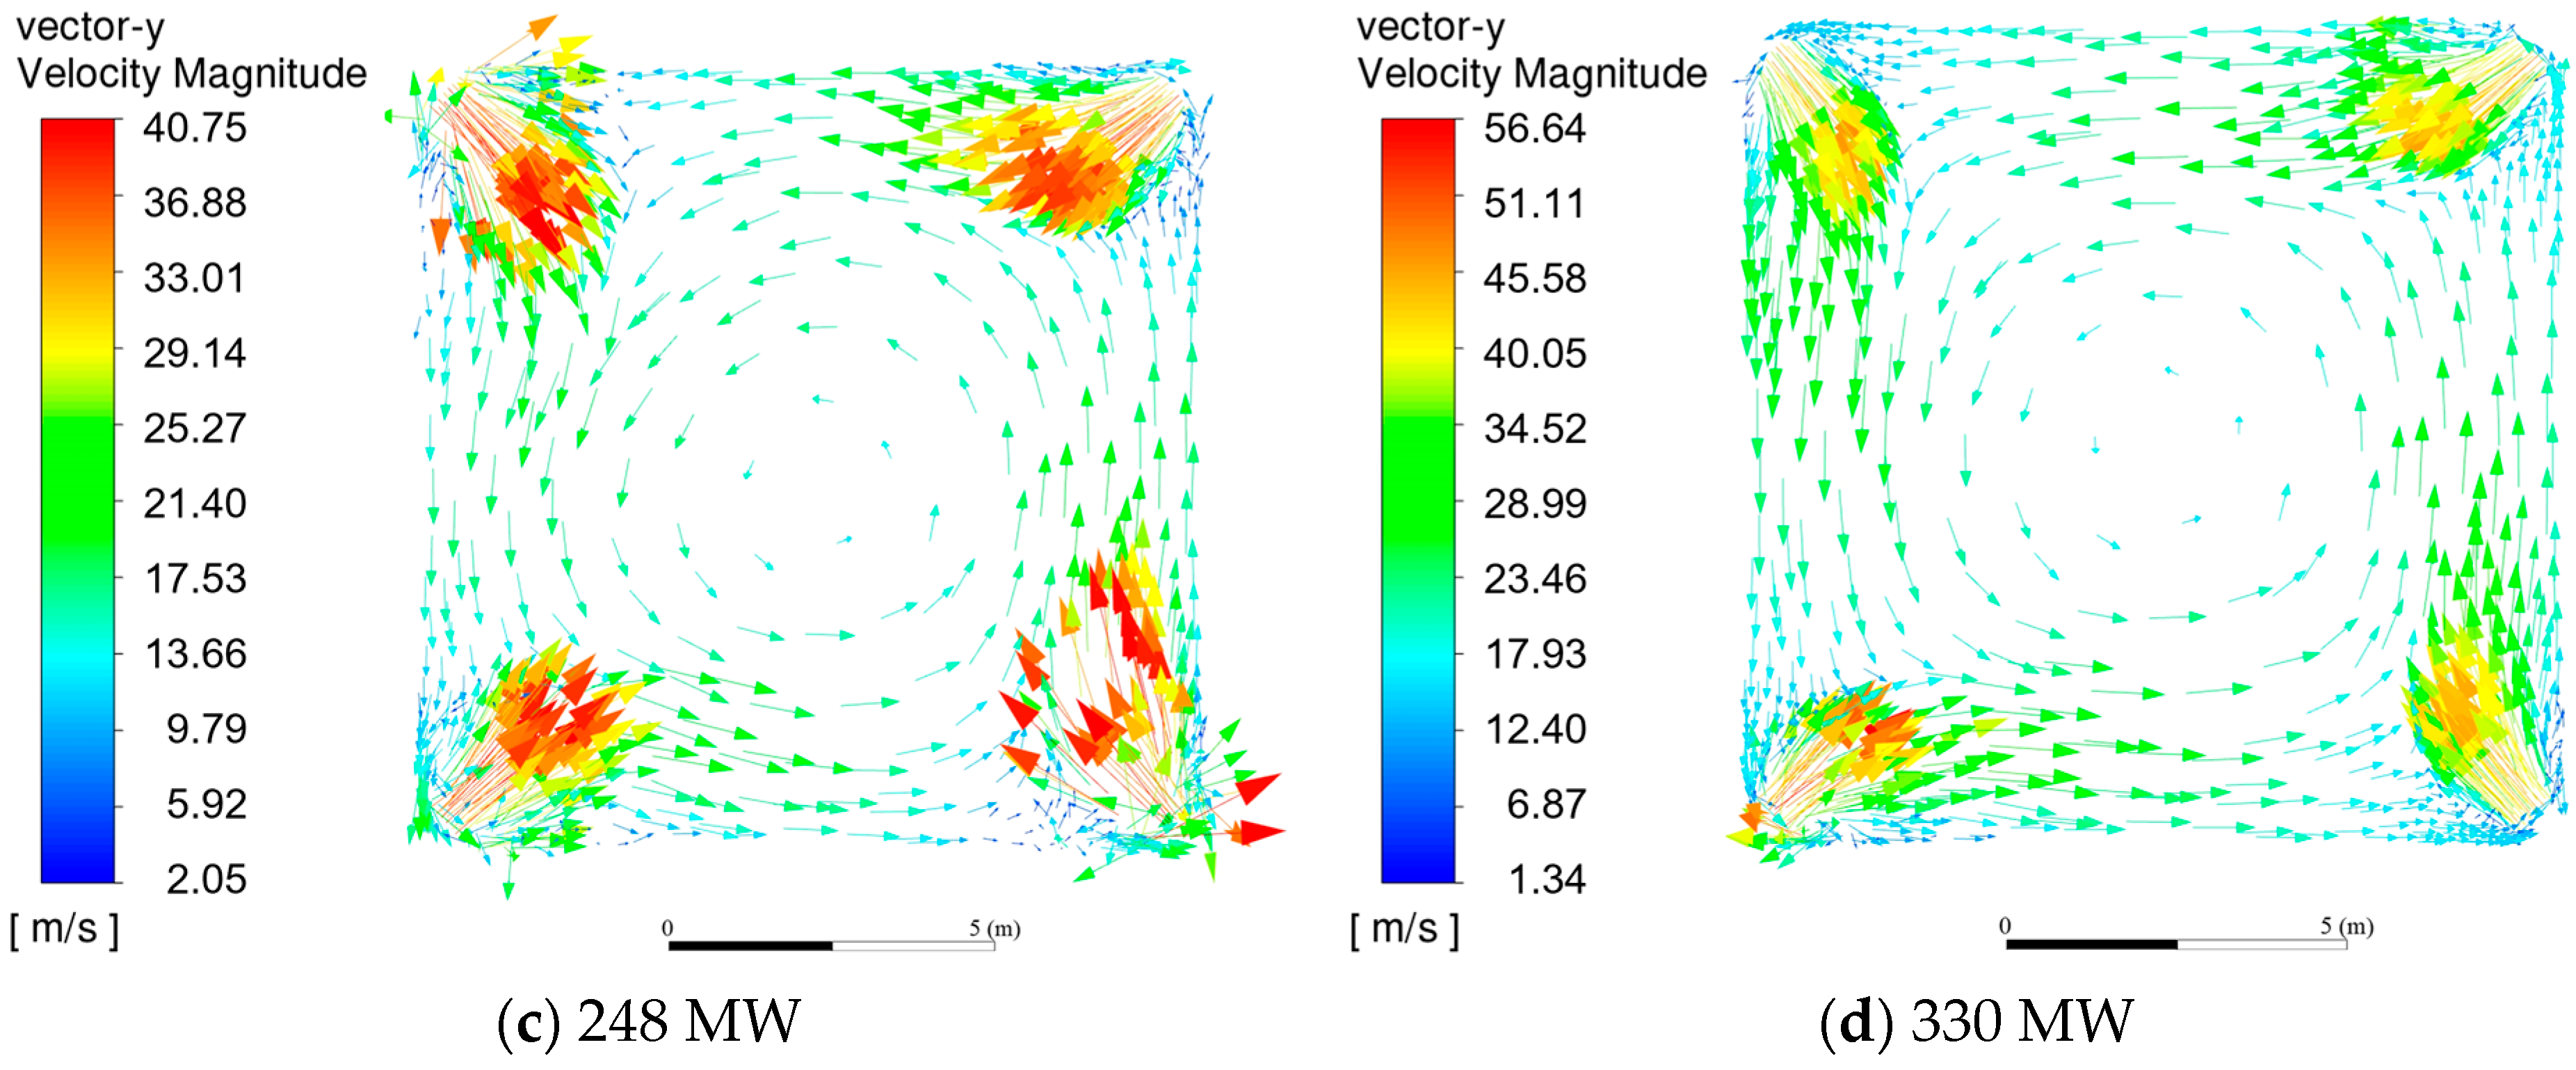
The flue gas in the furnace can form a tangent circle under different loads, and the furnace is full. At low loads (113 MW, 166 MW), the swirl intensity of the airflow is low, and the jet deflection of the burner is not obvious. At high loads (248 MW, 330 MW), the trend of air flow rotation is enhanced. In particular, at 330 MW load, the risk of flame scouring the water wall is significantly increased. It is recommended to balance combustion stability and safety by optimizing the imaginary tangent circle diameter.
(2)
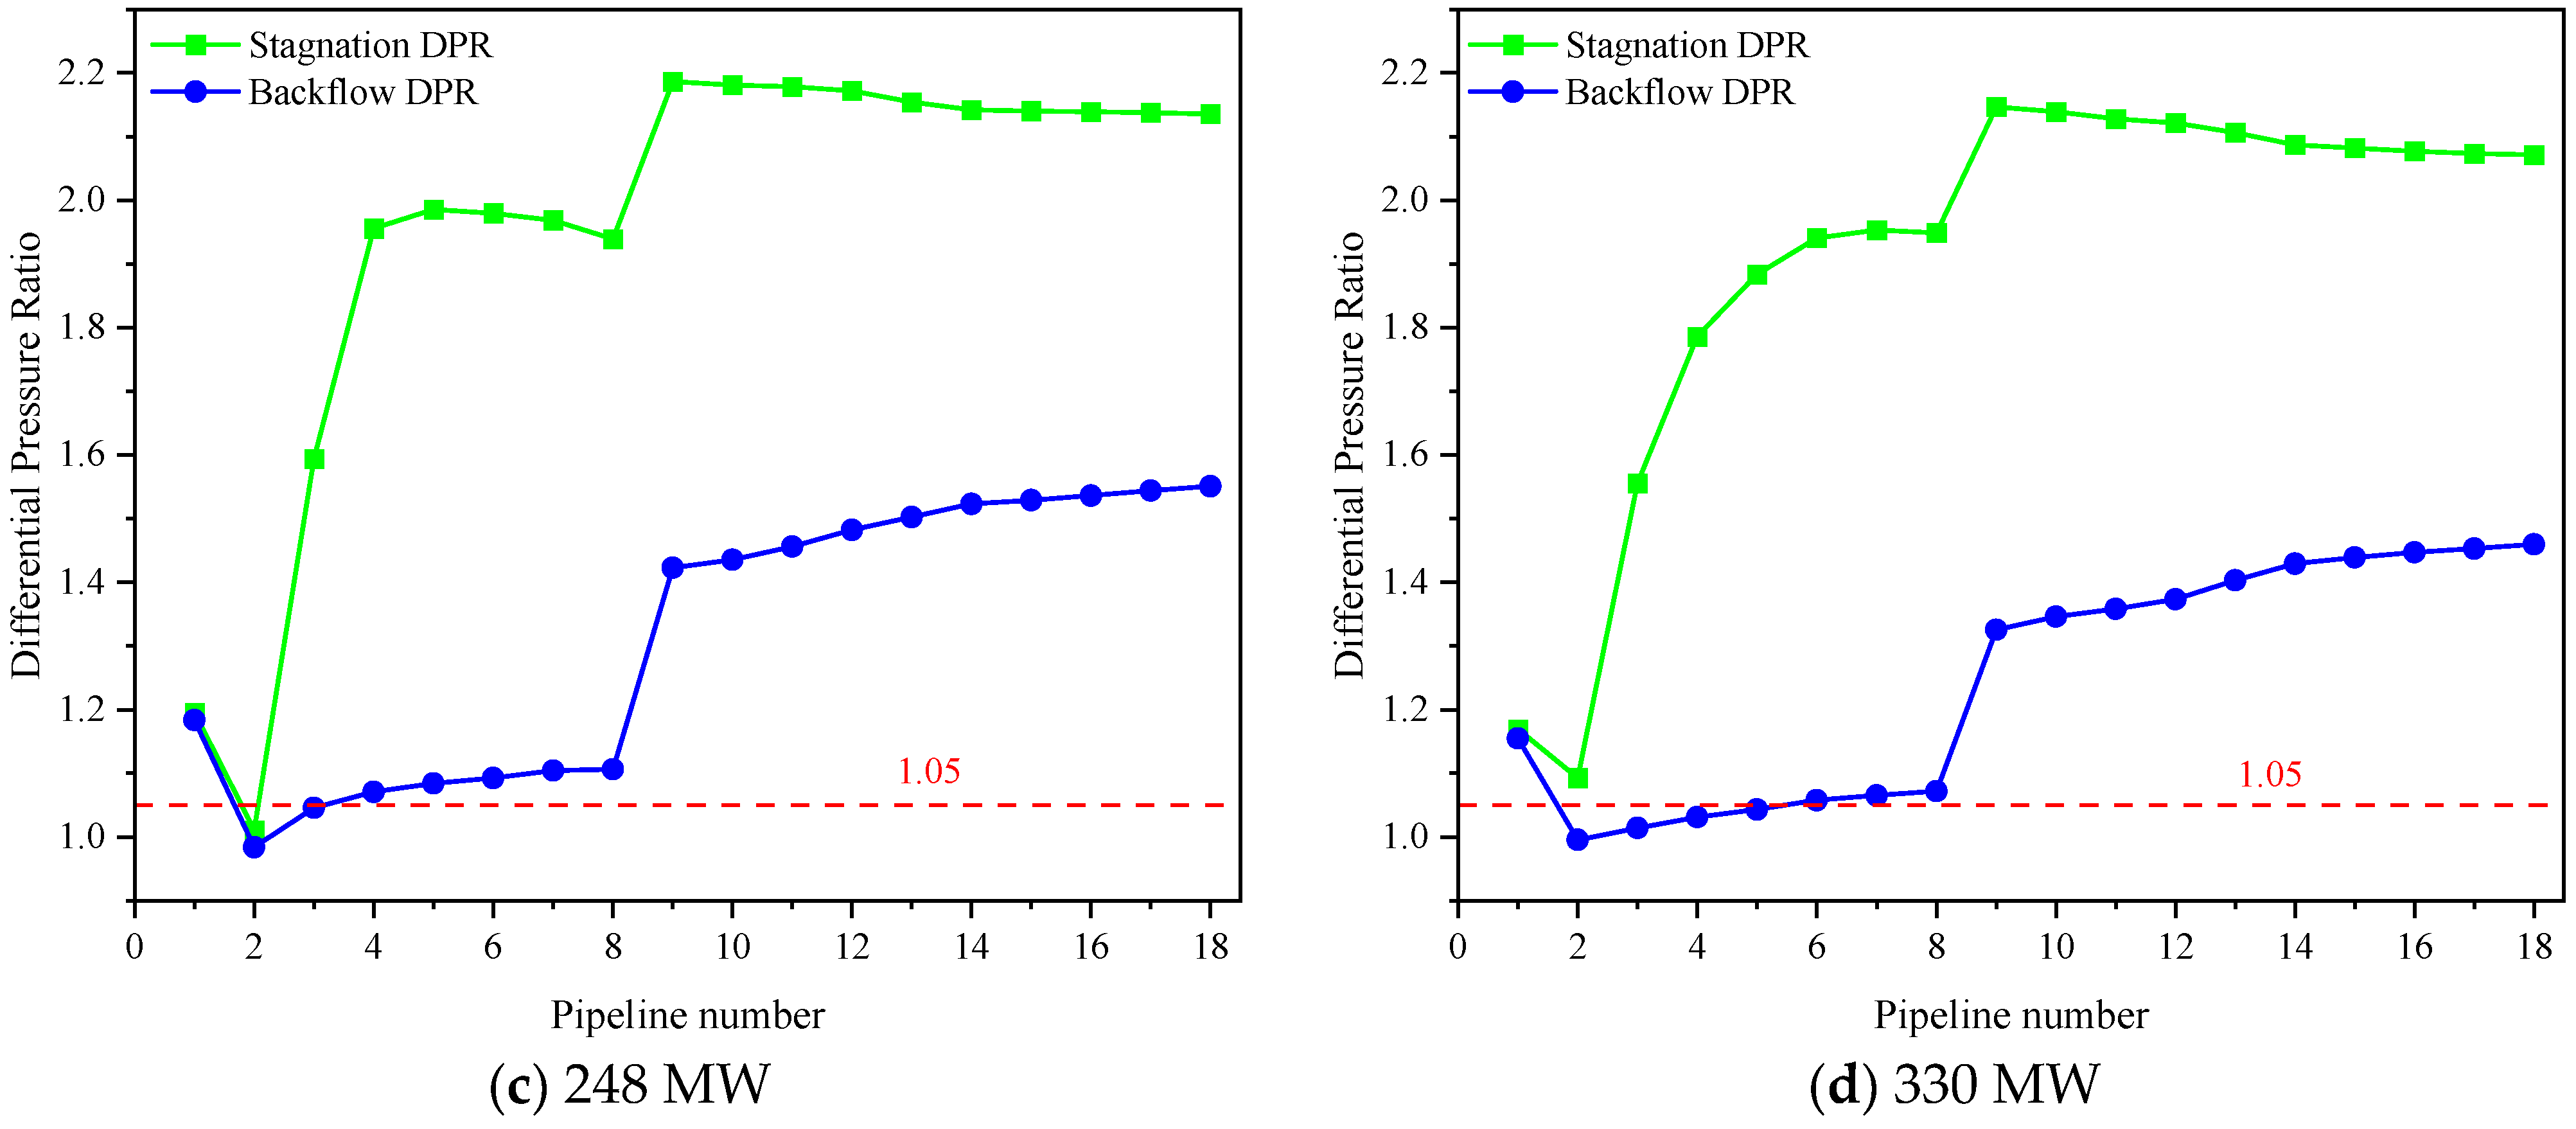
Due to the weakest heating of the right wall G1 tube group, the stagnation and reversal DPR of the local tubeline is close to the critical value of 1.0, but the overall DPR (stagnation DPR ≥ 1.85, reversal DPR ≥ 1.22) is higher than the safety threshold of 1.05, indicating that there is no flow anomaly in the water wall circuit under the current design. It is recommended to further improve safety by reducing the flow resistance of the loop or optimizing the design of the downcomer.
(3)
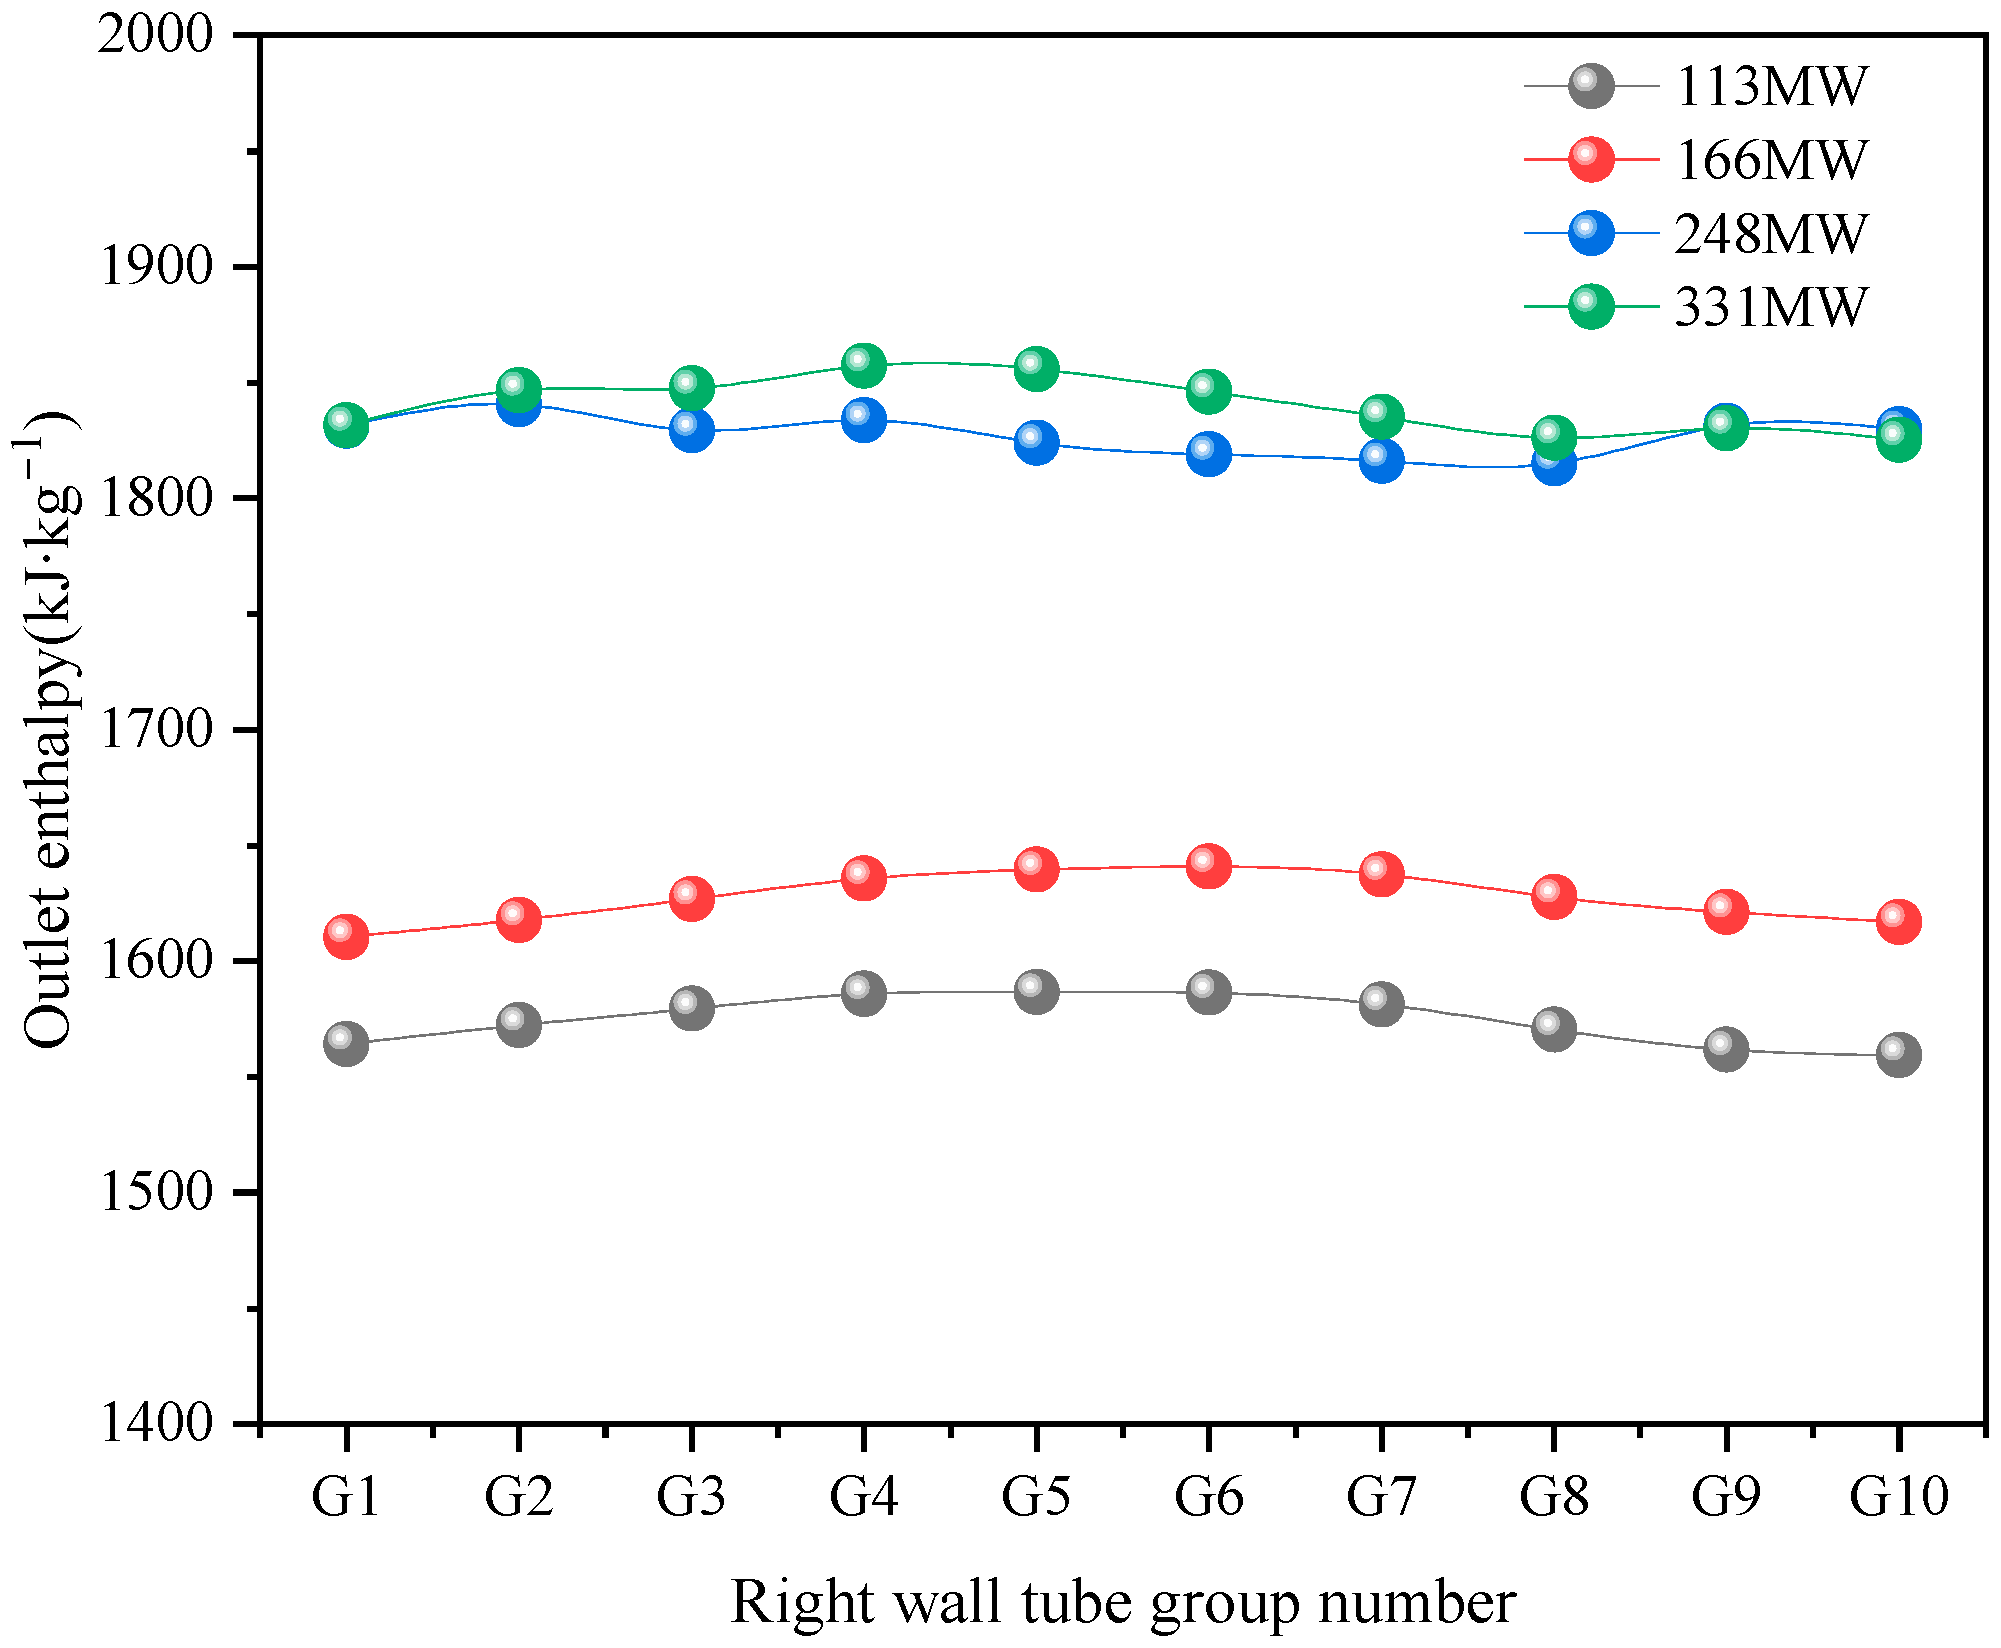
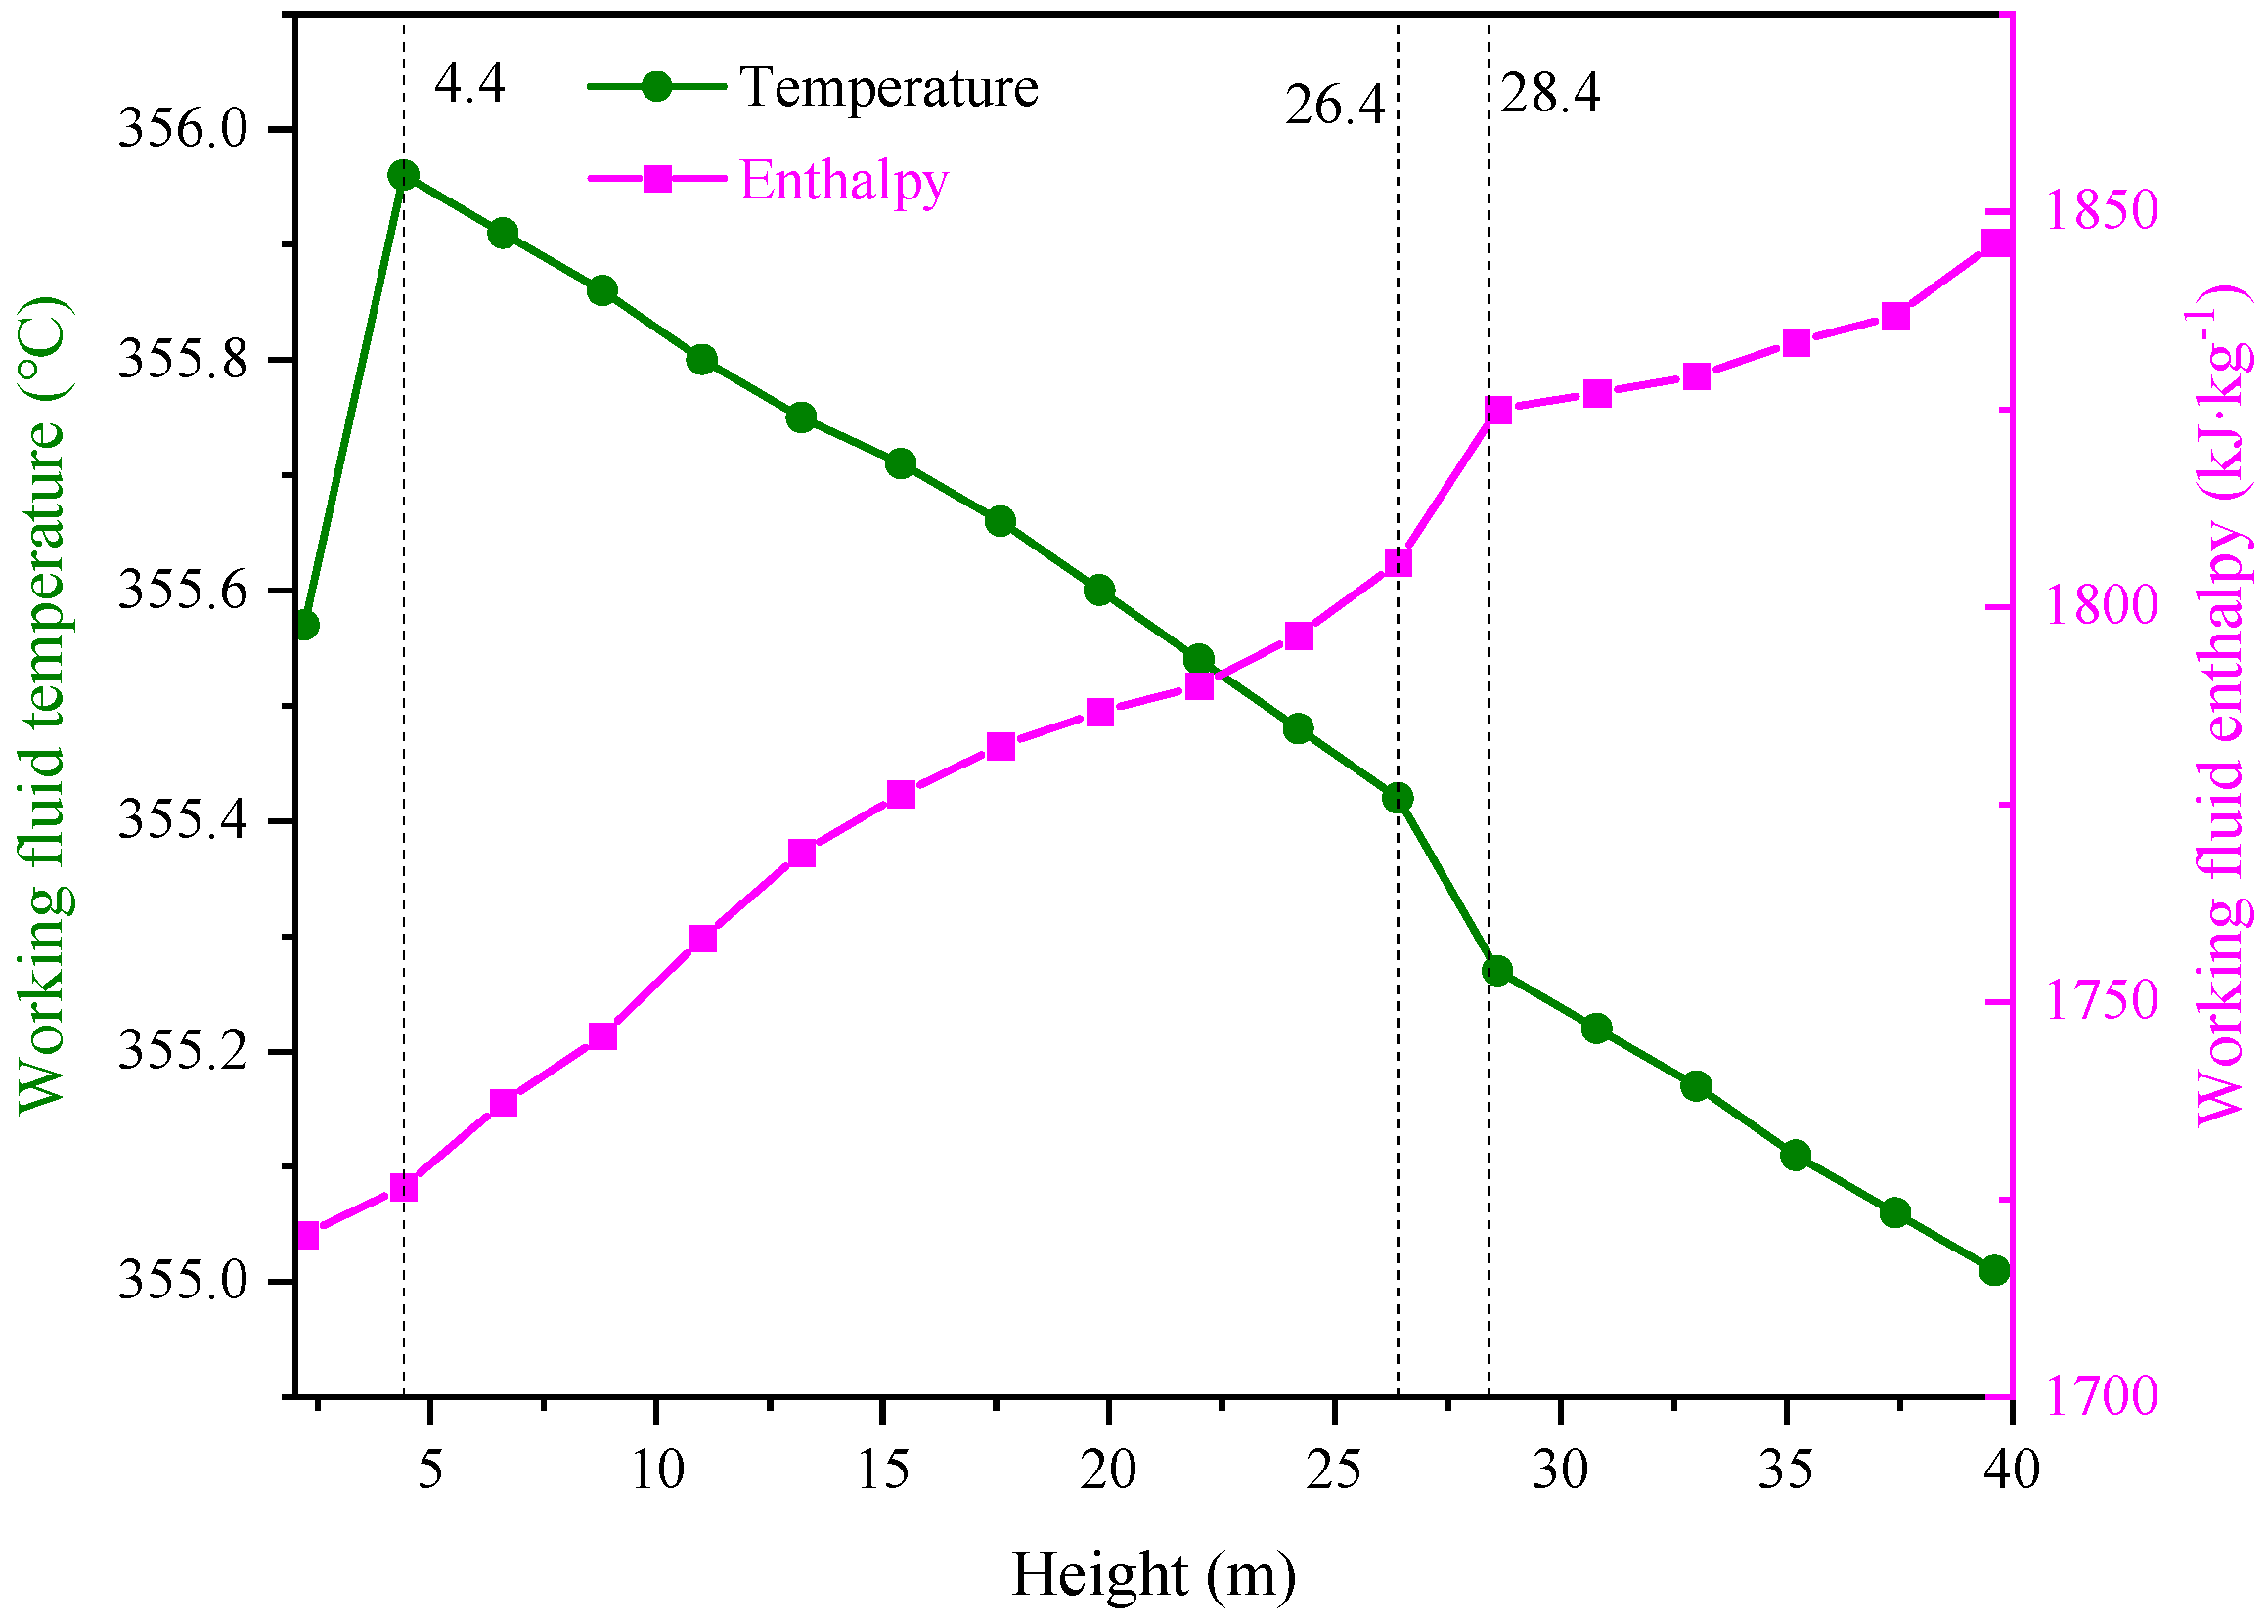
Under high load (330 MW), the working fluid of the G6 tube group undergoes heating, evaporation, and overheating stages along the furnace height, and the outlet dryness reaches 0.159. The temperature and pressure changes of the working fluid conform to the characteristics of the natural circulation boiler. The local temperature rises sharply after the secondary air is added, indicating that the combustion structure has a significant effect on the heat transfer characteristics of the water wall.
(4)
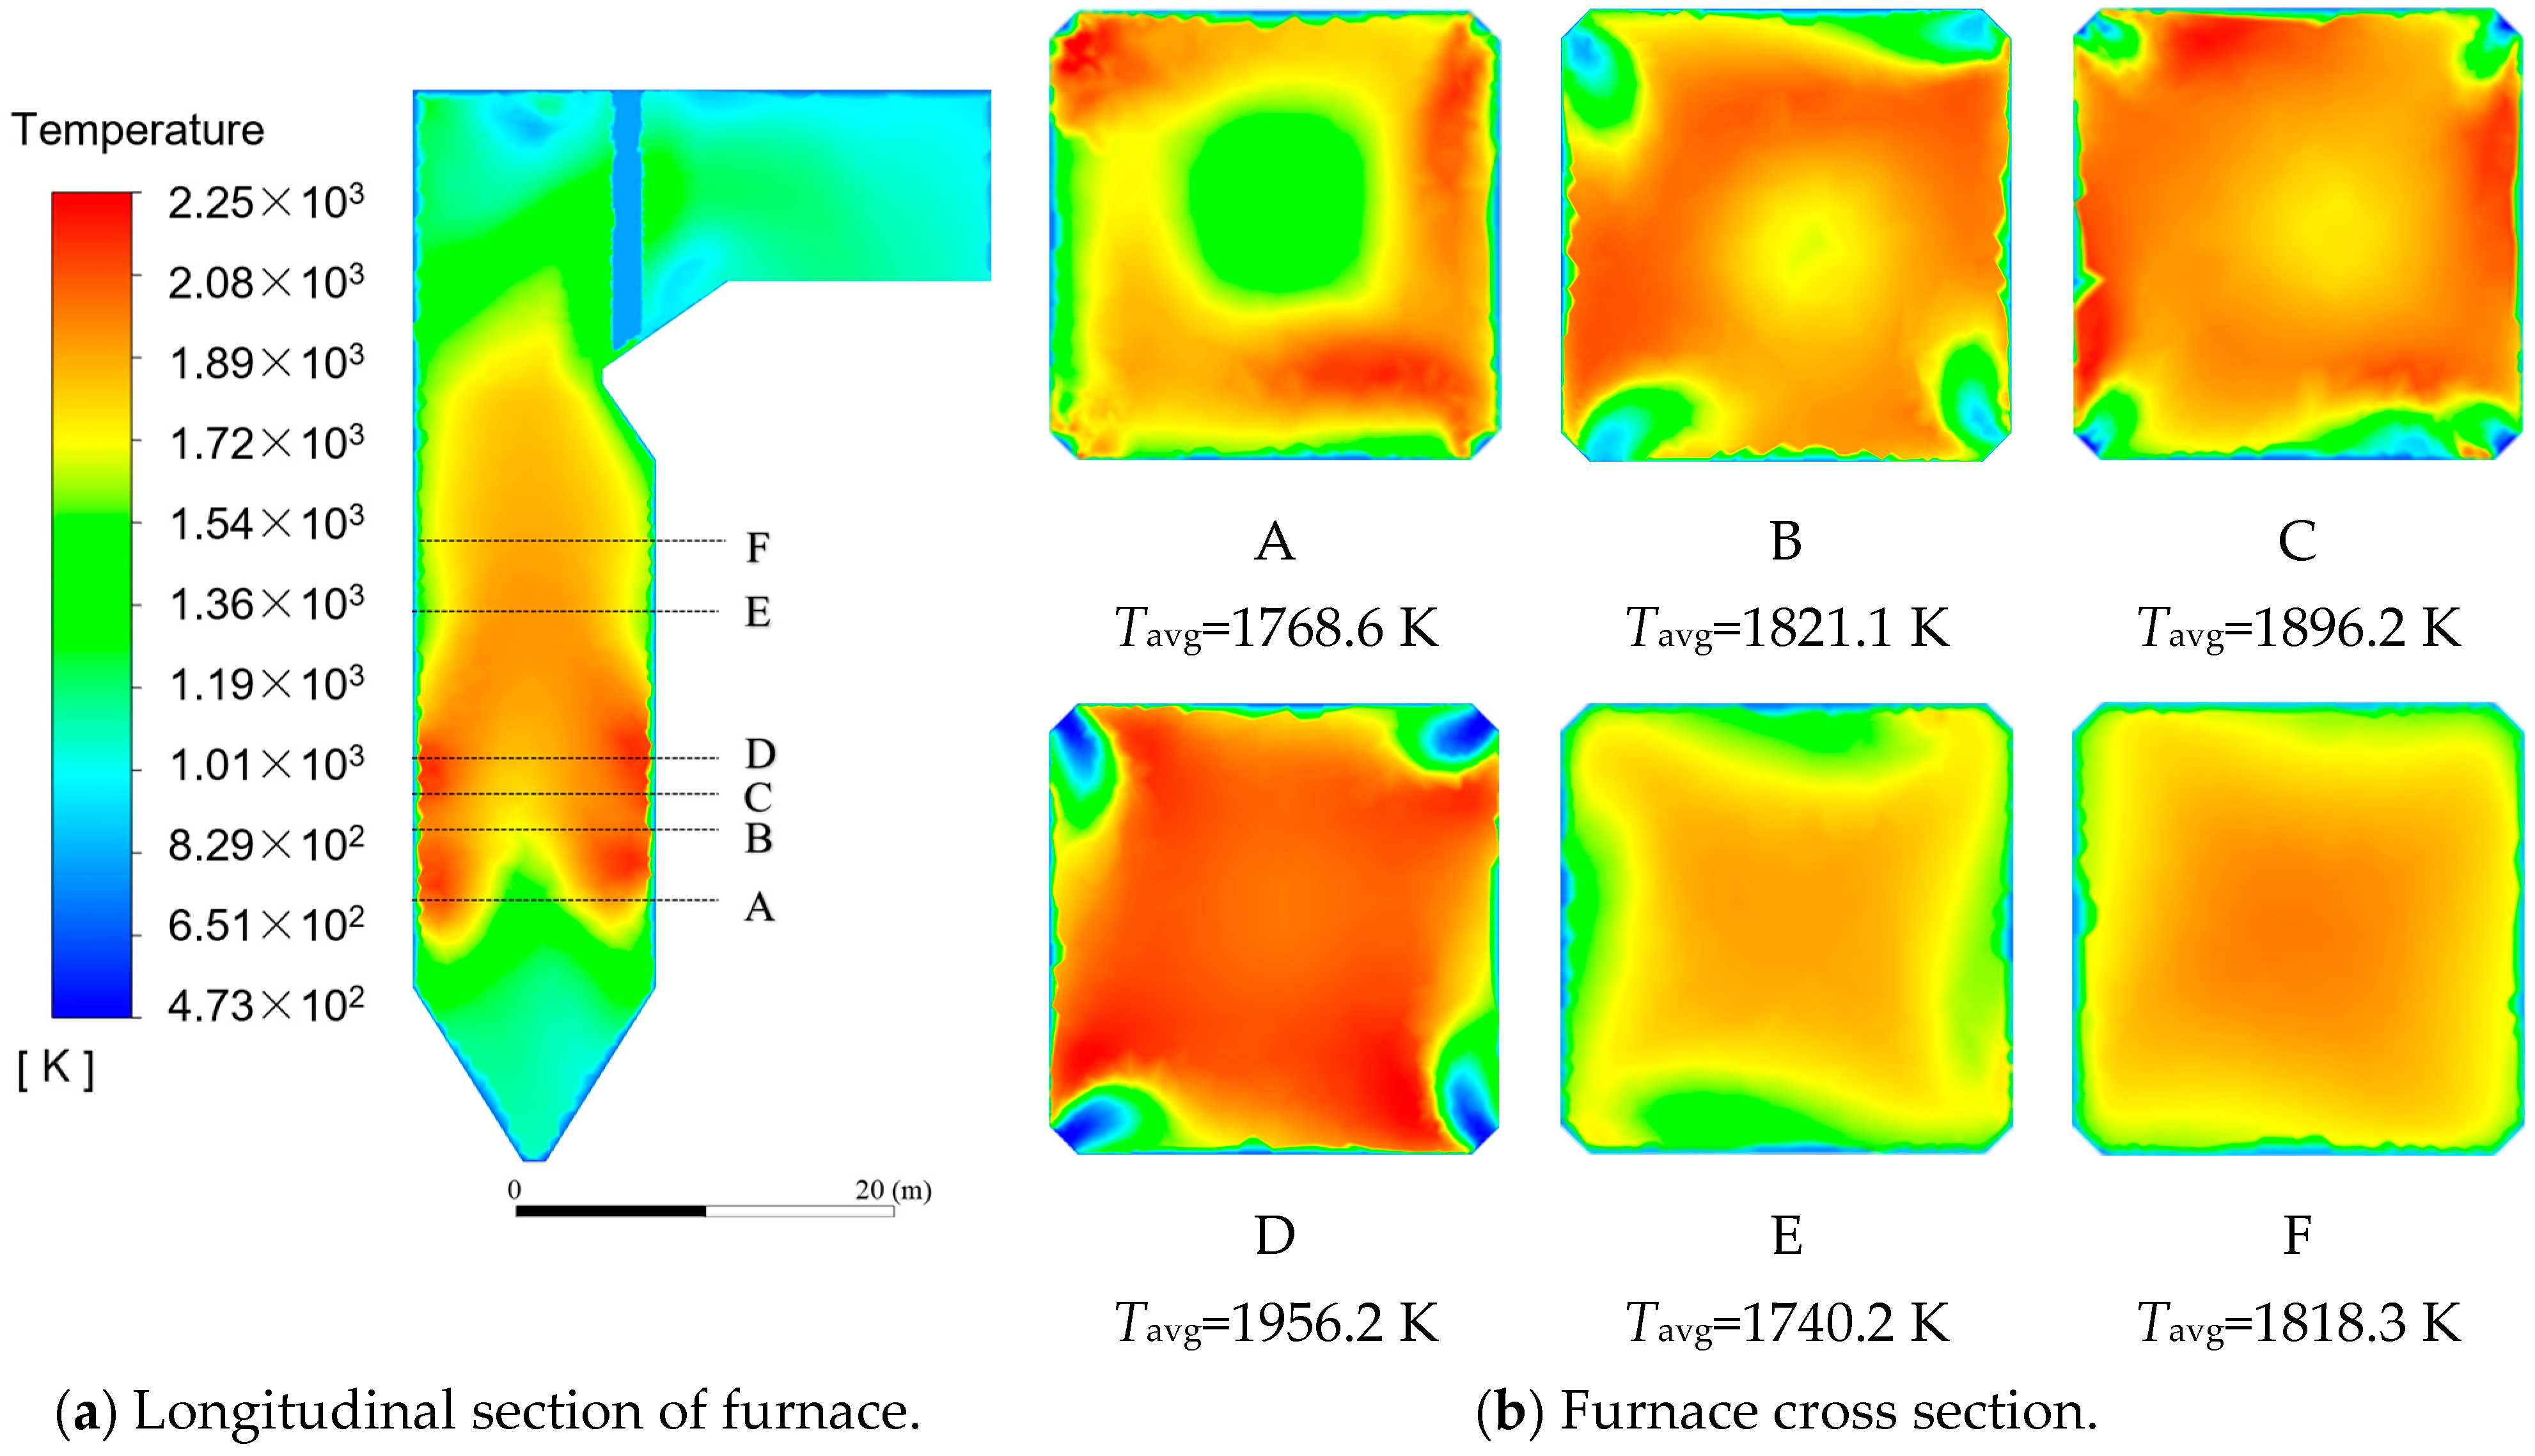
The temperature of the cross sections exhibits a typical tangential distribution, and the temperature gradient in the burner area is the largest (up to 1956.2 K). However, the cross-section D shows that there is a local high temperature zone (>1900 K) in the middle of the walls on both sides, which may cause coking and HTC. It is recommended to mitigate the risk by optimizing the secondary air ratio or strengthening the wall blowing.
(5)
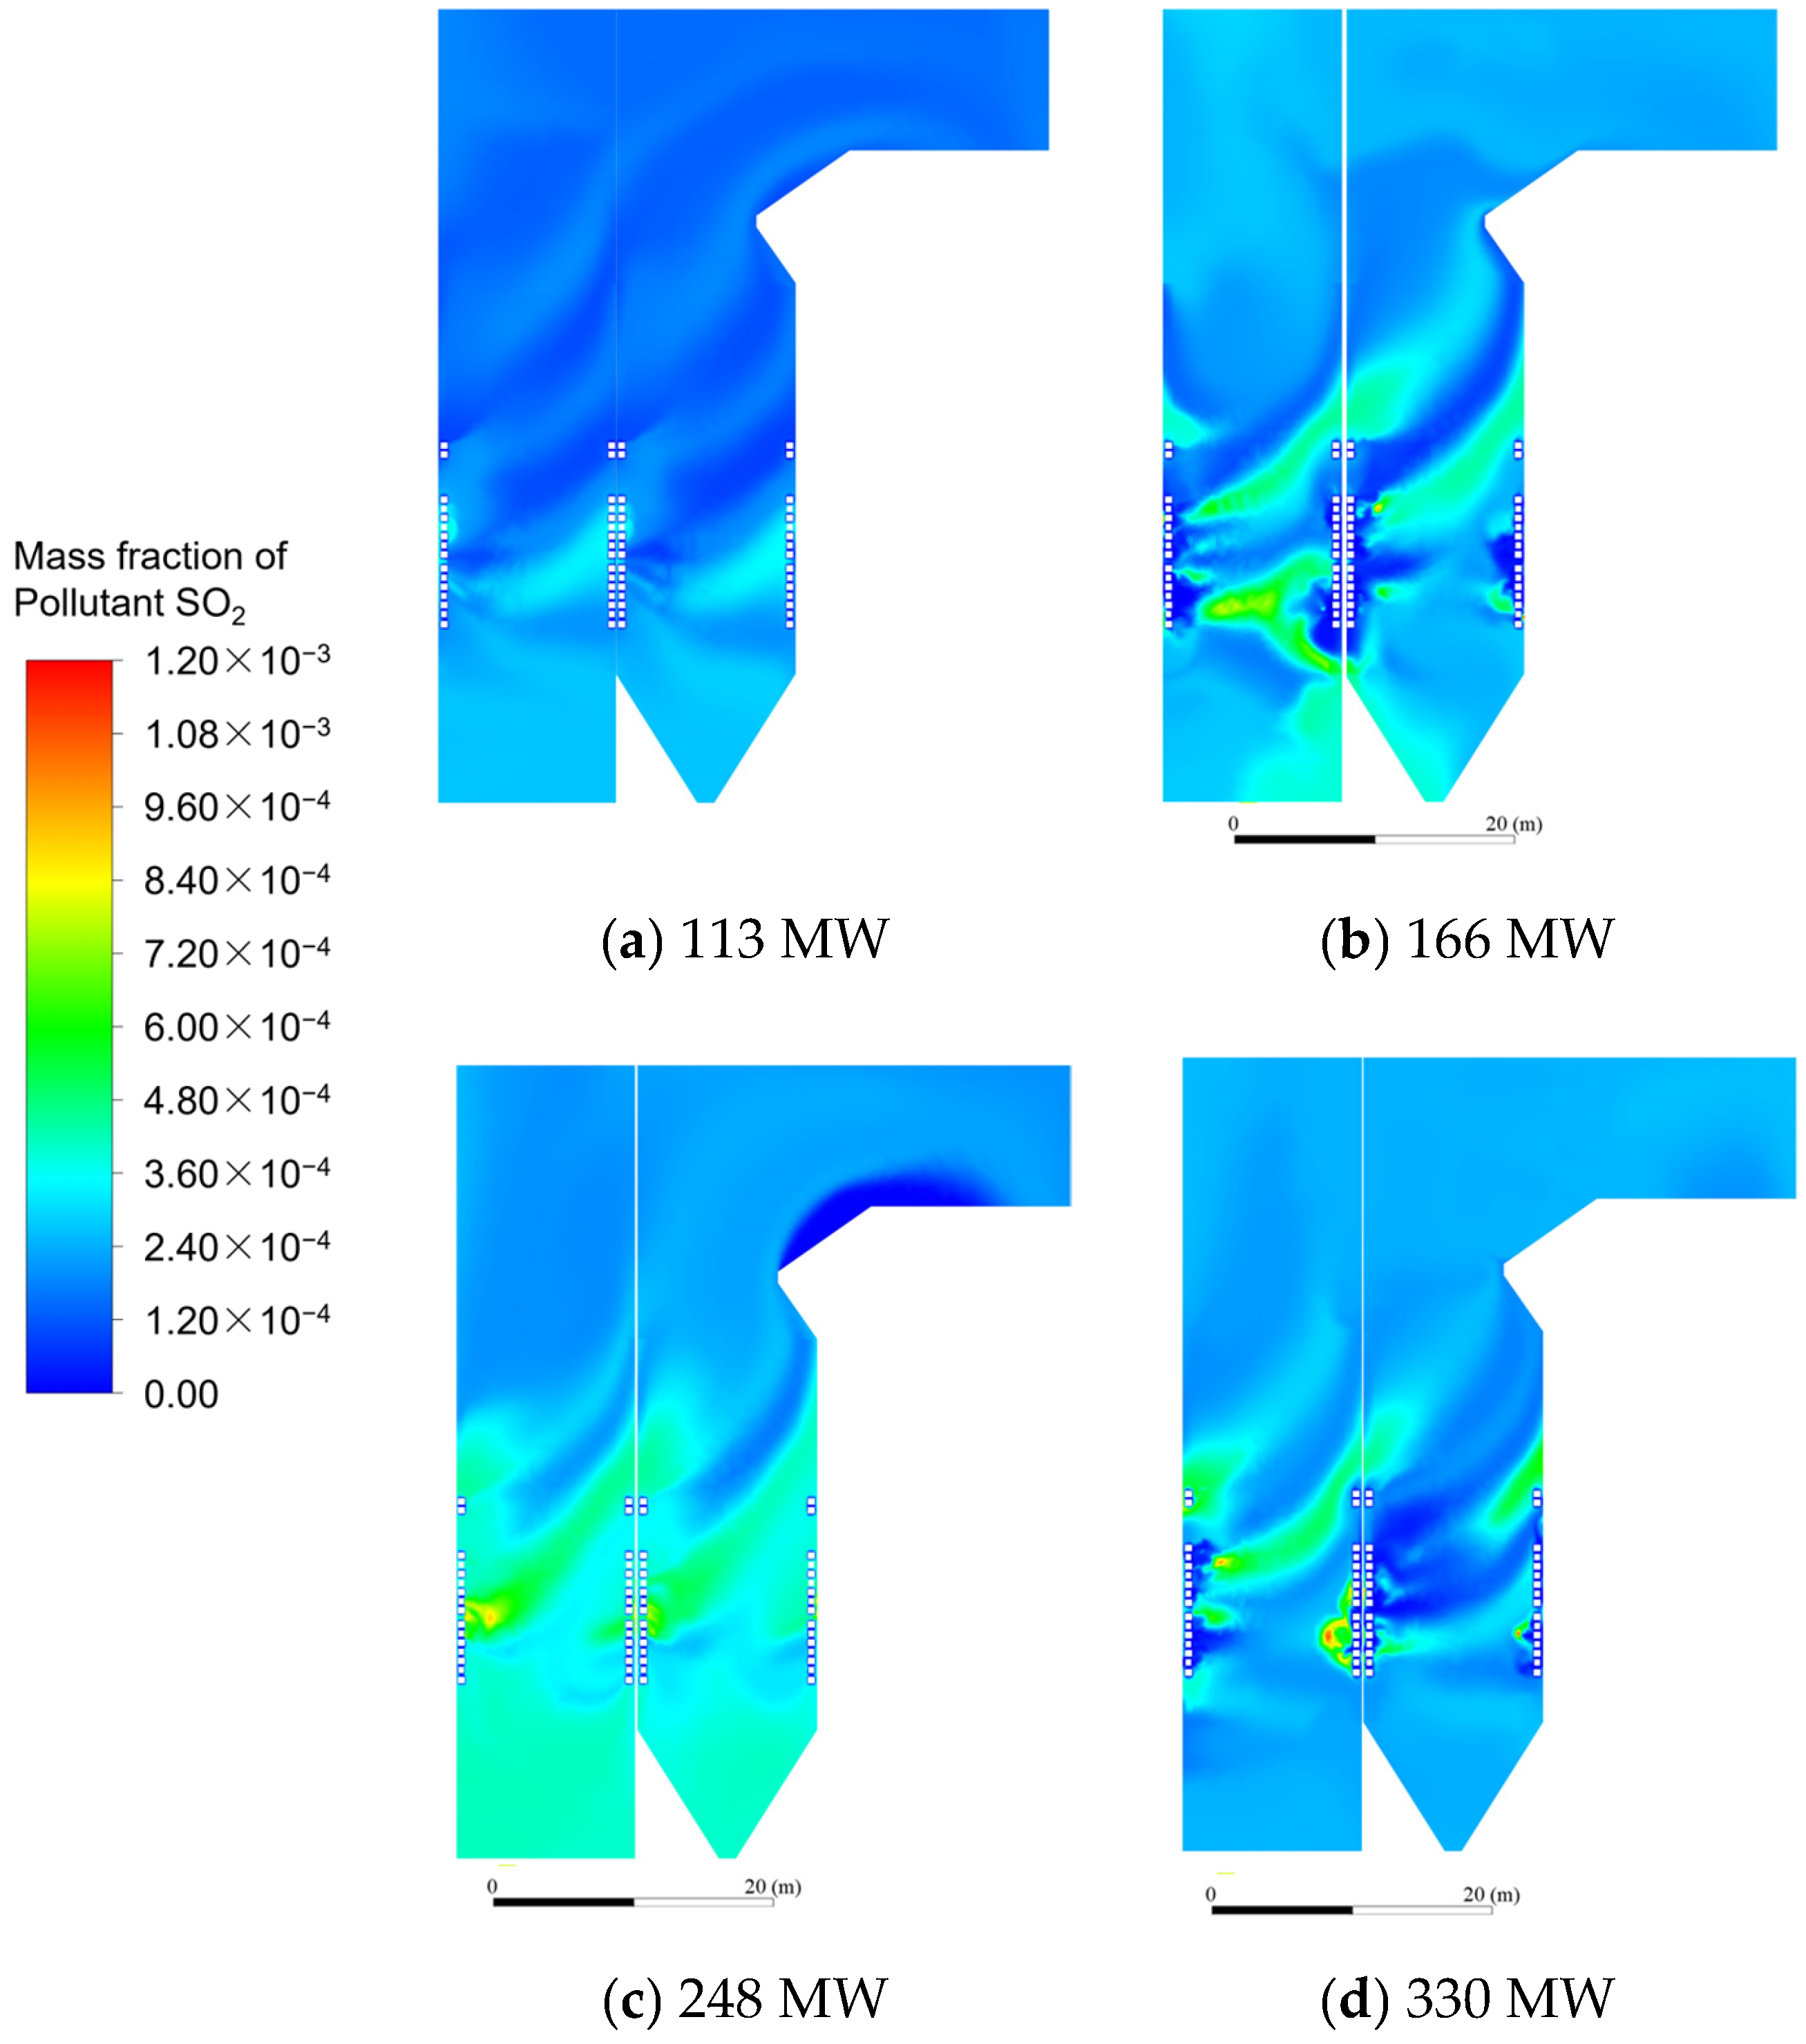
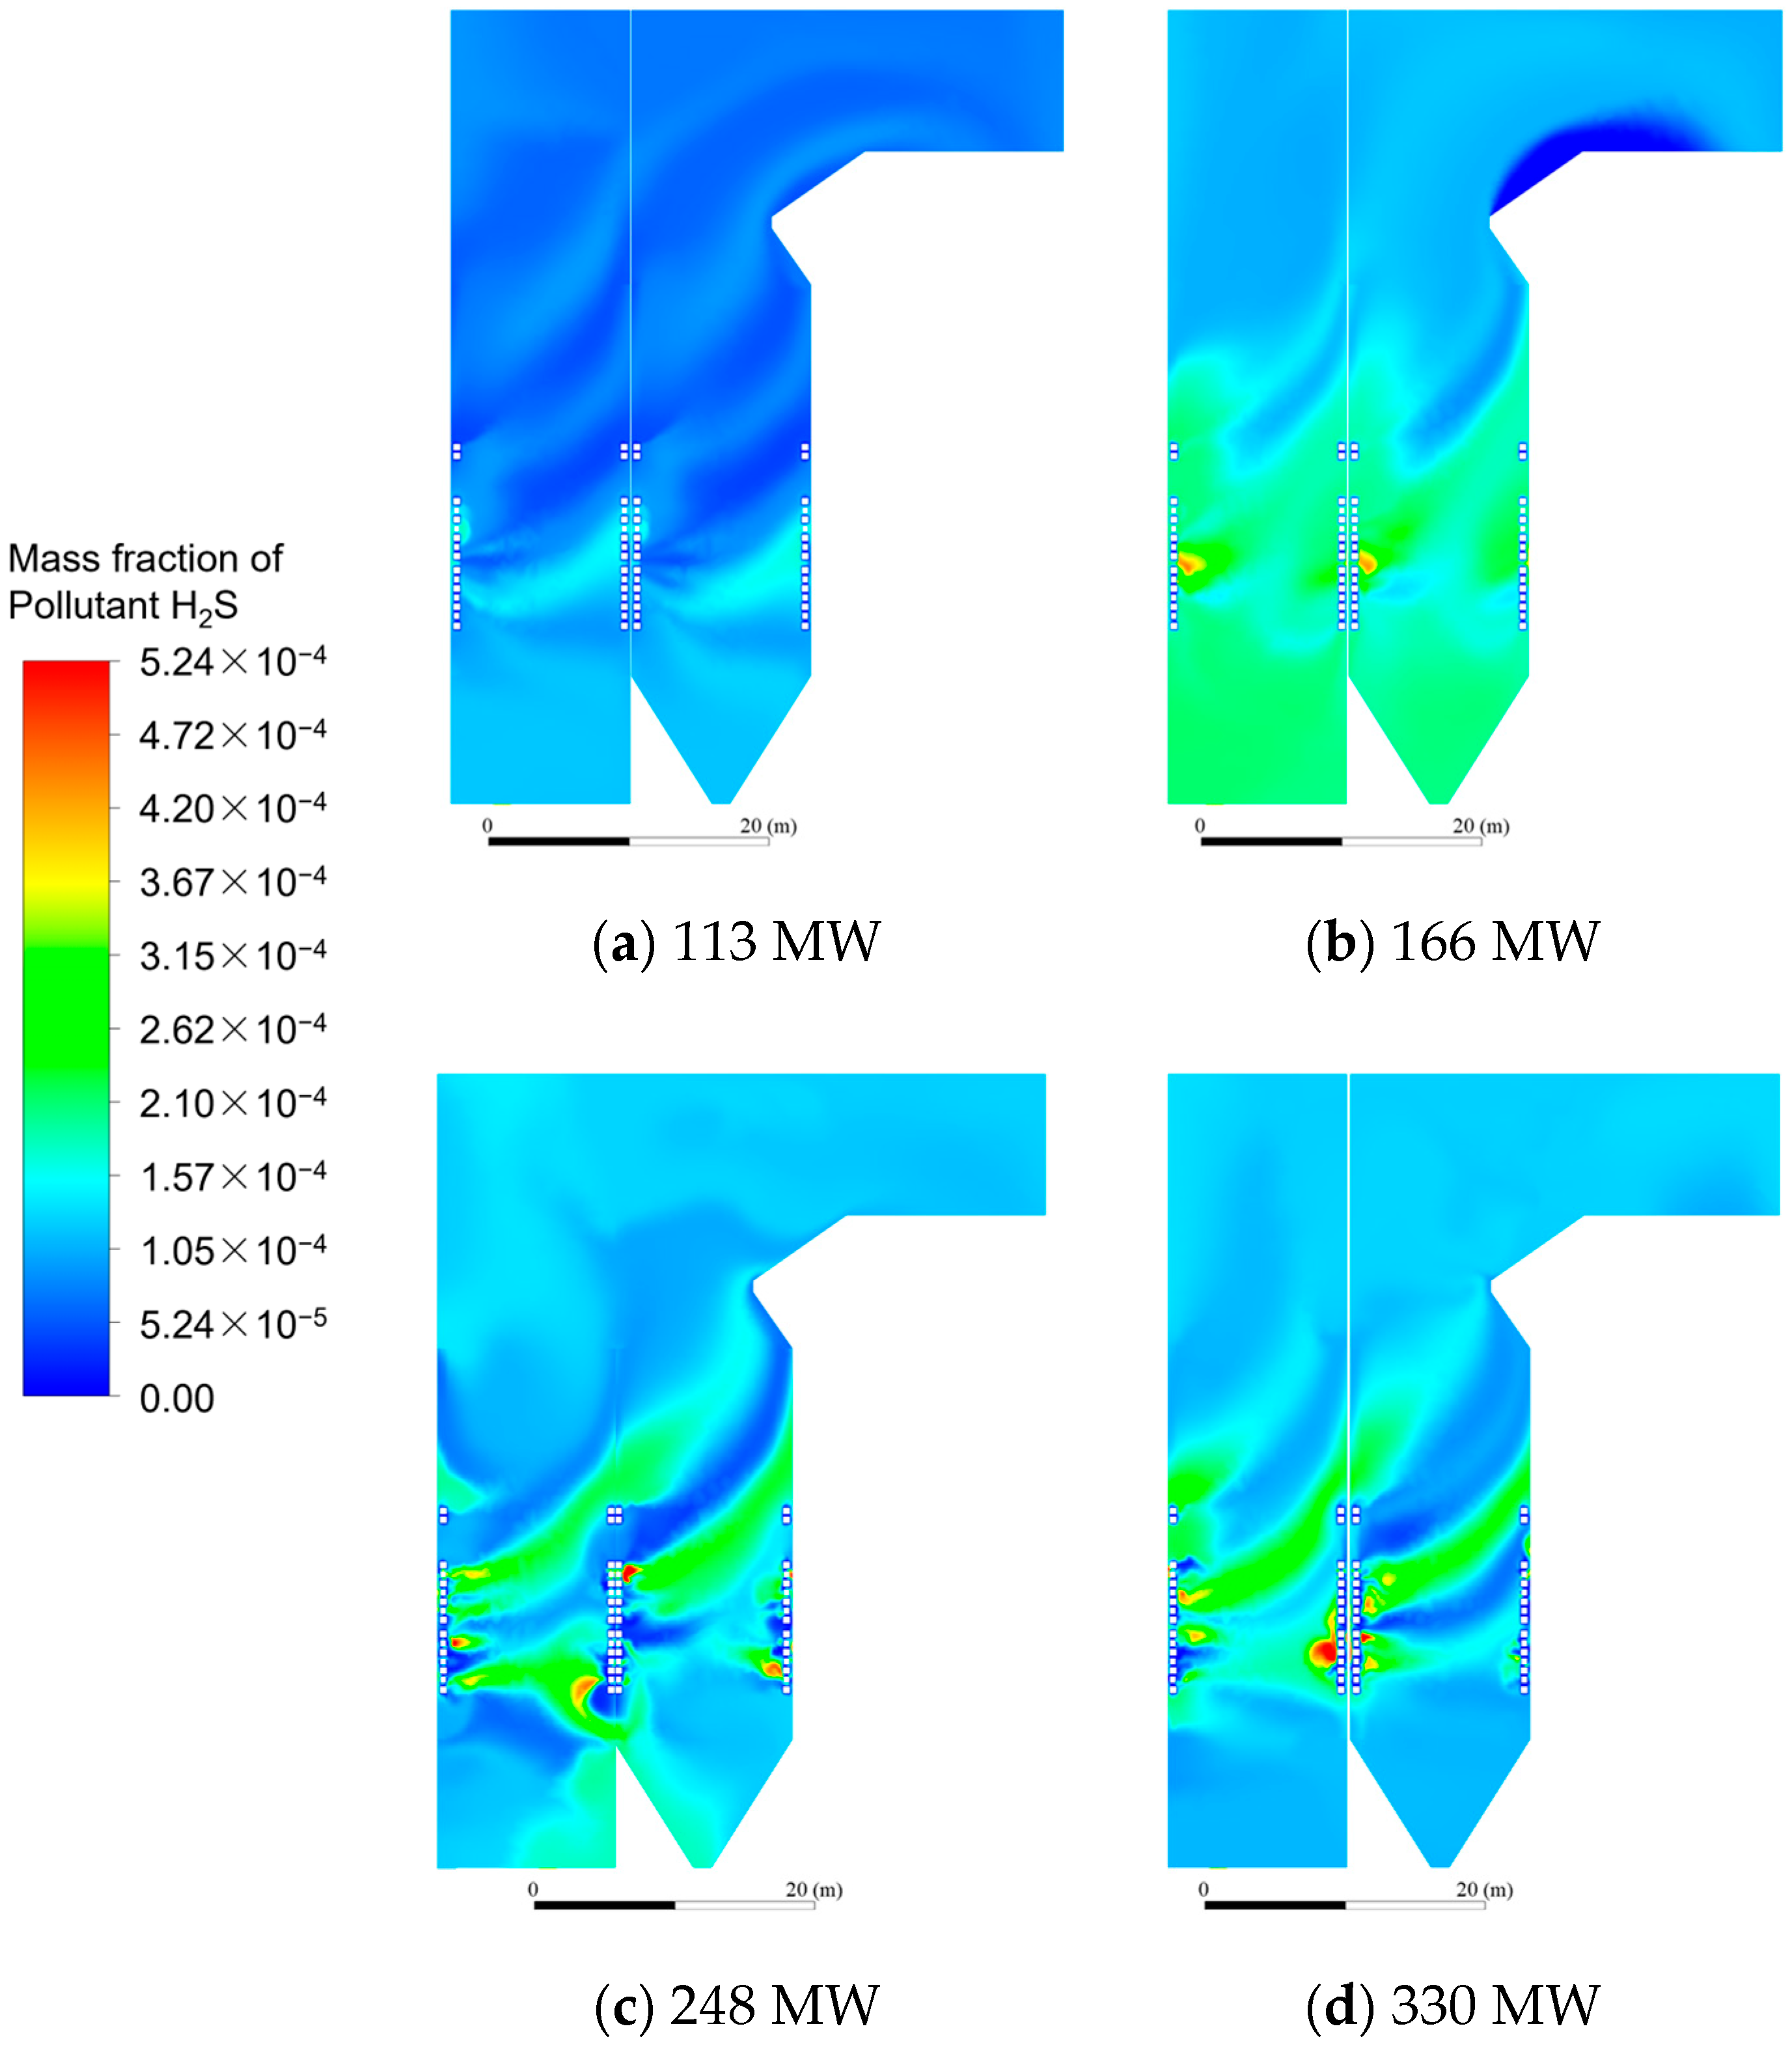
The mass fractions of SO2 and H2S, as the primary sulfide species responsible for high-temperature corrosion, show a positive correlation with boiler load. At 330 MW operating conditions, maximum concentrations of SO2 (0.120%) and H2S (0.0524%) are observed near combustor nozzles and in the secondary air zones, respectively. Local reducing atmospheres are found to enhance H2S formation. Implementing auxiliary air injection in secondary air regions may effectively mitigate corrosive gas accumulation while maintaining combustion efficiency.

Author Contributions

L.S.: Investigation, Data curation, Methodology, Writing—original draft. M.W.: Conceptualization, Writing—review & editing. P.C.: Investigation, Data curation, Writing—original draft. Y.S.: Conceptualization, Writing—review & editing. L.D.: Conceptualization, Supervision, Investigation, Writing—review & editing. All authors have read and agreed to the published version of the manuscript.

Funding

This research was funded by [the National Key R&D Program, China] grant number [2021YFF0600601].

Data Availability Statement

Data will be made available on request.

Conflicts of Interest

Authors Lijun Sun and Miao Wang were employed by the company Huayuan Power Plant, State Grid Energy Hami Coal and Power Co., Ltd. Author Peian Chong was employed by the company Shanghai Power Equipment Research Institute Co., Ltd. The remaining authors declare that the research was conducted in the absence of any commercial or financial relationships that could be construed as a potential conflict of interest.

References

  1. The National Energy Administration Released the National Power Industry Statistics for 2024—National Energy Administration. Available online: https://www.nea.gov.cn/20250121/097bfd7c1cd3498897639857d86d5dac/c.html (accessed on 7 March 2025).
  2. Renewable Energy Grid-Connected Operation in 2024—National Energy Administration. Available online: https://www.nea.gov.cn/20250221/e10f363cabe3458aaf78ba4558970054/c.html (accessed on 7 March 2025).
  3. Zhu, M.X.; Lu, H.; Zhao, W.J.; Huang, S.W.; Chang, X.Q.; Dong, L.J.; Kong, D.; Jing, X.H. A Numerical Study of Ash Deposition Characteristics in a 660MW Supercritical Tangential Boiler. Adv. Theor. Simul. 2023, 6, 2300133. [Google Scholar] [CrossRef]
  4. Belosevic, S.; Tomanovic, I.; Crnomarkovic, N.; Milicevic, A. Full-scale CFD investigation of gas-particle flow, interactions and combustion in tangentially fired pulverized coal furnace. Energy 2019, 179, 1036–1053. [Google Scholar] [CrossRef]
  5. Wang, H.P.; Deng, S.S.; Ti, S.G.; Jin, H.Z.; Yang, Z.; Gao, K.; Wu, X.H.; Liu, S.Y.; An, J.X.; Sheng, R.R. Experimental combustion characteristics and NOx emissions for a 600-MWe utility boiler after the retrofitted: Effects of load variation. Asia-Pac. J. Chem. Eng. 2024, 19, e3092. [Google Scholar] [CrossRef]
  6. Liu, P.; Zhang, W.; Chu, W.; Zhou, M. Combustion modification of expanded coal adaptability in ultra-small section circle-fired boiler. Clean Coal Technol. 2024, 30, 111–122, (In Chinese with English Abstract). [Google Scholar]
  7. Liu, T.; Wang, Y.G.; Zou, L.; Bai, Y.Y.; Shen, T.; Wei, Y.W.; Li, F.X.; Zhao, Q.X. Numerical investigation of stable combustion at ultra-low load for a 350 MW wall tangentially fired pulverized-coal boiler: Effect of burner adjustments and methane co-firing. Appl. Therm. Eng. 2024, 246, 122980. [Google Scholar] [CrossRef]
  8. Ma, D.F.; Zhang, S.Y.; He, X.; Zhang, J.; Ding, X. Combustion stability and NOx emission characteristics of a 300 MWe tangentially fired boiler under ultra-low loads with deep-air staging. Energy 2023, 269, 126795. [Google Scholar] [CrossRef]
  9. Jiang, Y.; Lee, B.H.; Oh, D.H.; Jeon, C.H. Influence of various air-staging on combustion and NOx emission characteristics in a tangentially fired boiler under the 50% load condition. Energy 2022, 244, 123167. [Google Scholar] [CrossRef]
  10. Wang, H.P.; Jin, H.Z.; Yang, Z.; Deng, S.S.; Wu, X.H.; An, J.X.; Sheng, R.R.; Ti, S.G. CFD modeling of flow, combustion and NOx emission in a wall-fired boiler at different low-load operating conditions. Appl. Therm. Eng. 2024, 236, 121824. [Google Scholar] [CrossRef]
  11. Wang, Y.; He, Y.; Weng, W.B.; Wang, Z.H. Numerical simulation of ammonia combustion with coal in a 135 MW tangentially fired boiler. Fuel 2024, 370, 131831. [Google Scholar] [CrossRef]
  12. Chen, X.; Liu, X.; Deng, C.B.; Fan, C.N. Numerical Simulation Study on Boiler Combustion Characteristics with Different Volume Fraction of Ventilation Air Methane. J. Energy Resour. Technol. 2022, 144, 112304. [Google Scholar] [CrossRef]
  13. Yuan, M.B.; Deng, L.; Liu, H.; Wu, Y.; Liang, Y.; Belosevic, S.; Tomanovic, I.; Che, D.F. Numerical investigation on H2S formation characteristics in air-staging combustion of a tangentially coal-fired boiler. Energy Sources Part A 2022, 44, 1854–1863. [Google Scholar] [CrossRef]
  14. Modlinski, N.; Janda, T. Mathematical procedure for predicting tube metal temperature in the radiant superheaters of a tangentially and front fired utility boilers. Therm. Sci. Eng. Prog. 2023, 40, 101763. [Google Scholar] [CrossRef]
  15. Liu, Y.C.; Fan, W.D.; Li, Y. Numerical investigation of air-staged combustion emphasizing char gasification and gas temperature deviation in a large-scale, tangentially fired pulverized-coal boiler. Appl. Energy 2016, 177, 323–334. [Google Scholar] [CrossRef]
  16. Guo, J.J.; Liu, Z.H.; Wang, P.; Huang, X.H.; Li, J.; Xu, P.; Zheng, C.G. Numerical investigation on oxy-combustion characteristics of a 200 MWe tangentially fired boiler. Fuel 2015, 140, 660–668. [Google Scholar] [CrossRef]
  17. Liu, H.; Wang, Y.K.; Zhang, W.; Wang, H.; Deng, L.; Che, D.F. Coupled modeling of combustion and hydrodynamics for a 1000MW double-reheat tower-type boiler. Fuel 2019, 255, 115722. [Google Scholar] [CrossRef]
  18. Wu, X.F.; Fan, W.D.; Liu, Y.C.; Bian, B. Numerical simulation research on the unique thermal deviation in a 1000 MW tower type boiler. Energy 2019, 173, 1006–1020. [Google Scholar] [CrossRef]
  19. Edge, P.J.; Heggs, P.J.; Pourkashanian, M.; Williams, A. An integrated computational fluid dynamics-process model of natural circulation steam generation in a coal-fired power plant. Comput. Chem. Eng. 2011, 35, 2618–2631. [Google Scholar] [CrossRef]
  20. Park, H.Y.; Faulkner, M.; Turrell, M.D.; Stopford, P.J.; Kang, D.S. Coupled fluid dynamics and whole plant simulation of coal combustion in a tangentially-fired boiler. Fuel 2010, 89, 2001–2010. [Google Scholar] [CrossRef]
  21. Yu, C.; Xiong, W.; Ma, H.; Zhou, J.; Si, F.; Jiang, X.; Fang, X. Numerical investigation of combustion optimization in a tangential firing boiler considering steam tube overheating. Appl. Therm. Eng. 2019, 154, 87–101. [Google Scholar] [CrossRef]
  22. Bhutta, M.; Hayat, N.; Bashir, M.H.; Khan, A.R.; Ahmad, K.N.; Khan, S. CFD applications in various heat exchangers design: A review. Appl. Therm. Eng. 2012, 32, 1–12. [Google Scholar] [CrossRef]
  23. Gromke, C.; Buccolieri, R.; Di Sabatino, S.; Ruck, B. Dispersion study in a street canyon with tree planting by means of wind tunnel and numerical investigations—Evaluation of CFD data with experimental data. Atmos. Environ. 2008, 42, 8640–8650. [Google Scholar] [CrossRef]
  24. Mahmoodi, B.; Hosseini, S.H.; Ahmadi, G.; Raj, A. CFD simulation of reactor furnace of sulfur recovery units by considering kinetics of acid gas (H2S and CO2) destruction. Appl. Therm. Eng. 2017, 123, 699–710. [Google Scholar] [CrossRef]
  25. Yin, C.E.; Johansen, L.; Rosendahl, L.A.; Kær, S.K. New Weighted Sum of Gray Gases Model Applicable to Computational Fluid Dynamics (CFD) Modeling of Oxy-Fuel Combustion: Derivation, Validation, and Implementation. Energy Fuels 2010, 24, 6275–6282. [Google Scholar] [CrossRef]
  26. Li, J.; Brzdekiewicz, A.; Yang, W.H.; Blasiak, W. Co-firing based on biomass torrefaction in a pulverized coal boiler with aim of 100% fuel switching. Appl. Energy 2012, 99, 344–354. [Google Scholar] [CrossRef]
  27. Eaton, A.M.; Smoot, L.D.; Hill, S.C.; Eatough, C.N. Components, formulations, solutions, evaluation, and application of comprehensive combustion models. Prog. Energy Combust. 1999, 25, 387–436. [Google Scholar] [CrossRef]
  28. Rodriguez, J.A.; Chaturvedi, S.; Kuhn, M.; VanEk, J.; Diebold, U.; Robbert, P.S.; Geisler, H.; Ventrice, C.A. H2S adsorption on chromium, chromia, and gold/chromia surfaces: Photoemission studies. J. Chem. Phys. 1997, 107, 9146–9156. [Google Scholar] [CrossRef]
  29. Madejski, P. Numerical study of a large-scale pulverized coal-fired boiler operation using CFD modeling based on the probability density function method. Appl. Therm. Eng. 2018, 145, 352–363. [Google Scholar] [CrossRef]
  30. Oka, Y.I.; Okamura, K.; Yoshida, T. Practical estimation of erosion damage caused by solid particle impact: Part 1: Effects of impact parameters on a predictive equation. Wear 2005, 259, 95–101. [Google Scholar] [CrossRef]
  31. Oka, Y.I.; Yoshida, T. Practical estimation of erosion damage caused by solid particle impact: Part 2: Mechanical properties of materials directly associated with erosion damage. Wear 2005, 259, 102–109. [Google Scholar] [CrossRef]
  32. Kung, S.C. Further Understanding of Furnace Wall Corrosion in Coal-Fired Boilers. Corrosion 2014, 70, 749–763. [Google Scholar] [CrossRef]
  33. Xin, S.W.; Wang, H.; Li, J.B.; Wang, G.; Wang, Q.H.; Cao, P.Q.; Zhang, P.; Lu, X.F. Discussion on the Feasibility of Deep Peak Regulation for Ultra-Supercritical Circulating Fluidized Bed Boiler. Energies 2022, 15, 7720. [Google Scholar] [CrossRef]
  34. Shao, H.S.; Liao, M.; Zhang, C.; Wang, Y.B.; Sun, J.; Zhao, Q.X. A New Method for Calculating Hydrodynamics of Corner-Tube Boiler Based on Differential Pressure Solution. Therm. Sci. 2024, 28, 2831–2843. [Google Scholar]
  35. Han, H.; He, Y.L.; Tao, W.Q.; Li, Y.S. A parameter study of tube bundle heat exchangers for fouling rate reduction. Int. J. Heat Mass Transf. 2014, 72, 210–221. [Google Scholar] [CrossRef]
  36. Li, F.B.; Bai, B.F. Flow and heat transfer of supercritical water in the vertical helically-coiled tube under half-side heating condition. Appl. Therm. Eng. 2018, 133, 512–519. [Google Scholar] [CrossRef]
  37. Chong, P.A.; Zhu, X.L.; Li, J.N.; Li, X.; Deng, L. Investigation on Hydrodynamic Performance and Wall Temperature of Water-Cooled Wall in 1000 MW Boiler Under Low-Load Conditions. Energies 2024, 17, 5751. [Google Scholar] [CrossRef]
  38. Zhu, X.J.; Wang, W.S.; Xu, W.H. A study of the hydrodynamic characteristics of a vertical water wall in a 2953t/h ultra-supercritical pressure boiler. Int. J. Heat Mass Transf. 2015, 86, 404–414. [Google Scholar] [CrossRef]
  39. Yuan, M.B.; Deng, L.; Zhang, J.K.; Jiang, J.H.; Liang, Y.; Liu, H.; Che, D.F. Prediction of H2S corrosion depth for water-cooled wall in lower furnace of utility boiler. Fuel 2022, 329, 125466. [Google Scholar] [CrossRef]
  40. Meng, F.B.; Gao, S. Study on generation characteristics of H2S in tangentially fired boiler. Heilongjiang Electr. Power 2019, 41, 87–90. [Google Scholar]
  41. Liu, J.; Feng, L.L.; Wu, Y.X.; Feng, R.H.; Chen, S.K.; Zhao, D.Q. Numerical investigation on H2S formation in a pulverized coal-fired boiler using recycled flue gas as near-wall air. Energy 2024, 313, 134134. [Google Scholar] [CrossRef]
  42. Liu, H.; Hu, S.J.; Zhang, L.; Li, Q.Q.; Deng, L.; Che, D.F. Influence of near-wall air position on the high-temperature corrosion and combustion in a 1000 MWth opposed wall-fired boiler. Fuel 2019, 257, 115983. [Google Scholar] [CrossRef]
  43. Yang, W.J.; You, R.Z.; Wang, Z.H.; Zhang, H.T.; Zhou, Z.J.; Zhou, J.H.; Guan, J.; Qiu, L.C. Effects of Near-Wall Air Application in a Pulverized-Coal 300 MWe Utility Boiler on Combustion and Corrosive Gases. Energy Fuels 2017, 31, 10075–10081. [Google Scholar] [CrossRef]
  44. Huo, H.; Su, F.; Meng, P.; Zhang, B.; Bi, Y.; Luo, H.; Sun, J.; Zhao, P.; Wang, X.; Wang, Q.; et al. Retrofit of near-wall air system of a 600 MW opposed firing boiler. Clean. Coal Technol. 2024, 30, 461–468, (In Chinese with English Abstract). [Google Scholar]
Figure 1. Structure diagram of the boiler.
Energies 18 02585 g001
Figure 2. Schematic diagram of mesh: (a) vertical section, (b) combustor section, (c) cross-section.
Energies 18 02585 g002
Figure 3. Mesh independent test.
Energies 18 02585 g003
Figure 4. Pictorial diagram of tube group division.
Energies 18 02585 g004
Figure 5. Coupled heat transfer model calculation process.
Energies 18 02585 g005
Figure 6. Gas velocity distribution of the nozzle cross section under different loads.
Energies 18 02585 g006aEnergies 18 02585 g006b
Figure 7. The outlet enthalpy of each tube group on the right wall of the furnace under different loads.
Energies 18 02585 g007
Figure 8. R s and R r of the right wall G1 tube group under different loads.
Energies 18 02585 g008aEnergies 18 02585 g008b
Figure 9. The variation of enthalpy and temperature of the working fluid in the G6 tube with height.
Energies 18 02585 g009
Figure 10. The variation of outlet pressure and dryness of the G6 tube with height.
Energies 18 02585 g010
Figure 11. Temperature distribution of different sections in the furnace.
Energies 18 02585 g011
Figure 12. SO2 mass fraction distribution of the boiler front wall and right wall under different loads.
Energies 18 02585 g012
Figure 13. H2S mass fraction distribution of the boiler front wall and right wall under different loads.
Energies 18 02585 g013
Table 1. Boiler main parameters.
ParametersBMCRECR
Superheated steam flow rate (t∙h−1)1164.001129.00
Superheater outlet steam pressure (MPa)17.5017.45
Superheater outlet steam temperature (°C)541.0541.0
Reheat steam flow rate (t∙h−1)959.74928.19
Reheater inlet/outlet steam pressure (MPa)4.00/3.823.87/3.70
Reheater inlet/outlet steam temperature (°C)335.5/541.0331.9/541.0
Economizer outlet feedwater temperature (°C)358.2355.8
Boiler efficiency (%)92.4292.42
Table 2. Properties of fuels.
Ultimate Analysis (%)Proximate Analysis (%)Qnet,ar (kJ∙kg−1)
VarAarMarFCarCarHarOar *NarSar
8.8825.696.0059.4352.003.403.201.301.1022,190
* By difference.
Table 3. The operating parameters of the calculated work conditions.
LoadCoal Feed
Amount (t∙h−1)
Primary Air
Volume (km3∙h−1)
Primary Air
Temperature (K)
Secondary Air
Volume (km3∙h−1)
Secondary Air
Temperature (K)
100% BMCR168240359.3887588.8
75% BMCR144207356.8706578.3
50% BMCR118176350.7524567.3
35% BMCR75115348.0437549.2
Table 4. Detailed parameters under 100% BMCR load.
Parameters Value
Coal feed amount (kg∙s−1)46.67
Excess air ratio1.25
Primary air flow (m3∙s−1)66.67
Primary air temperature (K)359.3
Primary air density (kg∙m−3)0.59
Secondary air flow (m3∙s−1)246.39
Secondary air temperature (K)588.8
Secondary air density (kg∙m−3)0.58
Over-fire air flow (m3∙s−1)78.05
Nozzle area of primary air (m2)0.26
Nozzle area of secondary air (m2)0.32
Nozzle area of over-fire air (m2)0.32
Hydraulic diameter of primary air (mm)502
Hydraulic diameter of secondary air (mm)556
Hydraulic diameter of over-fire air (mm)551
Primary air nozzle flow rate (m∙s−1)10.81
Secondary air nozzle flow rate (m∙s−1)23.84
Over-fire air nozzle flow rate (m∙s−1)30.93
Table 5. The comparison between CFD simulation results and actual operation data.
NameCFD SimulationActualDeviation (%)
Furnace Outlet Temperature (K)128112880.54
Lower Furnace Outlet Temperature (K)168616980.71
Total Pressure Drop of Water Wall (MPa)0.22130.22000.59
Working Fluid Temperature of Separator (°C)358.05358.380.09
Oxygen Content of the Flue Gas at Economizer Outlet (%)2.832.810.71
CO Content of the Flue Gas at Economizer Outlet (%)0.860.824.87
NOx Content of the Flue Gas at Economizer Outlet (mg∙m−3)325.2320.31.53
Table 6. The overall DPR of the right wall G1 tube group under different loads.
Name113 WM166 WM248 WM330 WM
R s , total 1.892.071.881.85
R r , total 1.221.281.301.23
Disclaimer/Publisher’s Note: The statements, opinions and data contained in all publications are solely those of the individual author(s) and contributor(s) and not of MDPI and/or the editor(s). MDPI and/or the editor(s) disclaim responsibility for any injury to people or property resulting from any ideas, methods, instructions or products referred to in the content.

