Abstract
This paper remedies the lack of comparison between studies specifically addressing partial discharge (PD) localization using electrical techniques. It identifies all the elements in need in each technique as well as the equations leading to a precise determination of the discharge site in a cable with a certain length and documents several circuit models set to simulate various types of PD. From the details in this paper, different detection methods can be combined based on the specific requirements of each method for detecting PD. This work thoroughly evaluates several electrical PD detection approaches, including time-based, frequency band, and electromagnetic time reversal (EMTR). Additionally, it gathers circuit modeling for various types of PD along cables to improve detection accuracy. It is evident that all time-dependent methods, despite their simplicity and requiring only a small number of components, face challenges when applied to long cables. This is primarily due to their reliance on signal propagation time. The authors provide profound insights into suggestions for future study areas. This review will provide essential insights and serve as a foundation for researchers to develop more effective methods for detecting PD in cables.
1. Introduction
Cables significantly influence the dependability and accessibility of the power network, as cable failures almost inevitably lead to catastrophic losses [1]. Cable insulation must be in optimal condition without interruptions to ensure continuity. Condition monitoring inspections and testing may evaluate the degree of aging damage in the cables [1,2].
Partial discharge (PD) is considered one of the most dependable signs of prospective failures in compromised regions of cable insulating material, which may eventually lead to the failure of the cable structure [3,4]. Consequently, many studies examine the correlation between PD and the longevity of insulation components [5,6]. However, proving such a measurable relationship is tough. The discharges must first be detected and found to characterize the degree of discharge activity appropriately before implementing any mitigation or preventive measures [7].
Several methods exist for detecting PD, including electrical detection, chemical detection, acoustic detection, optical detection, and ultra-high-frequency (UHF) detection [8]. Every method possesses its own merits and drawbacks [9,10,11]. This research concentrates on the electrical detection approach, owing to its exceptional sensitivity in identifying low-level PD signals, appropriateness for online monitoring, compatibility with current power systems, and capacity to deliver quantitative assessments of PD features [9,12].
The power cable is considered a critical issue, and precisely locating faults is extremely important. To prevent power cable disruption or failure, the insulation condition of the cable must be assessed [13]. Recognizing the exact location of PD sources is essential for maintaining and monitoring power cables [14]. For the localization of PDs, researchers have developed numerous multi-terminal PD localization techniques, such as the time-of-arrival method [15]. Therefore, the localization of PD techniques and modeling methodologies has recently become of significant interest. Presumably, before the current study, many papers on PD localization in power cables have been produced in the literature [16,17]. However, there is a lack of a combined comparison of studies that specifically address PD localization using electrical techniques. those based on wave propagation time, such as Time-Domain Reflectometry (TDR), frequency-based methods, and those relying on more advanced principles like Electromagnetic Time Reversal (EMTR).
PD occurs in an electrical insulator when subjected to strong electric field pressures in the absence of a connection between the electrodes [18]. Over the years, a lot of research has been conducted on PD in solid dielectric structures, especially those with air gaps and cavities. This research has led to the publication of articles that aim to help us better understand the basic ideas behind PD by looking at all the related phenomena. The modeling of defects within solid insulation materials aligns with experimental data, which have shown the role of PD in insulation deterioration in high-voltage utilities. Consequently, a comprehensive understanding of insulation behavior under operational stressors will enhance the precision of insulation failure predictions [19]. Apart from that, modeling PD events in insulators would also assist in understanding the course of PD and simultaneously analyzing aspects of PD pattern [20]. However, it is challenging to describe and develop the actual phenomenon of PD because of disparities between modeling and practical criteria of observable and realistic methods [21]. Nevertheless, modeling and simulating PD events provides an alternative way of studying the power cable behavior in presence of defects while checking the influence of important parameters such as the dimension and position of internal defects, such as cavities, the kind of insulation used, the applied voltage and the cavity air pressure [22].
Therefore, this review paper seeks to amplify and enhance the latest scientific research achievements in power cable PD localization techniques. It explains each method and configuration and compares different circuit models that simulate PD in power cables. The primary objective of this research piece is to provide a comprehensive evaluation of the current literature and enhance awareness of advanced technologies pertinent to this sector. It creates a new classification based on the needs of each technology and combines the practical techniques with a comparison that highlights the strengths and weaknesses of each approach. The authors provide profound insights into suggestions for future study areas. In addition, this research brings together several studies that investigate the modeling of different kinds of defects that may appear in power cables. Identification of several methods and circuit models that can efficiently detect and simulate PD is one of the paper’s key findings.
The remainder of this review is structured as follows: Section 2 describes PD detection methods, including online and offline approaches. Section 3 provides an overview and classification of PD localization techniques. Section 4 details modeling strategies. Finally, Section 5 ends the analysis and compiles important ideas and suggestions for the next investigation. This structured approach ensures a review of PD phenomena and explains the development of more localization strategies, while the PD modeling circuits provide valuable insights into PD signal propagation and system behavior. This is the initial occasion that all these technologies and models have been analyzed together to our awareness. Our work may act as a direction for scholars interested in this subject.
2. Definition and Importance of PD Monitoring
PD is an electrical discharge that transpires over a segment of the insulation between two conductors without fully connecting the conductors. PD is detrimental because it promotes cumulative electrical apparatus and insulation degradation, eventually leading to equipment failure. Consequently, identifying PD and distinguishing it from noise are critical functions of condition monitoring to enhance grid asset performance and ensure prompt repair. The primary problems that might arise in conductors with extruded insulation are indicated in Figure 1. These defects generally comprise protrusions, pollutants, voids, water trees, conductor shield discontinuities, and vented and bow-tie trees [23].
Understanding localization challenges requires a comprehensive understanding of the various manifestations of PD in power cables, each with distinct causes, effects, and signal characteristics. Internal PD, often caused by voids or insulation degradation, produces signals with abrupt rising edges and high-frequency components. It typically appears at joints and terminations, where it leads to significant insulation deterioration. Surface PD, caused by moisture or bubbles, generates lower-frequency impulses at cable terminations and has a relatively mild impact. Corona discharges, resulting from protrusion faults at terminations, can cause high localized electric field stress and exhibit clear asymmetry in signal shape, depending on the protrusion geometry. Electrical treeing, caused by long-term electrical stress on faults or voids, produces high-magnitude signals with complex frequency components. Finally, PD caused by delamination and contamination, typically due to impurities or mechanical damage, generates lower-frequency signals in the hundreds to thousands of picocoulombs range but rarely leads to failure [23,24].
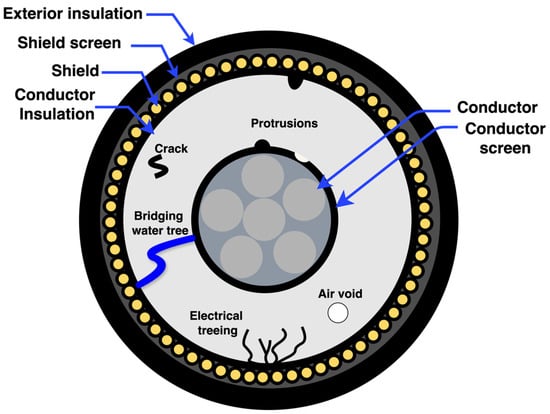
Figure 1.
Common types of internal defects and components in XLPE cable [11,25].
Various electrical and non-electrical analyzing methodologies are employed to satisfy the stringent quality criteria for solid dielectric wires [24]. Variations in heat and other factors, along with the electromagnetic field and heating induced by current after installation or lengthy usage, may aggravate irregularities and result in PD. The IEC 60270 procedure for offline testing is subject to external interference and noise and has possible drawbacks. Consequently, non-traditional ways for PD identification have been created. Wired sensors were employed in previous years to perform similar PD measurements, which led to direct and indirect financial repercussions from the underlying grid’s shutdown [12].
The process of PD detection, as shown in Figure 2, starts with fault initiation. PD signals are then detected using various sensors, followed by feature extraction (pulse shape, sequence, phase-resolved PD (PRPD), dimensionality reduction) and data analysis (classification and clustering). Detection, localization, and making decisions are the last three phases of PD diagnostics [18,26]. The decision-making stage is based on experience relating to PD magnitude, which may eventually lead to cable repair. Knowing the specific place of PD incidents in cables is crucial since it may enable engineers to determine how severe the faults are and speeds up the maintenance operation [12,25,27].
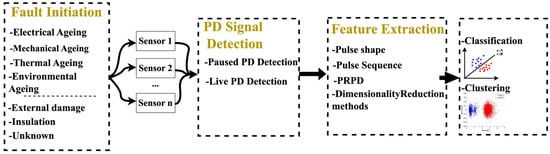
Figure 2.
Steps for PD detection and analysis [27].
PD testing is a highly effective, non-destructive assessment that can be performed offline and online [12]. During offline monitoring, the wire must be disconnected from standard service and powered using an independent voltage source, referred to as an independent source test [16]. In online monitoring, PD measurement is conducted while the cable is powered and requires only a monitoring circuit. As the discharge should sink to the ground, it is feasible to link a monitoring network to the cable’s ground strap.
An offline test is typically performed according to the experimental configuration displayed in Figure 3. The cable is detached from the connection at both terminals and adequately isolated. A voltage source and a coupling sensor are linked at one terminal (near terminal) while the other remains open. The coupling mechanism can be capacitive or inductive. The connection device is connected to PD detection and processing systems. As shown in Figure 3, in a typical online PD test, the cable remains in service with both terminals connected in an online measuring system.
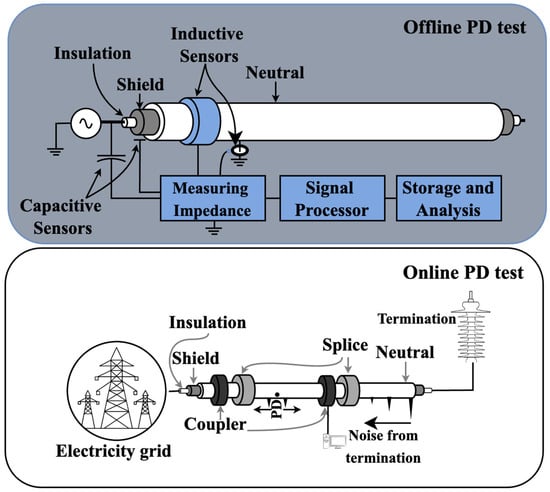
Figure 3.
Typical experimental configuration for offline and online PD monitoring [28].
3. Techniques for PD Localization in Power Cables: Analysis and Comparison of Different Methods
A system of overhead wires and subterranean cables facilitates power distribution and transmission. Wire circuit designs vary in years of age, voltage, and size. Most cable infrastructure consists of paper-insulated, bulk-impregnated, lead-wrapped wires that have been operational since the late 19th century. Currently, informed condition-based maintenance scheduling via condition monitoring provides a viable strategy to prevent forced outages, prolonging the service life of the aging asset base and eliminating the need for prohibitively expensive and comprehensive cable replacement. The objective of condition monitoring for wires or any electrical apparatus is to anticipate potential problems before their occurrence. Assets nearing breakdown can be changed or repaired, minimizing forced outages [26,27].
Many research projects have produced electrical techniques to locate PD occurrence in cables, which aim to detect any PD early and address problems before they worsen. This research can be classified into:
- Time-based methods including the TDR, phase difference, time-of-arrival, and rise time analysis methods;
- Frequency band method;
- EMTR method.
In the following, each type of these methods will be differentiated, with these species compared to each other, and differentiated based on their respective characteristics, where L is the total length of the wire, and X represents the location of PD in the wire. The section will conclude with a comparison of these different methods.
3.1. Time-Based Methods
The time-based PD localization approach relies on timing the signal propagation’s delay. It allows the exact location of discharge in wires. In this section, the TDR method, phase difference method, time-of-arrival methods, and rise time analysis are gathered since all of these techniques use the time for signals to localize PD.
3.1.1. TDR Method
The fundamental idea of the TDR approach for identifying PD sources involves measuring the time delay between the arrival of PD incident pulse and the reflected pulse.
TDR is an evident illustration of an established offline PD localization approach. This approach involves temporary disruption of the network and an independent power source to energize the severed cable. The electricity provided to the unconnected cable triggers PD and enables PD to move to both terminal points of the line from the place of generation. A recorder is put at one terminal of the cable to capture the PD and the following reflections of the PD from the other terminal. The recordings acquired are a sequence of successive pulses wherein the gap between two straight pulses is equivalent to double the length of the wire. PD is determined from the pulses collected. The power needed to activate a few kilometers of wire at the electrical frequency typically necessitates a vast system. The configuration is illustrated in Figure 4, where L represents the length of the cable, X is the PD location. A series of tiny, repeated pulses is injected at terminal A of the wire. These pulses are employed for synchronization reasons and are called timing pulses.
A PD pulse, a single pulse with a bigger amplitude than the other pulses, is delivered at a distance X from terminal A. The PD pulse moves simultaneously towards terminal A and terminal B. Oscilloscopes are put at both terminals of the wire to enable simultaneous recordings [29,30].
This approach utilizes the time difference of arrival of the first incident pulse at both terminals, along with the propagation velocity and cable length, to determine the position of the PD source, expressed as follows [31]:
The period difference represents the disparity in time required for PD to arrive at both extremities; is the propagation velocity.
3.1.2. Phase Difference Method
PD measurement mechanism in the phase difference approach is essentially the same as that of the TDR technique; the electricity provided to the unconnected cable triggers a PD and enables the PD to move to both terminal points of the line from the place of generation. The sole difference is the data analysis of the PD pulse. A simple PD measuring configuration system is presented in Figure 4. The PD test equipment is associated with the test cable at terminal A using a high-voltage capacitor. Terminal B is kept open. The instrument features a bandpass filter and a gain- wideband amp, which is accompanied by a digitizer (A/D) and a microprocessor (PC) for digital data analysis. The observed PD wave at the measuring terminal can be represented as [32]:
where represents the linear convolution process. h(t) is the reaction or response time, s(t) denotes PD signal obtained by the instrument, and ζ represents the time delay between the signal and system response. The recorded PD pulse is then saved on the PC.
The phase difference method-based PD localization involves several critical steps. Initially, the instrument receives the PD signal s(t), which is convolved with the impulse response h(t) of the instrument model to produce the measured signal y(t), as described in Equation (2). The presence of additive noise—originating from electronic or environmental sources—can complicate the analysis. This noise is typically modeled using a Gaussian distribution, and the signal-to-noise ratio (SNR) can vary between 10 dB and −5 dB. Next, the analog signal is digitized using an 8-bit A/D converter, resulting in the recorded PD pulse x(t). Through a pulse separation process, this recorded signal is divided into two windows: the first window contains the direct wave x1(t), while the second includes the reflected wave x2(t). Both waves are then transformed into the frequency domain using the Fourier Transform (FT), resulting in x1(f) for the direct wave and x2(f) for the reflected wave [32].
The estimation of PD location is expressed as a function related with frequency as follows:
where represents the frequency of the system, is the propagation velocity, and is a function of frequency, which can be found by:
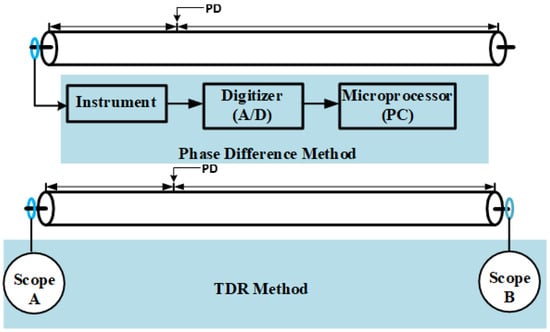
Figure 4.
Schematic representation of PD measurement system for TDR and phase difference methods [33,34].
The period of gap of arrival between the direct and reflected pulse is specified by:
where represents the time of the direct signal, and is the time of the reflected signal. The ultimate estimation of PD location can be derived from the average value of [32].
3.1.3. Time-of-Arrival Method
PD localization in wire systems can be performed with an one sensor if the distant terminal is disconnected or with two sensors (one at each cable terminal) if the cable is in regular service. Both approaches require estimating the entire propagation duration of the wire and the time of arrival of PD waves to determine the sources of PDs. The propagation time is determined utilizing the time of arrival of delivered impulses and their replies [35].
As shown in [35], PD localization in wire systems can be performed with only one sensor if the distant terminal is separated or with two sensors (one at each cable terminal) if the wire is in regular service. Both approaches need the estimation of the overall propagation time of the cable and the time of arrival of PD waves to ascertain the sources of PDs. The propagation period is calculated utilizing the times of arrival of the injected pulses and their replies.
For the placement of PD, two measurements are needed:
- The measurement;
- the real PD value.
Ring Main Units (RMUs) or electrical substations modify the pulse shape of both the PD signal and the injected output signal at the terminal of the cable. Offline diagnostics commonly employs a single-sided system where the measurement and PD location are dependent on reflections from the far terminal [12]. Usually, the impedances of RMUs fixed to the cable prevent apparent reflections from PD signals during online measurements.
Many time-of-arrival techniques have been developed, each suited for different uses and signal properties. These include trigger levels, signal energy, Akaike information criterion (AIC), phase in the frequency, and Gabor centroid [33].
Specific criteria are established to assess and compare the strengths and limitations of different strategies. These criteria encompass the independence of arrival time from the noise level and bandwidth, wave shape and amplitude, recorded signal duration, and pulse position within the signal. The approaches must be resilient against reflections from joints and RMUs and provide precise integration of arrival timings for both injected and monitored PD pulses [36]. A schematic sketch of the test set-up is illustrated in Figure 5. The testing configuration includes two RMUs with an MV/LV converter [33,36]. The difference in time of arrival at both terminals will be utilized, combined with , to compute the location of the PD:
where and are the arrival times of a PD pulse at the measurement units at, respectively, RMU1 and RMU2 [36].
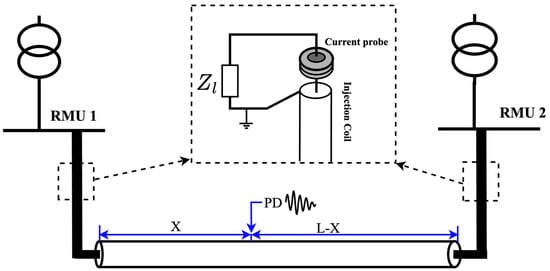
Figure 5.
A schematic illustration of the test setup, with the inset highlighting the placement of the current probe and the injection coil within the RMU [36].
Before computing arrival times, it is necessary to understand the nature of the recorded signals, particularly the effects of noise and the distribution of signal energy. A recorded pulse signal comprises the genuine pulse signal and superimposed noise:
where is the captured period discrete signal, is the noise-reduction PD wave data, and represents additive, independent Gaussian fluctuations with zero mean. n is an integer varying from 1 to N, and N is the entire total number of measurements in the data. The mean signal power in a record is:
where indicates the overall signal power, is PD signal power, represents the amount of noise power, is the energy of the PD signal, indicates the noise power, and represents the entire energy in the recorded signal, which is given by:
The effectiveness of PD localization utilizing double-sided traveling wave techniques depends on accurate time synchronization. Traditionally, GPS has been the primary technology for synchronizing sensors at both ends of the line. However, GPS-based synchronization exhibits uneven precision and sensitivity to ambient influences, leading to inaccuracies in PD location estimates. Although alternative pulse-based synchronization methods (PSMs) have been investigated, they typically fail under noisy conditions when pulse amplitudes are close to background interference levels. Moreover, without consistent GPS access, maintaining nanosecond-level synchronization becomes extremely challenging and results in significant localization errors [33,34,35,36].
3.1.4. Rise Time and Transfer Function Method
The method is based on the fact that the detected PD signal’s rising time depends on the cable’s length over which the signal has spread before reaching the measured point (such as a cable junction or termination). Thus, it can be both easy to use and fit for long wire circuits since it does not require data from the reflected waves [37].
The schematic of PD localization in this method starts with live monitoring utilizing the rise time and transfer function approaches. A monitoring device is put at a cable junction or termination to capture data in online data acquisition; then, the data are sent to a kind of filter, where noise is eliminated, and PD pulses are discovered. The rise times are then compared with the rise time and transfer function in the information base to establish the propagation length and find the PD location. The reflected signals, however, often suffer from severe attenuation and distortion in long cable networks or in environments with heavy background noise, making them difficult to consistently detect. Noise can obscure the true rising edge of the PD pulse, thereby reducing the accuracy of rise time measurements by introducing errors in estimating the precise onset and peak times. As a result, particularly in noisy conditions or when the PD source is located near cable ends where reflections are already weak, the ability to accurately estimate the PD location is significantly impaired [37,38].
The configuration of this technique is indicated in Figure 6. In both configurations, a PD calibrator is linked to two different lengths of coaxial wire by a T-connection to calibrate the PD detection systems and analyze the cable response. At first, as shown in set-up 1 Figure 6, Line A is short-circuited, and the measurement result from this set-up is referred to as . This term emphasizes the individual line involved in the short-circuit arrangement. In set-up 2 Figure 6, coaxial wire A is linked to the PD calibrator and the near terminal of the cable, while the other terminal, far terminal, is connected to channel 1 of the scope by the coaxial wire C. As the cable is linked to Line A, the related information is gathered, and the measurement result from this set-up is referred to as .
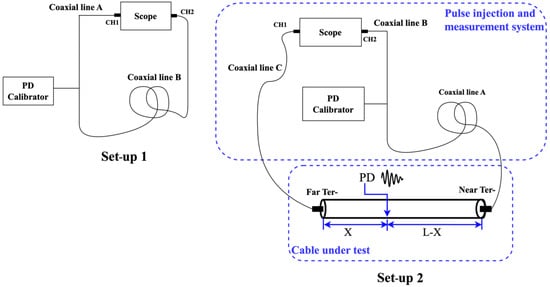
Figure 6.
Schematic of a calibration method configuration [38].
The naming system provides clarity by correlating the measured signal with the relevant line arrangement. From this, the transfer function of the system can be found in [37]:
where represents the cable reaction, is the detected signal reflected at the short-circuited terminal of Coaxial Line A, and is the signal reflected due to impedance mismatch. The scope displays and analyzes electrical signals over time [37].
The features of the initial PD pulse shape significantly affect the accuracy of the rise-time-based PD localization technique. Variations in the original pulse—such as changes in rise time, pulse width, or distortions caused by the type of PD (internal, surface, corona) or by propagation effects—can directly impact the detected rise time at the measurement location. Although the influence of initial rise time variations diminishes over long propagation distances, it can still lead to significant errors, particularly for short cable segments, as demonstrated by the experimental data. In practical scenarios in [37], real PD pulses may deviate substantially from idealized models, resulting in increased localization uncertainty. Therefore, when applying this method under diverse field conditions, it is crucial to recognize this sensitivity and to incorporate pulse-shape adaptation techniques or correction algorithms to enhance the reliability and accuracy of PD source location estimation. The propagation characteristic of a wave moving over a cable of segment length is the simple proportion between the voltages of the output wave and the input wave of the wire part. If a length of wire is viewed as a linear electrical system, this proportion expresses the wire transfer function TF(ω) as:
where ω = 2πƒ, ω represents the angular velocity in radians per second (rad/sec), and ƒ is the frequency in hertz (Hz).
The intricacy and accuracy of transfer function estimation have a significant impact on the effectiveness of the rise-time and transfer function-based PD localization methods. Measuring the transfer function of a cable accurately is inherently difficult because it depends on specific cable characteristics, such as attenuation, dispersion, and impedance variations along the line. Any inaccuracies in characterizing these parameters may result in faulty modeling of pulse propagation behavior, ultimately impairing the accuracy of both localization and the rise time prediction. Moreover, it is difficult to effectively account for the uncertainties introduced by real-world factors such as aging cables, splices, joints, and environmental impacts into the estimated transfer function. Consequently, the overall precision of the approach strongly depends on the quality and completeness of the transfer function estimation, even though the method benefits from utilizing rise time as a localization indicator.
The line is characterized by its propagation constant γ, which is composed of a fundamental part, the attenuation constant α (measured in dB/m), and an imaginary part, the phase constant β (measured in rad/m). γ is expressed as:
3.2. Frequency Band Method
This approach compares the time duration and frequency domain properties of PD pulses observed from several measurement sites. It has been initially described in [15] and can offer an estimated position using PD measurements obtained along the cable path when evaluating accessories.
Phenomena impacting pulses passing over cable lines can be utilized to determine the preliminary place of the defect site. Near the defect, PD waves will display large amplitude, significant frequency content, and small time duration. On the contrary, further from the defect location, attenuation will lower the amplitude and frequency content, and dispersion will increase the duration.
While amplitude is understandable immediately, PD pulses’ frequency content and temporal length must be measured. The set-up scheme is presented in Figure 7 [15,39]. The system consists of a cable and connects via two links (Termination 1 and Termination 2). PD is tested using a detector based on a high-frequency current converter (HFCT) installed at the grounding point of the first terminal (Termination 1), where the Variable Frequency Resonance Test System (VFRTS) is also connected to generate test signals. The cable is attached at one terminal to the VFRTS, while the other is open-circuited.
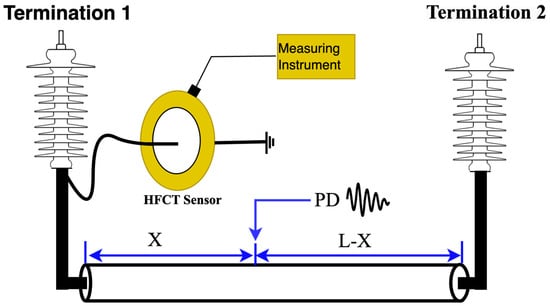
Figure 7.
Cable system under test using frequency–amplitude analysis [39].
The procedure to evaluate time length T and frequency content F is the following [15]:
where s is the recorded pulse, t represents the variable time in the system, represents the specific time constant that describe the rise and fall behavior of a signal, and L is the temporal duration of the observation frame. After these basic procedures, amplitude–frequency mapping is applied by charting. For each condition, the 98% percent of PD amplitude distribution and the mean F value result from the measurement site along the cable path [39].
The analysis of pulse propagation phenomena considers resonance effects, the main influence of cable type and length, and the difficulty of establishing a trustworthy frequency–distance correlation. As previously indicated, PD pulses produced close to the coupler exhibit a large bandwidth and a short equivalent time length, whereas pulses detected farther away show a greater T and a lower F due to attenuation and dispersion effects along the cable. Significant pulse distortion occurs over distance because of these phenomena, which are highly dependent on the cable’s type, material, and length. Additionally, since noise pulses typically have very low F values, the amplitude–frequency map approach—which organizes pulses according to their T and F values—highlights the complexity introduced by multiple PD sources and noise. It becomes increasingly difficult to differentiate between overlapping signals when multiple PD sources are active or when external interferences are present. These challenges make establishing an accurate frequency–distance correlation even more difficult, particularly for longer cables, where resonance effects may further distort signal patterns and where pulse attenuation and dispersion are more pronounced. The behavior of PD pulses traveling through a cable is analyzed in the amplitude–frequency map by examining how attenuation and dispersion affect their attributes. Attenuation diminishes the high-frequency content and amplitude of PD pulses, whereas dispersion causes them to spread over time, increasing their duration. PD pulses typically exhibit a significant amplitude, broad frequency content, and short duration near the defect site. In contrast, pulses detected farther from the defect source show reduced amplitude and frequency content, along with a longer duration. To systematically characterize these changes, two parameters, T and F, are introduced. T measures the spread in the time domain, with lower T values indicating sharper, shorter pulses, while F measures the spread in the frequency domain, with higher F values indicating richer high-frequency content. In practice, pulses arriving from distant sources exhibit large T and small F values, whereas those originating close to the coupler have small T and large F values. Conversely, noise pulses are typically characterized by relatively small F values. By plotting pulses according to their T and F values on a Cartesian plane—a procedure known as TF mapping—distinct clusters of similar pulses can be identified. Each cluster may be associated with a noise source or a specific PD source. As a result, amplitude–frequency mapping is an effective technique for isolating true PD signals from noise, distinguishing between various PD sources, and providing a preliminary estimate of defect locations, particularly in complex cable networks where multiple sources and external interferences may be present [15,39].
3.3. EMTR
The EMTR-based approach for PD localization relies on the time-reversal of the telegrapher’s equations [40], detailing PD wave propagation on electrical paths, and on the application of the Transmission Line Matrix (TLM) numerical approach to calculate the telegrapher’s equations in the time-reversal domains. The TLM numerical approach is used to characterize the time-reversal evolution of PD waves [41]. The fundamental stages of the EMTR PD localization technique start with measuring the PD signal at a singular observation point inside the power network. Subsequently, reversing the observed PD signal in time, establish presumed PD sites at nodes inside a one-dimensional TLM system of the network, and then imitate the back delivery of the reversed PD wave at the designated places with TLM. Finally, the PD source at the hypothesized place with the highest energy is ascertained.
For each time-reversal simulation, the amount of energy E contained in the guessed PD location’s transverse impedance is assessed and normalized relative to the maximum energy using:
where is the high value of the voltage over all the guessed PD Locations, represents the guessed PD position transverse capacitance changed by PD occurrence, and is the number of the samples. The physical position of the PD will coincide with the PD defined by maximum energy since the time-reversed PD pulses will constructively interfere in phase with the actual PD position during their retrograde propagation [42].
The system configuration is shown in Figure 8. In medium-voltage (MV) systems, PD measuring units are situated within a central ring main unit (RMU). An RMU is linked to one to five MV lines and an MV/low-voltage (LV) distributing transformer. The observation point (OP) within the RMU oversees one or many cable segments between two RMUs [41].
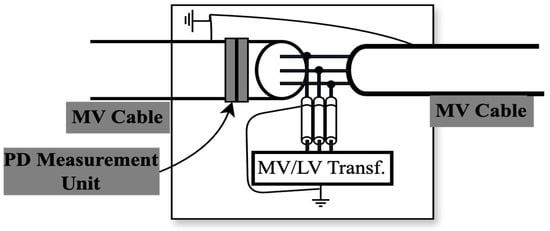
Figure 8.
RMU with PD measurement unit [42].
For real-time or near-real-time applications, the computational cost of the EMTR-based localization method remains manageable. As indicated, localization requires only a few seconds of overall processing time. This shows that the approach maintains a computational cost suitable for online monitoring scenarios, even when using a time-reversal simulation over a discretized TLM model. The study clearly demonstrates that an exact facsimile of the network under consideration is not required, despite employing a full electromagnetic characterization of cables of cross-linked polyethylene (XLPE) and Paper Insulated Lead Covered (PILC) types, and RMUs to develop the simulation environment. A generic model is sufficient for accurate PD localization. The EMTR-based approach relies on identifying the maximum energy concentration following the back-injection of the time-reversed signal, rather than on strict time-of-arrival peak detection, which is particularly sensitive to modelling mismatches. This leads to a relaxation of the model precision requirement. Furthermore, the method’s inherent robustness minimizes sensitivity to modelling errors. The technique reliably detected the PD source with a relative error of less than 0.1%, even in scenarios where the PD signal was affected by frequency-dependent impedances, reflections from impedance mismatches, or the complex behavior of interconnected cables and RMU systems. Compared to classical reflectometry techniques, which are far more susceptible to modelling errors and signal distortions, the energy-based localization mechanism of the method enables it to tolerate moderate inaccuracies in the assumed propagation parameters and network impedance profiles [41,42].
3.4. Comparison of PD Localization Techniques in Power Cables
Each of these techniques, including the time-based method, frequency band method, and EMTR method, has unique characteristics that make it suitable for specific applications. Table 1 presents a comparative analysis of these PD localization and detection techniques in power cables, focusing on their strengths and limitations.
To summarize the findings in Table 1, this classification has enabled us to develop a new framework for determining the discharge location in a cable. Time-dependent methods are the simplest but lack accuracy in the case of long cables, as they primarily rely on sending a signal through the cable and measuring its propagation time. Frequency-dependent methods utilize frequency analysis of the signal but are highly susceptible to interference. Although the EMTR method offers higher accuracy, it requires a relatively greater number of devices and sensors compared to the other methods.

Table 1.
Comparison of PD localization techniques in power cables.
Table 1.
Comparison of PD localization techniques in power cables.
| Techniques | Merits | Weakness | Refs. |
|---|---|---|---|
| TDR | Testing is simple to implement. The test equipment has a low voltage rating, is compact, and is cost-effective. Periodic tests provide historical data to track future changes. Finds locations of the cable structure with impedance-related concerns. | The low-voltage TDR pulse may have issues due to interference. Qualified personnel are required to conduct tests and analyses. Pertinent to short-length cable structures because both the original and reflected pulses need to be detectable when they reach the detecting site. Requires expensive, sophisticated synchronization methods. | [43,44,45] |
| Phase Difference | Needs just the top two PD peaks, which makes it useful for PD position prediction. Perfect for minimum noise situations. Can be calculated using the cross-Fourier spectral density ratio at different frequencies. | Relevant to short cables, ensuring both pulses are detectable. Performance can be compromised in the event of intense Gaussian noise, which is more common in life. | [32,46] |
| Time-of-Arrival | Appropriate for long-range signal detection. Offers precise PD localization in well-synchronized systems. Distinguishes noise intensity and spectrum since it uses multi-sensor detection to find accurate signals across different points. | Requires a distinct noise intensity and spectrum. Needs to process complex data in comparison with the other methods. The propagation velocity is influenced by variations. | [47,48] |
| Rise time and transfer function | Helpful in detecting quick transient signals. Assists with evaluating signal distortions due to insulation deterioration. | Sensitivity to noise can impact the precision of measurements. High-speed testing equipment is needed for optimal detection. | [49,50] |
| Frequency band | Allows separation of PD data from surrounding noise. Can detect PD sources depending on frequency characteristics. Able to gather PD waves from different frequency ranges. | Requires previous knowledge of PD signal frequency characteristics. | [11,18,51] |
| EMTR | Enhances reliability in PD localization. Can recreate the actual PD source location with great precision. | Mathematically complicated and needs substantial processing. Sensitivity to environmental fluctuations impacting wave propagation. Can give some incorrect results because of intensive electromagnetic interference. | [47,51,52,53] |
4. Electrical Circuit Modeling of PD Signal Propagation in Power Cables
PDs are minor dielectric failures inside an electrical insulation device. They may manifest in any specific faulty areas inside the insulation. Unlike a short circuit, the gap between the two conductors is not entirely closed by the discharge. Consequently, PD activity may persist for an extended duration, progressively compromising the insulation. They primarily manifest in the operational apparatus of electrical power transmission networks subjected to high-voltage strains. Measuring PD facilitates timely fault detection and prevents power interruptions.
The broadband PD pulses typically transmit from their source to a measurement instrument over a transmission line (TL), such as overhead lines or power cables. This propagation distorts the original impulse and lowers the bandwidth of the measured spectrum depending on the distance traveled. To model and replicate this process, a comprehensive knowledge of the propagation actions of the TL utilized is essential. An appropriate model may thereafter characterize the transmission of PD and all other high-frequency signals on the TL [54].
Numerous studies have produced different models for PD in cables. Table 2 summarizes and compares some of these studies, which discuss simulation circuits for PD in power cables with its explanation, key findings, and approaches for PD analysis. The importance of studying and forming a model for all types of discharge that can occur in the power cables is that it enables us to simulate the impact of this problem during cable and to understand its complications in various situations, such as voltage change, current, and location in the TL.
Table 2.
Modeling of different electrical circuits of PD.
Table 2.
Modeling of different electrical circuits of PD.
| Ref. | The Circuit Simulations and Explanations | PD Type | Key Findings | Approaches for PD Analysis |
|---|---|---|---|---|
| [54] | 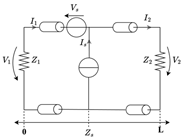 L represents the total length of the TL, with termination impedances and at both terminals. PD event occurs at position along the TL and can be modeled as either a voltage source () or a current source (). | Ohmic and dielectric losses. | Does not neglect the wave character of the high-frequency signals. Incorporates TL theory and provides an analytical and practical approach. | Analytical solution based on telegrapher equations. |
| [55] | 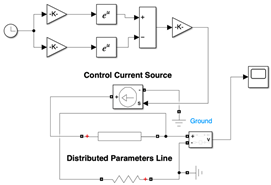 | Aging states. | The degradation of XLPE material mainly influences the equivalent capacitance wire. The propagation properties of PD signals in cables vary according to their aging stages. | Simulation model using COMSOL Multiphysics and MATLAB/Simulink. |
| [56] | 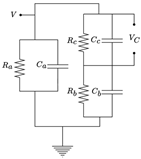 and represent the capacitance and resistance of the cavity, and are the capacitance and the resistance of the dielectric before the cavity, and represent the capacitance and resistance of the dielectric after the cavity, is the voltage across the cavity, and is the applied voltage to the system. | Void. | Develops a 3D Finite Element Method (FEM) model to predict PD occurrence in High Voltage Direct Current (HVDC) cables, including the impacts of electric field and temperature-dependent conductivity. | FEM-based PD model incorporating electric and thermal fields. |
| [57] | 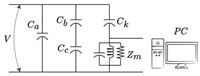 represents the healthy insulation of the remaining area in the dielectric material, denotes the surrounding of the void, refers to the void within the dielectric material, and is the coupling capacitor connected in a shunt with the dielectric material. | Void. | The charge values are raised when the applied voltage is adjusted from 6.3 kV to 12.3 kV. This occurs due to increased electric fields surrounding the empty area. | Three capacitance models for PD in voids. |
| [58] | 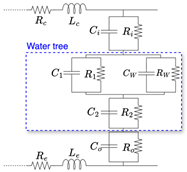 The inner semiconducting layer , ) and outer semiconducting layer (, ). The conductor’s resistance () and inductance () represent power losses and magnetic effects. Insulation values are modeled by (, ). Healthy insulation is modeled by (, ), while water tree-affected regions are captured by (, ). The earth screen (, ) provides shielding and minimizes interference. | A water tree. | Demonstrates that TDR and Frequency-Domain Reflectometry (FDR) could effectively locate water trees at various growth stages. | Lumped RC circuit model for water trees. |
| [59] | 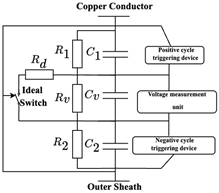 (, ) and (, ) model the upper and lower healthy parts of the insulation, (, ) represent the capacitance and resistance of the void under normal conditions, and models the ionized path resistance during discharge. A voltage-triggering device controls an ideal switch. | Void. | Creates an enhanced capacitive PD model, including streamer discharge physics. The model precisely depicts PD transients in medium-voltage cables. The high-frequency propagation characteristics of PD signals are examined, revealing the influence of wave impedance and void parameters on signal attenuation and distortion. | A model based on passive components (R-L-C). |
| [60] | 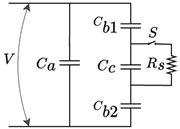 is the capacitance of the insulation excluding the defect column, represents the capacitance of the void (defect) within the insulation, and is the equivalent capacitance of the defect column, calculated from and (upper and lower insulation capacitances) using . Spark resistance is represented by , and a breakdown switch by S. | Void. | Charge behavior in PD processes is analyzed, understanding charge distribution crucial for insulation diagnosis. | Three capacitance models for PD in voids. |
As a summary of Table 2, the various circuit models presented for PD simulation exhibit specific strengths and weaknesses depending on the situation. In particular, for modeling high-frequency PD signal propagation along long cables, the TL model [54], based on the telegrapher’s equations, accurately captures the effects of ohmic and dielectric losses. By contrast, models based on COMSOL Multiphysics and MATLAB/Simulink [55] are better suited for examining aging effects in XLPE cables, where material degradation alters the equivalent capacitance and affects the PD signal behavior. For void-type discharges, FEM-based models [56] and capacitance-based models [57,60] provide appropriate frameworks; FEM models allow detailed investigation of electric field distribution and temperature-dependent conductivity, while simpler capacitance models offer practical strategies for insulation diagnosis. Lumped RC models [58] are particularly effective for studying water tree deterioration in polymeric insulation systems. Furthermore, enhanced R-L-C circuit models [59] are appropriate for medium-voltage cable studies where high-frequency phenomena are important, enabling thorough transient analysis of PD signals, including streamer discharges. Therefore, the selection of the appropriate simulation model should be guided by the PD type, the operating frequency range, and the specific cable material and condition under investigation.
5. Obstacles and Future Opportunities
In the realm of condition checking, PD position has drawn the attention of major researchers. Current research has looked at irreversible contributions to the research of PD position localization, even though many sensors have been introduced, and novel localization techniques have been developed. Many methods used to locate the discharge can be improved, as some of them have problems. The literature review in the field of PD supply localization shows that several articles have effectively used various PD monitoring techniques. Sensor construction, synchronization, transmission of measurement parts, noise reduction from the identified waves, PD localization, and determination of PD source phase are some issues in online PD monitoring. There is a great need to design models that accurately simulate all types of PD; however, research has predominantly focused on voids while neglecting other types of PD. Since PD measurements with one or more identical sensors might be impacted by a specific sort of noise [61], multi-sensor detection will boost the localization and identification sensitivity accuracy. Adapting numerous sensors with varied features (such as propagation delay, amplitudes, signal duration, and frequency ranges) for PD measurement makes the data gathering less noise-resistant [62].
The use of artificial intelligence (AI) approaches has considerably benefited recent breakthroughs in TDR, especially in the areas of defect detection and noise reduction [63,64]. One notable improvement is the deployment of AI-based approaches, including denoising autoencoders (DAEs), which minimize the effects of environmental disturbances like solar irradiance fluctuations and inverter switching noise [65]. These improvements make enhanced signal clarity and more precise fault detection in complex systems possible. Additionally, deep learning models have shown promise in boosting the sensitivity and robustness of PD detection, especially those that use hybrid networks incorporating autoencoders and other neural architectures. Recent research has demonstrated significant gains in fault detection accuracy, particularly in challenging environments, by applying these models to time-dependent localization technique signals. These advancements contribute to the broader trend of advancing diagnostic approaches using deep learning, which enhances performance in data processing and real-time monitoring. By improving detection accuracy and reliability over long transmission distances, this approach may help address the challenges associated with PD localization on long-line cables. Additionally, models of neural networks determined by deep learning are sensitive to overfitting superfluous features during feature extraction and learning, possibly leading to localized failures. By combining existing information, the model can promptly determine crucial properties of PD signals from cables, minimizing needless computations and boosting diagnostic efficiency. Furthermore, including prior knowledge increases the transparency of the model’s decision-making process, boosting interpretability.
6. Conclusions
This research presents different techniques of the electrical methods used for PD localization, along with a comparative analysis of these methods based on their underlying detection principles. Each localization method’s essential principles, advantages, and disadvantages are meticulously analyzed. The modeling and simulation of electrical circuits for various types of PD are ultimately examined. This paper provides a succinct and comprehensive overview of the current state of the art, serves as a reference, and fosters progress in cable PD electrical localization methods. Additionally, modeling and simulating PD events provides an alternative way of studying defects on power cables while checking the influence of important parameters such as the dimension and position of internal defects such as cavities, type of insulation material used, and applied voltage on PD behavior. Therefore, it gathers circuit modeling for various types of PD along cables to improve detection accuracy.
The results of this research highlight several key findings, including the need for improved time-based methods, such as TDR and phase difference analysis, to detect PD in long cables. While current methods may seem straightforward, our new classification provides a deeper understanding of different PD types and facilitates the integration of detection techniques for further development. Additionally, the circuit models used to represent various types of discharge reveal a lack of comprehensive representation. Therefore, this research suggests developing a model capable of simulating all types of discharge within a unified framework.
Funding
This research received no external funding.
Conflicts of Interest
Authors Giuseppe Rizzo, Vincenzo Li Vigni and Roberto Candela were employed by the company Prysmian. The remaining authors declare that the research was conducted in the absence of any commercial or financial relationships that could be construed as a potential conflict of interest.
References
- Li, G.; Zhang, X.; Wu, G.; Yang, L.; Xie, Y. The Lifetime Prediction and Insulation Failure Mechanism of XLPE for High-Voltage Cable. IEEE Trans. Dielectr. Electr. Insul. 2022, 30, 761–768. [Google Scholar] [CrossRef]
- Li, S.; Cao, B.; Li, J.; Cui, Y.; Kang, Y.; Wu, G. Review of Condition Monitoring and Defect Inspection Methods for Composited Cable Terminals. High Volt. 2023, 8, 431–444. [Google Scholar] [CrossRef]
- Yan, Y. Online Partial Discharge Detection and Localization of Medium-Voltage Overhead Distribution Networks. Sensors 2024, 24, 5678. [Google Scholar]
- Wu, Y.; Zhang, P. A Novel Online Monitoring Scheme for Underground Power Cable Insulation Based on Common-Mode Leakage Current Measurement. IEEE Trans. Ind. Electron. 2022, 69, 13586–13596. [Google Scholar] [CrossRef]
- Raymond, W.J.; Illias, H.A.; Mokhlis, H. Partial discharge classifications: Review of recent progress. Measurement 2015, 68, 164–181. [Google Scholar] [CrossRef]
- Hassan, W.; Shafiq, M.; Hussain, G.A.; Choudhary, M.; Palu, I. Investigating the Progression of Insulation Degradation in Power Cable Based on Partial Discharge Measurements. Electr. Power Syst. Res. 2023, 221, 109452. [Google Scholar] [CrossRef]
- Govindarajan, S.; Morales, A.; Ardila-Rey, J.A.; Purushothaman, N. A Review on Partial Discharge Diagnosis in Cables: Theory, Techniques, and Trends. Measurement 2023, 216, 567. [Google Scholar] [CrossRef]
- Maresch, K.; Freitas-Gutierres, L.F.; Cardoso, G.; Borin, A.S.; Damiani, J.S.; Quatrin, A.D.N.; Morais, A.M.; Nunes, M.V.A.; Correa, C.H.; Martins, E.F.; et al. Innovative Approach for Detecting Early-Stage Partial Discharges in Instrument Transformers via Ultrasound and Random Forest Analysis. Measurement 2024, 232, 114710. [Google Scholar] [CrossRef]
- Rossi, M.; Ricci, F. Real-Time Monitoring of Partial Discharge in Air Switchgear Based on Characteristic Gases for Insulation Fault Diagnosis. Am. J. Appl. Sci. 2025, 7, 1–6. [Google Scholar]
- Li, A.; Li, S.; Zhang, C. Fault Detection in Cable Systems via Deep Semi-Supervised Learning for Partial Discharge. J. Power Electron. 2025, 25, 1–9. [Google Scholar] [CrossRef]
- Kaziz, S.; Said, M.H.; Imburgia, A.; Maamer, B.; Flandre, D.; Romano, P.; Tounsi, F. Radiometric Partial Discharge Detection: A Review. Energies 2023, 16, 1978. [Google Scholar] [CrossRef]
- Hussain, G.A.; Hassan, W.; Mahmood, F.; Shafiq, M.; Rehman, H.; Kay, J.A. Review on Partial Discharge Diagnostic Techniques for High Voltage Equipment in Power Systems. IEEE Access 2023, 11, 51382–51394. [Google Scholar] [CrossRef]
- Duan, L.; Hu, J.; Zhao, G.; Chen, K.; He, J.; Wang, S.X. Identification of Partial Discharge Defects Based on Deep Learning Method. IEEE Trans. Power Deliv. 2019, 34, 1557–1568. [Google Scholar] [CrossRef]
- Mor, A.R.; Morshuis, P.H.F.; Llovera, P.; Fuster, V.; Quijano, A. Localization Techniques of Partial Discharges at Cable Ends in Off-Line Single-Sided Partial Discharge Cable Measurements. IEEE Trans. Dielectr. Electr. Insul. 2016, 23, 428–434. [Google Scholar] [CrossRef]
- Puletti, F.; Olivieri, M.; Cavallini, A.; Montanari, G.C. Localization of Partial Discharge Sources along HV and MV Cable Routes. In Proceedings of the 2005 International Power Engineering Conference, Singapore, 29 November–2 December 2005; IEEE: New York, NY, USA, 2005. [Google Scholar]
- Veen, J. Online Signal Analysis of Partial Discharges in Medium-Voltage Power Cables. Ph.D. Thesis, Technische Universiteit Eindhoven, Eindhoven, The Netherlands, 2005. [Google Scholar]
- Refaat, S.S.; Shams, M.A. A Review of Partial Discharge Detection, Diagnosis Techniques in High Voltage Power Cables. In Proceedings of the 2018 IEEE 12th International Conference on Compatibility, Power Electronics and Power Engineering (CPE-POWERENG 2018), Doha, Qatar, 10–12 April 2018; IEEE: New York, NY, USA, 2018; Volume 12, pp. 1–5. [Google Scholar]
- Hussain, M.R.; Refaat, S.S.; Abu-Rub, H. Overview and Partial Discharge Analysis of Power Transformers: A Literature Review. IEEE Access 2021, 9, 64587–64605. [Google Scholar] [CrossRef]
- Sahoo, N.C.; Salama, M.M.A.; Bartnikas, R. Trends in Partial Discharge Pattern Classification: A Survey. IEEE Trans. Dielectr. Electr. Insul. 2005, 12, 248–264. [Google Scholar] [CrossRef]
- Venge, T.; Nyamupangedengu, C. A Review of Test Voltages Used in Partial Discharge Measurements. In Proceedings of the 2021 IEEE AFRICON, Arusha, Tanzania, 13–15 September 2021; pp. 1–6. [Google Scholar]
- Afrouzi, H.N.; Abdul-Malek, Z.; Vahabi Mashak, S.; Naderipour, A.R. Three-Dimensional Potential and Electric Field Distributions in HV Cable Insulation Containing Multiple Cavities. Adv. Mater. Res. 2014, 845, 372–377. [Google Scholar]
- Pan, C.; Wu, K.; Chen, G.; Gao, Y.; Florkowski, M.; Lv, Z.; Tang, J. Understanding Partial Discharge Behavior from the Memory Effect Induced by Residual Charges: A Review. IEEE Trans. Dielectr. Electr. Insul. 2020, 27, 1951–1965. [Google Scholar] [CrossRef]
- Gutiérrez, S.; Sancho, I.; Fontán, L.; Nó, J. Effect of Protrusions in HVDC Cables. IEEE Trans. Dielectr. Electr. Insul. 2012, 19, 1774–1781. [Google Scholar] [CrossRef]
- Rostaghi-Chalaki, M.; Yousefpour, K.; Donohoe, J.P.; Kurum, M.; Park, C.; Kluss, J. Design of Transmission Line and Electromagnetic Field Sensors for DC Partial Discharge Analysis. IEEE Trans. Dielectr. Electr. Insul. 2020, 27, 2138–2146. [Google Scholar] [CrossRef]
- Han, T.; Yao, Y.; Li, Q.; Huang, Y.; Zheng, Z.; Gao, Y. Locating Method for Electrical Tree Degradation in XLPE Cable Insulation Based on Broadband Impedance Spectrum. Polymers 2022, 14, 3785. [Google Scholar] [CrossRef] [PubMed]
- Berkemeier, R.; Bach, R.; Tenbohlen, S. UHF Partial Discharge Detection and Localization: On-site Experiences at 110-kV-Cable Terminations. IEEE Trans. Power Deliv. 2025, 40, 1169–1179. [Google Scholar] [CrossRef]
- Chen, J.; Zhang, Y.; Liu, Z.; He, J.; Liu, C.; Li, J. A Novel Method for PD Feature Extraction of Power Cable with Renyi Entropy. Entropy 2015, 17, 7698–7712. [Google Scholar] [CrossRef]
- Zhang, X.; Chen, Z.; Wang, H.; Song, X.; Yan, X. Review on Detection and Analysis of Partial Discharge along Power Cables. Energies 2021, 14, 7692. [Google Scholar] [CrossRef]
- Shim, I.; Soraghan, J.J.; Siew, W.H. Noise Reduction Technique for On-Line Detection and Location of Partial Discharges in High Voltage Cable Networks. Meas. Sci. Technol. 2000, 11, 1708–1713. [Google Scholar] [CrossRef]
- Robles, G.; Shafiq, M.; Martínez-Tarifa, J.M. Multiple Partial Discharge Source Localization in Power Cables through Power Spectral Separation and Time-Domain Reflectometry. IEEE Trans. Instrum. Meas. 2019, 68, 4703–4711. [Google Scholar] [CrossRef]
- Mohamed, F.P.; Siew, W.H.; Soraghan, J.J.; Strachan, S.M.; McWilliam, J. Partial Discharge Location in Power Cables Using a Double-Ended Method Based on Time Triggering with GPS. IEEE Trans. Dielectr. Electr. Insul. 2013, 20, 2212–2221. [Google Scholar] [CrossRef]
- Mardiana, R.; Su, C. Partial Discharge Location in Power Cables Using a Phase Difference Method. IEEE Trans. Dielectr. Electr. Insul. 2010, 17, 1738–1746. [Google Scholar] [CrossRef]
- Helwig, M.; Bräuer, M.; Köhler, J.; Stahr, A.; Dannehl, J.; Schulz, D. Numerical and Experimental Investigation of Time-Domain-Reflectometry-Based Sensors for Foreign Object Detection in Wireless Power Transfer Systems. Sensors 2023, 23, 9425. [Google Scholar] [CrossRef]
- Walczak, K.; Sikorski, W. Non-Contact High Voltage Measurement in the Online Partial Discharge Monitoring System. Energies 2021, 14, 5777. [Google Scholar] [CrossRef]
- Steennis, F.; van der Wielen, P.C.J.M.; Kaptein, B.; Harmsen, D.; Kruithof, M.; Postma, A. Permanent On-Line Monitoring of MV Power Cables Based on Partial Discharge Detection and Localisation—An Update. In Proceedings of the 7th International Conference on Insulated Power Cables, Versailles, France, 24–28 June 2007. [Google Scholar]
- Sun, K.; Zhou, J.; Liu, Z.; Zhang, Y.; Lu, J. Robust Estimation of Arrival Time of Complex Noisy Partial Discharge Pulse in Power Cables Based on Adaptive Variational Mode Decomposition. Appl. Sci. 2020, 10, 1641. [Google Scholar] [CrossRef]
- Sheng, B.; Zhou, C.; Hepburn, D.M.; Dong, X.; Peers, G.; Zhou, W.; Tang, Z. A Novel On-Line Cable PD Localisation Method Based on Cable Transfer Function and Detected PD Pulse Rise-Time. IEEE Trans. Dielectr. Electr. Insul. 2015, 22, 2087–2096. [Google Scholar] [CrossRef]
- Sikorski, W.; Walczak, K.; Werle, S.; Michalak, D.; Borucki, S. On-Line Partial Discharge Monitoring System for Power Transformers Based on the Simultaneous Detection of High Frequency, Ultra-High Frequency, and Acoustic Emission Signals. Energies 2020, 13, 3271. [Google Scholar] [CrossRef]
- Robles, G.; Fresno, J.M.; Martínez-Tarifa, J.M.; Ardila-Rey, J.A.; Parrado-Hernández, E. Partial Discharge Spectral Characterization in HF, VHF and UHF Bands Using Particle Swarm Optimization. Sensors 2018, 18, 746. [Google Scholar] [CrossRef]
- Rachidi, M.P.F.; Rubinstein, M. Electromagnetic Time Reversal: Application to EMC and Power Systems; Springer: Berlin/Heidelberg, Germany, 2017. [Google Scholar]
- Ragusa, A.; Wouters, P.A.A.F.; Sasse, H.; Duffy, A.; Rachidi, F.; Rubinstein, M. Electromagnetic Time Reversal for Online Partial Discharge Location in Power Cables: Influence of Interfering Reflections from Grid Components. IET Sci. Meas. Technol. 2024, 18, 483–490. [Google Scholar] [CrossRef]
- Karami, H.; Bakkali, M.; Djobbi, R.; Bacha, S.; Mekhaldi, A. Partial Discharge Localization Using Time Reversal: Application to Power Transformers. Sensors 2020, 20, 1419. [Google Scholar] [CrossRef]
- Michel, A.; Sobczuk, H.; Hansen, K.K. Time Domain Reflectometry. RILEM State Art Rep. 2018, 26, 115–122. [Google Scholar]
- Fornas, J.G.; Jaraba, E.H.; Bludszuweit, H.; Garcia, D.C.; Estopinan, A.L. Modeling and Simulation of Time Domain Reflectometry Signals on a Real Network for Use in Fault Classification and Location. IEEE Access 2023, 11, 23596–23619. [Google Scholar] [CrossRef]
- Xavier, G.V.R.; De Oliveira, A.C.; Silva, A.D.C.; Nobrega, L.A.M.M.; Da Costa, E.G.; Serres, A.J.R. Application of Time Difference of Arrival Methods in the Localization of Partial Discharge Sources Detected Using Bio-Inspired UHF Sensors. IEEE Sens. J. 2021, 21, 1947–1956. [Google Scholar] [CrossRef]
- Lan, S.; Hu, Y.Q.; Kuo, C.C. Partial Discharge Location of Power Cables Based on an Improved Phase Difference Method. IEEE Trans. Dielectr. Electr. Insul. 2019, 26, 1612–1619. [Google Scholar] [CrossRef]
- Khan, U.F.; Lazaridis, P.I.; Mohamed, H.; Albarracín, R.; Zaharis, Z.D.; Atkinson, R.C.; Tachtatzis, C.; Glover, I.A. An Efficient Algorithm for Partial Discharge Localization in High-Voltage Systems Using Received Signal Strength. Sensors 2018, 18, 4000. [Google Scholar] [CrossRef]
- Akbari, M.A.; Sadeghi, M.; Gholami, M.; Khodadadi, M.; Shaterian, M.; Haghifam, M. Optimized Arrival Time Determination of UHF Pulses for Localization of Partial Discharges in Power Transformers. In Proceedings of the 2018 IEEE Conference on Electrical Insulation and Dielectric Phenomena (CEIDP), Long Beach, CA, USA, 14–17 October 2018; pp. 1–4. [Google Scholar]
- Abdullah, A.Z.; Isa, M.; Amlus, M.H.; Azizan, N.; Bakar, M.F.; Meor, A.Z. Partial Discharge Characteristics for On-Site Measurement Based on Rise Time Waveform. J. Phys. Conf. Ser. 2021, 1878, 012025. [Google Scholar] [CrossRef]
- Ding, Y.; Wang, Y.; Yin, Y. Effects of Rise Time and Pulse Width on Magnitude and Phase Distribution of the Partial Discharge in Power Module Packaging Insulation under Square Pulse. In Proceedings of the 2023 IEEE 4th International Conference on Electrical Materials and Power Equipment (ICEMPE 2023), Shanghai, China, 7–10 May 2023; IEEE: New York, NY, USA, 2023; pp. 1–4. [Google Scholar]
- Wang, P.; Ma, S.; Akram, S.; Meng, P.; Castellon, J.; Li, Z.; Montanari, G.C. Design of an Effective Antenna for Partial Discharge Detection in Insulation Systems of Inverter-Fed Motors. IEEE Trans. Ind. Electron. 2022, 69, 13727–13735. [Google Scholar] [CrossRef]
- Karami, H.; Aviolat, F.Q.; Azadifar, M.; Rubinstein, M.; Rachidi, F. Partial Discharge Localization in Power Transformers Using Acoustic Time Reversal. Electr. Power Syst. Res. 2022, 206, 107801. [Google Scholar] [CrossRef]
- Uwiringiyimana, J.P.; Khayam, U.; Suwarno; Montanari, G.C. Design and Implementation of Ultra-Wide Band Antenna for Partial Discharge Detection in High Voltage Power Equipment. IEEE Access 2022, 10, 10983–10994. [Google Scholar] [CrossRef]
- Fritsch, M.; Wolter, M. Transmission Model of Partial Discharges on Medium Voltage Cables. IEEE Trans. Power Deliv. 2022, 37, 395–404. [Google Scholar] [CrossRef]
- Li, H.; Zhang, Y.; Wang, X.; Chen, L.; Liu, Z.; Zhao, J. Effect of Cable Aging on Parameters in the Partial Discharge Propagation Model. In Proceedings of the 2022 IEEE International Conference on High Voltage Engineering and Applications (ICHVE), Chongqing, China, 25–29 September 2022; IEEE: New York, NY, USA, 2022; pp. 1–4. [Google Scholar]
- Anagha, E.R.; Jineeth, J.; Sindhu, T.K. A Finite Element Method Based Approach for Modeling of Partial Discharges in HVDC Cables. IEEE Electr. Insul. Conf. (EIC) 2018, 2018, 533–537. [Google Scholar]
- Kalla, U.K.; Adhikari, N.; Rustagi, A. Modeling and Investigation of Insulation Defects by Partial Discharge in HV XLPE Cable. In Proceedings of the 2018 8th IEEE India International Conference on Power Electronics (IICPE), Jaipur, India, 13–15 December 2018; IEEE: New York, NY, USA, 2018; pp. 1–6. [Google Scholar]
- Reyes, V.; Celeita, D.; Ramos, G. A Simulation Study on Locating Water Trees on Single Core XLPE Underground Cables Using Reflectometry Diagnosis Techniques. In Proceedings of the 2021 IEEE/IAS 57th Industrial and Commercial Power Systems Technical Conference (I&CPS), Las Vegas, NV, USA, 27–30 April 2021. [Google Scholar]
- Achillides, Z.; Kyriakides, E.; Georghiou, G. Partial Discharge Modeling: An Improved Capacitive Model and Associated Transients along Medium Voltage Distribution Cables. IEEE Trans. Dielectr. Electr. Insul. 2013, 20, 770–781. [Google Scholar] [CrossRef]
- Mahdipour, M.; Akbari, A.; Werle, P. Charge Concept in Partial Discharge in Power Cables. IEEE Trans. Dielectr. Electr. Insul. 2017, 24, 817–825. [Google Scholar] [CrossRef]
- Sinai, A.; Müller, T.; Hoffmann, M.; Schneider, M.; Bach, C. Multi-Physical Sensor Fusion Approach for Partial Discharge Detection on Medium Voltage Cable Connectors. In Proceedings of the 2019 2nd International Conference on High Voltage Engineering and Power Systems (ICHVEPS), Denpasar, Indonesia, 1–4 October 2019; IEEE: New York, NY, USA, 2019; pp. 202–207. [Google Scholar]
- Böttcher, B.; Schmidt, H.; Weber, F.; Peters, J.; Neumann, R. Algorithms for a Multi-Sensor Partial Discharge Expert System Applied to Medium Voltage Cable Connectors. In Proceedings of the 2019 2nd International Conference on High Voltage Engineering and Power Systems (ICHVEPS), Denpasar, Indonesia, 1–4 October 2019; pp. 190–195. [Google Scholar]
- Kumar, H.; Shafiq, M.; Kauhaniemi, K.; Elmusrati, M. Artificial Intelligence-Based Condition Monitoring and Predictive Maintenance of Medium Voltage Cables: An Integrated System Development Approach. In Proceedings of the 2024 10th International Conference on Condition Monitoring and Diagnosis (CMD), Gangneung, Republic of Korea, 20–24 October 2024; IEEE: New York, NY, USA, 2024. [Google Scholar]
- Mikušová, D.; Mikuš, P.; Smatanová, M.; Štofanik, V. Applying the Machine Learning Method to Improve Calibration Quality of Time Domain Reflectometry Measuring Technique. Adv. Sci. Technol. Res. J. 2024, 18, 3. [Google Scholar] [CrossRef]
- Wang, G.; Wang, Q.; Zhang, T.; Li, X.; Zhang, W. Partial Discharge Pattern Recognition of High Voltage Cables Based on the Stacked Denoising Autoencoder Method. In Proceedings of the 2018 International Conference on Power System Technology (POWERCON), Guangzhou, China, 6–8 November 2018; IEEE: Piscataway, NJ, USA, 2018; pp. 1919–1924. [Google Scholar]
Disclaimer/Publisher’s Note: The statements, opinions and data contained in all publications are solely those of the individual author(s) and contributor(s) and not of MDPI and/or the editor(s). MDPI and/or the editor(s) disclaim responsibility for any injury to people or property resulting from any ideas, methods, instructions or products referred to in the content. |
© 2025 by the authors. Licensee MDPI, Basel, Switzerland. This article is an open access article distributed under the terms and conditions of the Creative Commons Attribution (CC BY) license (https://creativecommons.org/licenses/by/4.0/).