Article

Effect of Combined Wave and Current Loading on the Hydrodynamic Characteristics of Double-Pile Structures in Offshore Wind Turbine Foundations

by
Yongqing Lai
1,
Li Cai
1,
Xinyun Wu
1,
Bin Wang
1,*,
Yiyang Hu
2,
Yuwei Liang
2,
Haisheng Zhao
2 and
Wei Shi
2
1
Power China Huadong Engineering Corporation Limited, Hangzhou 311100, China
2
State Key Laboratory of Coastal and Offshore Engineering, Dalian University of Technology, Dalian 116024, China
*
Author to whom correspondence should be addressed.
Energies 2025, 18(10), 2573; https://doi.org/10.3390/en18102573
Submission received: 17 April 2025 / Revised: 27 April 2025 / Accepted: 13 May 2025 / Published: 15 May 2025
(This article belongs to the Topic Wind, Wave and Tidal Energy Technologies in China)

Abstract

:
The multi-pile structure is a common and reliable foundation form used in offshore wind turbines (such as jacket-type structures, etc.), which can withstand hydrodynamic loads dominated by waves and water flow, providing a stable operating environment. However, the hydrodynamic responses between adjacent monopiles affected by combined wave and current loadings are seldom revealed. In this study, a generation module for wave–current combined loading is developed in waves2Foam by considering the wave theory coupled current effect. Subsequently, a numerical flume model of the double-pile structure is established in OpenFOAM based on computational fluid dynamics (CFD) and SST k-ω turbulence theory, and the hydrodynamic characteristics of the double-pile structure are investigated. It can be found that, under the combined wave–current loading, the maximum wave run-up at the leeward side of the upstream monopile is significantly reduced by about 24% on average compared with that of the individual monopile when the spacing is 1.25 and 1.75 times the wave length. At the free water surface height, the maximum discrepancy between the maximum surface pressure on the downstream monopile and the corresponding result of the individual monopile is significantly reduced from 37% to 19%. Compared to the case applying the wave loading condition, the wave–current loading reduces the influence of spacing on the wave run-up along the downstream monopile surface, the maximum surface pressure at specific positions on both upstream and downstream monopile, and the overall maximum horizontal force acting on the double-pile structure.

1. Introduction

As the earth’s land resources are gradually being developed and consumed, resource extraction is gradually shifting from land to sea. Therefore, various marine structures are being utilized [1] to exploit ocean resources [2], such as offshore wind energy [3]. As large-scale constructions, marine structures are affected by various oceanic loads [4]. Extensive research has been conducted to investigate the reliability and stability of wind turbine foundations. Ali et al. [5] and Cai et al. [6] reveal that floating offshore wind turbines experience large displacement responses under wave–current loading. In contrast, fixed offshore wind turbines are less prone to large displacements and are widely used in existing ocean engineering. Fixed foundations such as monopiles and jackets are often used as supporting structures for marine structures in engineering [7], where the cylindrical monopile structure is the most common structural unit [8]. When the monopile foundation structure is in the marine environment, it is subjected to hydrodynamic loads dominated by waves and currents, which affects the safety and stability of marine structures [9]. Therefore, it is particularly important to investigate the hydrodynamic characteristics of monopile foundation structures.
Numerous studies have investigated the hydrodynamic characteristics of monopiles under wave conditions. Regarding nonlinear waves, Xie et al. [10] developed a numerical model to investigate the interaction between solitary waves and monopiles on a sloping seabed. The numerical results show that the model has high accuracy in simulating solitary waves and wave height variation around monopiles. Schløer et al. [11] analyzed the hydrodynamic load characteristics acting on monopiles by considering the nonlinear effect of waves. Zeng et al. [12] investigated the effect of breaking waves on monopile-type OWT at different locations on the edge of a 1:25 slope through a combination of numerical and experimental methods. Zhu et al. [13] proposed modified empirical formulas for calculating the slamming co-efficient for breaking regular and irregular waves on monopiles. Shi et al. [14] analyzed the wave run-up and the interaction between the nonlinear wave load and the monopile at different locations around the monopile, providing insight into the design of monopile foundations for specific wave breaking conditions. And a number of scholars have considered fluid dynamics modeling to more accurately determine the mechanical parameters of the contact surface between the fluid and the structure [15,16]. These studies reveal the interaction between nonlinear waves and monopiles and present models and empirical formulas with high accuracy, which are beneficial for designing safer and more stable monopiles under nonlinear conditions. Regarding regular waves, Tang et al. [17] carried out a hydrodynamic analysis of monopile structures under the action of regular waves, revealing the effect of an anti-icing protection device on the wave run-up and pressure distribution on the monopile surface. Li et al. [18] proposed a three-dimensional scaled boundary finite element model (SBFEM) to investigate the structural responses of the monopile foundation when exposed to ocean waves. Lin et al. [19] investigated the wave run-up phenomenon in a monopile structure based on the computational fluid dynamics (CFD) method, and obtained semi-empirical formulas for specific environments. These studies refine the monopile model under linear wave conditions and also investigate the effect of waves on monopiles under specific operating conditions, providing a theoretical basis for designing monopiles under different operating conditions. Although these studies are able to reveal the hydrodynamic characteristics of various waves on the monopile, the foundation part of most marine structures consists of a multi-pile structure, and the influence between piles should not be ignored. Therefore, it is important to carry out hydrodynamic analysis of double-pile structures under wave action.
Some scholars have researched the hydrodynamic characteristics of double piles under wave loading. Wang et al. [20] conducted a comparative study of the transient seafloor response induced by random waves around a monopile and double pile on the seafloor, finding that the hydrodynamic characteristics of the double pile are related to the relative spacing. Chen et al. [8] discussed the effect of double-pile spacing on wave run-up on the surface of the front and rear monopile surfaces based on Berkhoff’s gentle slope equations and the finite element method. Yao et al. [21] analyzed the effects of variations in wave run-up and impact force on the monopile in view of wave nonlinearity and the ratio of monopile spacing to diameter by developing a numerical model. Koraim et al. [22] experimentally and theoretically investigated the wave transmission, reflection, and energy dissipation of a double row of vertical monopiles suspended with horizontal C-bars under normal regular waves, and developed a theoretical model that could effectively estimate hydrodynamic characteristics. These studies illustrate the effects of factors such as spacing between double piles, pile diameter, etc., on wave run-up, impact force, energy dissipation, etc., and establish theoretical models with high accuracy. However, in real marine environments, in addition to the wave load, the current load cannot be ignored. For example, Chen et al. [23] investigated the variations in pore water pressure around the monopile in time and space using wave flume experiments, finding that the hydrodynamic response and seabed response caused by the combined wave–current loading are significantly different from those caused by wave loading. Based on this conclusion, it is important to consider combined wave–current loading when carrying out hydrodynamic analyses. Thus, some scholars have carried out hydrodynamic characterization of monopiles under combined wave–current loading. Cheng et al. [24] investigated the scour characteristics and their influence factors around inclined monopiles and vertical monopiles at a certain inclination range under combined wave–current loading. Chen et al. [25] concluded that the most effective way to reduce monopile deflection is to increase the buried depth of the monopile by studying the deformation of the monopile under combined wave–current loading. Shi et al. [26] investigated the influencing factors of local scour around a monopile under the action of wave–current–vibration action, and established an empirical formula to predict the depth of local scour of the monopile under the action of wave–current–vibration. The correlation between the average velocity-based Froude number (Fr(a)) and the equilibrium scour depth (S/D) of offshore monopile foundation under the combined wave–current loading action was proposed by Qi et al. [27]. An empirical expression for the correlation between S/D and Fr (a) is given for predicting equilibrium scour depth, which may provide a guide for offshore engineering practice. Büchmann et al. [28] concluded from the results of numerical flume experiments that the current load has a significant effect on the wave run-up distance on the surface of the monopile structure. Hong et al. [29] investigated the interaction between the monopile foundation structure and combined wave–current loading and obtained the resistance coefficient of a large-sized monopile foundation.
In general, most of these studies considered the effect of combined wave–current action on the scour depth, wave run-up, and resistance of monopiles, and some theoretical and empirical formulas have been derived. For the double-pile structure, most of the studies are related to the case of wave loading action. Few studies have analyzed the hydrodynamic characteristics of a double-pile structure under combined wave–current loading. Therefore, based on OpenFOAM open-source software, this study carries out the secondary development of the waves2Foam open-source toolkit to generate the combined wave–current loading, and the effects of current and spacing on the hydrodynamic characteristics of the double-pile structure are investigated using CFD and a k-ω turbulence model.

2. Theoretical Method

The heat transfer and compressibility of the fluid are generally not considered in the hydrodynamic analysis. Thus, the fluid in the computational domain can be described using the Reynolds time-averaged Navier-Stokes equation:
ρ u i x i = 0
ρ u i t + ρ u i u j x j = P x i + ρ g + x j μ e f f u i x j + u j x i
where u i is the mean velocity component in the corresponding direction; x 1 ,   x 2 , and x 3 correspond to the coordinates of x ,   y ,   a n d   z directions, respectively; t is time; ρ is the density of the fluid; μ is the dynamic viscosity; μ t is the additional viscosity; p is the pressure; and k is the turbulent kinetic energy.
For the two-phase current problem, the volume of fluid (VOF) method is usually used to track and capture the interface between the air phase and the water phase. The governing equation of the phase volume fraction and its corresponding fluid state are as follows:
α t + u i α x i + u r , i α ( 1 α ) x i = 0
α = 1 w a t e r   p h a s e 0 < α < 1 i n t e r f a c e α = 0 a i r   p h a s e
where u r , i is the artificial velocity field component suitable for the compression interface.
Based on the corresponding relationship in Equation (4), the fluid density and effective dynamic viscosity in each mesh need to be weighted:
ρ = α ρ w a t e r + ( 1 α ) ρ a i r
μ e f f = α μ e f f , w a t e r + 1 α μ e f f , a i r
where ρ w a t e r and ρ a i r are the densities of the water phase and air phase, respectively; and μ e f f , w a t e r and μ e f f , a i r are the effective dynamic viscosity of the water phase and air phase, respectively.
The k-ω turbulence model is able to accurately describe the flow within the boundary layer compared to the k-ε turbulence model, but it is not suitable for the simulation of free flow. Therefore, the corrected SST k-ω turbulence model is applied in this study to simulate the turbulence state of the flow field, which is suitable for simulations including both free flow and the boundary layer:
t ρ k + x j ρ k u j = P k β * ρ ω k + x j   [ ( μ + σ k μ t ) k x j ]
t ρ ω + x j ρ u j ω = γ ρ μ t P k β ρ ω 2 + x j μ + σ ω μ t ω x j + 2 ( 1 F 1 ) ρ σ ω 2 ω k x j ω x j
P k = m i n τ i j u i x j ,   10 β * k ω
τ i j = μ t u i x j + u j x i 2 3 u k x k δ i j 2 3 ρ k δ i j
where P k is the turbulent kinetic energy generated by the average velocity gradient and ω is the turbulent dissipation rate. The calculation formulas of parameters σ k , σ ω , γ , and β are as follows:
ϕ = ϕ 1 F 1 + ϕ 2 ( 1 F 1 )
F 1 = tanh ( a r g 1 4 )
a r g 1 = min max 2 k β * ω d , 500 μ ρ d 2 ω , 4 ρ σ ω 2 k C D k ω d 2
C D k ω = max 2 ρ σ ω 2 1 ω k x j ω x j , 10 20
where β * = 0.09 ; d is the distance from the boundary; ϕ is the calculation variable, σ k , σ ω , γ , and β ; and ϕ 1 and ϕ 2 correspond to each calculated variable, including σ k 1 = 0.85 , σ k 2 = 1.0 , σ ω 1 = 0.50 , σ ω 2 = 0.856 , γ 1 = 0.5532 , γ 2 = 0.4403 , β 1 = 0.075 , and β 2 = 0.0828 .
According to the loading conditions selected in this study, the second-order Stokes wave theory is selected for numerical wave generation, and the current load effect is introduced into the wave theory formula as follows:
Potential function:
ϕ = u c u r r e n t x + π H k T cosh k z + h sinh k h sin θ + 3 8 π 2 H k T H L cosh 2 k z + h sinh 4 k h sin 2 θ
Wave surface equation:
η = H 2 cos θ + H k 8 cosh k h 2 cosh 2 k h + 1 sinh 3 k h cos 2 θ
Water quality point velocity:
u = u c u r r e n t + H 2 ω cosh k z + h sinh k h cos θ + 3 8 H k cosh 2 k z + h sinh 4 k h cos 2 θ
v = H 2 ω sinh k z + h sinh k h sin θ + 3 8 H k sinh 2 k z + h sinh 4 k h sin 2 θ
where H is the wave height; T is the wave period; L is the wave length; and h is the water depth. In addition, θ = k x ω t ; k is the wave number, k = 2 π L ; ω is the circular frequency, ω = 2 π T + k u c u r r e n t ; and u c u r r e n t is the velocity of the current load in the same direction as the wave transfer.

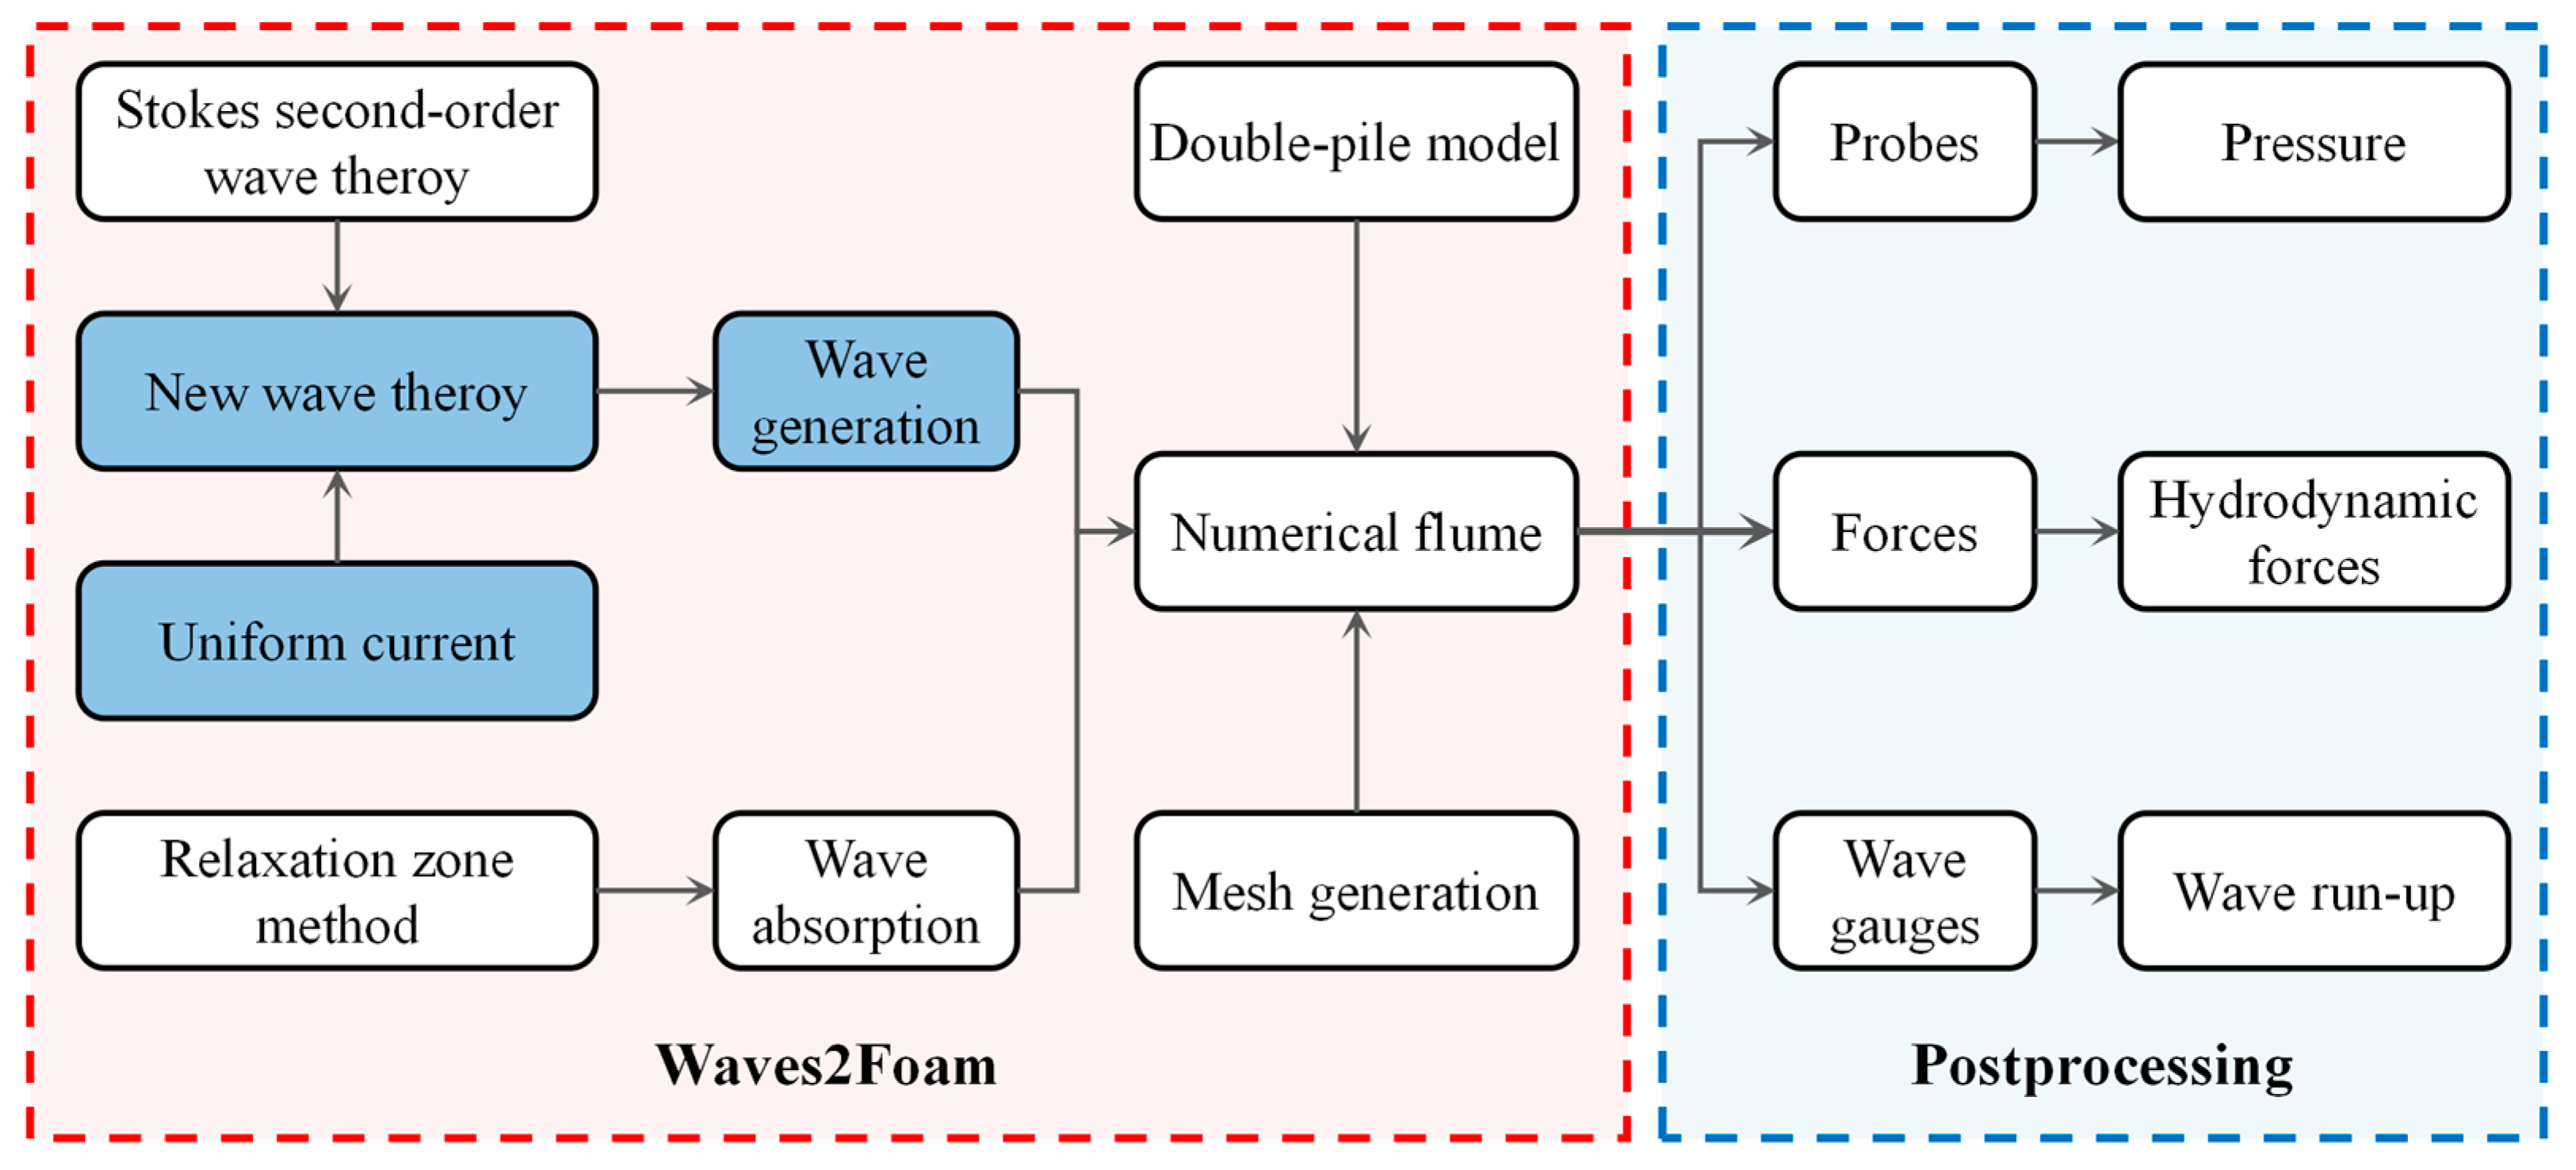
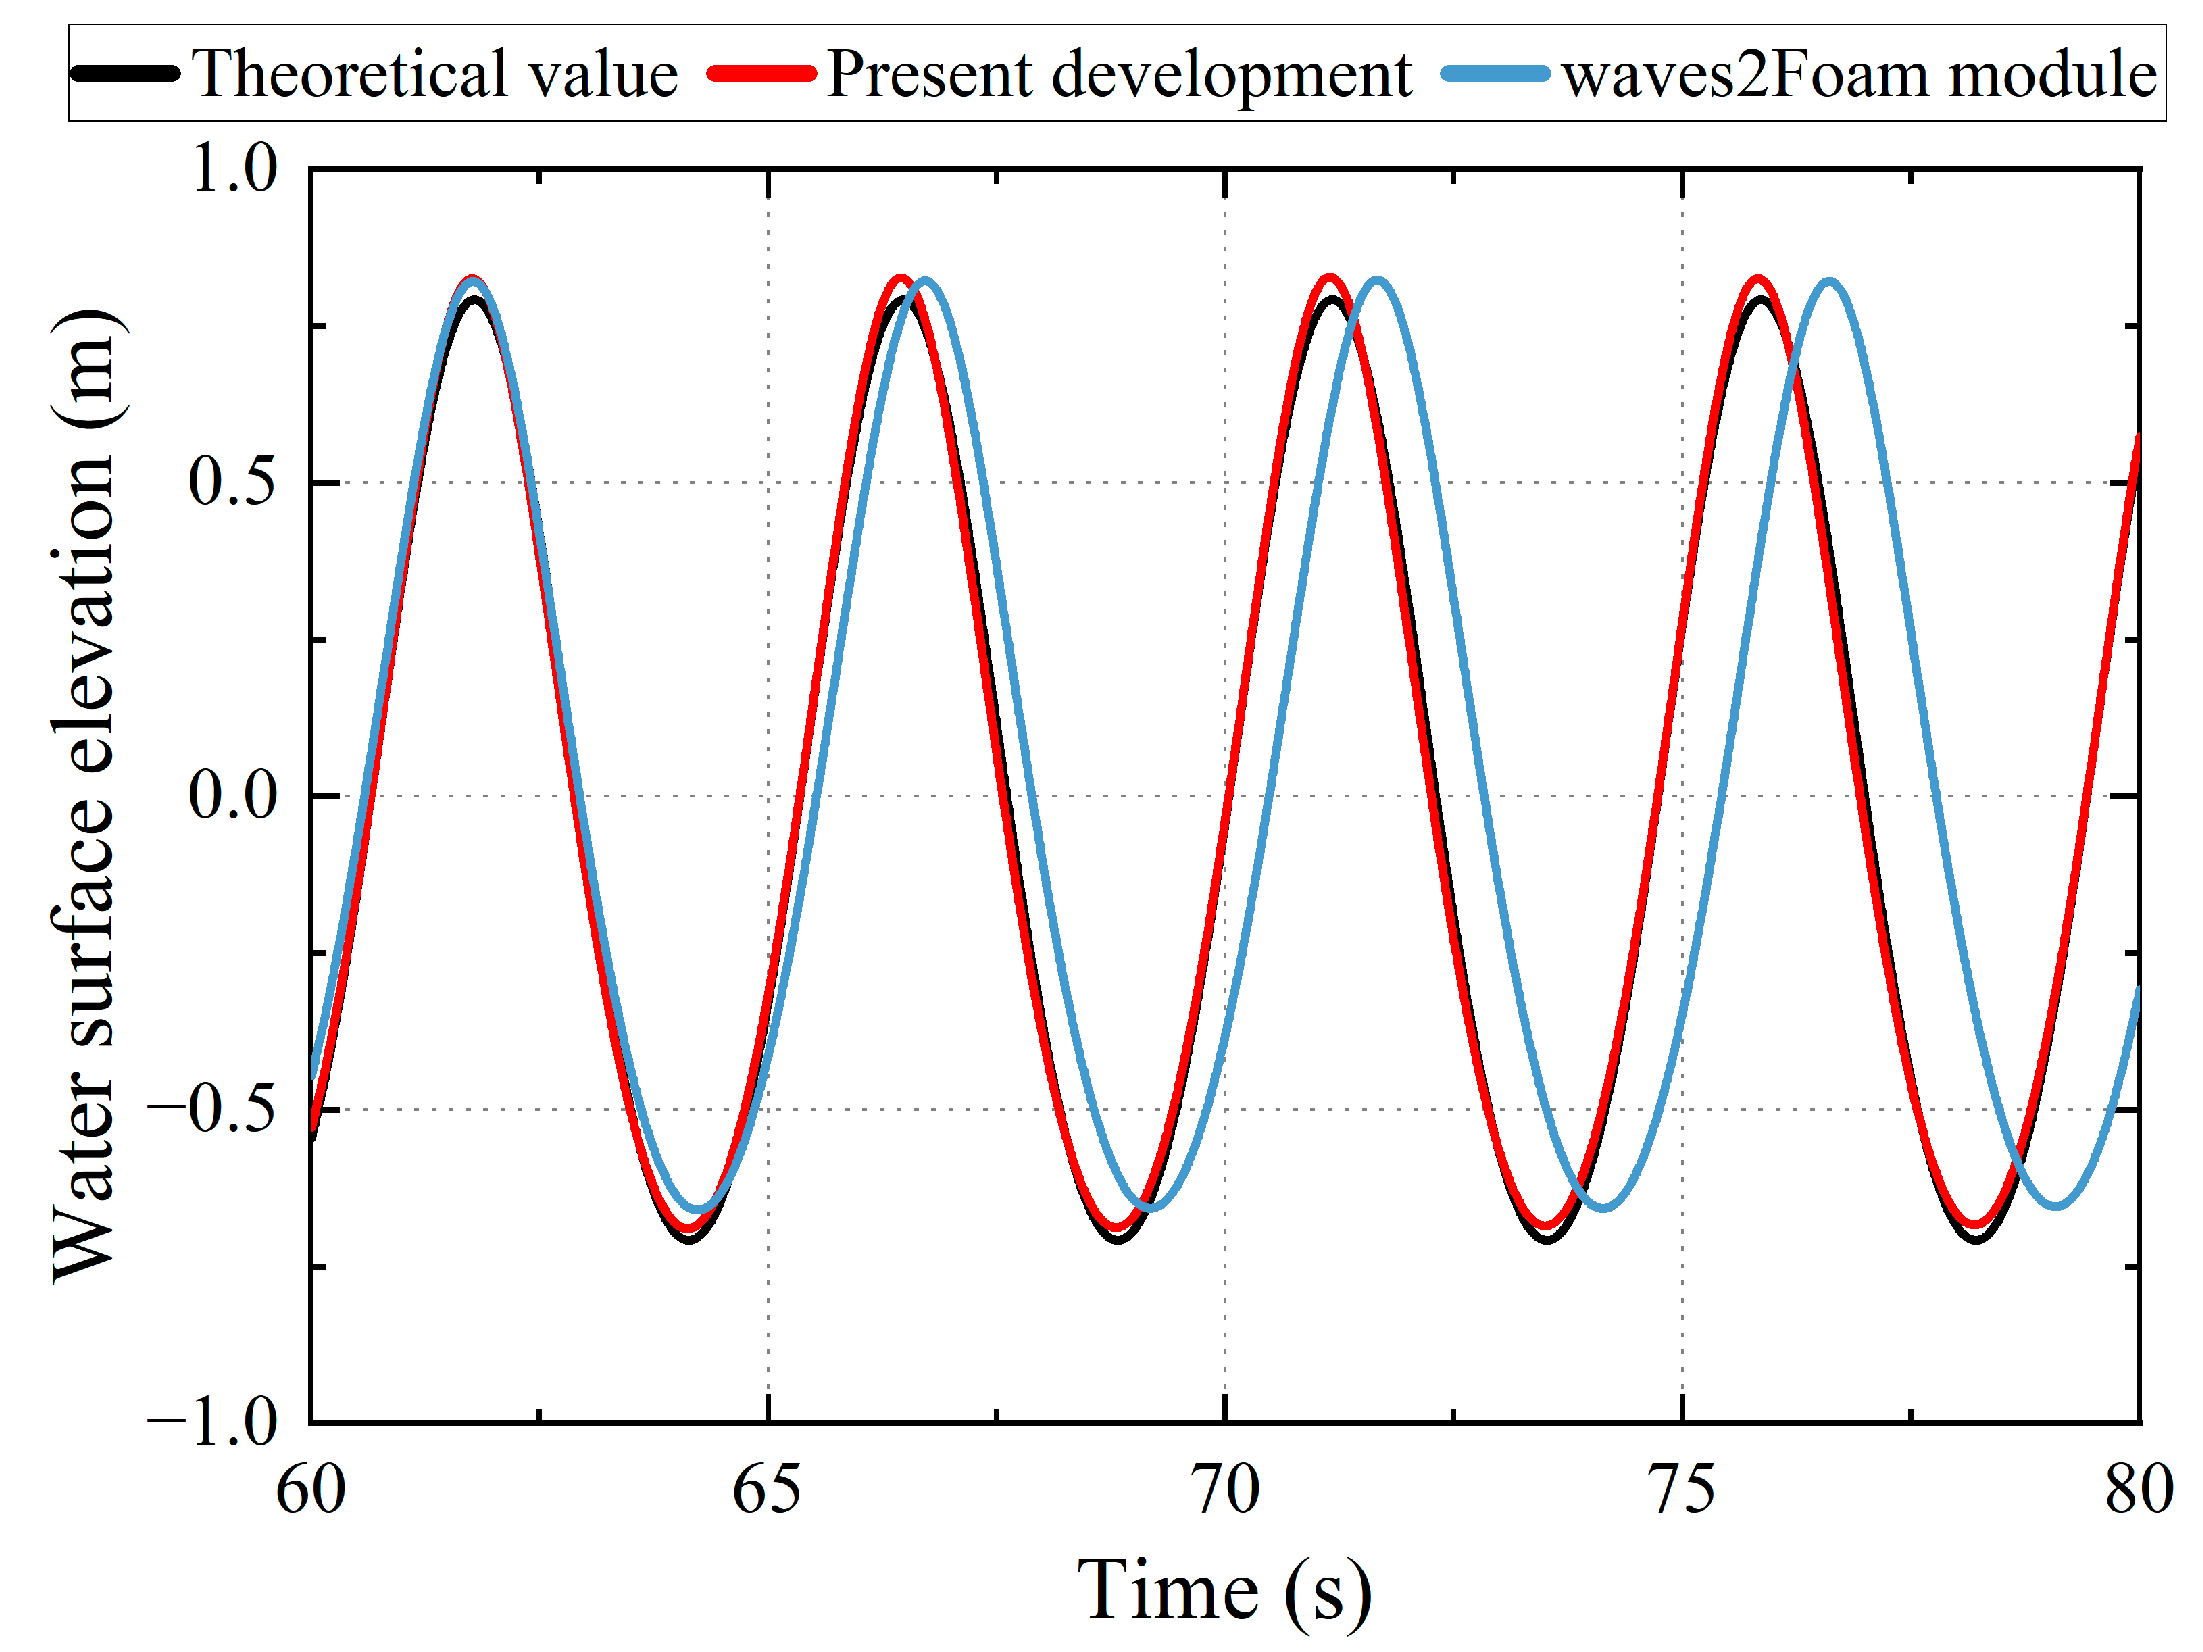
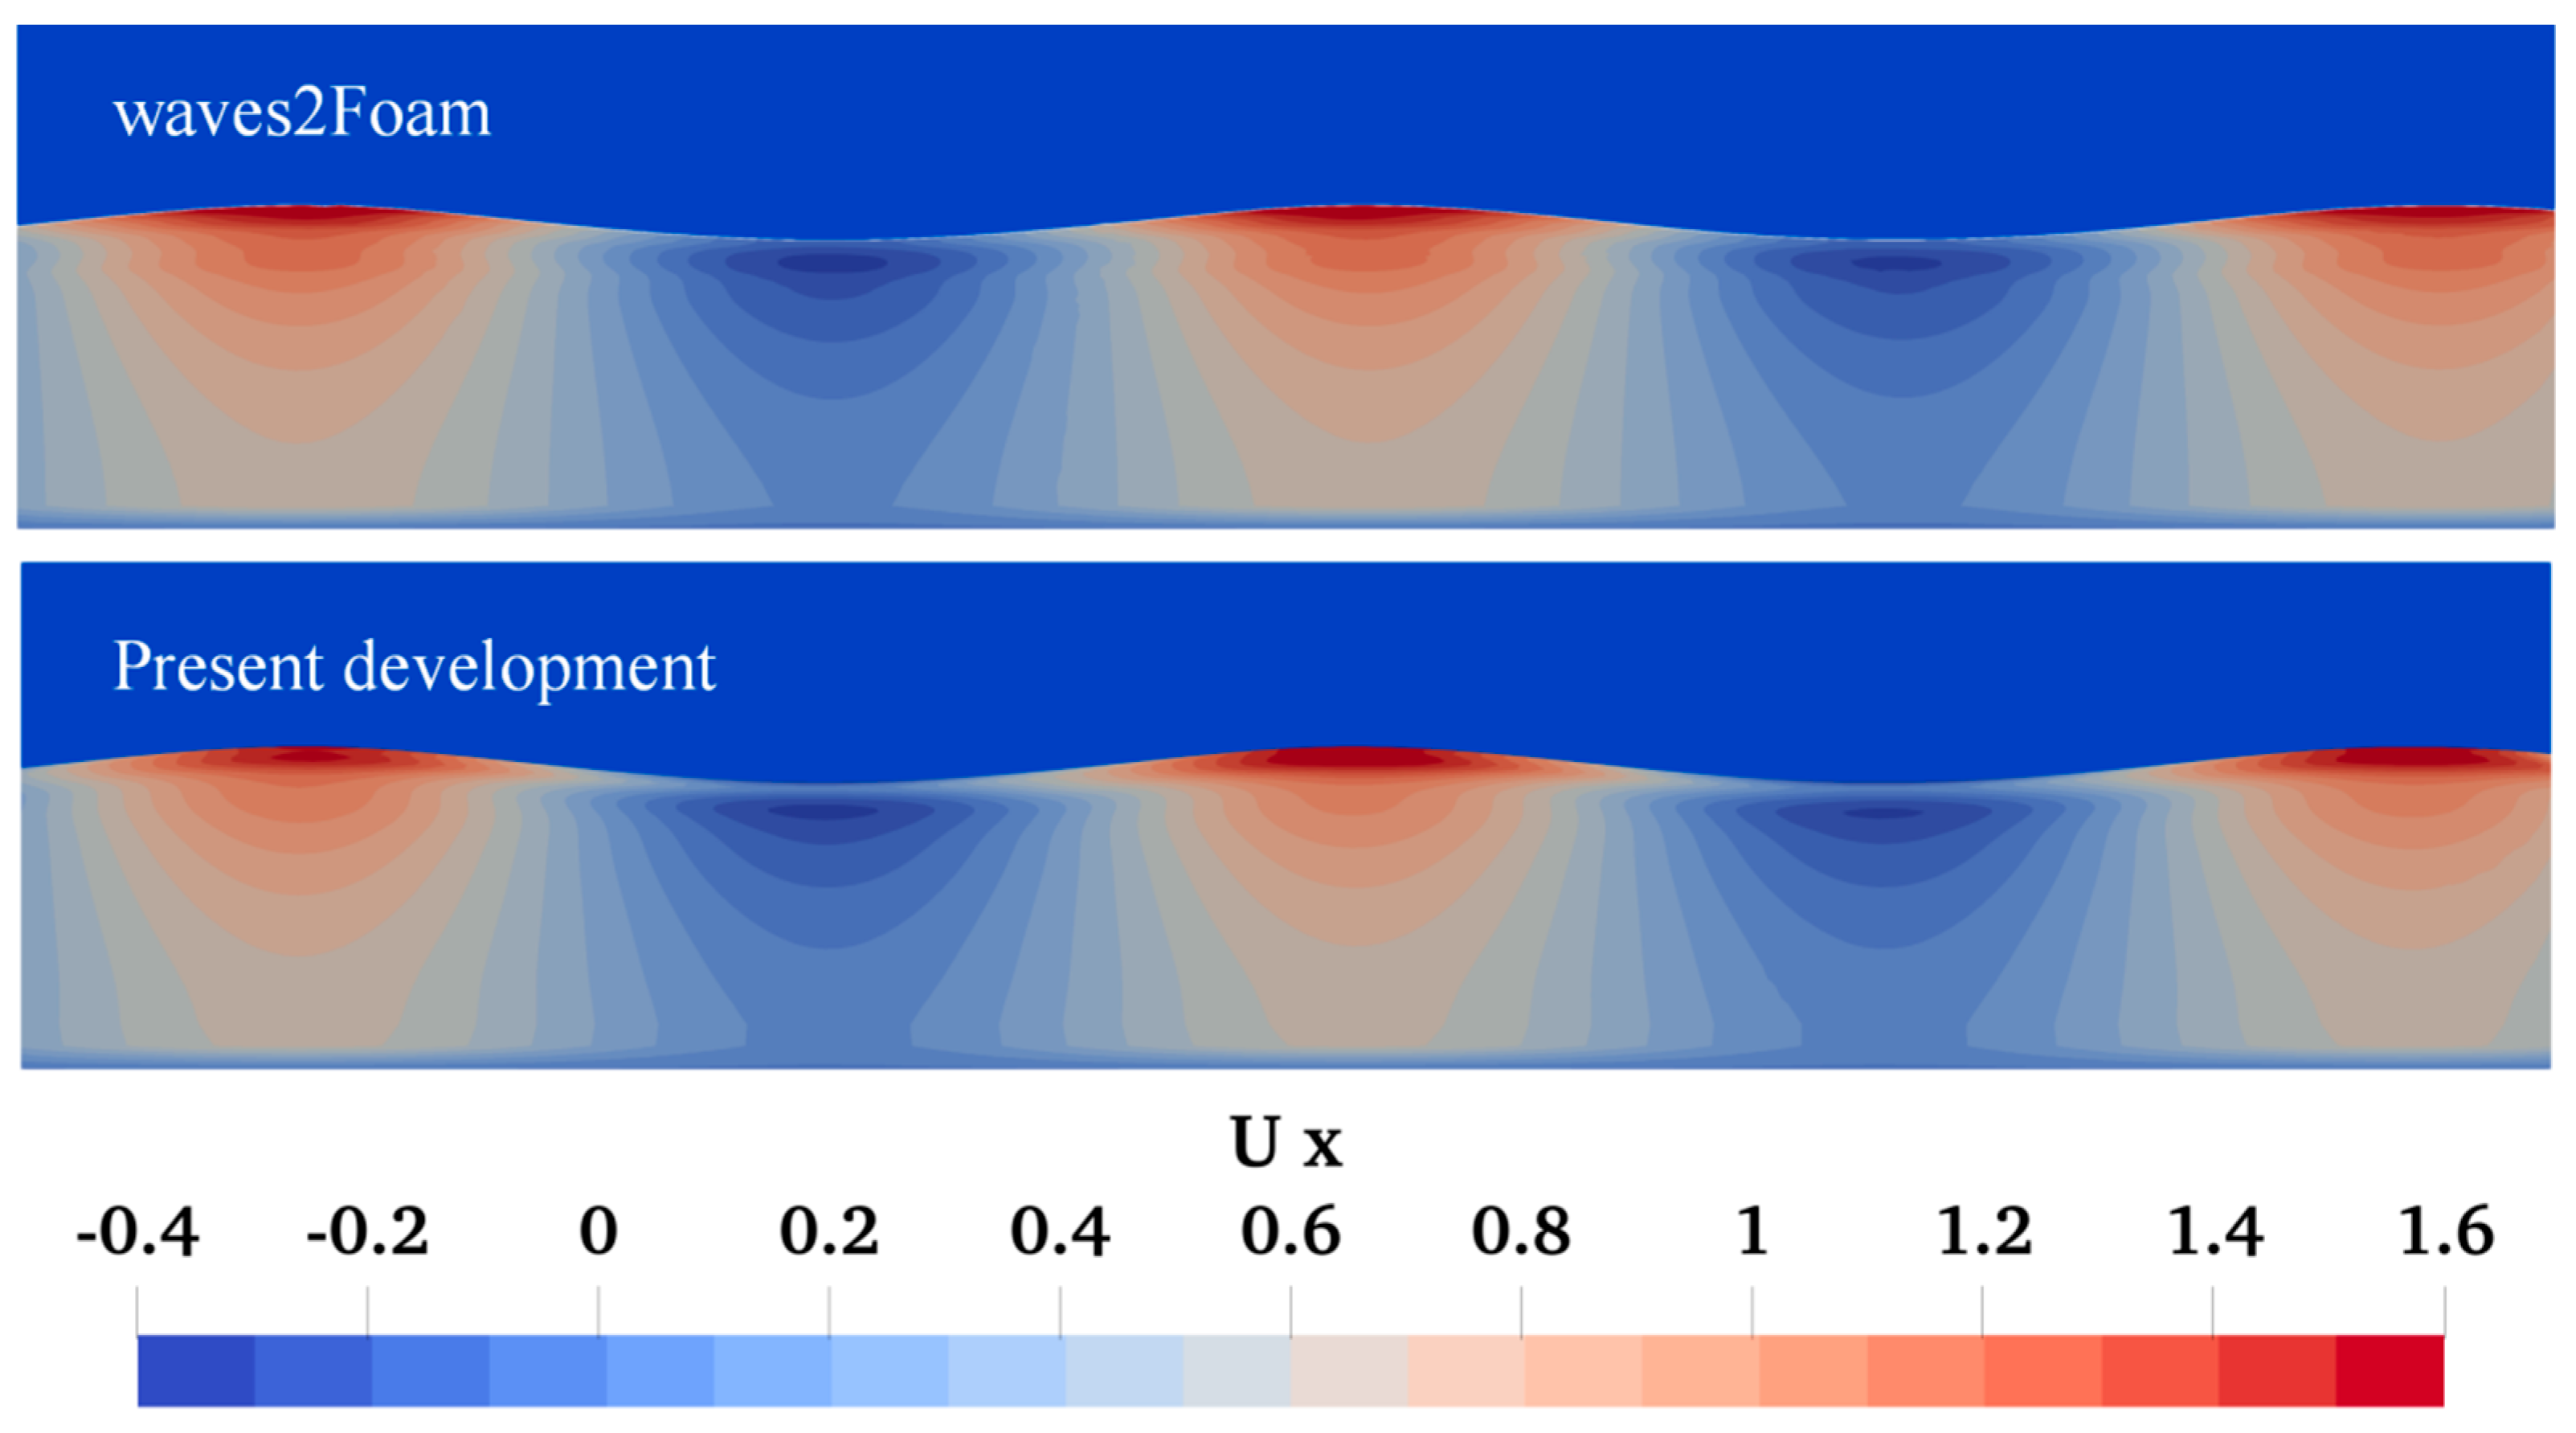
3. Establishment and Verification of the Numerical Model

In order to carry out the hydrodynamic analysis of a double-pile structure under combined wave–current action, this study establishes a numerical model based on OpenFOAM open source software, and its layout diagram is shown in Figure 1. The whole computational domain is divided into three parts along the x-axis direction, including the wave generation zone, working zone, and wave absorption zone. The length of the wave generation zone ( L g ) is not less than two times that of the wave length; in the working zone, the distance from the center of the monopile to the wave generation zone and the wave absorption zone ( L w ) is not less than one wave length; the working water depth of the flume is 10 m; the width of the flume is set to be eight times that of the diameter of the monopile to reduce the boundary effect, and symmetric boundary conditions are applied to the boundary on both sides. Meanwhile, Figure 1 shows the selection of other boundary conditions of the numerical flume; the inlet boundary and the outlet boundary are chosen as the velocity inlet boundary condition and pressure outlet boundary condition, respectively; the bottom boundary and the monopile surface are both no-slip boundary conditions; the top atmospheric boundary is set as the convolution boundary condition. Moreover, the artificial relaxation zone is introduced into the wave generation zone and wave absorption zone to realize numerical wave generation and wave dissipation processing, respectively.
The computing mesh is generated using the mesh generation tool blockMesh and snappyHexMesh in OpenFOAM-v2206 open-source software. Firstly, the basic mesh of the numerical flume without a cylindrical monopile is generated, and the meshing method in the wave generation zone and the working zone is kept in the same way; the size of the mesh in the wave absorption zone along the x direction increases at a ratio of 1.03 to save computing resources and increase numerical loss. Based on previous studies [30], the quality of the mesh in the range of one times the wave height above and below the water surface has a great influence on the calculation accuracy, namely, the size of the mesh in the z-direction and the aspect ratio of the mesh (the ratio of the size in the x-direction to the size in the z-direction), and the computational time step is also an important factor. Therefore, the mesh in this region is refined, and its size in the z-direction is selected as H /10, the mesh aspect ratio is selected as 4, and the time step is set to T /1000, where the rationality of this meshing method and time step setting has been verified [30].
Furthermore, waveIsoFoam solver in waves2Foam is utilized to solve the numerical flume, where the pressure–velocity coupling equation is solved using the PISO-SIMPLE algorithm. For accurate computation, IsoAdvector format is employed to improve the accuracy of solving VOF equations by using the geometric reconstruction method; meanwhile, the multi-dimensional universal limiter with explicit solution (MULES) is applied to ensure both precision and boundedness in the simulation. The convective term is discretized using a second-order upwind numerical scheme, and the relaxation factor is set to 0.1. An overview of the computational process is illustrated in Figure 2.
In order to realize the combined wave–current loading condition, a combined wave–current loading module based on Equations (16) and (17) is developed in the open source toolkit waves2Foam to replace the original individual wave loading module. Although the “combinedWaves” class in waves2Foam can also generate wave and current loads simultaneously, it only realizes linear superposition and does not consider the coupling phenomenon of the two [31], namely, the Doppler effect. However, the combined wave–current loading module developed in this study can consider this coupling effect. Then, the loading conditions in Table 1 are used for verification. As shown in Figure 3, it can be seen that the combined wave–current loading conditions generated by the self-developed module are not much different from the theoretical conditions, and the frequency is faster than that given by the built-in waves2Foam module, which ignores the Doppler phenomenon. At the same time, Figure 4 shows the comparison results of the velocity field, which further verifies the accuracy of the module developed in this study.
Based on the numerical flume mesh without a monopile structure, a cylindrical monopile structure with a diameter of 6 m is placed at the center of the working zone. In view of the influence of the quality of the monopile surface and the surrounding mesh on the calculation accuracy, the mesh at this position is refined in this study, and three mesh division methods are proposed (Figure 5). The horizontal force on the monopile structure is calculated, respectively, and the mesh convergence analysis is carried out. From Figure 6a–c, it can be seen that the medium-type mesh has already satisfied the accuracy requirements in horizontal force, surface pressure, and water run-up. Thus, this meshing method is adopted in the subsequent investigation, which is implemented by subdividing the mesh of the monopile surface three times according to the octree method, and ensuring that the mesh is not less than 10 layers for each transition area. Furthermore, in order to verify the modeling method, boundary condition, and parameter setting in this study, the classical physical experiment carried out by Robertson et al. [32] is chosen for comparative verification, where the experimental parameters are shown in Table 2. Based on the modeling method and parameter setting scheme of this study, the numerical simulation results obtained via CFD calculation are compared to the corresponding experiment data. As shown in Figure 6d, the difference between them can be ignored, indicating that the modeling method and parameter settings in this study are correct.

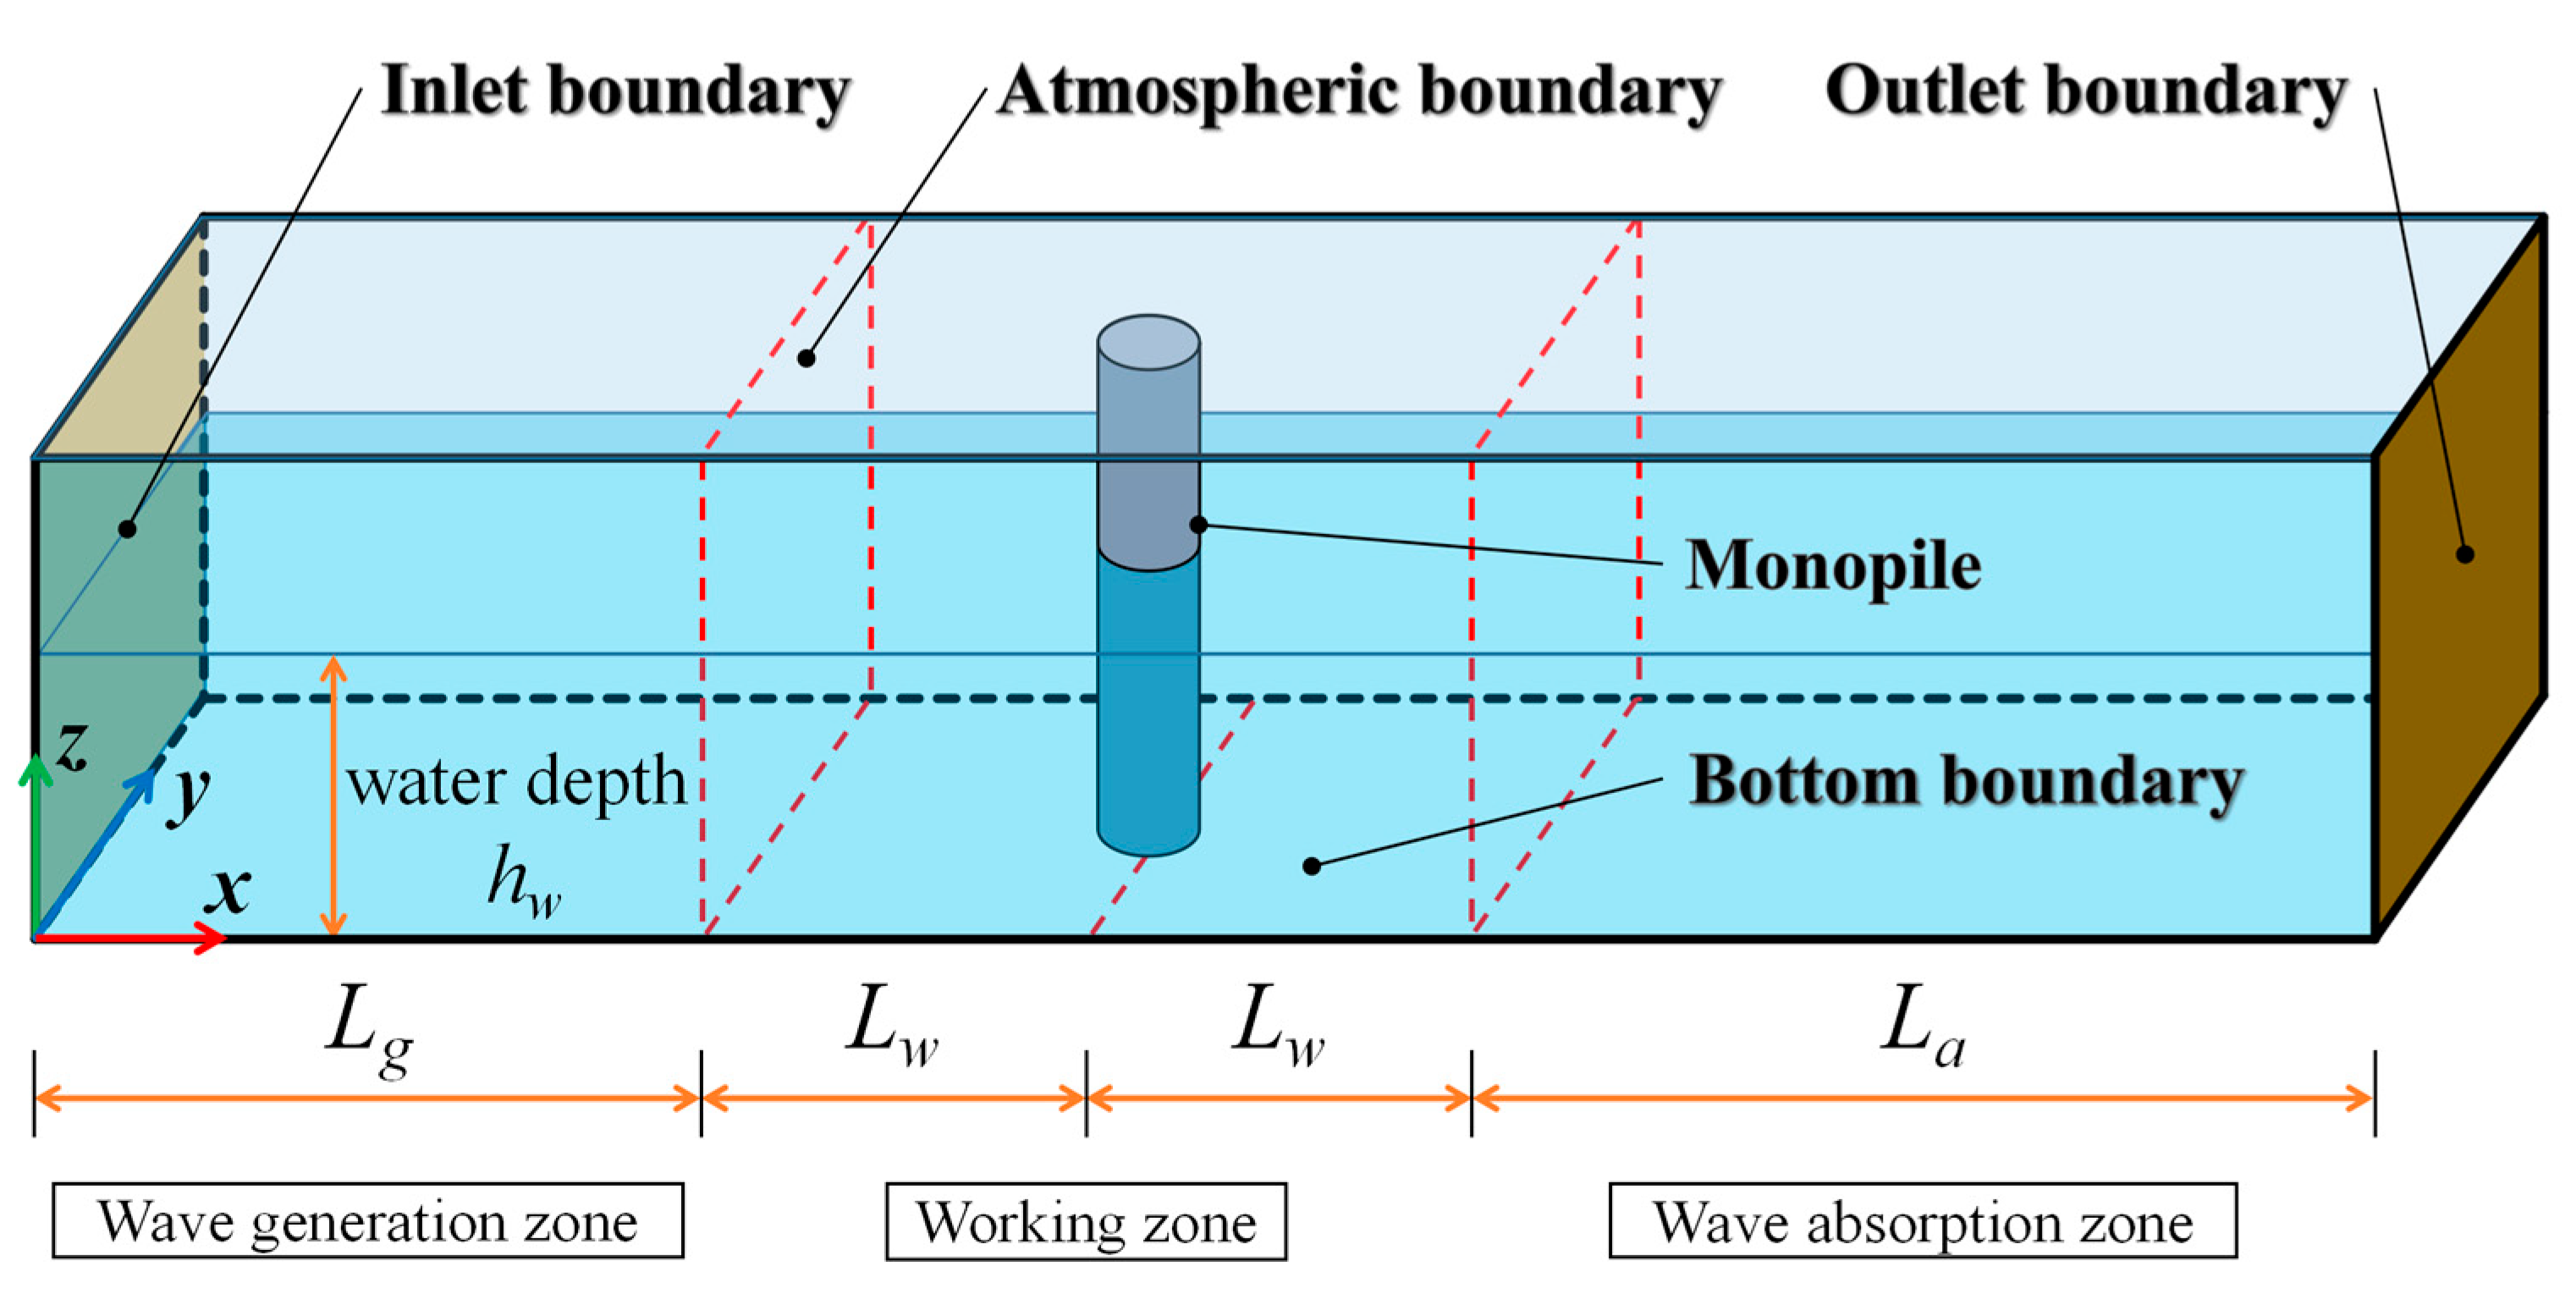
4. Computational Domain and Boundary Conditions

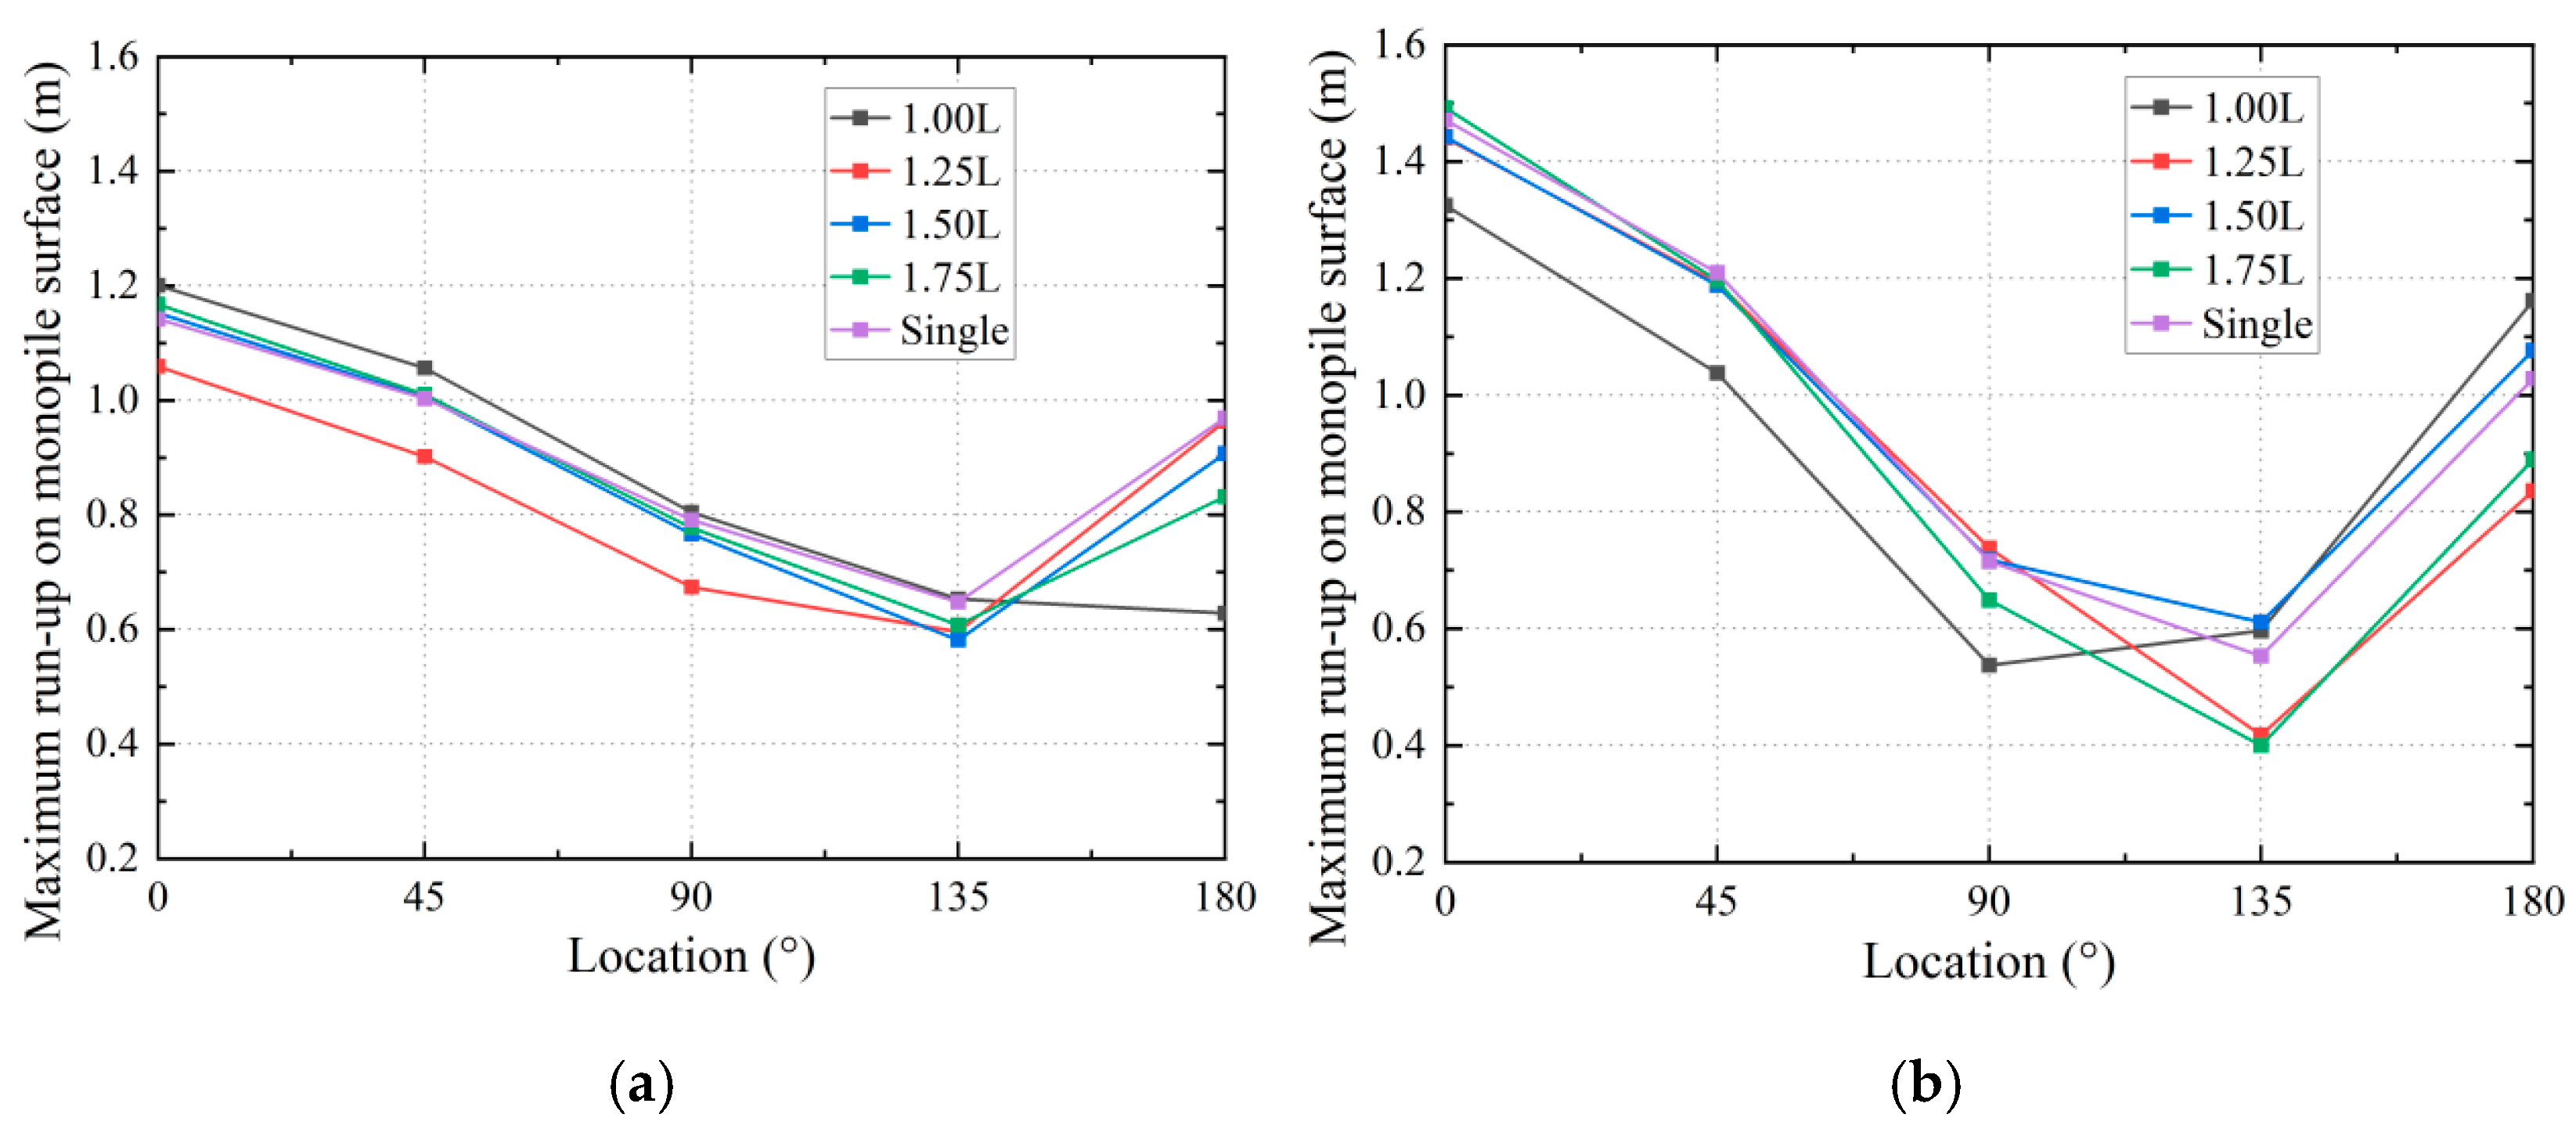
4.1. Wave Run-Up on the Monopile Surface

Relying on the generation module for combined wave–current loading developed in waves2Foam and the numerical flume established in Section 3, the hydrodynamic analysis of the double-pile structure under wave–current loading is carried out by applying the loading conditions listed in Table 3, where the layout diagram of the wave gauge monitoring point is shown in Figure 7. The distribution of the maximum wave run-up on the double-pile surface in one period under different spacings is obtained.
As shown in Figure 8a, the maximum wave run-up on the upstream monopile surface at positions from 0° to 135° is greater than the results of the individual monopile case when the spacing is one times the wave length, for the case of separate waves. The reason is that the spacing for this case satisfies the generation condition of the wave loop [8], inducing the superposition of the reflected wave with the incoming wave to increase the maximum wave run-up; the differences are shown in Figure 9a and Figure 10a. In addition, it is observed that the maximum wave run-up at the 180° position is significantly reduced by about 35%, which is due to the blockage effect of the reflected wave on the fluid confluence behind the monopile. When the spacing is 1.25 times that of the wave length, it satisfies the generation condition of the wave trough [8]. This induces the reflected wave to counteract the incident wave, resulting in an average decrease of about 10% in wave run-up from 0° to 135° compared to the individual monopile, as shown in Figure 9a and Figure 11a. As the spacing increases further, the change in the maximum wave run-up on the upstream monopile surface is no longer significant.
After considering the combined wave and current effects shown in Figure 8b, the maximum wave run-up on the waveward side of the upstream monopile is significantly increased. However, when the spacing is one times the wave length, the wave–current loading reflected by the downstream monopile counteracts the partial effect of the incoming wave–current loading, as shown in Figure 12, resulting in the maximum wave run-up on the waveward side of the upstream monopile being significantly less than that of the individual monopile, where the average reduction is about 16% (Figure 9b and Figure 10b); this phenomenon ceases to be significant with larger spacing. With a spacing of 1.25 and 1.75 times the wave length, the wave run-up on the leeward side of the upstream monopile is significantly reduced by about 24% on average (Figure 9b and Figure 11b), because the conditions for wave valley formation are satisfied by the present spacing [8] and the current loading aggravates the fluid shedding phenomenon behind the upstream monopile.
The distribution of wave run-up on the surface of the downstream monopile under different spacings is shown in Figure 13, where it is observed that the maximum wave run-up on the surface of the downstream monopile under wave action gradually reduces with increasing spacing, showing a large discrepancy from the individual monopile case, with the maximum discrepancy being about 41%. This is attributed to wave attenuation induced by the dissipation effect of turbulence during wave transport downstream. However, after considering the combined wave–current loading, the discrepancy between the maximum wave run-up on the downstream monopile surface and the corresponding result from the individual monopile simulation are relatively less when the spacing is changed, with a maximum discrepancy of about 29%; meanwhile, it is found that the combined wave–current loading attenuates the effect of spacing on the wave run-up on the downstream monopile surface. The reason for this is that the effect of current accelerated wave propagation, thereby reducing the wave attenuation along the route.

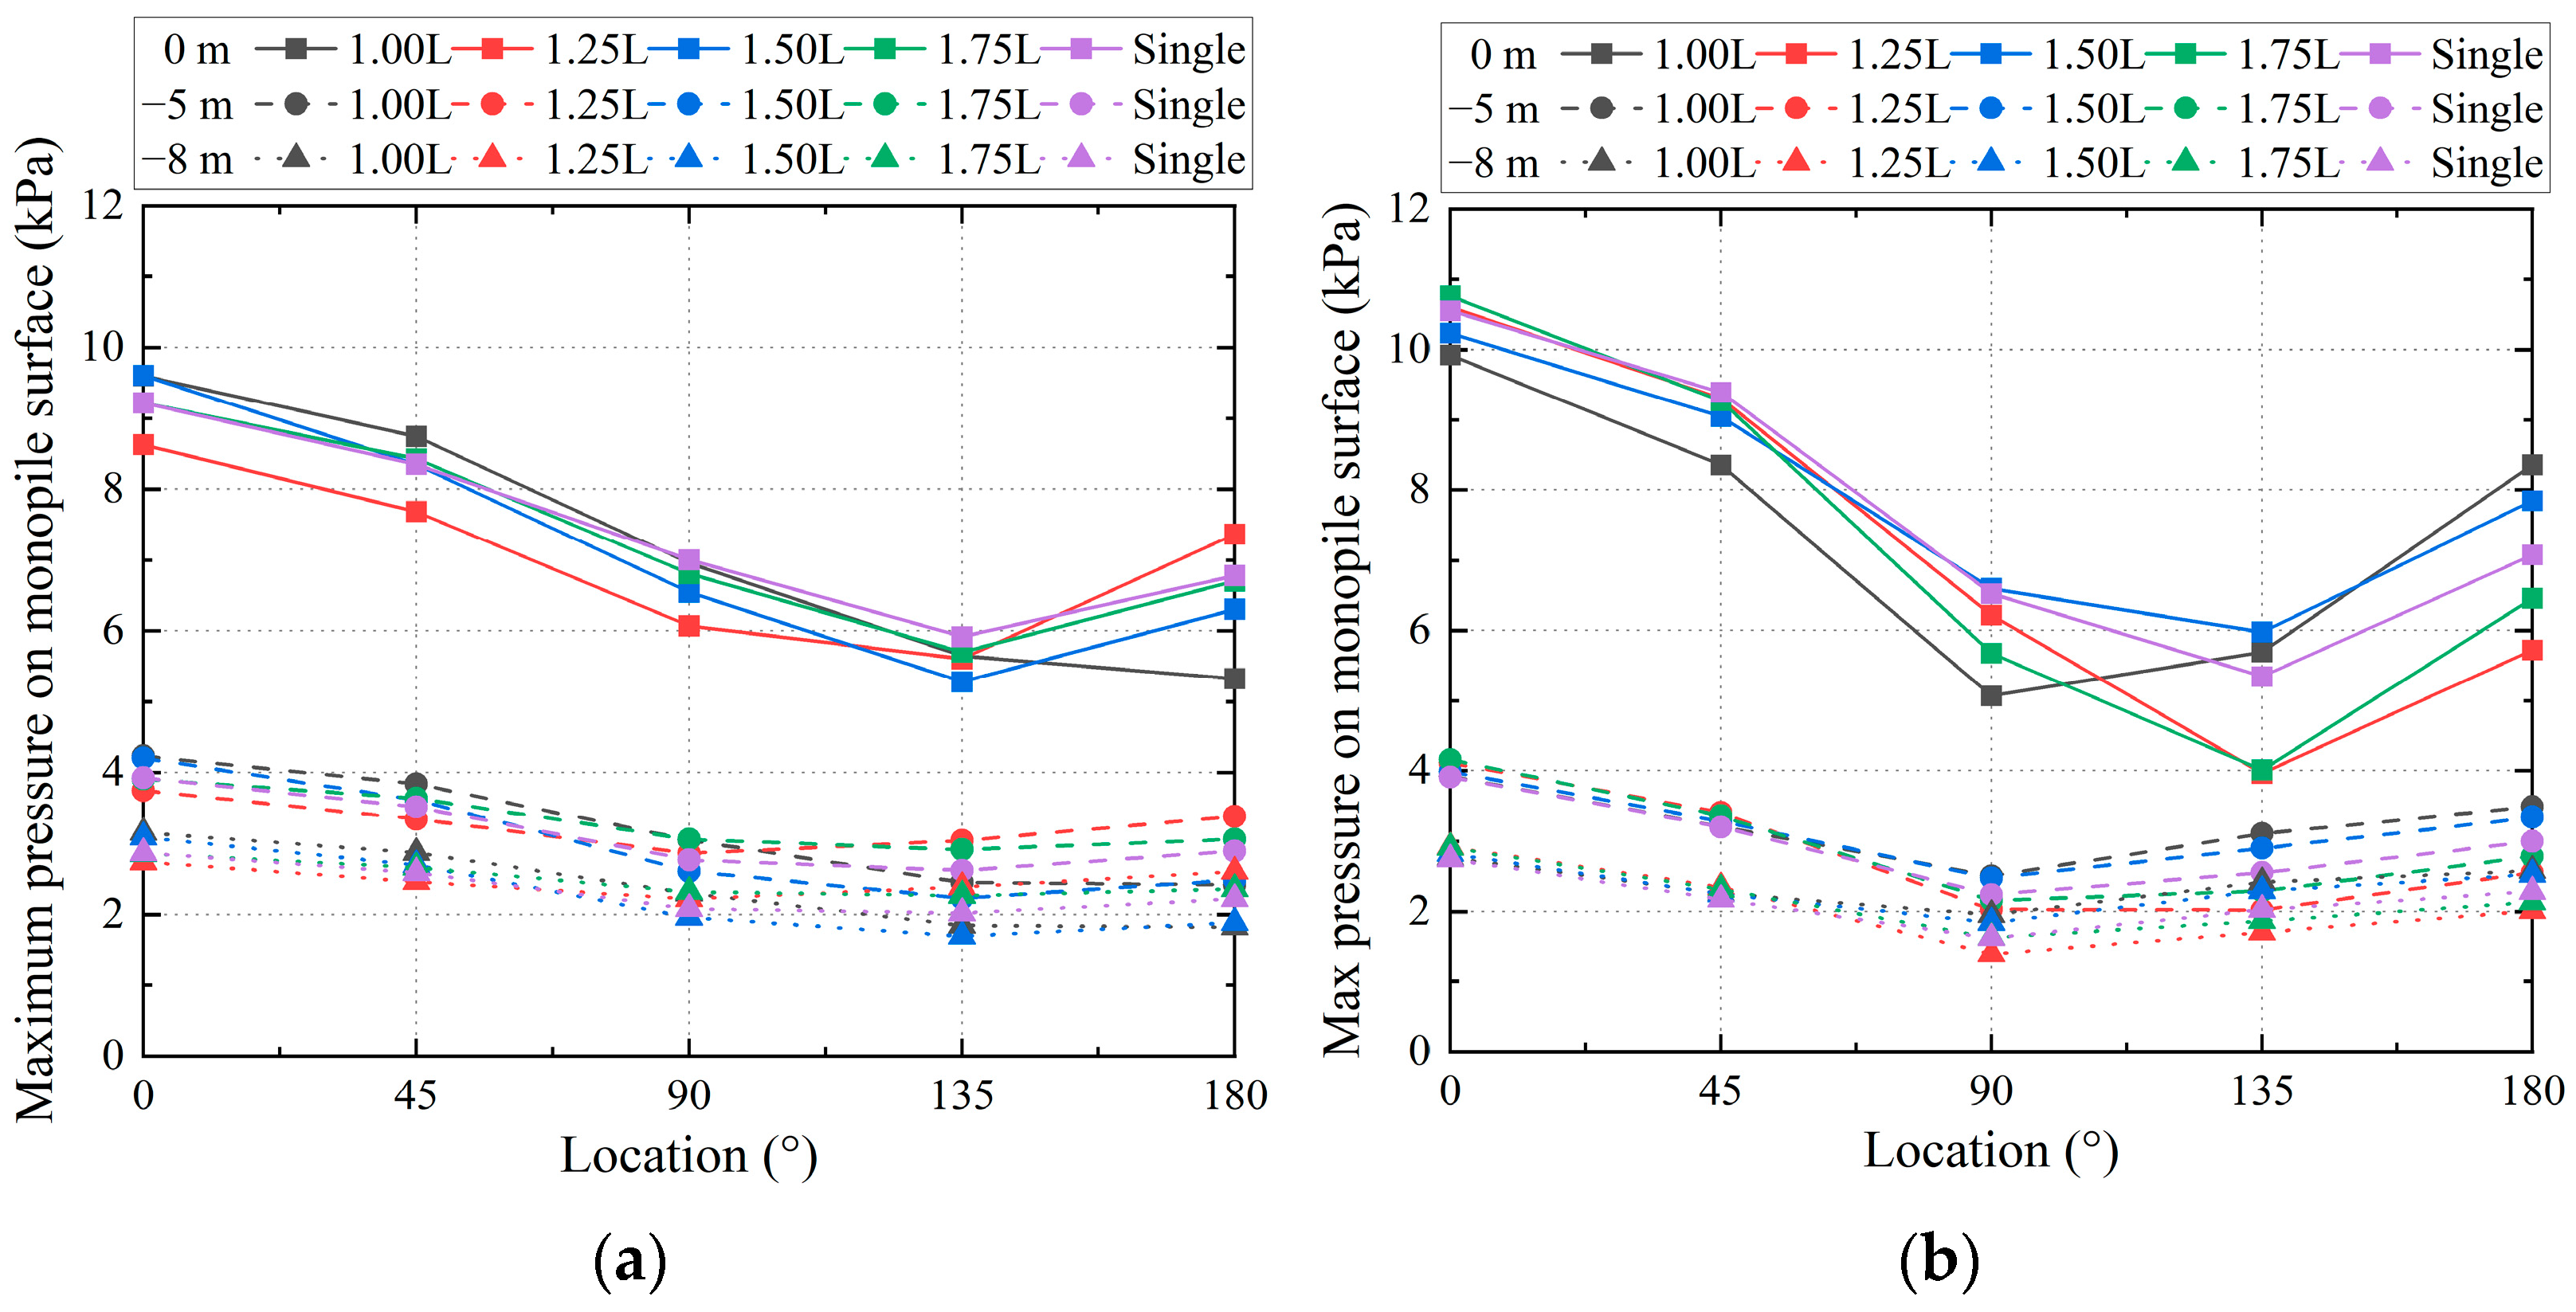
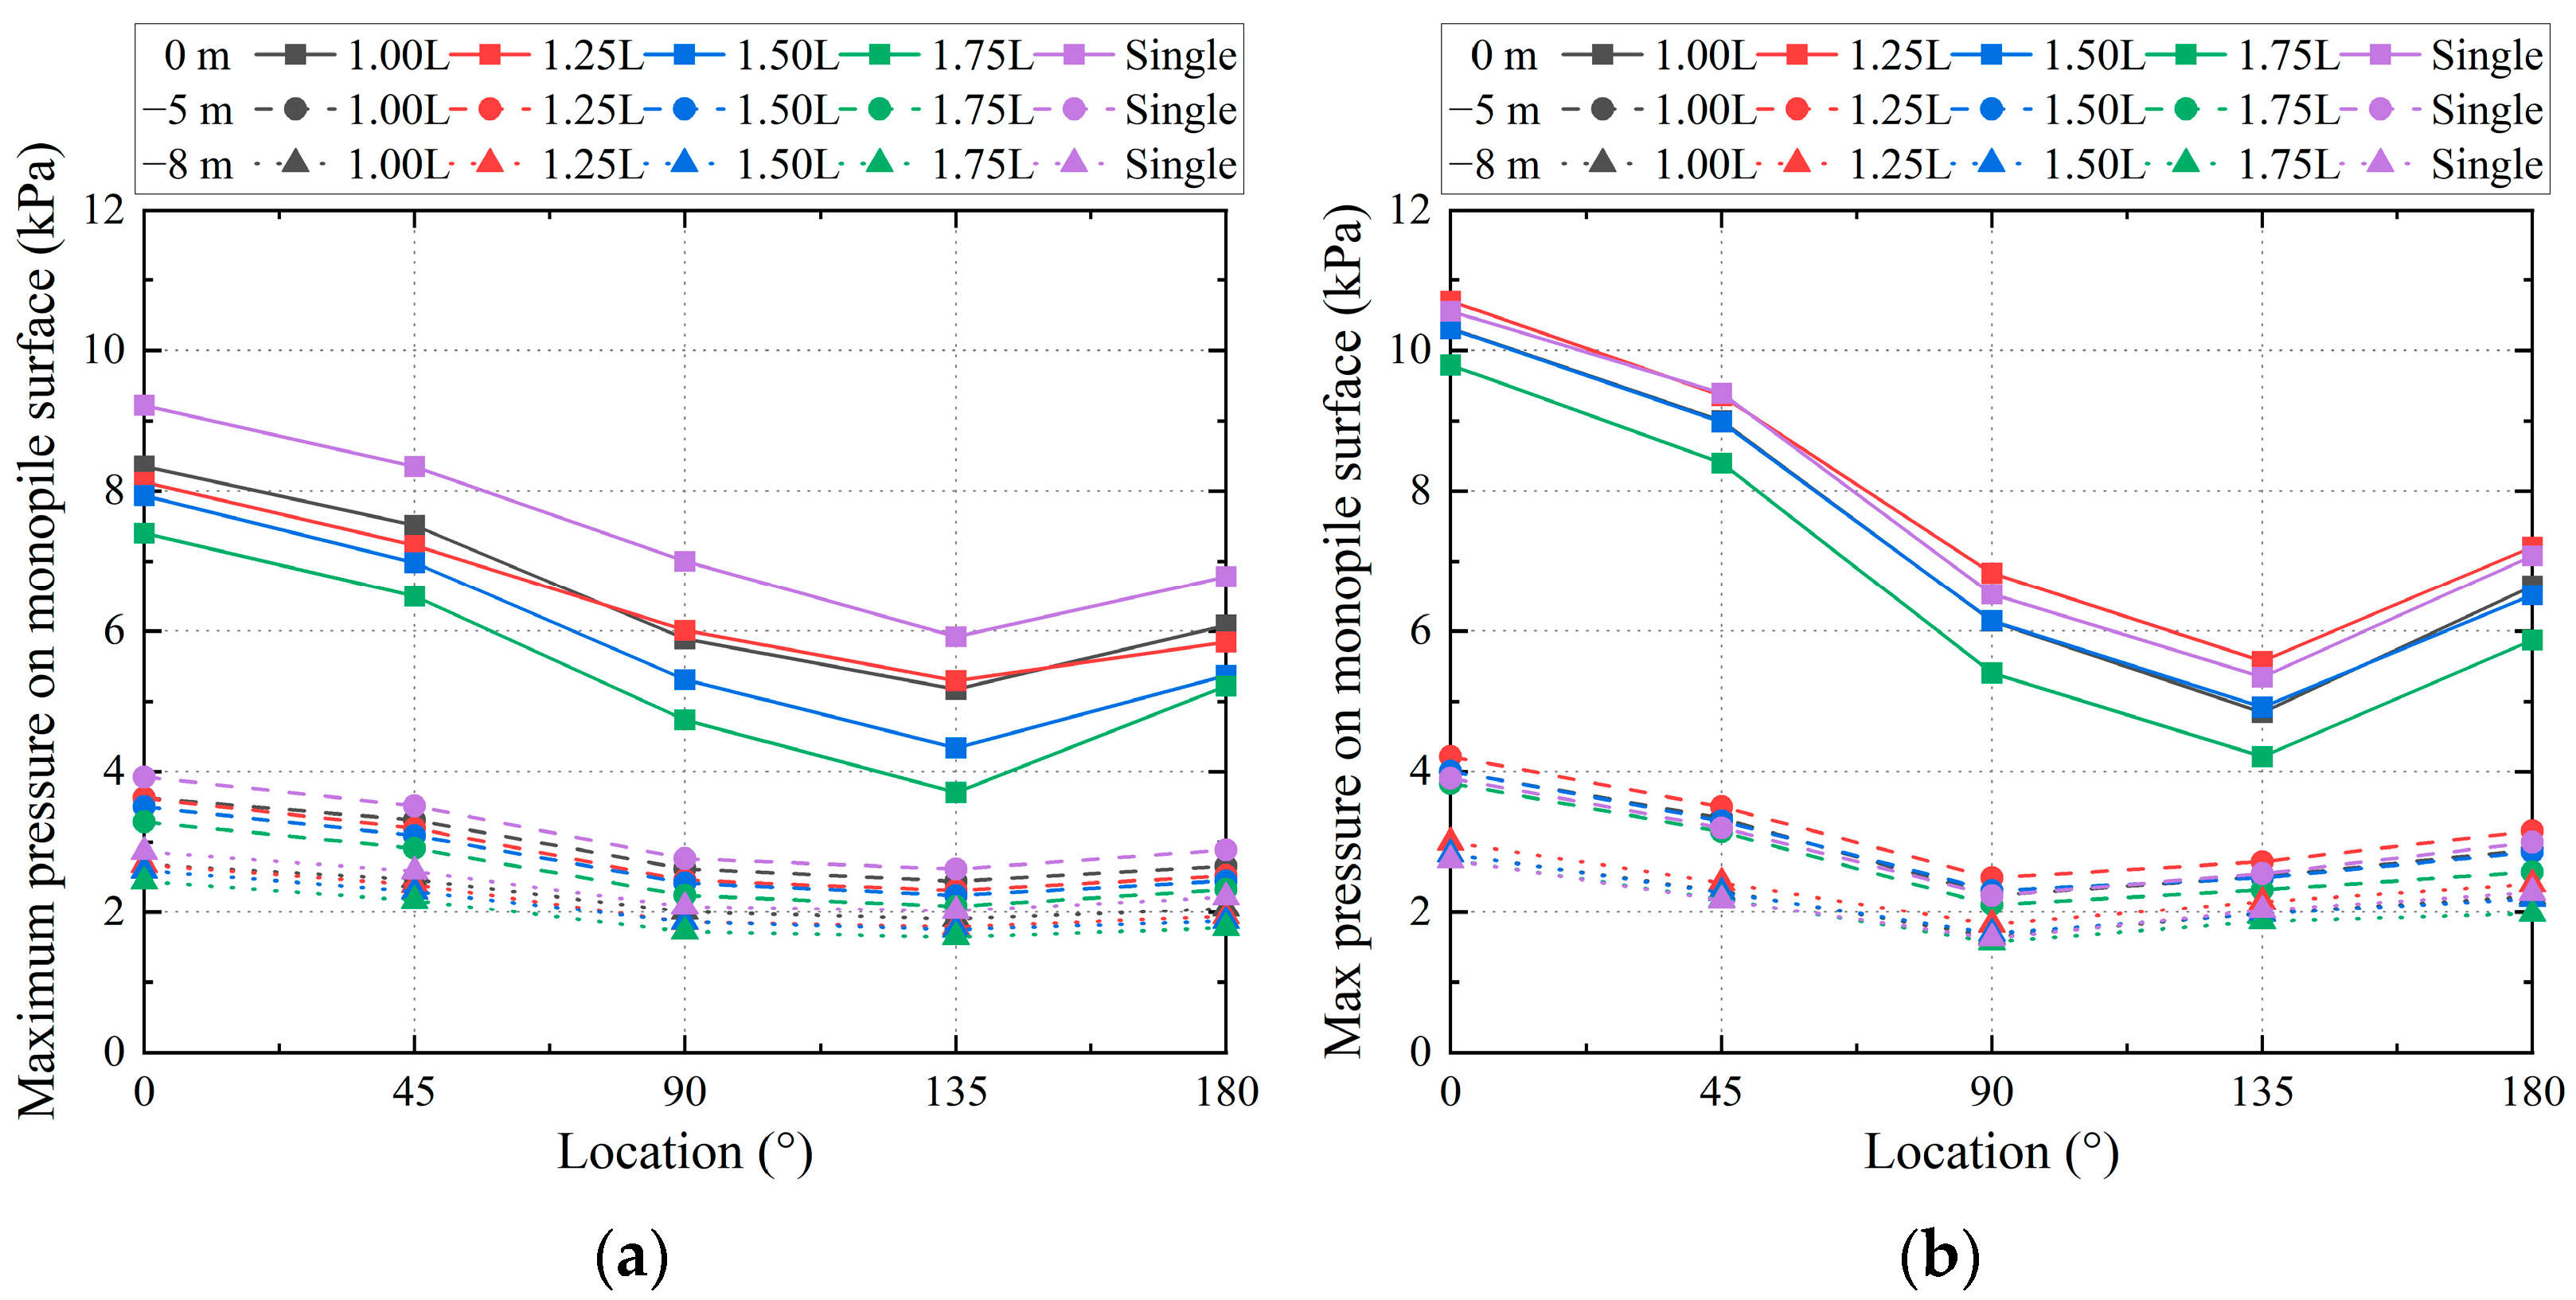
4.2. Pressure Distribution on Double Monopile Surface

Based on the numerical simulation of the double-pile structure presented in Section 4.1, the distribution of the maximum pressure on the monopile surface along the circumferential direction at different heights is extracted in one period when the pressure stabilizes over time, and the arrangement of the pressure monitoring points is shown in Figure 14.
From the results of the upstream monopile under wave action (Figure 15a), it can be seen that at a height of 0 m, the maximum surface pressure at the 0°~135° position are larger and less than the corresponding value of the individual monopile, when the spacings are 1 and 1.25 times wave length, respectively. The reasons and mechanisms for these changes correspond to the wave run-up behavior analyzed in Section 4.1. Meanwhile, when the spacing is one times the wave length, the maximum pressure at the 180° position is reduced by about 21% compared to the individual monopile case. As the spacing progressively increases, the variation in the surface pressure on the upstream monopile at a height of 0 m exhibits a diminishing trend. In addition, at heights of –5 m and –8 m, the maximum pressure on the waveward side of the upstream monopile is higher than that of the individual monopile at spacings of 1 and 1.5 times the wave length (satisfying the generation condition of the wave loop); however, the corresponding value is less than that for the individual monopile when the spacing reaches 1.25 and 1.75 times the wave length (the generation condition of the wave trough). It is also observed that the corresponding changing trend on the leeward side of the upstream monopile is opposite to the above.
As shown in Figure 15b, after considering combined wave–current loading, the maximum pressure on the waveward side of upstream monopile is significantly enlarged at a height of 0 m. When the spacing is one times the wave length, the maximum pressure on the waveward side is significantly reduced by about 13% on average relative to the individual monopile; meanwhile, the maximum pressure on the leeward side presents an average decrease of about 16% relative to individual monopile results when the spacing is 1.25 and 1.75 times the wave length. It is found that the trend in the maximum pressure at a height of 0 m is generally in agreeance with wave run-up behavior explored in Section 4.1. Although the spacing is changed, the discrepancy between the maximum pressure on the waveward side of upstream monopile and the corresponding results of the individual monopile is significantly reduced at heights of –5 m and –8 m, indicating that the pressure at these locations is not affected by the downstream monopile. Moreover, the calculation results considering the combined wave–current loading are indifferent to the case under wave loading conditions.
From Figure 16, it can be seen that the maximum pressure at the waveward side of the downstream monopile at each height is significantly increased due to the effect of the current. As shown in the results under the wave loading condition in Figure 16a, the maximum surface pressure on the downstream monopile at a height of 0 m gradually reduces with increasing spacing, where the maximum reduction is about 37% relative to the individual monopile; however, when the combined wave–current loading is applied (Figure 16b), the discrepancy between the maximum surface pressure on the downstream monopile and corresponding individual monopile results is significantly decreased, with the maximum discrepancy being about 19%. This phenomenon is similar to the wave run-up characteristics of the downstream monopile in Section 4.1. Furthermore, as the heights are –5 m and –8 m, the maximum pressure on the leeward side of the monopile is hardly affected by the combined wave–current loading.

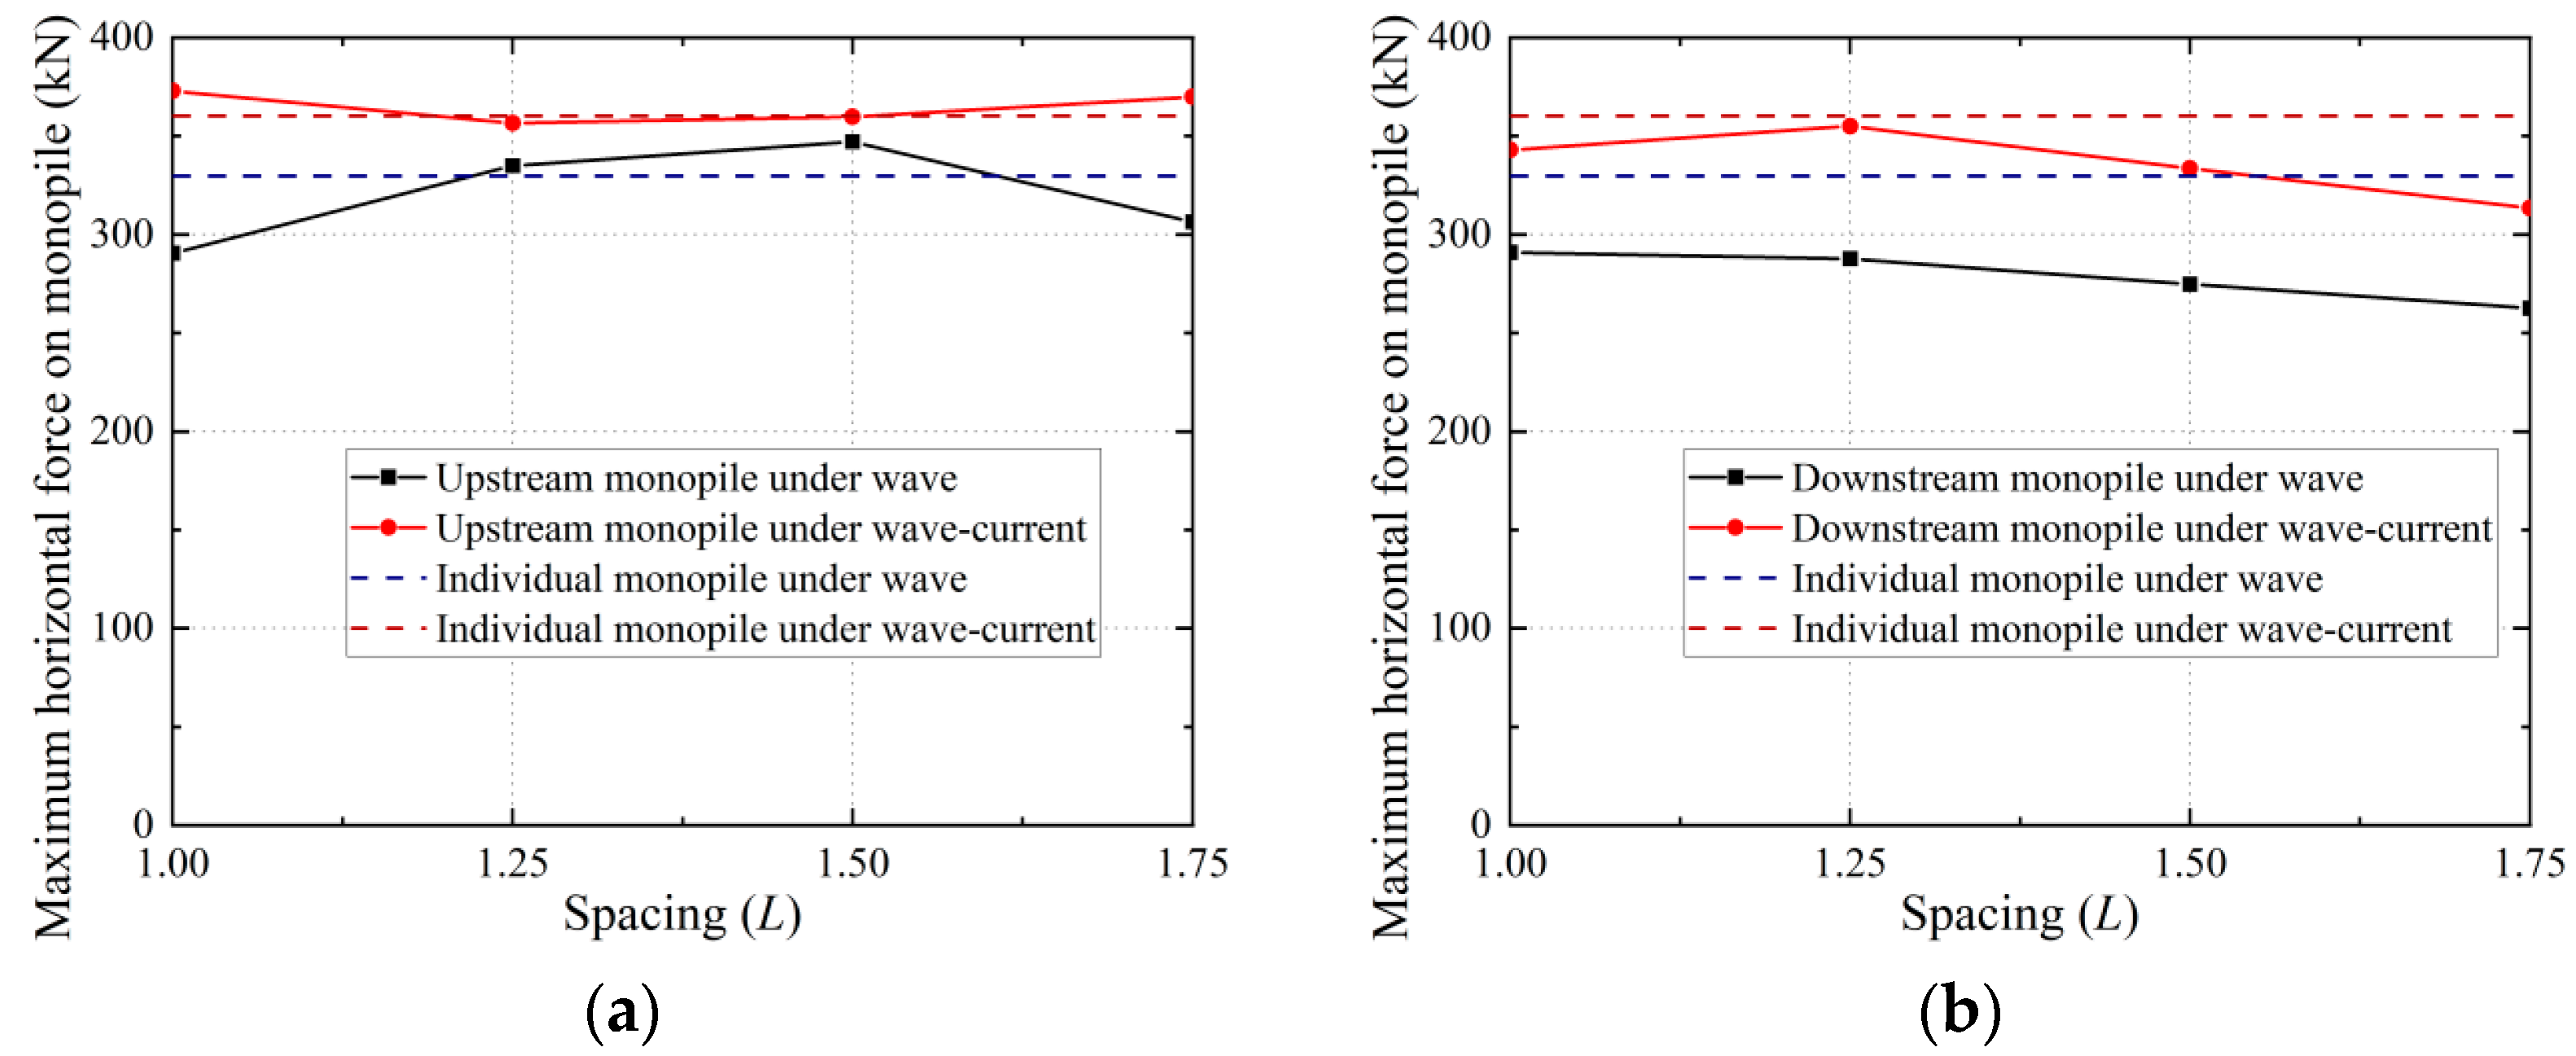
4.3. Horizontal Force on Double Monopile

Besides the maximum wave run-up and maximum pressure distribution characteristics on the monopile surface, the maximum horizontal force of double-pile structure in one period under different loading conditions is analyzed. From Figure 17a, under the wave action, the maximum horizontal force of the upstream monopile is characterized by an initial increase followed by a subsequent decrease as the spacing expands, where the maximum forces for the cases with spacings of 1.25 and 1.5 times the wave length are larger than those for the individual monopile. However, after applying wave–current loading, the maximum horizontal force of the upstream monopile reduces and then rises as the spacing increases, whereas the magnitude of change is insignificant. As shown in Figure 17b, the maximum horizontal force on the downstream monopile exhibits a decreasing trend with increasing spacing regardless of whether the current load is considered, and it is significantly less than the corresponding results for the individual monopile. Moreover, it can be found that the variability of the maximum horizontal force on the upstream and downstream monopile induced by the change in spacing is reduced after considering combined wave–current loading; meanwhile, the difference between the maximum horizontal force results of the upstream/downstream monopile and the individual monopile is reduced by the effect of current loading, where the corresponding differences in Figure 17 are listed in Table 4.

5. Conclusions

Based on the CFD methodology incorporating turbulence theory and wave–current interaction theory, a generation module for combined wave–current loading is developed in waves2Foam, and a numerical flume model for the double-pile structure in an offshore wind turbine is established to investigated the hydrodynamic characteristics under combined wave–current action. The following conclusions are obtained:
(1)
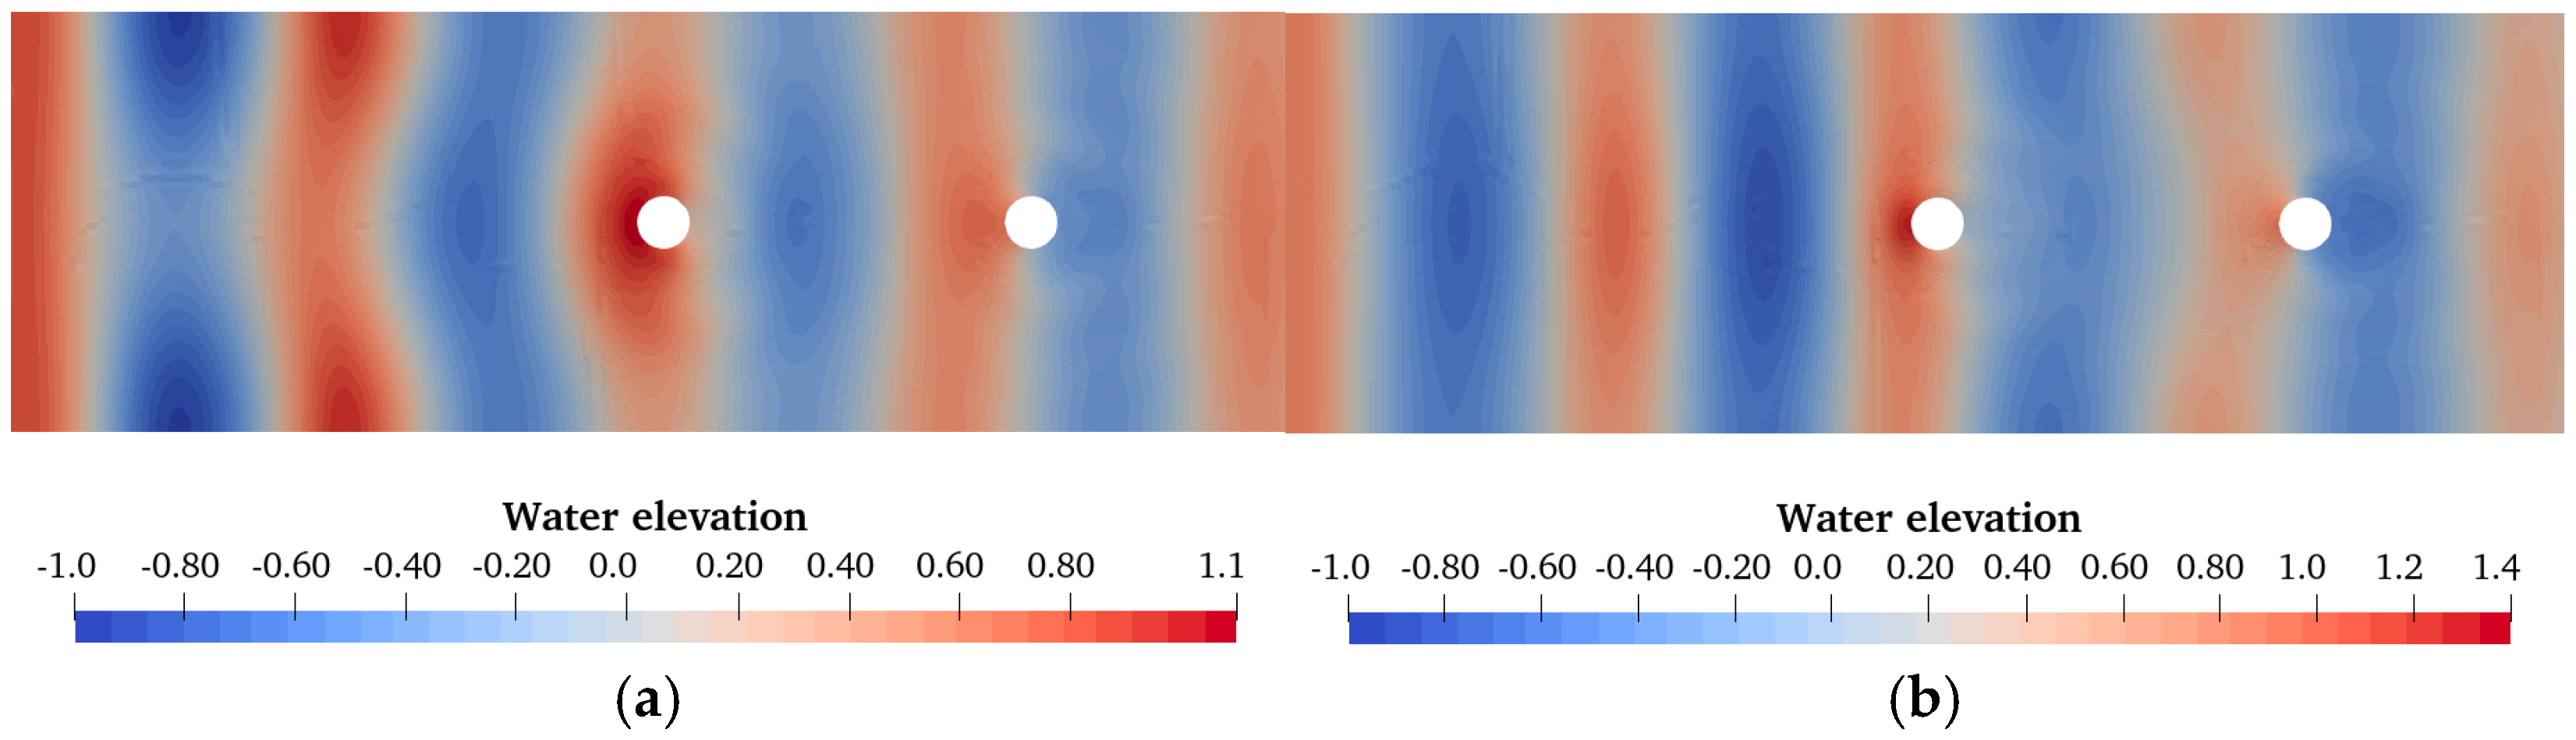
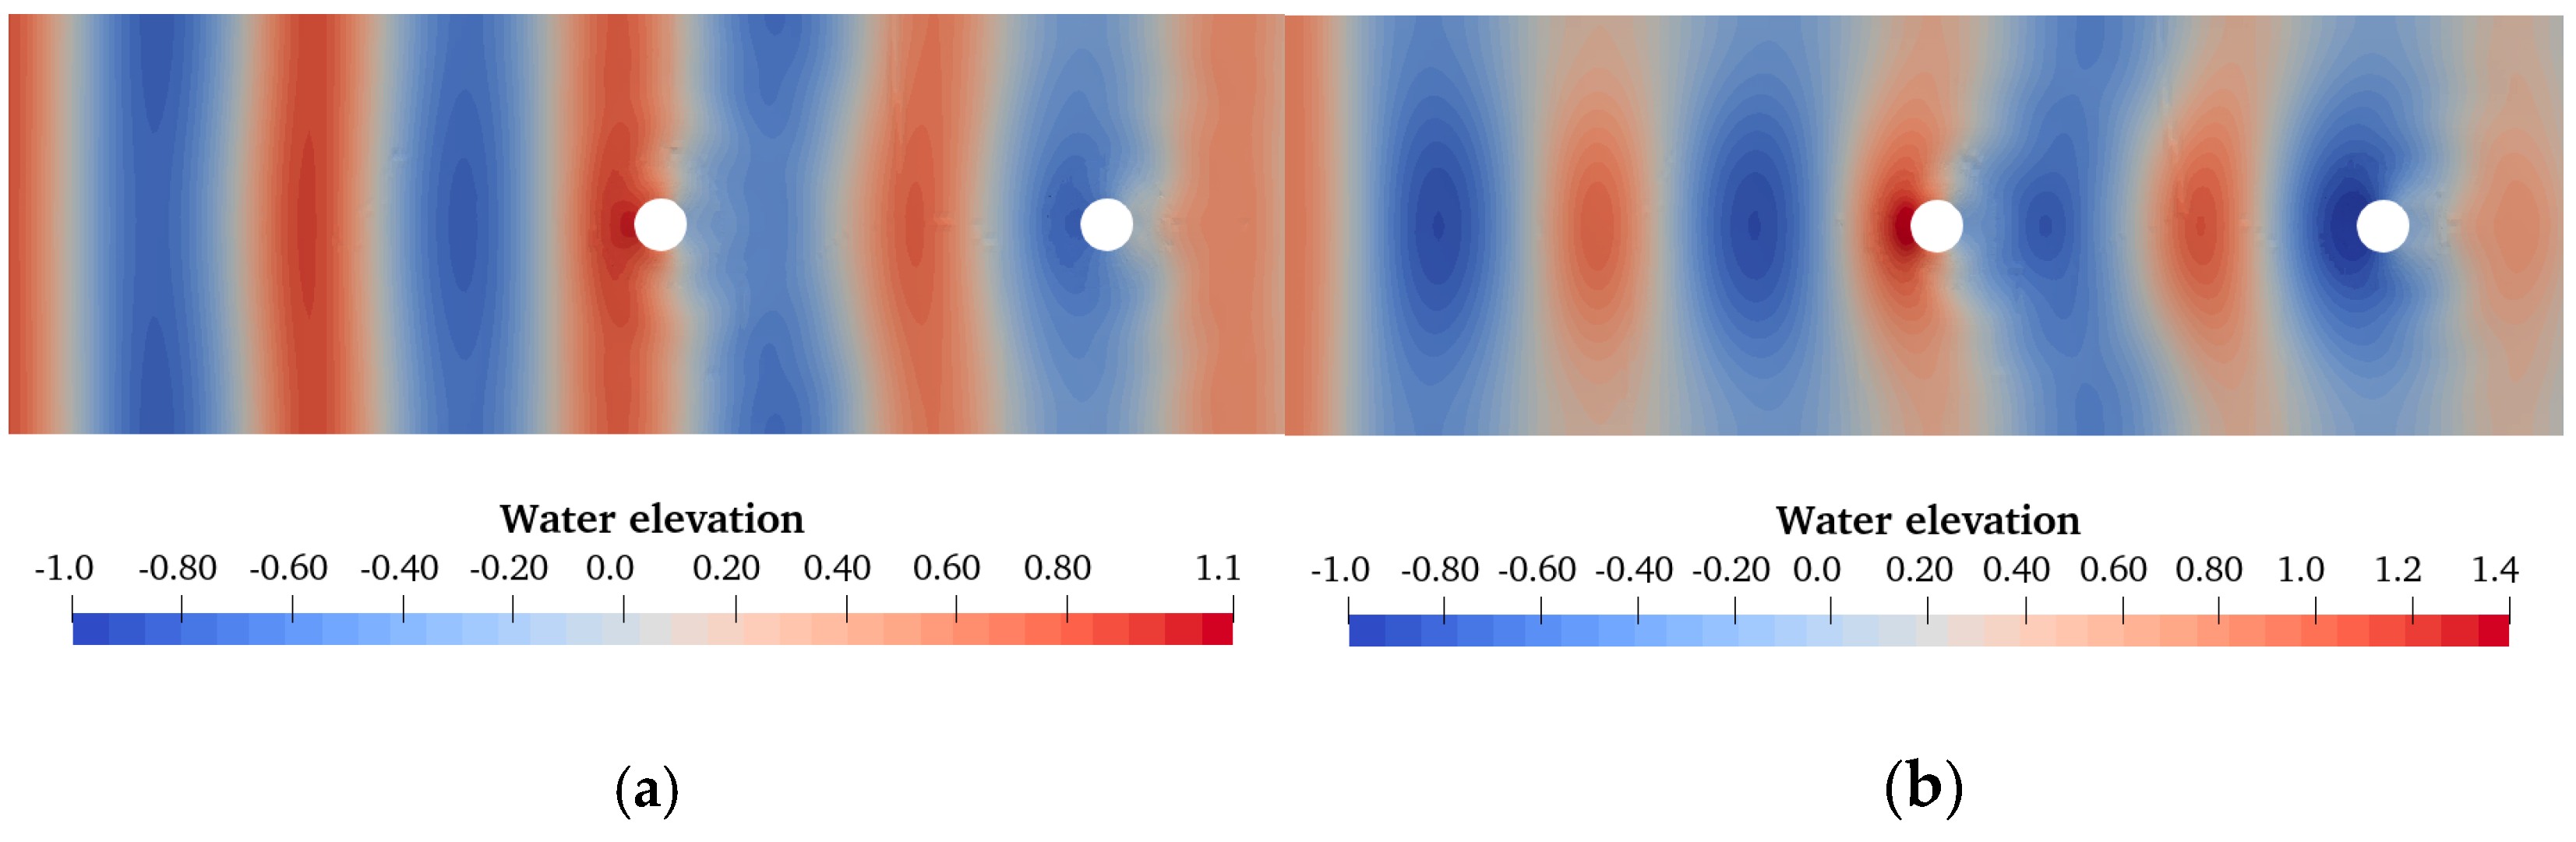
Compared to the results of the individual monopile under wave loading, due to the wave trough induced by reflected waves and the fluid shedding phenomenon caused by current loading, the maximum wave run-up at the leeward side of the upstream monopile for the case of combined wave–current loading is significantly reduced by about 24% compared with that of the individual monopile when the spacing is 1.25 and 1.75 times the wave length. Under the combined wave–current loading, the maximum wave run-up discrepancy between the downstream monopile and the individual monopile is about 29% on average, which is lower than the approximately 41% discrepancy observed under wave-only loading. Moreover, it is found that the combined wave–current loading attenuates the effect of spacing on the maximum wave run-up on the downstream monopile surface.
(2)
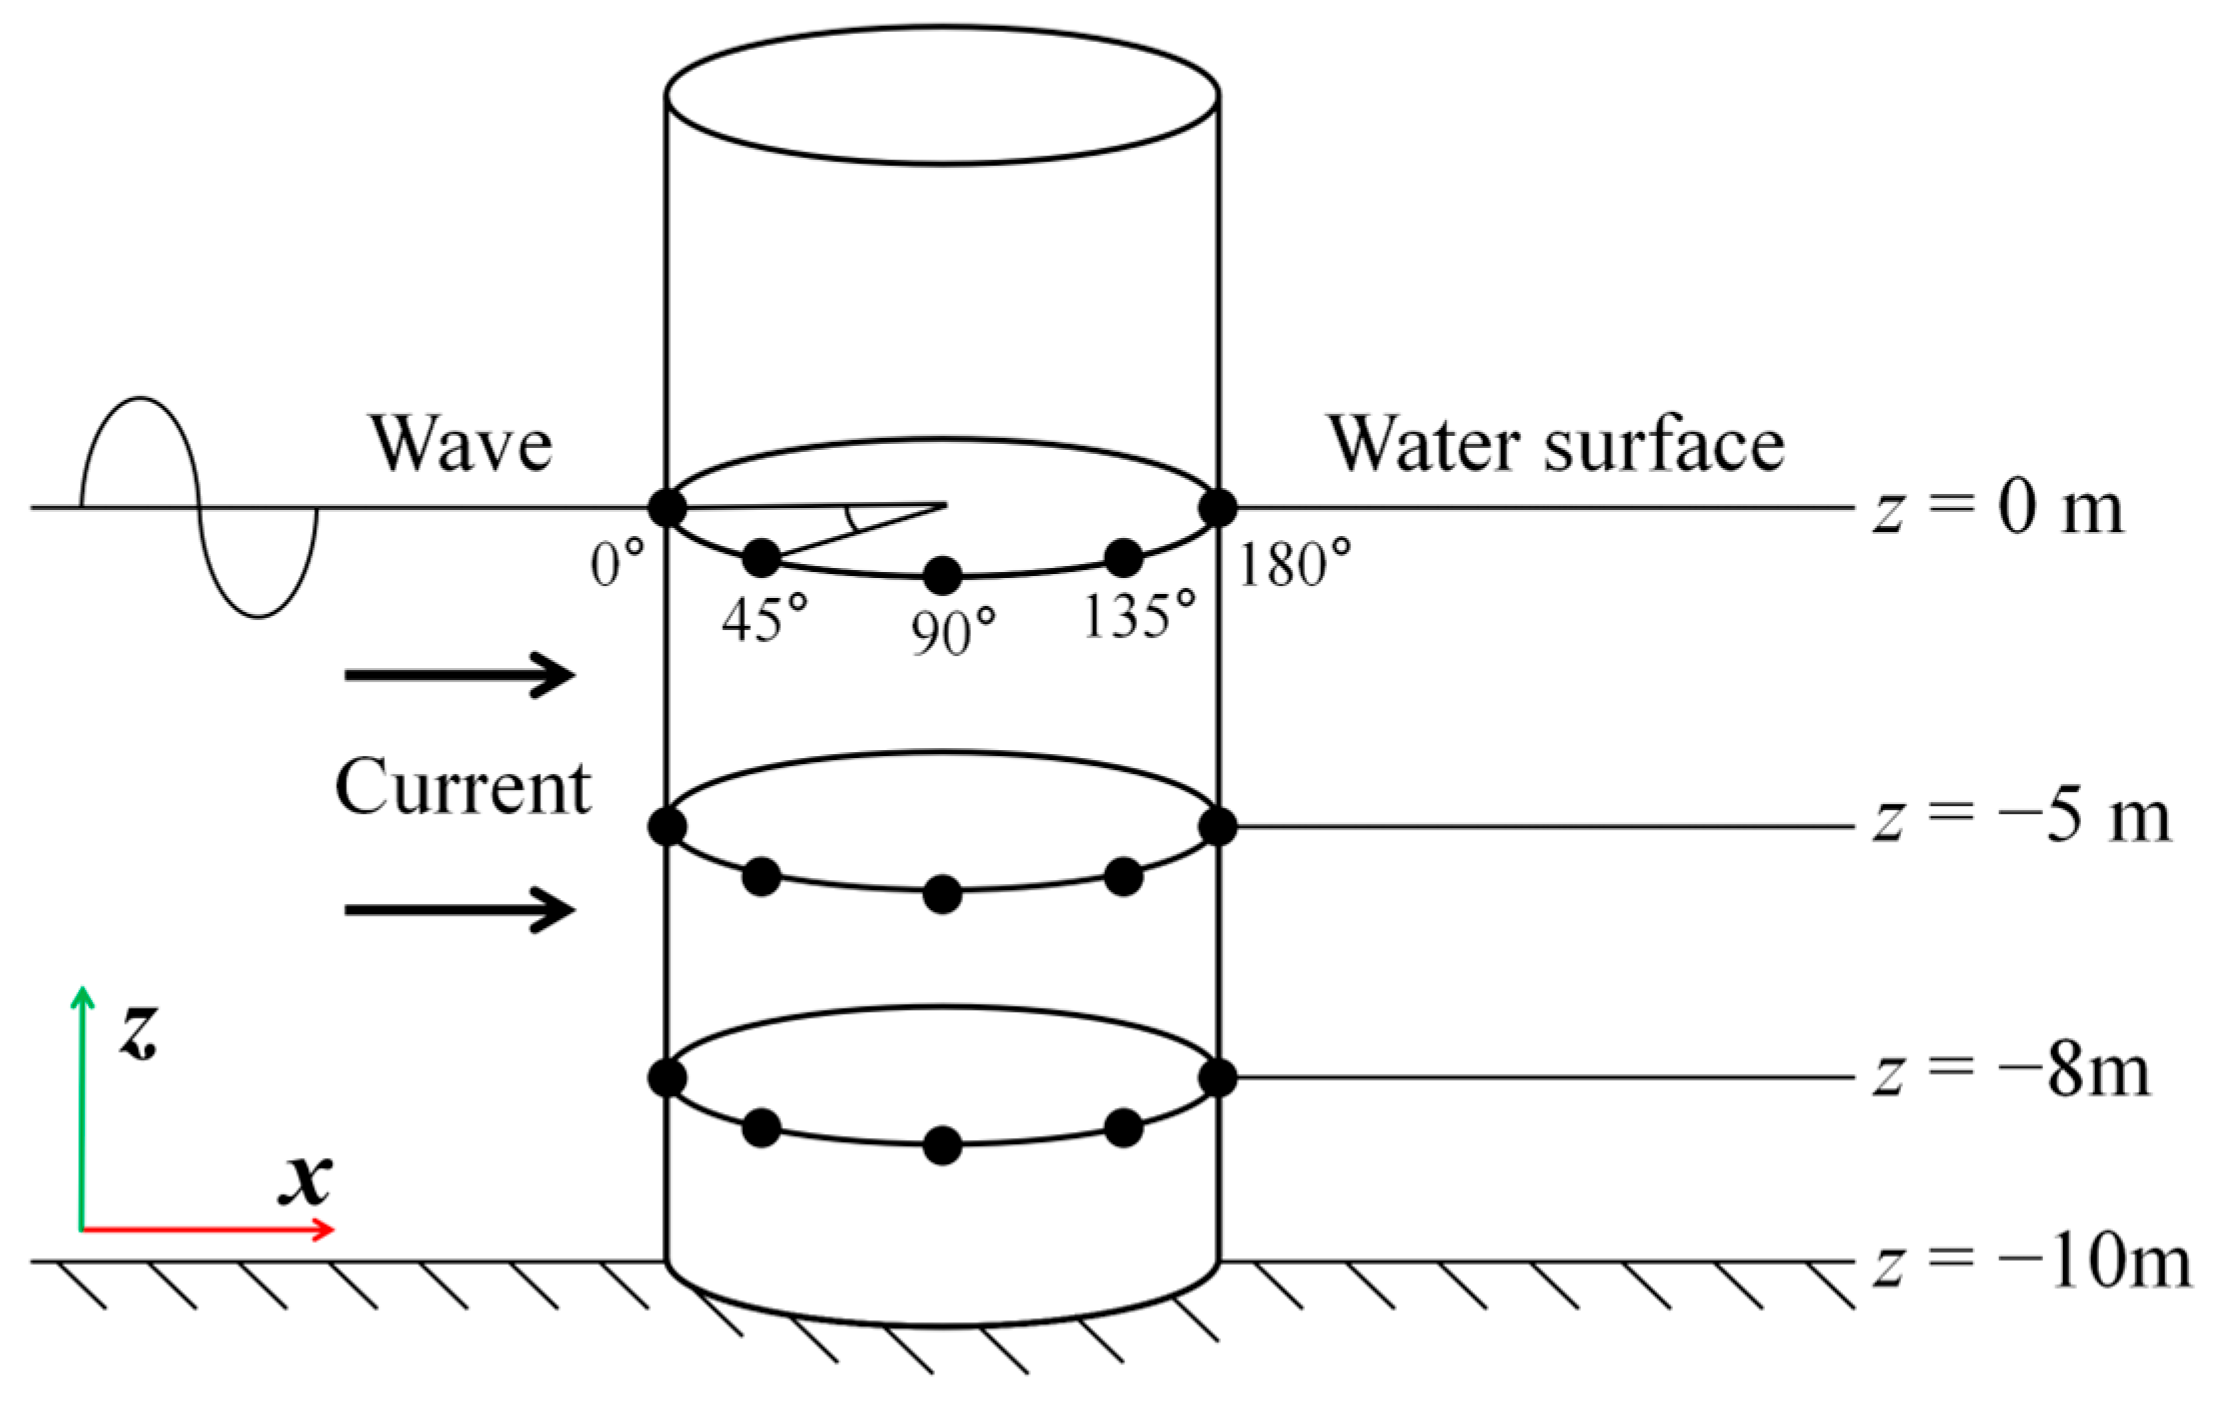
When the loading conditions and spacing are changed, the maximum surface pressure at the free water surface changes similarly to that of the maximum wave run-up. At heights of –5 m and –8 m, the combined wave–current loading does not significantly change the maximum pressure distribution on the leeward side of both the upstream and downstream monopiles compared to the wave loading conditions. Furthermore, the maximum pressure distribution on the surface of the upstream monopile is significantly reduced by the influence of the downstream monopile as the location gets closer to the water bottom.
(3)
Under the wave loading, the maximum horizontal force of the upstream monopile increases first and then decreases with the increase in spacing; however, after applying the combined wave–current loading, it shows an opposite trend. Conversely, for the downstream monopile, the maximum horizontal force decreases with increasing spacing no matter whether the wave load or the combined wave–current load is applied. For the overall double-pile structure, compared with the case under wave loading, combined wave–current loading significantly reduces the influence of spacing on the maximum horizontal force of the upstream/downstream monopile and reduces the discrepancy in maximum horizontal force between the double-pile structure and individual monopile.

Author Contributions

Conceptualization, H.Z.; Methodology, Y.L. (Yongqing Lai) and B.W.; Software, Y.L. (Yongqing Lai), L.C., X.W. and Y.H.; Validation, Y.L. (Yongqing Lai) and L.C.; Formal analysis, Y.L. (Yongqing Lai), L.C. and X.W.; Investigation, Y.L. (Yongqing Lai), L.C., X.W., B.W. and Y.H.; Resources, B.W.; Data curation, X.W. and Y.L. (Yuwei Liang); Writing—original draft, Y.L. (Yongqing Lai), Y.H. and Y.L. (Yuwei Liang); Writing—review & editing, B.W., H.Z. and W.S.; Supervision, H.Z. and W.S.; Funding acquisition, B.W. All authors have read and agreed to the published version of the manuscript.

Funding

This research work was financially supported by the National Key Research and Development Program of China (Grant NO. 2023YFB4203200). Their financial support is gratefully acknowledged.

Data Availability Statement

The data are not publicly available due to privacy or ethical restrictions, which will be available on request from corresponding authors.

Conflicts of Interest

Authors Yongqing Lai, Li Cai, Xinyun Wu, Bin Wang were employed by the company Power China Huadong Engineering Corporation Limited. The remaining authors declare that the research was conducted in the absence of any commercial or financial relationships that could be construed as a potential conflict of interest.

References

  1. Sarkar, N.; Konar, T.; Ghosh, A.D. Passive vibration control techniques for offshore structures under different environmental loading: A review. Ocean Eng. 2025, 320, 120296. [Google Scholar] [CrossRef]
  2. Li, C.; Jin, T.; Chen, Z.; Wei, G. A De-Nesting Hybrid Reliability Analysis Method and Its Application in Marine Structure. J. Mar. Sci. Eng. 2024, 12, 2221. [Google Scholar] [CrossRef]
  3. Wang, S.; Xing, Y.; Balakrishna, R.; Shi, W.; Xu, X. Design, local structural stress, and global dynamic response analysis of a steel semi-submersible hull for a 10-MW floating wind turbine. Eng. Struct. 2025, 291, 116474. [Google Scholar] [CrossRef]
  4. Konispoliatis, D.N.; Mavrakos, S.A. Hydrodynamic research of marine structures. J. Mar. Sci. Eng. 2024, 12, 2049. [Google Scholar] [CrossRef]
  5. Ali, A.; Shi, W.; Wang, S.; Zhai, H.; Haider, R.; Leng, S.; Li, X.; Han, X. Dynamic analysis of a TetraSpar floating offshore wind turbine with different tendons failure scenario. Ocean Eng. 2025, 323, 120607. [Google Scholar] [CrossRef]
  6. Cai, Y.; Zhao, H.; Li, X.; Shi, W.; Xiao, Q. Developing an OpenFOAM solver for coupled aero-hydrodynamic analysis of integrated structure with floating offshore wind turbine and aquaculture net cage. Coast. Eng. 2025, 198, 104720. [Google Scholar] [CrossRef]
  7. Arshad, M.; O’Kelly, B.C. Piled-cruciform attachment to monopile head reduces deflection. Proc. Inst. Civil Eng.-Geotech. Eng. 2016, 169, 321–335. [Google Scholar] [CrossRef]
  8. Chen, H.; Ni, Y. Numerical analysis of wave run-up characteristics on dual non-submerged vertical cylinders system. Hydro-Sci. Eng. 2020, 6, 42–47. [Google Scholar]
  9. Guo, J.; Han, B.; Ma, Z.; Zhang, B.; Guo, M.; He, B. Research on the strain response of offshore wind turbine monopile foundation through integrated fluid-structure-seabed model test. Ocean Eng. 2024, 314, 119729. [Google Scholar] [CrossRef]
  10. Xie, W.; Zhang, Q.; Cai, H.; Fu, M. Numerical Investigation on the Interaction between a Tsunami-like Solitary Wave and a Monopile on a Sloping Sandy Seabed. J. Mar. Sci. Eng. 2024, 12, 1421. [Google Scholar] [CrossRef]
  11. Schløer, S.; Bredmose, H.; Bingham, B.H. The influence of fully nonlinear wave forces on aero-hydro-elastic calculations of monopile wind turbines. Mar. Struct. 2016, 50, 162–188. [Google Scholar] [CrossRef]
  12. Zeng, X.; Shi, W.; Michailides, C.; Zhang, S.; Li, X. Numerical and experimental investigation of breaking wave forces on a monopile-type offshore wind turbine. Renew. Energy 2021, 175, 501–519. [Google Scholar] [CrossRef]
  13. Zhu, J.; Gao, Y.; Wang, L.; Li, W. Experimental investigation of breaking regular and irregular waves slamming on an offshore monopile wind turbine. Mar. Struct. 2022, 86, 103270. [Google Scholar] [CrossRef]
  14. Shi, W.; Zhang, S.; Michailides, C.; Zhang, L.; Zhang, P.; Li, X. Experimental investigation of the hydrodynamic effects of breaking waves on monopiles in model scale. J. Mar. Sci. Technol. 2023, 28, 314–325. [Google Scholar] [CrossRef]
  15. Xu, P.; Li, Q.; Wang, C.; Li, L.; Tan, D.; Wu, H. Interlayer healing mechanism of multipath deposition 3D printing models and interlayer strength regulation method. J. Manuf. Process. 2025, 141, 1031–1047. [Google Scholar] [CrossRef]
  16. Tan, Y.; Ni, Y.; Xu, W.; Xie, Y.; Li, L.; Tan, D. Key technologies and development trends of the soft abrasive flow finishing method. J. Zhejiang Univ.-SCI A 2023, 24, 1043–1064. [Google Scholar] [CrossRef]
  17. Tang, Y.; Shi, W.; You, J.; Michailides, C. Effects of nonlinear wave loads on large monopile offshore wind turbines with and without ice-breaking cone configuration. J. Mar. Sci. Technol. 2021, 26, 37–53. [Google Scholar] [CrossRef]
  18. Li, M.; Zhang, H.; Guan, H. Study of offshore monopile behaviour due to ocean waves. Ocean Eng. 2011, 38, 1946–1956. [Google Scholar] [CrossRef]
  19. Lin, Y.H.; Chen, J.F.; Lu, P.Y. A CFD model for simulating wave run-ups and wave loads in case of different wind turbine foundations influenced by nonlinear waves. Ocean Eng. 2017, 129, 428–440. [Google Scholar] [CrossRef]
  20. Wang, M.; Si, W.; Gao, Y.; Cui, L.; Jeng, D.S.; Sun, K.; Chen, B.; Zhao, H. Experimental Study of the Random Wave-Induced Hydrodynamics and Soil Response in a Porous Seabed Around Double Piles. J. Mar. Sci. Eng. 2024, 12, 1715. [Google Scholar] [CrossRef]
  21. Yao, Y.; Tang, Z.; He, F.; Yuan, W.C. Numerical investigation of solitary wave interaction with double row of vertical slotted piles. J. Eng. Mech. 2018, 144, 04017147. [Google Scholar] [CrossRef]
  22. Koraim, A.S.; Iskander, M.M.; Elsayed, W.R. Hydrodynamic performance of double rows of piles suspending horizontal c shaped bars. Coast. Eng. 2014, 84, 81–96. [Google Scholar] [CrossRef]
  23. Chen, L.; Zhai, H.; Wang, P.; Jeng, D.S.; Zhang, Q.; Wang, S.; Duan, L.; Liu, Y. Physical modeling of combined waves and current propagating around a partially embedded monopile in a porous seabed. Ocean Eng. 2020, 205, 107307. [Google Scholar] [CrossRef]
  24. Cheng, H.; Cheng, Y.; Wang, X.; Xia, B.; Lyu, X.; Zheng, Y.; Zhang, J. Experimental study of local scour around inclined piles in combined waves and current. Ocean Eng. 2022, 266, 112511. [Google Scholar] [CrossRef]
  25. Chen, L.; Yang, X.; Li, L.; Wu, W.; EI Naggar, M.H.; Wang, K.; Chen, J. Numerical analysis of the deformation performance of monopile under wave and current load. Energies 2020, 13, 6431. [Google Scholar] [CrossRef]
  26. Shi, L.; Cheng, Y.; Zheng, Y.; Xia, B.; Huang, X. Experimental study on local scour at the monopile foundation of an offshore wind turbine under the combined action of wave–current–vibration. J. Mar. Sci. Eng. 2024, 12, 963. [Google Scholar] [CrossRef]
  27. Qi, W.G.; Gao, F.P. Equilibrium scour depth at offshore monopile foundation in combined waves and current. Sci. China: Technol. Sci. 2014, 57, 1030–1039. [Google Scholar] [CrossRef]
  28. Büchmann, B.; Skourup, J.; Cheung, K.F. Run-up on a structure due to second-order waves and a current in a numerical wave tank. Appl. Ocean Res. 1998, 20, 297–308. [Google Scholar] [CrossRef]
  29. Hong, C.; Lyu, Z.; Wang, F.; Zhao, Z.; Wang, L. Wave-Current Loads on a Super-Large-Diameter Pile in Deep Water: An Experimental Study. Appl. Sci. 2023, 13, 8859. [Google Scholar] [CrossRef]
  30. Shi, Q.; Hu, Y.; Zhao, H.; Jiang, C.; Zou, C.; Nian, J.; Li, X. Hydrodynamic analysis of the monopile-supported offshore wind turbine integrated with the UHMWPE cage under wave-current loading. In Proceedings of the International Offshore and Polar Engineering Conference, International Society of Offshore and Polar Engineers, Rhodes, Greece, 16–21 June 2024; pp. 1013–1020. [Google Scholar]
  31. Jacobsen, N.G. Waves2foam Manual. 2017. Available online: https://www.researchgate.net/publication/319160515_waves2Foam_Manual (accessed on 16 April 2025).
  32. Robertson, A.N.; Wendt, F.; Jonkman, J.M.; Popko, W.; Borg, M.; Bredmose, H.; Schlutter, F.; Qvist, J.; Bergua, R.; Harries, R.; et al. OC5 Project Phase Ib: Validation of Hydrodynamic Loading on a Fixed, Flexible Cylinder for Offshore Wind Applications. Energy Procedia 2016, 94, 82–101. [Google Scholar] [CrossRef]
Figure 1. Schematic diagram of the numerical flume (taking a monopile as an example).
Energies 18 02573 g001
Figure 2. Chart showing the computation process.
Energies 18 02573 g002
Figure 3. Verification for generation module of combined wave–current loading.
Energies 18 02573 g003
Figure 4. Comparison for profile view of velocity.
Energies 18 02573 g004
Figure 5. Three meshing methods.
Energies 18 02573 g005
Figure 6. Comparison results for mesh convergence. (a) Horizontal force on monopile. (b) Surface pressure on waveward side of monopile at height of free water level. (c) Wave run-up on waveward side of monopile. (d) Modeling validation.
Energies 18 02573 g006
Figure 7. Layout diagram of wave gauge monitoring points.
Energies 18 02573 g007
Figure 8. The maximum wave run-up distribution on the surface of the upstream monopile under different spacings. (a) Wave loading condition. (b) Wave–current loading condition.
Energies 18 02573 g008
Figure 9. Water elevation field of a single monopile. (a) Wave loading condition. (b) Wave–current loading condition.
Energies 18 02573 g009
Figure 10. Water elevation field of a double pile with spacing of 1.0 L. (a) Wave loading condition. (b) Wave–current loading condition.
Energies 18 02573 g010
Figure 11. Water elevation field of a double pile with spacing of 1.25 L. (a) Wave loading condition. (b) Wave–current loading condition.
Energies 18 02573 g011
Figure 12. Visualizations of the flow field under combined wave and current loading. (a) Individual monopile. (b) Double monopile with 1.0 L spacing.
Energies 18 02573 g012
Figure 13. The maximum wave run-up distribution on the surface of the downstream monopile under different spacings. (a) Wave loading condition. (b) Wave–current loading condition.
Energies 18 02573 g013
Figure 14. Layout diagram of pressure monitoring points.
Energies 18 02573 g014
Figure 15. The maximum pressure distribution on the surface of the upstream monopile under different spacings. (a) Wave loading condition. (b) Wave–current loading condition.
Energies 18 02573 g015
Figure 16. The maximum pressure distribution on the surface of the downstream monopile under different spacings. (a) Wave loading condition. (b) Wave–current loading condition.
Energies 18 02573 g016
Figure 17. Maximum horizontal force on monopile. (a) Upstream monopile. (b) Downstream monopile.
Energies 18 02573 g017
Table 1. Verification condition for combined wave–current loading.
Wave HeightWave CycleWater DepthWater Velocity
1.50 m4.95 s10 m0.4 m/s
Table 2. Parameters related to a classical physical modeling experiment.
Monopile
Diameter
Wave Height
H
Wave Period T Water Depth
h
Flume LengthFlume WidthFlume Height
0.075 m0.09 m1.5655 s0.78 m16 m0.8 m1.18 m
Table 3. List of loading conditions.
No. H   ( m ) T   ( s ) L   ( m ) h   ( m ) Double-Pile Spacing ( L ) Current Velocity (m/s)
LC 11.54.9536101.000
LC 21.54.9536101.250
LC 31.54.9536101.500
LC 41.54.9536101.750
LC 51.54.9536101.000.4
LC 61.54.9536101.250.4
LC 71.54.9536101.500.4
LC 81.54.9536101.750.4
Table 4. Difference in the maximum force between the upstream/downstream monopile and individual monopile results for loading conditions in this study.
Monopile PositionLoading ConditionThe Largest Differences Compared to Individual Monopile Results
UpstreamWave7.1%
UpstreamWave–current3.5%
DownstreamWave20%
DownstreamWave–current13%
Disclaimer/Publisher’s Note: The statements, opinions and data contained in all publications are solely those of the individual author(s) and contributor(s) and not of MDPI and/or the editor(s). MDPI and/or the editor(s) disclaim responsibility for any injury to people or property resulting from any ideas, methods, instructions or products referred to in the content.

