Abstract
The huge penetration of renewable energy sources poses several challenges for the function of electricity markets, such as increased price volatility and massive curtailments. This paper investigates the current structure of the wholesale electricity market in Greece under the Target Model guidelines. Our analysis put under scrutiny the formation and function of both spot and balancing markets by highlighting key challenges and reforms. Empirical evidence reveals that the domestic market is currently in accordance with the European Target Model; however, the anticipated benefits in terms of more competitive prices are not evident yet. The oversupply of electricity accompanied by low demand that is apparent in the Greek market points to the rapid participation of storage units in the system. The paper provides a detailed description of the recent support mechanism to facilitate the integration of BESS into the system. Eventually, this is anticipated to reduce price volatility and smoothen the price curves.
1. Introduction
The integration of energy markets in the European Union (EU) has gradually evolved since 1990 to achieve price convergence and enhance competition of European products [1]. Different directives and guidelines facilitated the drive towards a pan-European energy market, which was thoroughly structured with the introduction of the Third Energy Package in 2009. The Target Model was formulated with a vision of achieving an integrated European energy market, offering a more efficient, robust and competitive energy system, while enhancing security and cross-border trading. In that framework, surplus energy produced in one country would easily be transferred to a neighboring country facing scarcity, bringing both countries in balance concerning price coupling and environmental aspects [2]. Following more than two decades in this direction towards energy transition and sustainability, the primary challenge at the EU level is the increased electrification rates of today’s system. This development poses a significant need for enhanced interconnections between countries and proper modelling of energy flows [3].
The structure of the wholesale electricity market to date was designed to accommodate mainly conventional electricity production sources [4,5]. Yet, the ongoing energy transition accompanied by the immense penetration of Renewable Energy Sources (RES) drives the need for significant modifications in the design of the wholesale electricity market, as well as requiring massive investments towards upgrading infrastructures in interconnections and storage solutions [6,7]. Thus, various storage technologies and grid connections are essential to secure the smooth operation of the system and manage the heavy loads of generated energy during peak production hours [8]. The absence of these interventions could lead to curtailments and congestion problems in the grid accompanied by zero and even negative prices, as seen in many member states [9]. Another critical issue arising due to the increased penetration of RES is price volatility throughout the day, and especially in the Intraday Markets [10].
This paper investigates the current structure of the wholesale electricity market in Greece, accounting for Spot and Balancing Markets. By exploiting the abundance of RES, Greece aims to become an energy hub supported by cross-border interconnections that would allow for the export of surplus electricity to neighboring counties. Indicatively, the share of RES in the electricity mix of Greece skyrocketed to 44.4% from 17.1% in 2014, marking Greece among the first European countries to lead the installation and exploitation of renewables. In that context, the focal role of Greece in the southeast region is reflected in the projections of the “National Energy Climate Plan” (NECP), with installed capacity of RES reaching more than 27 GW by 2030. In this setting, the lack of energy storage units in the system makes Greece an appropriate case study to review the recent developments in terms of market design by highlighting all the recent initiatives to support their implementation in the electricity mix.
Considering this, the inverted supply–demand relationship that is apparent in the Greek wholesale electricity market is seeking means of storage to exploit the remaining and curtailed renewable energy. Eventually, this would instantly lower the price volatility and smoothen the price curve during the day. As Greece has yet to implement storage technologies, combined with the saturation of non-dispatchable RES in the electricity system, utilizing them in a price optimization manner would facilitate the system’s flexibility, thus lowering price volatility [11,12]. Our analysis put under scrutiny the formation and function of both spot and balancing markets by highlighting the key challenges and reforms to be addressed in the following period. Empirical evidence reveals that the domestic market is currently in accordance with the European Target Model; however, the anticipated benefits in terms of more competitive prices are not evident yet.
The remainder of this paper is structured as follows. In Section 2, we review the literature related to the function of the wholesale electricity market in Greece. In Section 3, the current structure of the spot market in Greece is analyzed. The next section reviews the function of the Balancing Market and highlights the existence of non-compliance charges along with a discussion on the Balancing Capacity Market (Section 4). Finally, in Section 5, we conclude and provide directions for future research.
2. Literature Review
The liberalization of the energy market in Greece began in the late 1990s, implemented by the EU to create a pan-European Energy Market, resulting in a robust and resilient energy system. The liberalization began through the smooth introduction of various energy packages, consisting of EU directives and regulations. The First Energy Package consisted of Directive 96/92/EC and Directive 98/30/EC, established in 1996 and 1998, respectively. These directives introduced common rules for the internal market regarding electricity and natural gas (NG) and were active from 1998 to 2003, while establishing the right of Third-Party Access and operational unbundling. Under those directives, national regulatory authorities took the role of market supervision, monitoring compliance and regulation of the electricity supply.
The Second Energy Package extended prior directives by introducing Directive 2003/55/EC, which granted access to cross-border NG transmission networks. Regulation (EC) No 1228/2003 established conditions to the network for cross-border exchanges in electricity. Specifically, these changes were issued to set technical rules for access to the transmission network, capacity allocation and congestion management. In that context, Ref. [13] investigated the cross-border electricity trading in Southeast Europe with respect to the Internal European Market. Next, the Third Energy Package, which took place from 2009 to 2019, consisted of Directive 2009/72/EC, Regulation (EC) No 714/2009 and Regulation (EC) No 713/2009, which established the Agency for the Cooperation of Energy Regulators.
The Fourth Energy Package added Regulation (EU) 2019/943 and Directive (EU) 2019/944. The new framework established common rules for the internal wholesale electricity market, aiming at a competitive and robust market, while integrating renewable energy and removing barriers to cross-border trading. In 2021, the Fifth Energy Package was established, also named “Fit for 55”, setting targets for 2030 towards decreasing greenhouse gas (GHG) emissions by at least 55% compared to 1990 levels and achieving climate neutrality by 2050. An early investigation on the electricity sector in Greece accompanied by the initial reforms to liberalize the wholesale market is provided by [14]. The author identified a couple of key pending reforms to boost the liberalization process, for instance, transparency in pricing formation, promotion of competition, unbundling of transmission networks and introduction of a regulatory framework aligned with European guidelines. Next, Ref. [15] outlined an overview of Greece’s wholesale electricity market with emphasis on ancillary services. Since then, the developments recorded in the wholesale electricity market of Greece have been fundamental.
To begin with, one important milestone considering the liberalization of the domestic market during the past decade was the transformation of the state-controlled electricity firm, Public Power Company (PPC), under a period of severe financial and economic crisis in Greece [16]. For about 50 years, the electricity sector in Greece has been structured under a monopolistic model, where the state-owned and vertically integrated PPC was granted exclusive rights as regards all electricity activities [14]. The gradual transition from this dominant model towards a more liberalized one along with the penetration of RES initiated in 2010.
At that time, the EU’s commitment to achieving a reduction in greenhouse gas emissions, increasing the share of RES in the final energy consumption and improving energy efficiency led also to the acceleration of domestic policies towards the support of RES. In parallel, empirical findings identified increased levels of acceptability of renewable energy applications by the Greek population [17,18]. In this framework, Ref. [19] investigated the effect of solar and wind power generation with respect to volatility of wholesale electricity prices in the Greek electricity market from 2012 to 2018. The authors argue that renewables in general lead to decreased price volatility, while wind power tends to increase it, and solar power tends to decrease it. Furthermore, according to their findings, during peak hours, wind and solar power generation tend to decrease price volatility.
Next, aiming to achieve a smooth energy transition, along with increasing the share of RES in the energy mix, the EU proposed the Target Model mainly focusing on the electricity mix. Prior to the launch of the Target Model, a Day-Ahead Mandatory pool was established including the following processes: Day-ahead scheduling, Dispatch scheduling, Real time dispatch operation and Imbalances settlement. By 1 November 2020, the Target Model was introduced in the Greek market, setting a key milestone for the market reform in Greece. The transition replaced the Mandatory Pool model, aligning Greece with the EU framework, working toward a single EU Pan-European Hybrid Electricity Market Integration Algorithm (EUPHEMIA) [20]. In that context, Refs. [21,22] provide optimization approaches to balance short-term and long-term decision making on energy planning. Consequently, regarding the Greek power generation system, a plethora of papers have analyzed the optimal long-term energy planning and the incorporation of the EUPHEMIA algorithm [23,24,25,26,27]. In that context, a recent paper by [28] presents an investigation into a novel multi-energy trading market model, which is based on the concept of matching prices.
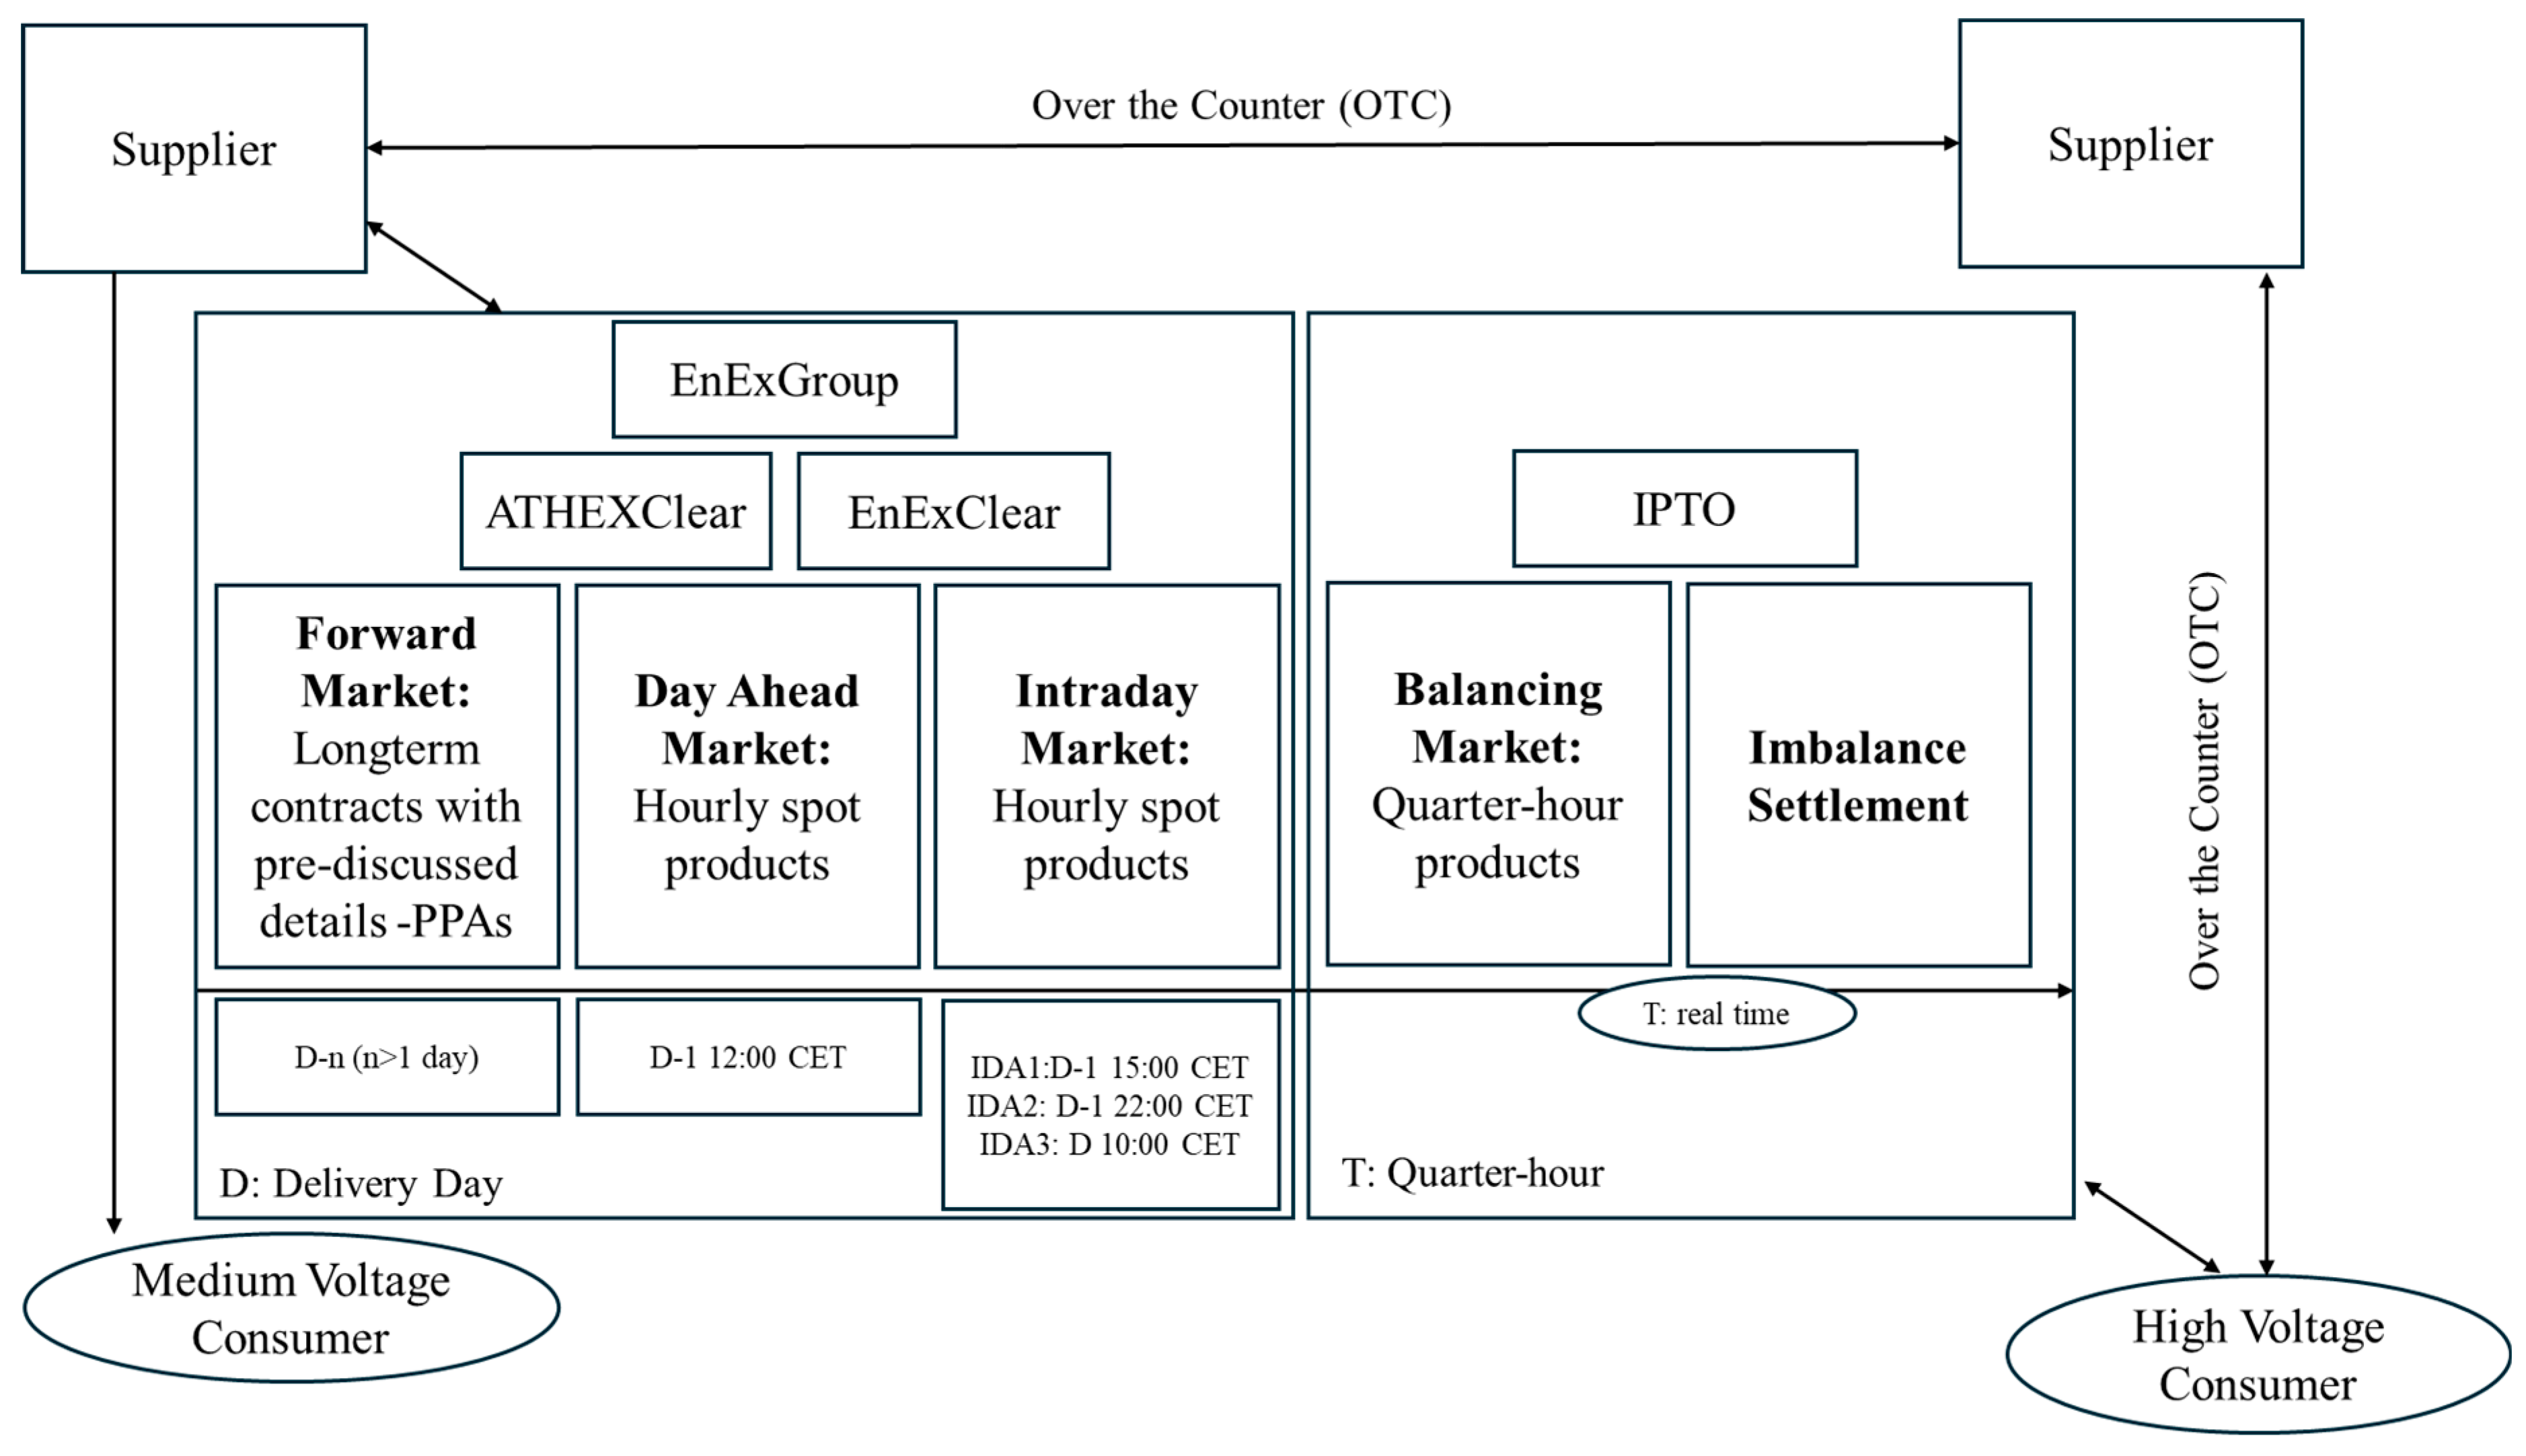
Under the newly established framework, the Target Model consists of four distinct markets, the Forward Market (FM), the Day-Ahead Market (DAM), the Intraday Market (IDM) and the Balancing Market (BM) (Figure 1). The EU Member States that have adopted the Target Model have a Single Day-Ahead Coupling mode (SDAC), while the Intraday Market is gradually being coupled on a pan-European level. Continuous Intraday Trading or Single Intraday Coupling (SIDC) is in almost full force among most EU member states. Furthermore, Greece is directly coupled with the Italian and Bulgarian electricity markets, giving access to other coupled EU countries.
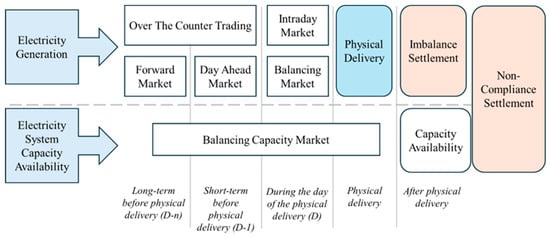
Figure 1.
Target Model structure in Greece.
The main institutions in the formation of the Target Model include the Independent Power Transmission Operator (IPTO), the Hellenic Energy Exchange (HEnEx) and the Clearing House (EnExClear). EnExClear acts as the Clearing House both for the Day Ahead and the Intraday Markets, intervening among the counterparties of the settled transactions, assuming the role of buyer to each seller and the opposite. The Clearing House is responsible for the financial settlements and transactions, to reduce credit risk for the market. The Clearing Members, following the Clearing Regulations, are split into two categories, Direct Clearing Members that are Market Participants (MPs) who may only clear their own transactions and positions, and General Clearing Members who are Financial Institutions that undertake the clearing of the position and transactions of other participants.
Finally, considering the Derivatives Market, which was established in March 2020, ATHEXClear is responsible for clearing all transactions and acting as a Central Counterparty. For the efficient supervision of the legal structure, overseeing the daily function of the markets are the Regulatory Authority for Energy, Waste and Water (RAEWW) in Greece and the Hellenic Capital Market Commission (HCMC). As Figure 2 illustrates, operators of the power system also include Hellenic Electricity Distribution Network Operator (HEDNO), acting as the Distribution System Operator (DSO) and the Operator of RES and Guarantees of Origin. Eventually, in 2022, the Target Model came into full force in Greece, implementing the final step of the BM and the non-compliance charges for BM responsible parties.
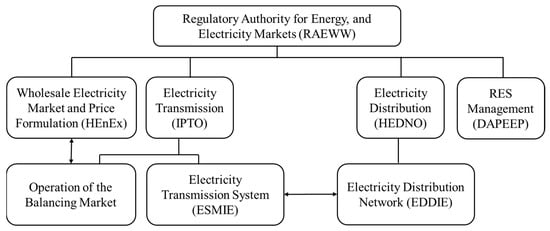
Figure 2.
Main institutional entities and operators of the Greek power system.
3. Spot Market Analysis
3.1. Power Exchange
In line with [1], a Power Exchange (PX) refers to a competitive wholesale trading facility designed for the exchange of energy commodities like electricity and natural gas. All PXs share a similar structure with common rules and operating mechanisms. A power exchange serves as a centralized platform characterized by standardized attributes, principles, regulations, quality benchmarks and transaction terms for energy-related financial product trading. This marketplace is a central electronic auction platform connecting buyers and sellers through fully transparent rules and procedures, with the main task matching demand and supply, and continuously determining a Market Clearing Price (MCP).
3.2. Day Ahead Market
The DAM refers to transactions occurring the day before physical delivery. The procedure allows market participants and the TSO to arrange a balanced timeframe of the physical aspects of the delivery (Figure 3). The orders are submitted one day before the delivery day with hourly time units and refer to the market schedule. Based on the assessed load for that hour and the prices of the technologies offered, the MCP is calculated. At the DAM closure time, in each market schedule, generation should be equal to estimated demand, respectfully to the interconnection balance, considering net imports and exports of electricity. When the balance is secured, offers that are above the balance are declined, while priority is given on a first-come first-served basis respectfully to the lowest price. When submitting an order, each participant submits a balanced portfolio (nominations) to the system operator, providing information on generation or forecasted consumption in each market schedule (time unit) [23].
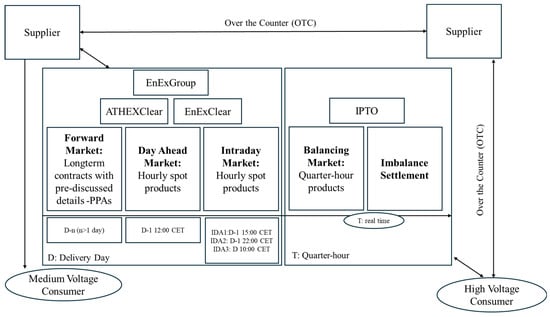
Figure 3.
Power exchange market design in Greece.
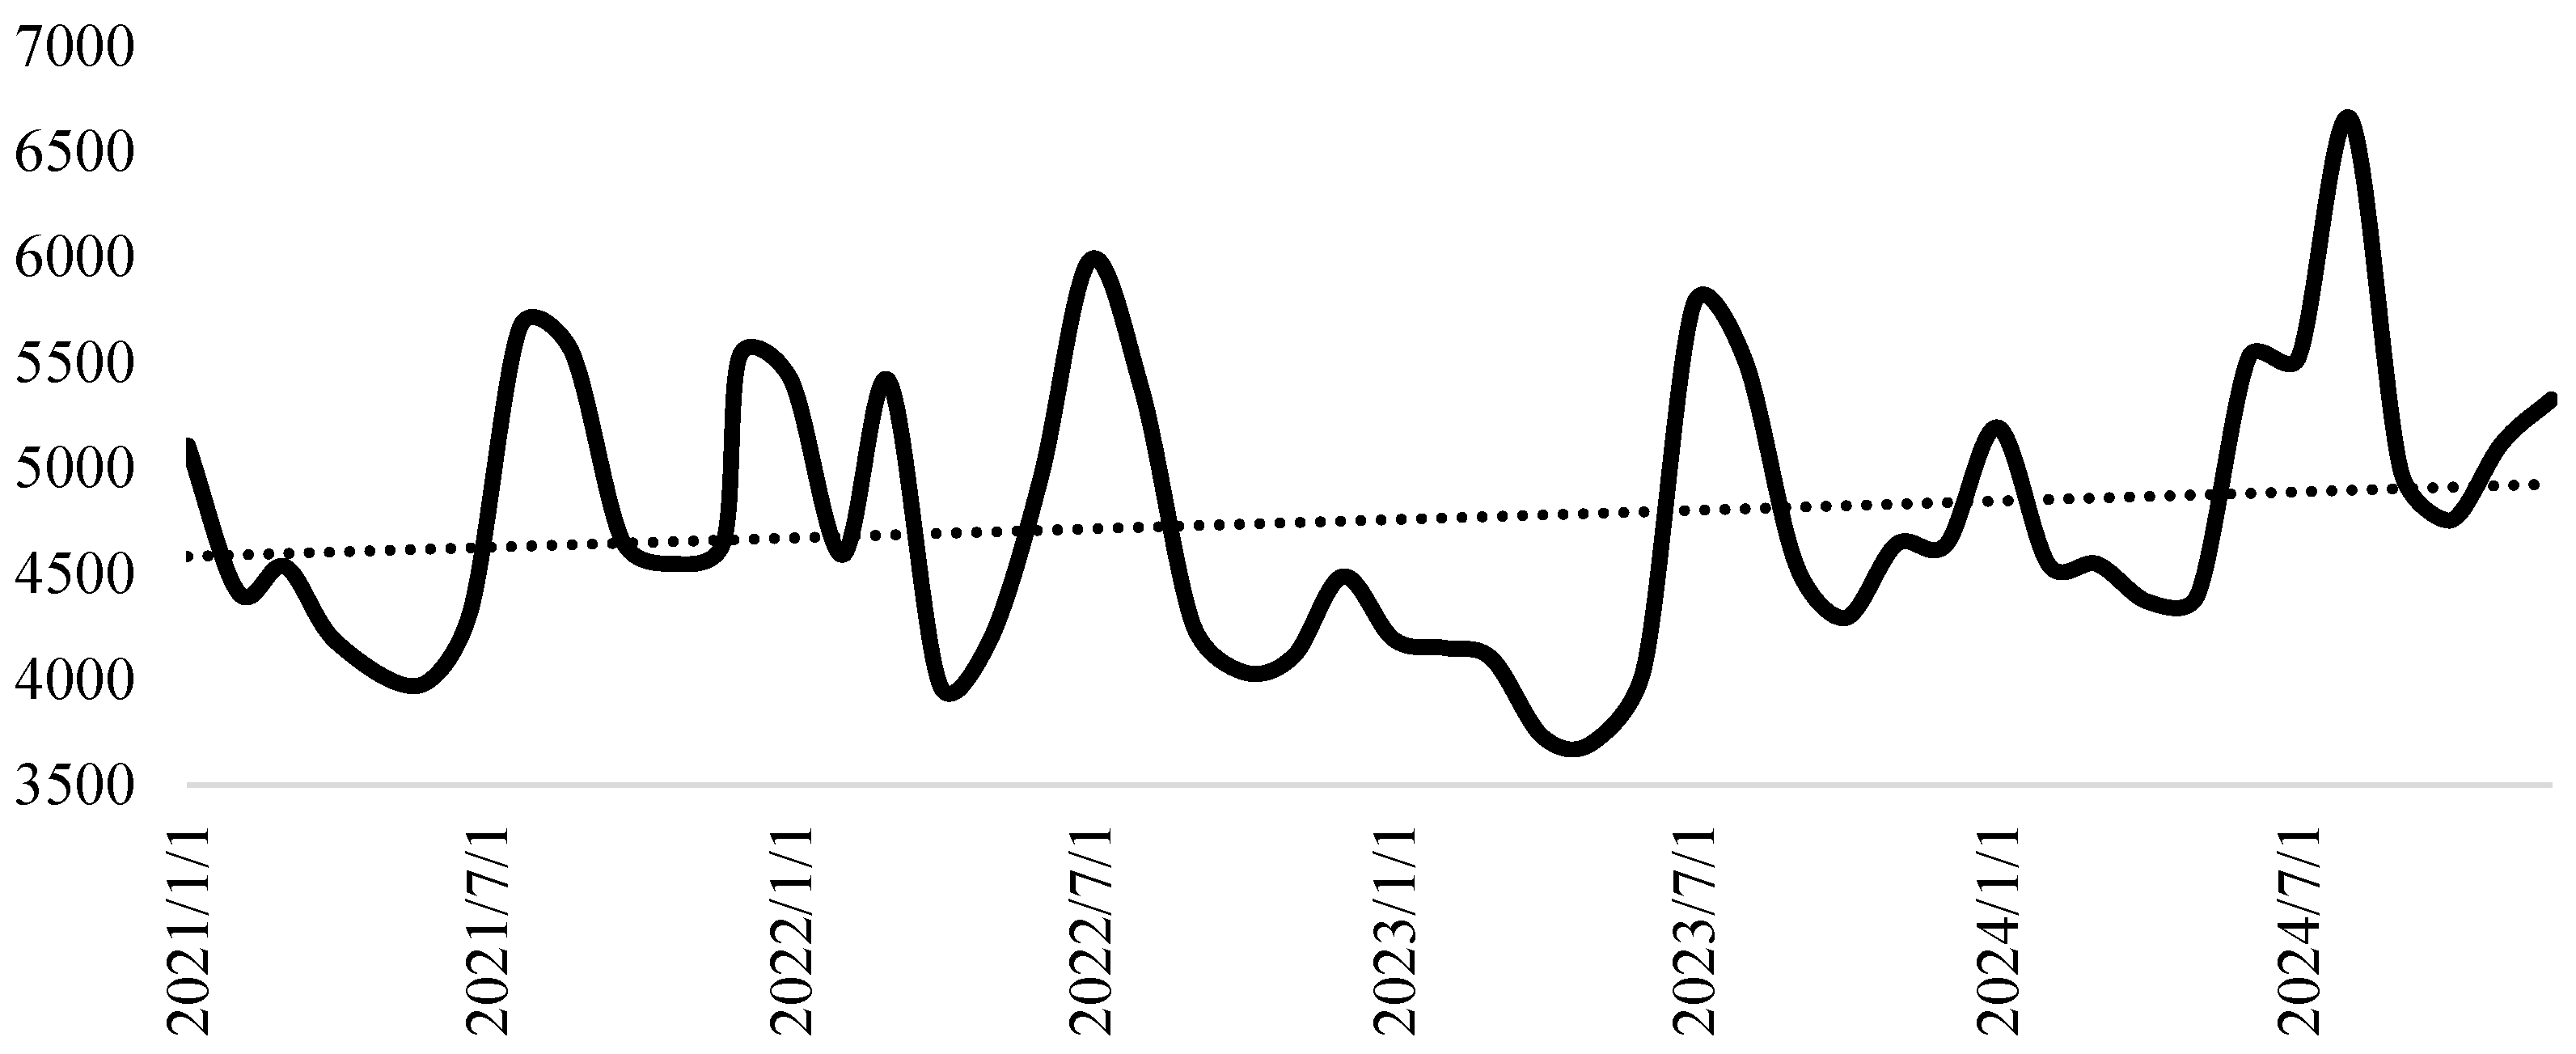
In DAM, only electricity products with physical delivery within the Hellenic Transmission System Bidding Zones are traded. The eligible products, supported by the Price Coupling Algorithm, are in accordance with Article 40 of Regulation (EU) 2015/1222 by a joint proposal of Nominated Electricity Market Operators (NEMOs), and are in line with the available Buy and/or Sell Orders. Additionally, bilateral Over the Counter (OTC) trades are taken into consideration as volumes in the DAM, but their prices can remain undisclosed, while they do not affect the final MCP. Figure 4 illustrates the traded volumes in the Day-Ahead market of HENEX from 2021 until 2024, reflecting the constantly rising demand for electricity (24% slope) along with the apparent electrification trend since 2021.

Figure 4.
Traded volumes in the DAM of HENEX (1 January 2021–31 December 2024).
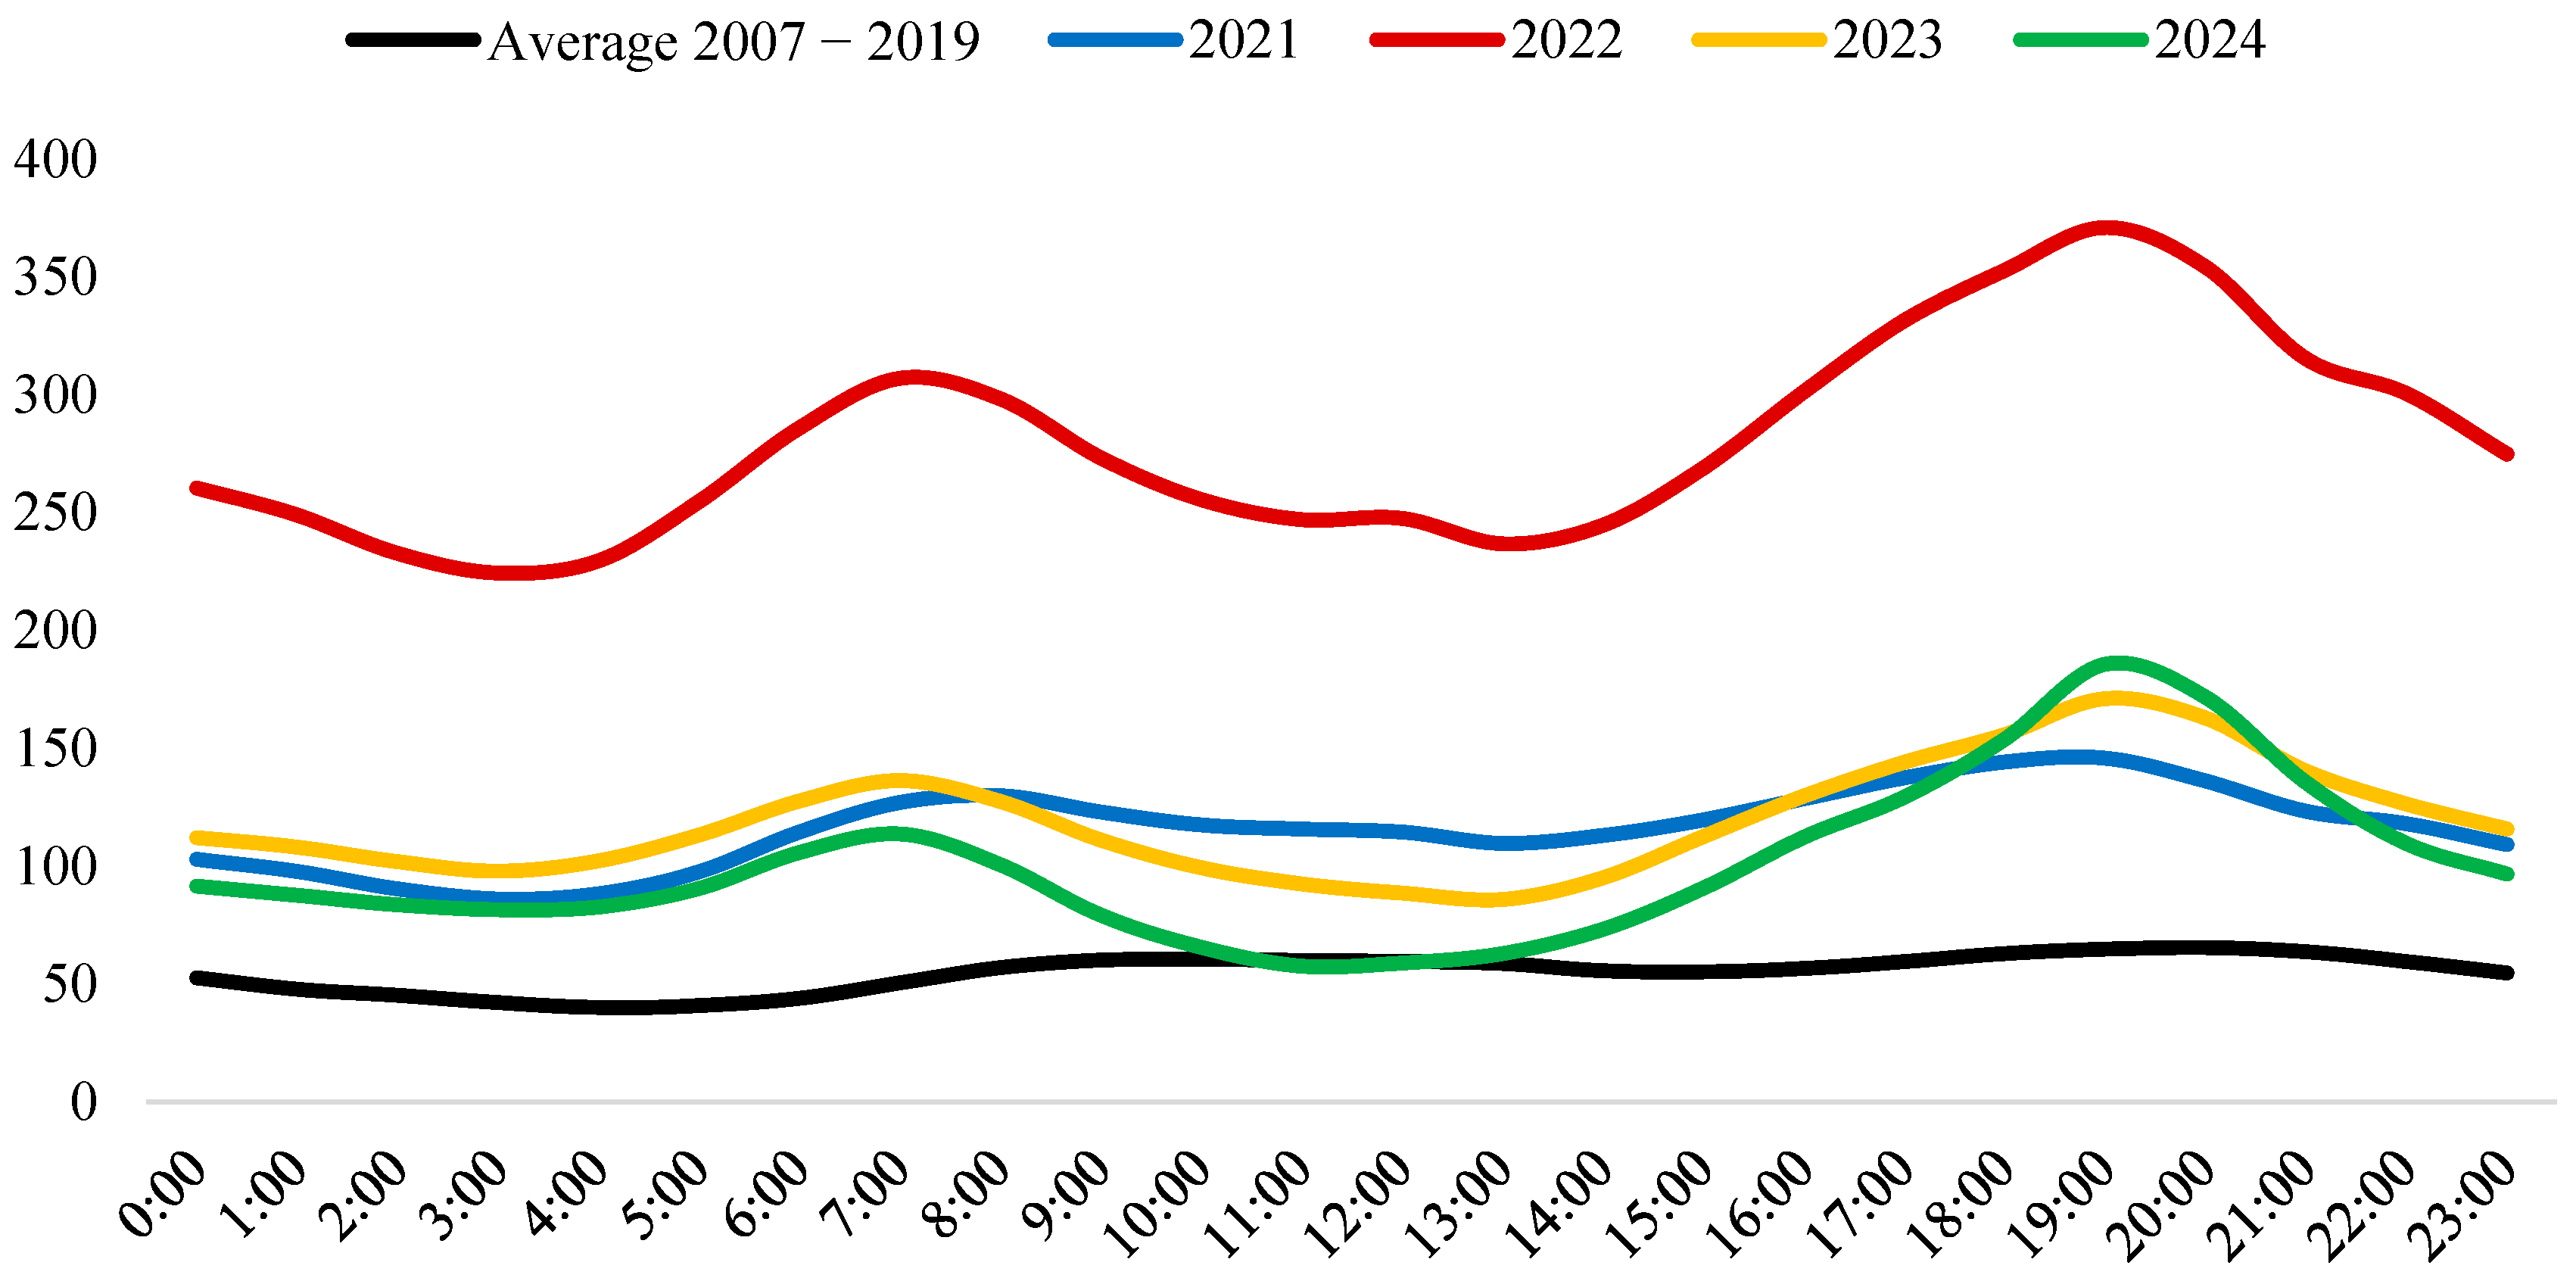
As Figure 5 depicts, even though DAM prices during 2024 are significantly lower compared to 2022, they are still higher compared to the respective levels during the implementation of the Mandatory Pool (2007–2019), supporting the argument of increased electricity prices since the introduction of the Target Model in Greece. Considering price volatility, as expected during evening hours, an upward trend is evident. Interestingly, as illustrated in Figure 6, during 2021, we observe increased levels of volatility compared to the following years.
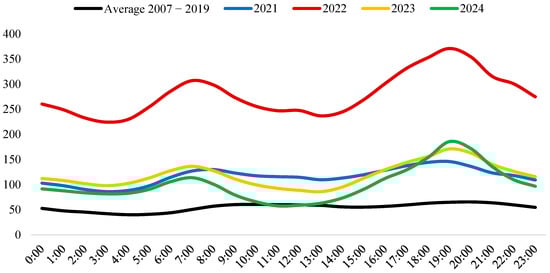
Figure 5.
Average hourly DAM prices (EUR/MWh).
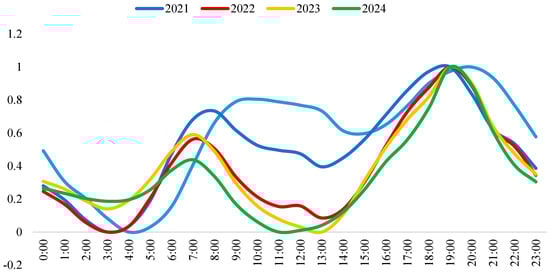
Figure 6.
Price volatility in DAM.
OTC trades and contracts with obligation of physical delivery, taking place in the FM, can use DAM for fine-tuning. One of the main objectives for the EU is the adoption of a single pan-European cross-zonal DAM for electricity. The goal is to increase overall efficiency by promoting competition, increased liquidity and enablement of more efficient utilization of generation resources across Europe [29]. SDAC was initiated in 2014 by NEMOs and TSOs in the framework of Capacity Allocation and Congestion Management, enabling cross-border trading through implicit auctions for next-day power delivery.
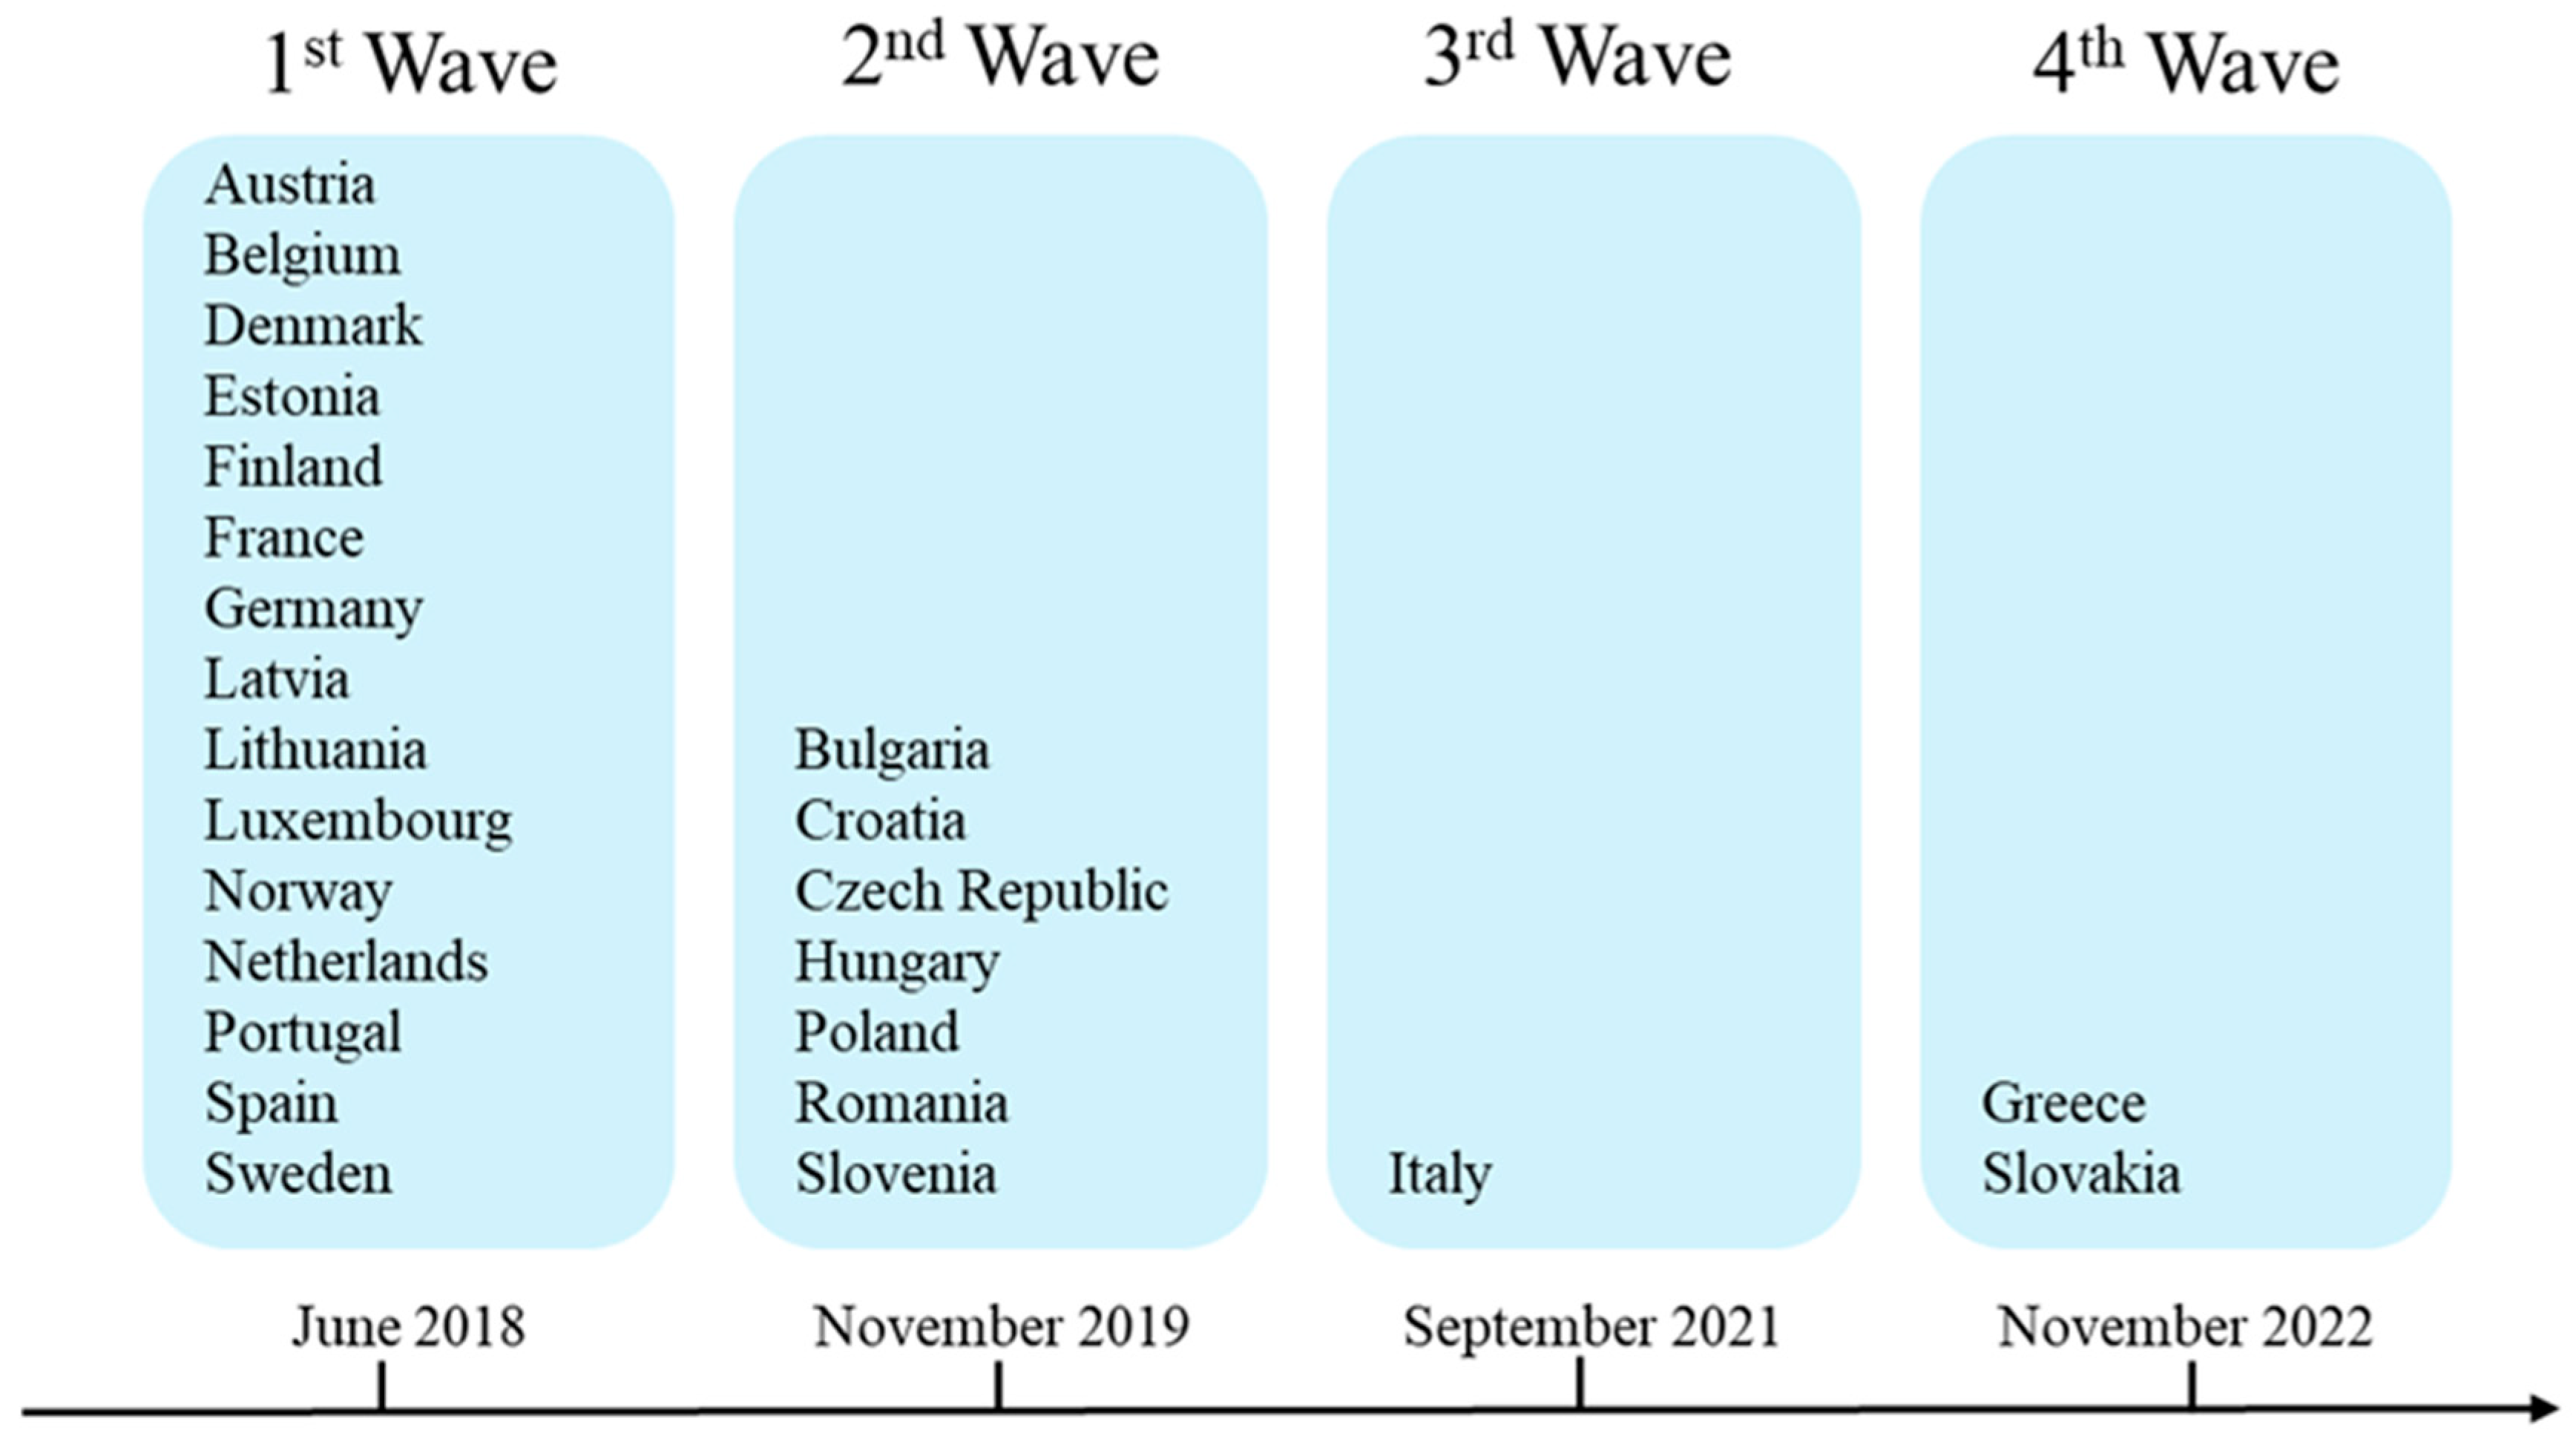
In February 2014, the “first go-live” took place, including Belgium, Denmark, Estonia, Finland, France, Germany, Austria, United Kingdom (UK), Latvia, Lithuania, Luxembourg, the Netherlands, Norway, Poland, Sweden, Portugal and Spain. A couple of months later, in November 2014, Czech Republic, Hungary, Romania and Slovakia joined the initiative. In February of 2015, Italy and Slovenia coupled. Next, in 2018, Croatia and Ireland coupled, while the German–Austrian bidding zone split into two separate ones [30]. The Greek DAM has been integrated into the pan-European DAM since December of 2020, through the Greek–Italian border, with Bulgaria joining later in May of 2021, through the Greek–Bulgarian border. Across this coupling of regions, it was made possible to implement implicit capacity allocation on each border. Nevertheless, in the same year, the UK decoupled from the EU, almost one year after Brexit.
3.3. Intraday Markets
Following the completion of DAM, the IDM allows participants to correct the submitted positions in DAM as the time of the physical delivery approaches. This can be especially useful when there are changes in the energy demand, power plant availability, or changes in the non-dispatchable RES plant forecast, as short-term forecasts are more accurate for RES plants. The IDM allows participants to submit buy or sell orders on the day of physical delivery, after the gate closure of the DAM. Results for the FM and DAM are considered, as well as the BM restrictions. As for the case of DAM, there is no guarantee that the submitted orders will be matched and thus executed [31].
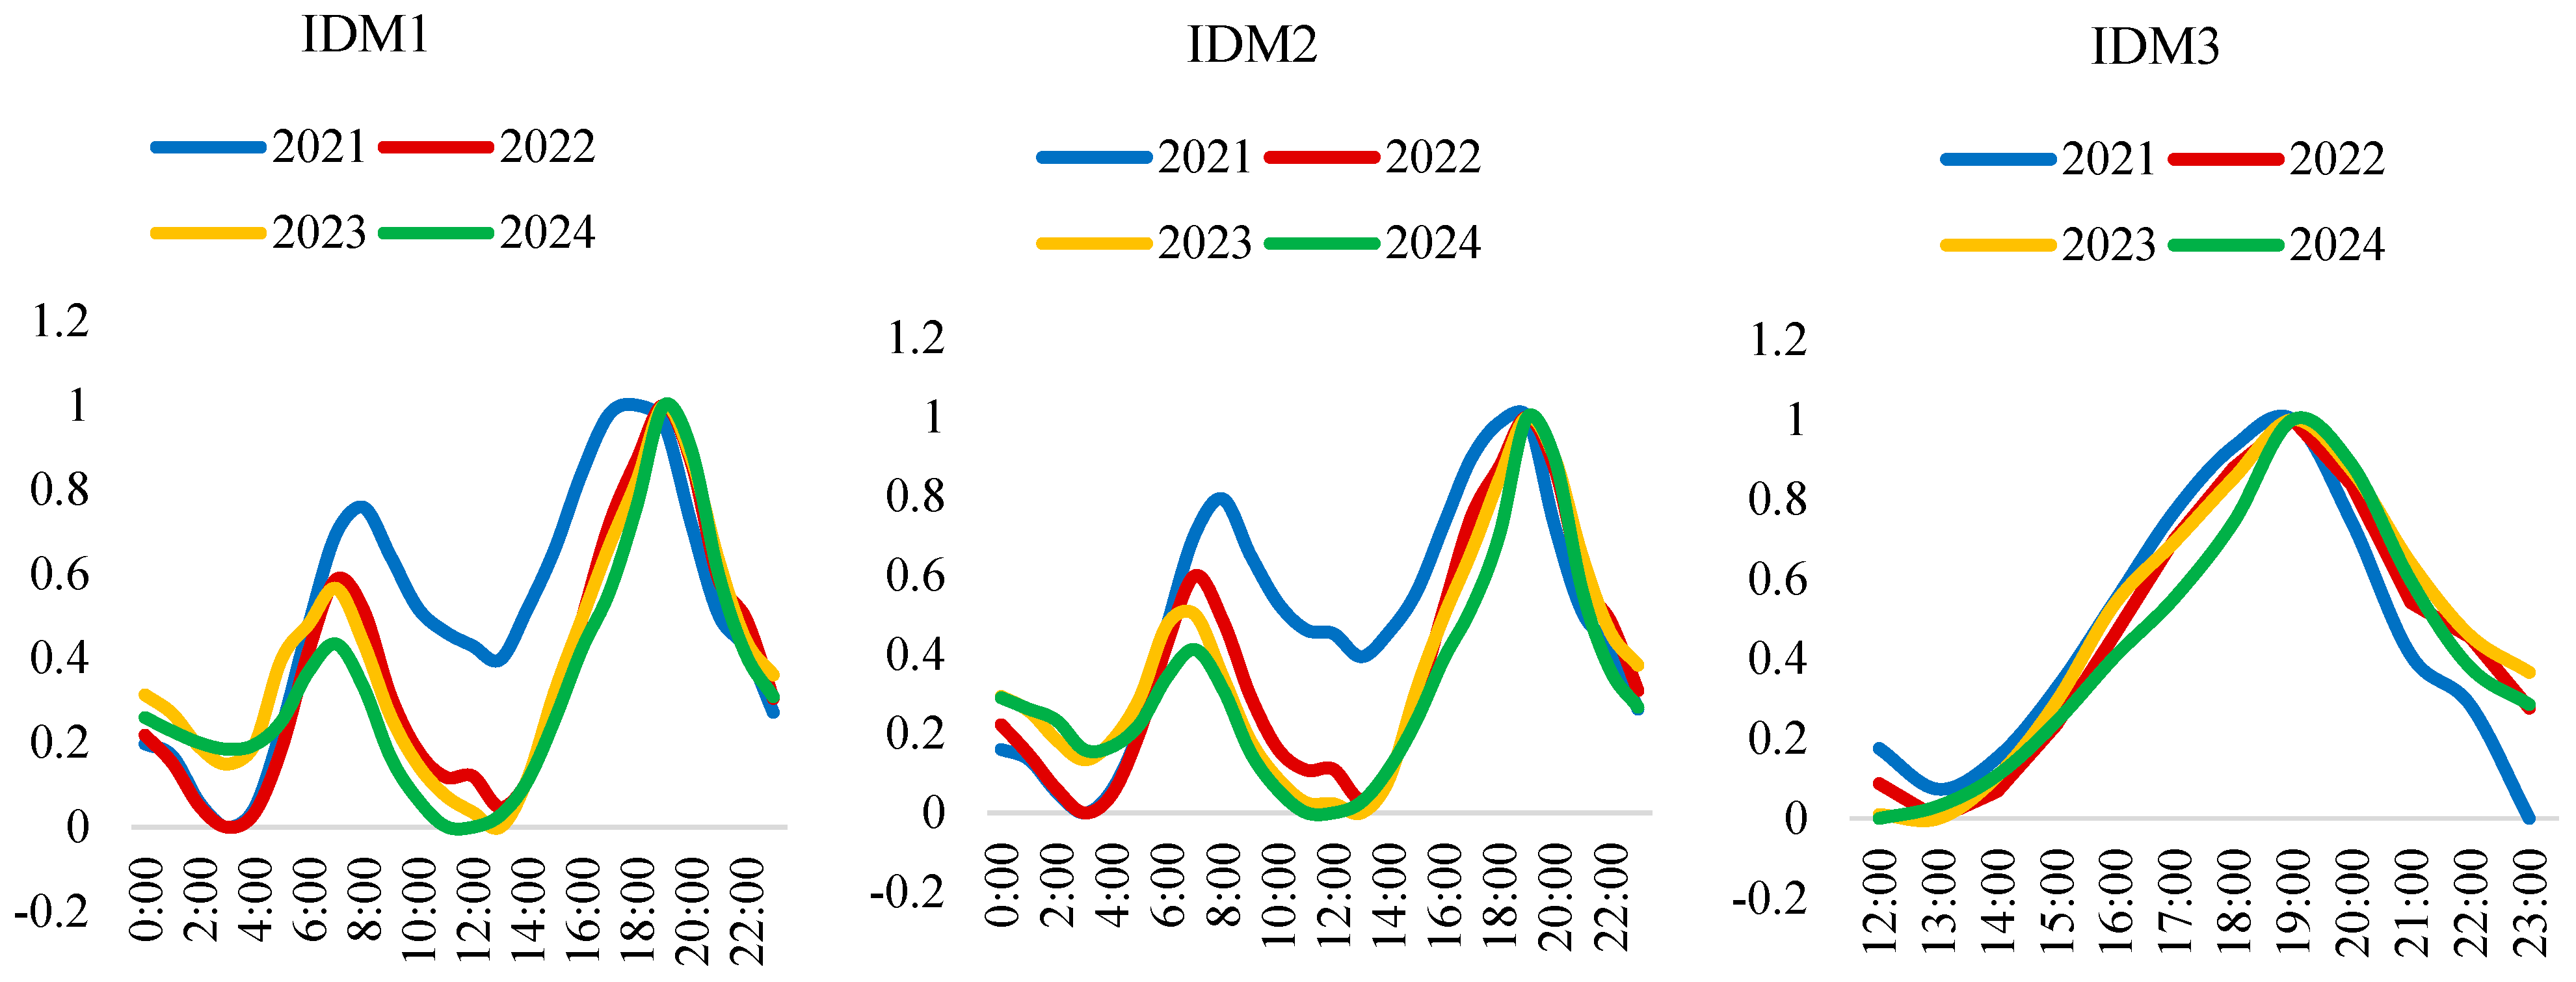
Until September 2021, the Greek IDM performed in three local intraday auctions (LIDAs), as it was not yet coupled in intraday terms with neighboring markets, since the cross-border capacity was not recalculated after DAM. In September of 2021, the Greek and Italian IDMs were coupled, initially through complimentary intra-day auctions (CRIDAs). On 13 June 2024, Intraday Markets (IDAs) took their place via the SIDC. During the execution of IDAs and until the results are published, the coupled borders included in IDAs are paused and all orders in IDAs are verified and validated. Results of IDAs comprise the acceptance status of each order, a single net position for each bidding zone and market time unit as well as the MCP for each time unit. After publication, the results are forwarded to the Clearing House-EnExClear. As depicted in Figure 7, similarly to the case of DAM volatility, the three Intraday Markets follow identical patterns to 2021, maintaining increased levels compared to the following years.
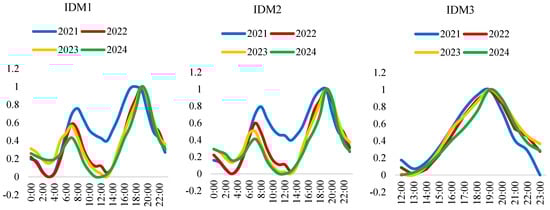
Figure 7.
Price volatility of intraday markets (2021–2024).
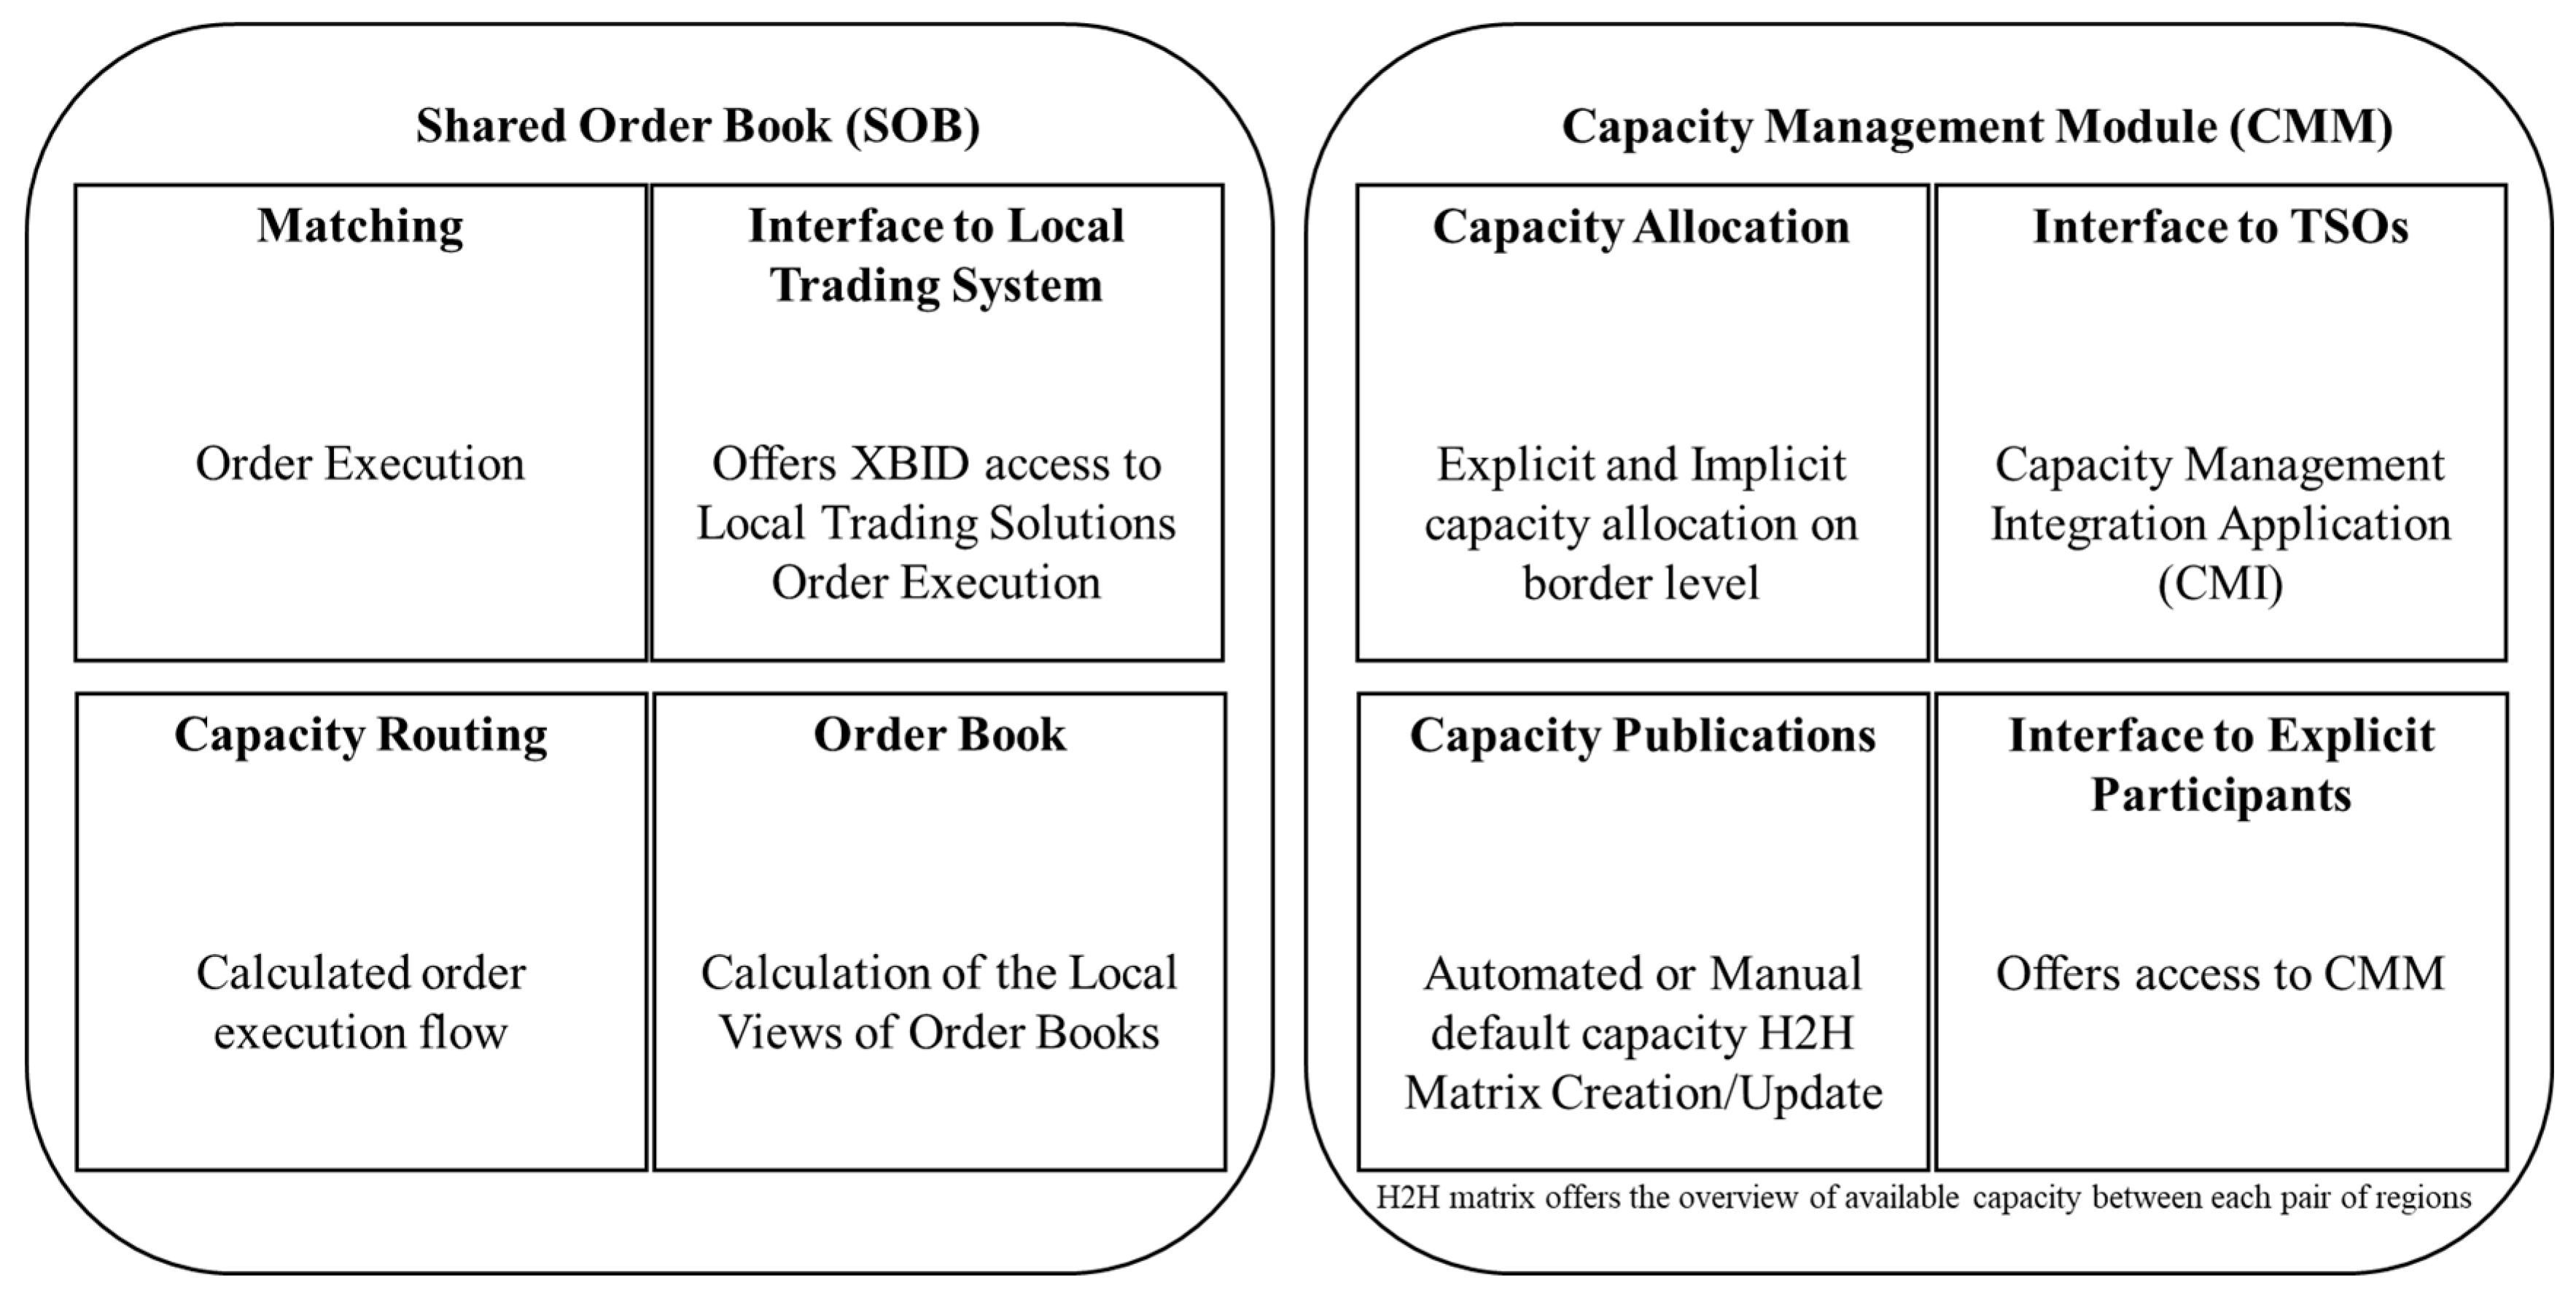
In a similar manner to SDAC, the EU’s plan is for all member states to adopt the XBID project (Cross Border Intraday). XBID was established in 2018, aiming to construct a single EU cross-zonal intraday electricity market, where market participants can trade electricity continuously. SIDC is constructed on a common system with a Shared Order Book (SOB), a Capacity Management Module (CMM) and a Shipping Module (SM) (Figure 8). The benefit of a common system means that market participants from different coupled regions can match their orders with complementary orders, if the available transmission capacity allows this act. In such cases, order matching results in implicit capacity allocation and the SOB and CMM are updated immediately, while the trading principle remains the same. Updating the SOB means matched orders are removed and the available capacity is updated in the CMM. The number and location of the borders where the capacities are updated follows the cross-border flows of the matched orders [32].
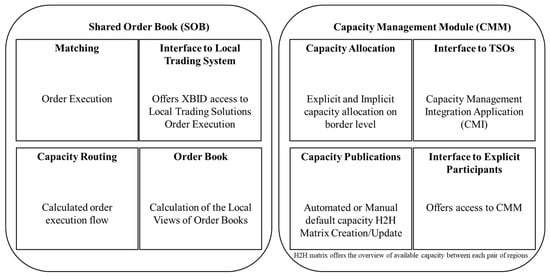
Figure 8.
SIDC matching solution architecture.
The initiative of an integrated intraday market serves the purpose of increasing market liquidity and thus the overall efficiency of intraday trading. Liquidity increase refers to orders that did not have a chance to match prior to integration and since the adoption of XBID, facing greater probability in matching an order. With the overall growth of RES, the interest in intraday trading has increased, as it is rather challenging for RES producers to remain balanced after the closing of DAM. Holding a balance closer to the delivery time is beneficial for all MPs, and for power systems alike. This is of particular interest for RES aggregators, which constantly try to minimize their deviations, and thus the non-compliance charges. The intraday solution supports both explicit and implicit continuous trading, while being in line with the EU Target to unify all EU power exchanges into one.
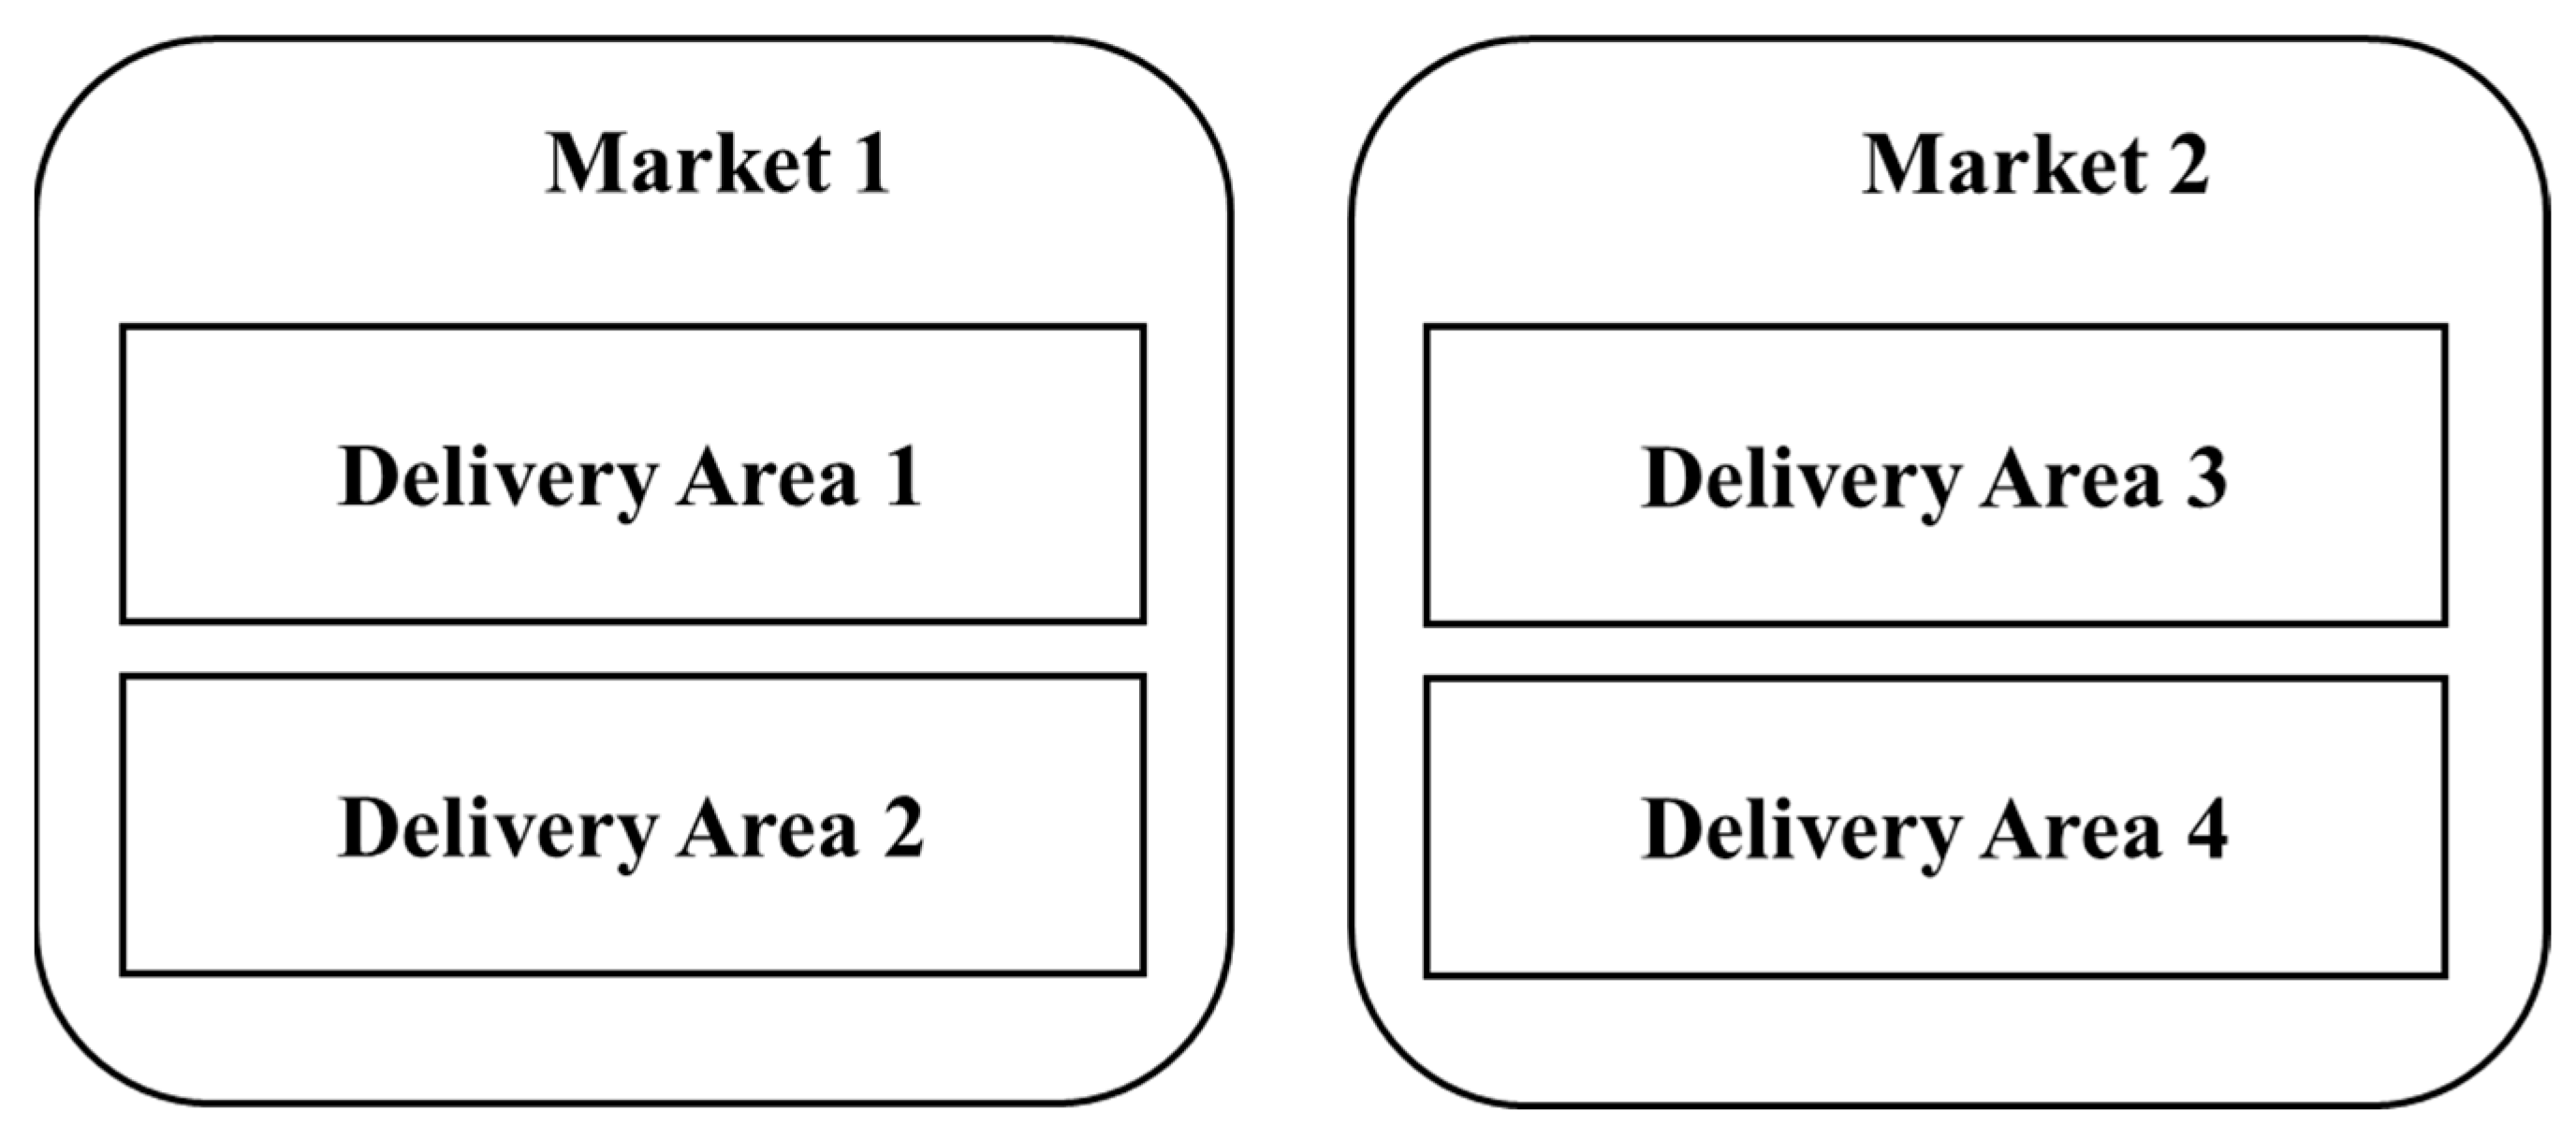
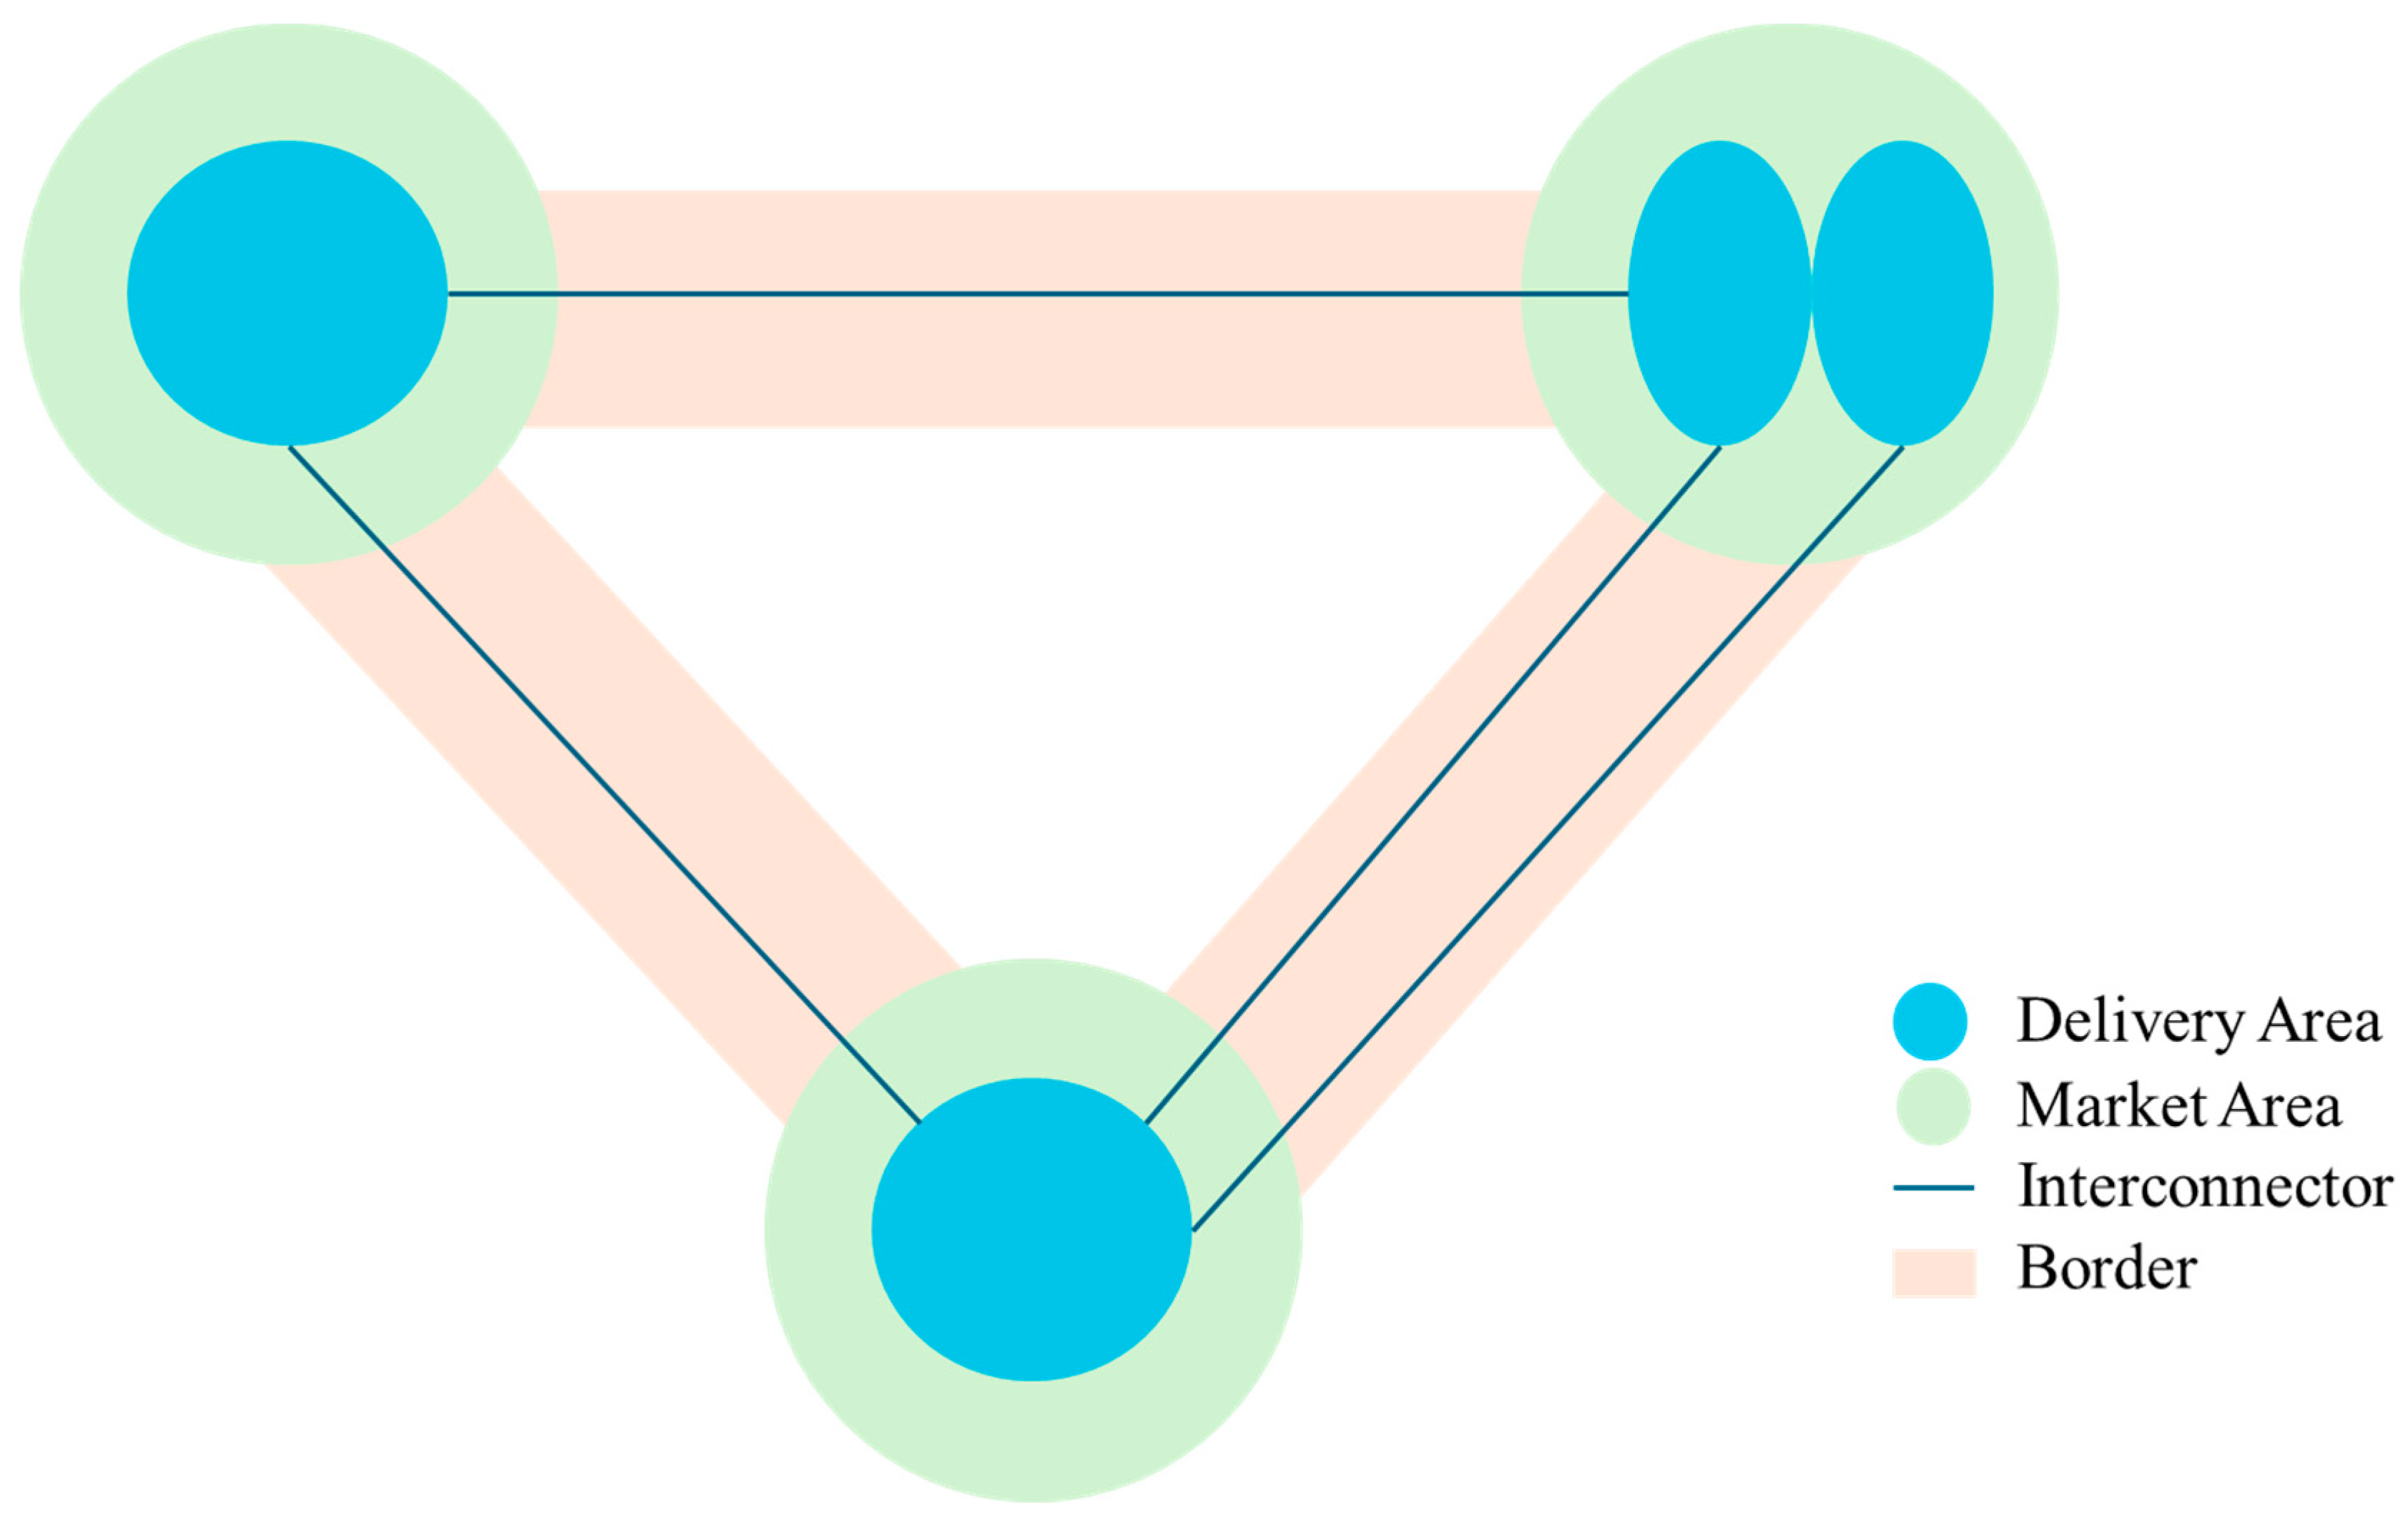
The SIDC’s CMM in the most basic form consists of the Market and the Delivery Areas. The Market Area represents a “price area” in the delivery grid, containing one or more Delivery Areas, and the transport capacity between Market Areas is subject to congestion. The Delivery Area represents an area in the delivery grid and is managed by the respective TSO. Order entry takes place into the Delivery Area, meaning a commodity is received or delivered. The Delivery Area is a subset of the Market Area, as seen in Figure 9. In SIDC’s CMM, apart from the Market and Delivery Areas, the role of interconnectors and borders is crucial. An interconnector is the connection between two Delivery Areas, while a Border is a connection between two Market Areas. An Interconnector is implied to have a separate configuration. The configuration includes characteristics such as opening and closing time, capacity resolution along with default capacity and validation. At the same time, a common configuration per Border is essential. A broader schematic of the CMM configuration is depicted in Figure 10.
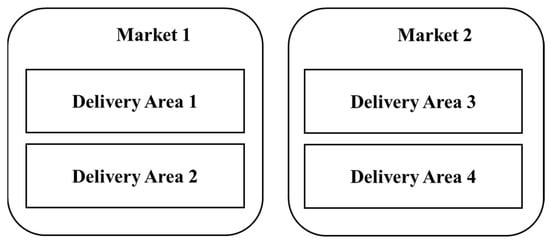
Figure 9.
CMM Market and Delivery Areas.
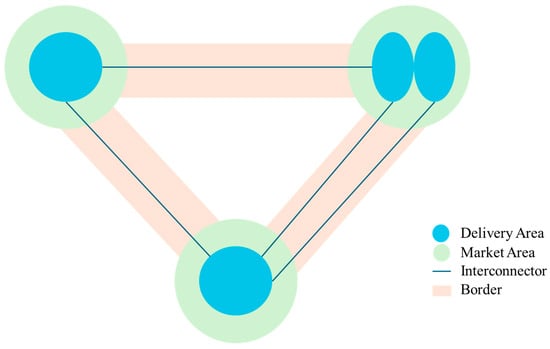
Figure 10.
CMM schematic.
On 13 June 2024, Intraday Auctions were introduced to EU member states that have already adopted the SIDC. In the case of Greece, CRIDAs have been replaced by IDAs. IDAs allow for the accumulation of offers and efficiently allocate scarce transmission capacity, compared to continuous intraday trading, where allocation takes place on a first-come first-served basis. The purpose of IDAs is to harmonize the computation of cross-border capacity and assign a price to that capacity concurrently with its allocation and determine the price of cross-border capacities that can be realized through XBID [33]. Ultimately, IDAs further strengthen the competitiveness of EU electricity markets, trading, and supply through Regulation (EU) 2015/1222.
Figure 11 illustrates the waves that took place in terms of the SIDC for each country. As for the case of Greece, SIDC run through the XBID live platform allows for more freedom and flexibility for a more accurate trade, especially for RES aggregators [34]. During the continuous trading, participants can submit buy and sell orders for all market schedules, with time unit of 60 min. Initially, it was expected for 15 min time units to be introduced in Greece during 2023, though it is estimated to be accomplished by June 2025.
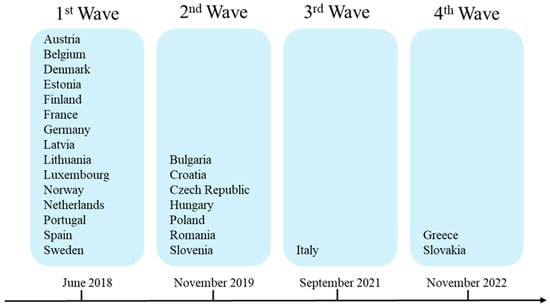
Figure 11.
SIDC country introduction.
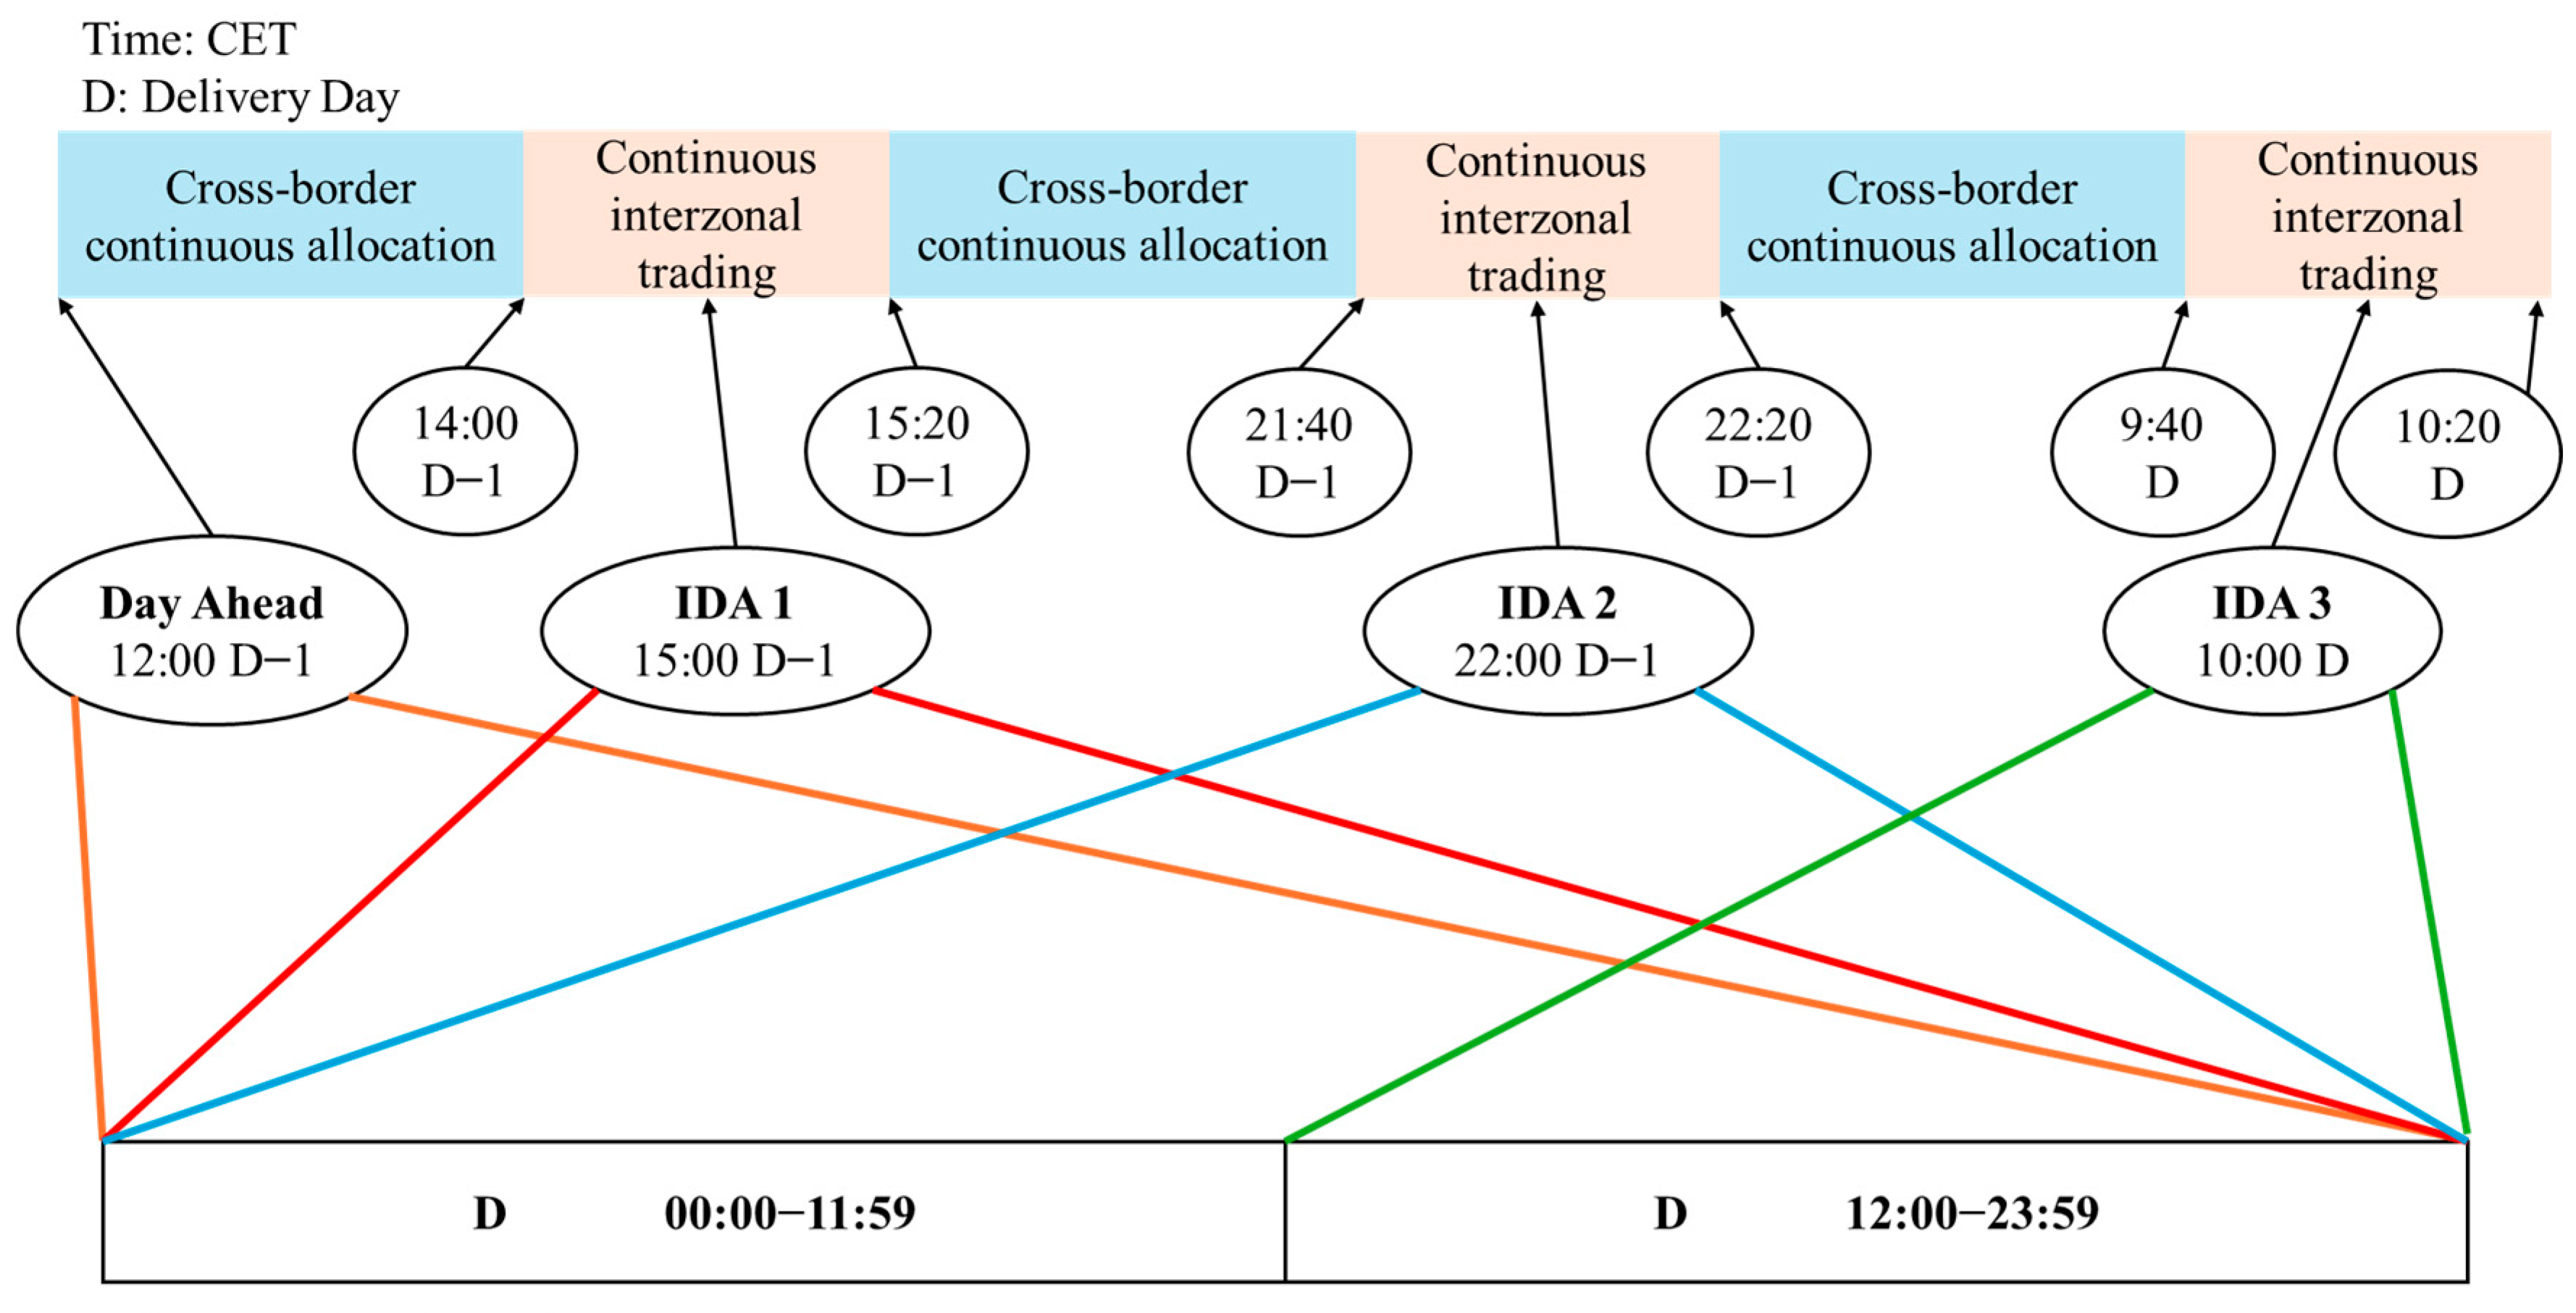
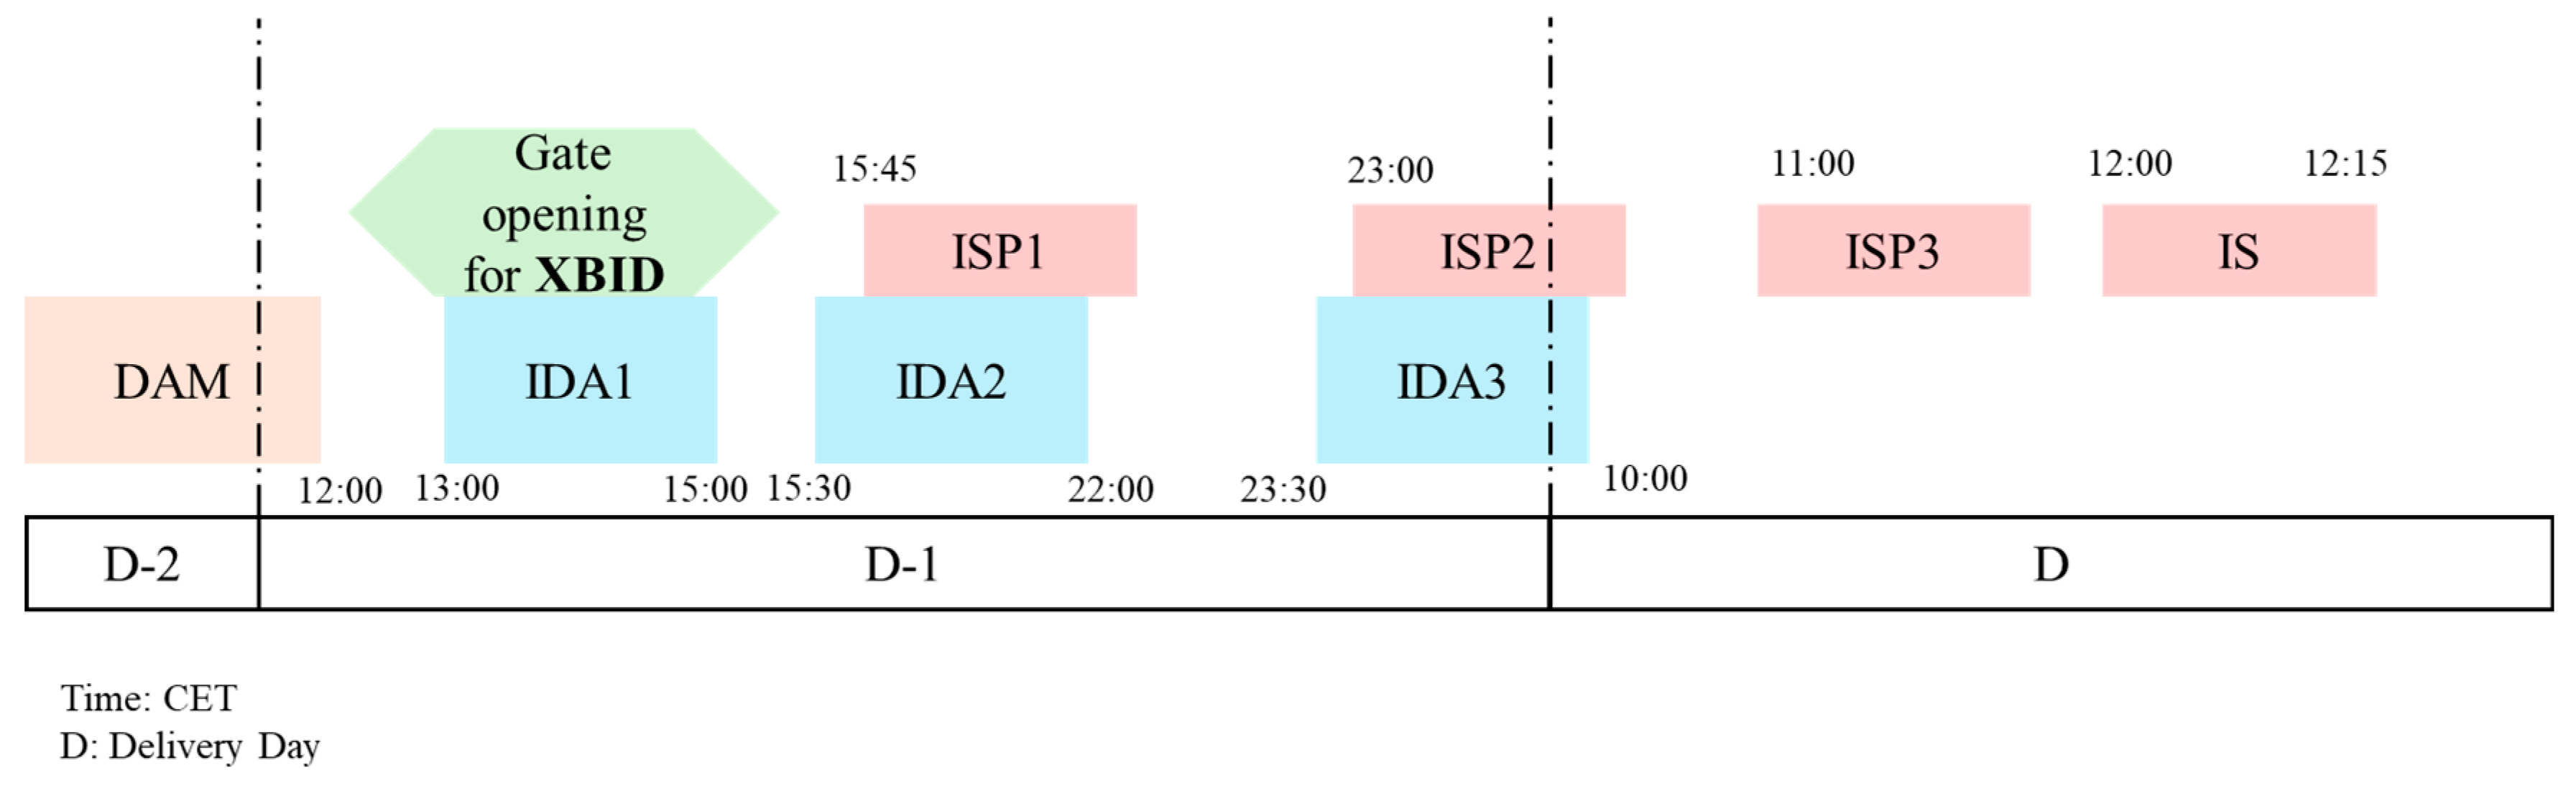
While XBID provides a platform for continuous trading, IDAs provide a mechanism for allocation and pricing cross-border capacity in the intraday markets via the EUPHEMIA algorithm. The IDA solution is organized as an implicit auction; orders are matched, and the cross-zonal capacity is instantly allocated for different bidding zones. All valid submitted orders for the respective auction are taken into consideration, and a clearing price for the specific bidding zone is determined. It is not possible to simultaneously allocate cross-zonal capacities for IDAs and XBID. To resolve this issue, the XBID orders are suspended for a limited period of 20 min before and after the Gate Closing Time (GCT) of IDAs. The GCT as well as the allocated period for IDAs and DAM, along with the suspension intervals of XBID, are shown in Figure 12.
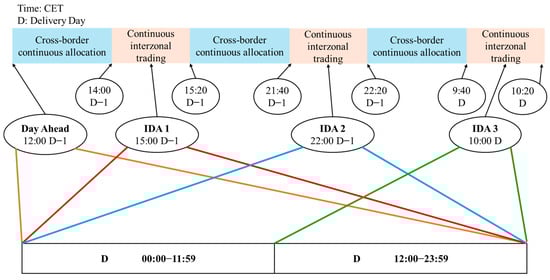
Figure 12.
Trading periods in different markets of the Target Model.
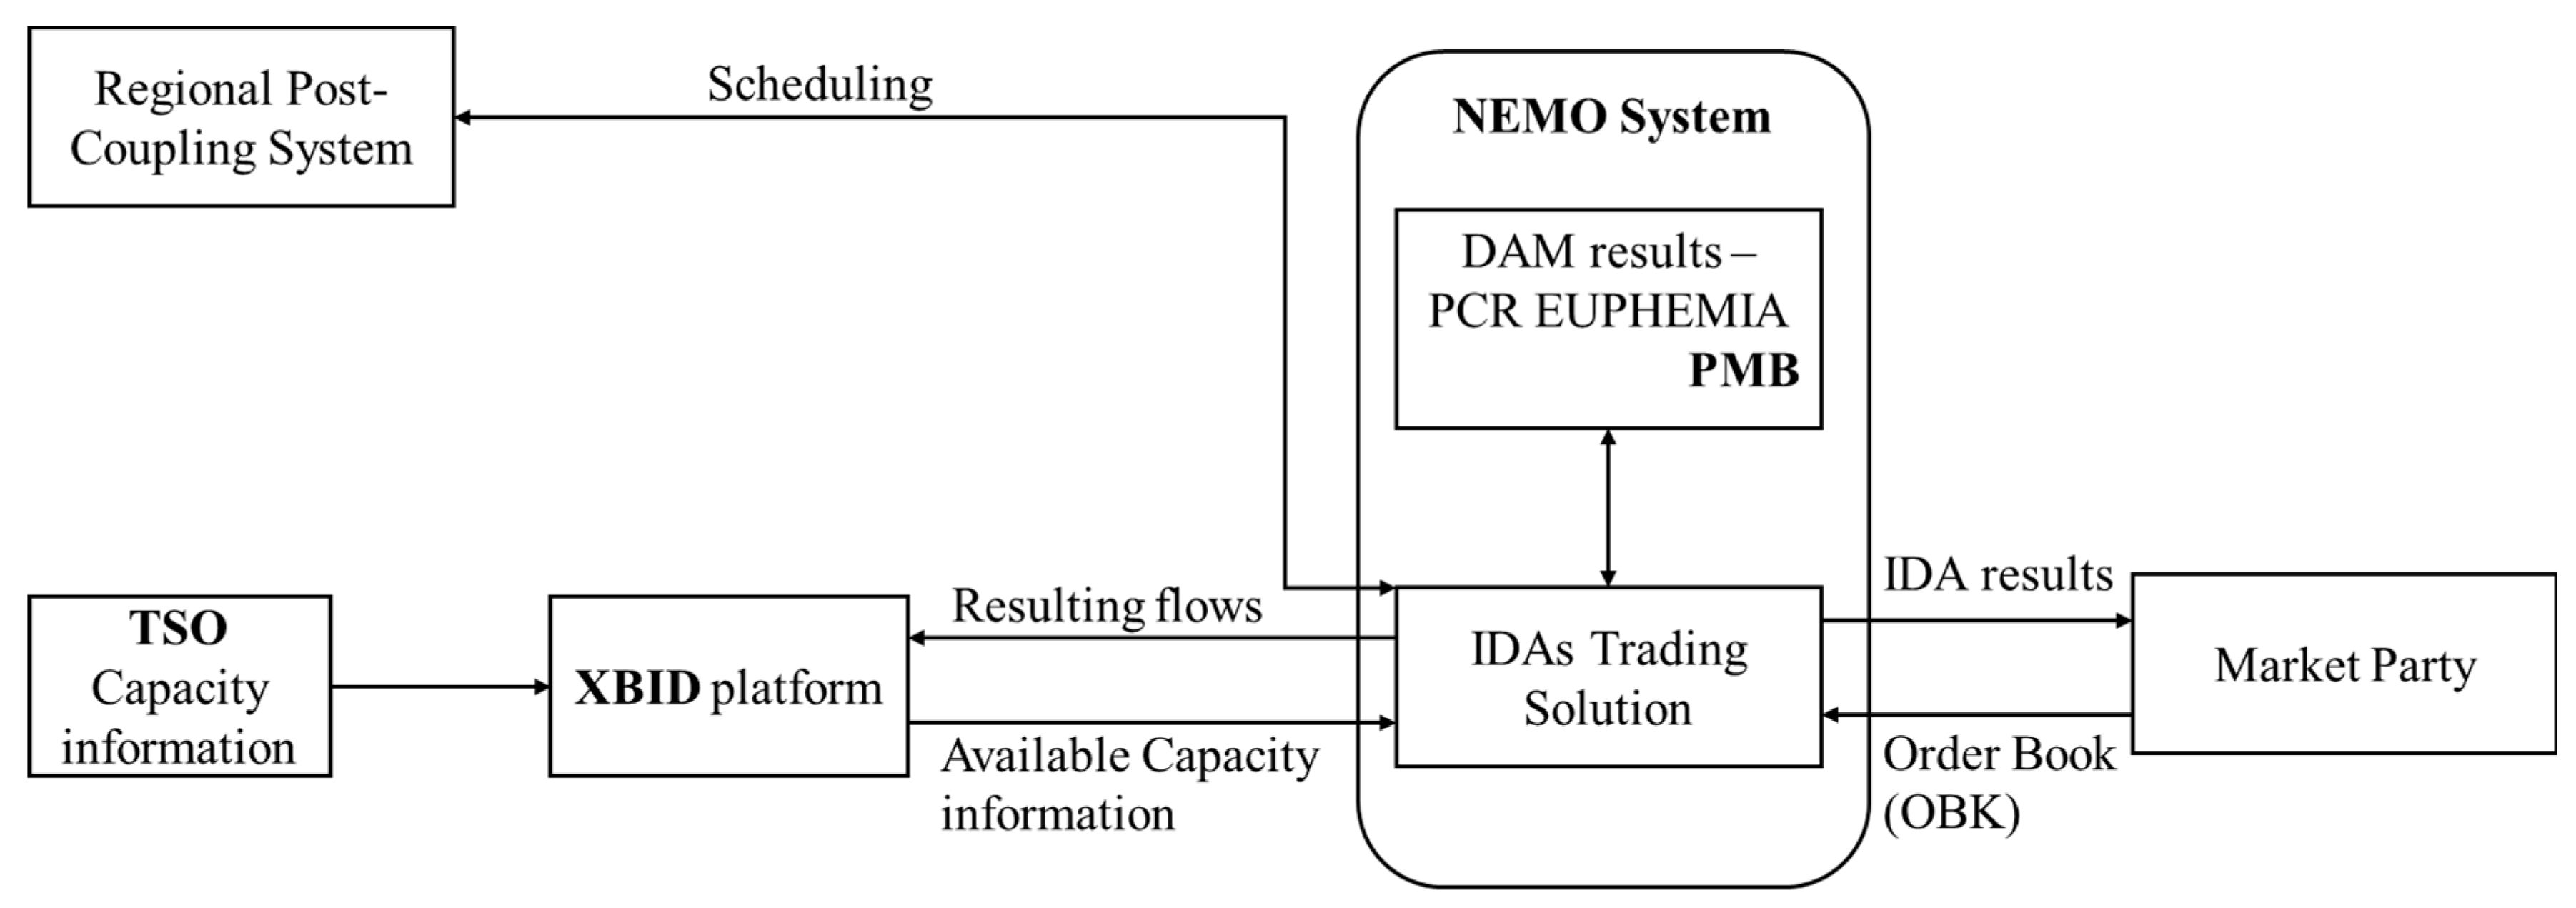
For the case of Greece, Gate Opening and Closing Times for IDAs remains the same as they were formed in CRIDAs. XBID and IDAs are closely affiliated. The only XBID module affected is the CMM; the remaining two modules remain non-functionally impacted. XBID’s CMM serves as a connecting link between the TSO of the country and the NEMO’s IDA trading solution. Pre-coupling, XBID’s CMM is used as a source of network constraint data for the IDA; this is needed to determine the available capacity per region, and after that, in the coupling phase to validate the IDA results (allocated capacity does not exceed the network constraints). Regarding the DAM results, they are provided by the NEMOs to the EUPHEMIA algorithm via PMB (Price Coupling of Regions (PCR) Matcher and Broker) and the PCR along with the allocated capacities are provided to the IDA platform. The PMB service provides anonymized orders and electricity network constraints. Data are distributed along all PXs, to calculate bidding zone prices, along with other reference prices and net positions for all bidding zones.
IDA results are submitted back to XBID’s CMM in the form of allocation requests. In case the flows coming from IDA are compatible with the CMM data, they are accepted, or else they are denied. The back and forth transferring process is made available by implementing the IDA Central Interface Point (CIP), developed specifically for IDA operations; both NEMOs and TSOs have access. IDA CIP is a solution to work between NEMO’s system and XBID’s CMM. Functionalities include data transfer between the two platforms, processing of the data received from XBID’s CMM and giving the processed data to NEMOs, accepting the resulting data from NEMOs after the IDA GCT and transferring back these data to XBID’s CMM, while ensuring consistency between the platforms. Notably, IDA Local Trading Solutions could potentially be the same as in the Day-Ahead auction with small adaptations for the IDAs, or completely new, depending on the NEMO in each instance. The high-level architecture is provided in Figure 13.
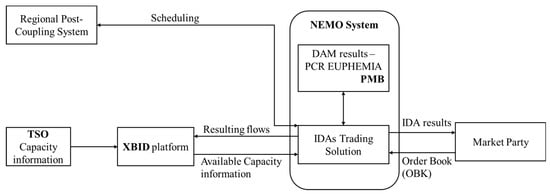
Figure 13.
High-level architecture of IDA data transferring.
3.4. Calculation of Market Clearing and Market Coupling
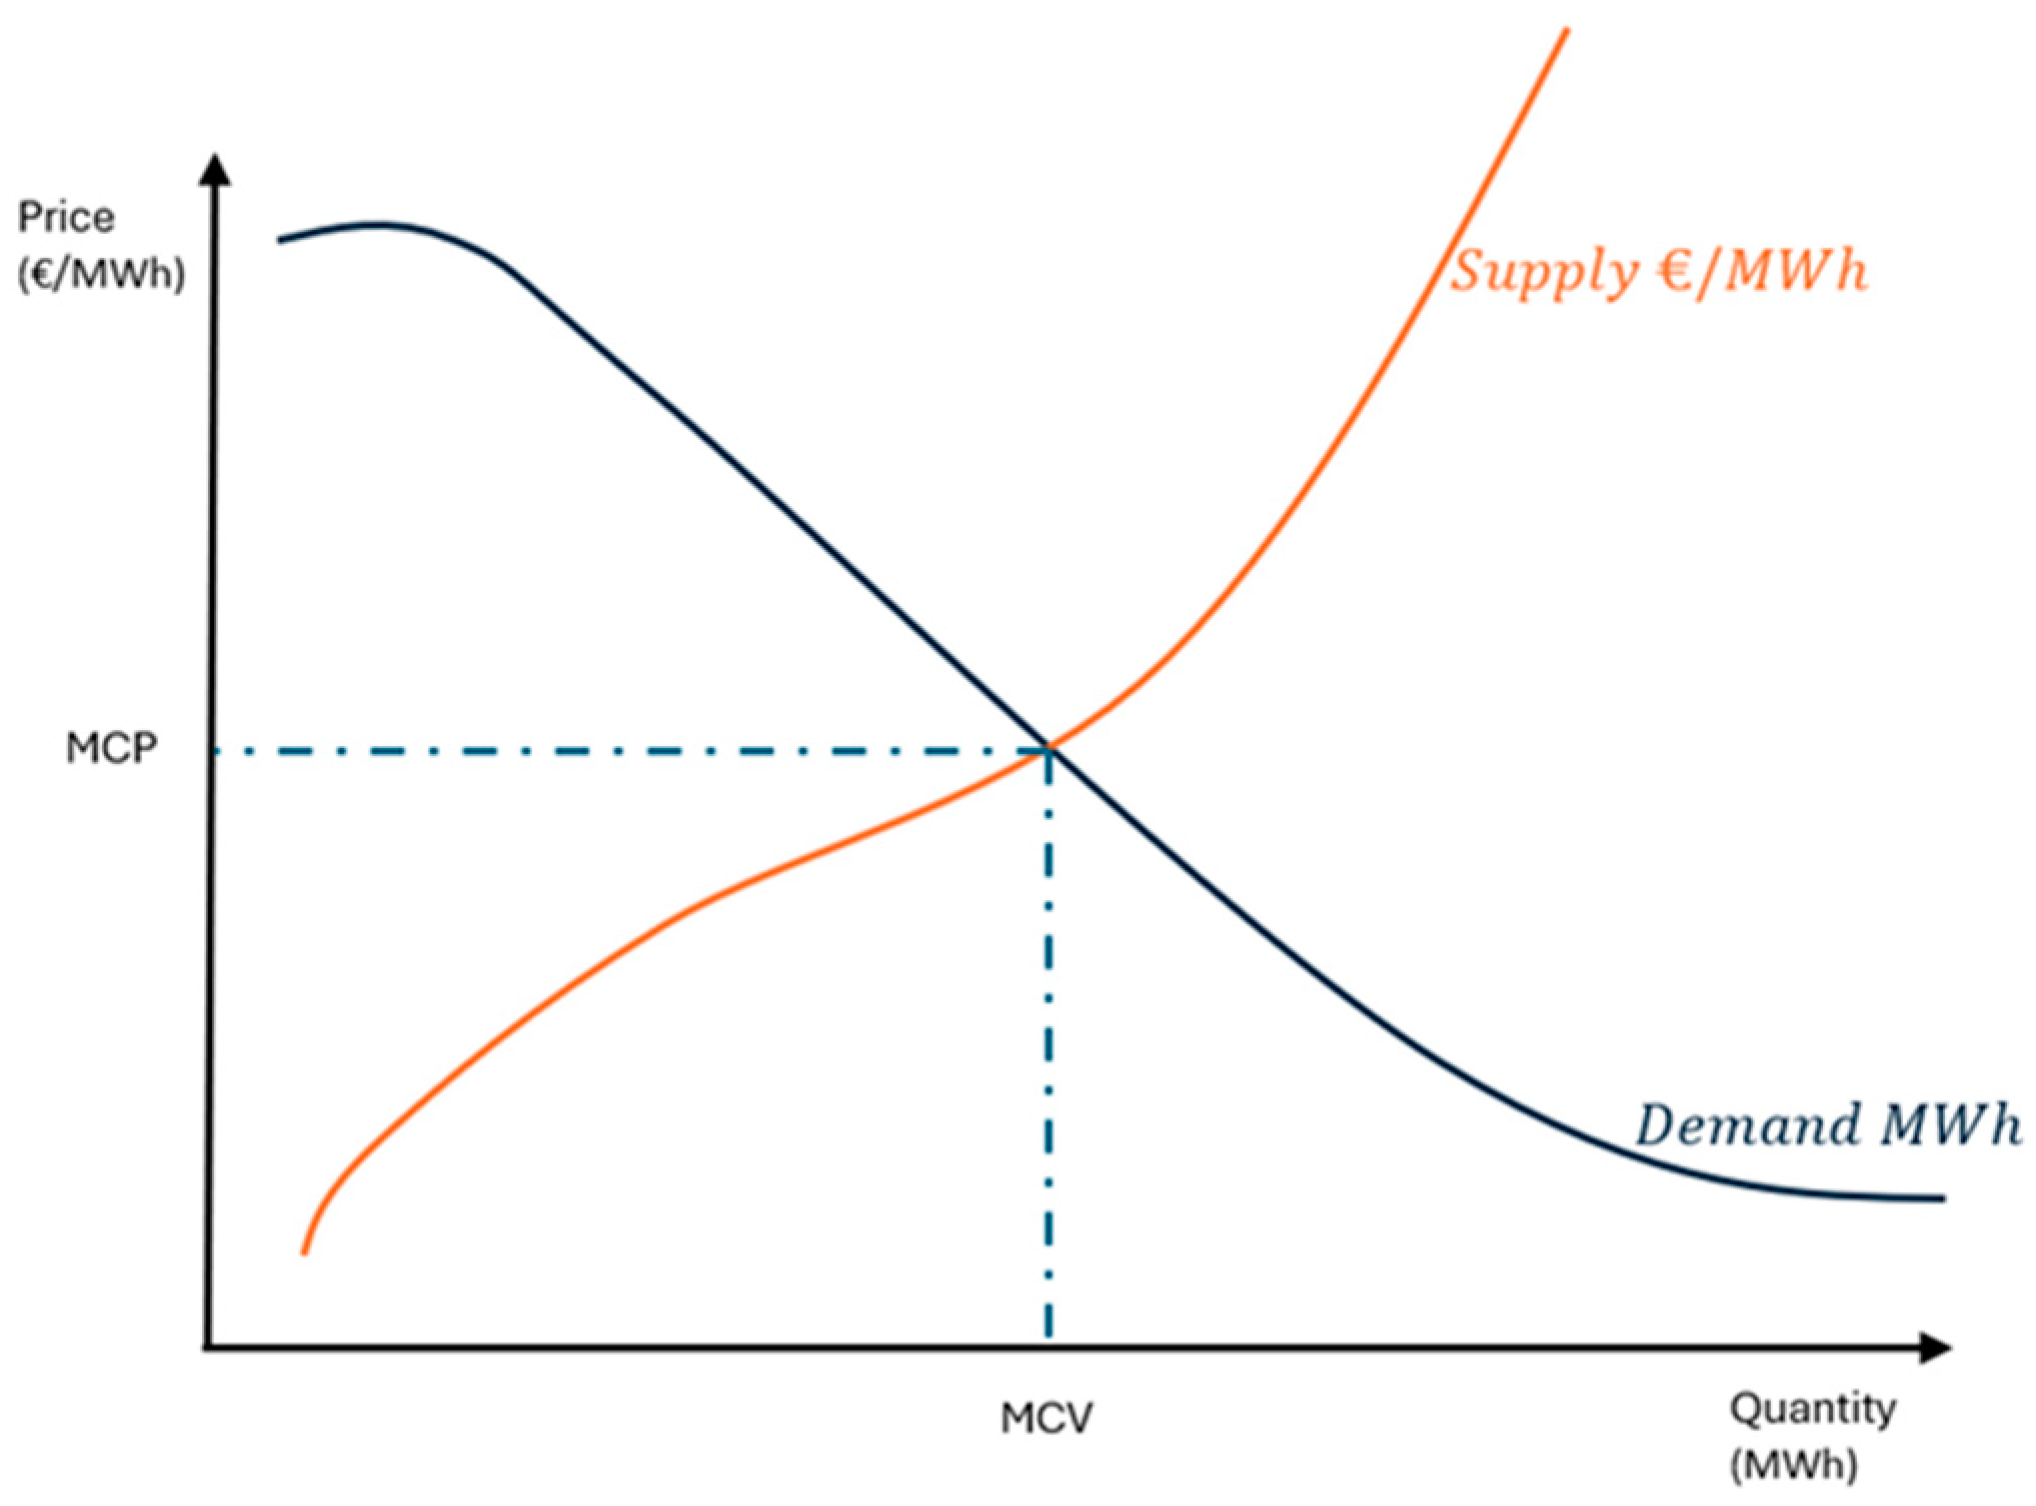
Following Gate Closure, for the DAM and the IDMs, respectively, the algorithm for calculating the MCP is set into action. The submitted buy and sell orders should have information on volume and price, in the relevant price ranges of the auction, determined by EnExGroup. The Buy-Orders establish the demand curve in the PX, while the Sell-Orders establish the supply curve; these two refer to the aggregation curves for each market schedule of the following day. The MCP reflects the demand and supply, serving interest for both curves. As illustrated in Figure 14, the interception point of the two curves determines the MCP and the Market Clearing Volumes (MCVs). For each market schedule, there is a unique MCP and MCV, both applying for Buyers and Sellers. This price is never higher than the price fixed by the buyer or lower than the price fixed by the seller. The MCP is determined in a pay-as-cleared manner, meaning that all sellers with accepted orders no matter the submitted price will get paid the MCP, as during these auctions, the buyers and sellers are not matched one-on-one but rather in an aggregated manner.
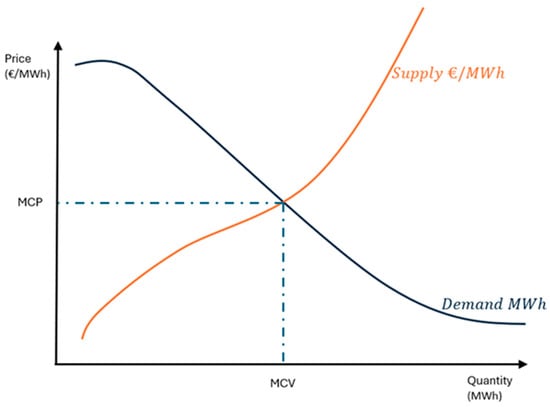
Figure 14.
Supply and demand aggregation curves.
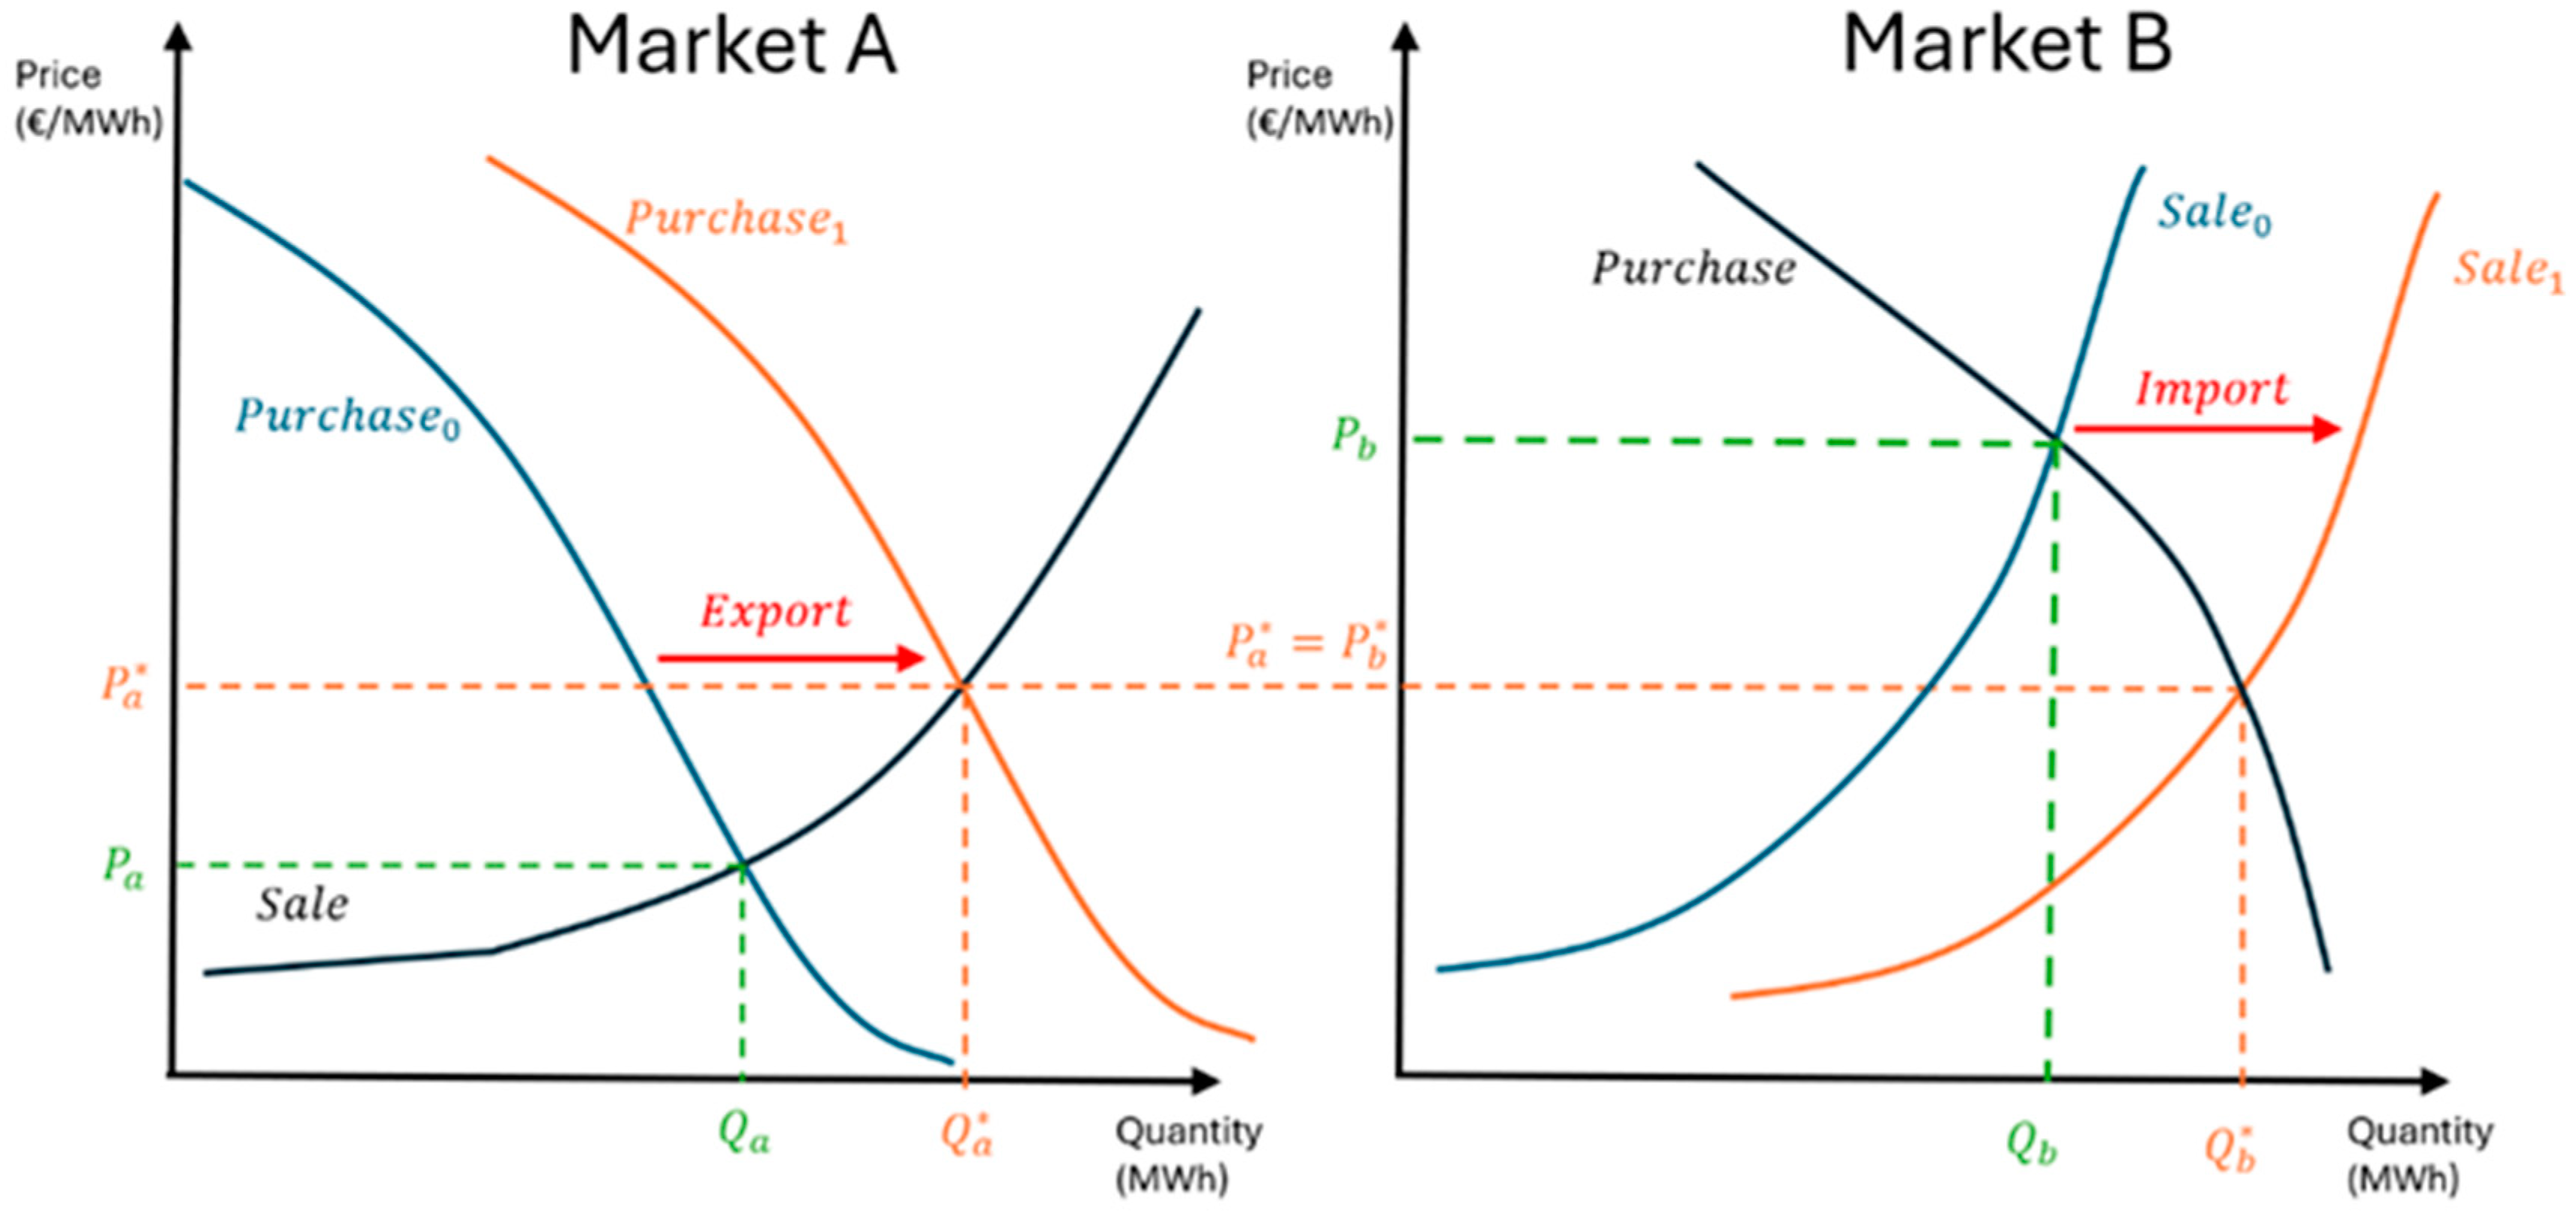
Market Coupling (MC) is a way to join and integrate energy markets from different regions into one single coupled market. As such, buy and sell transactions are possible through different areas, while benefiting from more attractive prices. The main benefit of MC is the improvement of the market liquidity combined with less volatile electricity prices via healthy competition, price convergence, mitigation of market power abuse and granting easier access to the market for smaller participants [20]. In Figure 15, the advantages of MC can be observed. Quantities from Market A that would not be otherwise realized in this market could be partially or even completely exported to Market B. On the other hand, Market B has access to lower prices due to imports from Market A. The EUPHEMIA algorithm was developed to solve the problem of coupling of the DAM markets in the PCR. Market participants submit their orders to the respective PX; these orders are collected and submitted to EUPHEMIA. Next, it is up to EUPHEMIA to decide which orders are to be executed and which to be rejected. The main objectives of EUPHEMIA include maximization of social welfare generated by the executed orders and optimization of the capacity of the relevant network elements [35].
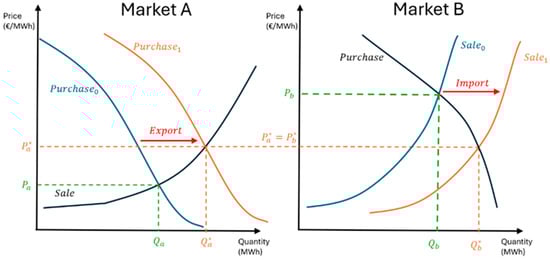
Figure 15.
Market coupling.
EUPHEMIA handles a variety of order types simultaneously as well as their requirements, which are available to market participants according to the local market rules. Such order types include Aggregated Hourly Orders, Complex Orders (Minimum Income Condition and Load Gradient orders), Block Orders (Linked Block Orders, Exclusive Groups of Block Orders, Flexible Hourly Orders) and Merit Orders. The hourly orders (demand/supply) from all market participants belonging to the same bidding zone will be aggregated into one single curve, called the aggregated demand/supply curve, defined for each period. Demand orders are sorted from highest to lowest price, while supply orders are sorted from lowest to highest price, in the opposite manner to demand orders.
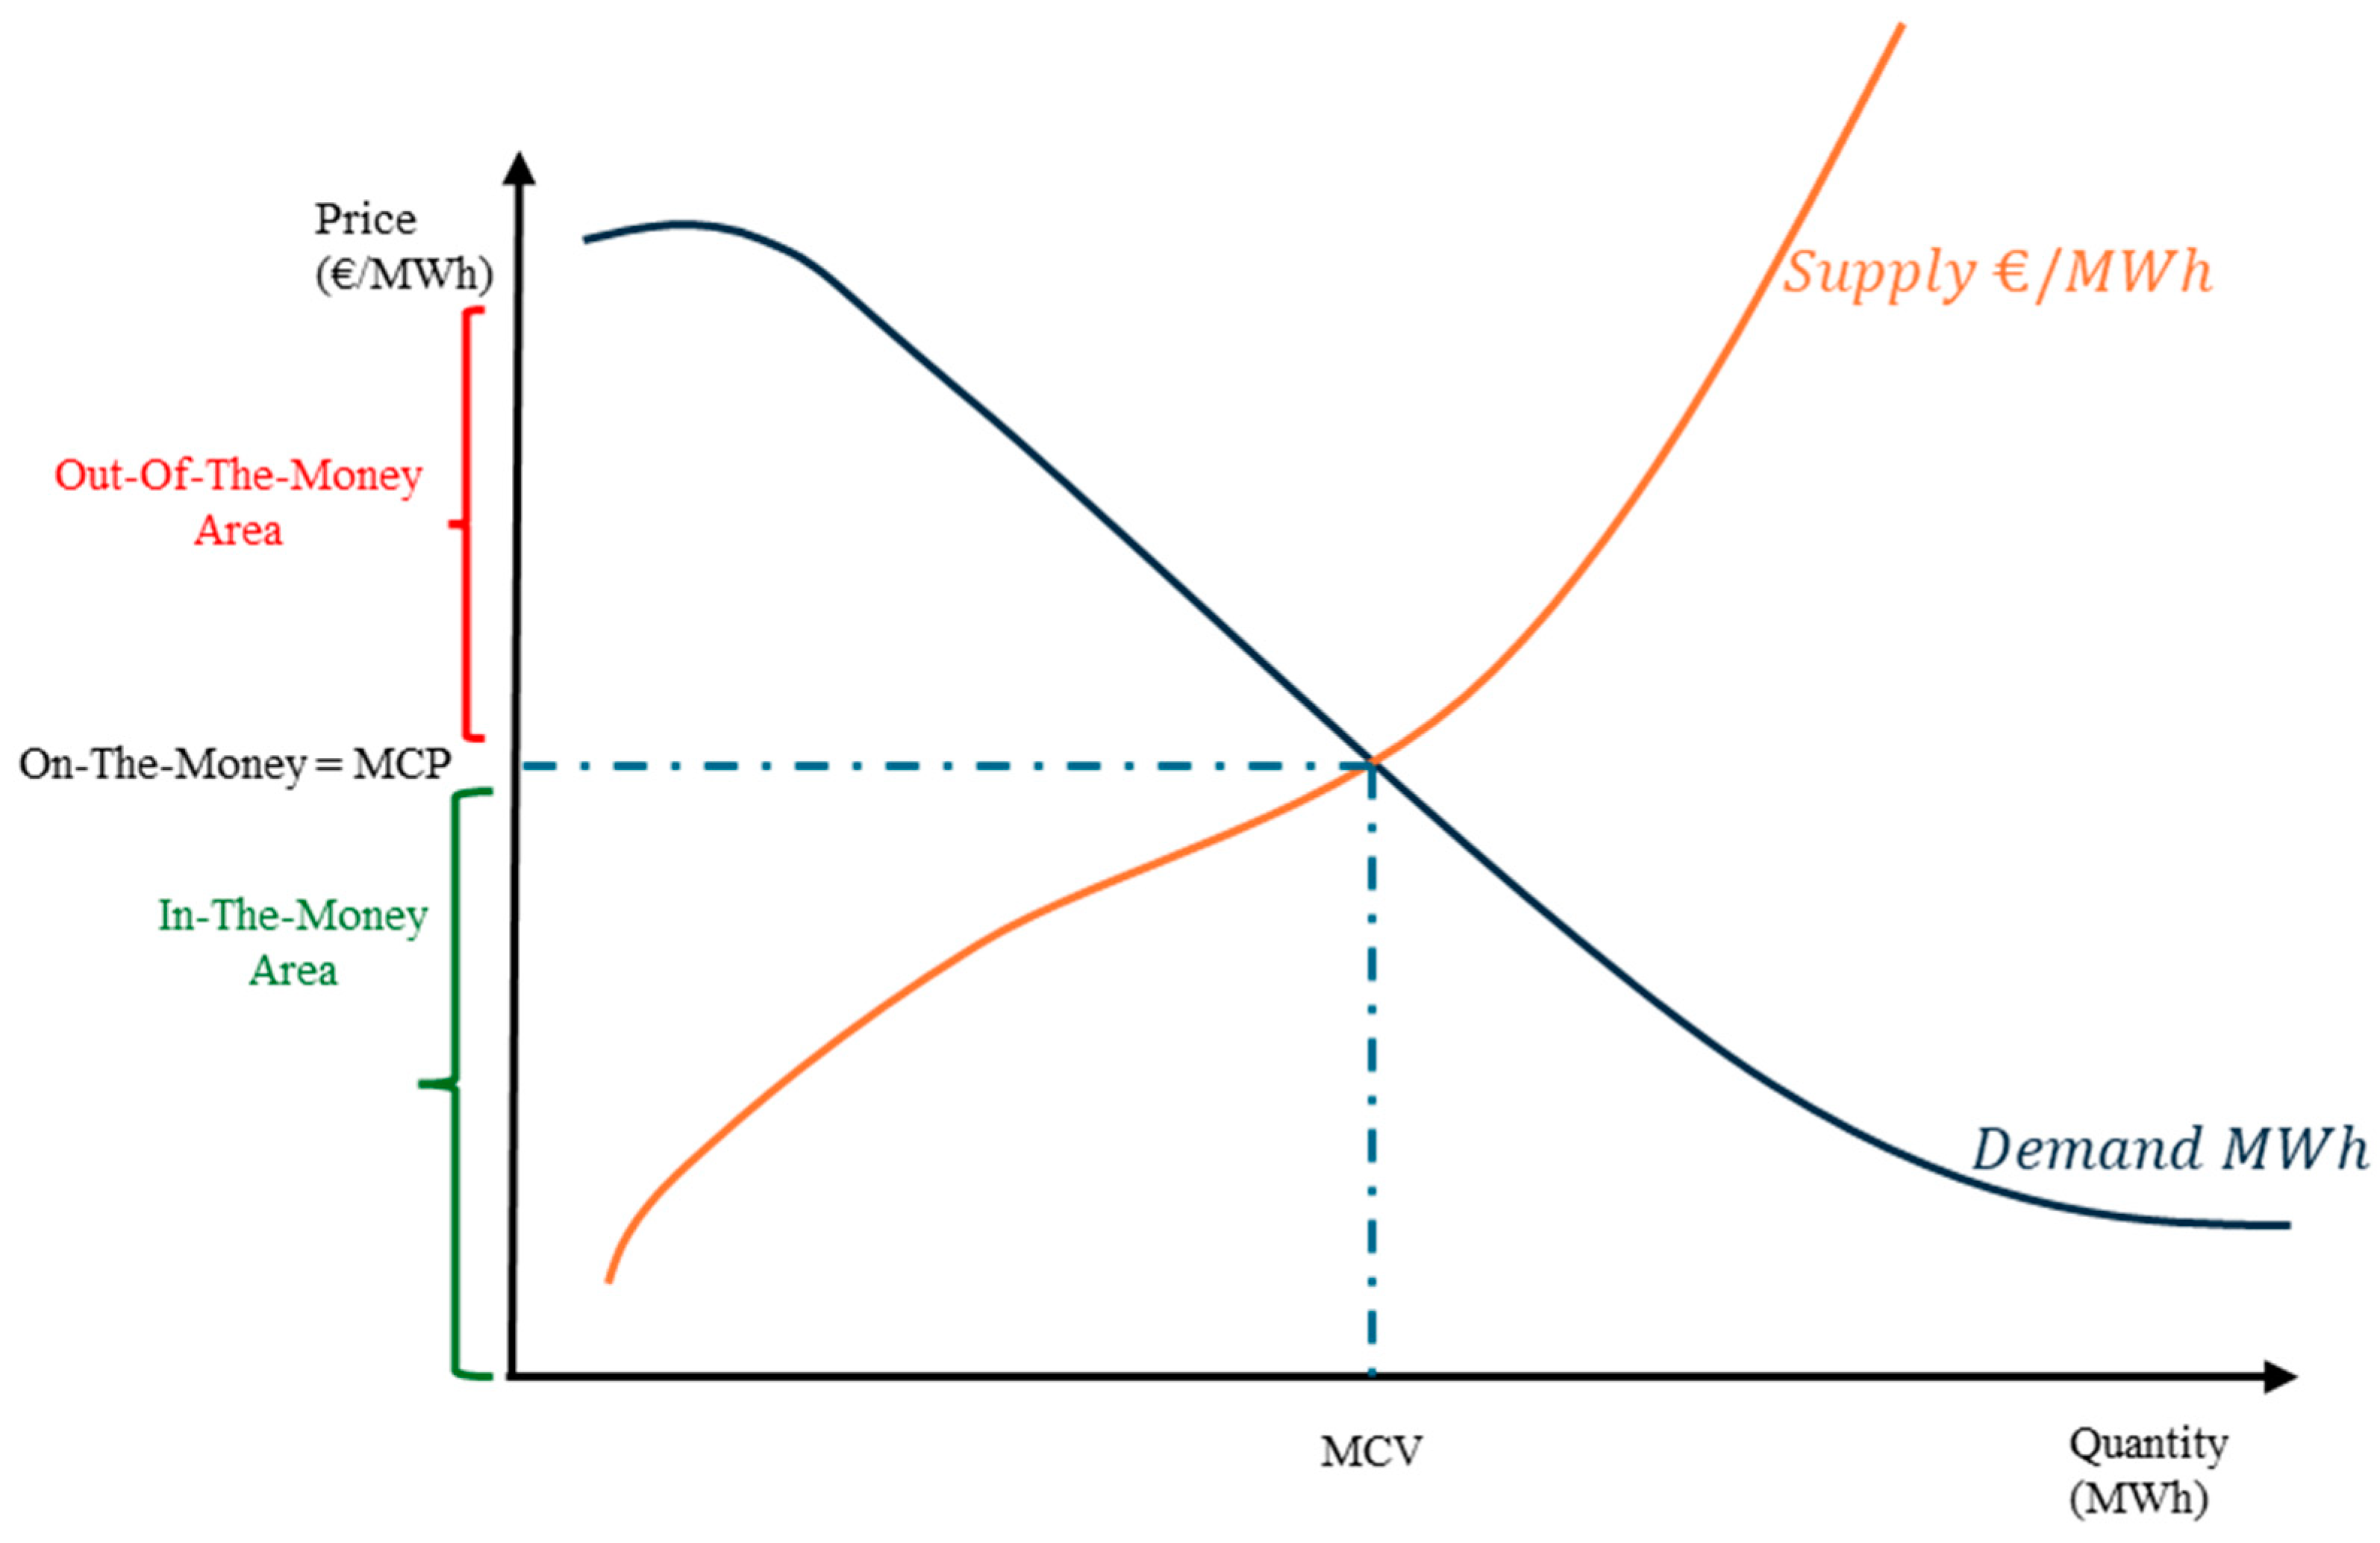
In line with the main principle of the algorithm, Figure 16 shows that any orders that are in-the-money should be accepted, while orders that are out-of-the-money should be rejected. Orders that are at-the-money can be either accepted fully, or partially, or rejected. The algorithm aims at rapidly finding a good first solution and continuously improving it if possible. Also, all submitted orders of the same type by market participants are treated equally. Information about the Power Transmission network of each PX provided by the TSOs is taken into consideration as constraints, meaning that each bidding zone applies different constraints. Accordingly, all submitted orders in the same bidding zone will have the same clearing price. EUPHEMIA calculates the MCP for each bidding zone and period along with the corresponding net position. For this reason, the MCP in the Greek bidding zone and the MCP for exports are different. Finally, Figure 17 illustrates an overview of the wholesale market timeframe available in the spot market of Greece.
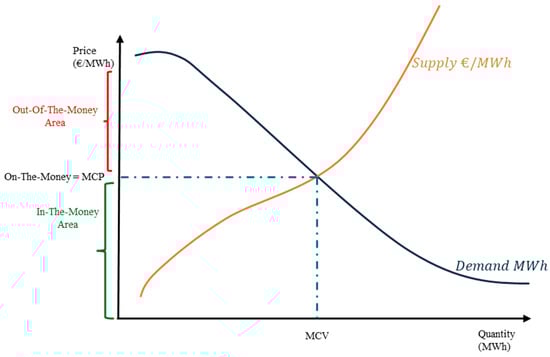
Figure 16.
EUPHEMIA solution.
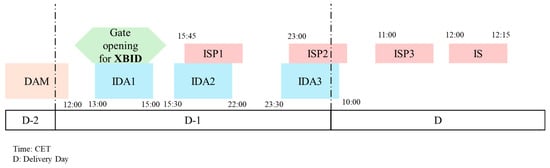
Figure 17.
Spot market timeframe.
3.5. Operating Aid for Battery Energy Storage Systems in Greece
The updated NECP includes a target for substantial 3.1 GW battery energy storage by 2030. A total of 900 MW of Battery Energy Storage Systems (BESS) has been awarded across the three auctions that have already taken place. The first auction, in August 2023, awarded 411.8 MW across 12 projects (2 MWh per MW), with bid prices ranging from EUR 33.9 to EUR 64.1 per MW annually with an average of EUR 49. per MW annually. The subsidy included a one-time capital expenditure (CAPEX) grant of EUR 200,000 per MW. The second auction in February 2024 awarded 300 MW across 11 projects (again, 2 MWh per MW), with bid prices ranging from EUR 44.1 to EUR 49.9 per MW annually with an average of EUR 47.6 per MW annually. The subsidy included a one-time CAPEX grant of EUR 100,000 per MW, which was significantly reduced compared to the first auction. The third auction in March 2025, awarded 188.9 MW across nine projects (4 MWh per MW). The subsidy included a one-time CAPEX grant of EUR 200,000 per MW.
The following analysis is in line with the detailed framework published by RAAEY on the calculation of the operating aid towards BESS in Greece. The intention of the framework is to incentivize the owners of subsidized BESS to participate in the relevant energy markets actively and effectively. Policymakers aimed to minimize risk and uncertainty of the revenue streams of BESS and at the same time ensure minimum technical characteristics throughout the Contract for Difference (CfD) duration. The duration of each Regulatory CfD period is set at 3 full calendar years beginning on 1/1/2026. Operational support will be disbursed annually from DAPEEP. The incentive scheme, which is designed to last for 10 years, is based on the relative performance of the awarded project within a Group of other similar Projects (the Reference Group). Both subsidized and merchant BESS with similar technical characteristics will be part of the same Reference Group. Each subsidized BESS will be categorized in different Groups based on their minimum guaranteed injected capacity (MWh/MW). Subsidized BESS from the first two auctions will be part of the same Groups, while subsidized BESS from the third auction will be grouped separately.
The operational aid (EUR/MW) is equal to the ex ante operating aid plus the ex post operating aid minus the various penalties due to deviations from technical requirements.
where RR is the Reference Revenue of each BESS, Estimated Market Revenue (EMR) is calculated before the beginning of each CfD period by RAAEY, and it is based on different economic data from IPTO, DAPEEP and HEnEx. Estimated Additional Revenue (EAR) considers any investment, operational or other type of aid besides the CfD. Estimated Revenue Losses (ERL) represents any decreases in the net market revenue related to a forced supply of additional services which may not be provided. Next, the ex post Operating Aid will be calculated separately for each BESS and year based on the difference between the Estimated and Actual Group Net Market Revenues plus any Actual Additional Revenues and Losses. Group Net Market Revenue is considered the sum of each individual BESS of the Group divided by their accumulated capacity.
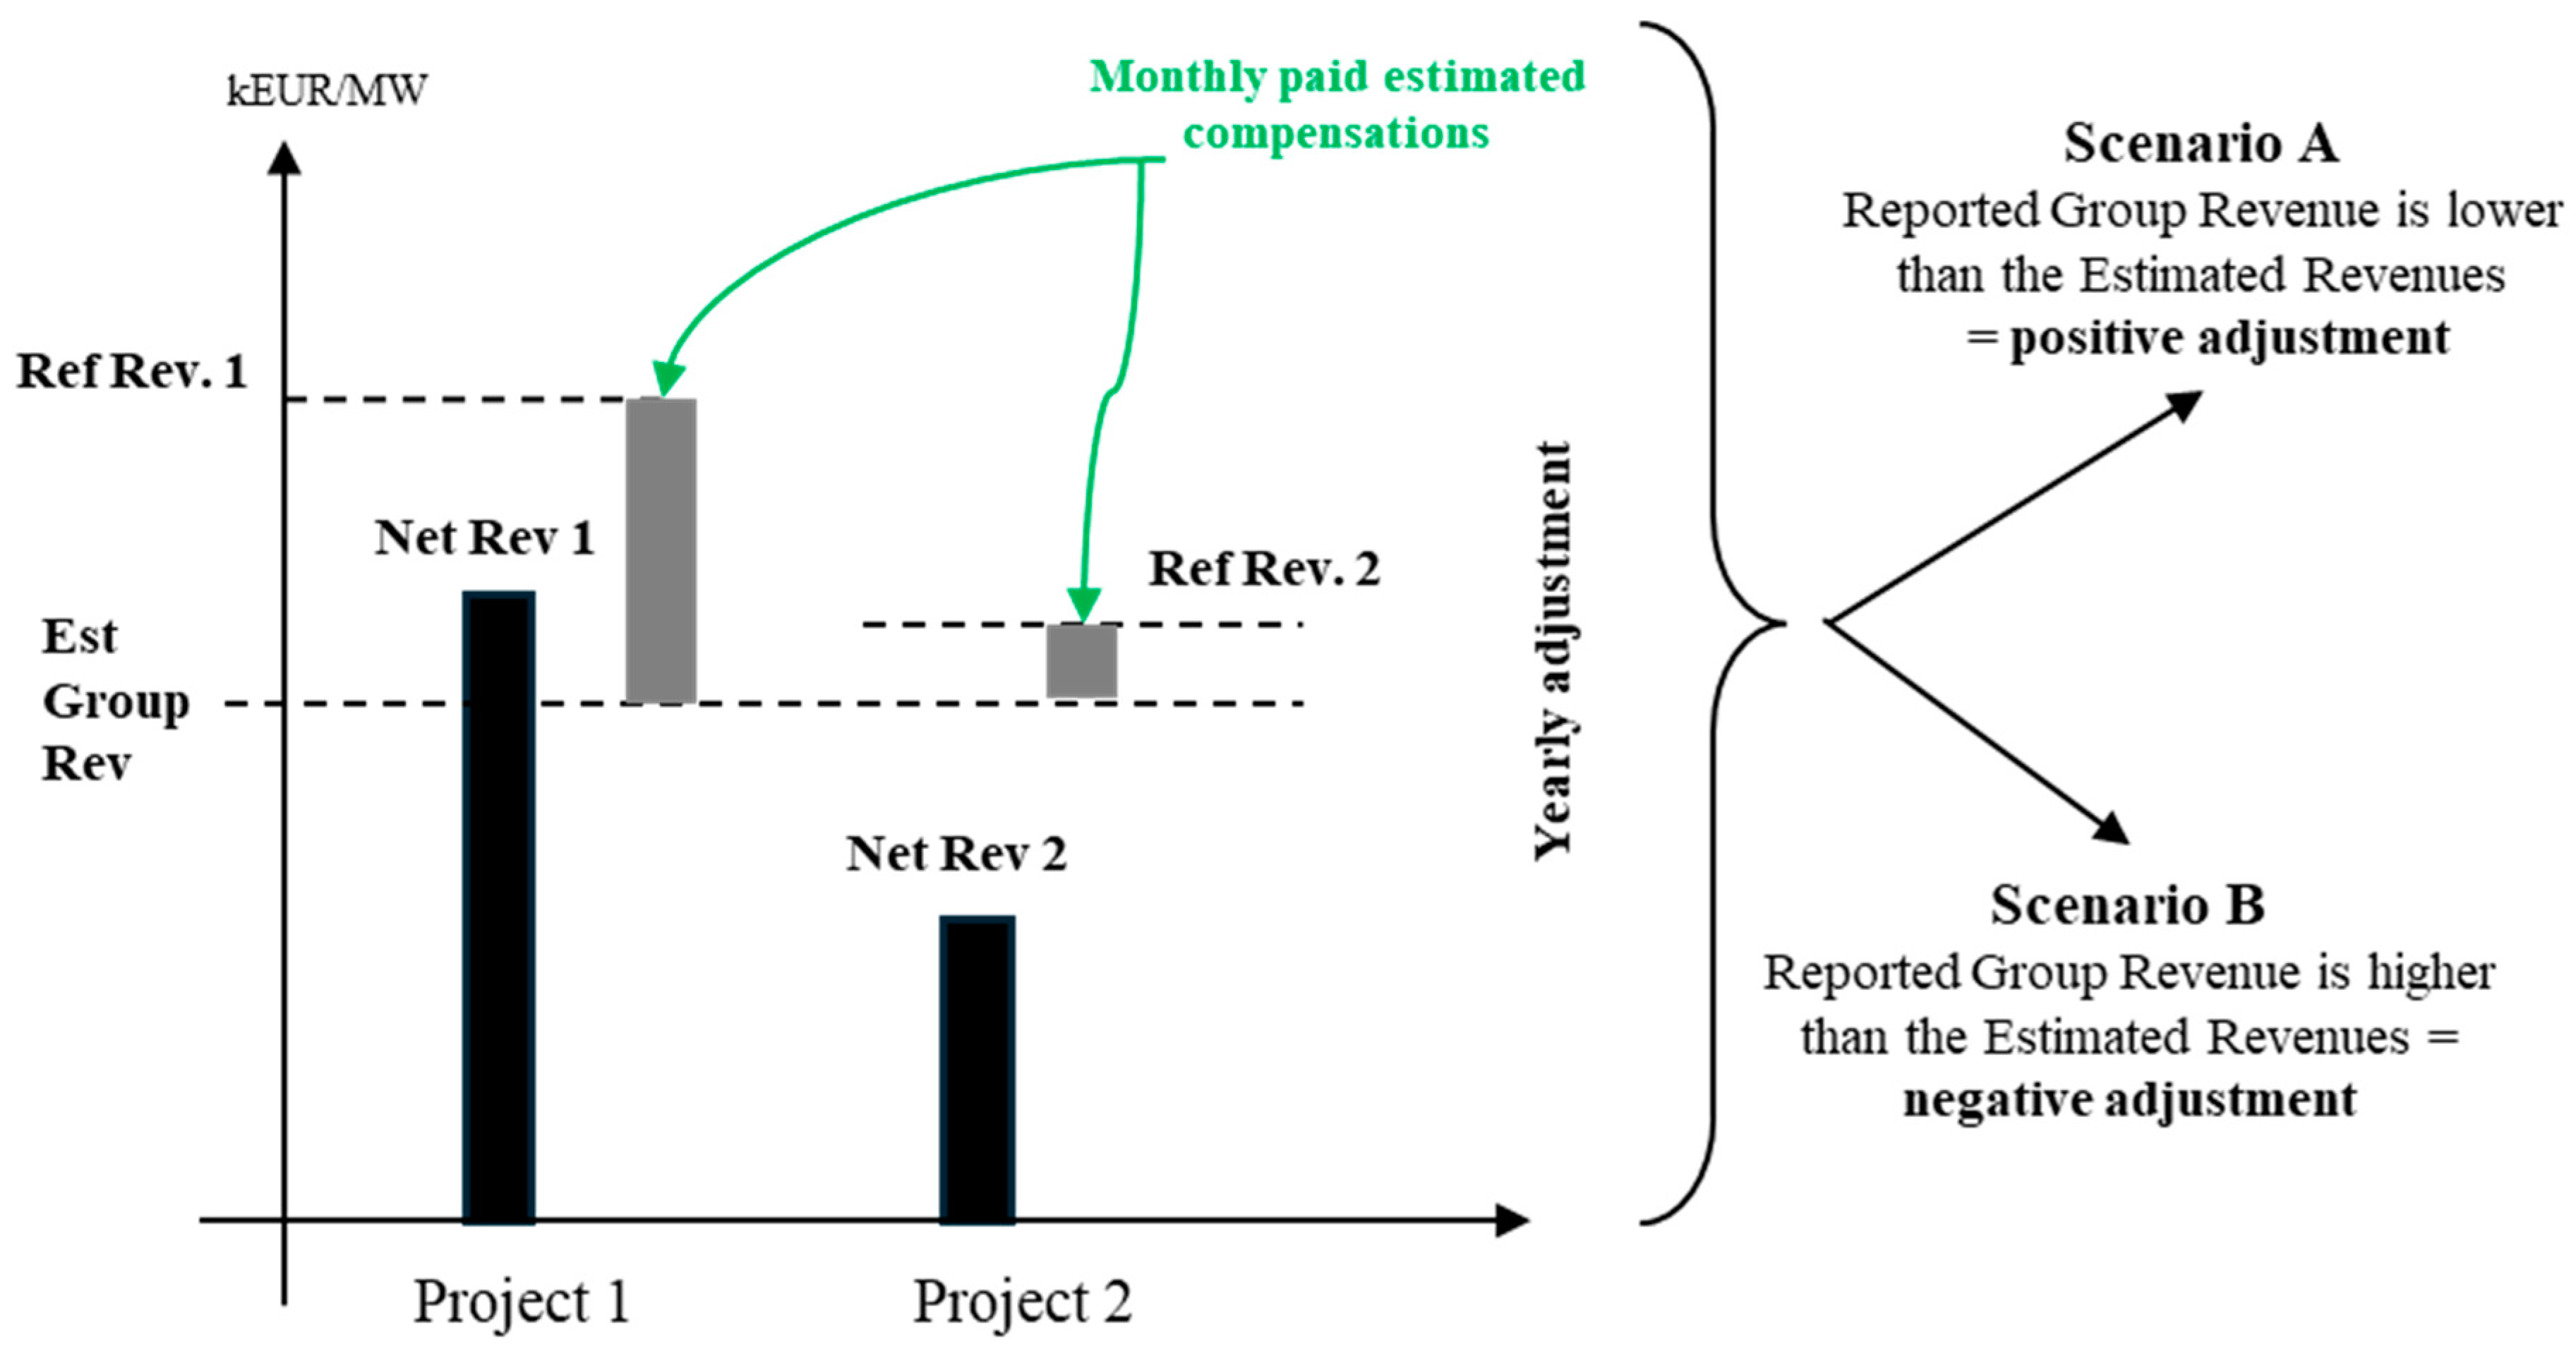
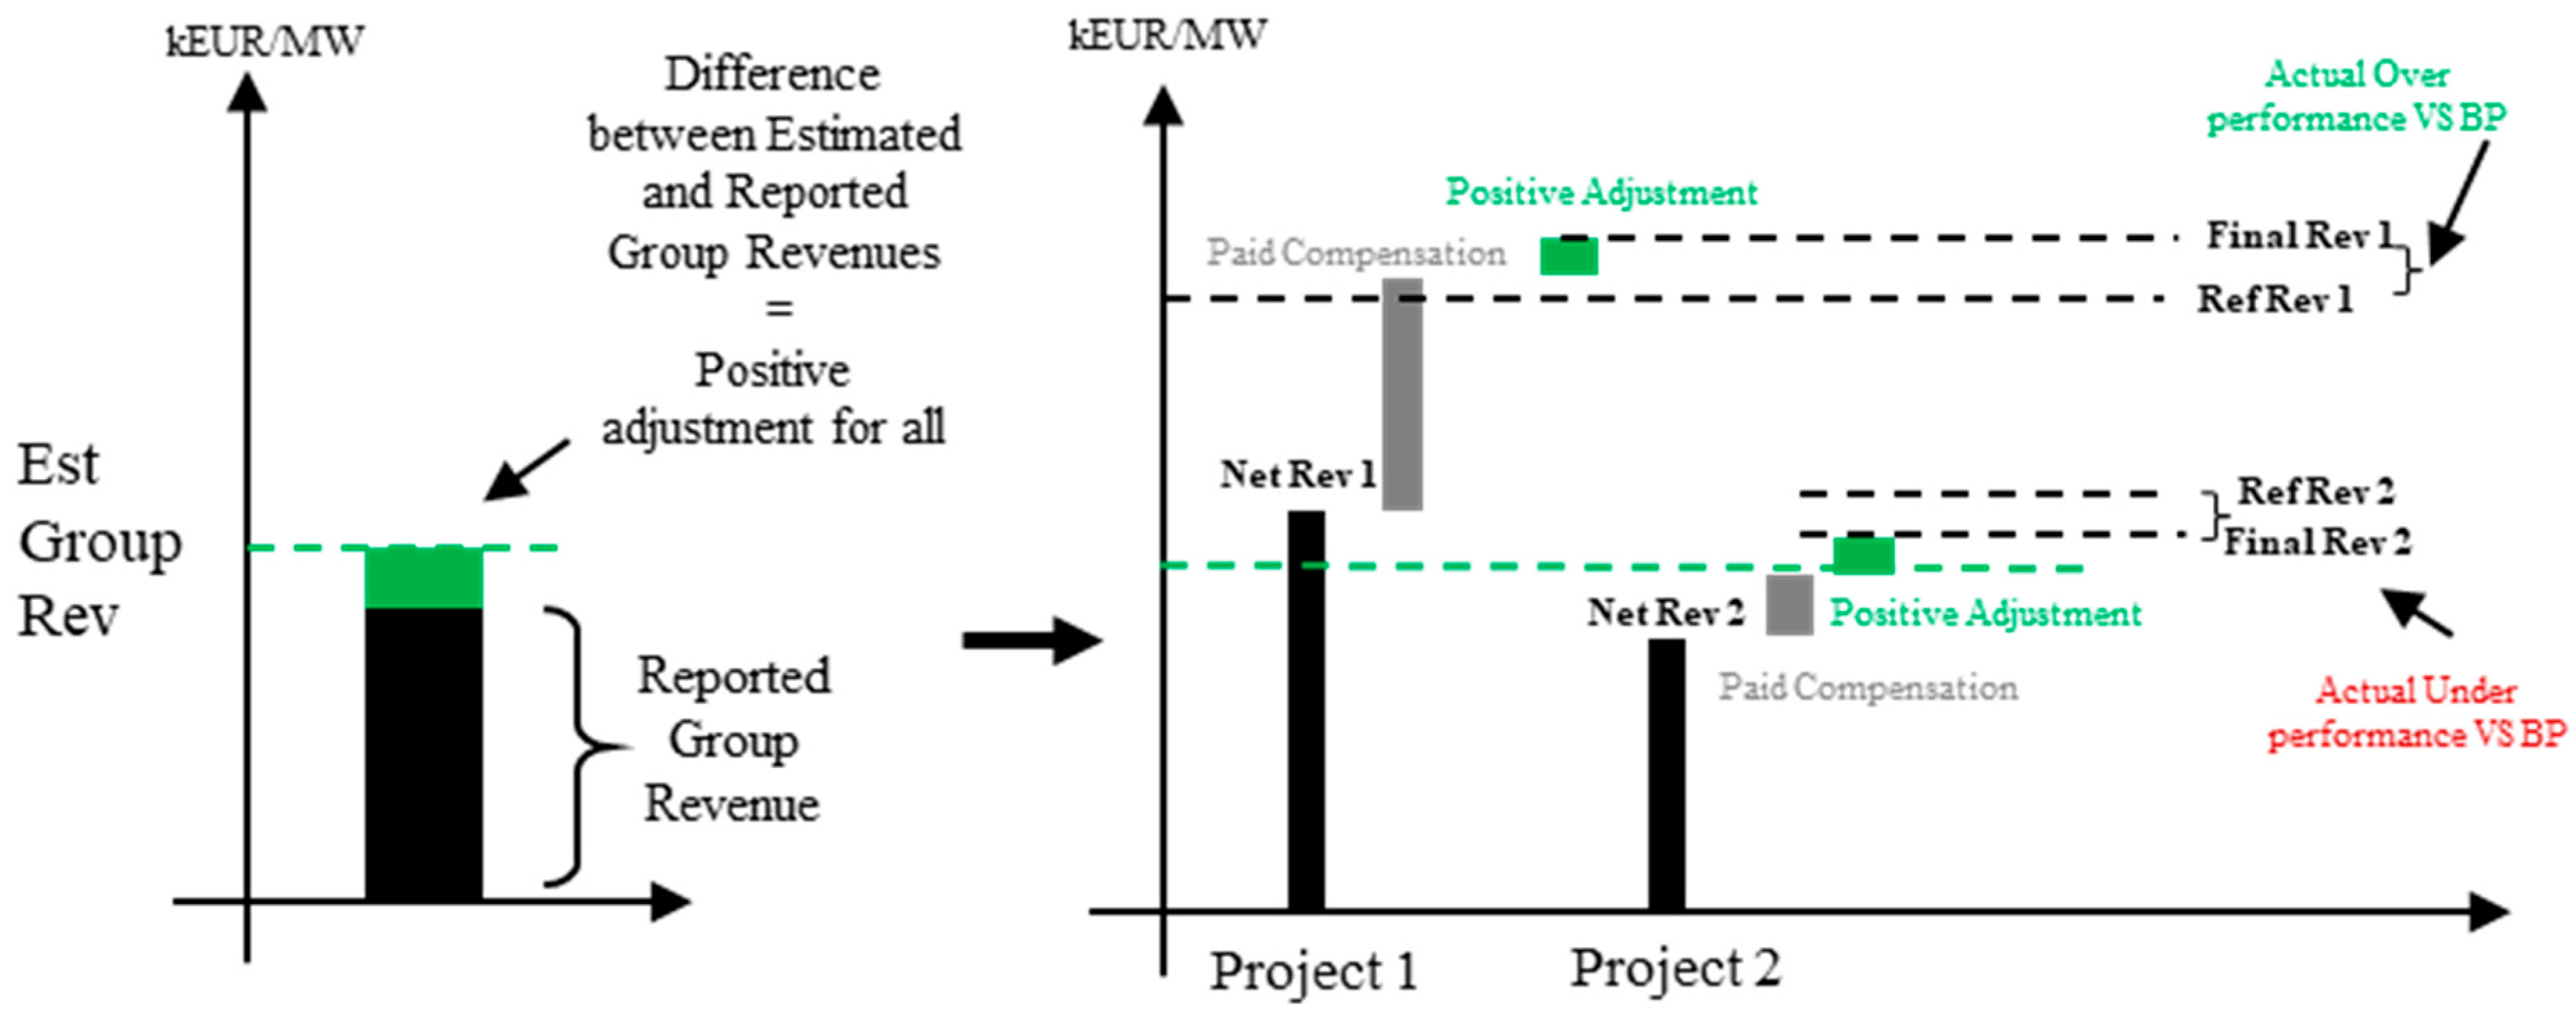
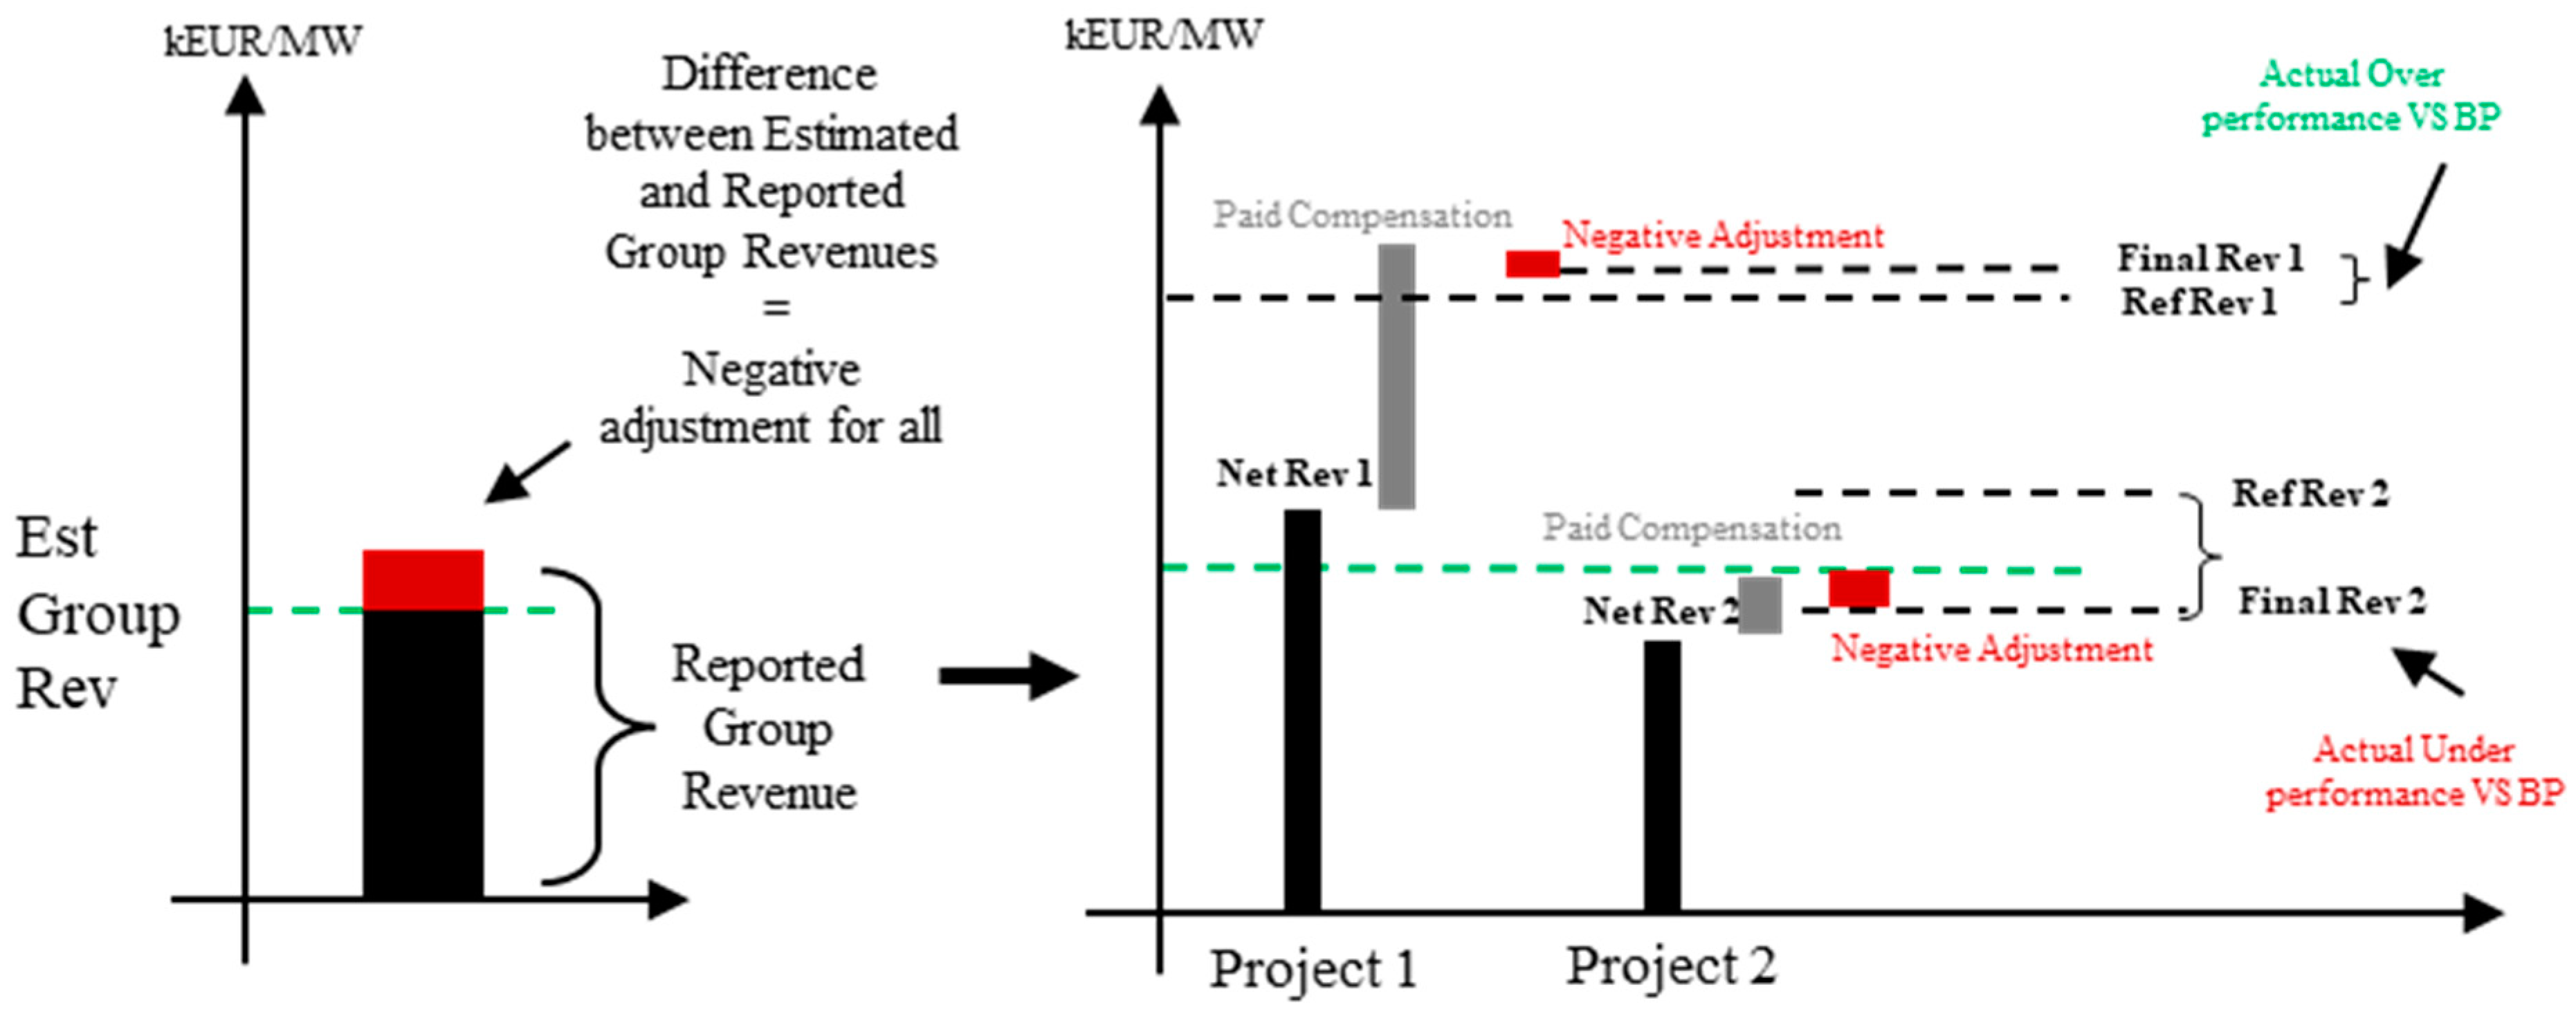
Finally, specific technical characteristics will be inspected every 2 years, such as Power Capacity, Energy Capacity, Round Trip Efficiency, Standby Auxiliary Consumption, Technical Availability. In the case of any deviations from the standard technical requirements as per RAAEY’s official call, penalties will be imposed based on the magnitude of the deviations. Figure 18 below illustrates the BESS incentive scheme under two different Reference Groups. Furthermore, Figure 19 depicts the scenario of positive adjustment when reported Group Revenue is lower than the Estimated Revenues and Figure 20 the negative adjustment, when Reported Group Revenue is higher than the Estimated Revenue.

Figure 18.
Incentive scheme under two different Reference Groups.
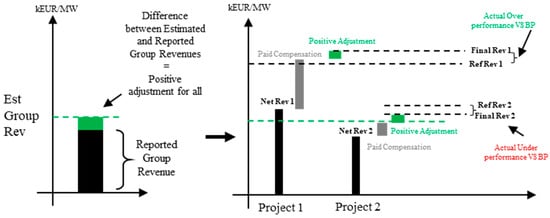
Figure 19.
Scenario A, positive adjustment of operational aid.
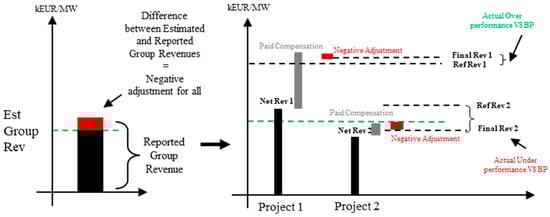
Figure 20.
Scenario B, negative adjustment of operational aid.
4. Balancing Market Analysis
Since the introduction of the Target Model, the electricity mix in Greece has changed significantly. In line with [36], storage units could act as assets and support the further penetration of RES even in the BM. The operation of the BM is handled by the local TSO, which is responsible for determining the imbalance settlements for the balancing actions, as well as the balancing costs that derive from those actions, ensuring a balanced and secure electricity grid. BM plays an essential role in the PX, especially with the constant integration of renewable energy into the power grid [37]. For a BM to be efficient, it should ensure supply at the lowest cost possible, provide real-time system monitoring, while delivering environmental benefits by reducing the requirement for back-up generation. One of the core functions of the BM is compensation for the ancillary services provided to ensure a balanced grid operation.
As for the case of Greece, IPTO is responsible for the operation of the BM. In the same context, IPTO is responsible for providing sufficient available capacity for the balancing services for the System and is required to issue the appropriate dispatch instructions to the Balancing Service Entities. The BM is divided into three individual procedures, the Balancing Capacity Market, the Balancing Energy Market and finally the Imbalance Settlement. With the full integration of the BM, the balancing costs were expected to reduce [38]. Yet according to [39], for the case of Greece, and specifically for RES aggregators, imbalance costs soared.
In the Greek BM, apart from the Imbalance Settlement, non-compliance charges are calculated monthly, based on the certified production data, the corrected Imbalance Prices and the submitted production. The non-compliance charges use three main indexes with the respective tolerance limits for their calculations. They are applied to all Balance Responsible Parties, while the tolerance limits are declared by the TSO based on the size of the participant. The main difference between conventional units and RES is that, for the case of the former one, non-compliance charges are applied when the significant imbalances between the measured energy and the corresponding Market Schedules of the same participant occur systematically.
According to the Electricity Market Code, non-compliance charges are applied:
- For Conventional Unit Portfolios in case:
- ○
- The normalized absolute deviation in a month m exceeds the tolerance margin .
- ○
- The normalized RMS value of deviations in month m exceeds the tolerance margin .
- For both Dispatchable and Non-Dispatchable RES Unit Portfolios, a third condition is added
- ○
- The normalized absolute deviation in a month m exceeds the tolerance margin .
- ○
- The normalized RMS value of deviations in month m exceeds the tolerance margin .
- ○
- The absolute normalized deviation in month m exceeds the tolerance margin .
The first two tolerances for conventional and RES portfolios are the same, but for RES portfolios, the normalized deviation is also considered.
To calculate those values, we set:
- The Market Schedule of Participant p for the MTU t: ;
- The offtake in MWh that corresponds to the consumers of the Interconnected System per participant p for the MTU t: ;
- Deviation in each MTU t for the participant p.
The tolerances are determined by IPTO. They should be published at least two months prior to their implementation and are calculated based on the monthly . For a conventional portfolio, corresponds to the charge that is implied in case a significant imbalance occurs in an MTU of month between the amount of energy dispatched and the corresponding Market Schedule of the seller .
For a conventional portfolio, a significant imbalance is considered when:
and are determined by IPTO.
Computational method for :
is the absolute deviation within the month MTU .
is the normalized absolute deviation within the month MTU .
Computational method for :
is the Root Mean Square (RMS) value of Deviations within the month MTU .
is the normalized within the month MTU .
For the calculation of Equations (4)–(7) the understanding of the below values is crucial:
- is the unitary charge corresponding to non-Compliance Charges to Suppliers for the normalized monthly absolute deviation.
- is the unitary charge corresponding to non-Compliance Charges to Suppliers for the normalized monthly RMS value of deviations.
- is the tolerance margin for imposing non-Compliance Charges on Suppliers for the normalized monthly absolute deviation.
- is the tolerance margin for imposing non-Compliance Charges on Suppliers for the normalized monthly RMS value of deviations.
These quantities are determined by RAE following a proposal by Hellenic Electricity Transmission System (HETS) Operator.
Computational method of :
For dispatchable and non-dispatchable RES portfolios, additional tolerance is implemented as . The tolerances and are calculated in a similar manner as for conventional portfolios.
Computational method for :
is the Normalized Root Mean Square (RMS) value of Deviations within the month MTU .
is the normalized within the month MTU .
In addition to the above quantities, , the normalized absolute monthly deviation of RES Units Portfolios in normal operation represented by the Balance Responsible Party p for month m, also plays a significant role.
At the same time, additional tolerance is added to the solution in the form of an additional constraint, where
The calculation method for :
where,
Furthermore, non-compliance charges do not apply to the Supplier of Last Resort, as defined in the relevant regulation. The non-compliance charges are only implemented in Greece, acting as an additional charge to the imbalance charges. The main issue with the introduction of non-compliance charges is that the power output of non-dispatchable RES can only be forecasted and estimated, but never accurately predicted. Combined with the lack of storage technologies, either being short or long term, non-dispatchable RES portfolio participants are facing huge non-compliance charges.
Another important issue that will become apparent in the following period in Greece is the electricity storage requirements to support the transition towards high renewable penetration levels. Currently, IPTO implements the Integrated Scheduling Process (ISP) for the Balancing Capacity Market. This process aims to compel the required Balancing Capacity needed in the short term while ensuring the schedule is in line with the technical constraints of the HETS and the Balancing Service Entities. In practice, IPTO keeps some capacity reserves for quick response for introducing additional energy generation. Currently, only conventional quick response plants can be implemented. Another usage of the reserves is for additional energy consumption during peak RES production hours with low consumption periods. Essentially, IPTO keeps capacity reserves that can generate ad hoc the required energy or limit their energy consumption to keep the grid in balance (ancillary services).
The Balancing Energy Market has the responsibility of determining quantities and prices for the activation of the Balancing Energy by the Balancing Service Providers, considering both the Market Schedule and HETS’s real-time state. Two main processes take place in the Balancing Energy Market, manual Frequency Recovery Reserve (mFRR) and automatic FRR (aFRR). Through the mFRR process, IPTO estimates in close to real time whether upwards or downwards activation of the mFRR is mandatory. After the type of mFRR is determined, relevant Dispatch Orders per time unit (15 min) are issued. On the other hand, in the aFRR process, real-time automatic Dispatch Orders to the Balancing Service Entities are issued. This process takes place with a frequency of 4 s, through the Automatic Generation Control Function.
The determination of entities occurring in the BM is conducted through a bidding competition for mFRR and aFRR processes, distinctly per direction. Regarding the remuneration for entities for the activation of mFRR Energy, which is implemented for purposes other than balancing, it supports the pay-as-bid principle and considers the activated offer steps in the related direction, while the reimbursement of entities for the activation of aFRR Balancing Energy is dependent on upward or downward activation.
- For upward activation, the greater value between the price for upward Balancing Energy for mFRR and the price of the Balancing Energy Offer for aFRR arranged by the Balancing Service Entity, matching the quantity of upward Balancing Energy activated for aFRR.
- For downward activation, the inferior value between the price for downward Balancing Energy for mFRR and the price of the Balancing Energy Offer for aFRR arranged by the Balancing Service Entity, matching the quantity of downward Balancing Energy activated for aFRR.
Contracted Balance Responsible Parties are assessed. A single Imbalance price per settlement is established. The calculation process is the weighted average price of the activated Balancing Energy in the predominant direction (upward or downward) for mFRR and aFRR for the specific Imbalance Settlement Period. The Settlement Procedures are issued for the first time one week after real-time procedures and are performed on a weekly basis. Finally, the Settlement includes Balancing Energy Settlement, Balancing Capacity Settlement and the Imbalance Settlement.
5. Conclusions
The introduction of the Target Model in Greece was anticipated to enhance cross-border trading, lead to more competitive electricity prices and lower emissions. Yet, the huge penetration of RES poses several challenges for the wholesale electricity market, such as increased price volatility and massive curtailments in generation. This issue is mainly attributed to the oversaturation of photovoltaic generation bringing prices close to zero or even negative during daylight hours. In contrast, increased prices are evident during night hours accompanied by lower production from photovoltaic plants and increased demand. This inverted supply–demand relationship is seeking means of storage to exploit the remaining and curtailed renewable energy. Eventually, this would directly lower the price volatility and smoothen the price curve during the day. In that sense, aiming to avoid the curtailment of renewable generation, the installation of storage units along with massive investments in the upgrade of grid interconnection are vital.
This paper provides an extensive overview of the market design and formation of the Target Model in the Greek wholesale electricity market. Our analysis investigates the spot market structure by highlighting the architecture of the different markets. Furthermore, the Balancing Market along with the corresponding non-compliance charges are scrutinized. Additionally, the foremost contribution of our study is the detailed description of the recent support mechanism to facilitate the integration of BESS into the system. This is broadly considered by market participants as a key policy incentive enabling cost recovery for storage.
Future research should be directed towards the assessment of the regulatory framework to ensure compliance with the EU Directives along with a dynamic sensitivity analysis on key parameters. Furthermore, related to policy implications, aiming to address grid congestion caused by the rapid penetration of RES, a fast-track approval process for new transmission lines and interconnections should also be considered.
Author Contributions
Conceptualization, E.N., F.I., K.K. and K.A.; Methodology, E.N. and F.I.; Software, E.N.; Validation, F.I.; Formal analysis, E.N., F.I., K.K. and K.A.; Investigation, E.N.; Resources, E.N.; Data curation, F.I.; Writing—original draft, E.N.; Writing—review & editing, E.N., F.I. and K.A.; Visualization, E.N. and F.I.; Supervision, F.I., K.K. and K.A. All authors have read and agreed to the published version of the manuscript.
Funding
This research received no external funding.
Data Availability Statement
The original contributions presented in this study are included in the article. Further inquiries can be directed to the corresponding author.
Conflicts of Interest
The authors declare no conflict of interest.
References
- Ioannidis, F.; Kosmidou, K.; Makridou, G.; Andriosopoulos, K. Market design of an energy exchange: The case of Greece. Energy Policy 2019, 133, 110887. [Google Scholar] [CrossRef]
- Makrygiorgou, J.J.; Karavas, C.S.; Dikaiakos, C.; Moraitis, I.P. The Electricity Market in Greece: Current Status, Identified Challenges, and Arranged Reforms. Sustainability 2023, 15, 3767. [Google Scholar] [CrossRef]
- Samarasinghe, S.L.; Moghimi, M.; Kaparaju, P. A review of modelling tools for net-zero emission energy systems, based on model capabilities, modelling criteria and model availability. Renew. Energy Focus 2025, 53, 100659. [Google Scholar] [CrossRef]
- Suski, A.; Chattopadhyay, D.; Nicolas, C. Testing Alternative Electricity Market Design Performances: Methodology and Case Study. IEEE Trans. Energy Mark. Policy Regul. 2024, 2, 407–422. [Google Scholar] [CrossRef]
- Bigerna, S.; Bollino, C.A. Optimal Price Design in the Wholesale Electricity Market. Energy J. 2016, 37, 1980. [Google Scholar] [CrossRef]
- Venetsanos, K.; Angelopoulou, P.; Tsoutsos, T. Renewable energy sources project appraisal under uncertainty: The case of wind energy exploitation within a changing energy market environment. Energy Policy 2002, 30, 293–307. [Google Scholar] [CrossRef]
- Psarros, G.N.; Papathanassiou, S.A. Electricity storage requirements to support the transition towards high renewable penetration levels–Application to the Greek power system. J. Energy Storage 2022, 55, 105748. [Google Scholar] [CrossRef]
- Williams, O.; Green, R. Electricity storage and market power. Energy Policy 2022, 164, 112872. [Google Scholar] [CrossRef]
- Fanone, E.; Gamba, A.; Prokopczuk, M. The Case of Negative Day-Ahead Electricity Prices. Energy Econ. 2013, 35, 22–34. [Google Scholar] [CrossRef]
- Nickelsen, D.; Müller, G. Bayesian hierarchical probabilistic forecasting of intraday electricity prices. Appl. Energy 2025, 380, 124975. [Google Scholar] [CrossRef]
- Prol, J.L.; Schill, W.-P. The Economics of Variable Renewable Energy and Electricity Storage. Annu. Rev. Resour. Econ. 2025, 13, 443–467. [Google Scholar] [CrossRef]
- Masoumzadeh, A.; Nekouei, E.; Alpcan, T.; Chattopadhyay, D. Impact of Optimal Storage Allocation on Price Volatility in Energy-Only Electricity Markets. IEEE Trans. Power Syst. 2018, 33, 1903–1914. [Google Scholar] [CrossRef]
- Makrygiorgou, D.I.; Andriopoulos, N.; Georgantas, I.; Dikaiakos, C.; Papaioannou, G.P. Cross-border electricity trading in southeast europe towards an internal European market. Energies 2020, 13, 6653. [Google Scholar] [CrossRef]
- Iliadou, E.N. Electricity sector reform in Greece. Util. Policy 2009, 17, 76–87. [Google Scholar] [CrossRef]
- Andrianesis, P.; Biskas, P.; Liberopoulos, G. An overview of Greece’s wholesale electricity market with emphasis on ancillary services. Electr. Power Syst. Res. 2011, 81, 1631–1642. [Google Scholar] [CrossRef]
- Danias, N.; Swales, J.K.; McGregor, P. The Greek Electricity Market Reforms: Political and Regulatory Considerations. Energy Policy 2013, 62, 1040–1047. [Google Scholar] [CrossRef]
- Kaldellis, J.K.; Kapsali, M.; Katsanou, E. Renewable energy applications in Greece-What is the public attitude? Energy Policy 2012, 42, 37–48. [Google Scholar] [CrossRef]
- Ioannidis, F.; Kosmidou, K.; Papanastasiou, D. Public awareness of renewable energy sources and Circular Economy in Greece. Renew Energy 2023, 206, 1086–1096. [Google Scholar] [CrossRef]
- Maniatis, G.I.; Milonas, N.T. The impact of wind and solar power generation on the level and volatility of wholesale electricity prices in Greece. Energy Policy 2022, 170, 113243. [Google Scholar] [CrossRef]
- Ioannidis, F.; Kosmidou, K.; Andriosopoulos, K.; Everkiadi, A. Assessment of the Target Model Implementation in the Wholesale Electricity Market of Greece. Energies 2021, 14, 6397. [Google Scholar] [CrossRef]
- Cuisinier, É.; Lemaire, P.; Penz, B.; Ruby, A.; Bourasseau, C. New rolling horizon optimization approaches to balance short-term and long-term decisions: An application to energy planning. Energy 2022, 245, 122773. [Google Scholar] [CrossRef]
- Mahbub, M.S.; Viesi, D.; Cattani, S.; Crema, L. An innovative multi-objective optimization approach for long-term energy planning. Appl. Energy 2017, 208, 1487–1504. [Google Scholar] [CrossRef]
- Koltsaklis, N.; Dagoumas, A. Policy implications of power exchanges on operational scheduling: Evaluating EUPHEMIA’s market products in case of Greece. Energies 2018, 11, 2715. [Google Scholar] [CrossRef]
- Koltsaklis, N.E.; Dagoumas, A.S.; Kopanos, G.M.; Pistikopoulos, E.N.; Georgiadis, M.C. A spatial multi-period long-term energy planning model: A case study of the Greek power system. Appl. Energy 2014, 115, 456–482. [Google Scholar] [CrossRef]
- Varelas, G.; Tzimas, G.; Alefragis, P. Forecasting Electricity Demand in Greece: A Functional Data Approach in High Dimensional Hourly Time Series. SN Comput. Sci. 2024, 5, 566. [Google Scholar] [CrossRef]
- Koltsaklis, N.E.; Liu, P.; Georgiadis, M.C. An integrated stochastic multi-regional long-term energy planning model incorporating autonomous power systems and demand response. Energy 2015, 82, 865–888. [Google Scholar] [CrossRef]
- Mourmouris, J.C.; Potolias, C. A multi-criteria methodology for energy planning and developing renewable energy sources at a regional level: A case study Thassos, Greece. Energy Policy 2013, 52, 522–530. [Google Scholar] [CrossRef]
- Zhang, N.; Yan, J.; Hu, C.; Sun, Q.; Yang, L.; Gao, D.W. Price-Matching-Based Regional Energy Market with Hierarchical Reinforcement Learning Algorithm. IEEE Trans Ind. Inform. 2024, 20, 11103–11114. [Google Scholar] [CrossRef]
- Carrión, M.; Domínguez, R.; Oggioni, G. Optimal participation of wind power producers in a hybrid intraday market: A multi-stage stochastic approach. Energy Econ. 2025, 144, 108303. [Google Scholar] [CrossRef]
- Lam, L.H.; Ilea, V.; Bovo, C. European day-ahead electricity market coupling: Discussion, modeling, and case study. Electr. Power Syst. Res. 2018, 155, 80–92. [Google Scholar] [CrossRef]
- El Adlani, A.E.; Riquelme-Santos, J.M.; Gómez-Quiles, C. A decomposition-based approach to European electricity market clearing. Int. J. Electr. Power Energy Syst. 2024, 161, 110192. [Google Scholar] [CrossRef]
- Kath, C. Modeling intraday markets under the new advances of the cross-border Intraday Project (XBID): Evidence from the German intraday market. Energies 2019, 12, 4339. [Google Scholar] [CrossRef]
- Ocker, F.; Jaenisch, V. The way towards European electricity intraday auctions—Status quo and future developments. Energy Policy 2020, 145, 111731. [Google Scholar] [CrossRef]
- Alberizzi, A.; Grisi, P.; Zani, A. Analysis of the SIDC market on relationship between auctions and continuous trading. In Proceedings of the 2021 AEIT International Annual Conference (AEIT), Milan, Italy, 4–8 October 2021; pp. 1–5. [Google Scholar] [CrossRef]
- Koltsaklis, N.E.; Zenginis, I.; Dagoumas, A.S. Assessing new block order options of the EUPHEMIA algorithm: An optimization model for the economic dispatch problem in power exchanges. Energy Rep. 2020, 6, 3119–3140. [Google Scholar] [CrossRef]
- Koltsaklis, N.E.; Knápek, J. Integrated market scheduling with flexibility options. Renew. Sustain. Energy Rev. 2025, 208, 115020. [Google Scholar] [CrossRef]
- Rohit, A.K.; Devi, K.P.; Rangnekar, S. An overview of energy storage and its importance in Indian renewable energy sector: Part I—Technologies and Comparison. J. Energy Storage 2017, 13, 10–23. [Google Scholar] [CrossRef]
- Roumkos, C.; Biskas, P.N.; Marneris, I.G. Integration of European Electricity Balancing Markets. Energies 2022, 15, 2240. [Google Scholar] [CrossRef]
- Ioannidis, F.; Georgitsioti, T.; Kosmidou, K.; Zopounidis, C.; Andriosopoulos, K. A simulation model for imbalance costs of renewable energy aggregators: The case of Greek balancing market. Energy Econ. 2025, 142, 108155. [Google Scholar] [CrossRef]


Disclaimer/Publisher’s Note: The statements, opinions and data contained in all publications are solely those of the individual author(s) and contributor(s) and not of MDPI and/or the editor(s). MDPI and/or the editor(s) disclaim responsibility for any injury to people or property resulting from any ideas, methods, instructions or products referred to in the content. |
© 2025 by the authors. Licensee MDPI, Basel, Switzerland. This article is an open access article distributed under the terms and conditions of the Creative Commons Attribution (CC BY) license (https://creativecommons.org/licenses/by/4.0/).