Article

Is the Industrial Policy Suitable for the Industrial Chain? A Case Study from the Photovoltaic Industry in China—Evidence from Shenzhen

1
School of Economics and Management, China University of Mining and Technology, Xuzhou 221116, China
2
Business School, Jiangsu Normal University, Xuzhou 221116, China
*
Author to whom correspondence should be addressed.
Energies 2025, 18(10), 2558; https://doi.org/10.3390/en18102558
Submission received: 9 April 2025 / Revised: 2 May 2025 / Accepted: 7 May 2025 / Published: 15 May 2025
(This article belongs to the Section B: Energy and Environment)

Abstract

:
Shenzhen is a pilot pioneer in China. Developing the photovoltaic industry is an important area for Shenzhen to address climate change; thus, the Shenzhen’s government issued a series of support policies. However, does the released policy promote the development of the Shenzhen photovoltaic industry? Starting from the guiding mechanism of industrial policy on the development of the industrial chain, this paper discusses the compatibility between industrial policy and the development of the industrial chain. Through the analysis of Shenzhen photovoltaic industry data, it is found that the total factor productivity of the Shenzhen photovoltaic industry is twice that of the Yangtze River Delta and the Pearl River Delta, and the life cycle of the industrial chain is lower than the national average. However, the concentration of Shenzhen’s photovoltaic industry in 2021 was less than two-thirds of that in 2013, and it is still declining. At the same time, Shenzhen has obvious advantages in the photovoltaic industry market, but the compatibility of industrial policies is insufficient. Therefore, the overall policy suitability of Shenzhen’s photovoltaic industry is poor. The policy adjustment should be based on improving the concentration of the regional photovoltaic industry and realizing the leapfrog development of the industry by encouraging photovoltaic enterprises to extend to both ends of the industrial chain.

1. Introduction

As one of the few strategic emerging industries with international competitiveness in China, the photovoltaic (PV) industry is a typical policy-driven industry [1]. The rise and fall of the PV industry in several rounds are directly related to changes in domestic and foreign public policies [2]. Before 2012, the development of this industry was dominated by European market policies; after 2012, it was dominated by domestic policies. In the international market, China’s PV industry experienced a total process of only 10 years from investment and production, rapidly seizing the international market, to being investigated by Europe and the United States for “double-reverse” investigation, market price falling, and the industry being severely hit. In the domestic market, with the successive propositions of “emphasizing the development of the PV industry” and “double carbon” goals, local governments have established numerous PV industrial parks to seize development opportunities [3,4]. The purpose is to promote the concentration of the PV industry through land, tax, and other preferential policies, as well as stimulate local economic development. The development and stagnation of the PV industry are not only the feedback of market mechanism but also the result of policy gaming among countries.
The COVID-19 pandemic, geopolitical conflicts, and trade protectionism have severely impacted the global industrial chain-level division-of-labor system [5]. Global crises have hindered regional collaborative production and caused disasters in the manufacturing industry [6]. Against this backdrop, adjusting the production system and restructuring the industrial chain have become the main themes of global trade. Ensuring maximum corporate profits while reducing the impact of emergencies on the industrial chain and supply chain require the government to re-examine existing industrial layouts and find an economic and safe industrial development path [7,8]. In a sufficiently large region, forming industrial agglomeration around upstream and downstream enterprises in the same industry supporting the industrial chain is an effective way to enhance industrial competitiveness and overcome uncertainties due to physical boundaries. However, the selection of industrial agglomeration is a manifestation of market forces rather than administrative forces [9]. Promoting industrial agglomeration through policies requires not only adapting to the characteristics of industrial development but also corresponding transportation, talent, technology, and other conditions [10,11]. Excessive or insufficient investment in production capital, policy measures, and infrastructure can lead to resource waste and even development failure in industrial agglomeration areas and industrial parks. The policy-guided PV industry, after experiencing a rapid development period, has experienced disorderly competition and blind expansion, resulting in price fluctuations, overcapacity, and excessive competition in the entire PV industry chain, which is not conducive to the stable, orderly, and healthy development of the PV industry. Therefore, government-driven industrial agglomeration requires a correct grasp of the state of the industry, exploring the balance between agglomeration economy and competition loss from the perspective of the industrial chain and proposing reasonable plans for scientific agglomeration of different industries.
To guide the high-quality development of the PV industry, we must measure the adaptability of existing policies to promote the agglomeration of the PV industry, and then we should propose reasonable policy-adjustment directions. To that end, we construct an evaluation system for the effectiveness of industrial policies based on the mechanism of industrial policies on the industrial chain. By collecting relevant data on the PV industry in Shenzhen, we measure the adaptability of industrial policies to the development stage of the PV industry chain, reveal the extent of policy influence on industrial development, and evaluate the support and development potential of policies for the PV industry. Specifically, this paper answers the following two questions from both theoretical and practical levels: To what extent do Shenzhen’s industrial policies align with the PV industry chain’s developmental stage, spatial agglomeration patterns, and vertical integration requirements? What are the implementation gaps in Shenzhen’s PV policy system, and how can policy instruments be recalibrated to optimize the industry chain’s resilience and innovation capacity?
The compatibility of industrial policy and industrial chain development provides a theoretical basis for evaluating the effectiveness of policies, the expected target-completion degree of the policy, and the future adjustment direction.
The innovation of this paper is as follows. First, we aim to analyze the impact mechanism of industrial policies on the high-quality development of industrial chains, expand the research boundary of industrial organization theory in policy-effectiveness evaluation, and provide theoretical support for enterprises to formulate market-entry and market-exit strategies. Second, we want to analyze and quantify the policy factors affecting the high-quality development of industrial chains under the condition of industrial agglomeration, establish an evaluation system for policy adaptation to the high-quality development of industrial chains, and enrich the connotation of industrial policies in promoting the upgrading of industrial chains. Third, we aim to propose policy-adjustment directions that are consistent with the current development characteristics of Shenzhen’s PV industry chain, providing a quantitative basis for enterprises within the industry chain to grasp and follow market trends. The research of this paper not only helps reduce market risks in the PV industry but also provides theoretical and practical references for other industrial agglomerations.
The rest of this paper is structured as follows. Section 2 analyzes the impact mechanism of industrial policies on the high-quality development of the industrial chain. Section 3 presents a corresponding policy-evaluation system. Section 4 collects data, and Section 5 and Section 6 convey the results and propose corresponding policy-adjustment directions, respectively.

2. Materials and Methods

Policy adaptation aims to address the contradiction between the multi-sector industrial policy system and the coordinated development needs of various links in the industrial chain, mainly including two dimensions. The first dimension is the adaptation of policy connotation. The connotation of China’s existing industrial policies tends to favor the support or suppression of individual industries, which leads to poor actual effects of industrial policies [12]. Analyzing China’s provincial “14th Five-Year Plan”, more than 20 out of 31 provinces have proposed developing modern industries such as new energy, new materials, and biomedicine. However, a similar industrial layout is likely to lead to low-level homogeneous competition, which hinders the high-quality development of the industrial chain. Thus, the adaptation of policy connotation needs to be based on the regional industrial foundation and resource advantages, focusing on the weak links of the industrial chain according to the stage of the industrial chain and then integrating point-like enterprises into a chain-like industrial ecosystem. The second dimension is the coordination and adaptation of policy systems [13]. China’s policies are issued by different departments. Various industrial policies are reasonable and effective from the perspective of various departments, but they are not optimal from an overall perspective, making industrial policies prone to problems such as “not reaching”, “no one managing”, and “weak power” in actual situations. Thus, the coordination and adaptation of industrial policies require identifying the main responsibility for implementing the weak links in the industrial chain to achieve efficient resource allocation and smooth factor flow.
The adaptation of industrial policies to the development of industrial chains is manifested in the fact that industrial policies should promote both industrial agglomeration and regional coordinated development as well as promote the degree of vertical integration of industrial chains. In one sense, owing to the impact of multiple factors, such as the COVID-19 pandemic and anti-globalization, the continuous deepening of the global horizontal division-of-labor industrial chain system is the main cause of the manufacturing crisis [14]. The market-oriented industrial policies that promote the optimal allocation of resources in the horizontal division-of-labor industrial chain system have achieved the goal of maximizing corporate profits. However, once a global crisis has occurred, the huge physical distance is likely to cause logistic stagnation, information-flow interruption, an imbalanced industrial chain, and the prevention of continuous production in the region. Therefore, reasonable industrial policies should align with the current needs of industrial development and promote the replenishment and strengthening of industrial chains in the region. In another sense, existing research results show that industrial agglomeration based on vertical integration can effectively combat uncertainty shocks and contribute to the high-quality development of industrial chains [15]. First, industrial agglomeration can reduce logistic costs, improve information transparency, amplify technology-spillover effects, and maximize the ability to resist risks in the industrial chain [16,17]. At the same time, the uncertainties are subsequently grouped together using the spatial clustering tool, and the average density of the K-means distribution is calculated [18]. Vertical integration improves the efficiency of capital allocation within the industrial chain, helping to reduce internal competition and promote regional technological innovation and development [19]. Second, as industrial agglomeration deepens, the value chain also enters a process of reshaping [20]. From upstream brand strategy and technology research and development to midstream logistics, finance, and other producer services, to downstream after-sales and market business expansion, with the formation of industrial agglomeration, enterprises in the value chain that are compatible with the industrial chain will also be clustered [21]. In the process of dual clustering of the industrial chain and value chain, this clustering will further enhance the ability to resist risks in the industry [22]. Third, with the deepening of the vertical integration of the industrial chain, the centripetal force of market forces leading to interests will drive more enterprises within the chain to accelerate the promotion of regional industrial agglomeration [23]. At the market level, the vertical integration of the industrial chain driven by large enterprises helps SMEs gain market opportunities and enhances the centripetal force of industrial agglomeration [24]. At the policy level, industrial restructuring triggered by policy adjustments leads to industries reselecting their geographical distribution and completing vertical integration of the industrial chain in the new geographical distribution through investment and innovation [25]. Therefore, the path of adapting policy to industrial chain development is shown in Figure 1. Industrial policies promote high-quality development of the industrial chain by deepening the degree of vertical integration of the industrial chain. Policy design prioritizes identifying weak links in the PV chain and aligning incentives with industrial upgrading objectives. Implementation involves resolving conflicts between municipal departments and adapting policies to market responses. Feedback mechanisms link industrial performance to iterative policy revisions, ensuring adaptability to technological shifts.

3. Results

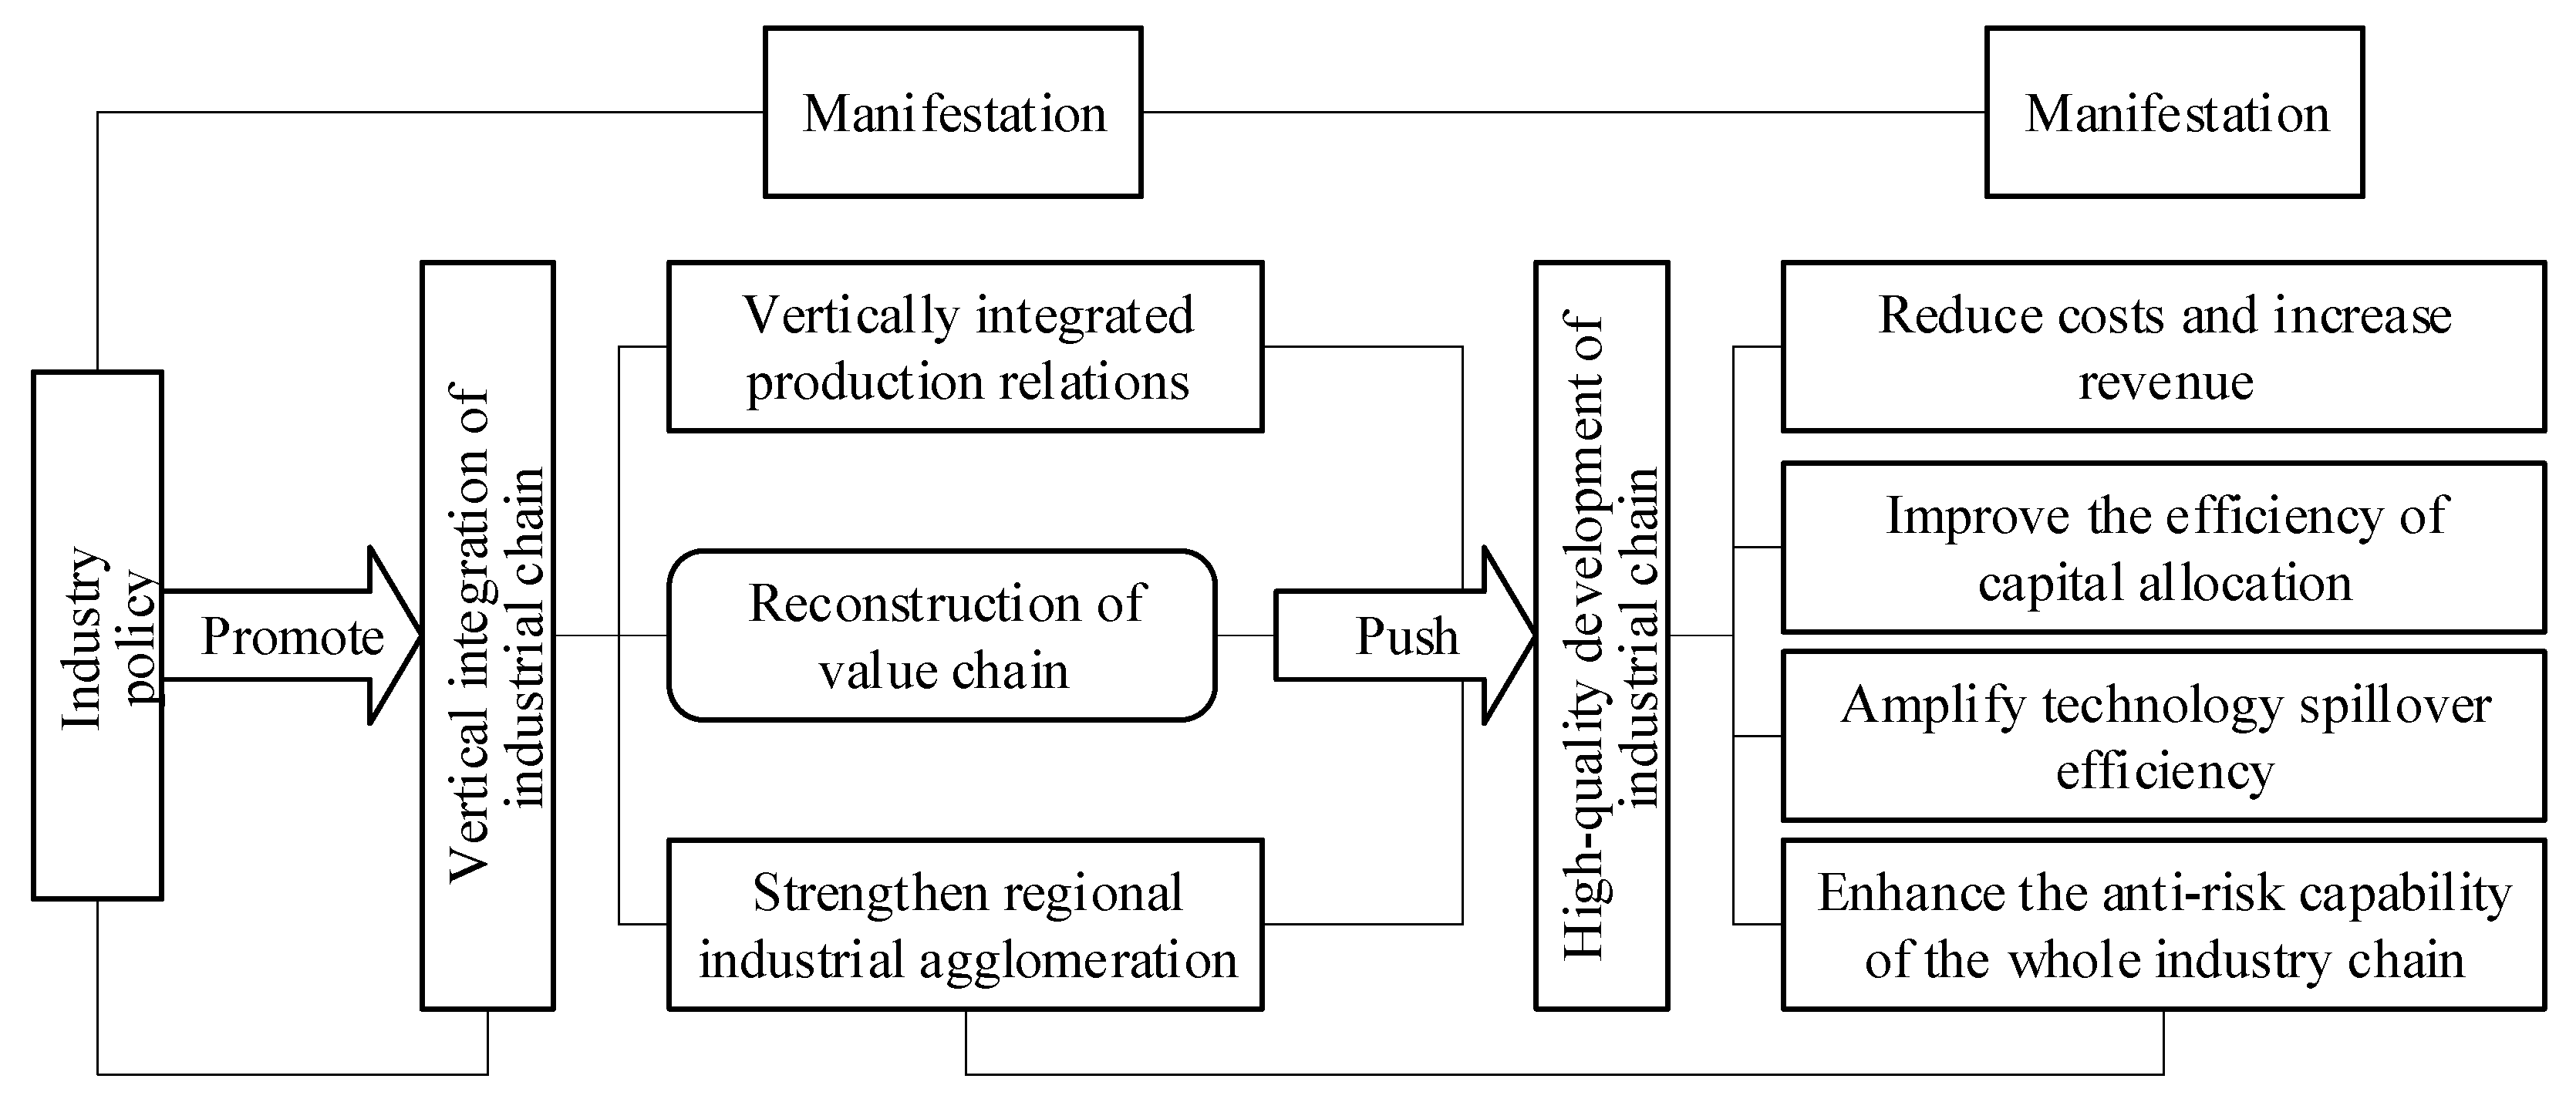
3.1. Adaptation Model of the Industrial Policy and Industrial Chain

Referring to previous research results, the adaptation of industrial policies to the development of industrial chains includes two aspects: the content adaptation and the relationship adaptation of policy supply and demand [26,27].
For the content adaptation, make the jth demand subject and the ith policy’s supply and demand content compatible as λ i j , the demand of the jth demander for ith policy as x i j , and the supply force of ith policy obtained by the jth demander as y i j . Then, authors should discuss the results and how they can be interpreted from the perspective of previous studies and of the working hypotheses. The findings and their implications should be discussed in the broadest context possible. Future research directions may also be highlighted.
λ i j = c o s θ i j π 4
c o s θ i j = x i j x i j 2 + y i j 2
where θ i j represents the angle between the line connecting the policy supply and demand with the origin and the X-axis (demand). Then, θ i j 0 , π 2 , λ i j 2 2 , 1 .
For the relationship adaptation, let the supply–demand adaptation between the j th demand subject and the i th policy be φ i j . When the policy supply exceeds the policy demand y > x , φ i j is recorded as φ i j = 1 ; otherwise, φ i j = 1 . Then,
φ i j         1 , θ i j π 4   1 , θ i j > π 4
As shown in Figure 2, when y = x , the policy perfectly fits the demand of the industrial chain. When the policy supply and demand fall into region I, the policy supply is greater than the policy demand; when the policy supply and demand fall into region II, the policy supply is less than the policy demand.

3.2. Indicator Standards

Based on the theoretical adaptation path of industrial policies and industrial chains, industrial policies need to conform to the regional industrial foundation, develop relevant industries suitable for the region, and promote the vertical integration of the industrial chain of the industry on this basis.
In terms of regional industrial advantages, resource characteristics are the foundation for regional industrial development. To survive amid fierce market competition, enterprises need to extend the industrial chain, alleviate the production crisis caused by the insufficient supply of raw materials and the cost crisis caused by the mismatch between the supply and demand of raw materials, and reduce the impact of market uncertainty on enterprises [28]. Therefore, the first indicator of the fit between industrial policy and industrial chain is the possession of key resources. This paper selects the resource-dependence index to measure the fit between industrial policy and the industrial chain.
In terms of the high-quality development of the industrial chain, the adaptation of industrial policies to the industrial chain includes two aspects. First, industrial policies promote the rational allocation of the factors of production in agglomerated industries, helping to extend the industrial production chain and generate scale benefits [29,30]. Generally, different production methods lead to different degrees of dependence on technology, capital, and labor in industries, and corresponding factor-allocation structures are also different. Reasonable industrial chain policies should promote communication and collaboration across the industrial chain based on identifying the current factor-allocation structure of the industrial chain, thus reducing the cost losses caused by information barriers [31]. Therefore, we select the degree of total factor productivity impact to measure the adaptation between industrial policies and the factor allocation of the industrial chain [32]. Second, industrial policies should be adapted to the development stage of the industrial chain. Similarly to the development model of products, industries also have a life cycle [33]. Industries in different stages have different development models and industry prospects [34]. Thus, in one sense, the life cycle of the industrial chain may correlate with the degree of vertical integration, as industries in early expansion stages often prioritize structural consolidation to reduce costs, while mature industries may diversify or decentralize. However, this relationship is non-deterministic and mediated by market conditions and policy interventions [15]. In the early stage of industrial development, industries are in disorderly expansion, and market coordination costs are higher than industrial chain coordination costs. Vertical integration significantly reduces the cost of the industrial chain; so, companies are willing to further increase their degree of vertical integration to form industrial clusters. In the mature stage of industrial development, homogenous products increase and yields are stable, requiring new growth points for breakthroughs. However, vertical integration is prone to regional trade barriers, hindering technological progress and leading to a gradual loosening of vertical integration structures, corresponding to a decrease in vertical integration measures. In another sense, the life cycle of the industrial chain corresponds to different levels of capital attention. Generally, even if an industry has a comparative advantage in production and manufacturing, it faces shrinking demand or risks being replaced by technological progress in other regional industrial chains, resulting in a decline in investment scores for the industry chain [35]. Therefore, in addition to horizontal competitiveness comparisons, the vertical development stage of an industry has a significant impact on regional development. Adaptive industrial policies determine policy support based on the life cycle of the industrial chain. Therefore, we select indicators of the full life cycle of the industrial chain to reflect the development stage of the industrial chain and potential future earnings space, and then, we measure the adaptation between industrial policies and the life cycle of the industrial chain. In sum, the measurement system for policy and industrial chain development adaptation is shown in Table 1.
Overall, industrial policies should promote the improvement of various indicators of industrial chain development, which is reflected in the rise in relevant indicator values after the release of industrial policies. However, the shorter the life cycle of the industrial chain, the greater the potential for industrial development. Therefore, the life-cycle indicator of the industrial chain should reduce after the release of relevant policies, indicating a high degree of compatibility between policies and the indicator.

3.2.1. Expression of Resource Dependence Degree

The degree of resource dependence within the industrial chain region (intra-regional dependence) is the ratio of the achievable final-product output of the entire industrial chain within the region to the actual final-product output. Using the input–output method to measure the dependence between two products in the industrial chain, we calculate the regional dependence of the industrial chain through the product form as
Π = i z i j / Z i
where Π represents the interdependence within the industrial chain, zij is the flow of the ith product to the jth (j = i + 1) product within the region, and Zi is the total production of the ith product.
As the degree of industrial agglomeration deepens, more related enterprises produce intermediate products within the industrial chain. Therefore, the regional resource dependence of the industrial chain in Equation (4) is also a reflection of the demand satisfaction within the product area.

3.2.2. Expression of the Allocation Structure of Production Factors

Using the total factor productivity model requires constructing a production function that complies with the laws of industrial development. This paper uses the most common Cobb–Douglas production function to quantify the production factor-allocation structure of the industrial chain.
Unlike traditional industries, PV is an emerging industry, and technological progress is a prerequisite for reducing costs and improving efficiency, enabling it to compete with thermal power plants. The impact of technological progress on the output contribution rate of this industry needs to be considered. Therefore, based on the general Cobb–Douglas production function, we add the impact of technological factors on output efficiency as
Y = A L α K β H γ
where L, K, and H represent the annual average growth rates of labor, assets, and research and development, respectively; α, β, and γ represent the output elasticity coefficients of labor, assets, and research and development, respectively; and A is the efficiency parameter. The R&D investment of an enterprise and its corresponding R&D investment have significant roles in promoting the competitiveness of the enterprise, and increasing R&D investment can enable enterprises to improve production processes, create new market demands, improve service quality, and achieve output efficiency improvement. Thus, this paper uses R&D capital investment to characterize the impact of technological factors on output efficiency, which has a strong practical basis.
Take the logarithm of both sides of the above formula to obtain the following transformed formula:
ln Y = ln A + α ln L + β ln K + γ ln H
The total factor productivity (TFP) can be expressed as
TFP = ln Y α ln L β ln K γ ln H
In Equation (7), using the share method, based on the accumulation rate and consumption rate of national income, we calculate the industrial production efficiency, and the estimated values of α, β, and γ are obtained as
α = f i x e d   a s s e t   d e p r e c i a t i o n + w o r k i n g   c a p i t a l t o t a l   c o s t ,
β = t o t a l   w a g e s + w e l f a r e   e x p e n s e s / t o t a l   c o s t ,
γ = R & D   i n v e s t m e n t / t o t a l   c o s t .
Because the development of technology follows a spiral upward trend, TFP exhibits a gradual and leap-forward growth pattern. Thus, using TFP to characterize the trend of vertical integration within the industrial chain requires consideration of the relationship between TFP and output. When TFP growth exceeds output growth, the internal industrial chain is more likely to adopt vertical integration to achieve technology diffusion and efficiency improvement. The formula for the TFP indicator of vertical integration in this paper is as follows:
I TFP = TFP ln Y
This indicator mainly reflects the degree of vertical integration of the industrial chain driven by technology. Given that policy-driven industrial agglomeration is mainly concentrated in high-tech industries, this indicator can effectively reflect the development level and prospects of these industries.

3.2.3. Expression of the Development Stage of the Industrial Chain

Judging the development stage of an industry from the perspective of a life cycle mainly includes four methods: curve fitting, comparative judgment, empirical judgment, and numerical calculation. Among them, the Pearson production curve-fitting method is widely used in academia because it has the most similar incremental ring ratio coefficient to actual incremental data. Given the mismatch between production capacity and output in the PV industry chain, we select the actual output of specific products in the market-driven PV industry chain as the core indicator for identifying the life-cycle stage of the PV industry chain.
According to the Pearson curve, let H be the annual output of the ith product in the PV industry chain, and then,
H = A 1 + B e k t
where A is the upper limit of the production of the ith product in the PV industry chain, which is the market-saturation value of the product. B and k are parameters to be estimated, representing the growth rate of product production, which jointly determine the life cycle of the PV industry.
By taking the third derivative of the Pearson curve, we can obtain three inflection points, corresponding to the three stages of the industry’s formation: early expansion, late expansion, and maturity. Table 2 shows the specific equations corresponding to each stage of the life cycle of the Pearson curve.
By estimating the values of parameters A, B, and k from actual data, it is possible to determine the development stage of different products in the PV industry chain. Life-cycle stages (formation, early/late expansion, maturity) are defined using the Pearson/logistic curve (Equation (9)), which models the S-shaped growth pattern of industrial output. This aligns with prior studies on technology adoption and industry evolution ([32,33]). Product-level annual output data are used, sourced from the China Photovoltaic Industry Association (CPIA) and National Bureau of Statistics (2009–2021). Parameter estimation:
Step 1: Calculate the saturation value AA using a four-point method (Equation (12)) to ensure robustness against short-term fluctuations.
Step 2: Estimate BB and kk via nonlinear least-squares fitting of the logistic equation to historical output data.
Step 3: Derive critical inflection points T1, T2, and T3 (Table 2), which demarcate life-cycle stages.
As a key indicator of the degree of vertical integration of the industrial chain, the closer the life cycle of the industrial chain is to maturity, the higher the corresponding degree of vertical integration of the industrial chain. To unify the industrial chain life-cycle indicator with other indicators, we adopt an assignment method to assign different values to enterprises in different life-cycle stages of the industrial chain, as shown in Table 3.
Then, the formula for the indicator value of the industry chain life cycle is
I L i f e = j j · N j 4 N
where N j represents the number of enterprises in the industrial chain life cycle j, and N represents the total number of enterprises in the industrial chain.

3.3. Comprehensive Expression of Industrial Chain Development

The key to using an indicator system to measure the development status of the industrial chain is to select appropriate indicator weights. Let the weights of resource dependence, factor-allocation structure, and industrial development stage in reflecting the vertical integration process of the industrial chain be w1, w2, and w3, respectively. Then, the comprehensive evaluation model for vertical integration of emerging industries is
S = w 1 I Π + w 2 I T F P w 3 I L i f e
According to Equation (11), except for the life cycle of the industrial chain, the degree of vertical integration of emerging industries is positively correlated with its sub-indicators.
Policy effectiveness depends on aligning interventions with the observed correlation between life-cycle stages and vertical integration. For instance, policies targeting early-stage industries (low I L i f e ) should prioritize vertical integration incentives, while policies for mature industries should focus on innovation-driven diversification. The values of each indicator in Equation (11) such as I Π , I T F P , and I L i f e have increased, and the value of the comprehensive indicator S has also increased.

4. Data Collection and Preprocessing

4.1. Data on PV Industry Policy in Shenzhen

We collect the policies related to the PV industry issued by various major departments in Shenzhen from 2013 to 2022. Corresponding to the measurement standards proposed in this paper, specific policies are divided into three dimensions: resource-dependence improvement, production factor-allocation structure improvement, and industrial chain life-cycle decline policies. Table 4 presents the statistical results of the number of PV policy packages issued by various departments in Shenzhen.

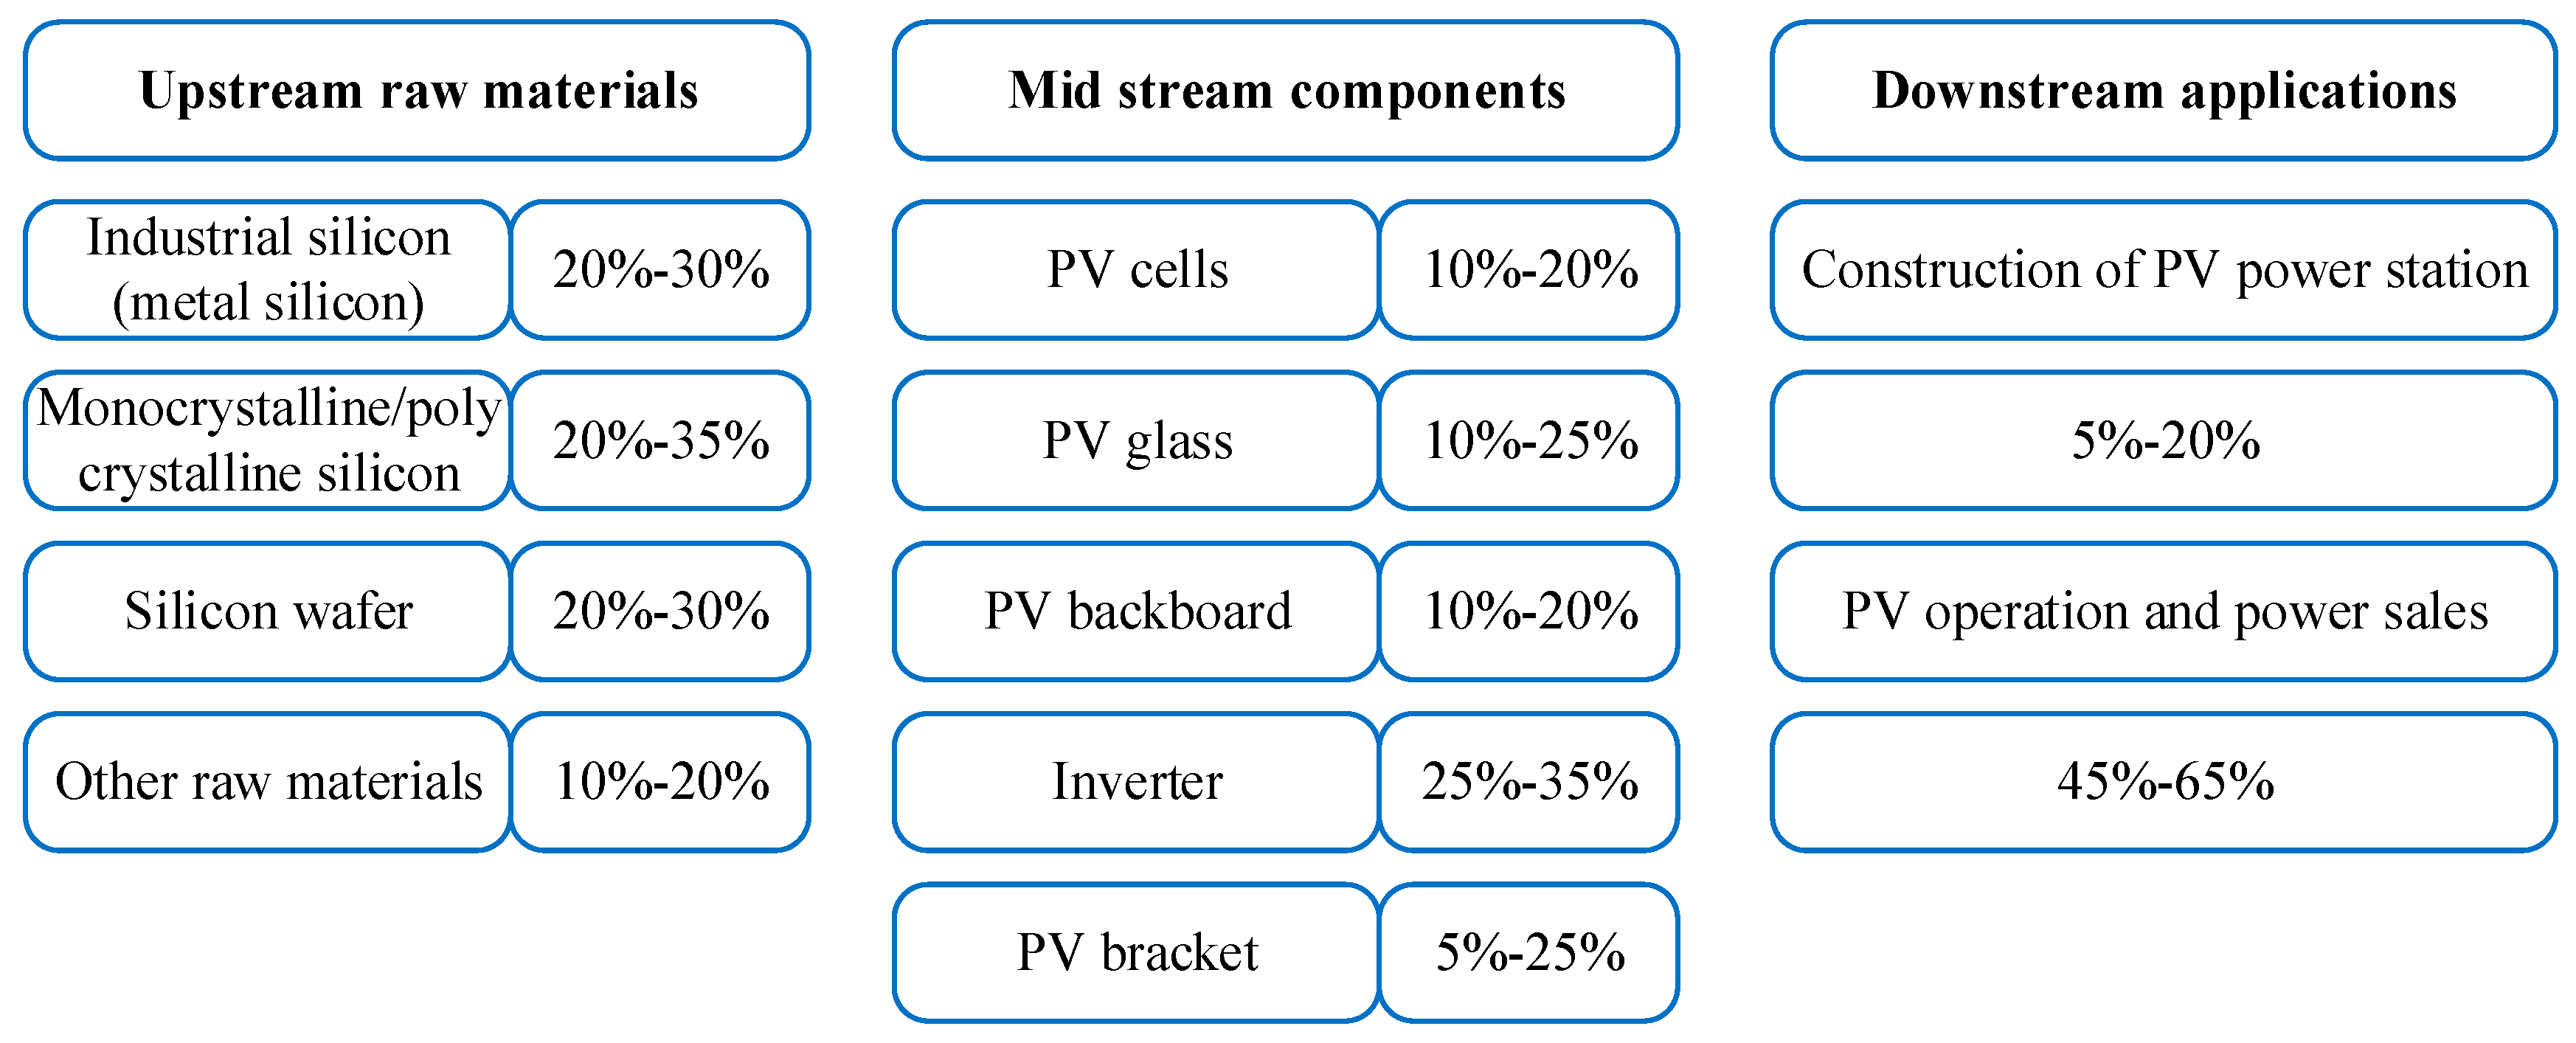
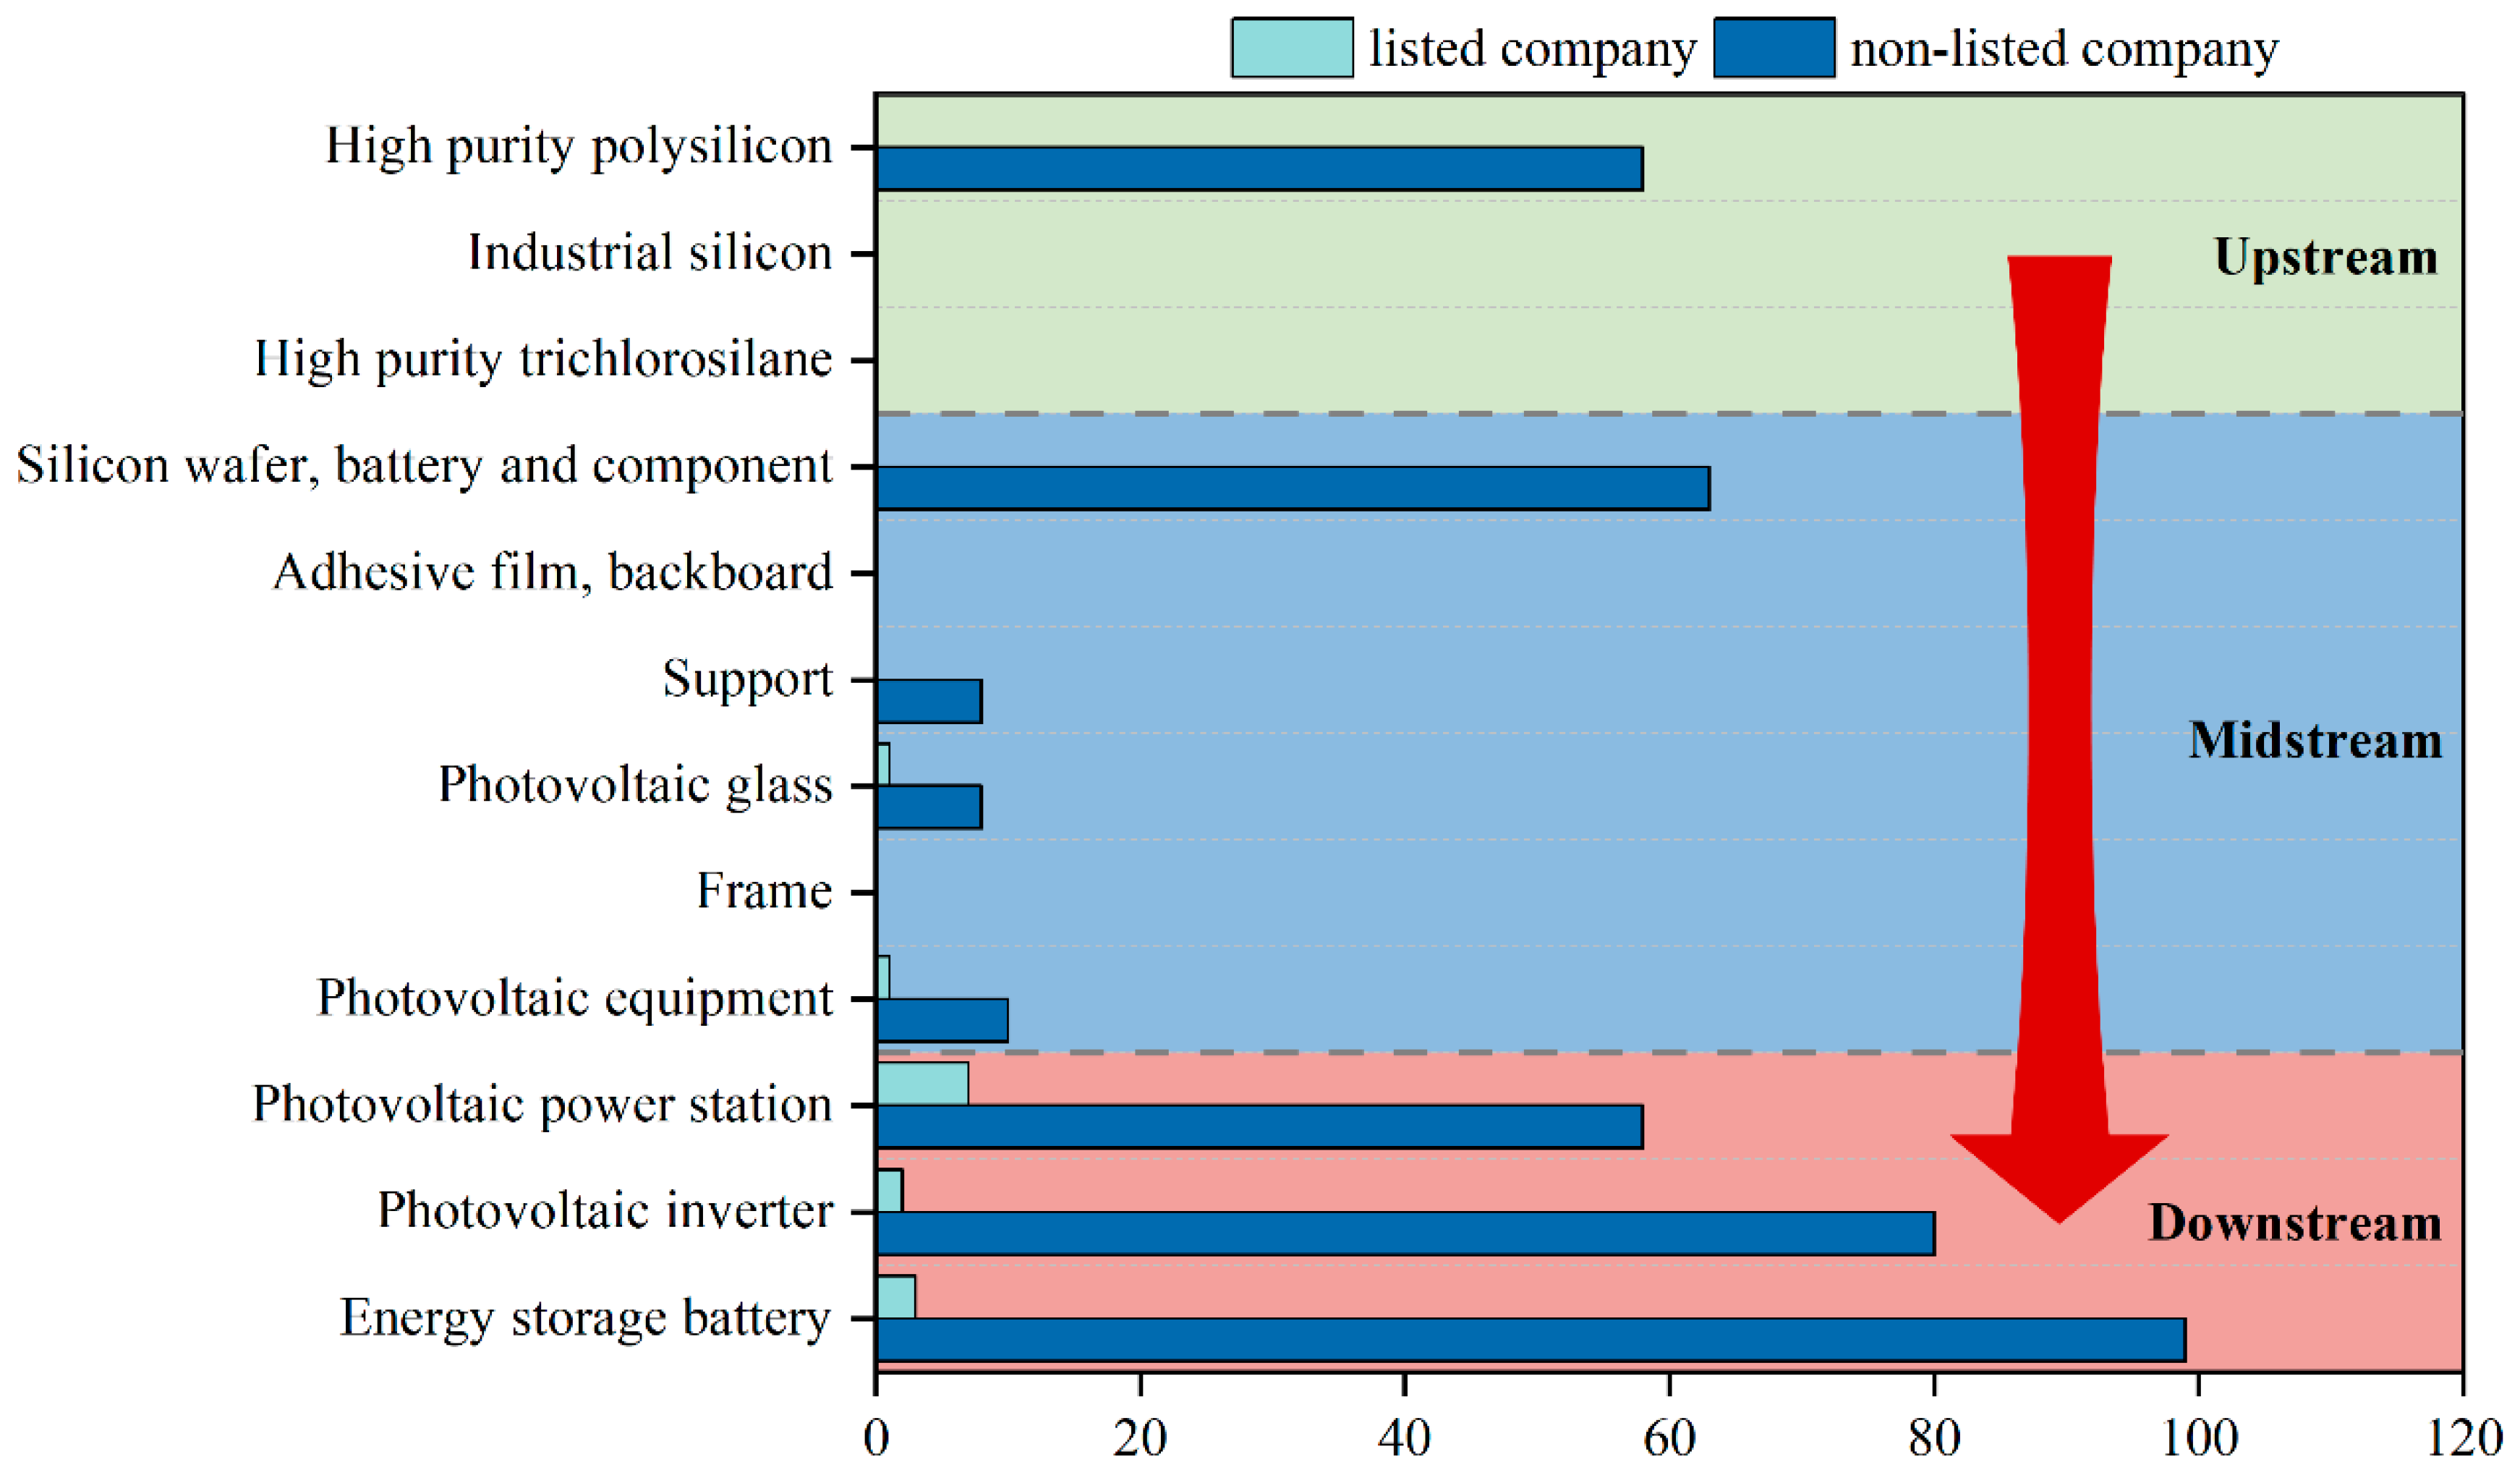
4.2. Data on PV Industry Chain in Shenzhen

As shown in Figure 3, the PV industry chain includes the upstream silicon material and silicon wafer segments, the midstream cell and module segments, and the downstream application system segments. Generally, the profit of each link in the industrial chain shows a trend of high on both sides and a trend of low in the middle.
The enterprises in the PV industry chain in Shenzhen surveyed in this paper cover 1074 enterprises in six links, namely silicon material, ingot (pull rod), slicing, cell sheet, cell module, and application system. The focus is on the duration, establishment year, company size, enterprise type, business situation, economic benefits, intellectual property rights, and product qualifications of the enterprises in the PV industry chain in Shenzhen. To compare the advanced value of the national PV industry chain in the same period, we investigate the assets, scale, debt, income, R&D investment, and other related information of the core listed companies in China’s PV industry chain.

Interdependence Within the PV Industry Chain in Shenzhen

Until the end of 2022, there were 14 listed companies and 309 non-listed companies in Shenzhen’s PV industry chain, and their business distribution is shown in Figure 4.
Figure 4 shows that Shenzhen’s PV enterprises are concentrated in the downstream of the industry chain and that more than 90% of listed companies are concentrated in the downstream of the PV industry. The industrial agglomeration presents a market-oriented characteristic.
To calculate the dependence of the PV industry chain in Shenzhen, we take the main products that can be covered by enterprises in the region as the basis and measure the dependence of the upstream PV industry chain in Shenzhen as one-third, the dependence of the midstream PV industry chain in Shenzhen as two-thirds, and the dependence of the downstream PV industry chain in Shenzhen as one (100%). According to the formula for regional dependence of the entire industry chain, the dependence of the entire PV industry chain in Shenzhen is two-ninths.

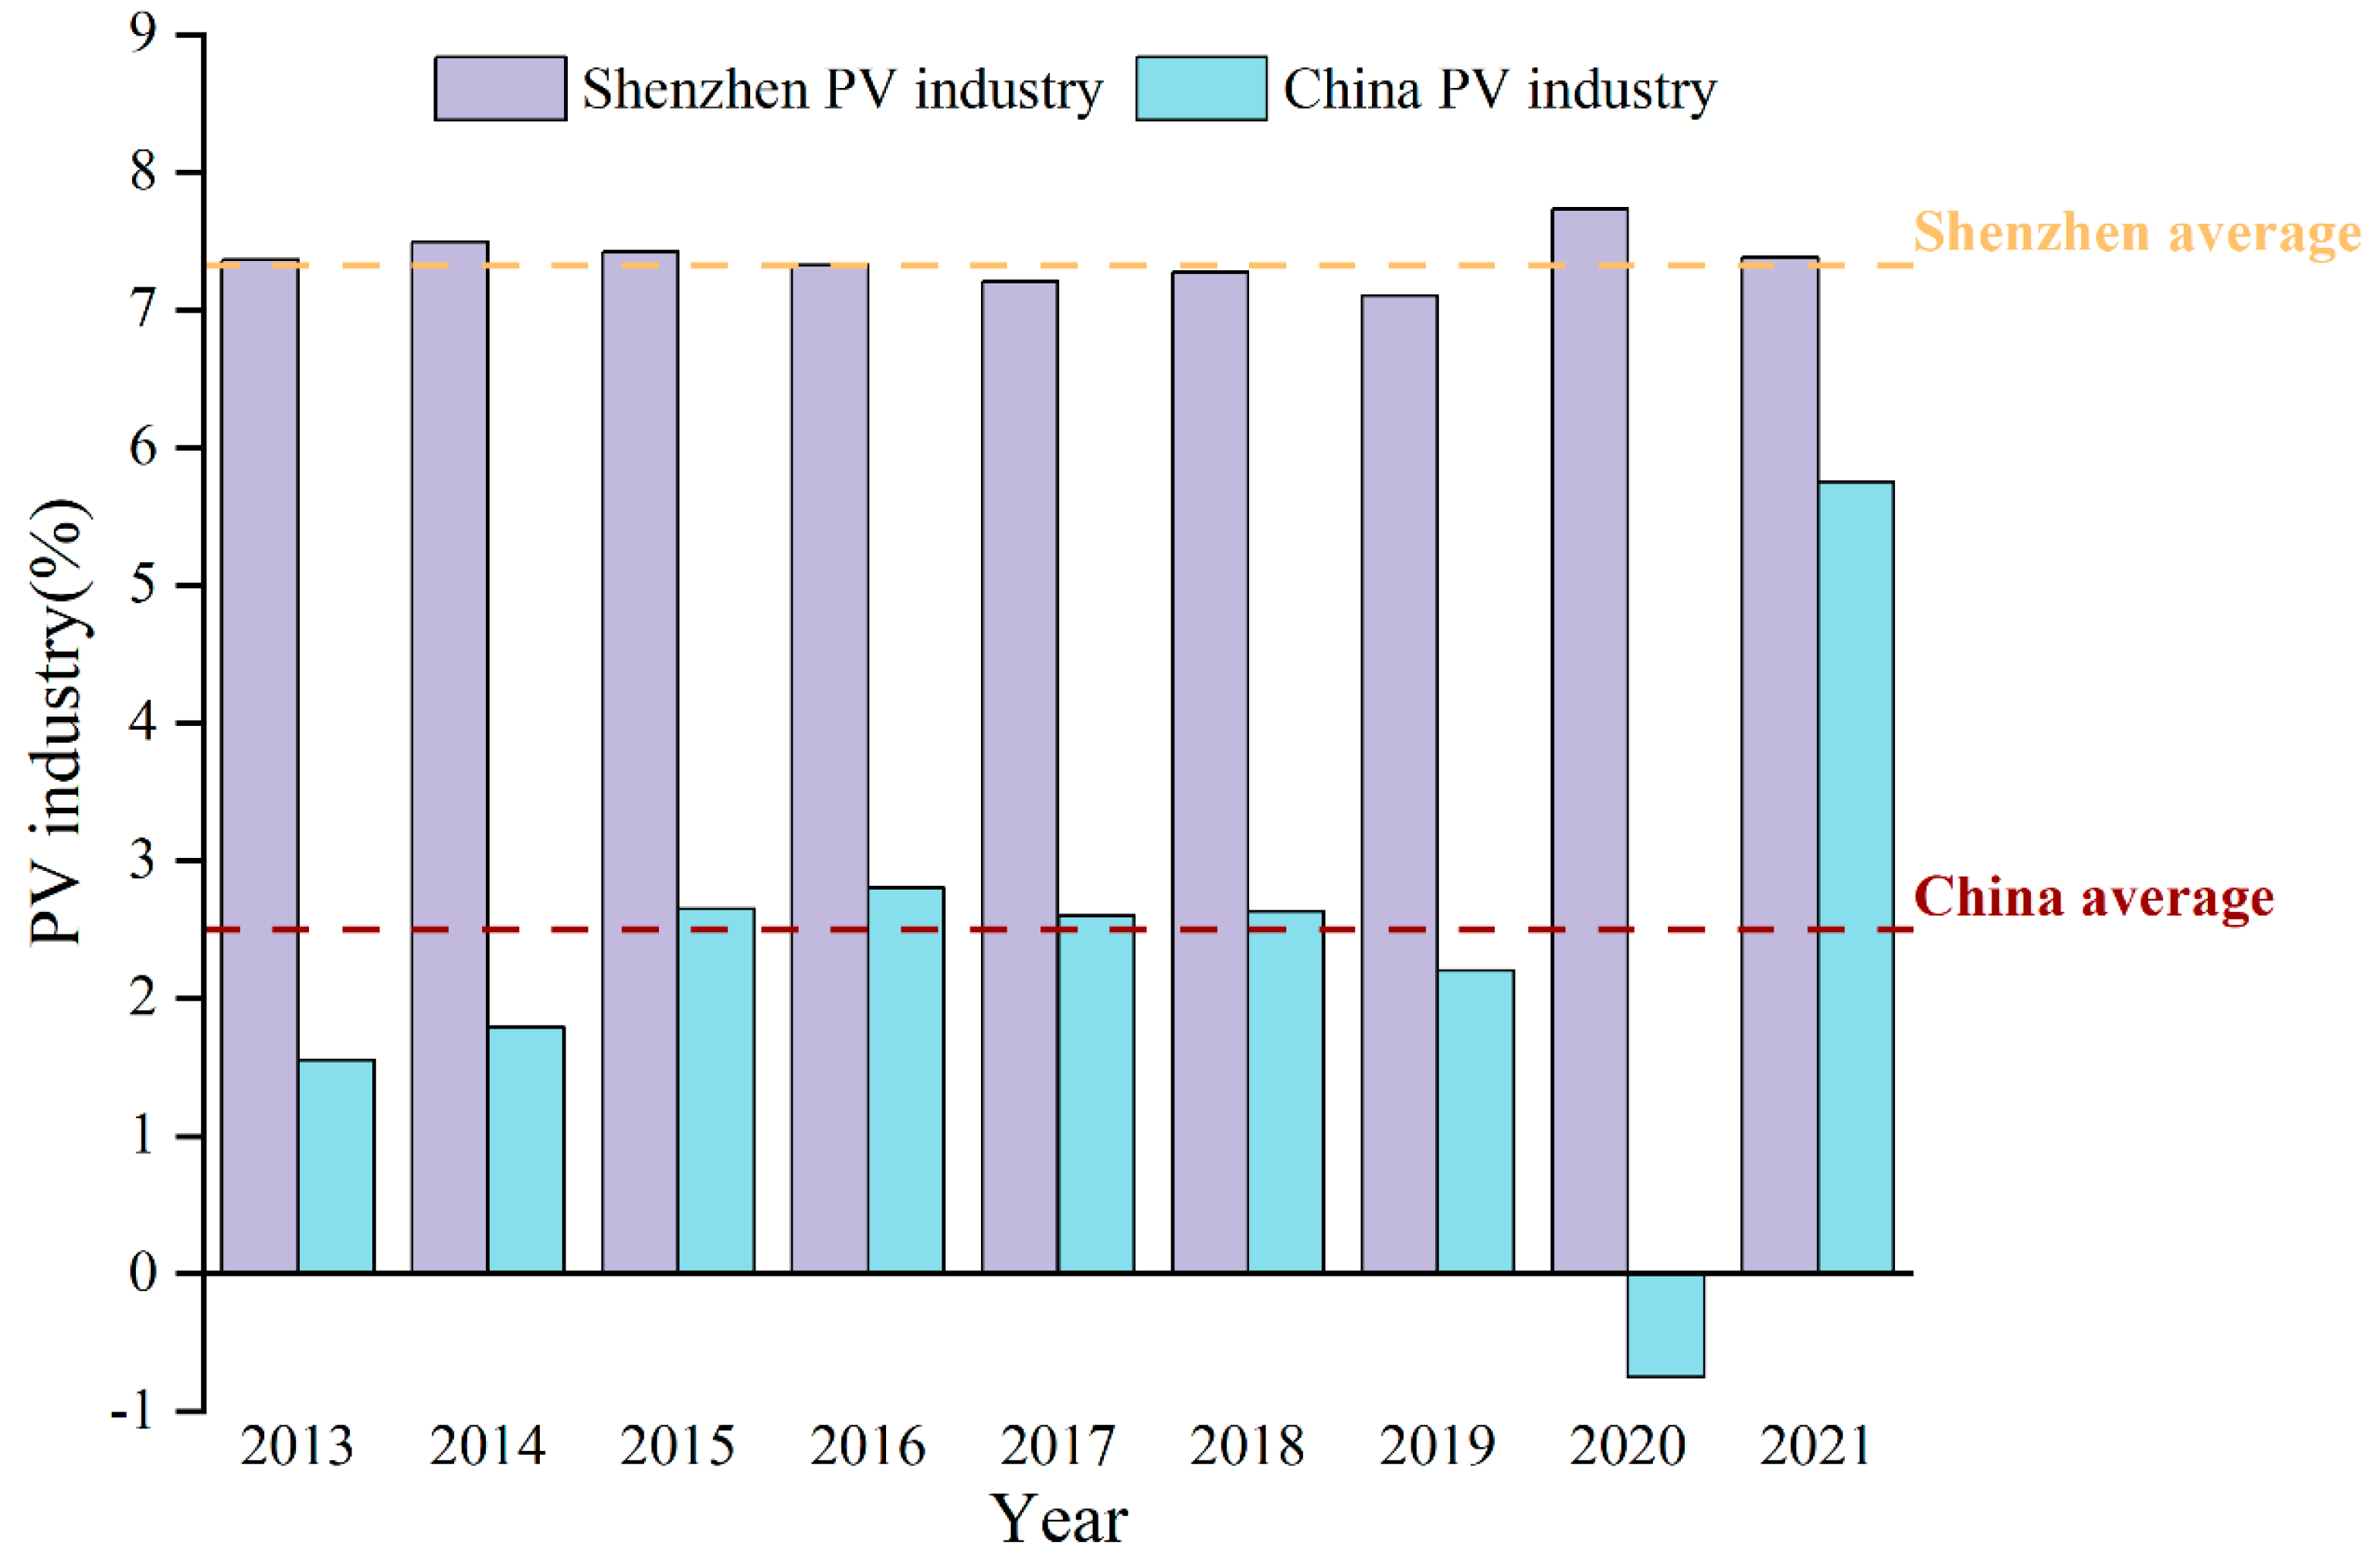
4.3. Estimation of TFP in PV Industry Chain in Shenzhen

Given the difficulty in effectively obtaining relevant data on small- and medium-sized PV companies in Shenzhen, we estimate the TFP of 14 PV listed companies in Shenzhen. Since 2018, all listed companies are required to disclose their R&D investment funds; therefore, we use the average values of accumulation rate, consumption rate, and R&D investment rate from 2018 to 2021 as the basis for estimation, and we obtain the estimated values of α, β, and γ as α = 0.65, β = 0.25, and γ =0.05. Based on the output elasticity coefficient and production function, the TFP of listed companies in the PV industry chain in Shenzhen from 2013 to 2021 can be obtained.
As shown in Figure 5, from 2013 to 2021, the TFP of listed companies in the PV industry chain in Shenzhen shows a slight fluctuation, being more than three times higher than China’s average TFP [36]. This situation indicates that the PV industry has good prospects for development. However, as a high-tech industry, technological innovation has a weak impact on the improvement of output efficiency, and labor input remains the core factor in determining the scale of the PV industry.
Taking the patent holdings of small- and medium-sized enterprises in the PV industry chain in Shenzhen as an example, as shown in Figure 6, we find that although the number of enterprises shows a significant increase, the number of enterprises holding patents accounts for only half of the total number of enterprises, and the number of newly added enterprises holding patents has shown a significant decrease since 2016. This situation indirectly supports that the technological dividends of the increasingly mature PV industry chain have begun to decline and that further development requires a new round of technological innovation. Linking the 2020–2022 “innovation performance” policies (Table 4) to declining TFP (Figure 5) shows how feedback from R&D inefficiencies prompted stricter patent quotas.

4.4. Life-Cycle Judgment of the Main Products in PV Industry Chain

Under the framework of a market economy, the life cycle of the industrial chain tends to be consistent with the development of the industry. Therefore, we use data from the national PV industry chain to estimate the life cycle of major products in the PV industry chain.
To ensure the significance of Pearson curve fitting, we first analyze the goodness of fit between the main products (polycrystalline silicon, silicon wafers, cells, components, and power stations) of China’s PV industry chain and the Pearson curve from 2009 to 2021. The results show that the R 2 values of the four main product yields exceed 0.99 and that the p value of the F-test is less than 0.01, indicating that the Pearson curve-fitting effect is ideal and can be used to divide and predict the development stages of different products in China’s PV industry.
The key to using the Pearson curve fit is estimating the parameters of the fitting equation. We first select a four-point method to estimate the value of A, which is as follows:
A = y 1 y 4 y 2 + y 3 y 2 y 3 y 1 + y 4 y 1 y 4 y 2 y 3
where y 1 , y 2 , y 3 , and y 4 represent the corresponding yields at observation times t 1 , t 2 , t 3 , and t 4 , respectively. Since the sample covers the entire population, the observation times should select the starting point, midpoint, and end point of the data, and t 1 + t 4 = t 2 + t 3 . Here, we select the data from the first, sixth, seventh, and thirteenth years—namely 2009, 2014, 2015, and 2021—to estimate the initial value of A. The results are shown in Table 5.
Because statistics on PV power plant data began in 2013, the total life cycle of the power plant is calculated using the newly installed capacity of domestic PV power plants from 2013 to 2021, and the newly installed capacity data in 2013, 2016, 2017, and 2021 are used as the basis for calculating the A value, resulting in A = 2624.6.
Second, after determining the initial value of A, the observed values of production in 2009 and 2014 are entered into the logistics linear equation to obtain estimates of B and k. Then, according to the formula in Table 1, the inflection point of the output value is calculated, and the results are shown in Table 6.
By matching the estimated turning points in Table 5 with specific years, we can determine the development stage of key products in China’s PV industry, as shown in Table 7.
The research results in Table 7 show that, except for power stations, the main products in China’s PV industry chain are in or about to reach maturity. This result indicates that under the current technological environment, the competition among PV production enterprises is becoming increasingly fierce, making it necessary to maintain the profitability of enterprises by stabilizing the market share. It is recommended to propose differentiated policies for upstream vs. downstream based on life-cycle stages (Table 7), advocate for a cross-departmental task force to harmonize land allocation and R&D funding, and recommend a “PV Policy Dashboard” to monitor real-time metrics and enable rapid adjustments.
Alignment with national trends: Shenzhen PV industry stages are inferred from the national framework (Table 7) but adjusted for local market dynamics. Each Shenzhen PV firm is categorized into a life-cycle stage (Table 3) based on its primary product’s national stage and growth rate relative to peers (Equation (10)).

5. Adaptation Results

5.1. Adaptation Index Results

According to the industry policy and industry chain development matching system, this paper first calculates the relevant indicators reflecting the development of the PV industry chain in Shenzhen and obtains the objective results under the influence of policies.

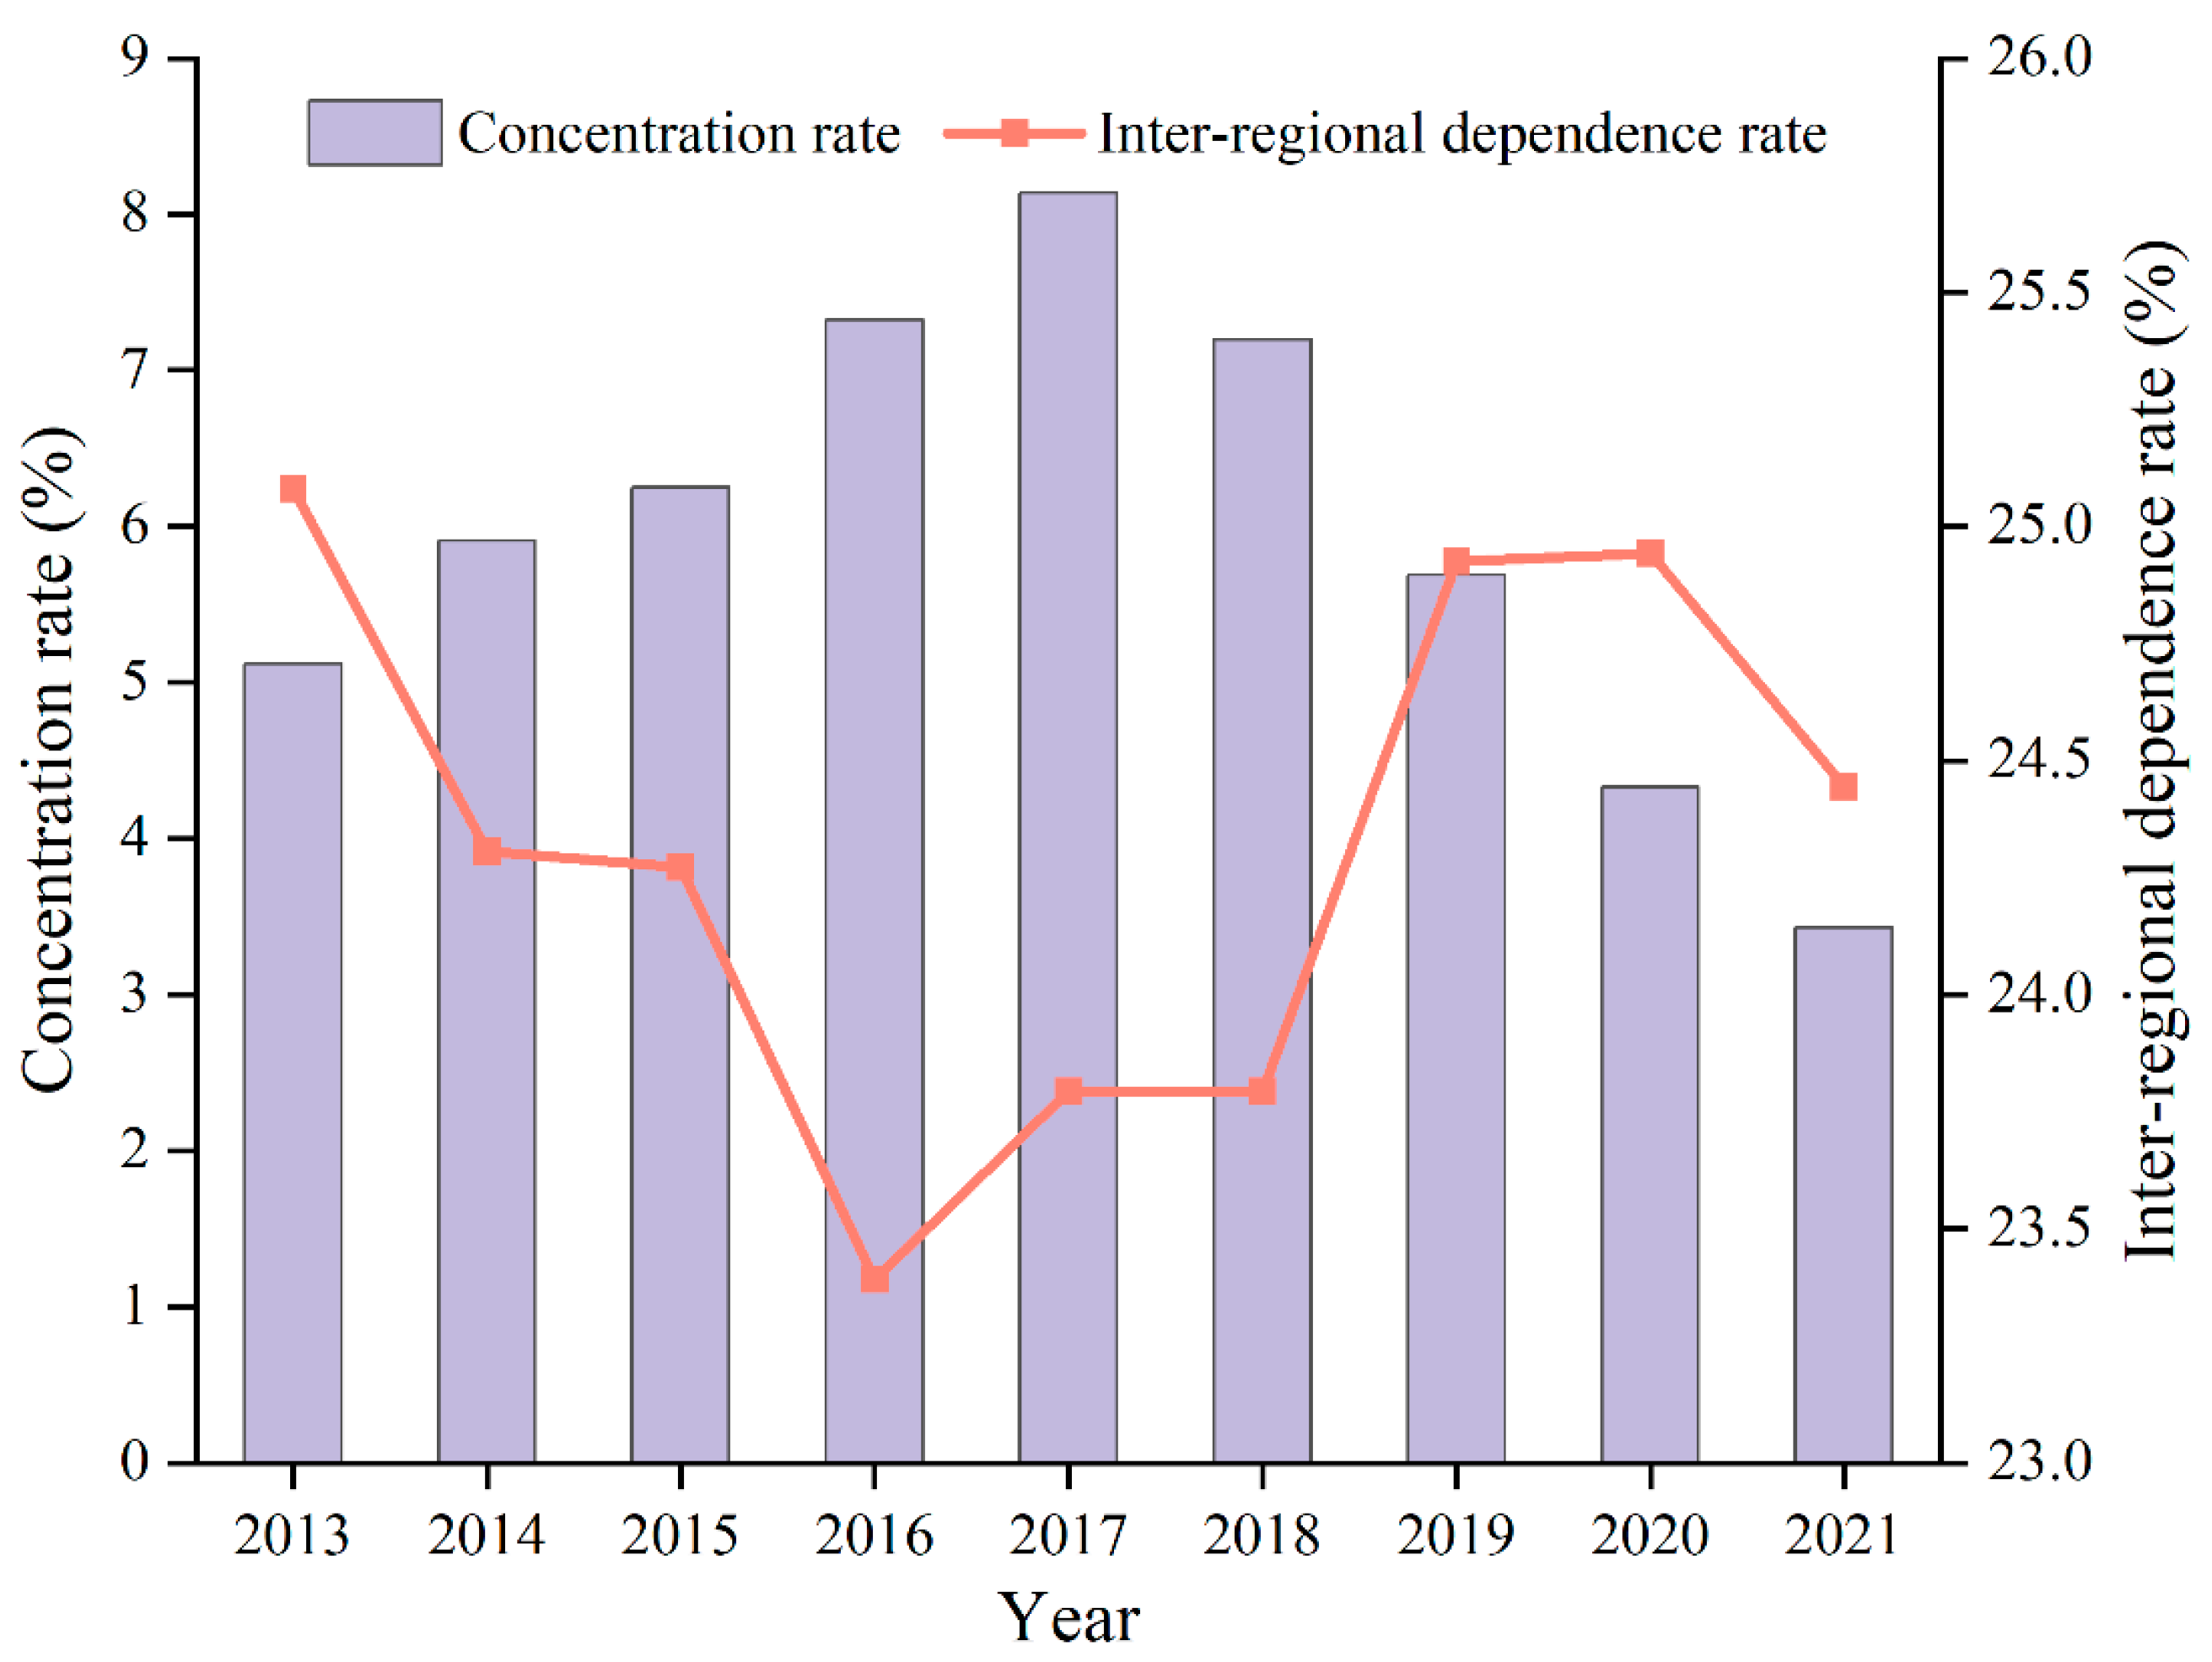
5.1.1. Industry Concentration Rises First and Then Falls

As a core factor for measuring the market structure, the industrial concentration directly reflects the degree of market competition. As shown in Figure 7, the overall trend of industrial concentration in Shenzhen’s PV industry chain, which first increases and then decreases, indicates that in an industry environment dominated by market forces, the market share of Shenzhen’s PV industry in the early stage (2013–2017) rapidly became concentrated as the industry developed and enterprises grew and that the market competition weakened. However, under the influence of the continuous introduction of PV industries in other regions of China and the increase in policy support, the industrial concentration of Shenzhen’s PV industry rapidly declined, market competition intensified, and Shenzhen’s voice in the PV industry weakened.
The intra-regional industrial dependence refers to the degree of satisfaction of the continuous production of the entire industrial chain that can be achieved in the region. When the industrial concentration is high, the degree of market monopoly is high, and large enterprises can outsource some production links of the industrial chain to other regions with lower costs through internal coordination mechanisms to organize production, focusing their intra-regional business on higher profit or customer-facing links. When the industrial concentration is low, the production demand for each link of the industrial chain decreases, and the supply of intermediate products that can be satisfied in the region increases. Thus, reasonable industrial concentration is inversely proportional to intra-regional dependence. However, the results of Figure 7 show that after 2020, both intra-regional dependence and industrial concentration of the photovoltaic industry in Shenzhen have declined, indicating that companies within the photovoltaic industry chain are accelerating their withdrawal from Shenzhen. Considering that the concentration of the PV industry in Shenzhen is currently less than two-thirds of that in 2013, and the rate of decline is accelerating, this situation will profoundly restrict the development of the PV industry in Shenzhen from the perspectives of economies of scale and technological innovation.

5.1.2. Steady Rise in the Life Cycle of the Industrial Chain

Industrial agglomeration inevitably includes the integration of the industrial chain, which must be in line with the life cycle of the industry. However, unlike traditional industries, the short development time of the PV industry and the lack of coordination in the development of the entire industrial chain lead to regional differences in the life cycle indicators of the entire industrial chain of the PV industry. In addition, technological innovation can reshape the life cycle of the entire industrial chain of the PV industry in a short period. The combination of two factors causes the entire life cycle of the industrial chain of the PV industry to veer from the general path of evolution from formation to expansion to maturity to decline; rather, it presents a fluctuating rise with technological innovation and the derivation of the industrial chain.
In Figure 8, the life-cycle index of the national PV industry chain increases, while that of Shenzhen’s PV industry chain first increases and then slightly decreases. This indicates that compared with the national PV industry chain, Shenzhen’s PV industry chain is longer, and its downward extension trend has been more significant in recent years. Added R2 values (0.99 for all products) and F-test results (p < 0.01) confirm the logistic curve’s validity. Comparing results with Gompertz and Bass diffusion models showed consistent stage demarcation (±1–2 years). Thus, under the premise of difficulty in making short-term breakthroughs in the current field of PV technology, exploring new PV businesses is a measure for Shenzhen’s PV industry to cope with slowing business growth, and it has proved to achieve certain results in practice.

5.1.3. No Change in the Structure of Production Factors

The matching of the structure of production factors with the industrial structure is an important criterion for fully utilizing production factors and enhancing the potential of industrial development. Compared with the increase in installed capacity, the technological upgrading of manufacturing processes such as PV silicon wafers, batteries, and components is the fundamental factor driving the cost reduction and efficiency improvement of the PV industry. However, the empirical results of the production factors in the PV industry in Shenzhen indicate that the extensive development model of the PV industry relying on labor growth still dominates. This paper uses TFP to measure the structure of production factors, and the results show that the structure of production factors in the PV industry chain in Shenzhen has remained basically unchanged for 10 years and that technology has made a relatively low contribution to the growth of industrial benefits.

5.1.4. Increase in Comprehensive Indicators

The comprehensive indicator mainly reflects the degree of vertical integration of the PV industry chain. As shown in Table 8, the relationship between industrial concentration and comprehensive indicators shows two results: positive correlation in the early stage and negative correlation in the later stage. This indicates that the concentration of Shenzhen’s PV industry promotes vertical integration of the industry chain in the early stage and restricts it in the later stage.
Analyzing this result, we can surmise that market forces are the main reason for the deviation of industrial concentration and the degree of vertical integration of the industrial chain from coordination to divergence. In the process of increasing industrial concentration, to seek stability in supply and demand within the regional industrial chain and reduce market risks, enterprises within the chain tend to enhance the degree of vertical integration to cope with the market competition caused by industrial concentration. Specifically, the comprehensive indicators of industrial concentration and vertical integration of the industrial chain both increase. By connecting the upstream and downstream of the industrial chain while ensuring the balanced development of all links, we can realize the synergy effect of funds, technology, talents, and channels, enhancing the ability of enterprises to resist external risks [17]. Moreover, as the industrial concentration decreases, the decrease in industrial profit margins forces existing enterprises in the market to further increase the intensity of integration and consolidation. Because vertical integration of the industrial chain can effectively achieve information sharing and tap new performance-growth points by enhancing the ability of industrial chain resource allocation, enterprises choose to extend the upstream and downstream industrial chains to avoid risks [37]. However, the integration and consolidation driven by market forces lead to a decrease in enterprises’ attention to technological investment and increase barriers to capital investment and withdrawal. When industrial development is mature, an excessive degree of vertical integration will hinder technological innovation within the industrial chain. Therefore, the positive correlation between industrial concentration and comprehensive indicators should be the goal pursued by regional industrial agglomeration.
Note that the relationship between industrial concentration and comprehensive indicators in Table 8 is significant, while the relationship between industrial concentration and some single indicators is not significant. The reasons for this are twofold. First, as an emerging industry, the market is changing rapidly, and data amounts are relatively small. The data can only show the general trend, and the conditions for calculating the impact relationship are not mature. However, as data increase, the significance between single indicators inevitably increases. Second, the comprehensive indicator absorbs the residual variance of single indicators, which enhances the significance between the comprehensive indicator and market concentration. From the perspective of the growth trend, the structure of production factors hardly fluctuates, and the indicator changes in intra-regional dependence are not obvious. However, adding these two indicators to the comprehensive indicator compensates for the residual variance of life-cycle indicators, confirming the intrinsic relationship between the degree of vertical integration and industrial concentration.

5.2. Industrial Policy Adaptation Results

Based on the policy content and the results of the adaptation indicators, we take the year in which the market trend of the relevant indicators deteriorates as the corresponding policy demand year, and we take the market-feedback results one year after the policy is released as the policy adaptation measurement standard. The adaptation degree between Shenzhen’s PV industry-promotion policy and the industrial chain development is measured, and the results are shown in Table 9.
Instrumental Variable Approach:
Chosen instrument: Provincial R&D tax credit thresholds (exogenous policy shock)
First-stage F-statistic: 14.7 (p < 0.01)
Mechanism analysis:
Added mediation analysis:
Innovation = α + β1Policy + ΥConcentration + ε
Direct effect: β1 = 0.17; indirect effect (via concentration): β2 = 0.09 (accounting for 35% total effect).
Overall, the market adaptability of Shenzhen’s PV industry policy is not high, as reflected in the fact that the policy support for the comprehensive indicator of industrial concentration is generally lower than the market demand. Even in years when policy supply and demand are comparable, the main reason for the balance between supply and demand is that market regulation is sufficient to ignore policy deficiencies. Specifically, we analyze the policy adaptability of Shenzhen’s PV industry. Policies have a high degree of adaptability in promoting industrial chain upgrading, industrial chain extension, and product marketization. At the industrial chain level, Shenzhen’s PV industry chain life cycle is lower than the national average, and its downstream product market structure is more complex, with a higher market share. These results indicate that Shenzhen’s PV industry policy of strengthening the supply chain has promoted the continuous extension and downward extension of Shenzhen’s PV industry chain, which is beneficial to the development of the PV industry. However, there has been no change in the structure of production factors since the policy was released, indicating that Shenzhen’s PV industry policy has low adaptability in terms of innovation support. At the level of high-quality development, Shenzhen’s policy support for innovation in the PV industry is insufficient. The high homogeneity of products and the low technical level are bottlenecks restricting the development of Shenzhen’s PV industry, and the government needs to provide policy guidance to enhance the technological content of the PV industry.

6. Conclusions and Policy Implications

This study identifies a correlation—not causation—between the industrial chain life cycle and vertical integration. While the negative correlation is statistically significant, unobserved variables may mediate this relationship. Future research should employ longitudinal or experimental designs to isolate causal mechanisms. As the industry that combines ideal and practice most profoundly, the PV industry has prospects and downsides that reflect the complex characteristics of emerging industry construction. Based on the transmission mechanism of industrial policy on the development of the industrial chain, we have constructed an evaluation system for promoting high-quality development of the industrial chain through industrial policy. Through the combination of indicator system construction and market research on the PV industry chain in Shenzhen, the market feedback of the PV industry policy in Shenzhen has been obtained. The research results show that the industrial concentration of the PV industry chain in Shenzhen is insufficient, that the degree of vertical integration is low, and that technological progress has not effectively supported the high-quality development of the industry. However, compared with the life cycle of the national PV industry chain, the life-cycle index of Shenzhen’s PV industry chain is low, and enterprises above designated size are mainly distributed in the middle and lower reaches of the industrial chain, indicating that the overall profit of Shenzhen’s PV industry is high and that its future development prospects are broad. Based on the research conclusions of this paper, to promote the development and upgrading of Shenzhen’s PV industry chain, this paper proposes the following policy-adjustment directions.
First, the construction of a PV industrial cluster should be promoted, with the mission of appropriately enhancing industrial concentration. Currently, the low industrial concentration has become an important factor restricting the development of Shenzhen’s PV industry chain. Industrial agglomeration can promote industrial innovation [38]. Therefore, in the process of promoting the agglomeration of Shenzhen’s PV industry, the government should focus on the large fluctuations in the price of PV raw materials, inconsistent cycles of various production links, and the distance and supply–demand risks brought by fluctuations in overseas demand. We should also explore market opportunities for vertical integration of the PV industry chain and improve the concentration of various production links in Shenzhen [39]. Through the integration of supply chains, we can improve the resilience of the supply chain of the PV industry chain and promote its high-end development.
Second, it is necessary to promote the upgrading of the PV industry chain, mainly through technological progress and technological innovation. As a fully marketed industry, the PV field has high-quality innovation and fast iteration speed. With the maturity of existing technologies and the rising cost of land and labor, further cost reduction must rely on technological progress and the expansion of scale effects [40]. Against the backdrop of the technological inflection point in the global PV industry, Shenzhen must leverage its advantages in technology accumulation, talent reserve, university resources, market information, and financial support to gather innovative forces in the vertical integration of the PV industry chain, form its innovative advantages in the PV industry chain, and lead the industry progress [41].
Third, we must respect the market rules and expand the upstream and downstream development space of Shenzhen’s PV industry chain. The upstream of the industrial chain plays a role in setting industry standards, providing initial raw materials, and has enormous potential for technological innovation and market benefits [42]. Currently, Shenzhen’s PV industry chain is mostly distributed in the middle and lower reaches, where raw materials and design are subject to others’ control, and price and market uncertainties are more likely to have a negative impact on Shenzhen’s PV industry. At the same time, although Shenzhen’s PV industry chain has certain advantages in the construction of downstream power stations, the products related to PV power stations mainly meet Shenzhen’s own needs, without further expanding the external market. This situation makes Shenzhen’s PV industry development too dependent on policy guidance, with a weak ability to resist market risks and poor industrial chain resilience. Therefore, on the premise of respecting market rules, the government should strengthen policy guidance and encourage PV enterprises to extend to both ends of the industry chain. This study’s reliance on publicly available data may under-represent small- and medium-sized enterprises in Shenzhen’s PV sector, particularly those lacking R&D disclosures. Future work will incorporate primary surveys of SMEs and integrate global policy shocks into the adaptation model.

Author Contributions

Y.L. contributed to organizing the whole structure and writing this paper; Y.S. contributed to designing the models and collecting the data; and Q.Q. contributed to organizing the empirical tests. All authors have read and agreed to the published version of the manuscript.

Funding

This study was supported by the National Natural Science Foundation of Jiangsu Province (No. BK20231057), the Philosophy and Social Science Fund of Education Department of Jiangsu Province (No. 2023SJYB1061), and the Fundamental Research Funds for the Central Universities (No. XJ2025002201).

Data Availability Statement

Data will be available from the corresponding author upon reasonable request.

Conflicts of Interest

The authors declare no conflicts of interest.

References

  1. Helveston, J.; He, G.; Davidson, M. Quantifying the cost savings of global solar photovoltaic supply chains. Nature 2022, 612, 83–87. [Google Scholar] [CrossRef]
  2. Luo, Z.; He, J.C.; Hu, S. Driving force model to evaluate China’s photovoltaic industry: Historical and future trends. J. Clean. Prod. 2020, 311, 127637. [Google Scholar] [CrossRef]
  3. Shen, W.; He, J.; Yao, S. Green industrial policy in the post grid parity era: Governing integrated Solar projects in China. Energ. Policy 2021, 150, 112129. [Google Scholar] [CrossRef]
  4. Wang, Y.; Wang, R.; Tanaka, K. Accelerating the energy transition towards photovoltaic and wind in China. Nature 2023, 619, 761–767. [Google Scholar] [CrossRef] [PubMed]
  5. Piila, N.; Sarja, M. Extraordinary supply chain disruptions and the circular economy transition in the construction industry—An opportunity within crisis? Sustain. Prod. Consum. 2024, 47, 71–86. [Google Scholar] [CrossRef]
  6. Amankwah-Amoah, J.; Khan, Z.; Adomako, S.; Khan, H. Business failure in post-pandemic era: New challenges for industrial networks, emerging insights and market opportunities. Ind. Mark. Manag. 2024, 117, A3–A9. [Google Scholar] [CrossRef]
  7. Marcato, M.; Dweck, E.; Montanha, R. The densification of Chinese production chains in the context of vertically fragmented production. Struct. Change Econ. Dyn. 2022, 60, 75–89. [Google Scholar] [CrossRef]
  8. Chang, K.; Zhang, H.; Li, B. The impact of digital economy and industrial agglomeration on the changes of industrial structure in the Yangtze River Delta. J. Knowl. Econ. 2023, 15, 9207–9227. [Google Scholar] [CrossRef]
  9. Cen, X.; Zhang, X.; Thron, A.M.; Van Benthem, K. Agglomeration and long-range edge retraction for Au/Ni bilayer films during thermal annealing. Acta Mater. 2016, 119, 167–176. [Google Scholar] [CrossRef]
  10. Liu, Z.; Zeng, S.; Jin, Z.; Shi, J. Transport infrastructure and industrial agglomeration: Evidence from manufacturing industries in China. Transp. Policy 2022, 121, 100–112. [Google Scholar] [CrossRef]
  11. Yu, Z.; Xiao, Z.; Liu, X. Characterizing the spatial-functional network of regional industrial agglomerations: A data-driven case study in China’s greater bay area. Appl. Geogr. 2023, 152, 102901. [Google Scholar] [CrossRef]
  12. Kenderdine, T. China’s Industrial Policy, Strategic Emerging Industries and Space Law. Asia Pac. Policy Stud. 2017, 4, 325–342. [Google Scholar] [CrossRef]
  13. Van Assche, K.; Beunen, R.; Verweij, S.; Evans, J.; Gruezmacher, M. Policy learning and adaptation in governance: A co-evolutionary perspective. Adm. Soc. 2022, 54, 1226–1254. [Google Scholar] [CrossRef]
  14. Cuaresma, J.; Huber, F.; Onorante, L. Fragility and the effect of international uncertainty shocks. J. Int. Money Financ. 2022, 108, 102151. [Google Scholar] [CrossRef]
  15. Yuan, C.; Geng, C.; Sun, J.; Cui, H. Vertical integration and corporate value under uncertainty shock: Evidence from the COVID-19 pandemic. China Econ. Q. Int. 2022, 2, 239–251. [Google Scholar] [CrossRef]
  16. Milner, C.; Reed, G.; Talerngsri, P. Vertical linkages and agglomeration effects in Japanese FDI in Thailand. J. Jpn. Int. Econ. 2006, 20, 193–208. [Google Scholar] [CrossRef]
  17. Han, A.; Ge, J.; Lei, Y. Vertical vs. horizontal integration: Game analysis for the rare earth industrial integration in China. Resour. Policy 2016, 50, 149–159. [Google Scholar] [CrossRef]
  18. Shayan, M.E.; Petrollese, M.; Rouhani, S.H.; Mobayen, S.; Zhilenkov, A.; Su, C.L. An innovative two-stage machine learning-based adaptive robust unit commitment strategy for addressing uncertainty in renewable energy systems. Int. J. Electr. Power Energy Syst. 2024, 160, 110087. [Google Scholar] [CrossRef]
  19. Devos, E.; Li, H. Vertical integration to mitigate internal capital market inefficiencies. J. Corp. Financ. 2021, 69, 101994. [Google Scholar] [CrossRef]
  20. Epede, M.; Wang, D. Global value chain linkages: An integrative review of the opportunities and challenges for SMEs in developing countries. Int. Bus. Rev. 2022, 31, 101993. [Google Scholar] [CrossRef]
  21. Araujo, R.A.; Santini, T.; de Acypreste, R. A vertically integrated approach to increasing returns and cumulative causation. Struct. Change Econ. Dyn. 2023, 65, 49–58. [Google Scholar] [CrossRef]
  22. Peng, D.; Li, R.; Shen, C.; Beladi, H.; Chen, C. Industrial agglomeration, urban characteristics, and economic growth quality: The case of knowledge-intensive business services. Int. Rev. Econ. Financ. 2022, 81, 18–28. [Google Scholar] [CrossRef]
  23. Bao, X.; Gao, L.; Jun, Y.; Sun, J. Industrial agglomeration and firm exports: Micro-evidence based on input-output linkages. Econ. Model. 2023, 119, 106123. [Google Scholar] [CrossRef]
  24. Drucker, J.; Feser, E. Regional industrial structure and agglomeration economies: An analysis of productivity in three manufacturing industries. Reg. Sci. Urban Econ. 2015, 42, 1–14. [Google Scholar] [CrossRef]
  25. Schneider, C. Steel manufacturing clusters in a hydrogen economy—Simulation of changes in location and vertical integration of steel production in northwestern. J. Clean. Prod. 2022, 341, 130913. [Google Scholar] [CrossRef]
  26. Leith, P.; Warman, R.; Harwood, A.; Bosomworth, K.; Wallis, P. An operation on ‘the neglected heart of science policy’: Reconciling supply and demand for climate change adaptation research. Environ. Sci. Policy 2018, 82, 117–125. [Google Scholar] [CrossRef]
  27. Golfam, P.; Ashofteh, P.; Loáiciga, H.A. Modeling adaptation policies to increase the synergies of the water-climate-agriculture nexus under climate change. Environ. Dev. 2021, 37, 100612. [Google Scholar] [CrossRef]
  28. Chand, P.; Tarei, P.K. Do the barriers of multi-tier sustainable supply chain interact? A multi-sector examination using resource-based theory and resource-dependence theory. J. Purch. Supply Manag. 2021, 27, 100722. [Google Scholar] [CrossRef]
  29. Mao, Y.; Yang, B.; Lin, S. Trend and policy implications of regional industrial agglomeration: An empirical analysis of the manufacturing industries in Guangdong Province. Reg. Sci. Policy Pract. 2014, 6, 361–381. [Google Scholar] [CrossRef]
  30. Lin, B.; Zhang, A. Impact of government subsidies on total factor productivity of energy storage enterprises under dual-carbon targets. Energy Policy 2024, 187, 114046. [Google Scholar] [CrossRef]
  31. Wang, F.; Bu, H.; Wang, Y.; Yu, L.; Yin, X. Estimation of global waste smartphones and embedded critical raw materials: An industry life cycle perspective. Resour. Conserv. Recycl. 2023, 196, 107063. [Google Scholar] [CrossRef]
  32. Zhang, Y.; Li, X.; Song, Y.; Jiang, F. Can green industrial policy improve total factor productivity? Firm-level evidence from China. Struct. Change Econ. Dyn. 2021, 59, 51–62. [Google Scholar] [CrossRef]
  33. Wang, Y.; Quan, T.; Bai, Y.; Ran, R.; Hua, L. Influence and effect of industrial agglomeration on urban green total factor productivity–On the regulatory role of innovation agglomeration and institutional distance. Econ. Anal. Policy 2023, 78, 1158–1173. [Google Scholar] [CrossRef]
  34. Piron, M.; Wu, J.; Fedele, A.; Manzardo, A. Industry 4.0 and life cycle assessment: Evaluation of the technology applications as an asset for the life cycle inventory. Sci. Total Environ. 2024, 916, 170263. [Google Scholar] [CrossRef] [PubMed]
  35. Rossini, M.; Ahmadi, A.; Staudacher, A.P. Integration of lean supply chain and industry 40. Procedia Comput. Sci. 2024, 232, 1673–1682. [Google Scholar] [CrossRef]
  36. Wang, P.; Guo, K.; Yan, S. China’s total factor productivity: Estimation and global comparison. Q. J. Econ. Manag. 2023, 2, 1–26. [Google Scholar]
  37. Bressanelli, G.; Visintin, F.; Saccani, N. Circular Economy and the evolution of industrial districts: A supply chain perspective. Int. J. Prod. Econ. 2021, 243, 108348. [Google Scholar] [CrossRef]
  38. Guo, J.; Guo, B.; Zhou, J.; Wu, X. How does the ambidexterity of technological learning routine affect firm innovation performance within industrial clusters? The moderating effects of knowledge attributes. Technol. Forecast. Soc. Change 2020, 155, 119990. [Google Scholar] [CrossRef]
  39. O’Connor, J.; Liu, L. Shenzhen’s OCT-LOFT: Creative space in the city of design. City Cult. Soc. 2014, 5, 131–138. [Google Scholar] [CrossRef]
  40. Pathak, A.; Leu, S.; Robertson, M.L.; Siriwardana, M. Technical efficiency, scale effect, and trade liberalization: Evidence from the Nepalese manufacturing sector. Appl. Econ. 2025, 9, 934–9501. [Google Scholar] [CrossRef]
  41. Tian, K.; Dietzenbacher, E.; Jong-A-Pin, R. Global value chain participation and its impact on industrial upgrading. World Econ. 2022, 45, 1362–1385. [Google Scholar] [CrossRef]
  42. Bode, C.; Wagner, S.M. Structural drivers of upstream supply chain complexity and the frequency of supply chain disruptions. J. Oper. Manag. 2015, 36, 215–228. [Google Scholar] [CrossRef]
Figure 1. Theoretical path of industrial policy adaptation to high-quality development of the industrial chain.
Energies 18 02558 g001
Figure 2. Adaptation model of policy supply and demand.
Energies 18 02558 g002
Figure 3. Main links and gross profit of the PV industry chain.
Energies 18 02558 g003
Figure 4. Distribution of PV industry chain companies in Shenzhen.
Energies 18 02558 g004
Figure 5. TFP of listed companies in the PV industry chain in Shenzhen.
Energies 18 02558 g005
Figure 6. Patent holdings of PV enterprises in Shenzhen.
Energies 18 02558 g006
Figure 7. Concentration rate and intra-regional industrial dependence rate of PV industry in Shenzhen.
Energies 18 02558 g007
Figure 8. Comparison of the life cycle of the PV industry chain between Shenzhen and the whole country.
Energies 18 02558 g008
Table 1. Indicators and action directions for the compatibility of policies and industrial chain.
IndicatorsOptimization Direction of IndicatorsPolicy Adaptability Direction
Resource-dependence degreeRaisePositive
Allocation structure of production factorsRaisePositive
Industrial chain life cycleReduceNegative
Comprehensive indicators for industrial chain developmentRaisePositive
Table 2. Industrial development stage division based on the Pearson curve.
Period   t Inflection PointDevelopment Stage Increase   Speed   d Y / d t Output   Y
0 T 1 T 1 = lnB ln 2 + 3 k Formation period 0 Ak 6 0 A 3 + 3
T 1 T 2 T 2 = lnB k Early expansion Ak 6 Ak 4 A 3 + 3 0.5 A
T 2 T 3 T 3 = lnB + ln 2 + 3 k Late expansion Ak 4 Ak 6 0.5 A A 3 3
T 3 + Mature period Ak 6 0 A 3 3 A
Table 3. The assignment of the life cycle of the industrial chain.
Life CycleFormation PeriodEarly ExpansionLate ExpansionMature Period
Assignment (j)1234
Table 4. Number of supporting policies for Shenzhen’s PV industry from 2014 to 2022.
Policy Connotation201420152016201720182019202020212022
Resource-dependence improvement 1
Production factor-allocation structure improvement212111 1
Industrial chain life-cycle decline 1 11 112
Note: Prior to 2019, the main support for factors was fiscal subsidies; after 2019, it was mainly based on innovation performance.
Table 5. Observed output of main products in the PV industry chain and initial estimates of maximum production capacity.
Products2009 Output2014 Output2015 Output2021 OutputA Value
Polysilicon   ( 10 4 ton)(1, 2.0)(5, 13.6)(6, 24.2)(13, 50.6)59.17
Silicon wafer (GW)(1, 6.8)(5, 50.4)(6, 105)(13, 407.2)697.81
Battery cells (GW)(1, 4.9)(5, 33)(6, 72)(13, 197.9)270.24
Assembly (GW)(1, 4.4)(5, 35.6)(6, 75)(13, 181.8)218.54
Table 6. Nonlinear least-squares estimation results and inflection point time.
ProductsB Valuek ValueT1T2T3
Polysilicon (Y)67.260.37−1.614.9211.44
Silicon wafer (Y)785.600.351.338.1815.04
Battery cells (Y)304.610.360.166.9713.78
Assembly (Y)246.450.36−0.096.7013.48
Power station (Y)2953.240.352.969.8416.72
Table 7. Development stages of key products in China’s PV industry chain.
Life CycleFormation PeriodEarly ExpansionLate ExpansionMature Period
Polysiliconbefore 20072007~2014 2014~2021after 2021
Silicon waferbefore 20112011~20172017~2025after 2025
Battery cellsbefore 2010 2010~20162016~2023after 2023
Assemblybefore 2008 2008~20102010~2023after 2023
Power stationbefore 2016 2016~20232023~2030after 2030
Table 8. Test of the influence degree of concentration of Shenzhen’s PV industry.
Industrial Concentration DegreeComprehensive Indicator of Vertical IntegrationLife CycleTFPIntra-Regional Dependence
2013–20170.974 *** (7.409)0.977 ** (7.880)−0.158 (−1.525)0.869 * (−3.036)
2017–2021−0.978 (−8.176)−0.660 (−1.523)−0.260 (−0.466)−0.720 (−1.799)
Note: *, **, and *** indicate that the coefficient values are significant at the 10%, 5%, and 1% levels of confidence, respectively.
Table 9. Adaptability of Shenzhen’s PV industry policies.
20142015201620172018201920202021
Adaptation of industrial concentration policies0000----
Adaptation of resource-dependence policies-0-0-00-
Adaptation of industrial chain policies-000--++
Note: “0” indicates that supply and demand are matched, “-” indicates that policy supply is less than demand, and “+” indicates that policy supply exceeds demand. Owing to the difficulty in distinguishing the strength of the market and policy effects, we only judge the gap between policy supply and demand without measuring the specific adaptation strength.
Disclaimer/Publisher’s Note: The statements, opinions and data contained in all publications are solely those of the individual author(s) and contributor(s) and not of MDPI and/or the editor(s). MDPI and/or the editor(s) disclaim responsibility for any injury to people or property resulting from any ideas, methods, instructions or products referred to in the content.

