Article

Research on Seepage and Phase Change Characteristics During Multi-Cycle Injection–Production in Oil Reservoir-Based Underground Gas Storage

State Key Laboratory of Oil and Gas Reservoir Geology and Exploitation, Southwest Petroleum University, Chengdu 610500, China
*
Author to whom correspondence should be addressed.
Energies 2025, 18(10), 2550; https://doi.org/10.3390/en18102550
Submission received: 12 April 2025 / Revised: 9 May 2025 / Accepted: 12 May 2025 / Published: 14 May 2025
(This article belongs to the Section B: Energy and Environment)

Abstract

:
China’s natural gas demand is growing under the “dual carbon” goal. However, the peaking capacity of gas storage remains insufficient. Oil reservoir-based underground gas storage (UGS) has, thus, emerged as a critical research focus due to its potential for efficient capacity expansion. The complexity of seepage and phase change characteristics during the multi-cycle injection–production process has not been systematically elucidated. This study combines experimental and numerical simulations to examine the seepage and phase change characteristics. This study innovatively reveals the synergistic mechanism of permeability, pressure, and cycle. The control law of multi-factor coupling on the dynamic peaking capacity of UGS is first expounded. Oil–water mutual drive reduced oil displacement efficiency by 2.5–4.7%. Conversely, oil–gas mutual drive improved oil displacement efficiency by 3.0–4.5% and storage capacity by 4.7–6.5%. The fifth-cycle oil–gas mutual displacement in high-permeability cores (74 mD) under high pressure (22 MPa) exhibited reductions in irreducible water saturation (7.06 percentage points) and residual oil saturation (6.38 percentage points) compared with the first-cycle displacement in low-permeability cores (8.36 mD) under low pressure (16 MPa). Meanwhile, the gas storage capacity increased by 13.44 percentage points, and the displacement efficiency improved by 10.62 percentage points. Multi-cycle huff-and-puff experiments and numerical simulations revealed that post-depletion multi-cycle huff-and-puff operations can enhance the oil recovery factor by 2.74–4.22 percentage points compared to depletion. After five-cycle huff-and-puff, methane content in the produced gas increased from 80.2% to 87.3%, heavy components (C8+) in the remaining oil rose by 2.7%, and the viscosity of the remaining oil increased from 2.0 to 4.6 mPa·s. The deterioration of the physical properties of the remaining oil leads to a reduction in the recovery factor in the cycle stage. This study elucidates seepage mechanisms and phase evolution during multi-cycle injection–production, demonstrating the synergistic optimization of high-permeability reservoirs and high-pressure injection techniques for enhanced gas storage design and efficiency.

1. Introduction

Driven by the goals of the “dual carbon” strategy, China’s energy structure is rapidly transitioning to cleaner sources of energy [1]. As a low-carbon fossil energy source, the production and consumption of natural gas have surged significantly in recent years [2,3]. Natural gas production increased from 274 × 108 m3 in 2000 to 1925 × 108 m3 in 2020, and consumption increased significantly from 247 × 108 m3 to 3262 × 108 m3 over the same period [4,5,6]. However, the proportion of natural gas in primary energy consumption is only 8.7%, significantly lower than the average of 23.87% in developed countries. Consumption is projected to continue growing at a high rate over the next decade [7,8]. The seasonal imbalance between the supply and demand of natural gas is becoming increasingly prominent. As a core facility for regulating peak and off-peak demand, gas storage plays a critical role in ensuring energy supply security [9]. The main types of natural gas storage include UGS, liquefied natural gas (LNG), storage tanks, and pipeline storage. Due to the large storage capacity, low gas storage costs, high safety, and reliability, UGS facilities are widely utilized worldwide [10,11,12]. Among the three primary geological formations (depleted oil and gas reservoirs, saline aquifers, and salt caverns), the present study prioritizes depleted oil and gas reservoirs for three reasons [13]. Firstly, based on historical oil and gas exploration data, depleted reservoirs possess favorable geological structural characteristics, significantly reducing exploration uncertainties. Secondly, depleted oilfields typically retain 60–80% of reusable wellbores and surface facilities, which lowers capital expenditures compared with new aquifer projects. Thirdly, the seal integrity of depleted reservoirs has been verified over decades of hydrocarbon containment, whereas saline aquifers require extensive caprock integrity verification. Although salt caverns offer higher storage rates, their geographical scarcity and high costs limit their widespread application. At present, the peak shaving capacity of underground gas storage facilities in China is severely insufficient. Furthermore, the availability of depleted gas reservoirs that are suitable for storage site selection in the eastern regions, where the demand for natural gas peak shaving is high, is limited [14,15,16]. Therefore, there is an urgent need to develop oil reservoir-based gas storage to address the peaking gap. Oil reservoir-based UGS offers high-capacity expansion potential due to the strong closure of gas-cap reservoirs and native natural gas seals. However, the complexity of seepage characteristics and phase behavior during multi-cycle injection and extraction is significantly higher than that of traditional gas storage systems [17,18,19]. Consequently, the injection and recovery capacity of gas storage reservoirs and the evaluation of reservoir capacity face significant challenges. Systematic research is urgently needed to guide engineering practices.
Numerous studies have been conducted on the seepage mechanisms and fluid phase behavior during multi-cycle injection–production processes in reservoir-based UGS. Wan et al. (2024) [20] developed a mathematical model and experimental simulations to characterize oil–gas phase behavior in the Shuang 6 gas storage, revealing that gas injection primarily induces evaporation–extraction effects on the oil rim, increasing the light component content in the gas cap and reducing heavy components in the oil phase. During stable operation, phase behavior transitions to dominance via dissolution–diffusion, with gradual changes in gas density and oil viscosity. Through multi-cycle experiments on condensate gas reservoirs, Yong et al. (2021) [21] demonstrated that injected gas significantly enhances condensate recovery (42% after five cycles), with evaporative effects dominating the early cycles and condensate saturation approaching zero in later stages. Sun et al. (2018) [22] proposed a capacity design method based on effective gas-bearing pores, validated by field data that showed a 13-fold increase in peak-shaving capacity after five cycles. Zhang et al. (2022) [23] developed a novel experimental method for oil-reservoir-converted UGS, demonstrating that higher initial oil saturation correlates with stronger capacity expansion (33.76% after five cycles) and improved oil recovery. Huan et al. (2023) [24] identified enhanced permeability through microfractures and migration of fines during multicycle gas flushing, suggesting a synergistic stage of capacity expansion and oil recovery. Liu et al. (2024) [25] conducted an oil–gas two-phase seepage experiment for oil–ring condensate gas reservoirs and found that permeability differences significantly affected the efficiency of oil–gas mutual displacement, necessitating optimization of reservoir screening criteria to improve the operational efficiency of gas reservoirs. Regarding multiphase flow hysteresis, Wang et al. (2022) [26] confirmed hysteresis effects in three–phase relative permeability under high-speed injection–production, emphasizing the need for hysteresis models to accurately simulate fluid distribution. Li et al. (2021) [27] revealed the impact of stress sensitivity on permeability, indicating that reservoirs with permeability below 0.3 mD are unsuitable for UGS due to irreversible permeability loss in early cycles. Ren et al. (2024) [28] improved material balance equations and nodal analysis to dynamically evaluate reserves and injection–production capacity, achieving high consistency with field data. Long et al. (2023) [29] observed reduced dissolved gas–oil ratios (162.5 m3/m3) and residual oil saturation (1.7%) in oil–rim condensate reservoirs after five cycles, highlighting their enhanced storage capacity. Gao et al. (2023) [30] numerically analyzed the Sizhan gas storage, revealing minimal water invasion (1.02 × 10⁴ m3) and stable gas–water interfaces, confirming its operational reliability. Geng et al. (2024) [31] demonstrated a 4.84–7.26% capacity expansion in high and low permeability cores through synergistic gas–liquid displacement experiments, which aligned with numerical simulations. Jiao et al. (2022) [32] compared 1 D core and 2 D plate experiments, proposing planar radial flow models to accurately describe the multiphase seepage laws in UGS. Gao et al. (2023) [33] visualized hydrogen storage processes, identifying increased gas saturation (73.89%) but reduced pore utilization (40.57%) due to phase trapping, with modifications to the Carlson model reducing simulation errors to 8.51%. Existing research has predominantly examined single-parameter influences (permeability, pressure, cycle) in isolation, while quantitative synergy analyses among these three critical factors remain absent. This methodological gap introduces prediction biases in dynamic peak–load capacity assessments for gas storage. While phase transition characteristics have been qualitatively described, conventional experimental approaches lack real-time monitoring capabilities for continuous cycle oil–gas–water tri-phase component dynamics. Therefore, it is imperative to develop multi-factor coupling physical experiments and numerical simulations to address these challenges.
This study systematically investigates the seepage characteristics and phase behavior of underground gas storage (UGS) in depleted oil reservoirs during multi-cycle injection–production. Through integrating experimental and numerical simulations, we aim to elucidate the synergistic effects of permeability, pressure, and operational cycles on gas storage performance.

2. Materials and Methods

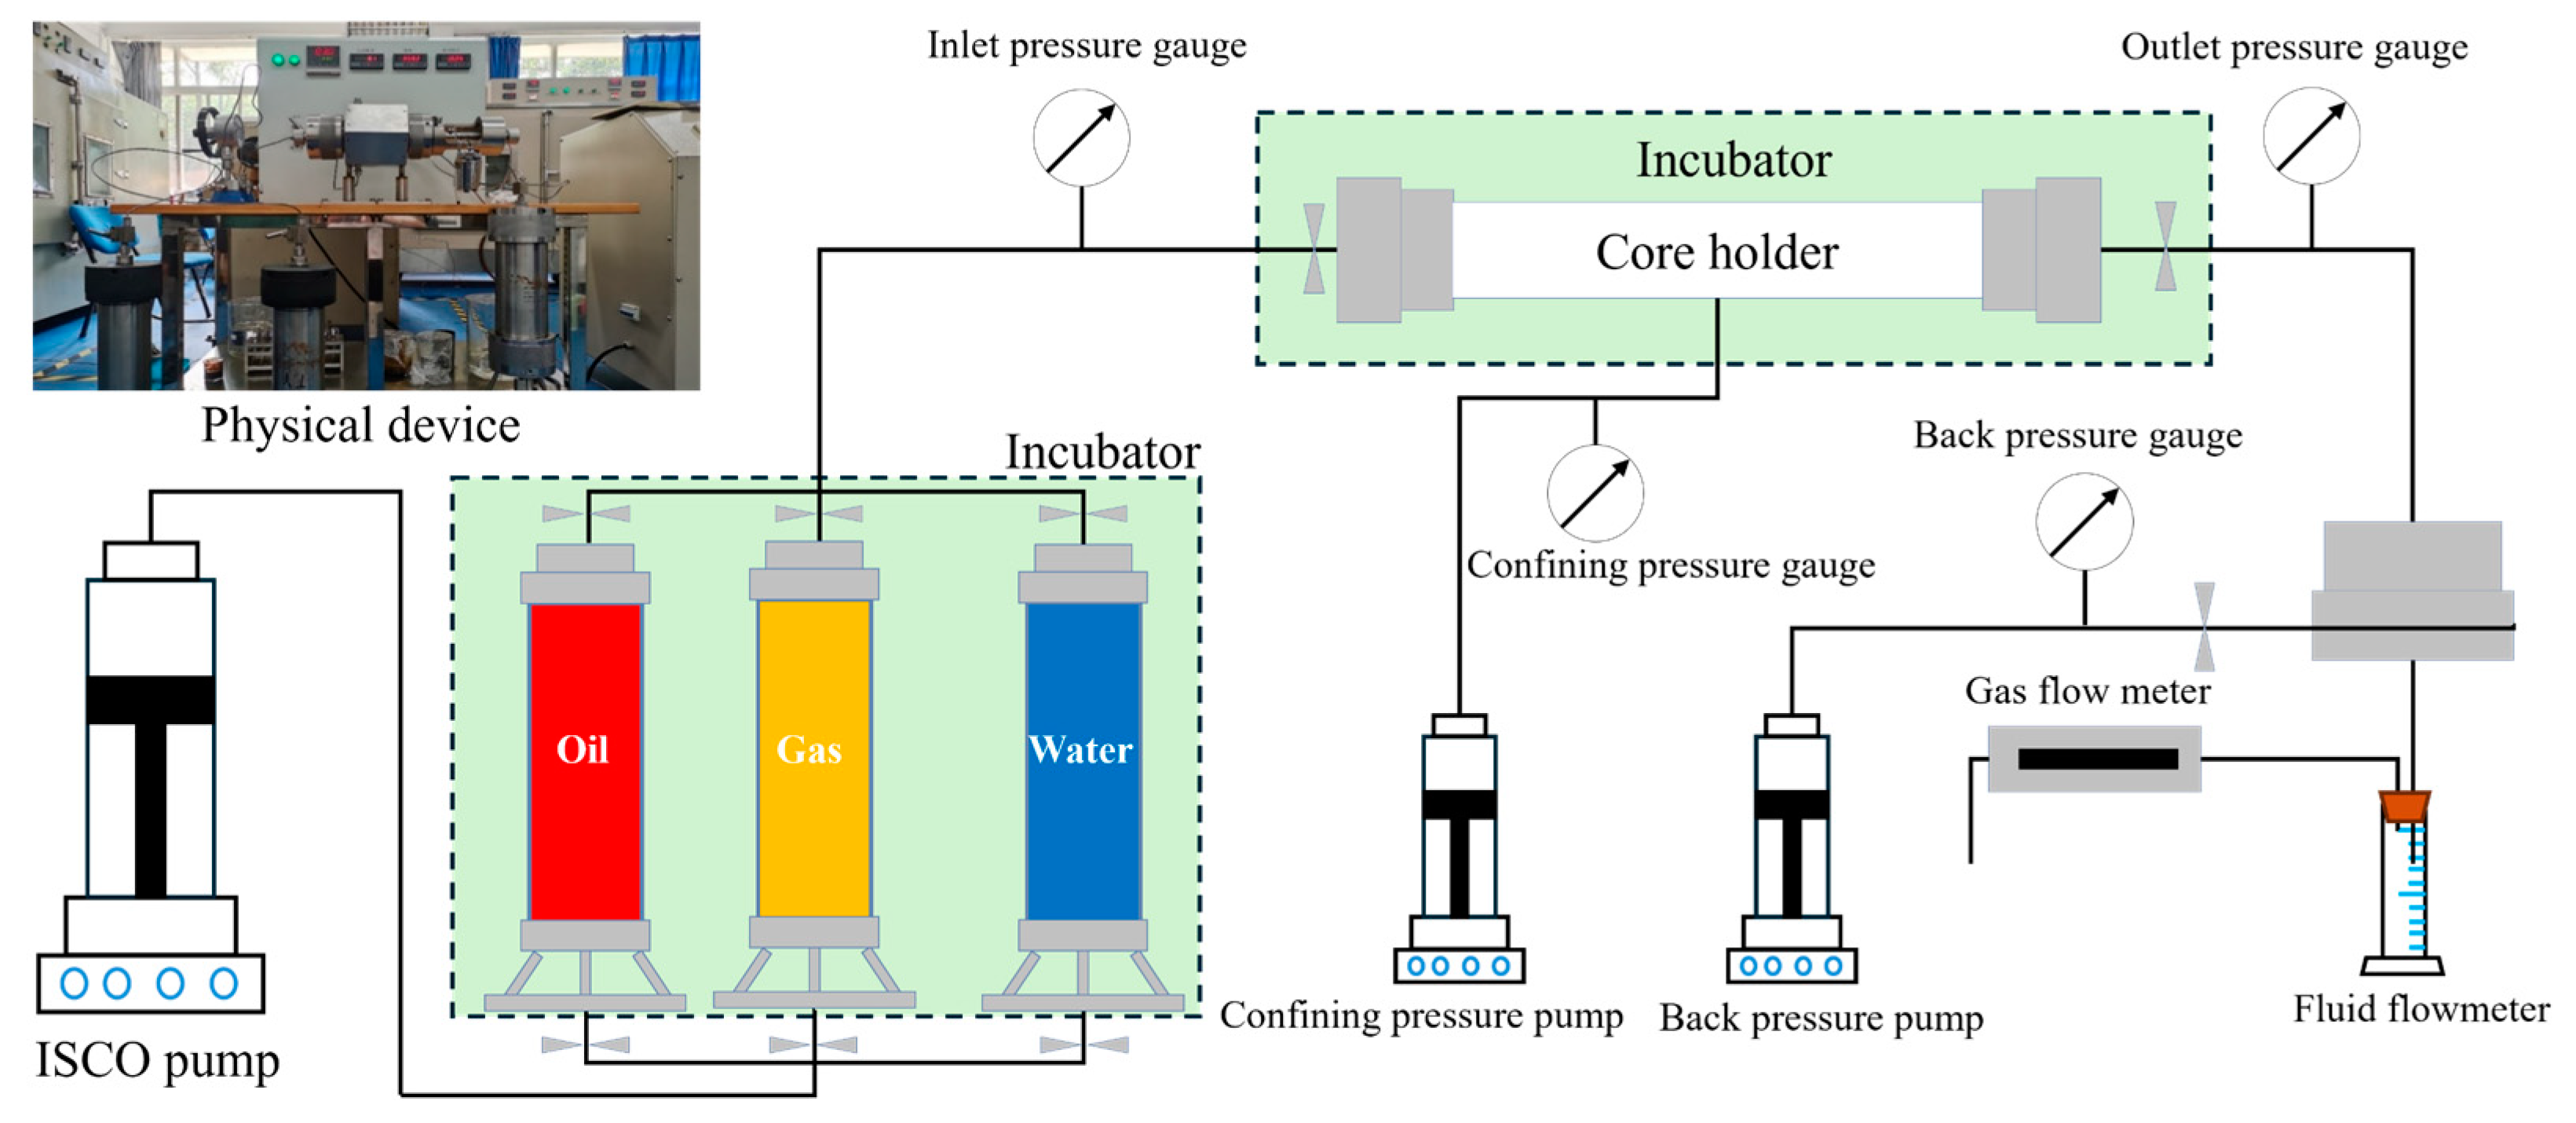
2.1. Multi-Cycle Mutual Drive Experiments

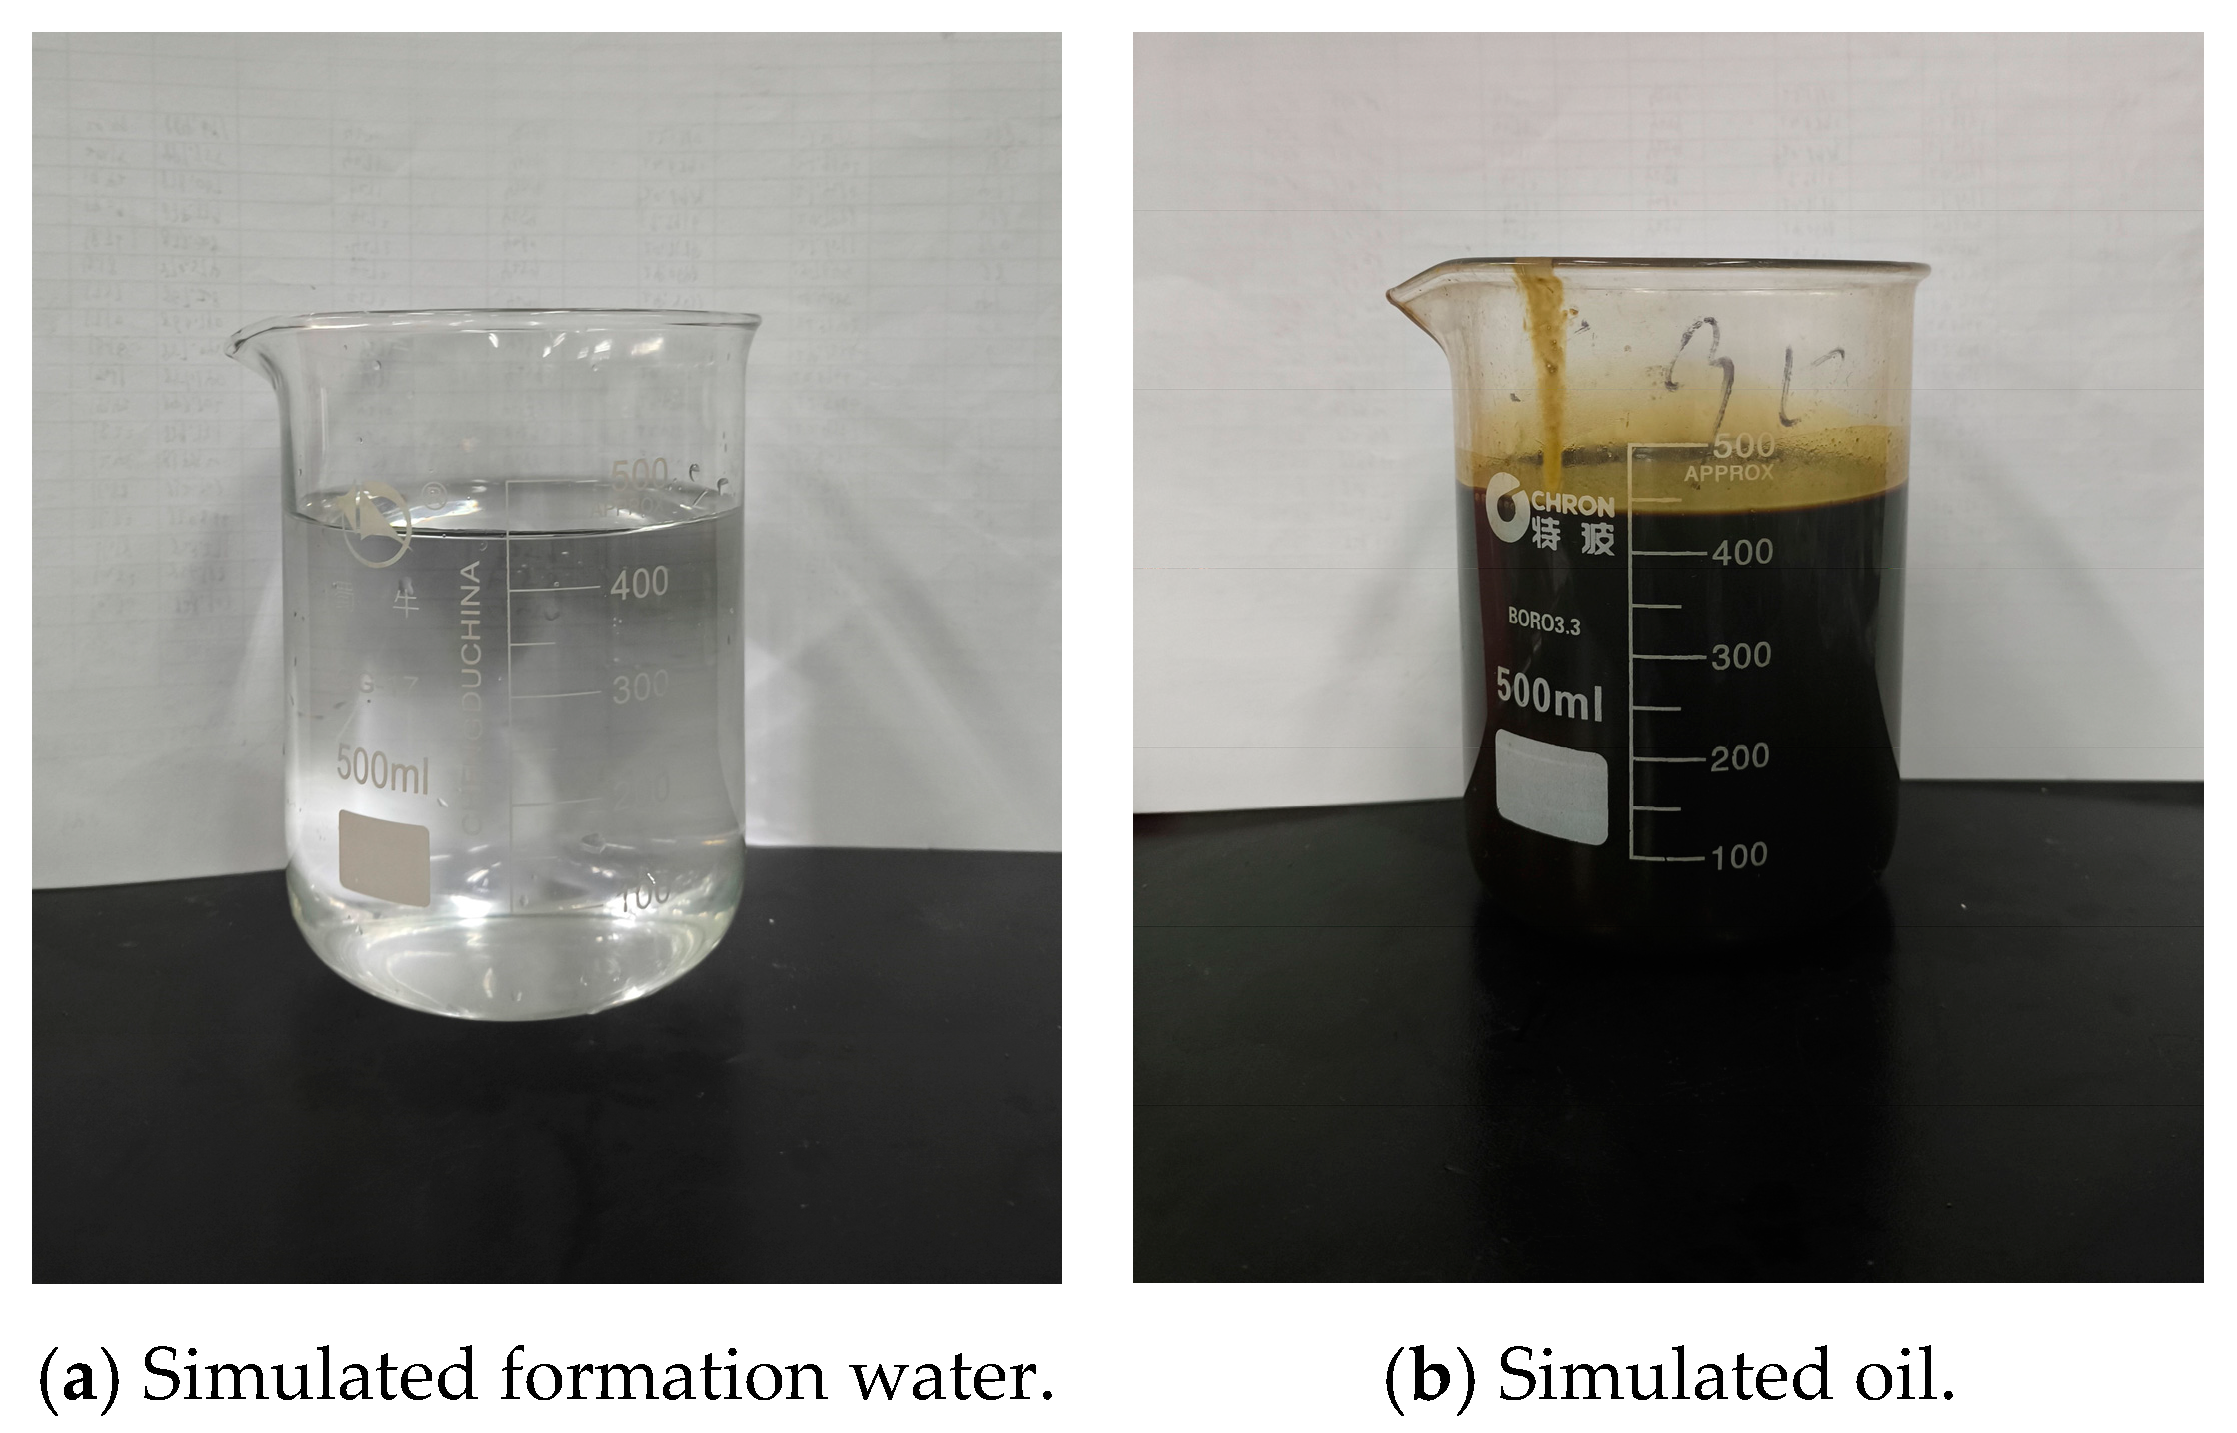
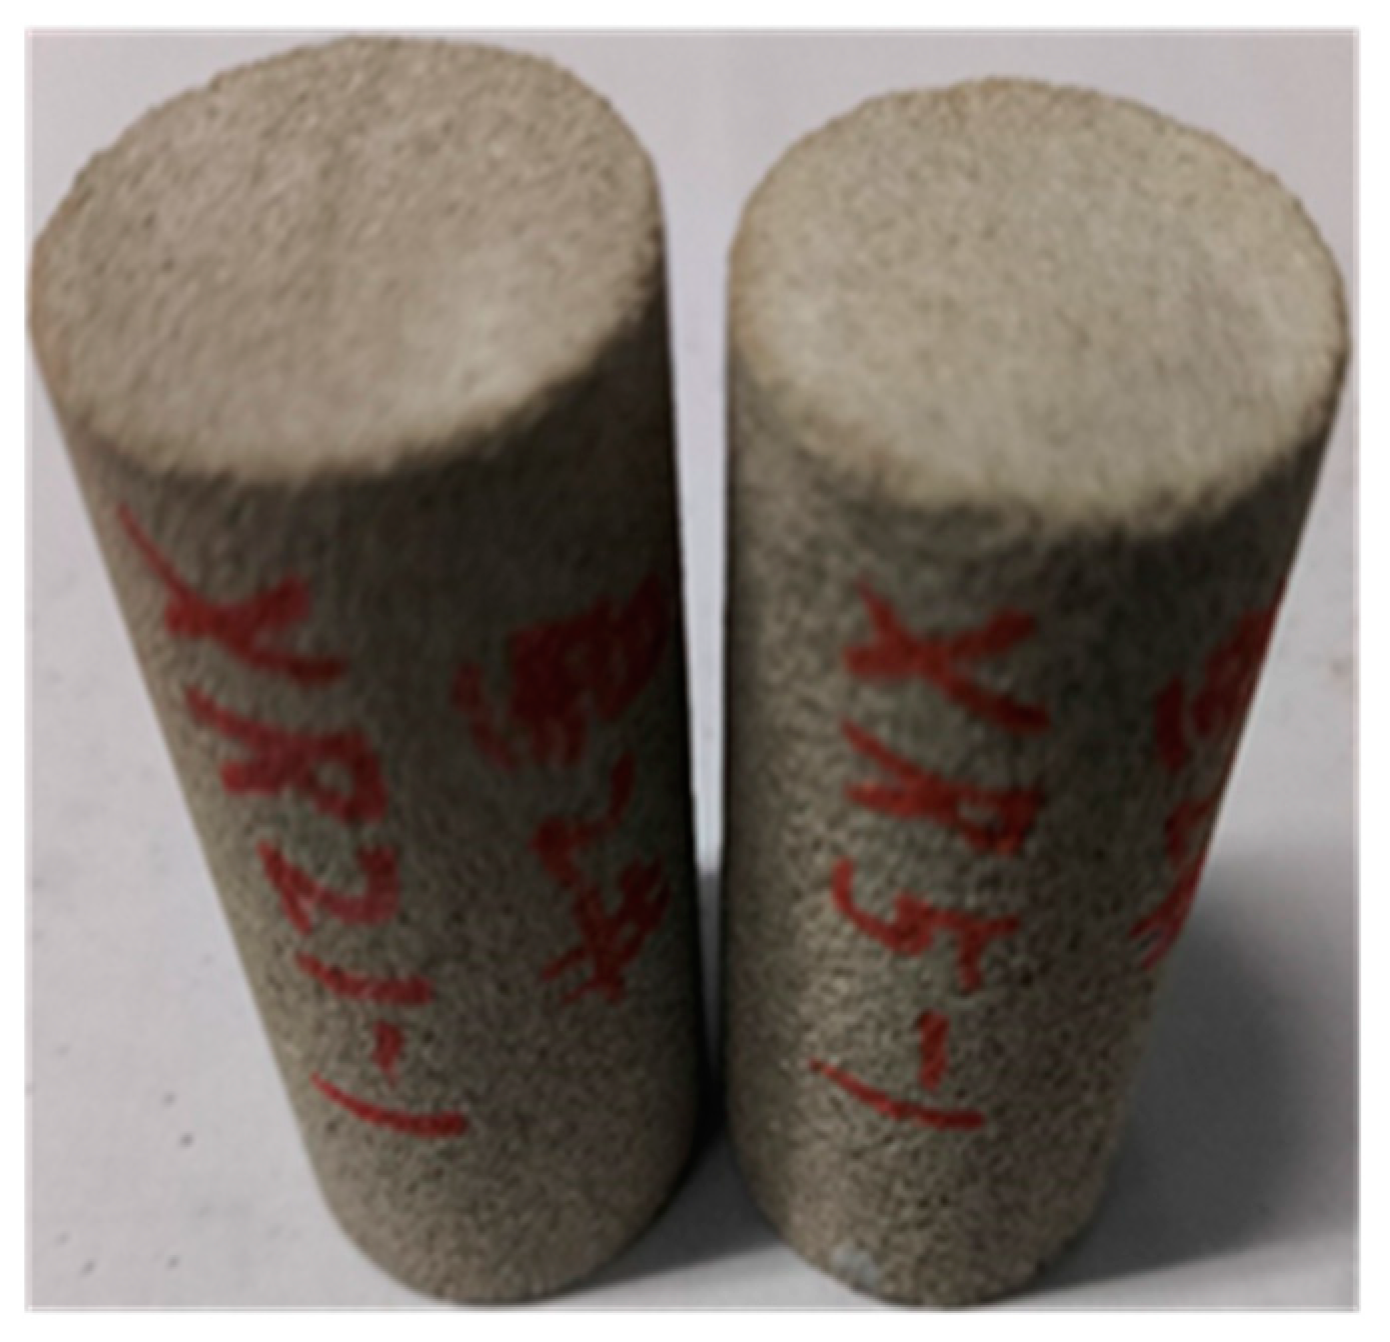
2.1.1. Experimental Material

The core obtained from the site was extracted, cleaned, and dried in accordance with the national standard GB/T 28912-2012 [34]. The core samples were subsequently subjected to measurements of various parameters, including length, diameter, dry weight, porosity, and permeability.
(1) Experimental Core
Core samples representing various reservoir types (high, medium, and low permeability) were chosen for this experiment. The experimental cores are shown in Figure 1. The basic characteristics of these samples are listed in Table 1. Following the GB/T 28912-2012 standard for determining the relative permeability of two-phase fluids in rocks, non-stationary oil–water, oil–gas, and gas–water relative permeability tests were conducted on the cores over three test cycles.
(2) Simulated Formation Water
After chemical analysis of the produced formation water in the study area, the simulated formation water with the same mineralization and water-based composition was prepared based on the concentration of each ion. The stratigraphic water analysis data are shown in Table 2. The stratigraphic water is shown in Figure 2a.
(3) Simulated Oil
Based on the reservoir crude oil viscosity (1.7 mPa·s to 2.4 mPa·s), kerosene and ground oil were used to formulate the simulated oil with a viscosity consistent with subsurface conditions. The simulated oil is shown in Figure 2b.

2.1.2. Experimental Procedure

The experimental flow chart is shown in Figure 3. The experimental steps for the oil–water inter-drive test are as follows (oil–gas and gas–water mutual drives are the same as oil–water mutual drives):
(a)
The determination of oil-phase permeability in the bound water state, after driving off up to 10 times the pore volume with crude oil, was followed by measuring the effective permeability of the oil phase for three consecutive measurements with a relative deviation of less than 3%.
(b)
According to the replacement conditions, choose the appropriate replacement rate (0.2 mL/min) or replacement pressure difference to perform the water-driven oil test.
(c)
Accurately record the time of water sighting, cumulative oil production at the time of water sighting, cumulative fluid production, the rate of repulsion, and the differential pressure of repulsion at both ends of the rock sample.
(d)
At the early stage of seeing water, encrypt the record, select the time interval based on the amount of oil, and gradually increase the time interval as the amount of oil decreases. When the water content reaches 99.95% or after injecting water at 30 times the pore volume, determine the water-phase permeability under residual oil conditions.
(e)
Conduct oil and water repelling experiments, using a repelling pump to repel the core at a certain rate (0.2 mL/min) until no water comes out.
(f)
Then, repeat steps c to e for three additional oil–water mutual drive experiments to conclude the experiment.

2.2. Multi-Cycle Huff and Puff Experiments

2.2.1. Experimental Material

(1) Experimental Core
Two core samples with high and low permeability were selected in this experiment. The experimental cores are shown in Figure 4. The basic characteristics are shown in Table 3.
(2) Simulated Formation Water
The simulated formation water was the same as that used during the preparation process in Section 2.1.1.
(3) Simulated Oil
The sample was prepared under the original formation conditions (83 °C, 18.92 MPa) with field sampling of oil and associated gas. The gas–oil ratio of simulated oil was 203 m3/m3, consistent with the formation oil (200 m3/m3).

2.2.2. Experimental Procedure

The experimental procedure is as illustrated in Figure 3, with the addition of closing the valve at the outlet of the core. The experimental steps were as follows:
(a)
Vacuum the core to saturate formation water. Then, drive the water with ground–degassed oil at formation temperature and pressure to establish bound water saturation.
(b)
Drive off the ground-degassed oil with formulated crude oil at formation pressure to establish original formation fluid conditions, and then carry out depletion mining to 3.8 MPa.
(c)
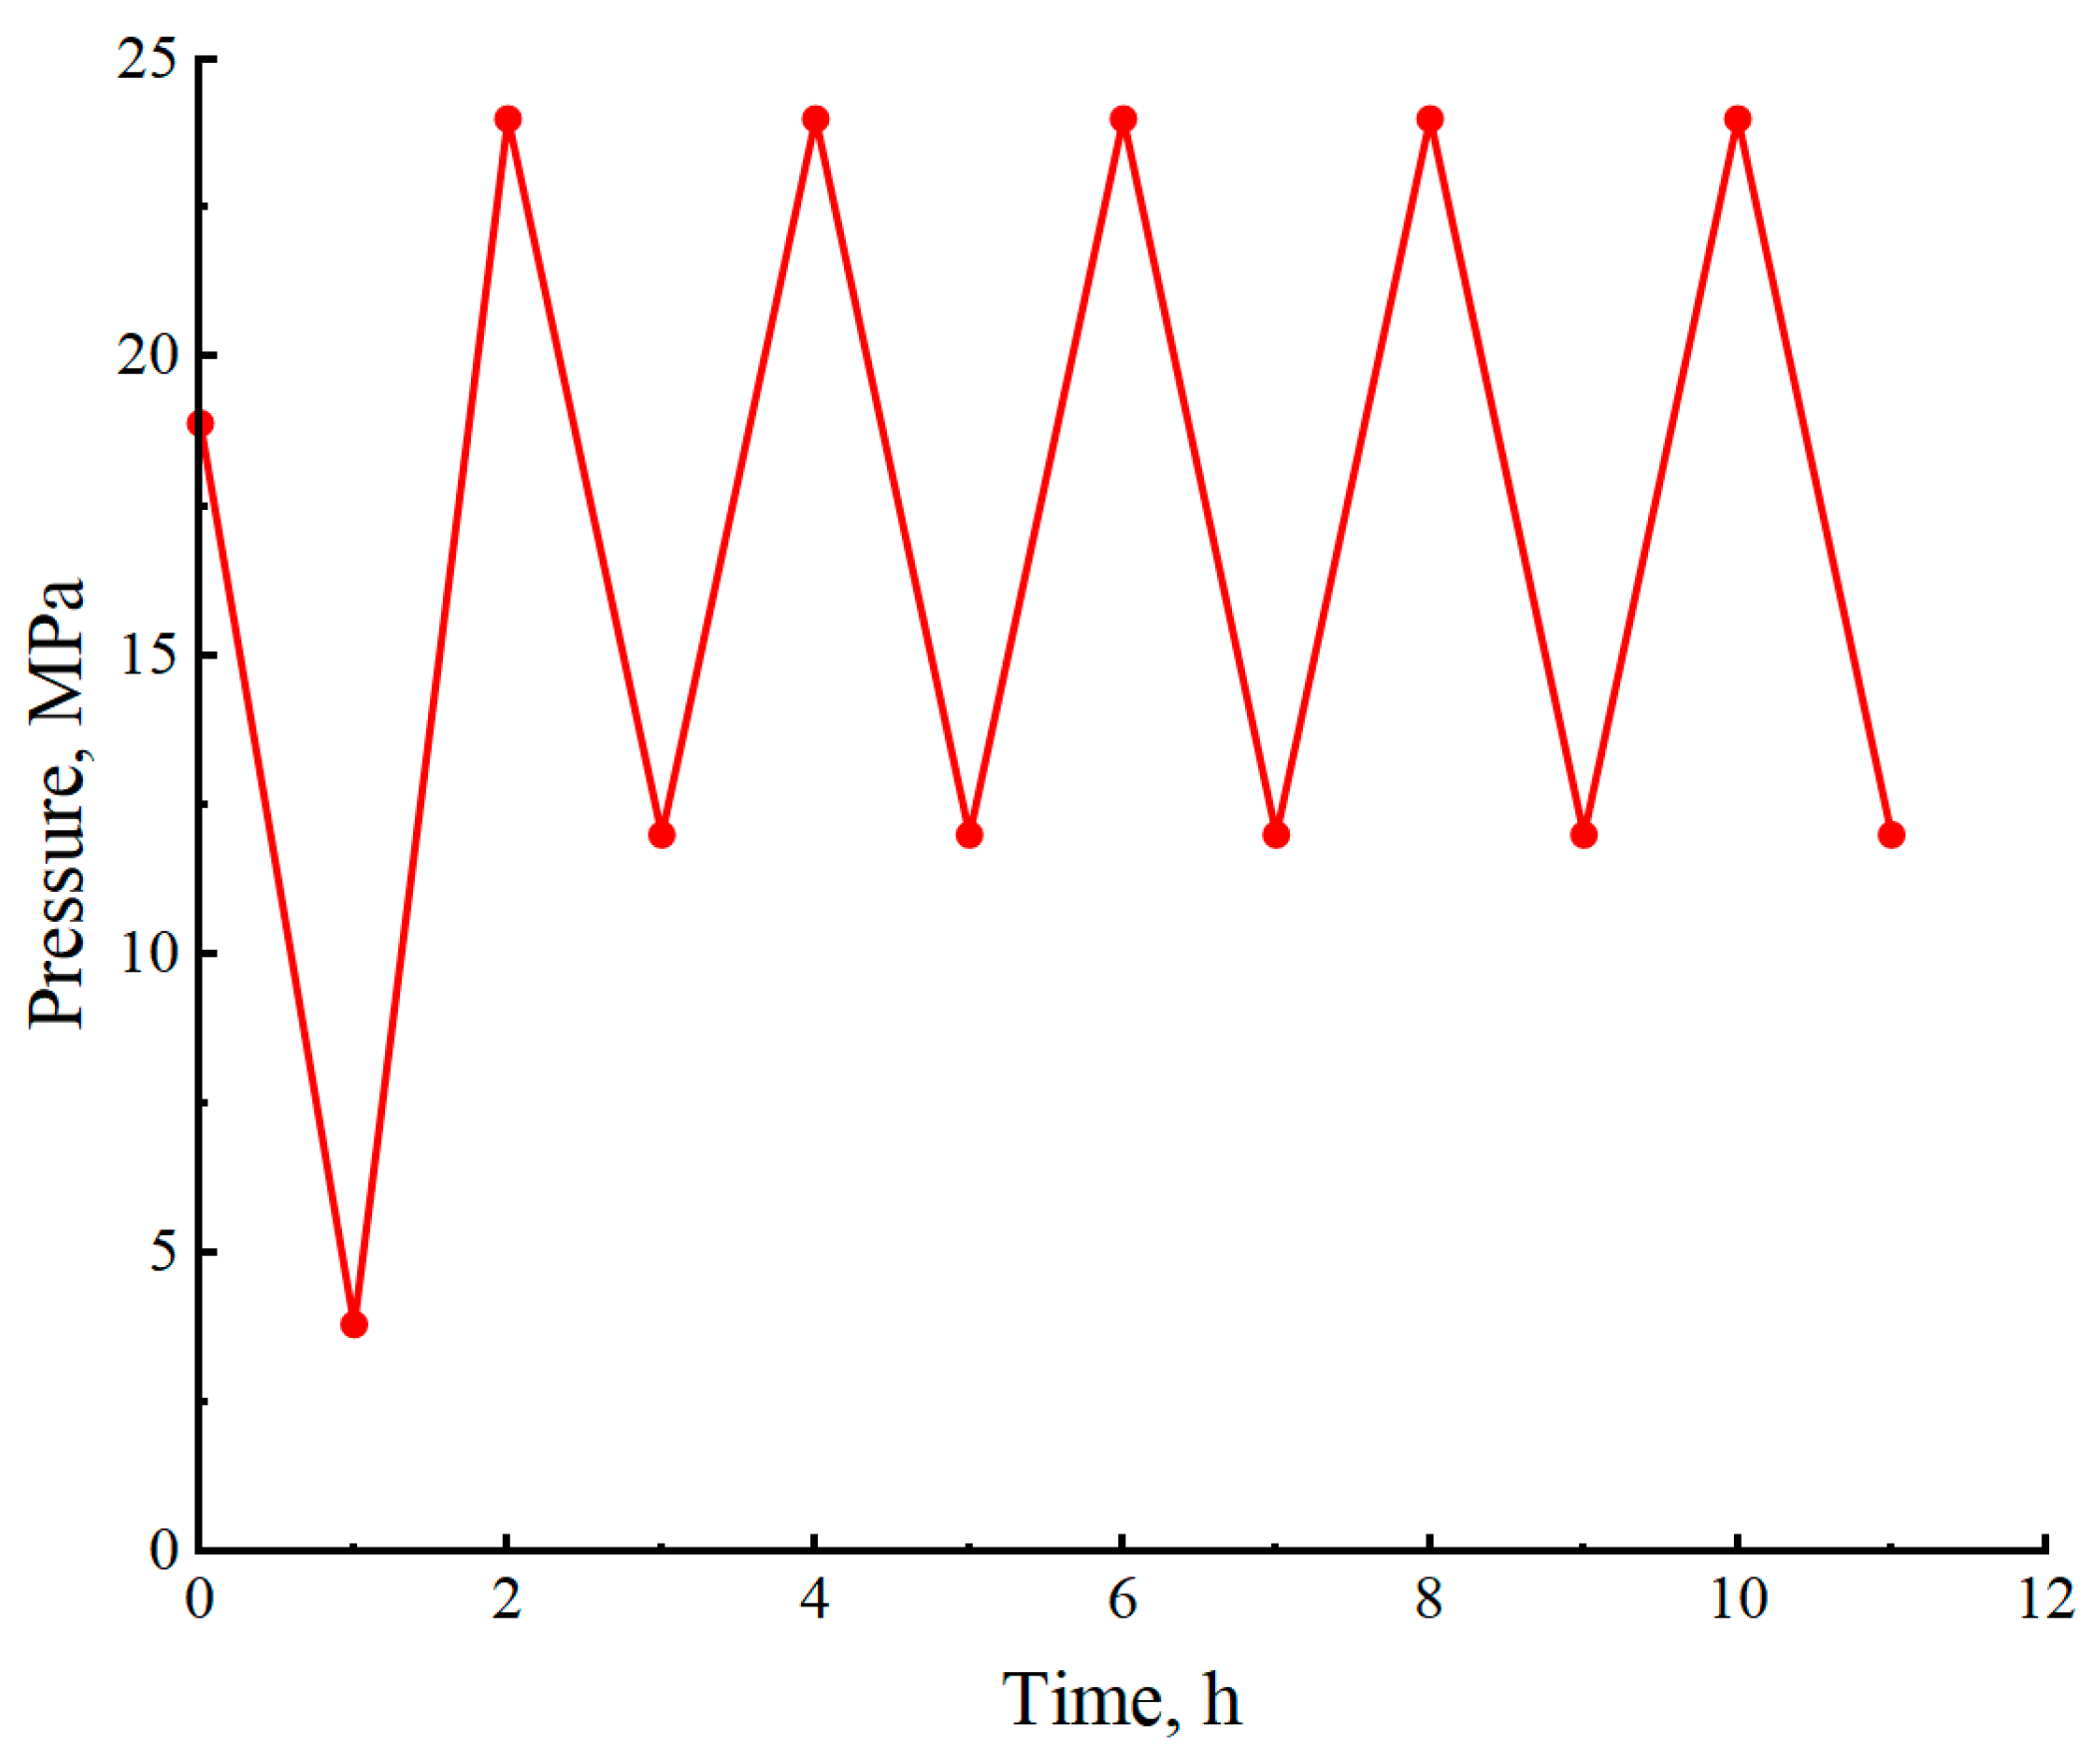
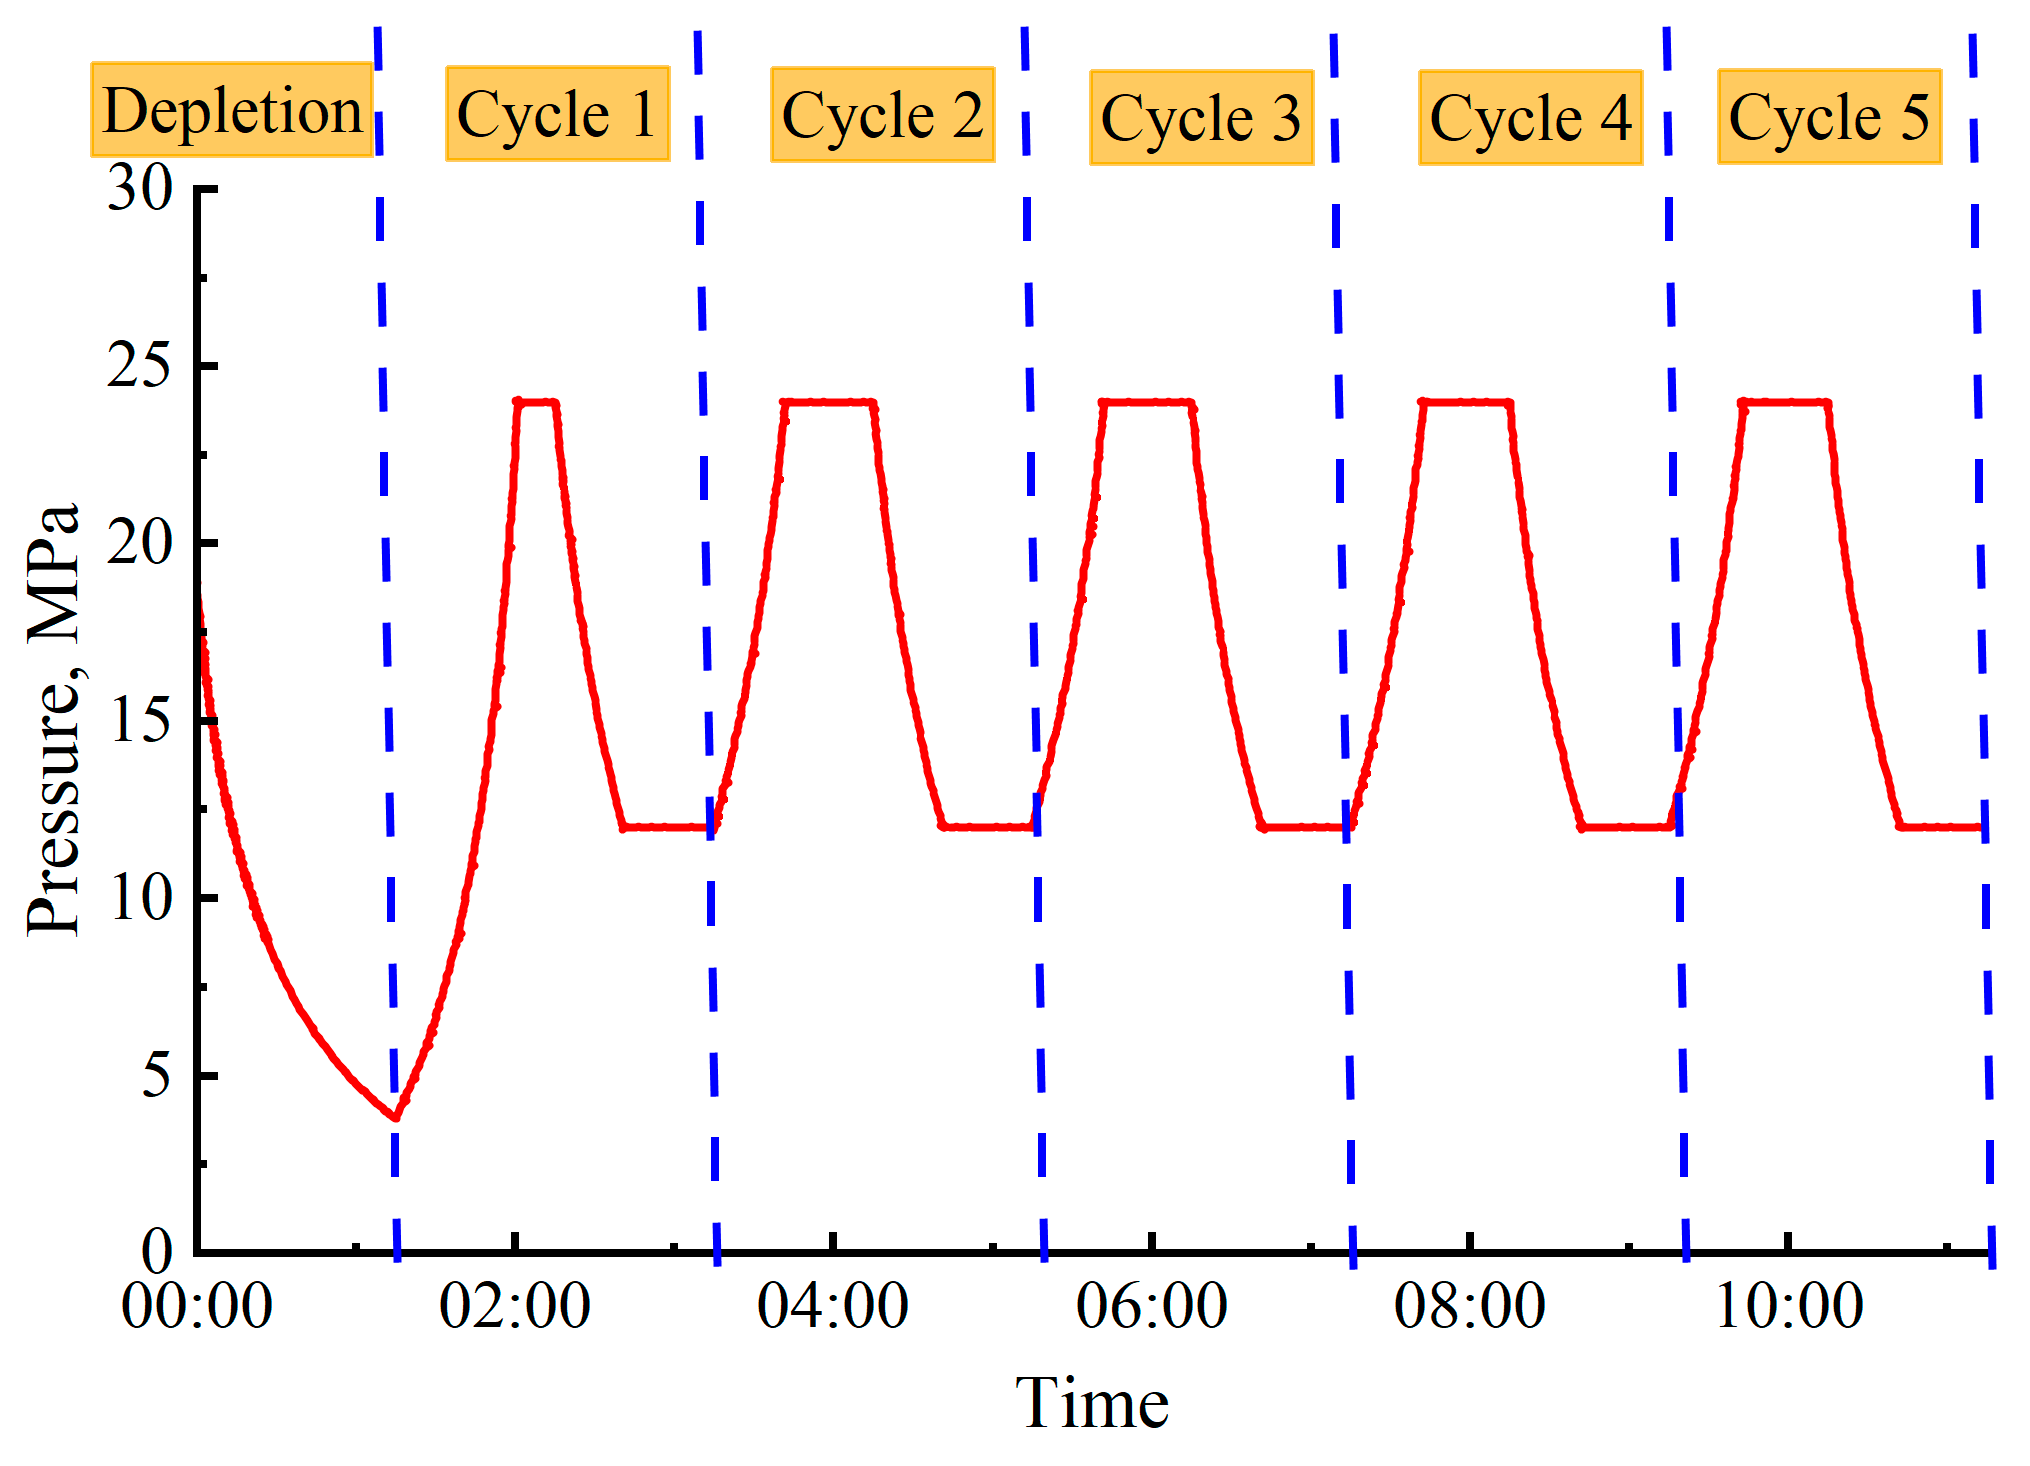
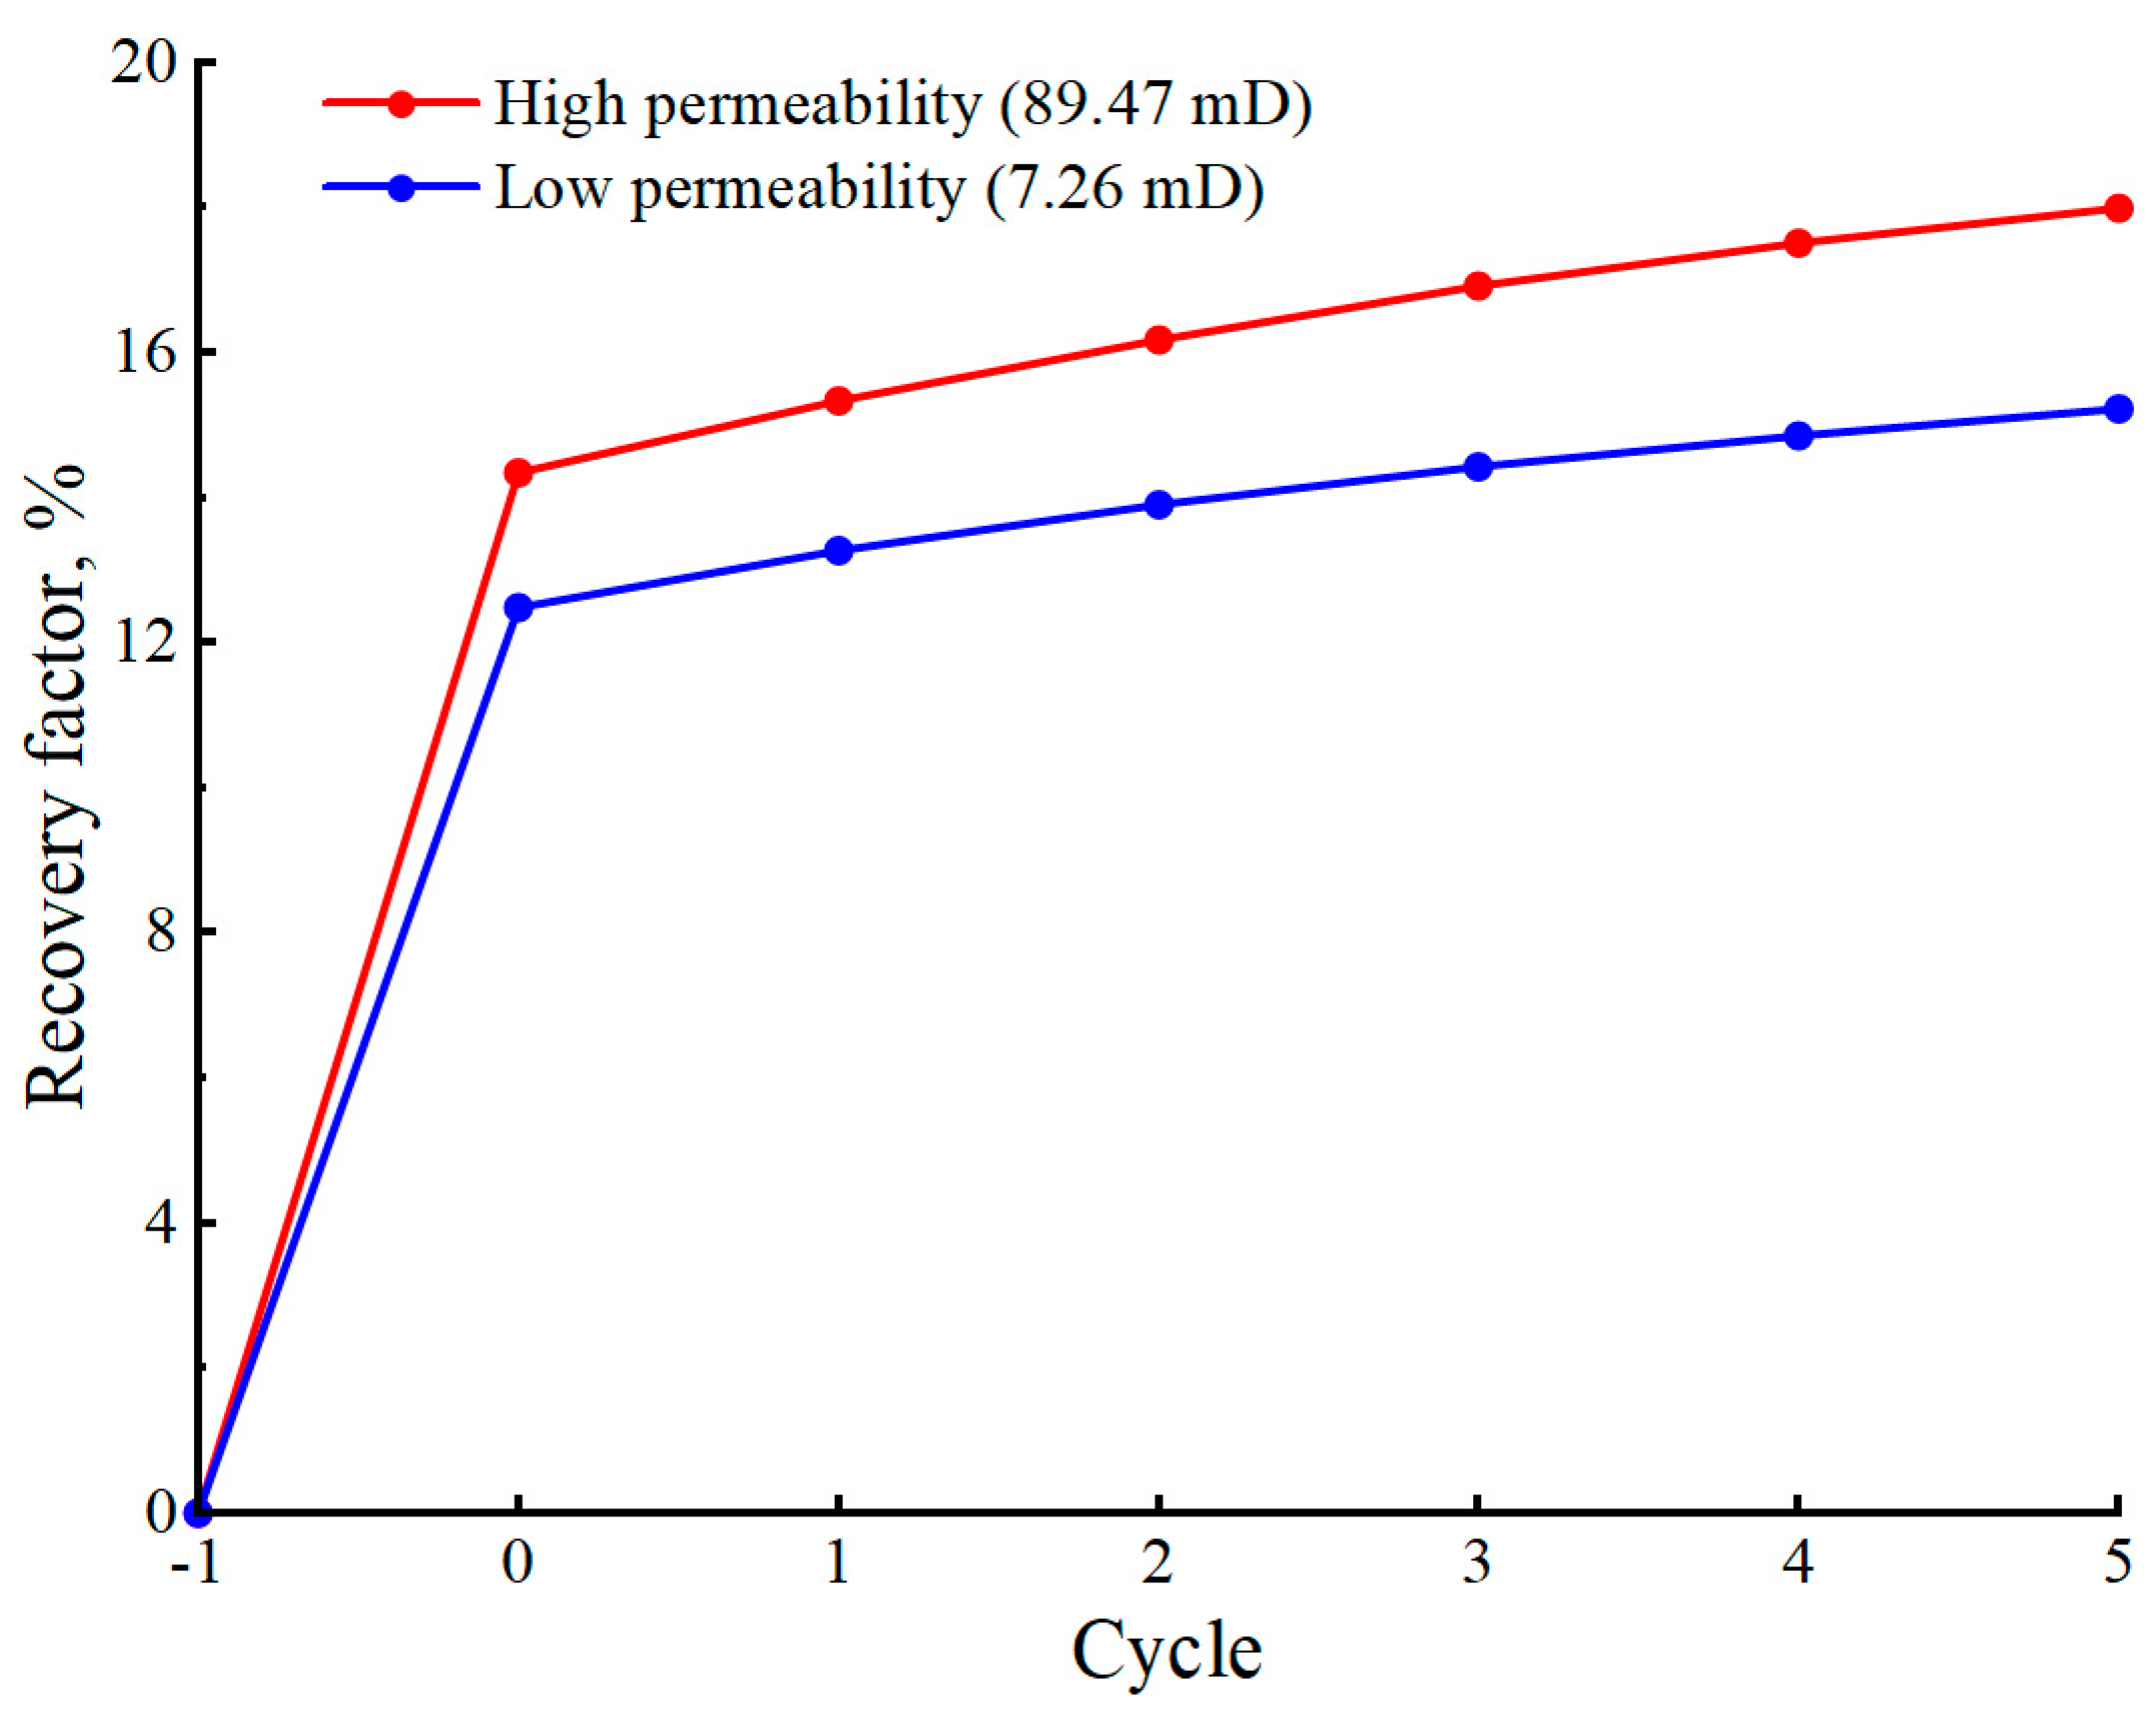
Inject the remaining fluid extracted to 3.8 MPa with natural gas to 24 MPa and then extract to 12 MPa (the actual operational pressure limits of the gas storage reservoir are defined as 24 MPa (upper limit) and 12 MPa (lower limit), respectively). Record the volume of gas and oil produced in each iteration, followed by compositional analysis of both the produced gas and oil. We repeated this procedure for five cycles. The multi-cycle huff and puff pressure variation curve is shown in Figure 5.

2.3. Numerical Simulation of Multi-Cycle Huff and Puff
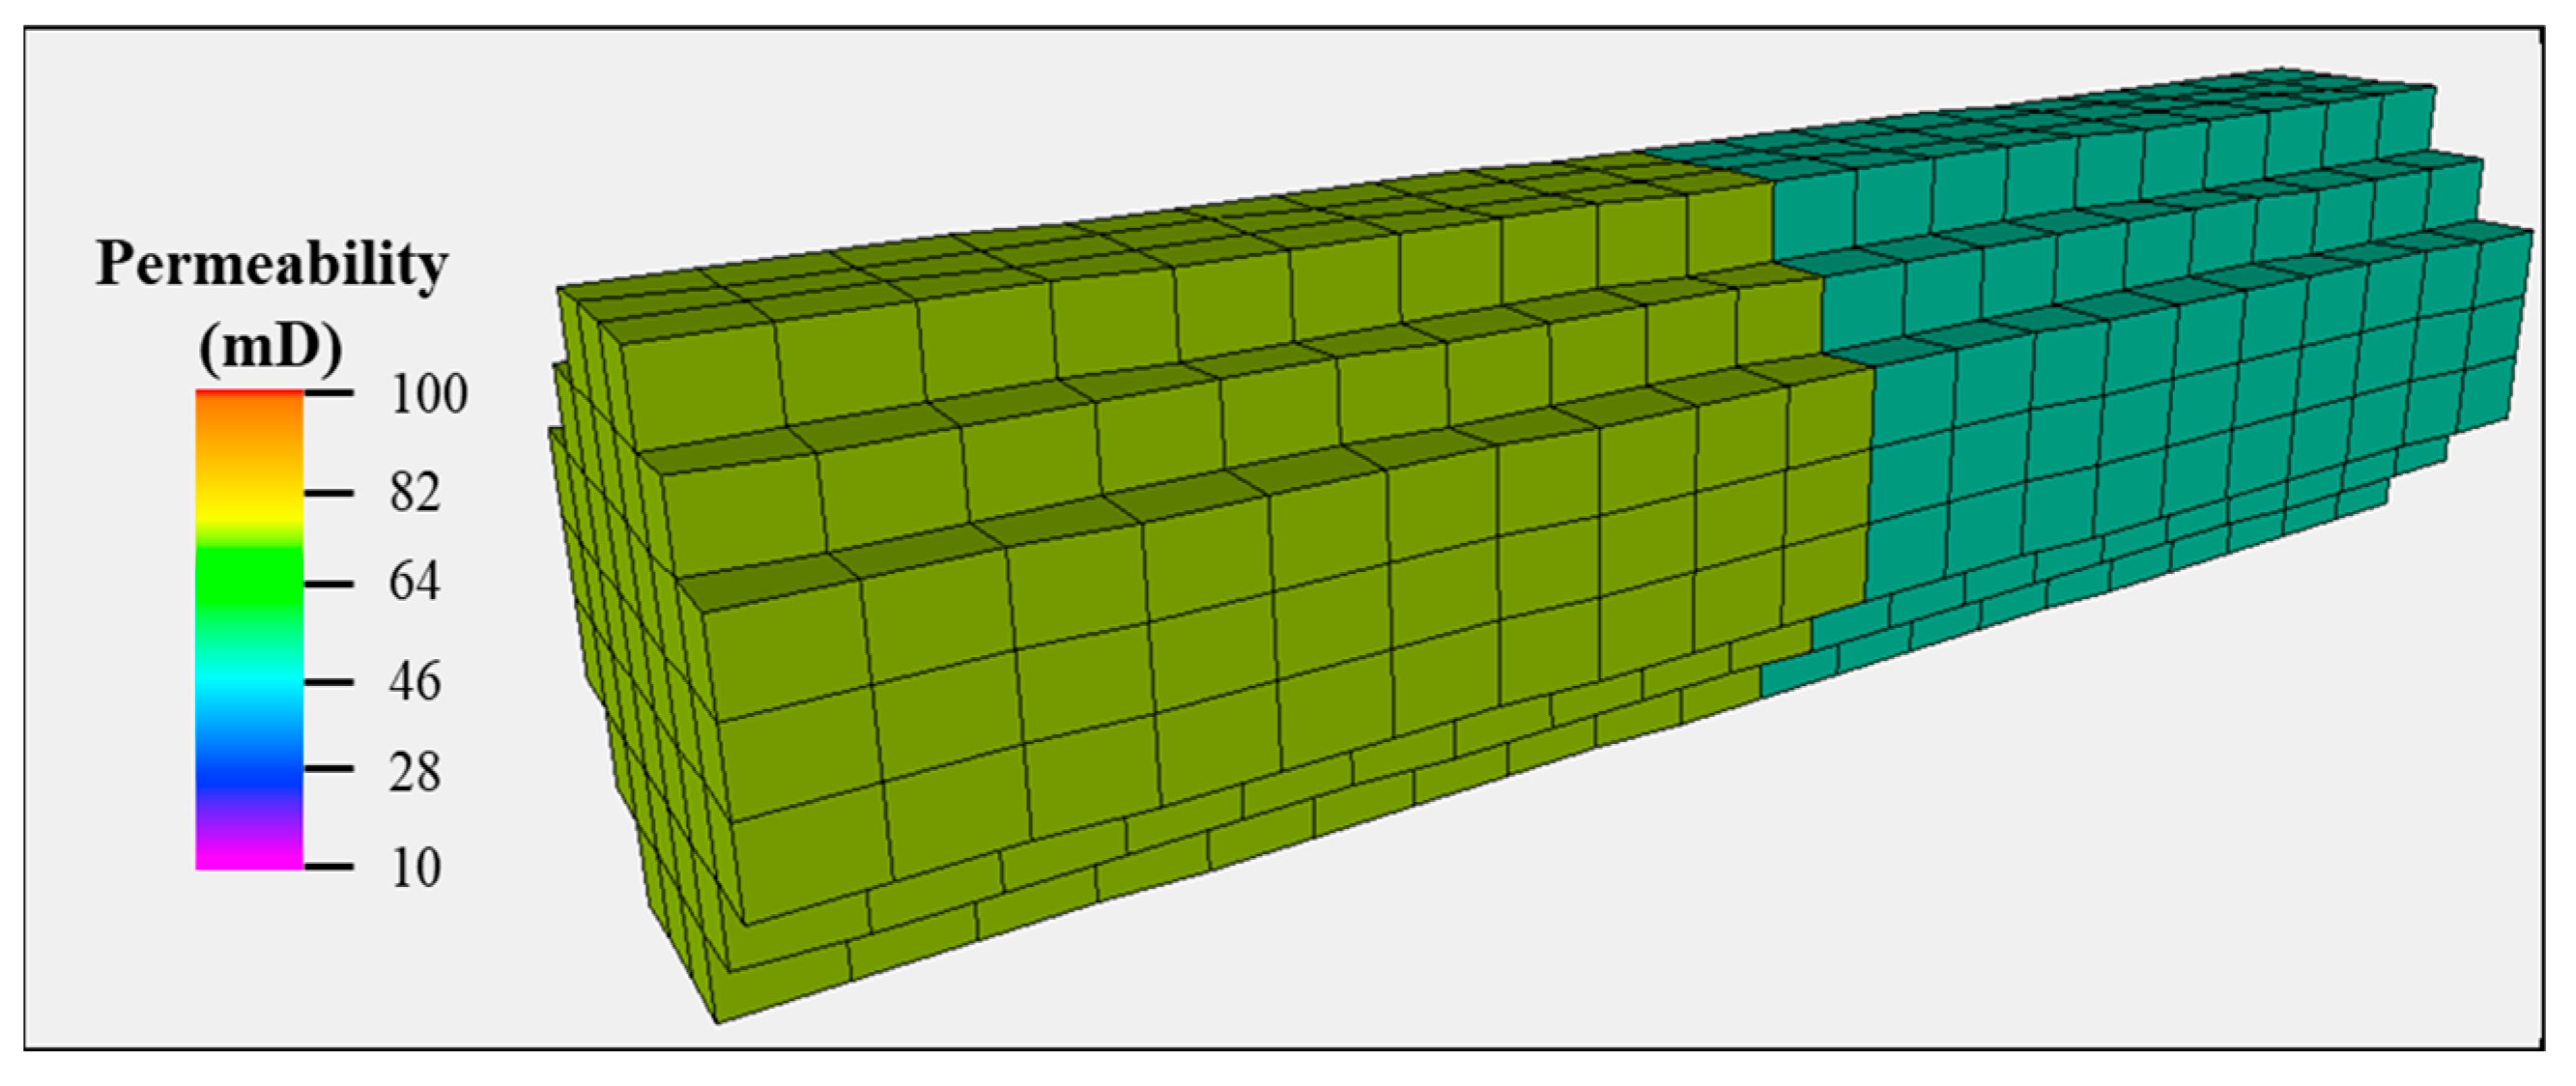
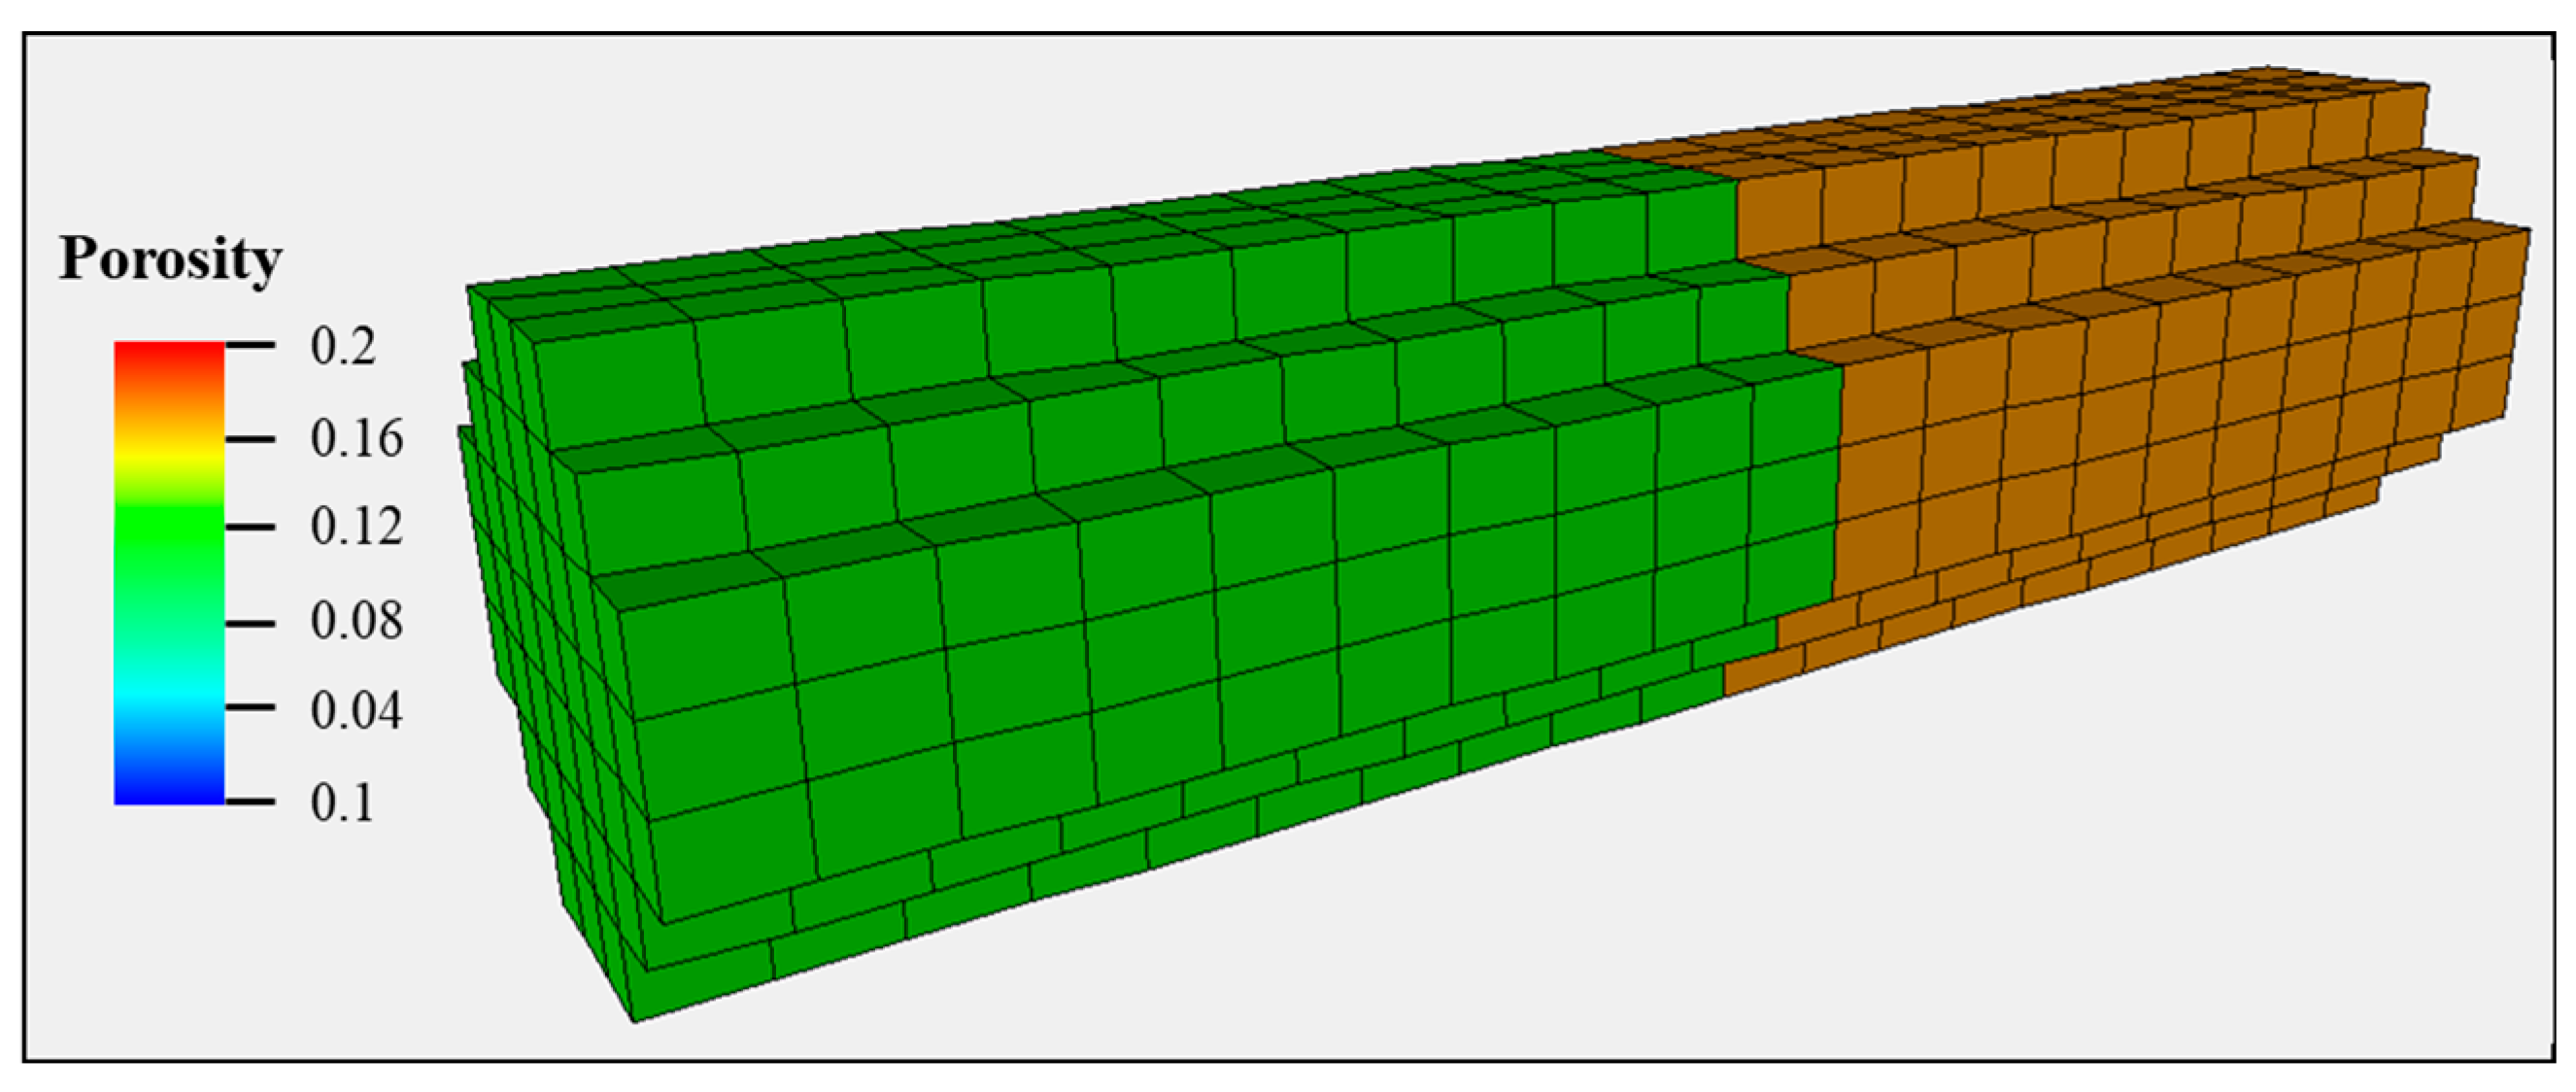
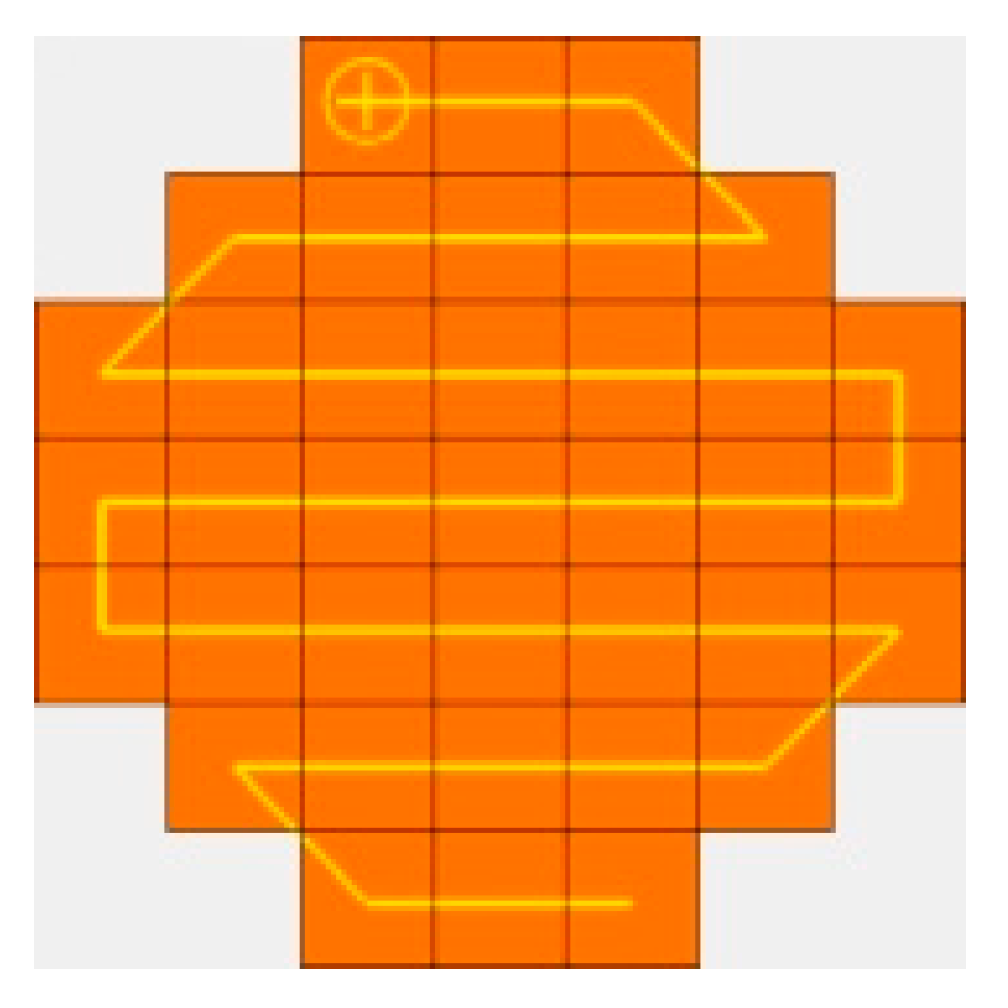
2.3.1. Model Setup

Based on the multi-cycle mutual drive experiments and the provided cores, a short core with a high-permeability model was selected, and a corresponding core numerical model was established using the Petrel (version 2022.2.0) reservoir simulation and modeling software. The model size and basic pore permeability parameters were consistent with those of the actual core, allowing for cycle injection simulations to be conducted. The core parameters are shown in Table 4.
The core model is shown in Figure 6 and Figure 7. The model grid consists of 20 × 5 × 5 cells, totaling 500 cells, with grid sizes based on the actual lithology length and radius settings. The model has an average permeability of 60.06 mD and porosity of 0.1707. The core samples are almost cylindrical, while the simulation models have sharp edges. This discrepancy is primarily attributed to grid size differences, manifesting in cross-sectional areas: the experimental core has a cross-sectional area of 5.21 cm2, while the simulation model’s area is 5.01 cm2, yielding a 3.9% deviation that falls within acceptable accuracy limits. The model employs relative permeability curves derived from high-permeability cores H1 and H2. The irreducible water saturation values for these cores are 24.3% and 23.8%, respectively, with corresponding oil saturation values of 75.7% and 76.2%. The initial pressure was 18.92 MPa, with a corresponding temperature of 83 °C.
This study utilizes a compositional model to analyze reservoir fluid dynamics. A compositional model is a mathematical formulation that characterizes the phase behavior and compositional evolution of multicomponent fluids (e.g., hydrocarbons, water, and their mixtures) in subsurface systems. Governed by principles of mass, energy, and momentum conservation, and integrated with thermodynamic phase equilibrium relationships, it establishes a system of partial differential equations (PDEs) to model multiphase flow, component transport, and phase transitions. The mathematical equations for compositional reservoir simulation are governed by the following system.
(1) Mass conservation for each phase (oil, gas, water):
∂(ϕραsα)/∂t + ∇⋅(ραvα) = Qα
where ϕ is the rock porosity, ρα is the phase density (α = oil, gas, water), sα is the phase saturation, vα is the Darcy velocity, and Qα represents sources/sinks.
(2) Component conservation for each chemical component c:
∂(ϕραxα,csα)/∂t + ∇⋅(ραxα,cuα + Jα,c) = Qα,c
where xα,c is the mass fraction of component c in phase α; Jα,c is the diffusion flux; and Qα,c denotes component-specific sources/sinks.
(3) Energy conservation:
( ϕ α ρ α U α S α + ( 1 ϕ ) ρ r C r T ) / t + ( α ρ α H α v α ) = ( λ T ) + Q
where Uα and Hα are the internal energy and enthalpy of phase α, λ is the thermal conductivity, and Q is the heat source.
(4) Darcy’s law for multiphase flow, the velocity of phase α is given as follows:
vα = −μαkkrα∇Φα
where k is the absolute permeability of the rock, krα is the relative permeability of phase α, μα is the viscosity of phase α, and Φα is the phase potential for phase α, which may include contributions from pressure, gravity, and capillary forces.
(5) Saturation constraints:
α S α = 1
where the summation of Sα over all phases α equals 1.
(6) Thermodynamic phase equilibrium equations:
fcgas = fcliquid(c = 1, 2, …, Nc)
fcα = xαcϕαcp
where ϕαc is the fugacity coefficient of component c in phase α, and p is the system pressure.
(7) Equation of state (Peng–Robinson EOS):
P = RT/(v − b) − a(T)/[v(v + b) + b(v − b)]
where a = i j x i x j ( 1 k i j ) a i a j , b = i x i b i , and kij is the binary interaction coefficient (experimentally fitted).
(8) Solubility Equations (Modified Henry’s Law):
xc,liq = Pyc,gas/Hc(T)
where Hc(T) is temperature-dependent Henry’s constant.
These equations are coupled through phase behavior models (e.g., equations of state) and closure relationships for capillary pressure and relative permeability. The assumptions and simplifications are as follows:
(a)
Local thermodynamic equilibrium (LTE) between phases.
(b)
Isothermal or adiabatic conditions.

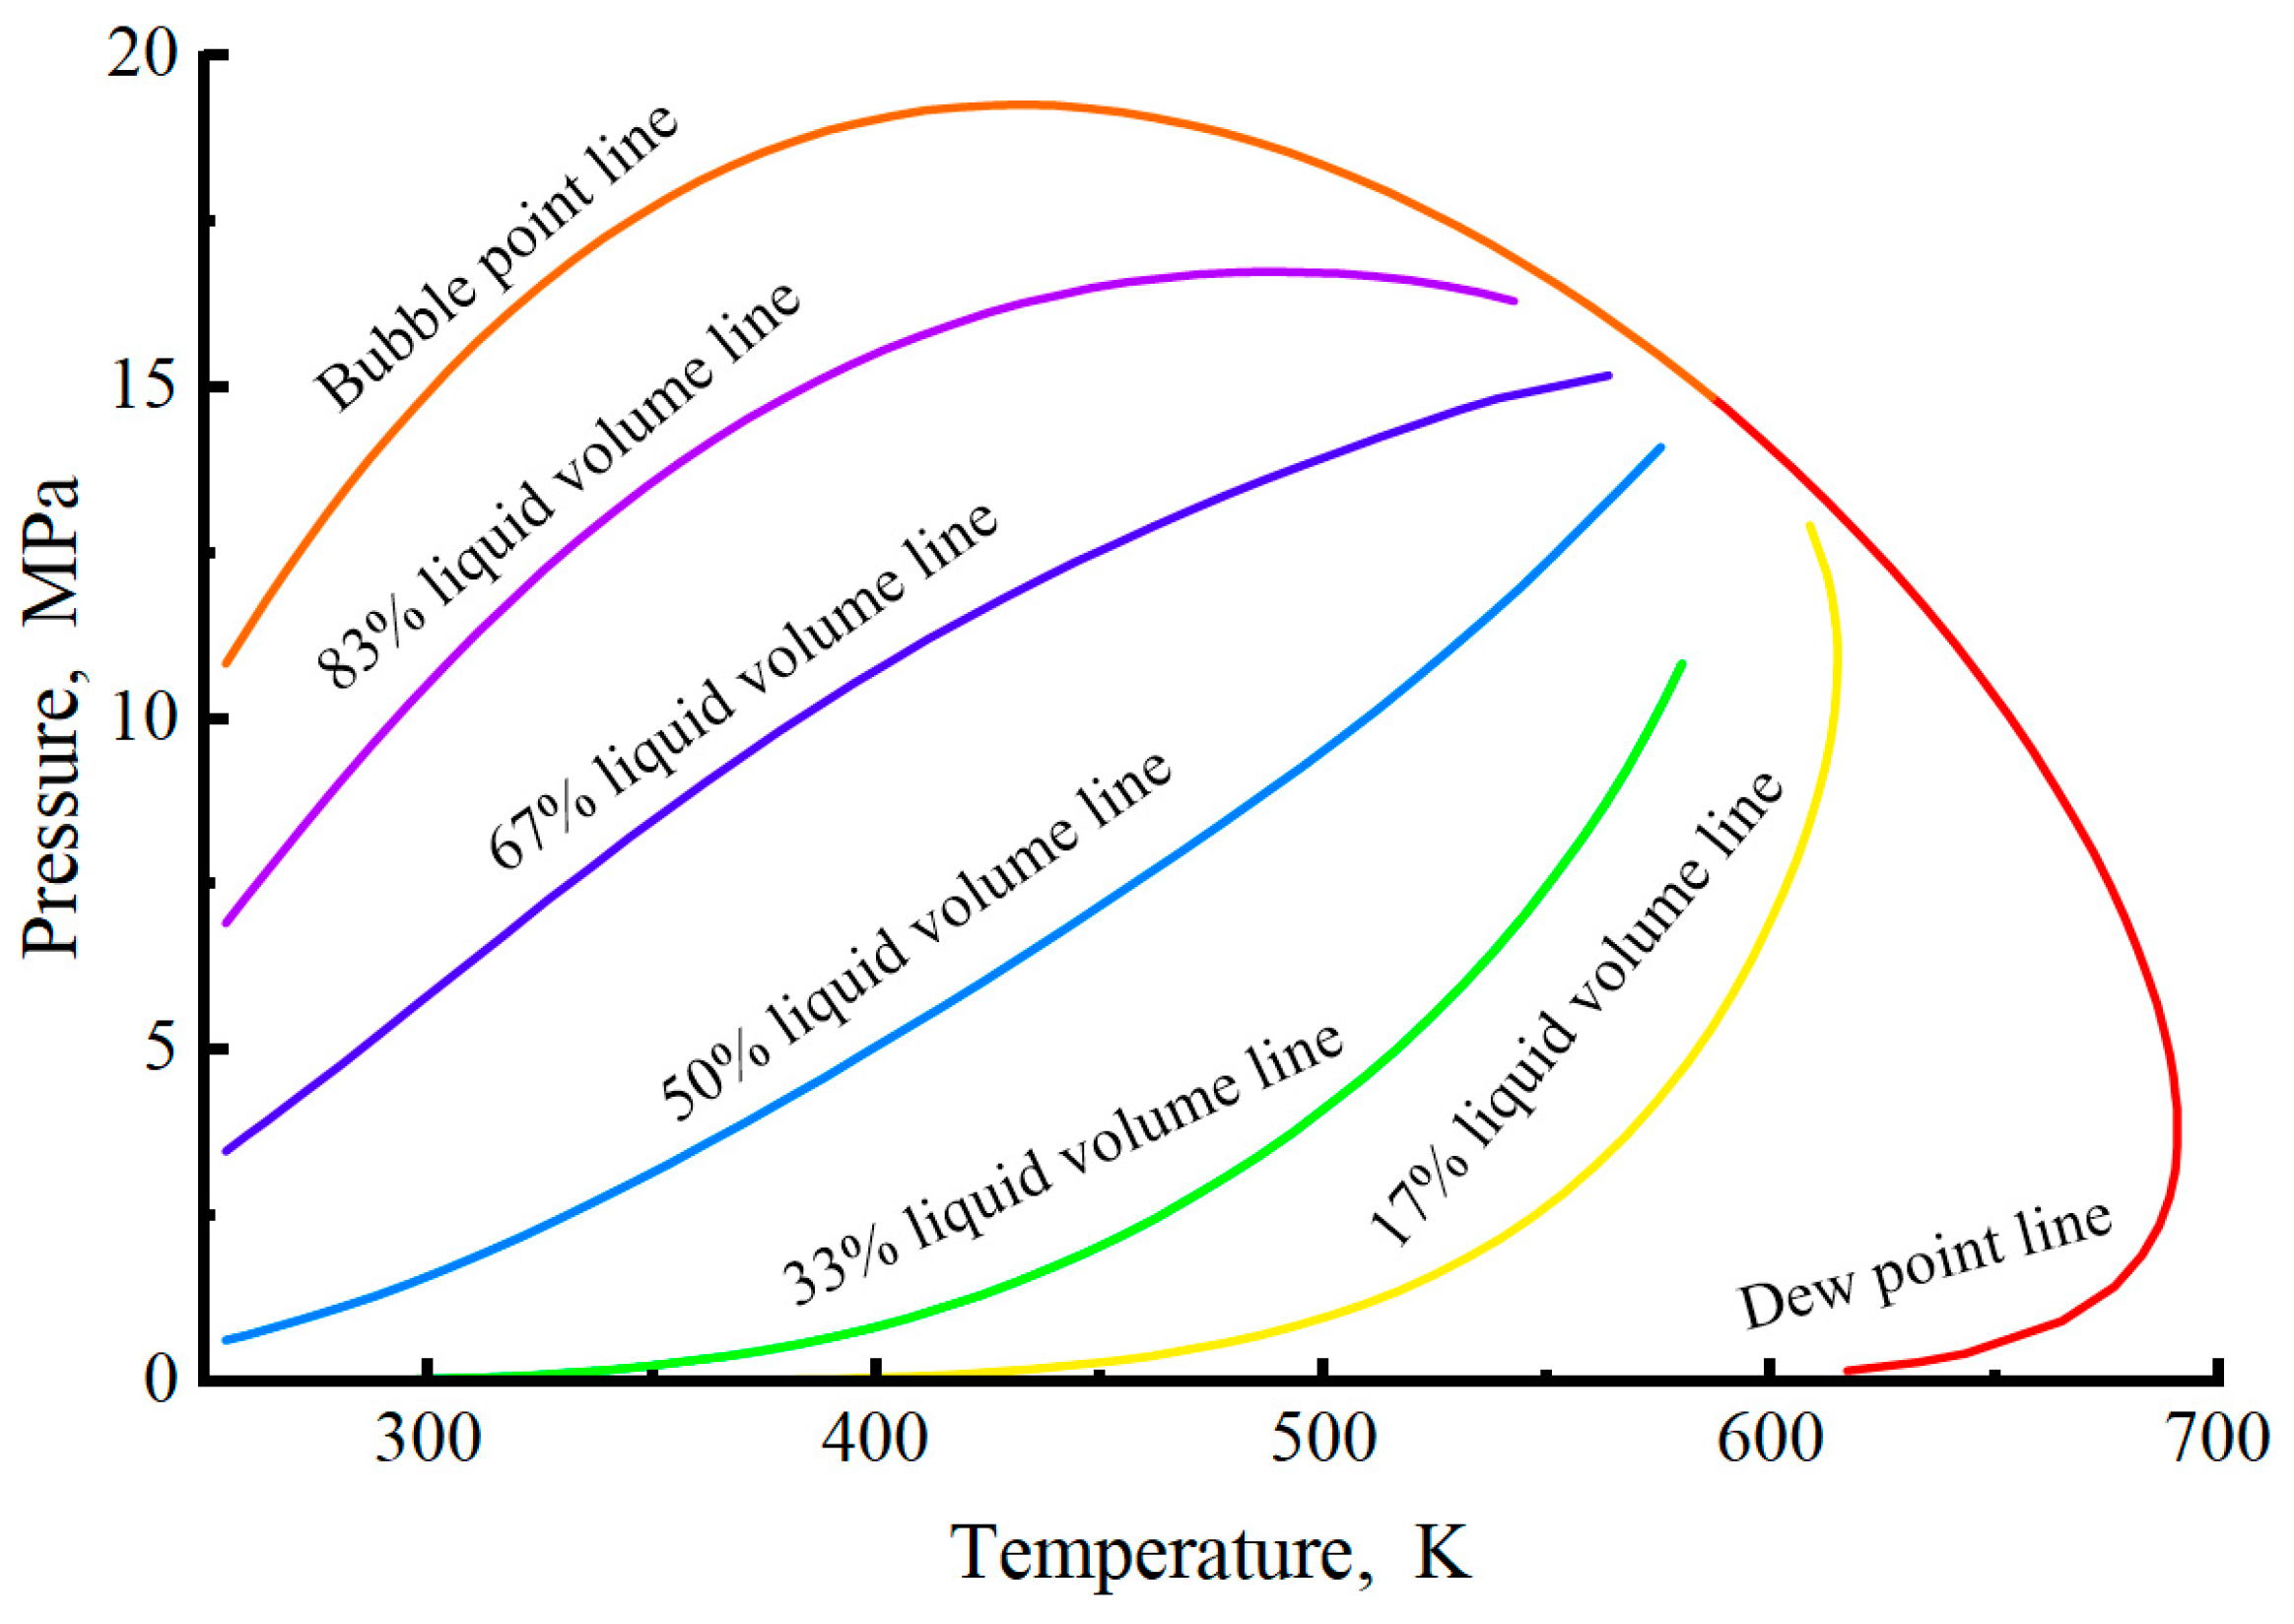
2.3.2. Phase Fitting

Based on experimental tests of the high-pressure physical properties of fluids from the study reservoir, the main high-pressure physical properties parameters of reservoir fluid are fitted, and the phase characteristic parameters of formation fluid are obtained.
(1) Pseudo-component division
The PR equation of state was selected based on the principle of similarity of component properties. The original oil well flow material was grouped into seven proposed components: C1, C2, C3+, C5+, C8+, C11+, and C23+. The content of each component is shown in Table 5.
(2) Experimental Matching of the Phase
To accurately model the high-pressure physical properties of the characterized fluids, phase fitting was performed on the results of various experiments, including single degassing, constant mass expansion, multi-stage degassing, and gas injection expansion tests. The experimental fluid saturation pressure was 18.9 MPa, the single degassing oil ratio was 236 m3/m3, the viscosity of formation crude oil was 2.05 mPa·s, and the formation oil density was 0.84 g/cm3. The fitting results were all controlled within the error range, indicating that the fluid model can accurately characterize the actual fluid’s high-pressure physical properties and provide a basis for the subsequent cycle injection simulation. The fluid fitting results are shown in Table 6.
The critical parameters and PT phase diagrams after fluid fitting are shown in Table 7 and Figure 8. The fitted fluid can be used for numerical simulations.

2.3.3. Program Setup

Based on the multi-cycle huff and puff experimental displacement process, a corresponding injection–production scheme was designed for the model, by configuring pipelines at one end to simulate depletion and injection–production cycles. The injection–production well configuration is shown in Figure 9 and Figure 10. This geometric configuration is designed to ensure that injected gas permeates through every grid cell on the model’s cross-sectional plane, thereby accurately simulating the experimental process where gas is injected from the end face of the core specimen housed within the core holder.
(1) Depletion Simulation
The model is initially subjected to a decay simulation to reflect the reservoir production history. The decay rate was set to 0.1 mL/min, based on the experimental condition. The model pressure reaches the current reservoir formation pressure of 3.8 MPa after 1 h.
(2) Multi-Cycle Huff and Puff Simulation
After the depletion simulation, the gas huff and puff rate was set to 0.1 mL/min, with a single cycle length of 1 h. The upper and lower pressure limits for the huff and puff cycles were 24 MPa and 12 MPa, respectively. Specific program parameter settings and changes in pressure during the huff and puff process are shown in Table 8 and Figure 11.

3. Results

3.1. Multi-Cycle Seepage Characteristic

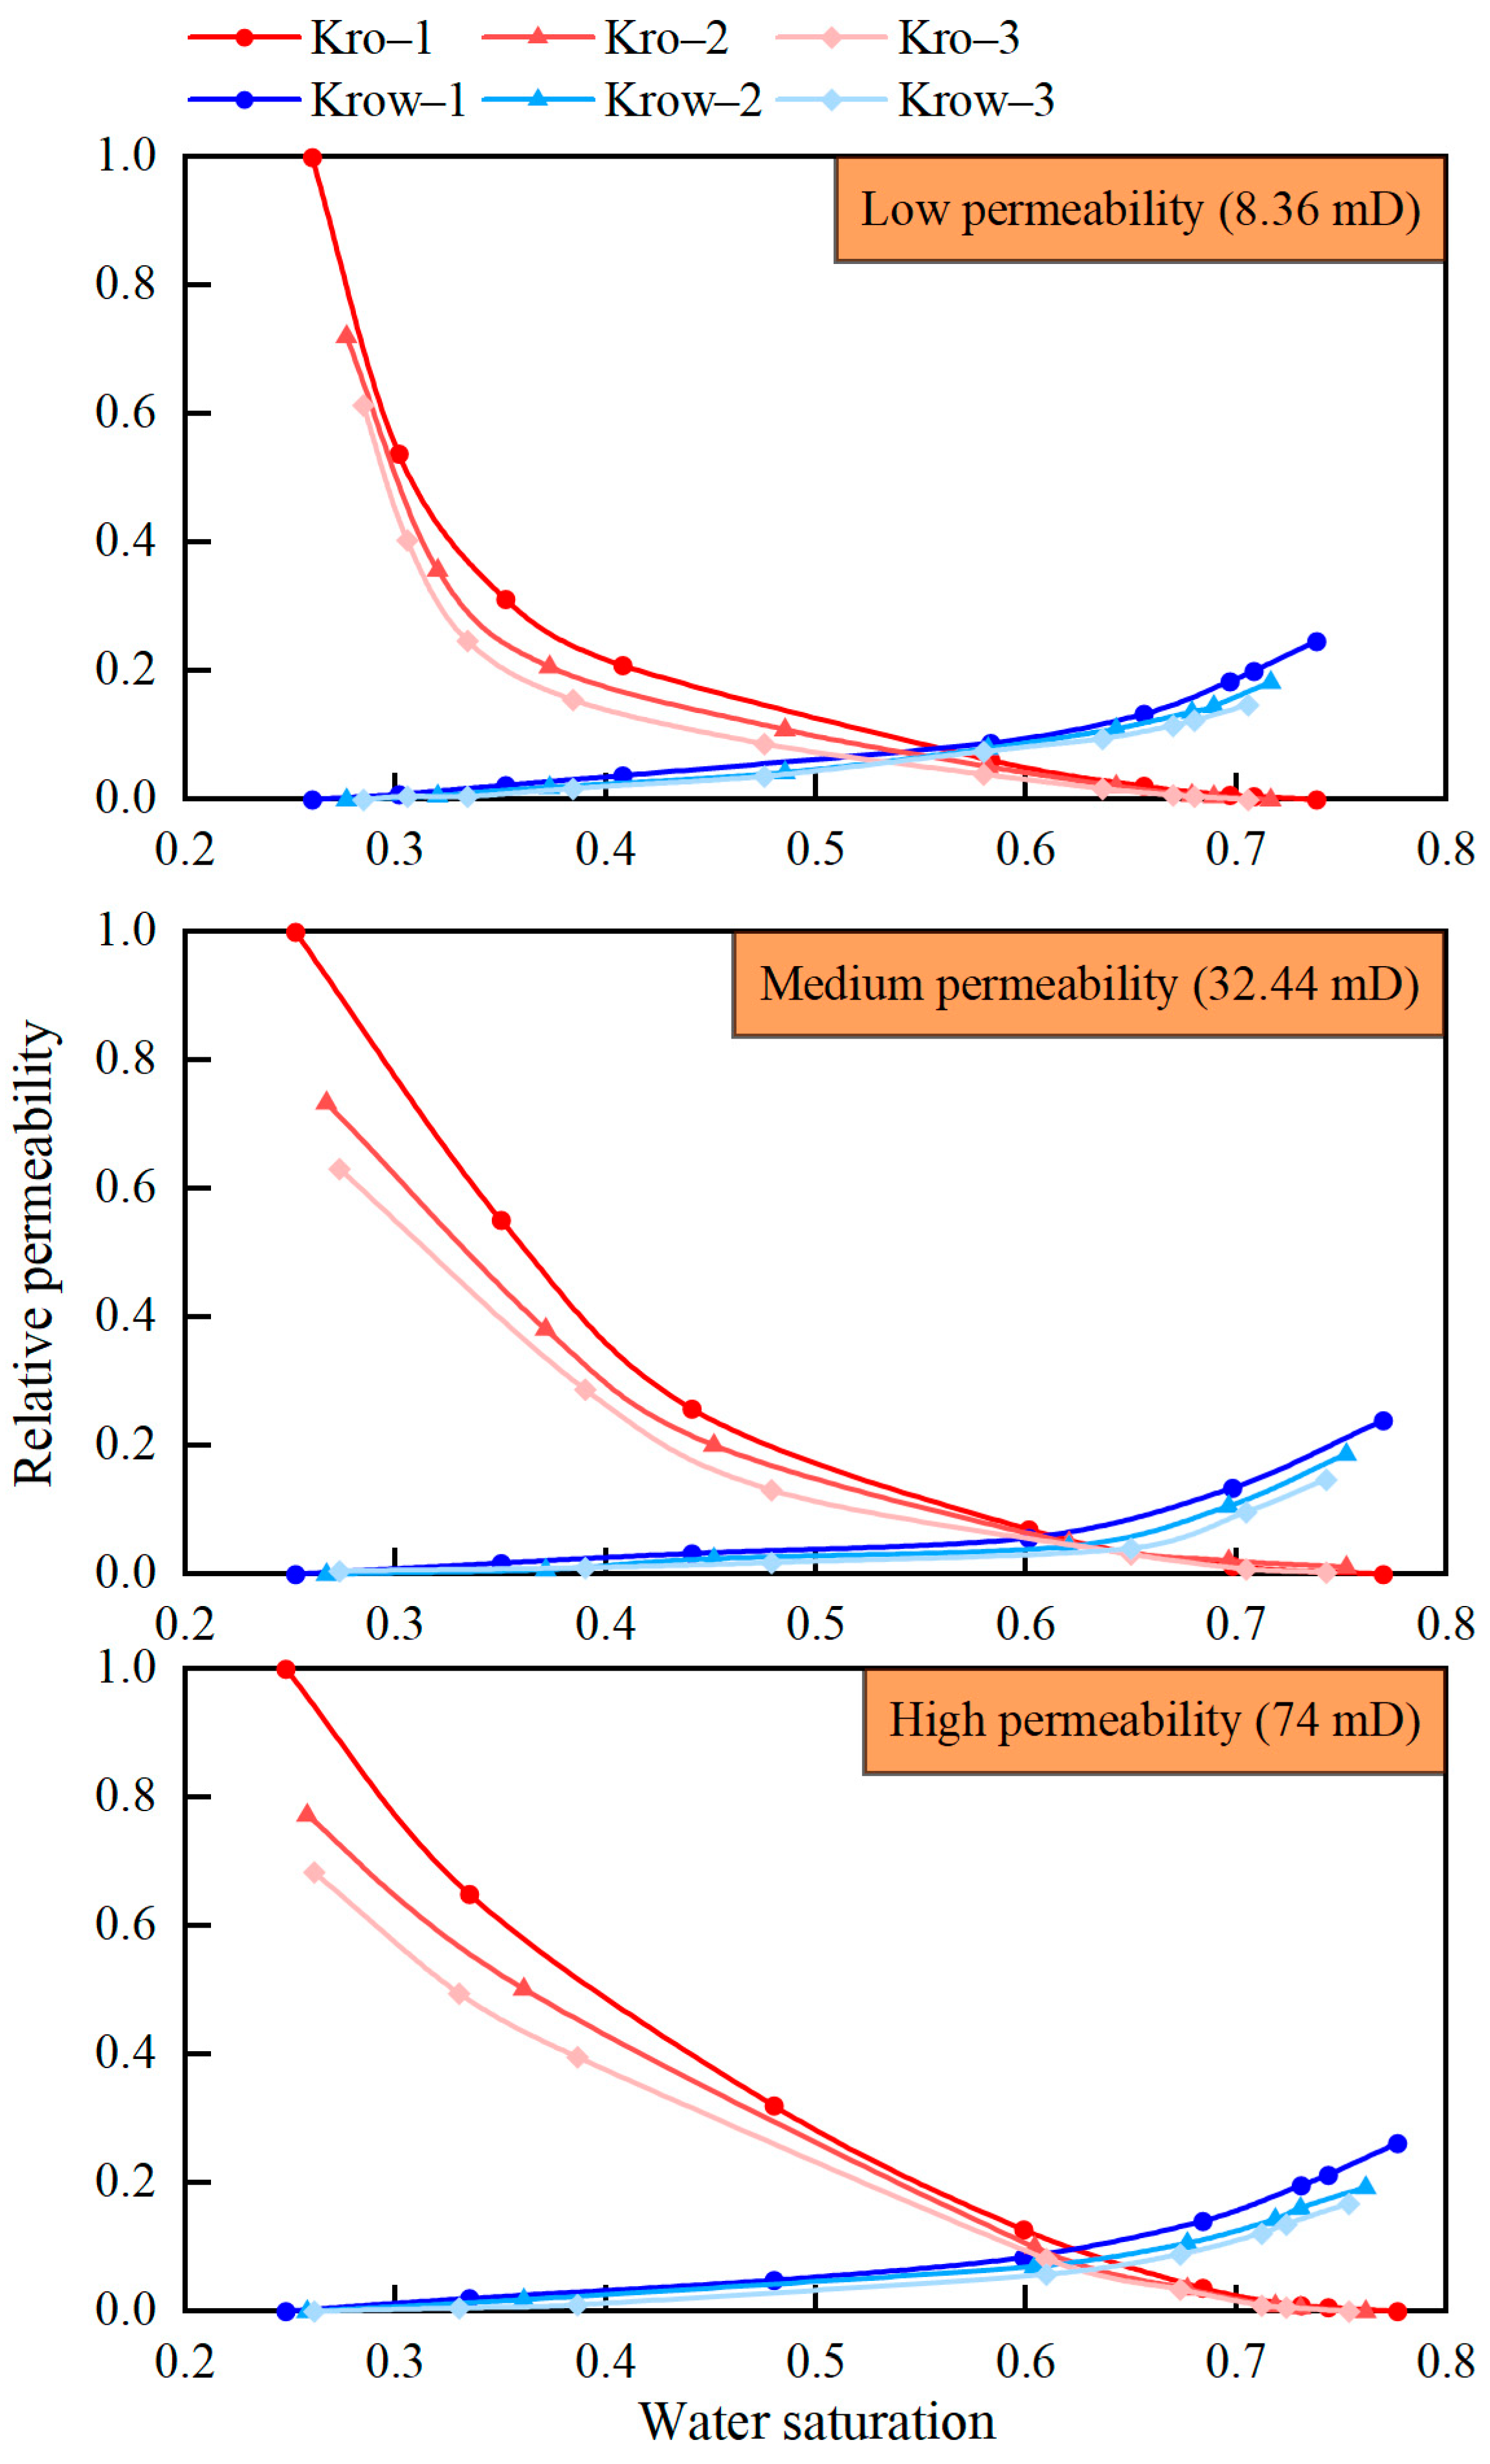
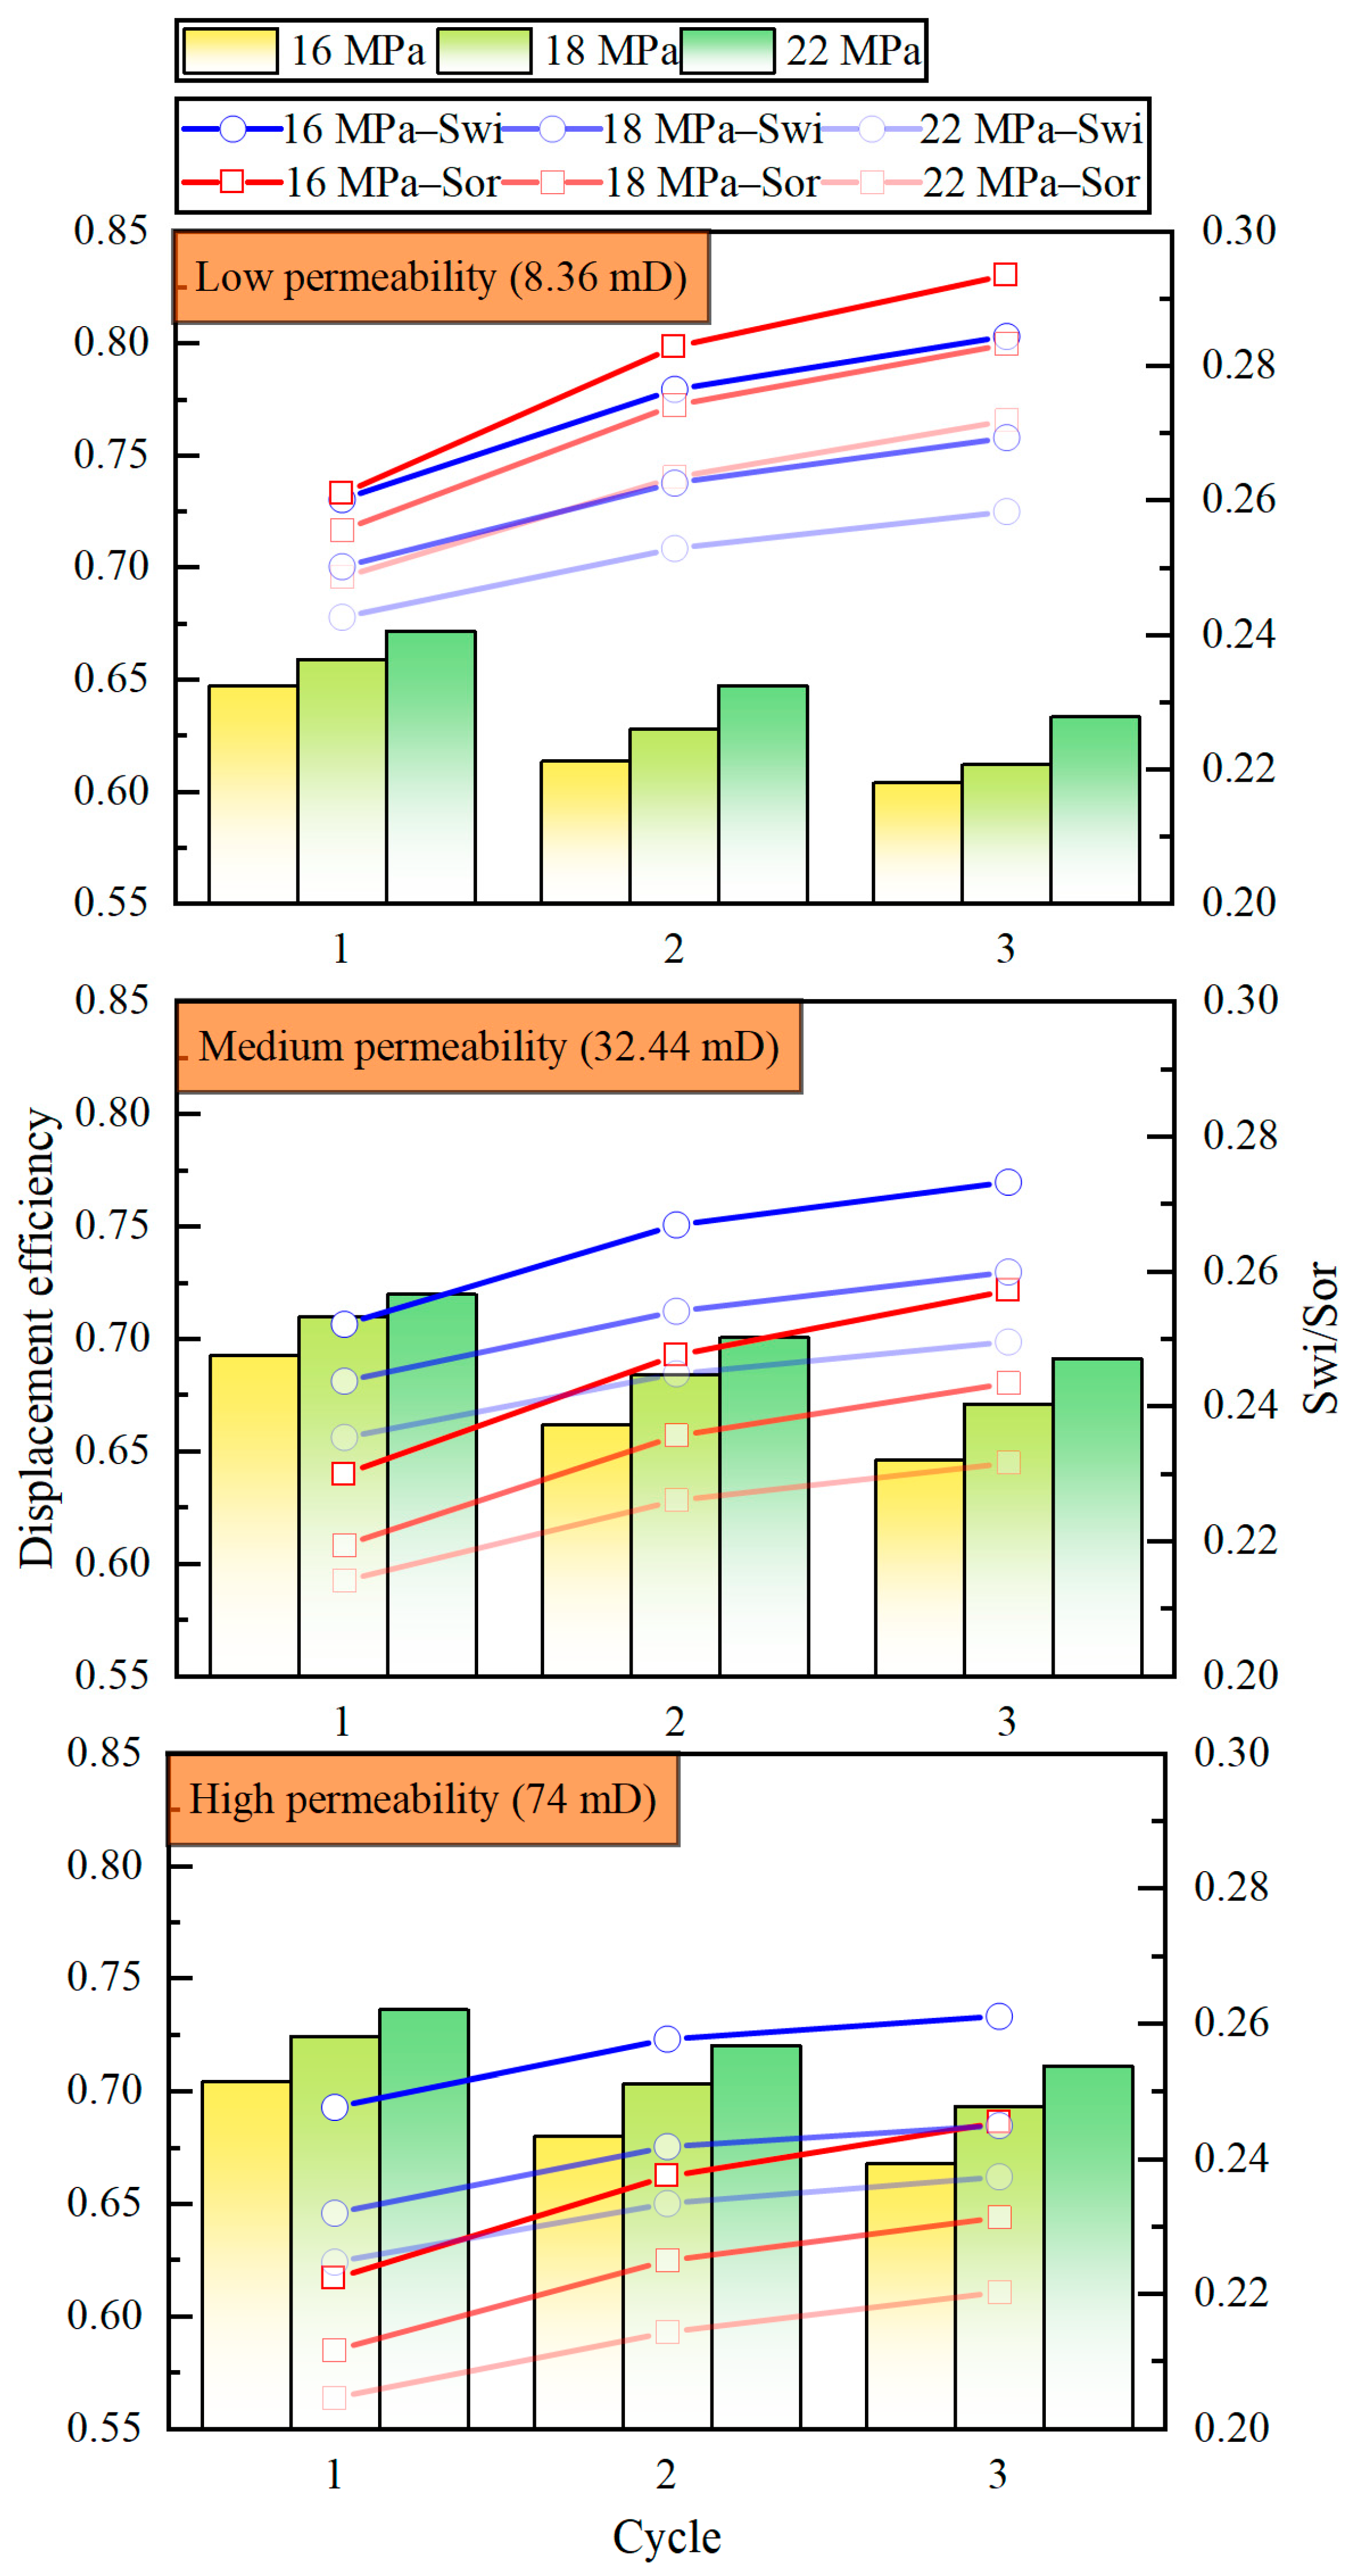
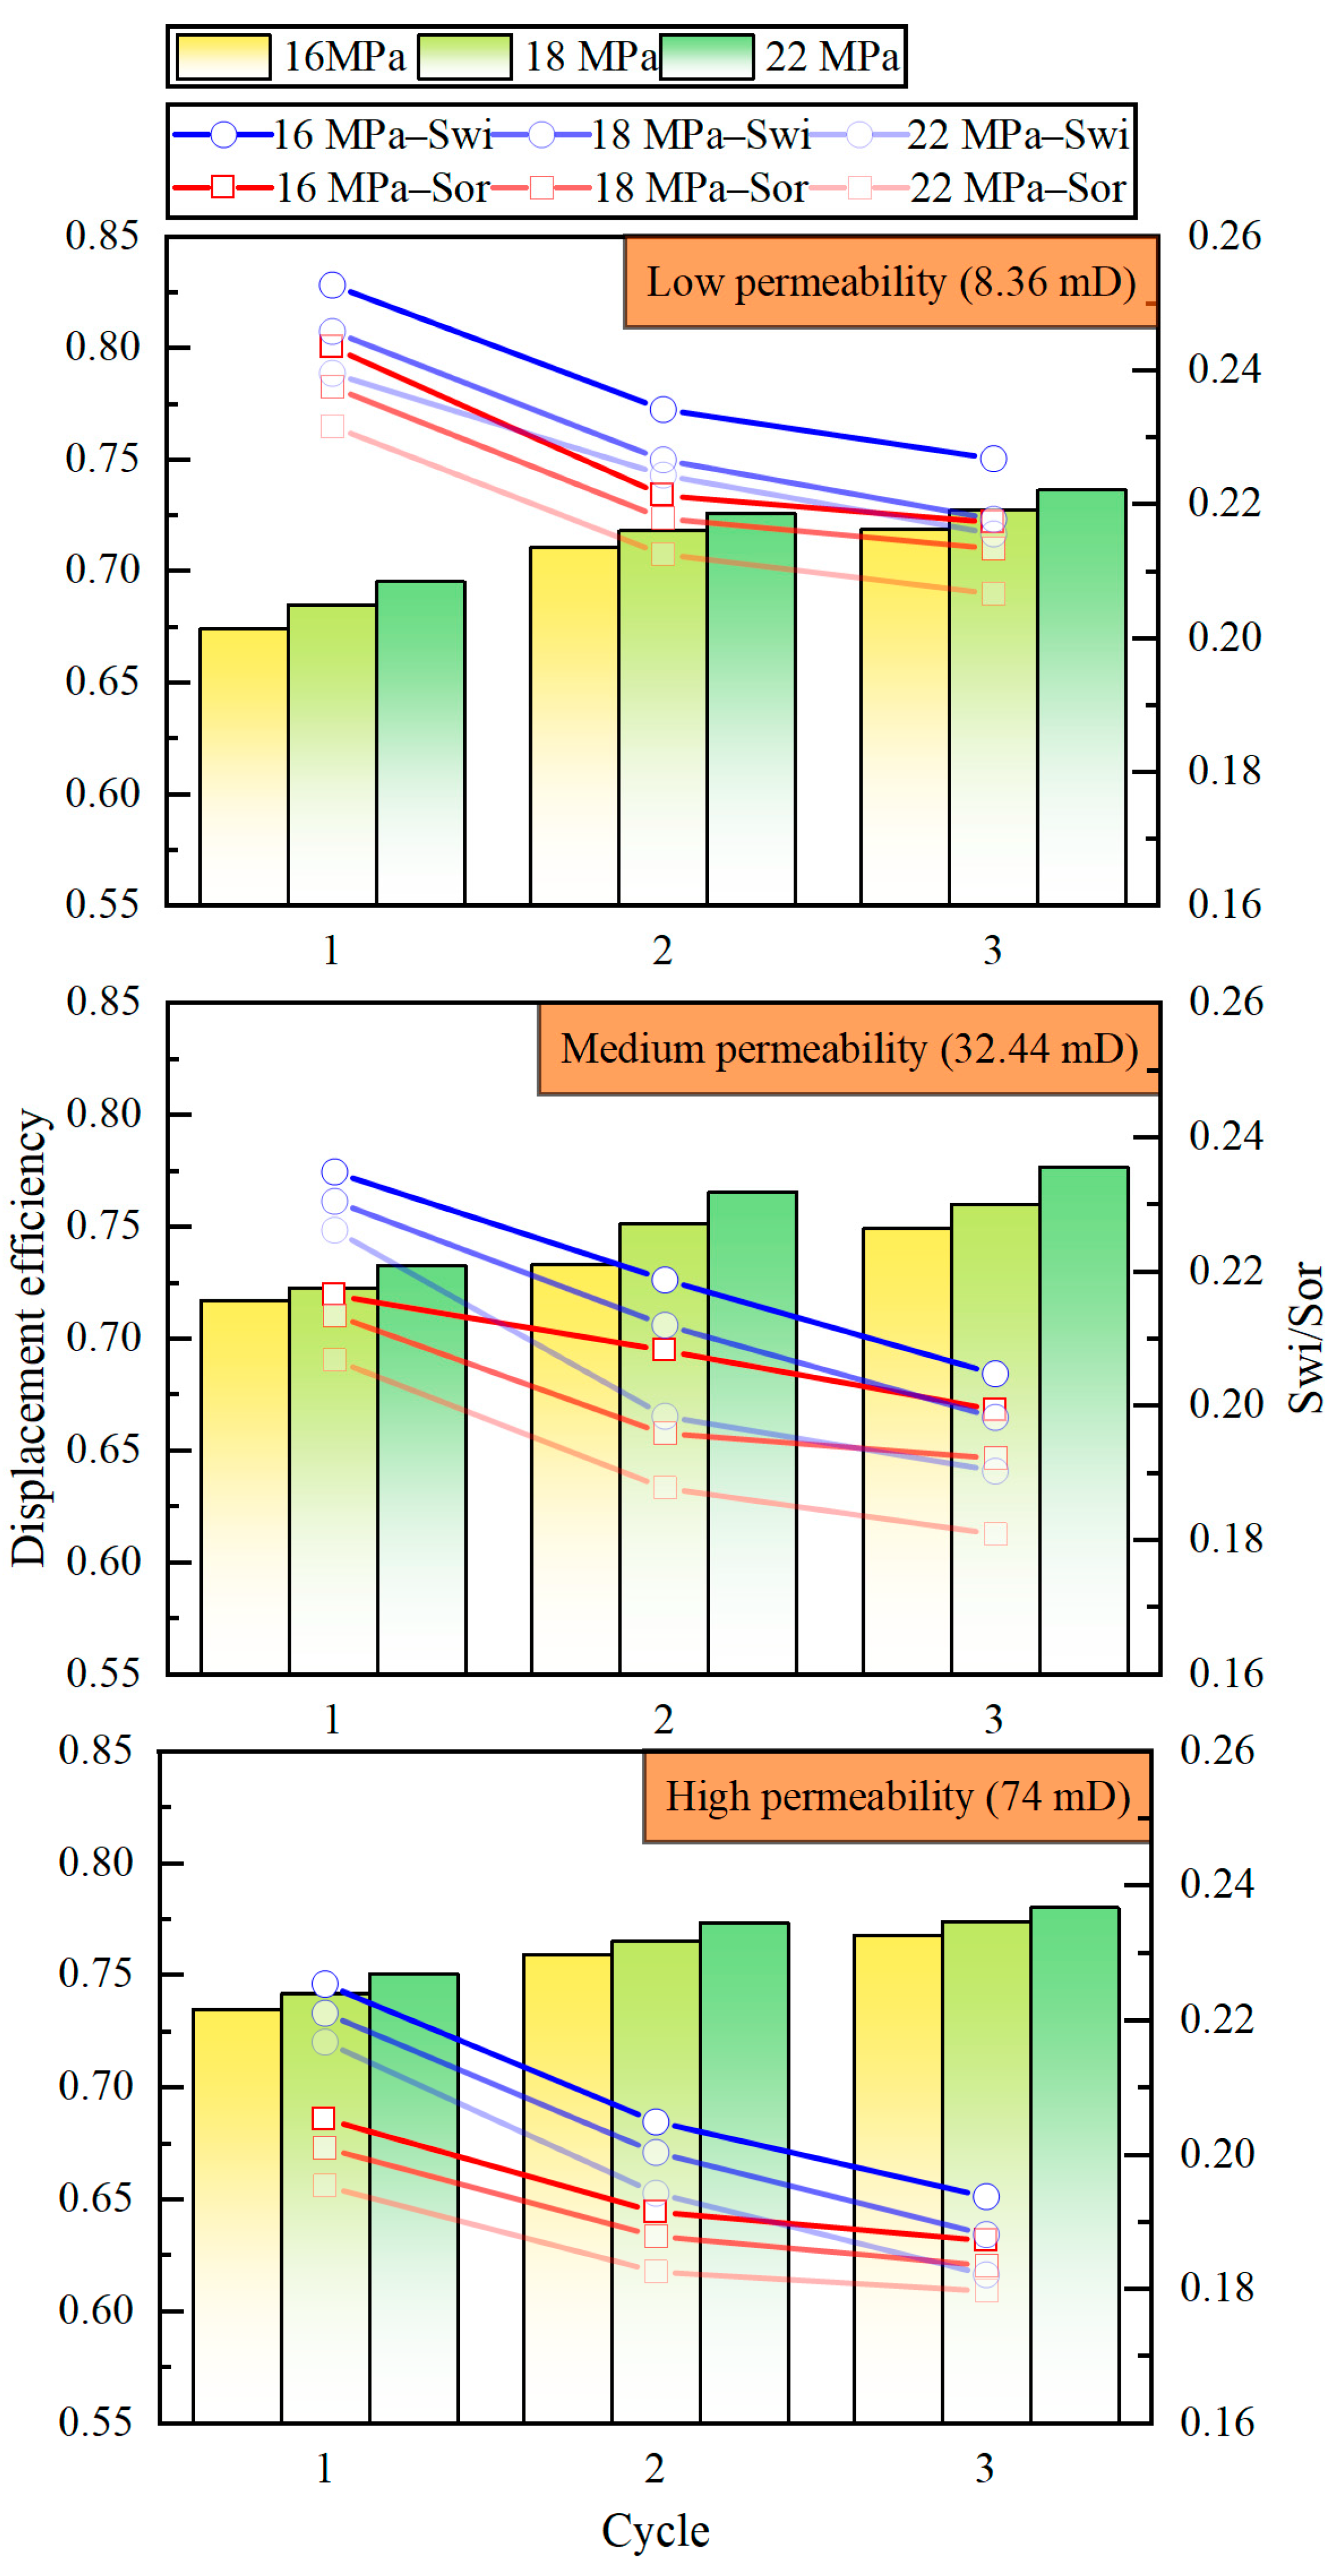
3.1.1. Oil–Water Mutual Drive

(1) Effects of Multi-Cycle Injection–Production
The oil–water relative permeability curve is shown in Figure 12 and Figure 13. After three cycles of oil–water mutual drive at an injection pressure of 16 MPa, the bound water saturation of the low-permeability core increased from 26.02% to 28.45%, the residual oil saturation increased from 26.11% to 29.36%, and the oil drive efficiency decreased from 64.7% to 60.4%. The bound water saturation of the medium-permeability core increased from 25.22% to 27.33%, the residual oil saturation increased from 23% to 25.72%, and oil driving efficiency decreased from 69.7% to 64.6%. The bound water saturation of the high-permeability core increased from 24.78% to 26.12%, the residual oil saturation increased from 22.23% to 24.54%, and oil driving efficiency decreased from 70.4% to 66.8%.
As shown in Figure 12, following three cycles of oil–water mutual displacement, a distinct leftward shift occurs in the curve, accompanied by a rise in both bound water saturation and residual oil saturation. The co-seepage zone becomes narrower, the relative permeability of both the water and oil phases decreases, and the seepage capacity significantly reduces. The iso-osmotic point shifted downward and to the left, while the efficiency of oil repulsion decreased. This is due to the strong hydrophilic characteristics of the core, which result in significant liquid flow resistance during the two-phase seepage mutual drive process.
(2) Effects of Permeability
As shown in Figure 12 and Figure 13, when the injection pressure is 16 MPa, the permeability increases from 8.36 mD to 74 mD. The average bound water saturation in three cycles decreases from 27.37% to 25.56%, a decrease of approximately 1.8 percentage points. The average residual oil saturation decreases from 27.92% to 23.51%, a decrease of approximately 4.4 percentage points. The average water drive efficiency increases from 62.2% to 68.4%, an increase of approximately 6.2 percentage points. The relative permeability of the oil phase increases, and the morphology of the phase permeability curve becomes flatter as the relative permeability curve of the oil phase decreases, resulting in an increase in oil phase seepage capacity. This occurs because as permeability increases, the proportion of large and medium-sized pores in the core rises, reducing the jamming phenomenon of small pores on oil flow. This results in a decrease in residual oil saturation, an increase in the distribution range of the core pore throat radius, a weakening of the interactions between the oil and water phases, and an expansion of the seepage space in the core pores.
(3) Effects of Pressure
The effects of pressure on multi-cycle oil–water mutual drive are shown in Figure 12 and Figure 13. When the pressure increased from 16 MPa to 22 MPa, the average bound water saturation of the low-permeability core was reduced from 27.37% to 25.13% in three cycles, a decrease of approximately 2.2 percentage points. The average residual oil saturation was reduced from 27.92% to 26.13%, a decrease of approximately 1.8 percentage points. The average water-drive efficiency increased from 62.2% to 65.1%, an improvement of approximately 2.9 percentage points. The average bound water saturation of the medium-permeability core decreased from 26.42% to 24.33%, a decrease of approximately 2.1 percentage points. The average residual oil saturation decreased from 24.5% to 22.4%, a decrease of approximately 2.1 percentage points. The average water drive efficiency increased from 66.7% to 70.4%, an increase of approximately 3.7 percentage points. The average bound water saturation of the high-permeability core decreased from 25.56% to 23.19%, a decrease of approximately 2.4 percentage points. The average residual oil saturation was reduced from 23.51% to 21.31%, a decrease of approximately 2.2 percentage points, and the average water drive efficiency increased from 68.41% to 72.25%, an increase of approximately 3.8 percentage points. This occurs because as pressure increases, the replacement phase can overcome the capillary force and enter smaller pore spaces, increasing the number of channels involved in seepage and expanding the range of waves, leading to more oil or water replacement. Secondly, as water saturation increases, the oil phase transitions from a continuous phase to discontinuous oil droplets distributed in the pore throats. These droplets, due to the Jamin effect, form additional resistance to seepage flow. As the pressure gradient increases, more oil droplets are driven through the narrow openings of the pore channels, resulting in an increase in the average water drive efficiency.

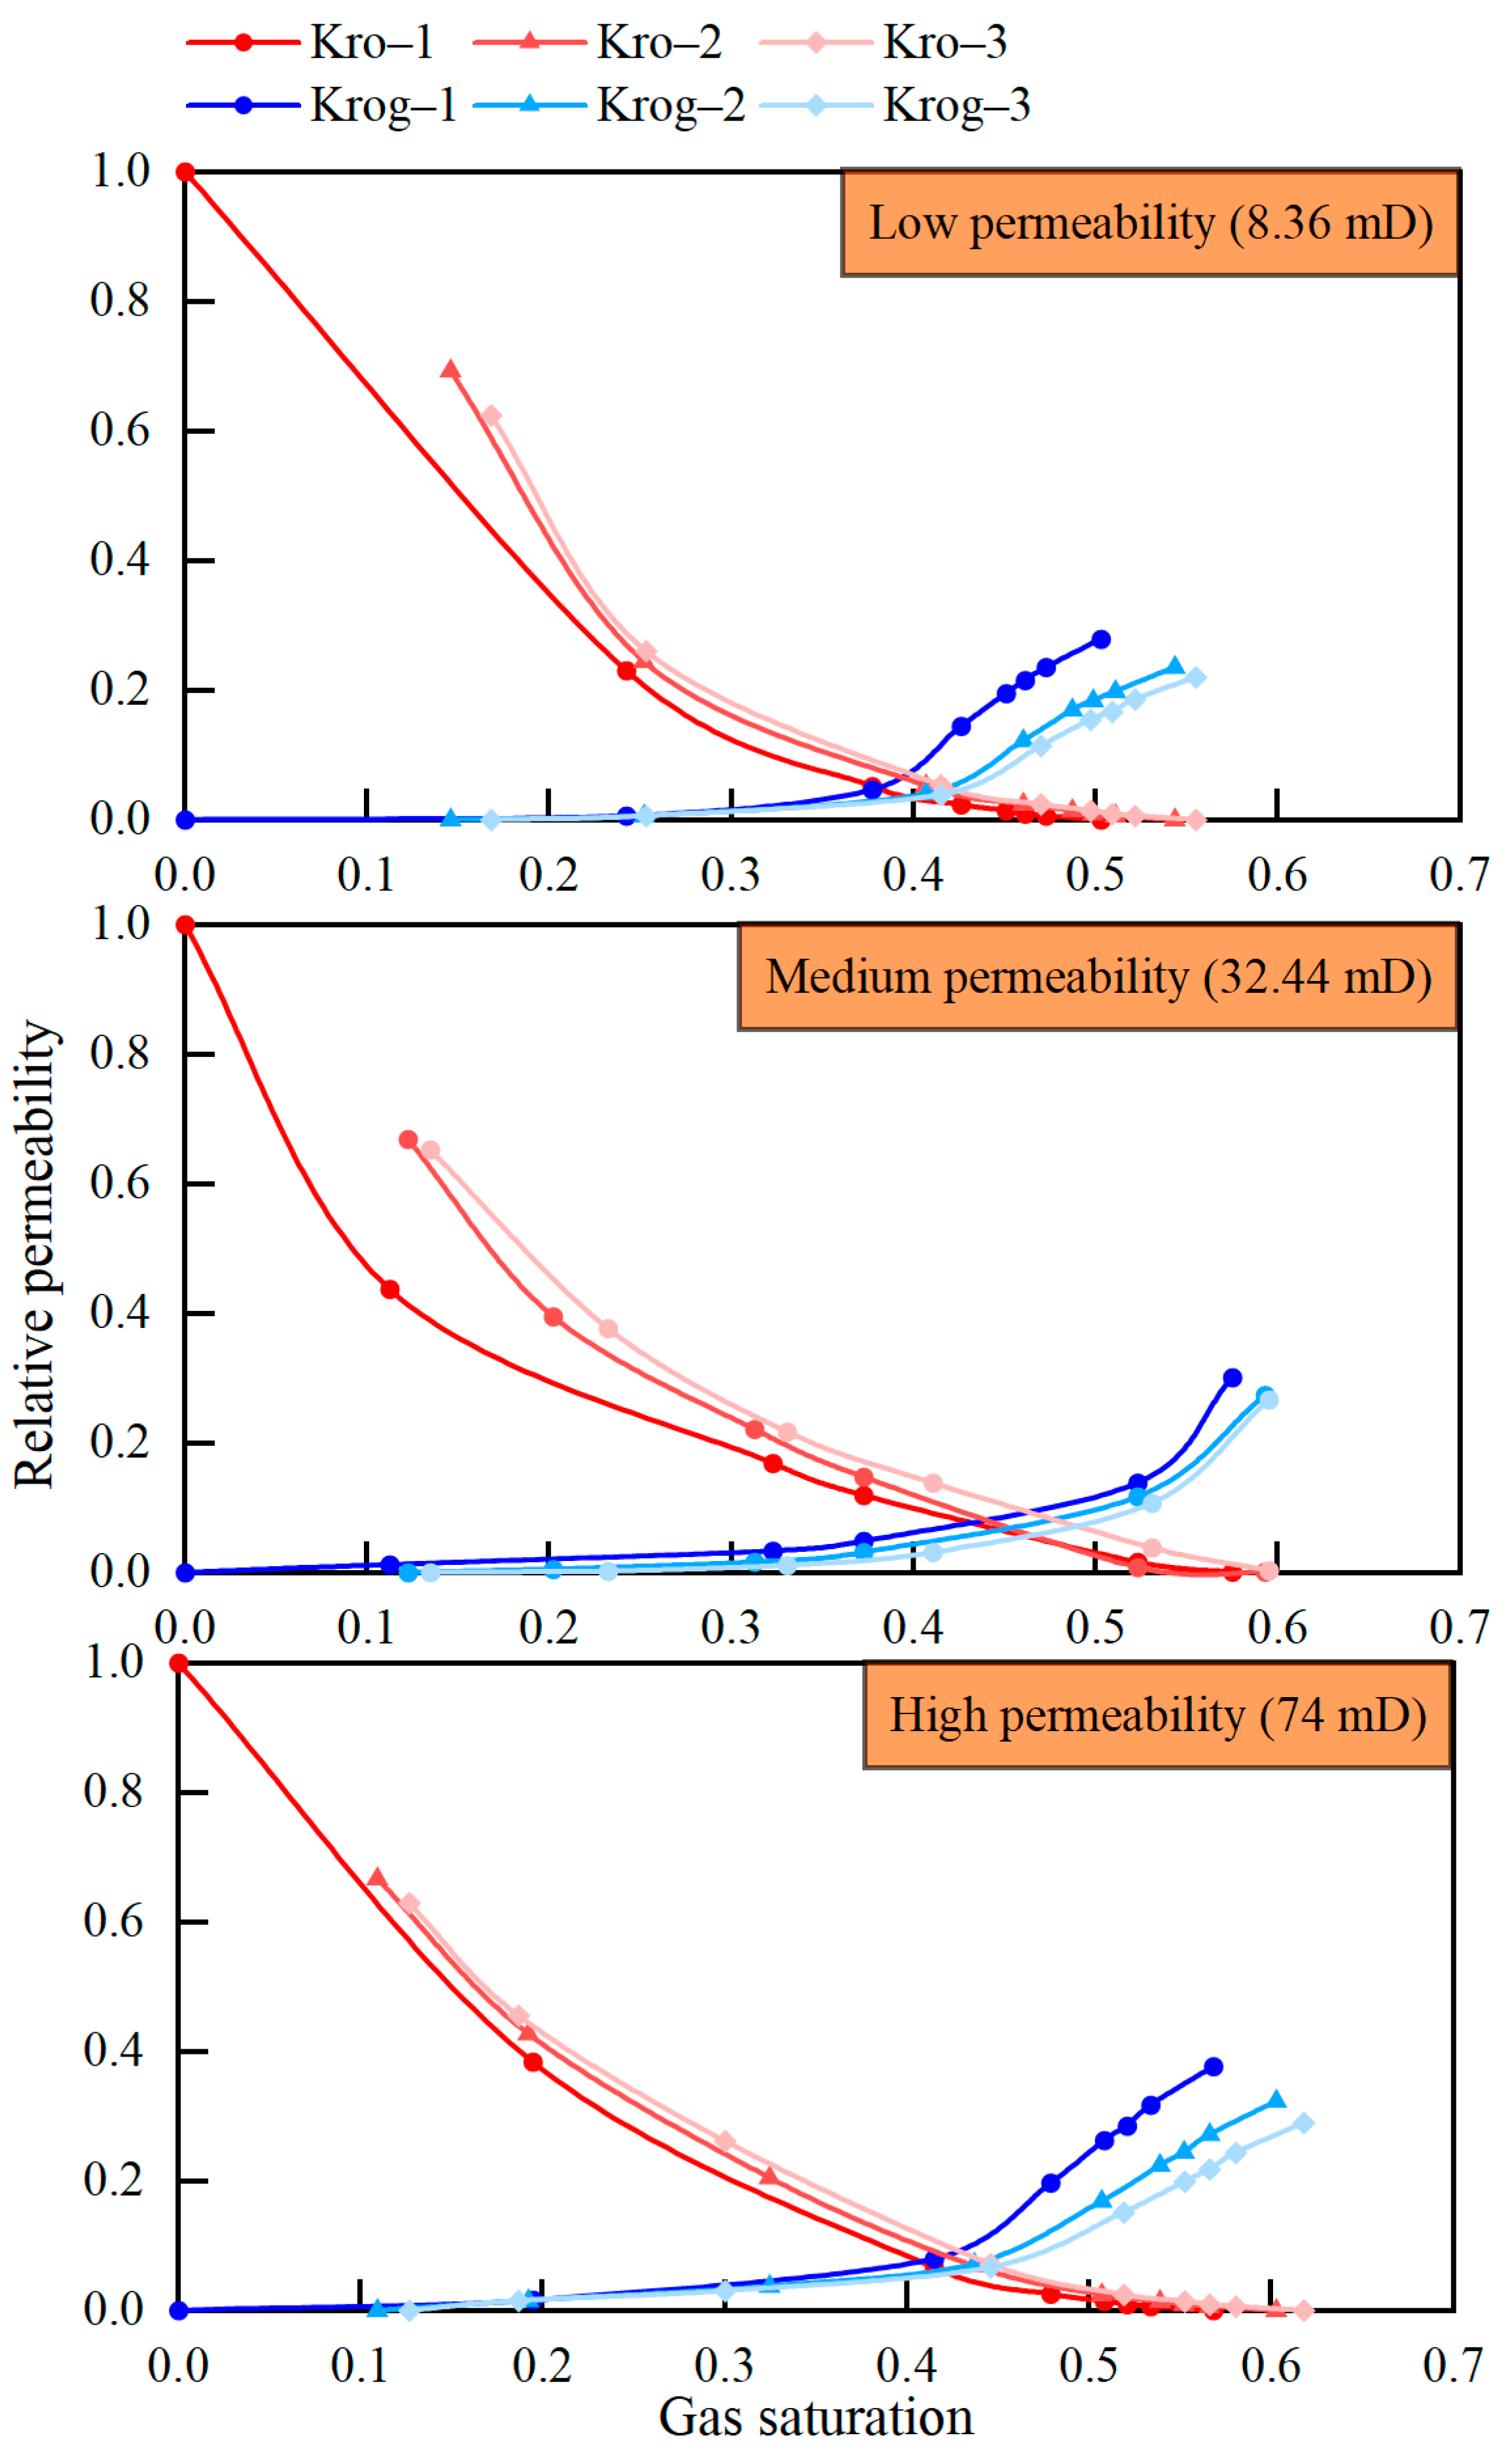
3.1.2. Oil–Gas Mutual Drive

(1) Effects of Multi-Cycle Injection–Production
The oil–gas relative permeability curve is shown in Figure 14 and Figure 15. At an injection pressure of 16 MPa, after three cycles of oil and gas mutual drive, the bound water saturation of the low-permeability core decreased from 25.28% to 22.69%, the residual oil saturation decreased from 24.35% to 21.73%, and the gas saturation increased from 50.37% to 55.58%, an increase of 5.2 percentage points. The oil-driving efficiency increased from 67.4% to 71.9%. The bound water saturation in the medium-permeability core decreased from 23.49% to 20.48%, the residual oil saturation decreased from 21.65% to 19.94%, and the gas saturation increased from 54.86% to 59.58%, an increase of 4.7 percentage points. The oil-driving efficiency increased from 71.9% to 73.3%. The bound water saturation of high-permeability core decreased from 22.54% to 19.38%, the residual oil saturation decreased from 20.54% to 18.72%, and the gas saturation increased from 56.92% to 61.9%, an increase of 5 percentage points. Oil driving efficiency increased from 73.5% to 75.4%.
(2) Effects of Permeability
As shown in Figure 14 and Figure 15, when the injection pressure was 16 MPa, the permeability increased from 8.36 mD to 74 mD, and the average bound water saturation after three cycles of oil and gas mutual drive decreased from 23.8% to 20.8%, a decrease of approximately 3 percentage points. The average residual oil saturation decreased from 22.74% to 19.47%, a decrease of approximately 3.3 percentage points. The average gas saturation increased from 53.46% to 55.65%, an increase of 2.2 percentage points, while the average gas drive efficiency increased from 70.1% to 75.4%, an increase of approximately 5.3 percentage points.
(3) Effects of Pressure
The effects of pressure on the multi-cycle oil–gas mutual drive are shown in Figure 15. When the pressure increased from 16 MPa to 22 MPa, the average bound water saturation after three cycles of oil and gas mutual drive in the low-permeability core decreased from 23.8% to 22.65%, a decrease of approximately 1.1 percentage points. The average residual oil saturation decreased from 22.74% to 21.7%, a decrease of approximately 1.0 percentage point. The average gas saturation increased from 53.46% to 59.73%, an increase of 6.3 percentage points, and the average oil driving efficiency increased from 70.1% to 71.9%, an increase of approximately 1.8 percentage points.
The average bound water saturation of the medium-permeability core decreased from 21.95% to 20.5%, a decrease of approximately 1.5 percentage points. The average residual oil saturation decreased from 20.81% to 19.18%, a decrease of approximately 1.6 percentage points. The average gas saturation increased from 54.69% to 60.595%, an increase of 5.9 percentage points, and the average oil repulsion efficiency increased from 73.32% to 75.83%, an increase of approximately 2.5 percentage points. The average bound water saturation of the high-permeability core was reduced from 20.8% to 19.78%, a decrease of approximately 1.0 percentage point. The average residual oil saturation was reduced from 19.47% to 18.59%, a decrease of approximately 0.9 percentage points. The average gas saturation increased from 55.65% to 61.63%, an increase of 6 percentage points, and the average oil driving efficiency increased from 75.39% to 76.8%, an increase of approximately 1.41 percentage points.

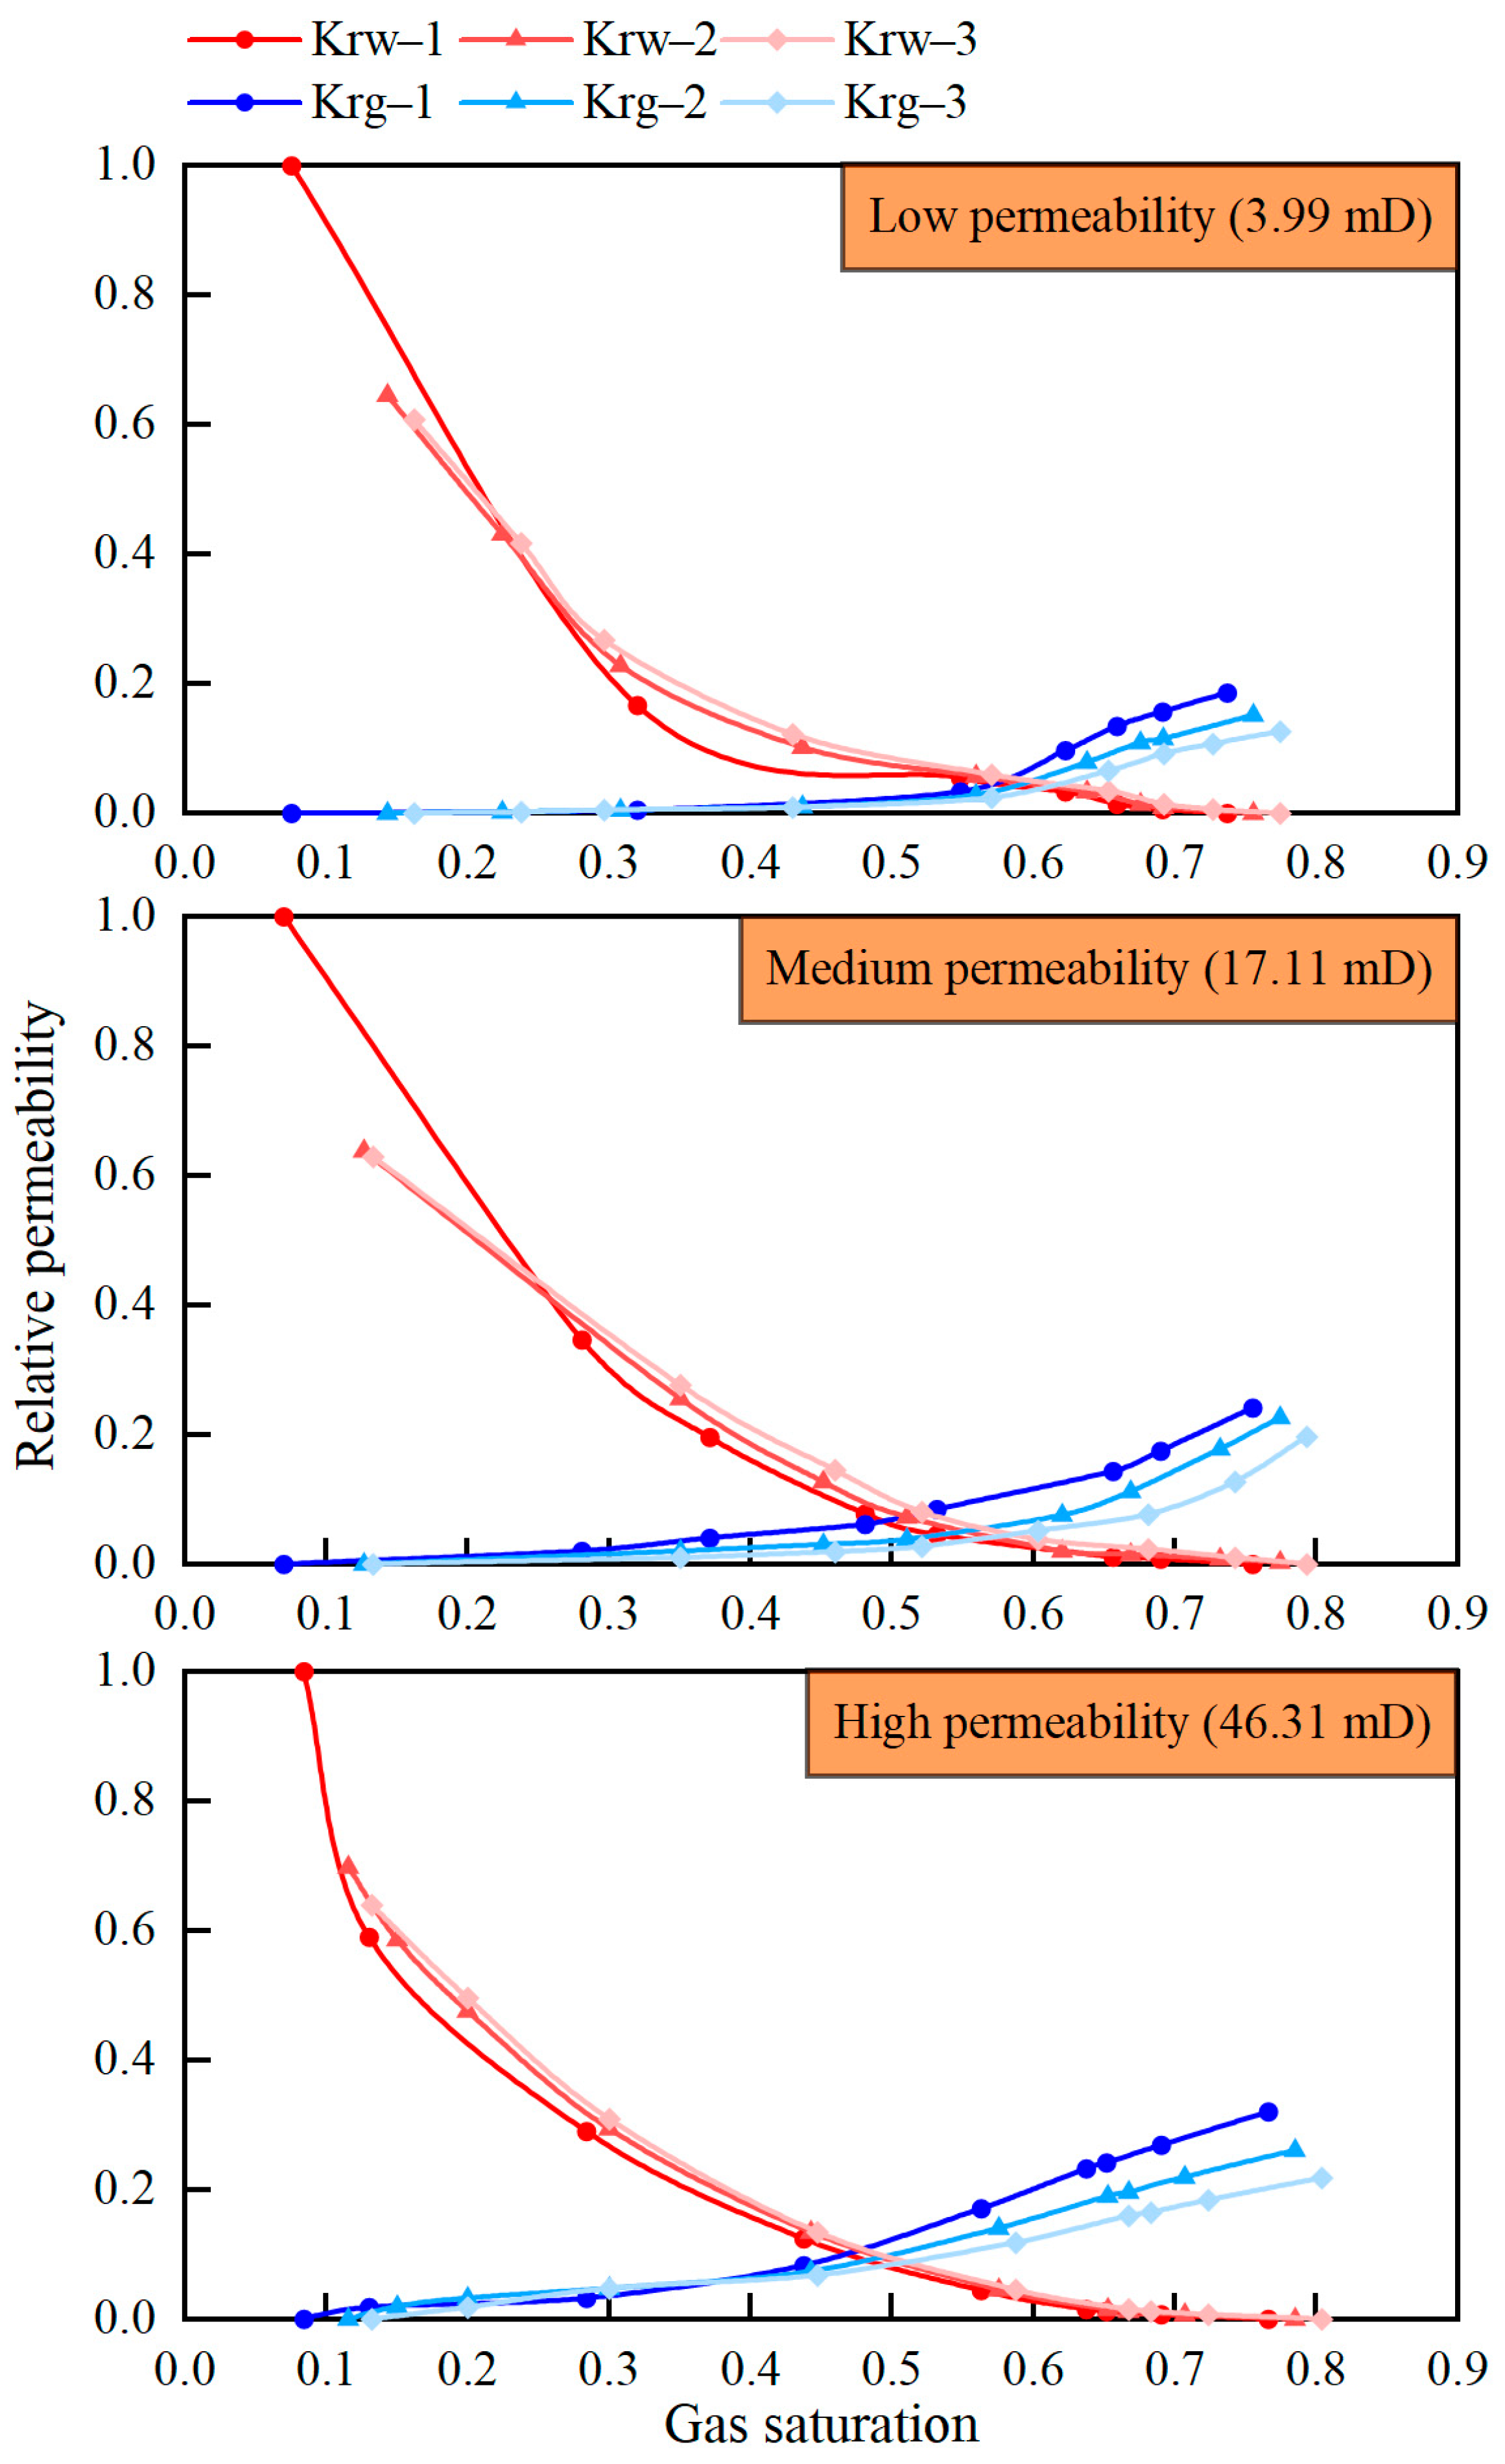
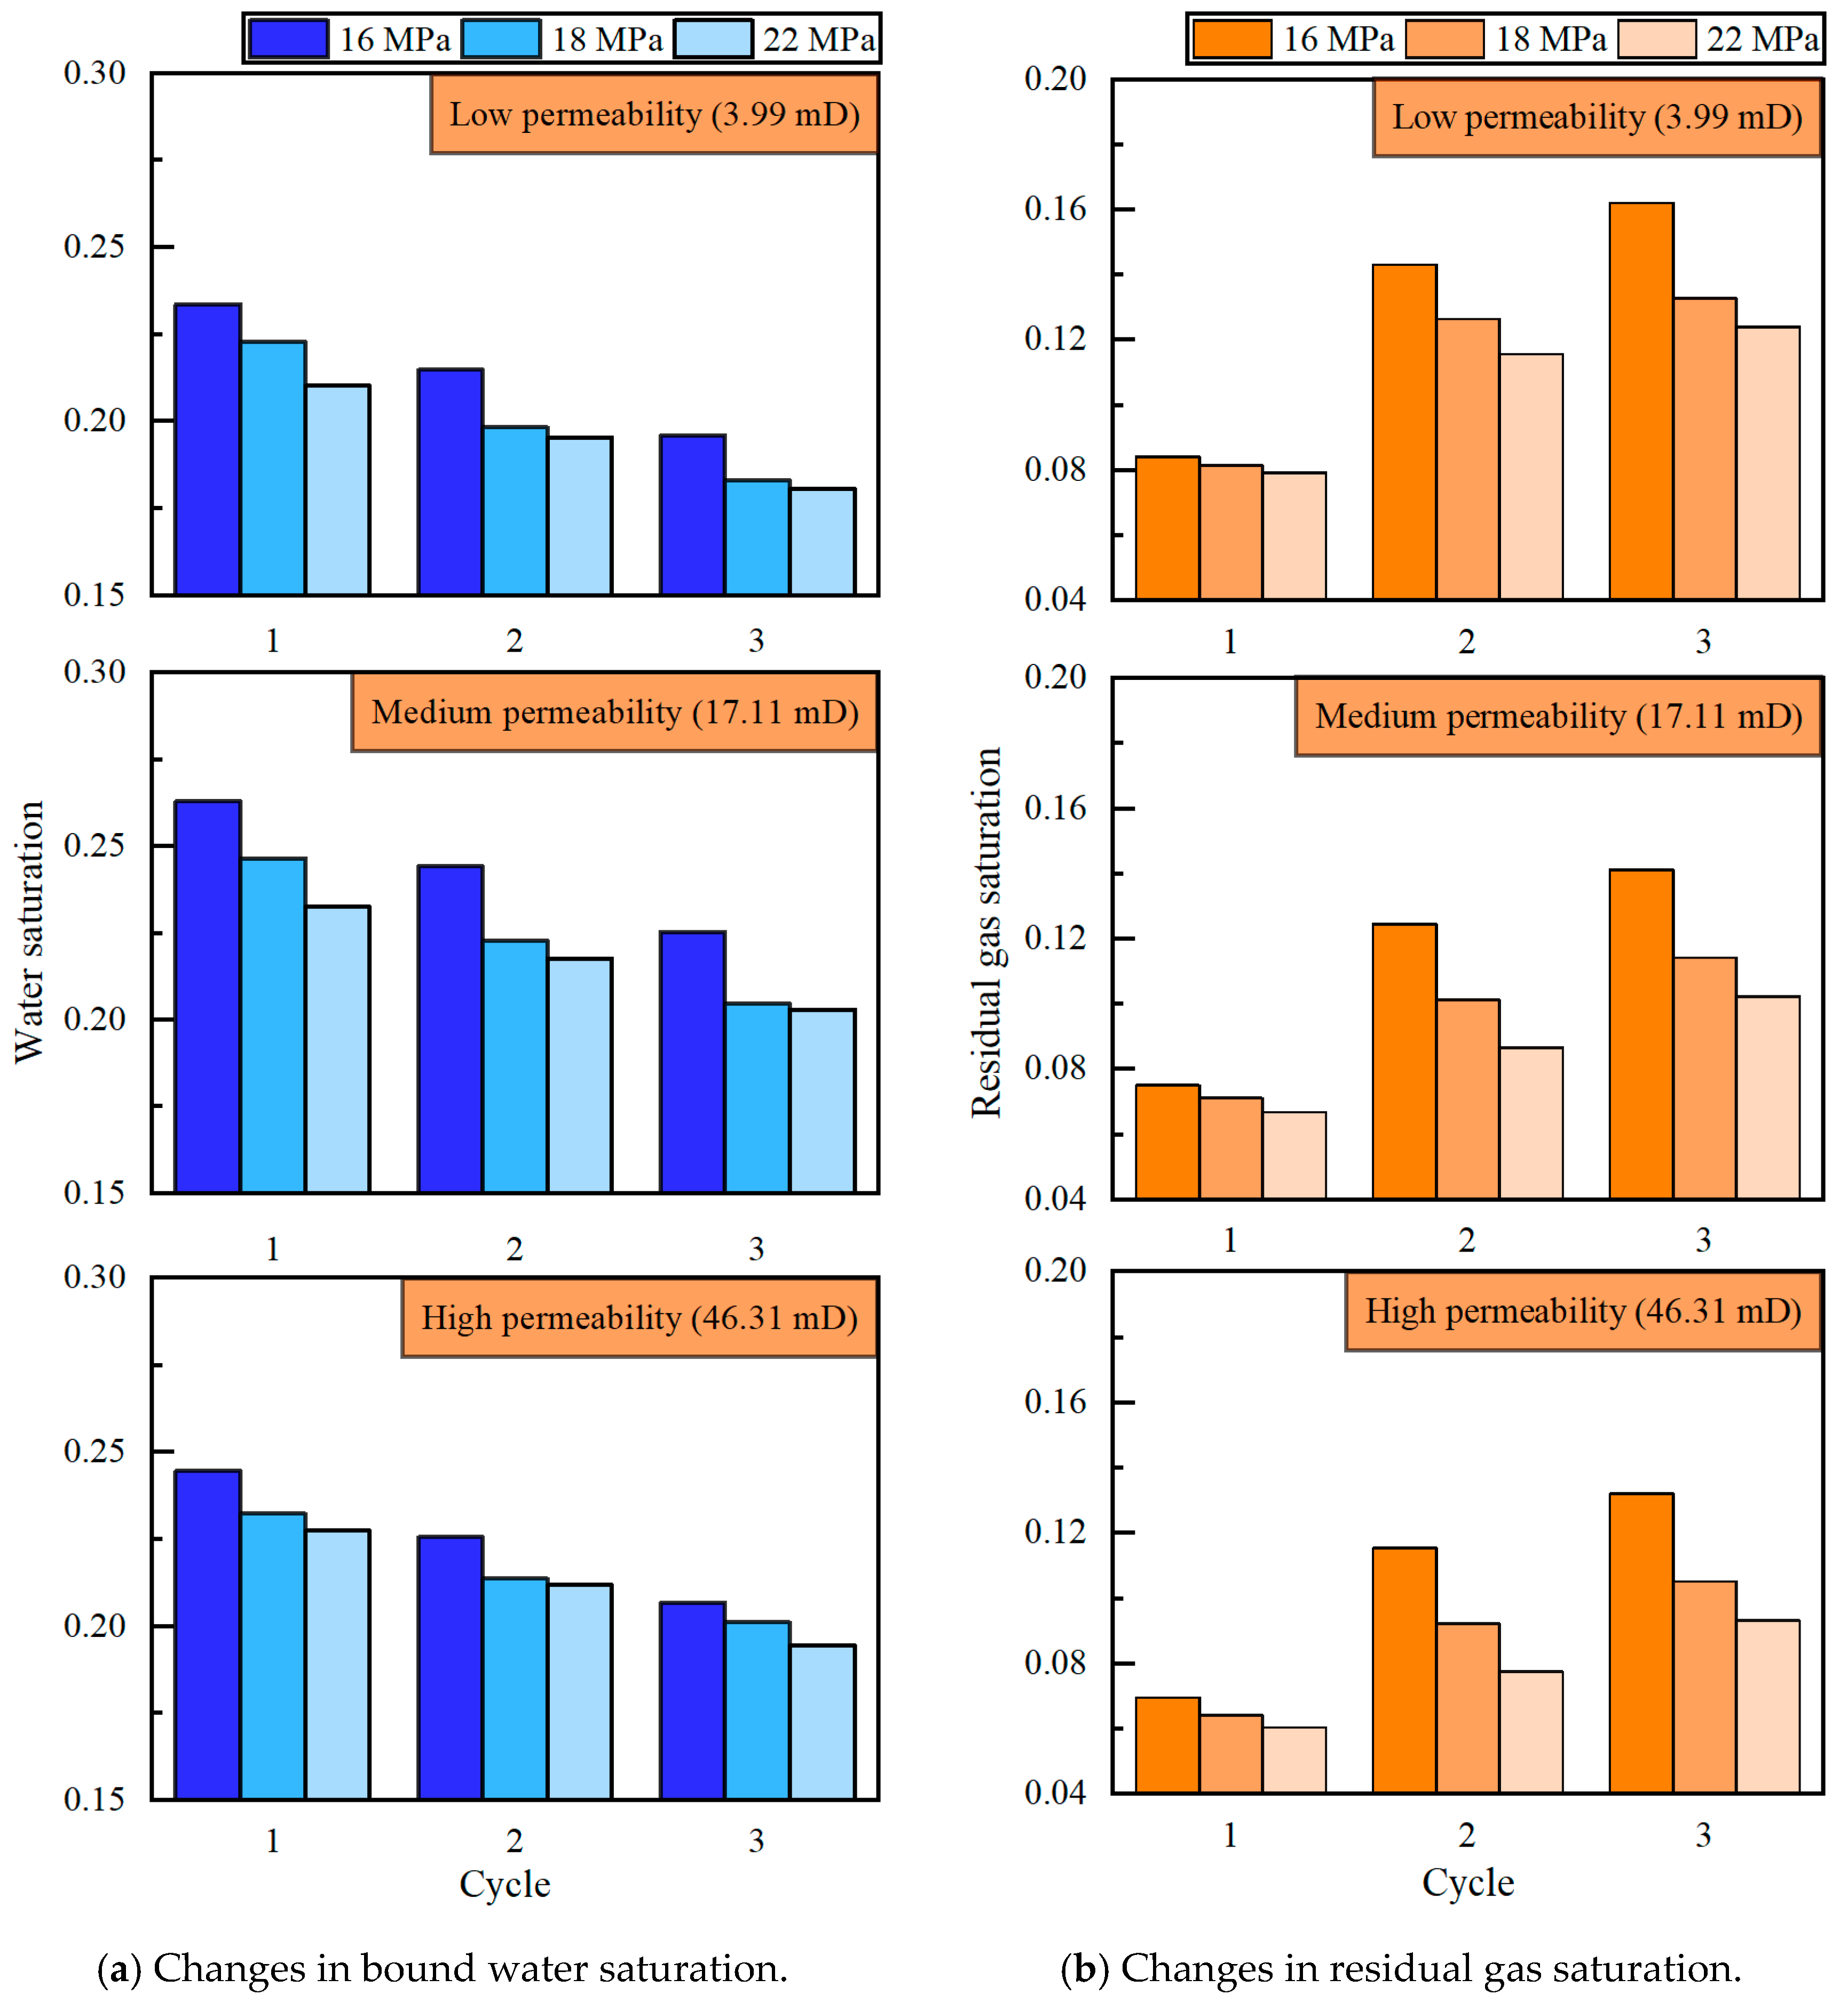
3.1.3. Gas–Water Mutual Drive

(1) Effects of Multi-Cycle Injection–Production
The relative permeability curve of gas–water is shown in Figure 16 and Figure 17. At an injection pressure of 16 MPa, after three cycles of gas–water mutual driving, the bound water saturation of the low-permeability core decreased from 26.31% to 22.25%, the gas saturation increased by 4.1%, and the residual gas saturation increased by 16.21%. The bound water saturation of the medium-permeability core decreased from 24.47% to 20.68%, the gas saturation increased by approximately 3.8%, and the residual gas saturation increased to 14.13%. The bound water saturation of the high-permeability core decreased from 23.38% to 19.6%, the gas saturation increased by about 3.8%, and the residual gas saturation increased to 13.21%.
The gas-containing pore volume increases due to the decrease in bound water saturation, leading to an increase in total reservoir capacity. Furthermore, with the increase in injection and extraction cycles, the residual gas saturation increases, the usable gas-containing pore volume gradually decreases, and the effective inventory of the reservoir decreases.
(2) Effects of Permeability
As shown in Figure 16 and Figure 17, when the injection pressure is 16 MPa, the permeability increases from 3.99 mD to 46.31 mD, and the average bound water saturation after three cycles of gas–water mutual drive decreases from 24.43% to 21.49%, with a corresponding increase of approximately 3 percentage points in gas saturation. The average residual gas saturation decreases from 10.18% to 8.25%, a decrease of approximately 1.9 percentage points.
(3) Effects of Pressure
The effects of pressure on the multi-cycle gas–water mutual drive are shown in Figure 16 and Figure 17. When the pressure increased from 16 MPa to 22 MPa, the average bound water saturation after three cycles of gas–water mutual drive in the low-permeability core decreased from 24.43% to 21.78%, and the gas saturation increased by approximately 2.7 percentage points. The average residual gas saturation decreased from 12.98% to 10.64%, a decrease of approximately 2.3 percentage points. The average bound water saturation of the medium-permeability core decreased from 22.57% to 21.2%, and the gas saturation increased by approximately 1.4 percentage points. The average residual gas saturation decreased from 11.37% to 8.53%, a decrease of approximately 2.8 percentage points. The average bound water saturation of the high-permeability core decreased from 21.49% to 19.55%, and the gas saturation increased by approximately 1.9 percentage points. The average residual gas saturation decreased from 10.57% to 7.70%, a decrease of approximately 2.9 percentage points.

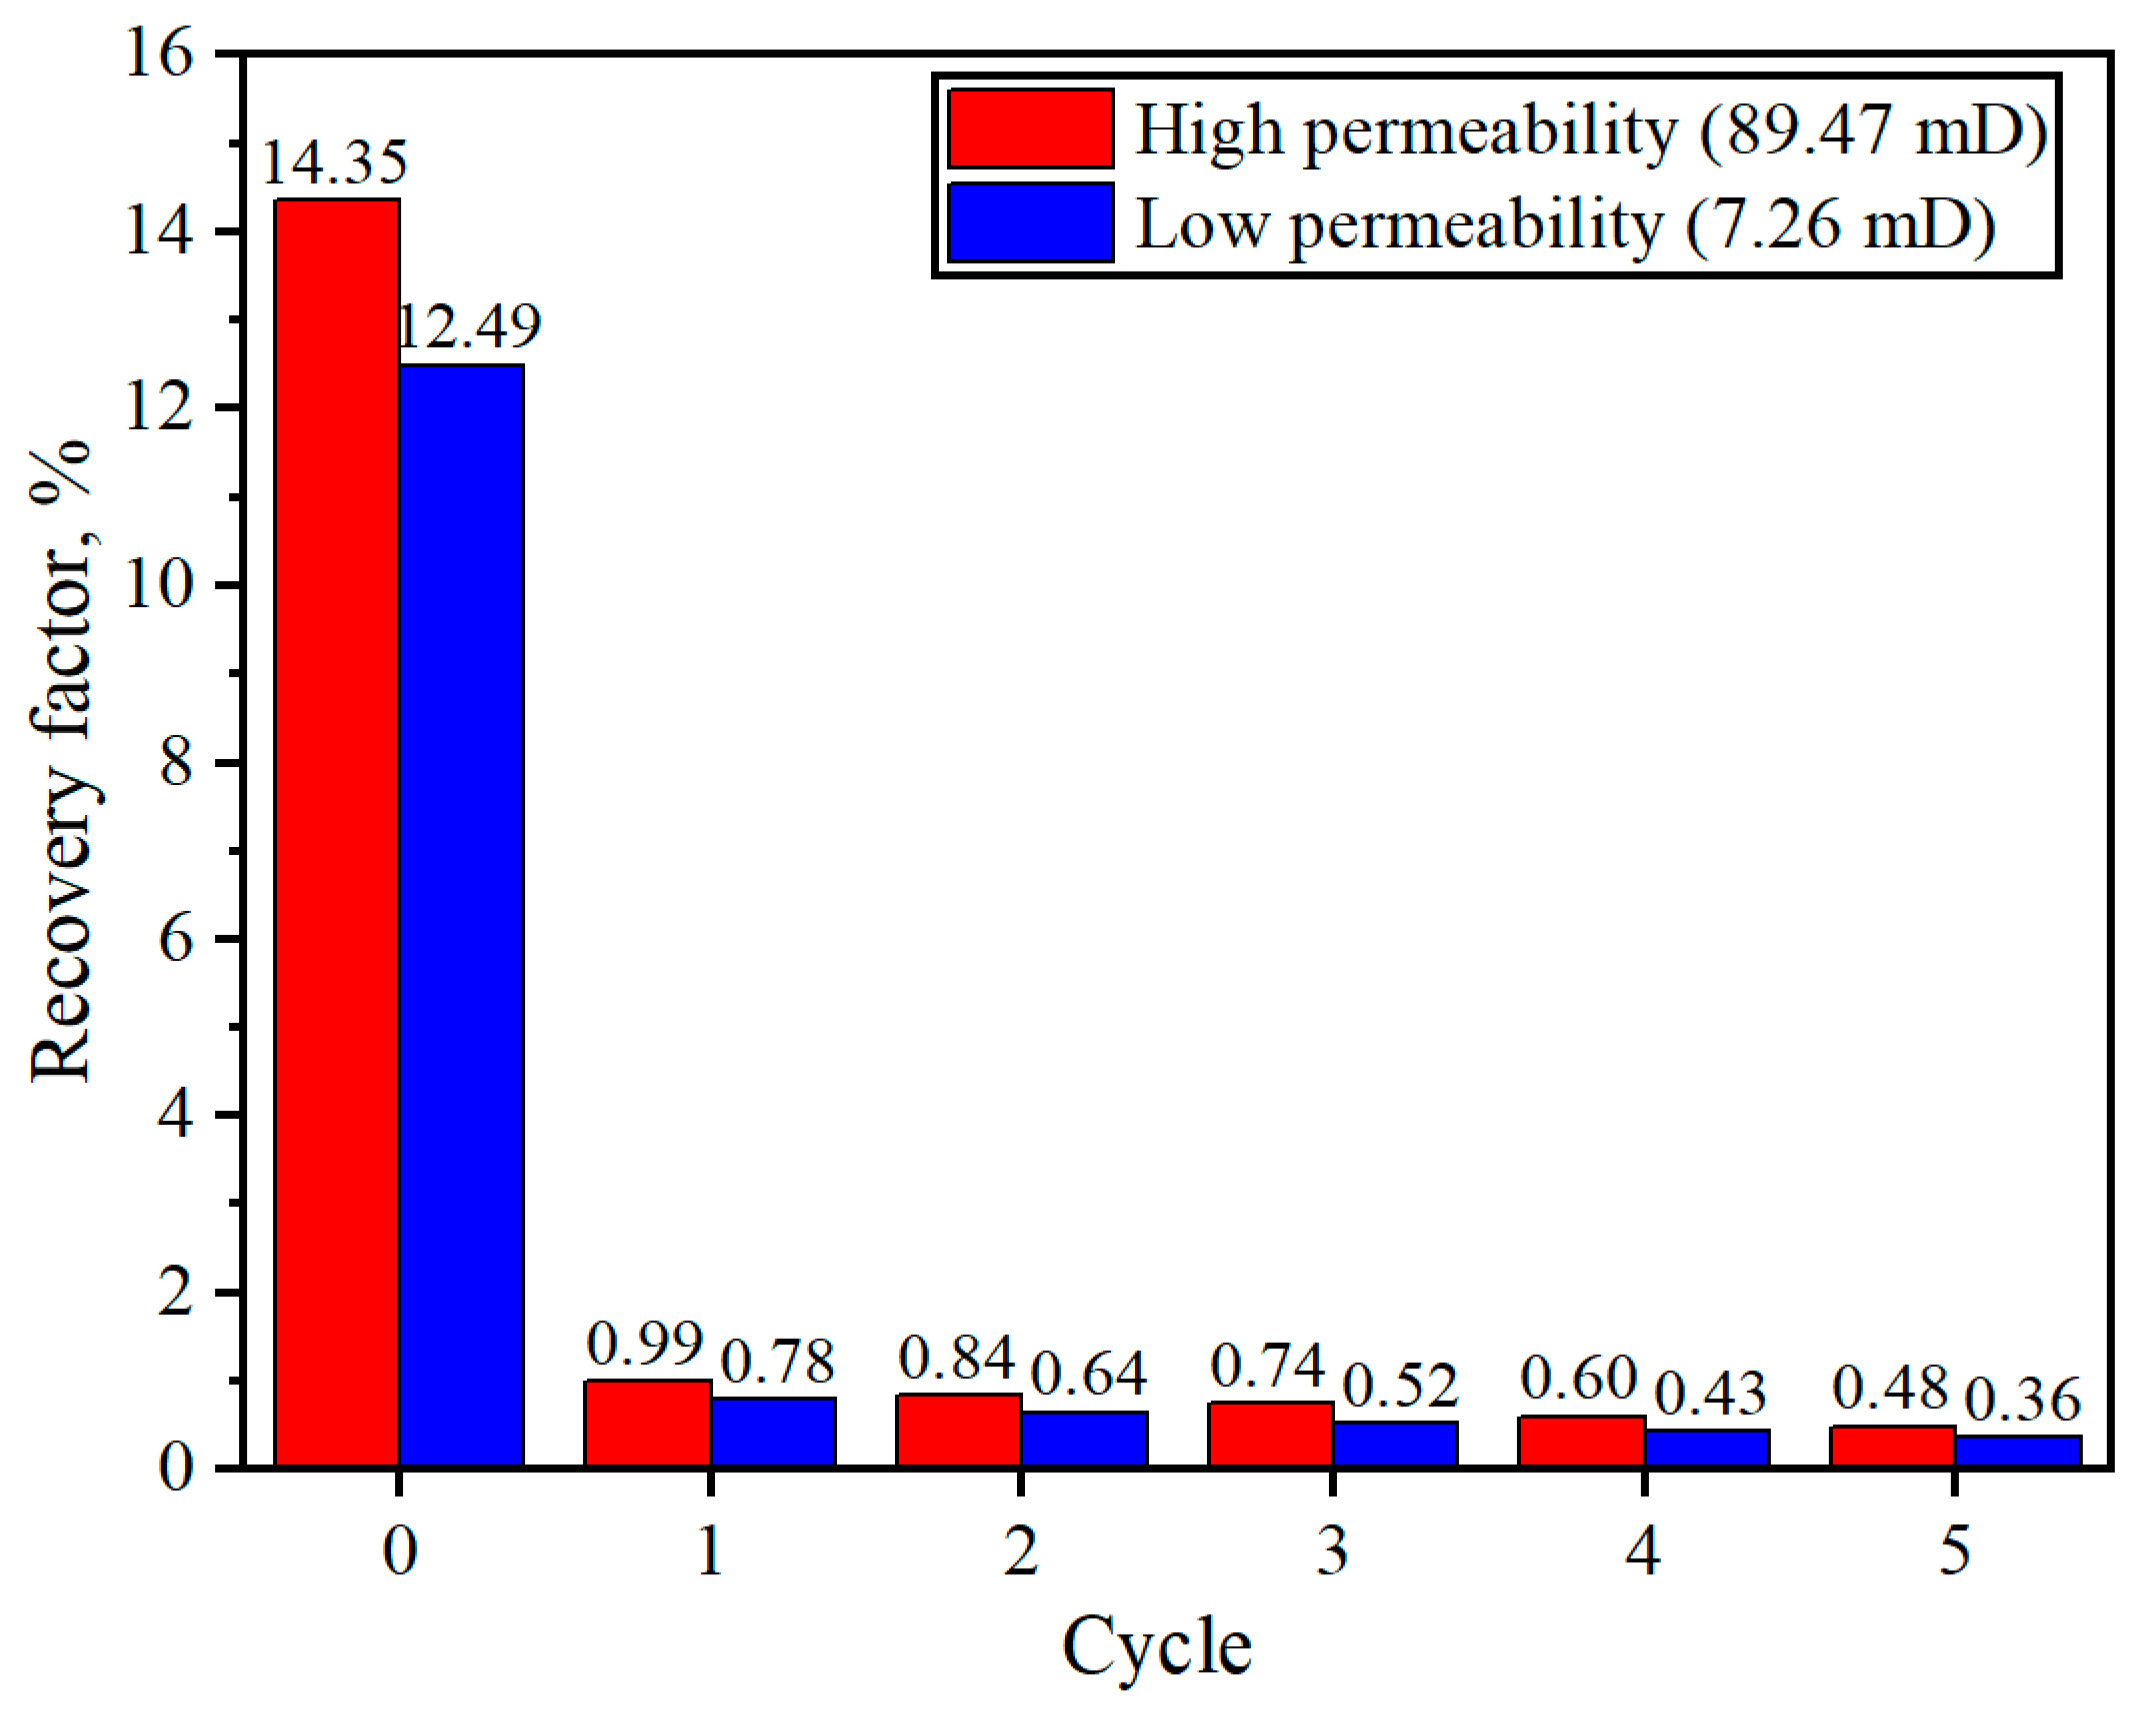
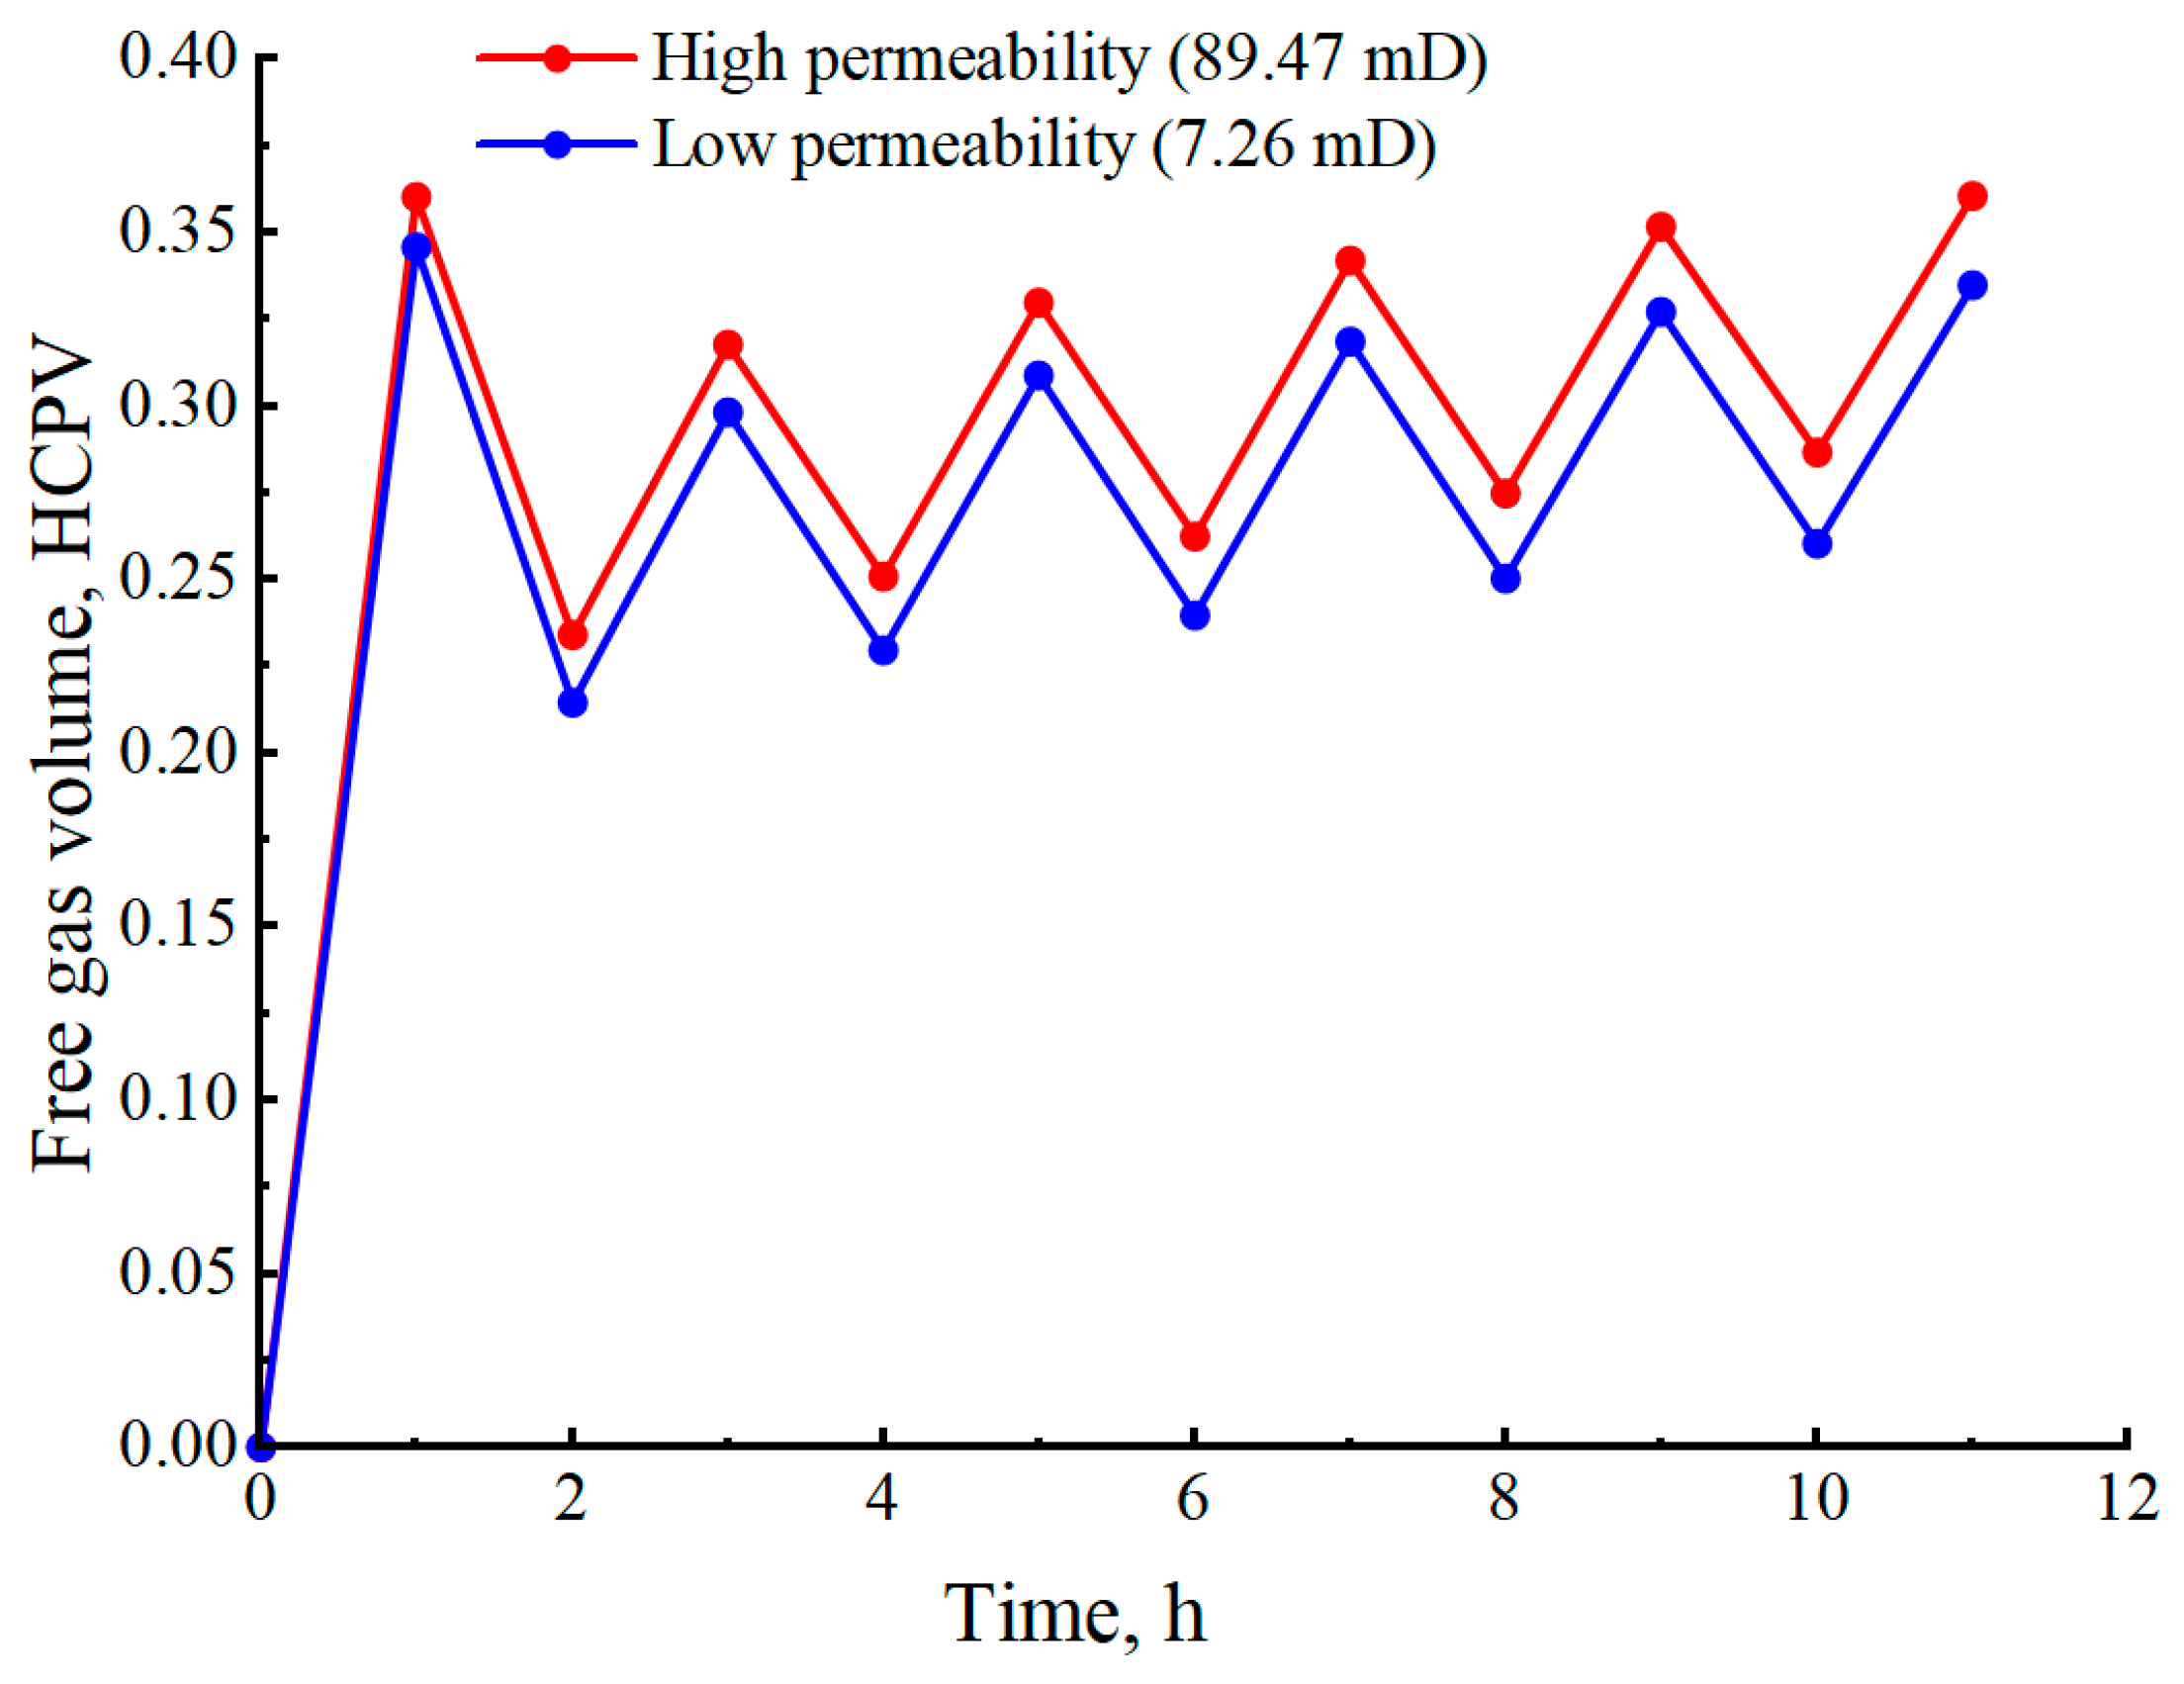
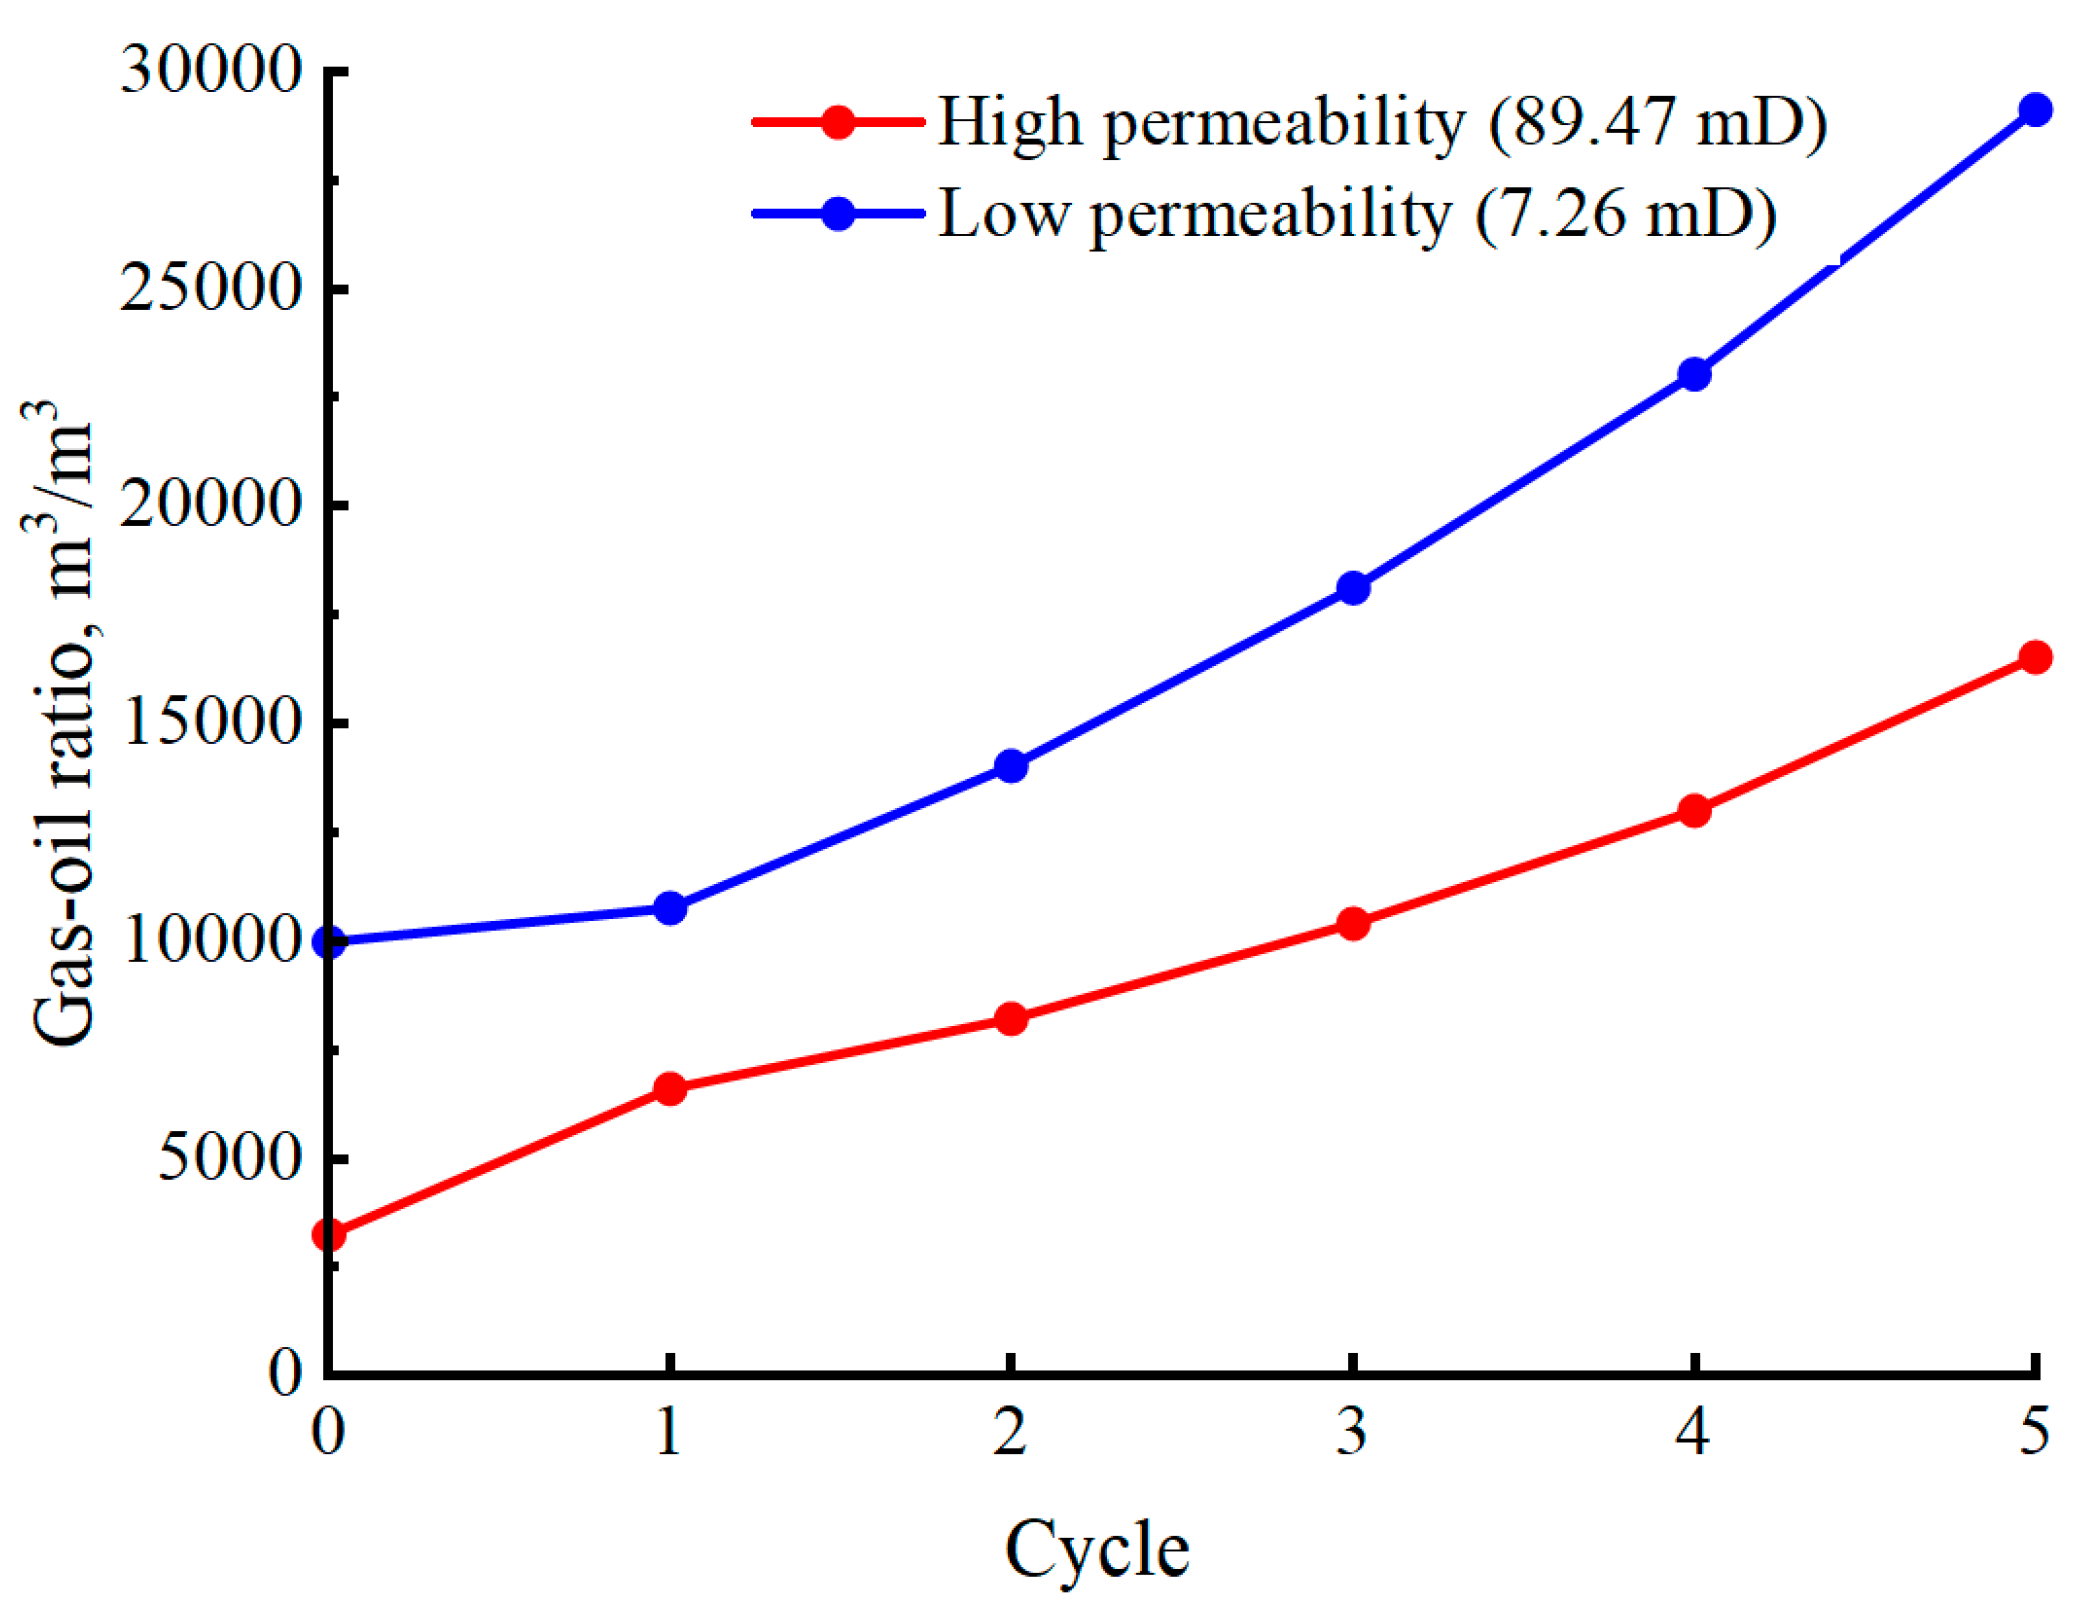
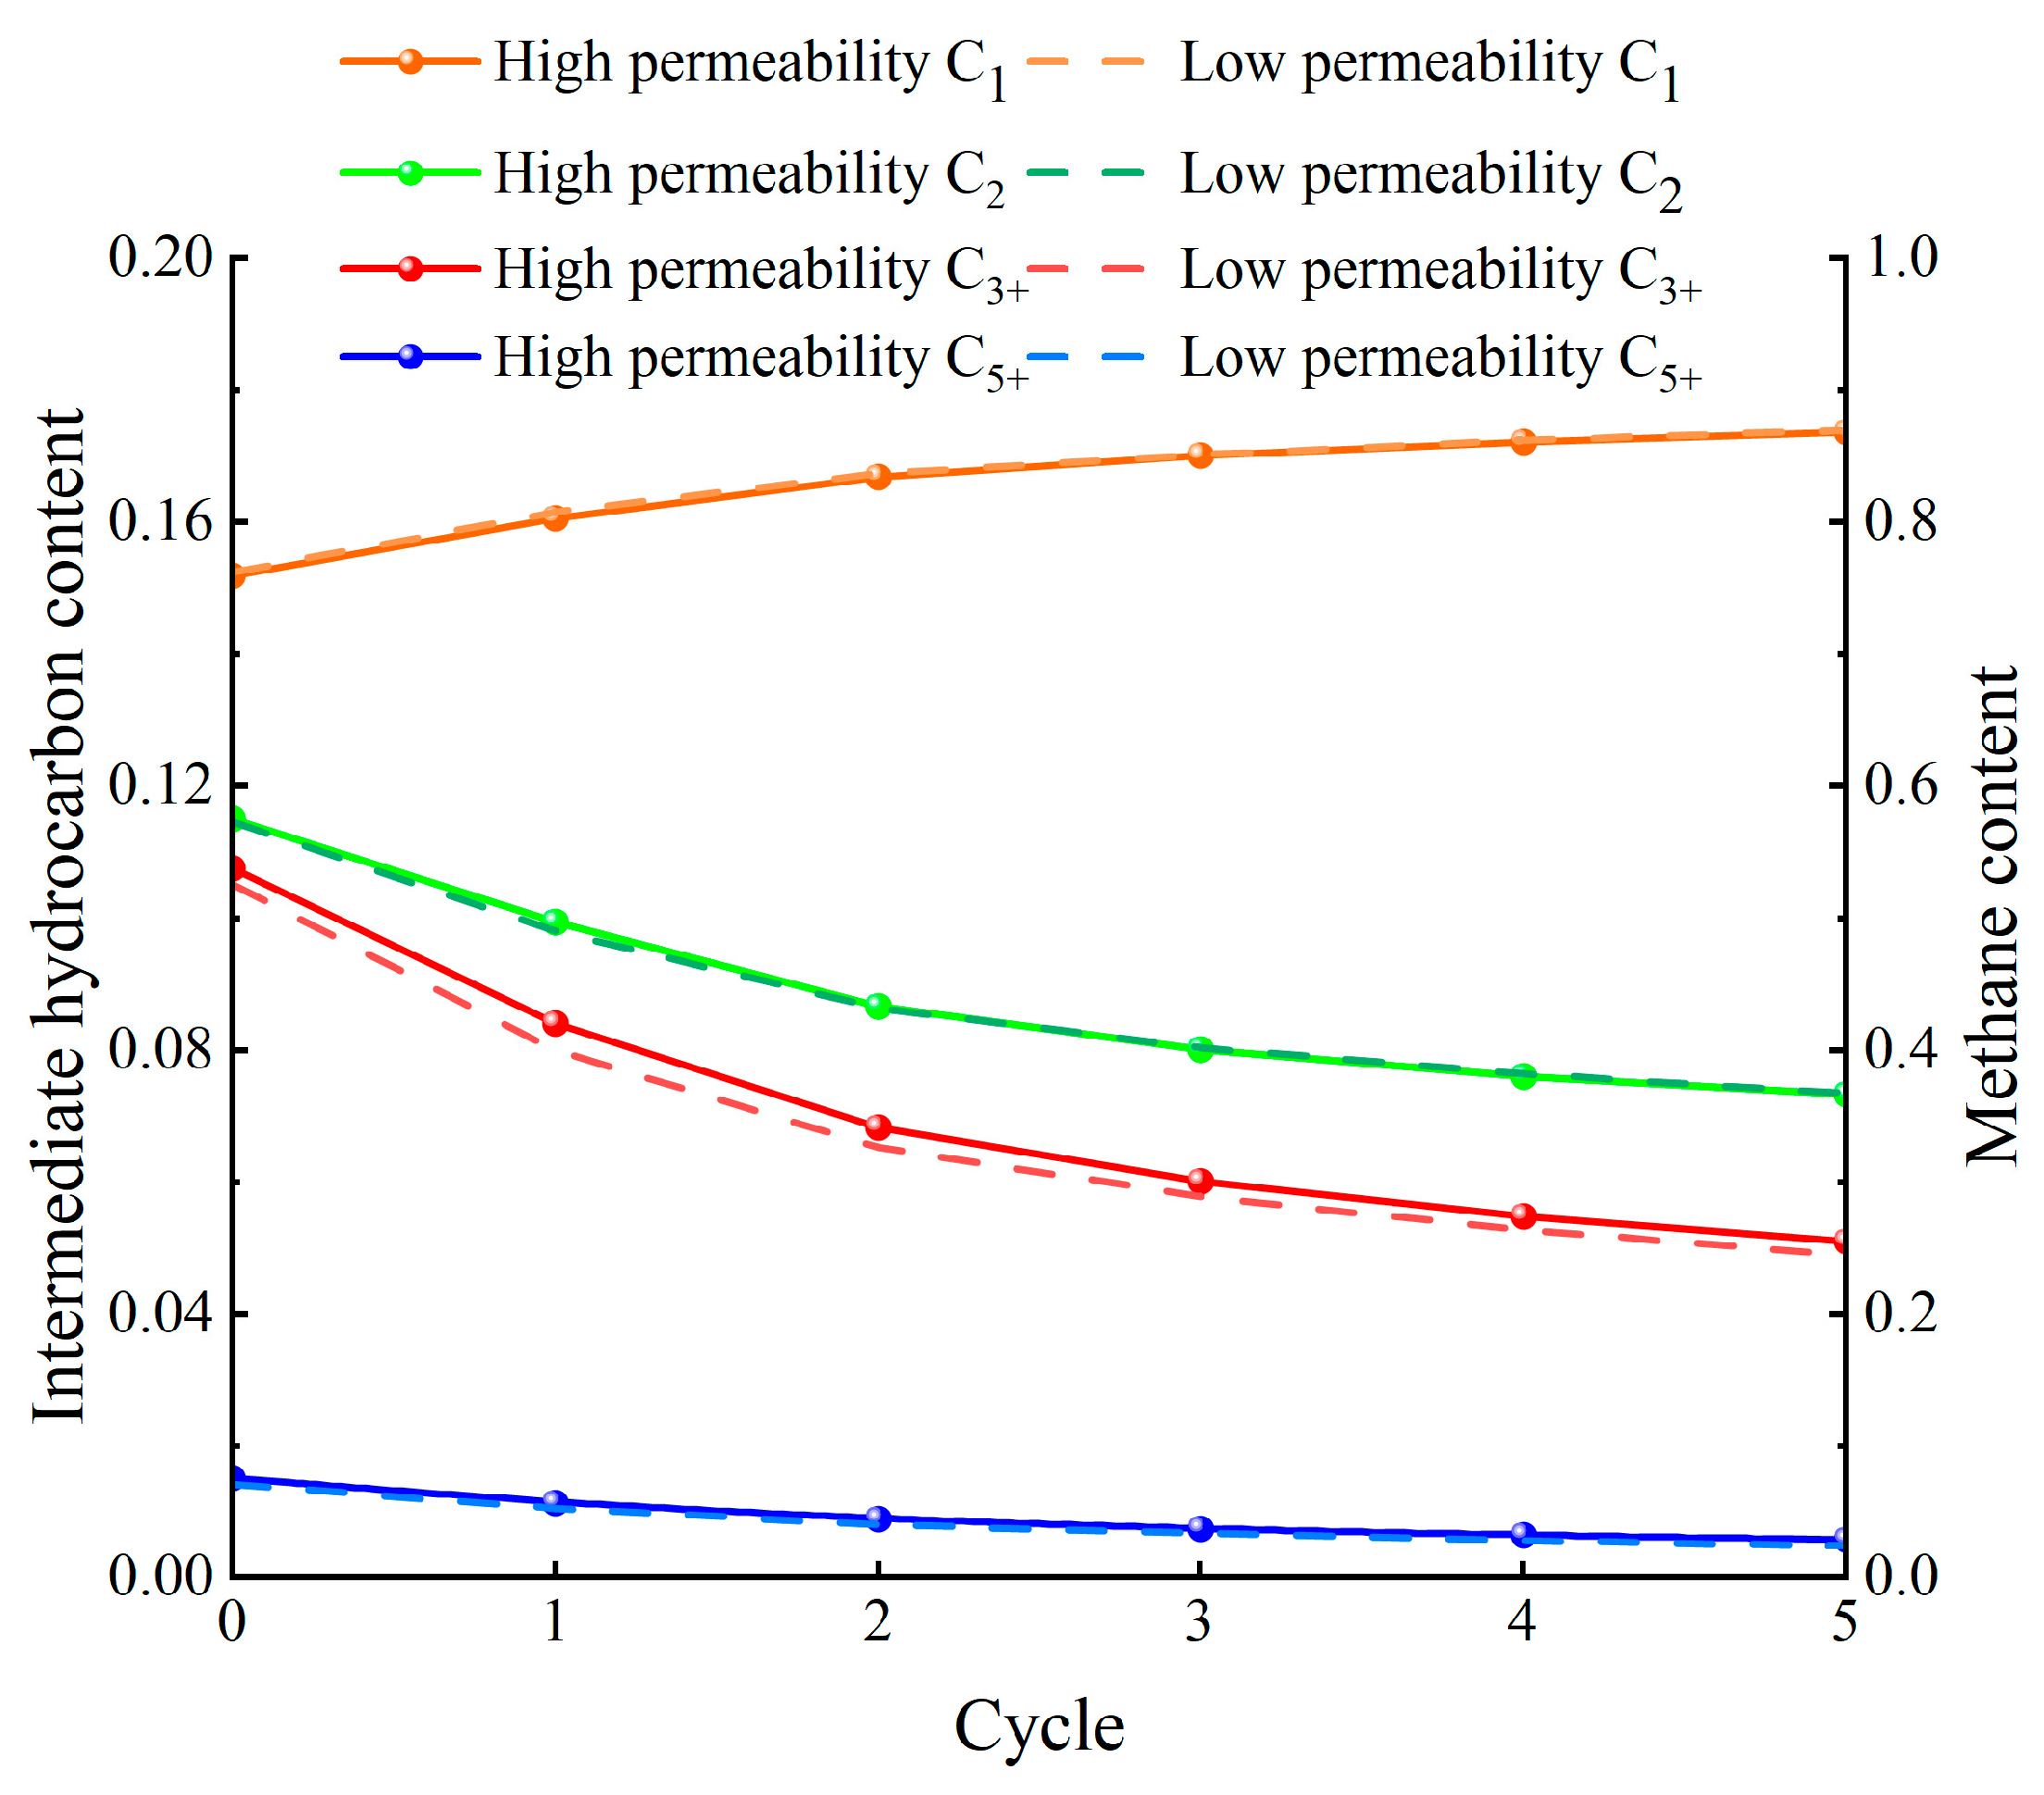
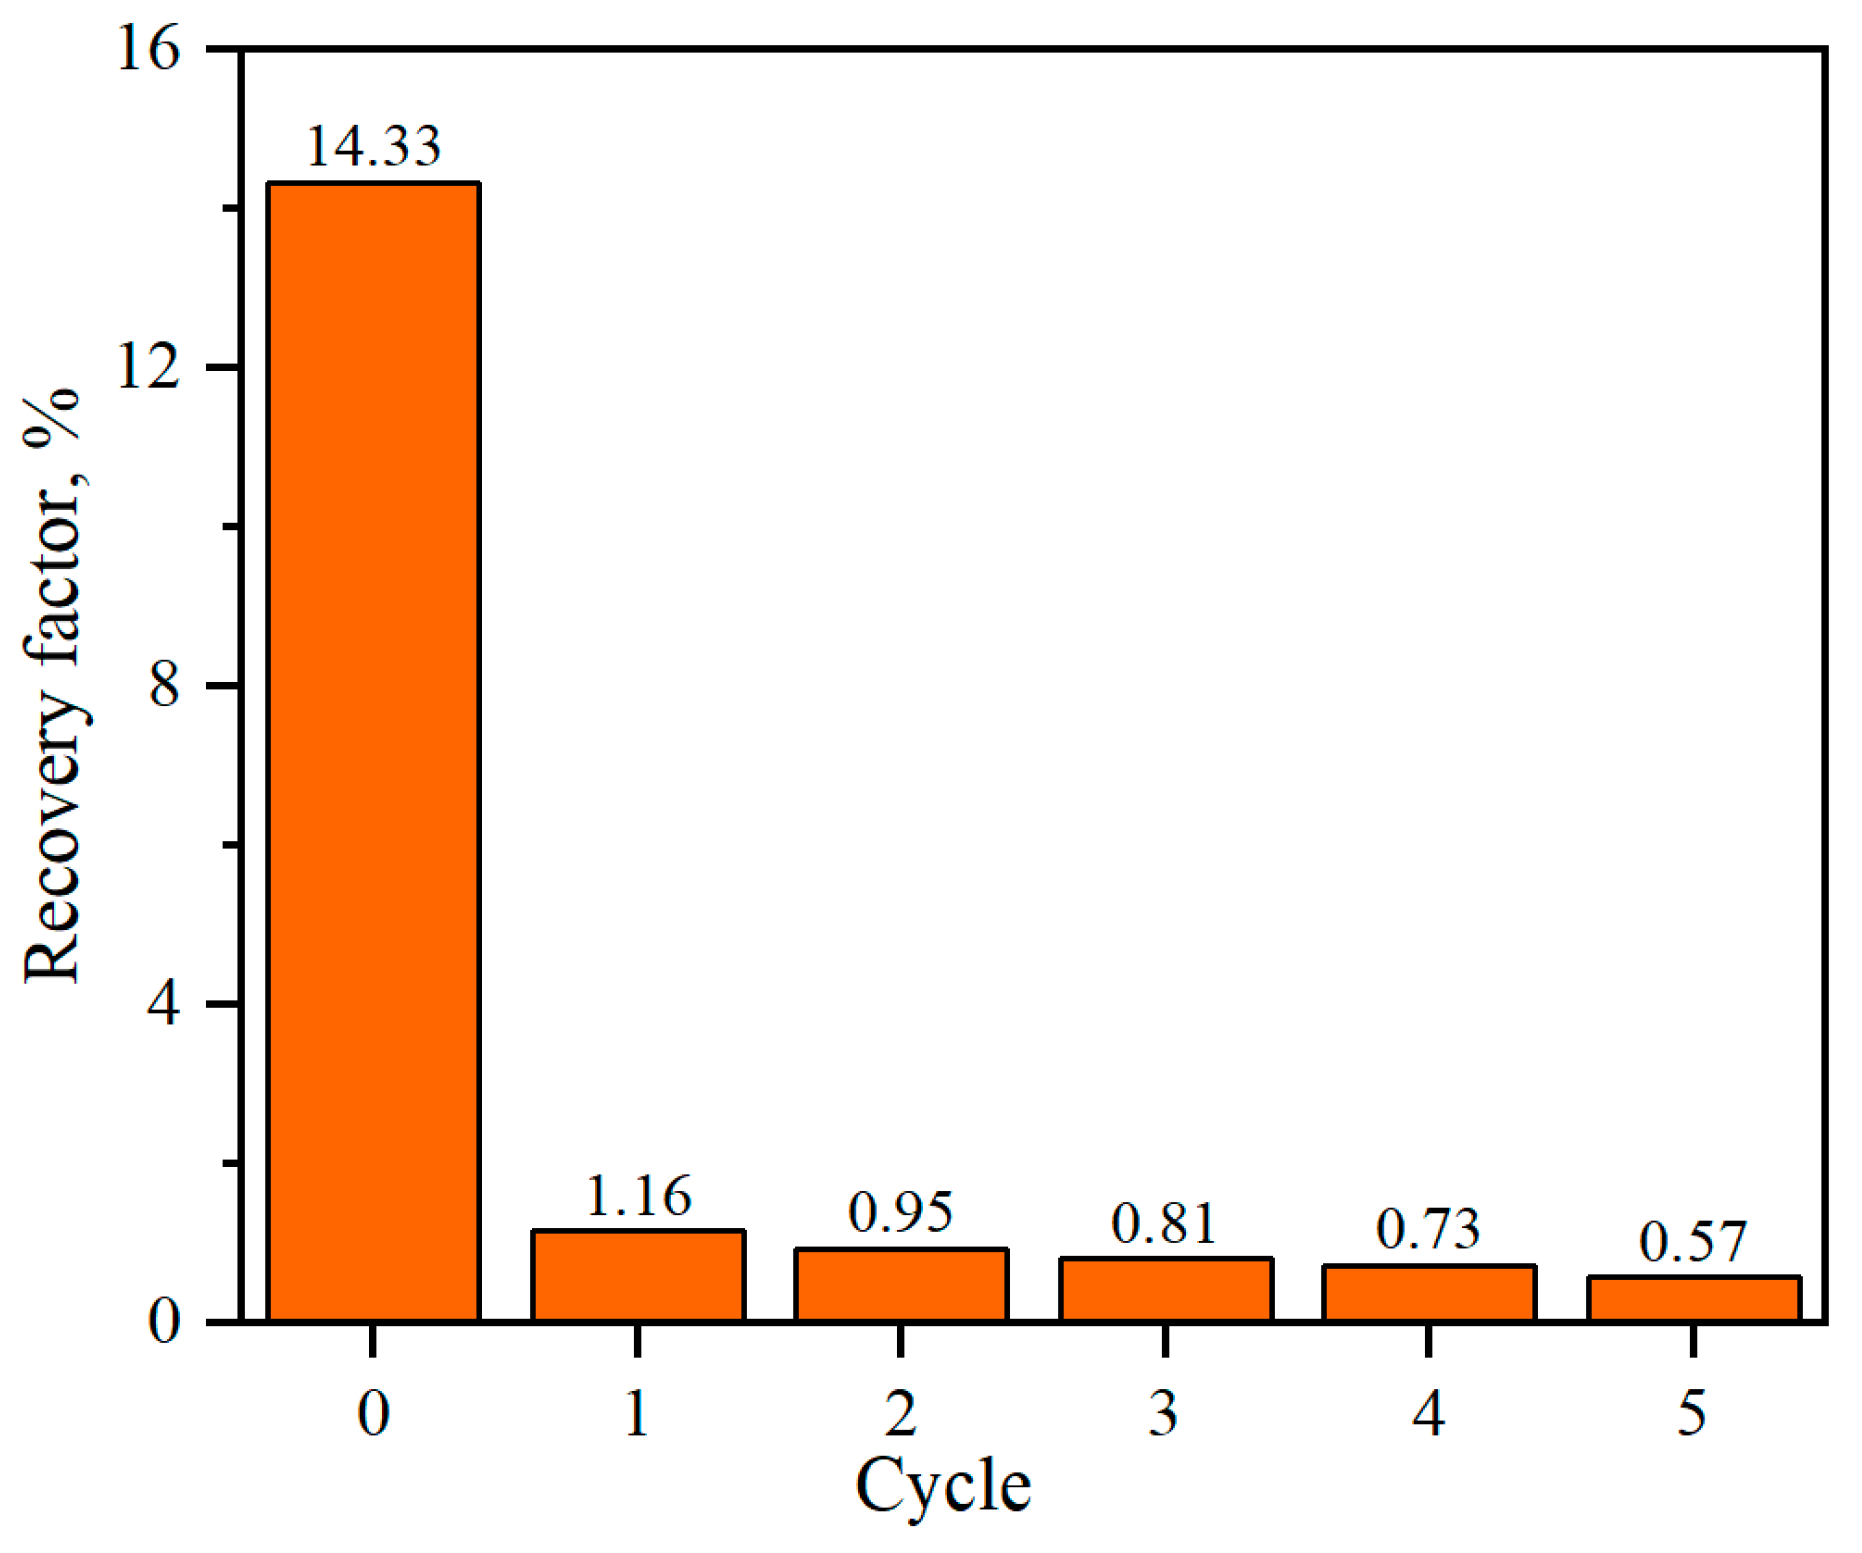
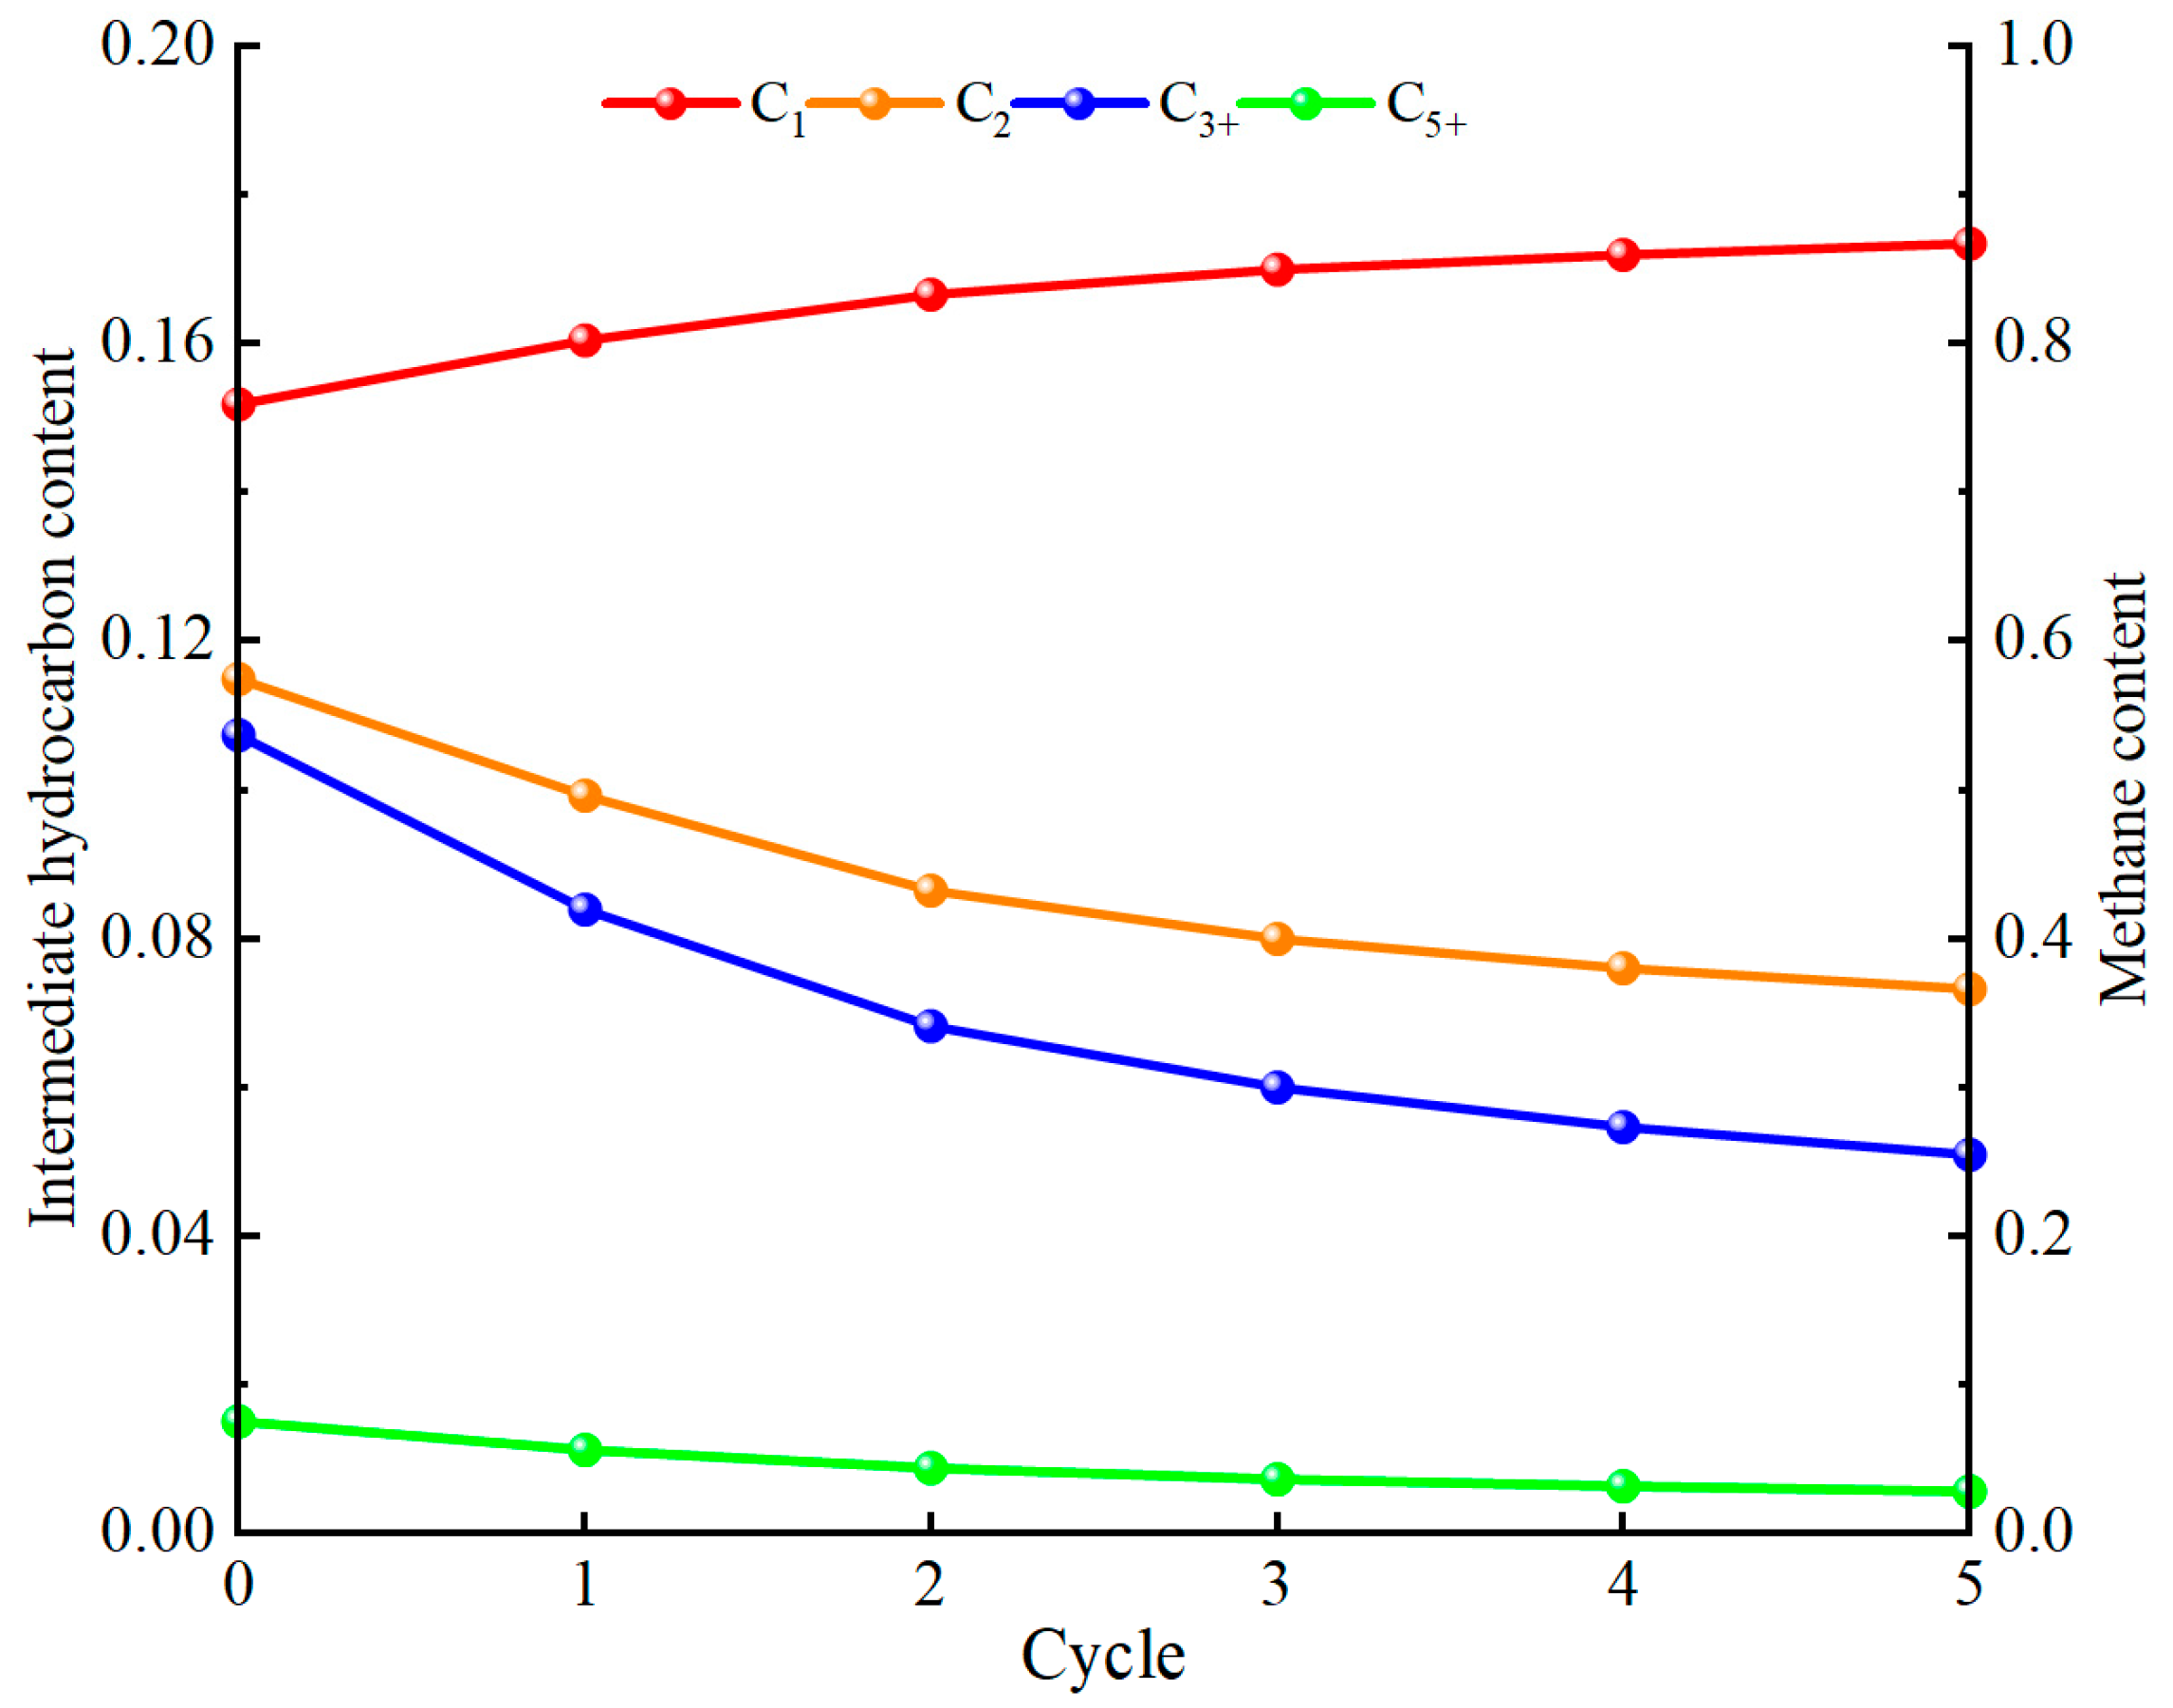
3.2. Phase Change Characteristics in Multi-Cycle Huff and Puff Experiments

The variations in recovery factor and free gas volume are shown in Figure 18, Figure 19 and Figure 20. After exhaustion and multi-cycle huff and puff, the crude oil recovery factor from the high-permeability core reaches 18.01%, and the free gas volume reaches 0.36 hydrocarbon pore volume (HCPV), with 14.35% extracted by depletion and 3.66% extracted by multi-cycle huff and puff. In contrast, the crude oil recovery factor from the low-permeability core reaches 15.23%, with a free gas volume of 0.33 HCPV, where 12.49% is extracted by exhaustion and 2.74% is extracted by multi-cycle huff and puff. The recovery factor per cycle gradually decreases as the number of cycles increases, from 0.99% in cycle 1 to 0.48% in cycle 5. The pumping and evaporation effects of the injected gas on crude oil gradually weaken. The cumulative recovery factor increases by 3.66%.
The gas–oil ratio and gas composition changes are shown in Figure 21 and Figure 22. Compared with the low-permeability core, the high-permeability lithology has less influence on the oil–gas fluidity ratio, lower residual oil saturation, and lower recovered gas–oil ratio. The gas–oil ratio increased from 6600 to 16,500 m3/m3 from the first cycle to the fifth cycle of the high-permeability core and from 10,800 to 29,000 m3/m3 from the first cycle to the fifth cycle of the low-permeability core. As the injection and extraction throughput cycle increases, methane content rises, while the content of intermediate hydrocarbons in the extracted gas decreases. Specifically, methane content rises from 80.7% to 87.6%, gradually approaching the composition of the injected gas. The content of intermediate hydrocarbons (C2~C5+) decreases from 19.5% to 13.0%. The ratio of recovered gas and oil in the high-permeability core is even lower. The smaller the change in the recovered gas component, the less the extraction effect on the intermediate hydrocarbons of the residual oil, which leads to better physical properties of the residual oil. Smaller changes in the extracted gas components and a reduced extraction effect on residual oil intermediate hydrocarbons improve the physical properties of the residual oil, thus enhancing the efficiency of the subsequent injection and extraction cycles.

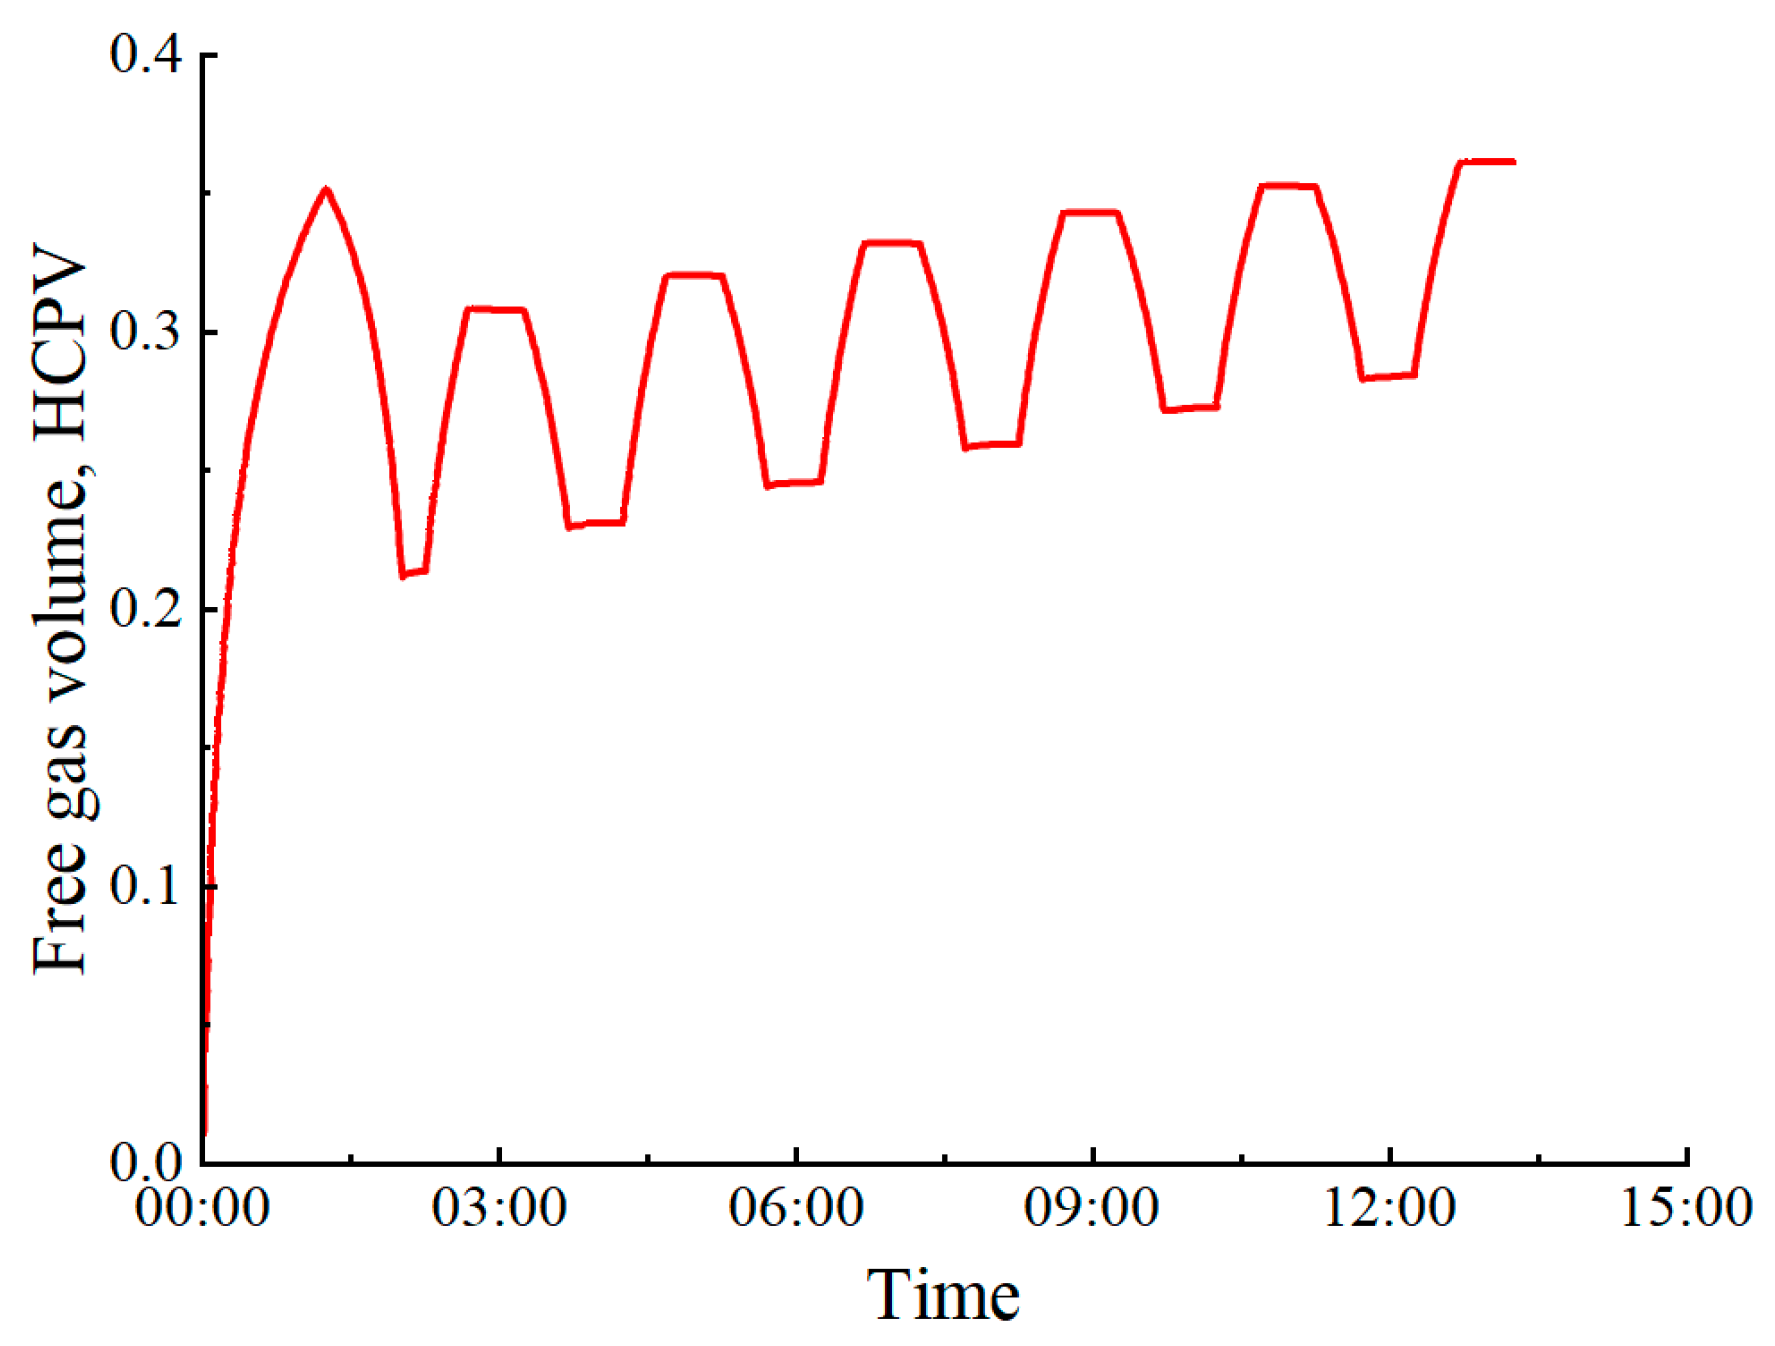
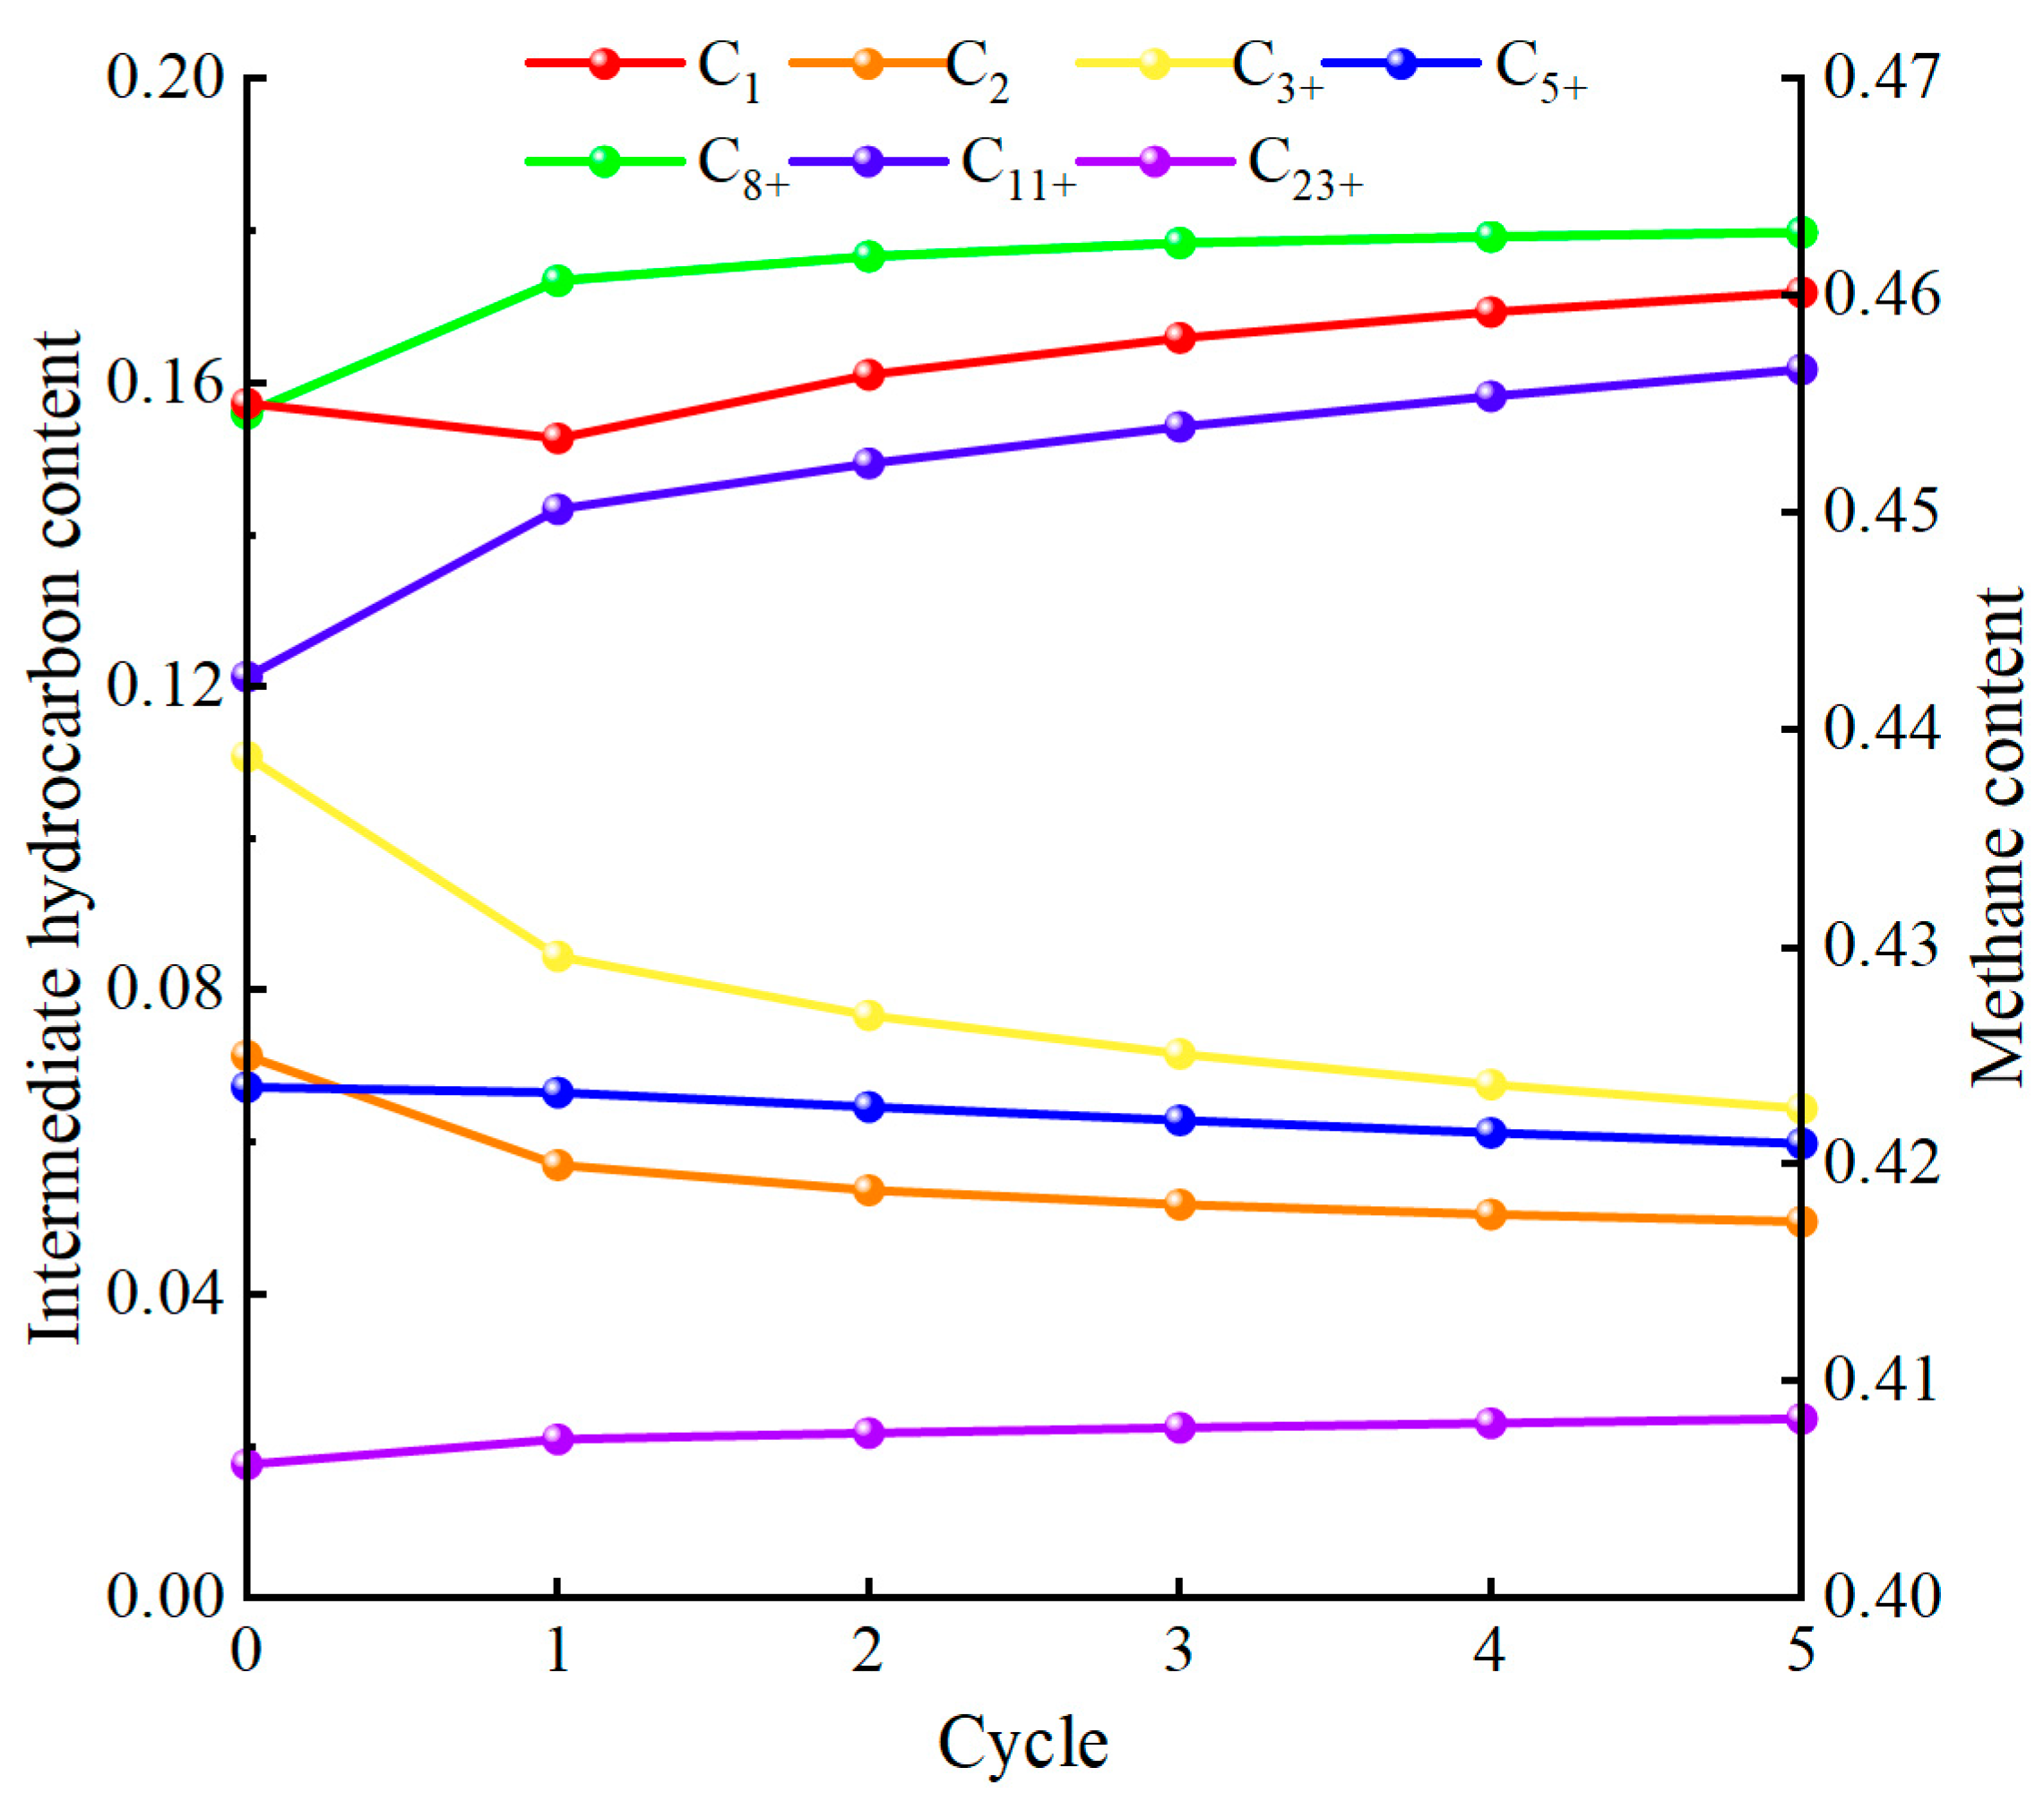
3.3. Phase Change Characteristics in Numerical Simulation of Multi-Cycle Huff and Puff

The recovery factor during multi-cycle huff and puff is shown in Figure 23 and Figure 24. Based on the huff and puff scheme in Table 8, the cumulative crude oil recovery factor after depletion and five cycles of huff and puff is 18.55%, including 14.33% recovery factor from depletion and 4.22% recovery factor from huff and puff cycles. The figures show the following: the recovery factor of a single cycle gradually decreases with the increase in huff and puff cycles, e.g., from 1.16% in the first cycle to 0.57% in the fifth cycle.
The free gas volume is shown in Figure 25. The free gas volume can be up to 0.35 HCPV. The free gas volume gradually increases from 3.08 to 0.353 HCPV.
The oil and gas saturation changes are shown in Figure 26. The average gas saturation of the model increases from 16.1% to 20.6%, while the average oil saturation decreases from 59.21% to 54.8% with the increase in huff and puff cycles.
The changes in the gas and residual oil components are shown in Figure 27 and Figure 28. Based on the changes in recovered oil and gas components, it can be seen that the intermediate hydrocarbon content of the recovered gas decreases while the methane content increases, with the methane content increasing from 80.2% to 87.3%, which is close to the injected gas component. The methane and recombinant contents of residual oil increase, with the intermediate hydrocarbon content (C2–C5+) decreasing by 3.4% and the heavy component (C8+) increasing by 2.7%.
Changes in the physical properties of oil and the PT phase diagram are shown in Figure 29 and Figure 30. Based on the summarized changes in the oil and gas components, we observed several alterations in the physical properties and the PT phase diagram of the remaining crude oil. Specifically, the crude oil became heavier, with a deterioration in its physical properties. The viscosity increased from 2.0 to 4.6 mPa·s, and the dissolved gas–oil ratio decreased from 228 to 178. The injected gas facilitates the interphase mass transfer of light hydrocarbons into the gas phase through synergistic effects of evaporation and component extraction, leading to an increased proportion of heavy components in the residual oil and a subsequent increase in crude oil viscosity. However, as the number of cycles increases, the remaining oil gradually becomes heavier with deteriorated physical properties, leading to weakened evaporation and extraction effects of the injected gas. Consequently, the impact of each subsequent cycle diminishes, resulting in a more pronounced effect in Cycle 1 compared to Cycles 2–5. Additionally, the difference between light and heavy hydrocarbon content widened, the two-phase envelope area expanded, the saturation pressure rose, and the critical point shifted to the right.

4. Conclusions

In this study, the seepage and phase change characteristics of oil reservoir-based UGS during multi-cycle injection–production were systematically investigated by combining experiments and numerical simulations. The influences of permeability, pressure, and injection–production cycles on the performance of the reservoir were revealed, and the main conclusions are as follows:
(1) Effect of multiple cycles of injection–production on seepage characteristics
Multi-cycle mutual drive exhibits significant differences in reservoir seepage characteristics. Oil–water mutual drive increases bound water saturation by 1.3% to 2.4% and residual oil saturation by 1.6% to 3.3%, while narrowing the co-permeability zone. This results in a decrease in gas saturation by 2.8% to 5.7% and reduces oil displacement efficiency by 2.5% to 4.7%, making it ultimately unfavorable for the expansion of gas storage space. Oil–gas mutual drive decreases bound water saturation by 2.6% to 3.6% and residual oil saturation by 1.6% to 2.6%. This expansion of the co-permeability zone, in turn, improves oil displacement efficiency by 3.0% to 4.5% and enhances gas storage capacity by 4.7% to 6.5%. As the injection–production cycles increase during the gas–water mutual drive process, residual gas saturation also increases, leading to a gradual decline in effective reservoir capacity.
(2) Effects of permeability and pressure
High-permeability cores exhibit a lower residual oil saturation with a decrease of approximately 4.4 percentage points and a higher oil displacement efficiency with an increase of 6.2 percentage points. This is attributed to their large pore throat radius and low fluid seepage resistance. Elevated injection pressure (16–22 MPa) enhances the ability of the repellent phase to enter microporous spaces, resulting in a decrease in bound water and residual oil saturation by 2.4 percentage points and improves oil displacement efficiency by 3.8 percentage points. Therefore, reservoirs with high permeability and high-pressure injection–production conditions are more conducive to the efficient operation of gas storage systems.
(3) Characterization of phase changes in multi-cycle huff and puff
Multi-cycle huff-and-puff experiments reveal that a high-permeability core achieves a cumulative oil recovery factor of 18.01% after depletion and five-cycle huff-and-puff operations, comprising 14.35% from depletion and 3.66% incremental recovery via huff-and-puff stimulation, with 0.36 HCPV of free gas produced. In contrast, a low-permeability core achieves a cumulative oil recovery factor of 15.23%, with 12.49% from depletion and 2.74% incremental recovery via huff-and-puff, producing 0.33 HCPV free gas. Multi-cycle huff and puff numerical simulations yielded comparable results, the cumulative oil recovery factor reaches 18.55%, comprising 14.33% recovery from depletion and an additional 4.22% recovery enhancement achieved through multi-cycle huff and puff operations, accompanied by free gas production of up to 0.35 HCPV. The methane content in the extracted gas rose from 80.2% to 87.3% as the number of huff and puff cycles increased; concurrently, there was a decrease in intermediate hydrocarbons, and the gas fraction exhibited a tendency to dry out. The heavy component (C8+) increased by 2.7%, with viscosity rising from 2.0 to 4.6 mPa·s and the dissolved gas–oil ratio decreasing by 22%. The deterioration of the physical properties of the remaining oil leads to a reduction in the recovery factor at the cycle stage. Both experimental and numerical results confirm that multi-cycle huff-and-puff after depletion enhances UGS recovery and capacity, with superior performance in high-permeability reservoirs.

Author Contributions

Methodology, Y.T.; Software, Y.L.; Data curation, M.C.; Writing—original draft, Z.T.; Writing—review & editing, J.Q.; Visualization, Z.W.; Supervision and Writing—review & editing, Y.H. All authors have read and agreed to the published version of the manuscript.

Funding

This research was funded by the National Natural Science Foundation of China, grant number No. 51974268.

Data Availability Statement

The original contributions presented in this study are included in the article. Further inquiries can be directed to the corresponding author.

Acknowledgments

This study sincerely acknowledges the technical support provided by Schlumberger for the Petrel software platform.

Conflicts of Interest

The authors declare no conflict of interest.

References

  1. Wang, Z.; Kong, Y.; Li, W. Review on the development of China’s natural gas industry in the background of “carbon neutrality”. Nat. Gas Ind. B 2022, 9, 132–140. [Google Scholar] [CrossRef]
  2. Li, Q.; Li, Q.; Cao, H. The Crack Propagation Behaviour of CO2 Fracturing Fluid in Unconventional Low Permeability Reser-voirs: Factor Analysis and Mechanism Revelation. Processes 2025, 13, 159. [Google Scholar] [CrossRef]
  3. Li, Q.; Li, Q.C.; Wu, J.J.; Li, Q.; Wang, F.; Cheng, Y.F. Sediment Instability Caused by Gas Production from Hydrate-Bearing Sediment in Northern South China Sea by Horizontal Wellbore: Sensitivity Analysis. Nat. Resour. Res. 2025, 34, 1667–1699. [Google Scholar] [CrossRef]
  4. Li, L. Development of natural gas industry in China: Review and prospect. Nat. Gas Ind. B 2022, 9, 187–196. [Google Scholar] [CrossRef]
  5. Zou, C.; Zhao, Q.; Chen, J.; Li, J.; Yang, Z.; Sun, Q.; Lu, J.; Zhang, G. Natural gas in China: Development trend and strategic forecast. Nat. Gas Ind. B 2018, 5, 380–390. [Google Scholar] [CrossRef]
  6. Jia, A.; He, D.; Wei, Y.; Li, Y. Predictions on natural gas development trend in China for the next fifteen years. J. Nat. Gas Geosci. 2021, 6, 67–78. [Google Scholar] [CrossRef]
  7. Dai, J.; Ni, Y.; Dong, D.; Qin, S.; Zhu, G.; Huang, S.; Yu, C.; Gong, D.; Hong, F.; Zhang, Y.; et al. 2021–2025 is a period of great development of China’s natural gas industry: Suggestions on the exploration and development of natural gas during the 14th five-year plan in China. J. Nat. Gas Geosci. 2021, 6, 183–197. [Google Scholar] [CrossRef]
  8. Evans, D.J.; Chadwick, R.A. (Eds.) Underground Gas Storage: Worldwide Experiences and Future Development in the UK and Europe; Geological Society of London: London, UK, 2009. [Google Scholar]
  9. Wang, Y.; Guo, C.-H.; Du, C.; Chen, X.-J.; Jia, L.-Q.; Guo, X.-N.; Chen, R.-S.; Zhang, M.-S.; Chen, Z.-Y.; Wang, H.-D. Carbon peak and carbon neutrality in China: Goals, implementation path, and prospects. China Geol. 2021, 4, 720–746. [Google Scholar] [CrossRef]
  10. Al-Shafi, M.; Massarweh, O.; Abushaikha, A.S.; Bicer, Y. A review on underground gas storage systems: Natural gas, hydrogen and carbon sequestration. Energy Rep. 2023, 9, 6251–6266. [Google Scholar] [CrossRef]
  11. Molíková, A.; Vítězová, M.; Vítěz, T.; Buriánková, I.; Huber, H.; Dengler, L.; Hanišáková, N.; Onderka, V.; Urbanová, I. Underground gas storage as a promising natural methane bioreactor and reservoir? J. Energy Storage 2022, 47, 103631. [Google Scholar] [CrossRef]
  12. Bai, M.; Song, K.; Sun, Y.; He, M.; Li, Y.; Sun, J. An overview of hydrogen underground storage technology and prospects in China. J. Pet. Sci. Eng. 2014, 124, 132–136. [Google Scholar] [CrossRef]
  13. Zhang, J.; Fang, F.; Lin, W.; Gao, S.; Li, Y.; Li, Q.; Yang, Y. Research on Injection-Production Capability and Seepage Characteristics of Multi-Cycle Operation of Underground Gas Storage in Gas Field—Case Study of the Wen 23 Gas Storage. Energies 2020, 13, 3829. [Google Scholar] [CrossRef]
  14. Zhou, S.; Wang, J.; Liang, Y. Development of China’s natural gas industry during the 14th Five-Year Plan in the background of carbon neutrality. Nat. Gas Ind. 2021, 41, 171–182. [Google Scholar]
  15. Lu, J.; Zhao, S.; Sun, Y.; Tang, H. Gas production peaks in China: Research and strategic proposals. Nat. Gas Ind. B 2018, 5, 371–379. [Google Scholar] [CrossRef]
  16. Wang, Y.; Feng, G.; Li, Z.; Xu, W.; Zhu, J.; He, L.; Xiong, Z.; Qiao, X. Retrieving the displacements of the Hutubi (China) underground gas storage during 2003–2020 from multi-track InSAR. Remote Sens. Environ. 2022, 268, 112768. [Google Scholar] [CrossRef]
  17. Vandeginste, V.; Ji, Y.; Buysschaert, F.; Anoyatis, G. Mineralogy, microstructures and geomechanics of rock salt for underground gas storage. Deep. Undergr. Sci. Eng. 2023, 2, 129–147. [Google Scholar] [CrossRef]
  18. Yang, S.; Hu, S.; Qi, Z.; Li, J.; Yan, W.; Huang, X.; Ao, X.; Yuan, Y. Stability evaluation of fault in hydrocarbon reservoir-based underground gas storage: A case study of W gas storage. Fuel 2024, 357, 129657. [Google Scholar] [CrossRef]
  19. Wang, J.; Shi, L.; Zhang, Y.; Zhang, K.; Li, C.; Chen, X.; Sun, J.; Qiu, X. Simulation of petroleum phase behavior in in-jection and production process of underground gas storage in a gas reservoir. Pet. Explor. Dev. 2022, 49, 1386–1397. [Google Scholar] [CrossRef]
  20. Wan, J.; Sun, Y.; He, Y.; Ji, W.; Li, J.; Jiang, L.; Jurado, M.J. Development and technology status of energy storage in depleted gas reservoirs. Int. J. Coal Sci. Technol. 2024, 11, 29. [Google Scholar] [CrossRef]
  21. Yong, T.; Keji, L.; Jieming, W.; Hongcheng, X.; Yong, W.; Youwei, H.; Lei, S.; Huayin, Z. Change of phase state during mul-ti-cycle injection and production process of condensate gas reservoir based underground gas storage. Pet. Explor. Dev. 2021, 48, 395–406. [Google Scholar]
  22. Sun, J.; Xu, H.; Wang, J.; Shi, L.; Li, C.; Tang, L.; Zhong, R. Injection–production mechanisms and key evaluation technologies for underground gas storages rebuilt from gas reservoirs. Nat. Gas Ind. B 2018, 5, 616–622. [Google Scholar] [CrossRef]
  23. Zhang, G.; Yang, S.; Mo, C.; Zhang, Z. Experimental research on capacity expansion simulation of multi-cycle injection-production in reconstruction of oil reservoir to underground gas storage. J. Energy Storage 2022, 54, 105222. [Google Scholar] [CrossRef]
  24. Huan, Q.; Li, Y.; Mohammed, A.S.; Sun, Y.; Liu, T. Multi-Round Development of Underground Gas Storage Converted from Depleted Oil Reservoirs: Physical Properties Changes and Capacity Expansion. In Proceedings of the 57th U.S. Rock Mechanics/Geomechanics Symposium, Atlanta, GA, USA, 25–28 June 2023. [Google Scholar]
  25. Liu, Q.; Yao, Y.; Wang, L. The Two-Phase Flow of Oil-Gas Multiple Rounds Injection-Production in the Reconstructed of Gas Storage with Oil-Ring Condensate Gas Reservoir. In Proceedings of the 58th U.S. Rock Mechanics/Geomechanics Symposium, Golden, CO, USA, 23–26 June 2024. [Google Scholar]
  26. Wang, J.; Feng, X.; Wanyan, Q.; Zhao, K.; Wang, Z.; Pei, G.; Xie, J.; Tian, B. Hysteresis effect of three-phase fluids in the high-intensity injection–production process of sandstone underground gas storages. Energy 2022, 242, 123058. [Google Scholar] [CrossRef]
  27. Li, Q.; Zhao, G.; Qi, Z.; Yin, B.; Xu, X.; Fang, F.; Yang, S.; Qi, G. Stress sensitivity of formation during multi-cycle gas injection and production in an underground gas storage rebuilt from gas reservoirs. Pet. Explor. Dev. 2021, 48, 968–977. [Google Scholar] [CrossRef]
  28. Ren, Z.-X.; Wang, H.-F.; Chang, D.-W.; Liu, Y.-H.; He, H.; Yuan, H.-F. Evaluation of reserves and injection-production capacity of underground gas storage under multi-cycle operation. Pet. Sci. Technol. 2024, 1–18. [Google Scholar] [CrossRef]
  29. Long, K.; Tang, Y.; He, Y.; Wang, Y.; Qin, J.; Tang, L. Fluid phase behavior during multi-cycle injection and production of underground gas storage based on gas-condensate reservoirs with oil rim. Geoenergy Sci. Eng. 2023, 226, 211769. [Google Scholar] [CrossRef]
  30. Gao, T.; Wang, H.-Y.; Wang, S.-X.; Lu, J.; Gu, C.; Wang, X.-Q. Performance Evaluation of Multi-Cycle Injection-Production of Sizhan Gas Storage. In International Field Exploration and Development Conference; Springer Nature: Singapore, 2023; pp. 942–953. [Google Scholar]
  31. Geng, J.; Zhang, H.; Yue, P.; Qu, S.; Wang, M.; Chen, B. Experimental and Numerical Simulation Studies on the Synergistic Design of Gas Injection and Extraction Reservoirs of Condensate Gas Reservoir-Based Underground Gas Storage. Processes 2024, 12, 2668. [Google Scholar] [CrossRef]
  32. Jiao, G.; Zhu, S.; Xie, F.; Yang, S.; Xiang, Z.; Xu, J. Study of the Characterisation Method of Effective Two-Phase Seepage Flow in the Construction of Gas Storage Reservoirs. Energies 2022, 16, 242. [Google Scholar] [CrossRef]
  33. Gao, J.; Kong, D.; Peng, Y.; Zhou, Y.; Liu, Y.; Zhu, W. Pore-scale mechanisms and hysteresis effect during multi-cycle injection and production process in underground hydrogen storage reservoir. Energy 2023, 283, 129007. [Google Scholar] [CrossRef]
  34. GB/T 28912-2012; Test Method for Two Phase Relative Permeability in Rock. China Standard Press: Beijing, China, 2013.
Figure 1. Cores for mutual drive experiments.
Energies 18 02550 g001
Figure 2. Simulated formation water and oil.
Energies 18 02550 g002
Figure 3. Flow chart of multi-cycle injection–production experiment.
Energies 18 02550 g003
Figure 4. Cores for multi-cycle huff and puff experiments.
Energies 18 02550 g004
Figure 5. Multi-cycle huff and puff pressure variation curve.
Energies 18 02550 g005
Figure 6. Permeability distribution of the core model.
Energies 18 02550 g006
Figure 7. Porosity distribution of the core model.
Energies 18 02550 g007
Figure 8. Fitted PT phase diagram of crude oil.
Energies 18 02550 g008
Figure 9. Single-end injection–production well configuration.
Energies 18 02550 g009
Figure 10. Cross-sectional view of the model and injection–production well configuration.
Energies 18 02550 g010
Figure 11. Multi-cycle huff and puff pressure change curve.
Energies 18 02550 g011
Figure 12. Oil–water relative permeability curves at an injection pressure of 16 MPa.
Energies 18 02550 g012
Figure 13. Effect of injection pressure on oil–water relative permeability.
Energies 18 02550 g013
Figure 14. Oil–gas relative permeability curves at an injection pressure of 16 MPa.
Energies 18 02550 g014
Figure 15. Effect of injection pressure on oil–gas relative permeability.
Energies 18 02550 g015
Figure 16. Gas–water relative permeability curves at an injection pressure of 16 MPa.
Energies 18 02550 g016
Figure 17. Effects of injection pressure on bound water saturation and residual gas saturation.
Energies 18 02550 g017
Figure 18. Recovery factor during the multi-cycle huff and puff experiments.
Energies 18 02550 g018
Figure 19. Bar chart of recovery factor increment during the multi-cycle huff and puff experiments.
Energies 18 02550 g019
Figure 20. Changes in free gas volume during the multi-cycle huff and puff experiments.
Energies 18 02550 g020
Figure 21. Gas–oil ratio during the multi-cycle huff and puff.
Energies 18 02550 g021
Figure 22. Changes in gas composition of the extracted gas.
Energies 18 02550 g022
Figure 23. Recovery factor during numerical simulation of multi-cycle huff and puff.
Energies 18 02550 g023
Figure 24. Bar chart of recovery factor increment during numerical simulation of multi-cycle huff and puff.
Energies 18 02550 g024
Figure 25. Changes in free gas volume during numerical simulation of multi-cycle huff and puff.
Energies 18 02550 g025
Figure 26. Changes in oil and gas saturation.
Energies 18 02550 g026
Figure 27. Changes in the extracted gas component.
Energies 18 02550 g027
Figure 28. Changes in residual oil component.
Energies 18 02550 g028
Figure 29. Changes in residual oil viscosity and dissolved gas–oil ratio.
Energies 18 02550 g029
Figure 30. Changes in the PT phase diagram of residual oil.
Energies 18 02550 g030
Table 1. Basic parameters of core samples for two-phase seepage experiments.
Core No.Coring LocationLength
(cm)
Diameter
(cm)
Dry Weight
(g)
Porosity
(%)
Permeability
(mD)
Experimental
Content
L1Lower oil/gas interface5.2112.58260.0814.668.36Oil–water and oil–gas mutual drive
M15.2382.58559.4116.2432.44
H15.3282.57260.5120.2074.00
L2Upper oil/gas interface5.3162.58162.7413.323.99Gas–water mutual drive
M25.2842.58860.8915.2917.11
H25.4012.57959.2918.9046.31
Table 2. Stratigraphic water analysis data.
Chemical Compositions (mg/L)Total Mineralization
(mg/L)
pHWater–Based
Na+, K+Mg2+Ca2+ClSO42−HCO3CO32−
75235625.3205.1634.627.12252.17~8NaHCO3
Table 3. Core parameters selected for huff and puff experiments.
Core NoCoring LocationLength
(cm)
Diameter
(cm)
Dry Weight
(g)
Porosity (%)Permeability
(mD)
H3Upper oil/gas interface5.1692.57657.0418.2389.47
L35.3322.58060.358.067.26
Table 4. Core parameters selected for the model.
Core No.Core Length
(cm)
Core Diameter
(cm)
Permeability
(mD)
Porosity
(%)
H15.3282.57274.0015.2
H25.4012.57946.3118.9
Table 5. Pseudo-component division.
ComponentsC1C2C3+C5+C8+C11+C23+
Molar composition (%)51.709.2811.492.696.8014.943.10
Table 6. Fitting results of saturation pressure and single degassing experiment.
Fitting ParametersExperimental DataFitting DataError (%)
Saturation pressure, MPa18.919.11.06
Density of ground crude oil, kg/m3842821.32.45
Formation crude oil viscosity, mPa·s2.051.983.41
Single degassing gas–oil ratio, m3/m3236228.23.39
Table 7. Fitting results of critical parameters for fluid components.
ComponentsPc (MPa)Tc (K)Vc (L/mol)Eccentricity FactorZ–FactorMolar MassOmegaAOmegaB
C14.64190.100.09790.01320.284716.140.45720.0778
C24.93305.430.14800.09860.284630.070.45720.0778
C3+4.01394.140.23120.17340.279951.480.45720.0778
C5+3.14513.590.35800.27660.260586.200.45720.0778
C8+2.66602.370.48550.34960.2554121.180.45720.0778
C11+2.25696.530.76980.75820.2956193.890.45720.0778
C23+1.15892.051.46831.37480.2258374.510.45720.0778
Table 8. Injection and production parameters for multi-cycle huff and puff.
Simulation StagesInjection/Production Rate (mL/min)Injection/Production Duration (h)Upper or Lower Pressure Limits (MPa)
Depletion simulation0.11.253.8 (lower limit)
Gas injection0.1124 (upper limit)
Gas production0.1112 (lower limit)
Disclaimer/Publisher’s Note: The statements, opinions and data contained in all publications are solely those of the individual author(s) and contributor(s) and not of MDPI and/or the editor(s). MDPI and/or the editor(s) disclaim responsibility for any injury to people or property resulting from any ideas, methods, instructions or products referred to in the content.

