1. Introduction
In the past decade, the production of energy from photovoltaic (PV) has experienced rapid growth, increasing by a record 270 TWh in 2022, reaching almost 1300 TWh. In 2022 [
1], PV energy demonstrated the most significant absolute growth in generation among all renewable technologies, surpassing wind energy for the first time in history. In 2023, solar PV alone accounted for three-quarters of renewable capacity additions worldwide [
1]. This growth rate is in line with the projections outlined in the Net Zero Emissions by 2050 Scenario for the period spanning from 2023 to 2030.
Floating photovoltaic (FPV) technology has attracted increasing interest, marking the emergence of a new sector. Floating solar panels offer significant potential for generating renewable energy in various geographical regions. The FPV involves installing solar panels on floating structures atop bodies of water, including inland lakes, artificial reservoirs, quarry lakes, irrigation canals, or even offshore locations.
Although most FPV installations currently are installed in inland environments (lakes, water reservoirs, dams, etc.), further expanding these on land is constrained by scarcity of land-locked systems (lakes, water reservoirs, dams, etc.) and local community resistance. To overcome such challenges, offshore installations are increasingly being considered. Numerous research studies have compared the advantages and disadvantages of floating photovoltaic (FPV) systems to ground-mounted PV installations, highlighting their potential for higher power efficiency and irradiation levels, albeit with considerations for site-specific factors [
2,
3,
4,
5,
6]. FPV has higher power efficiency due to wind and water cooling and higher irradiation levels. By integrating offshore FPV with the power cable infrastructure of offshore wind parks, levelized costs of energy can be reduced significantly. Although FPV is one of the best promising solutions for energy generation, FPV systems face significant structural challenges arising from external forces, both from the waves and wind conditions; these have the potential to cause substantial damage to the entire floating structure.
Extreme wave events, such as focused wave groups, can induce transient gap resonance between closely spaced PV panels or breakwaters, posing significant risks to floating photovoltaic (FPV) systems [
7]. Hydrodynamic forces generated during these events have the potential to cause severe damage or even complete failure of the FPV system, especially when the panels are in direct contact with the water surface. Song et al. [
8] investigated the dynamic behavior of a cylindrical floating structure and found that extreme wave conditions significantly amplified its dynamic response, potentially leading to the failure of the floating system.
However, when wind interacts with the FPV system, the situation changes dramatically. As the wind passes underneath the PV panel and lifts the panels off the water surface, hydrodynamic forces become less relevant. In this scenario, aerodynamic forces take precedence, becoming the dominant load acting on the system. The panels can experience significant uplift forces due to wind, a phenomenon observed in real-world FPV installations. A notable incident occurred at an FPV site in Albania, where, following a root cause analysis, it was discovered that wind speeds exceeded the design specifications applied to the system [
9]. Honaryar et al. [
10] performed numerical simulations on large-scale floating photovoltaic (PV) systems, revealing that wind loads were 458% greater compared to those on similarly sized ground-mounted solar panel arrays. This event underscores the necessity of accounting for wind-wave interactions. Choi et al. [
11] performed numerical simulations to estimate area-averaged drag coefficients and displacements, validated with experimental data. The first and last rows of solar panels experienced higher wind loads, while wave loads influenced displacements based on wave direction. In their study, correlations were developed to predict drag and lift forces on solar panels across different wind speeds, providing valuable guidelines for the design of floating photovoltaic systems and their panels. These findings indicate that wind loads on PV panels are influenced by various factors; however, to obtain an accurate assessment of wind forces, it is essential to evaluate the solar panel array as a whole rather than individual panels. Proper consideration of wind loads is critical, as they play a pivotal role in ensuring the safety and structural integrity of floating PV systems. This highlights the critical importance of ensuring that FPV systems are designed to withstand wind loads beyond standard criteria to avoid similar failures.
While hydrodynamic performance is crucial when the FPV system is in direct contact with the water, aerodynamic forces become critical when the system is elevated by wind. Therefore, both forces are condition-dependent. In this study, we focus on the aerodynamic performance, as hydrodynamic forces are negligible when the FPV panels are lifted and not interacting with the water surface. Understanding the aerodynamic behavior is essential for ensuring the stability and resilience of FPV systems under high wind conditions, as wind-induced loads can lead to significant structural challenges, especially during extreme weather events. This highlights why aerodynamics is essential in certain scenarios while also acknowledging the importance of hydrodynamic forces in other conditions.
Considering the potential for the FPV panels to lift due to wind forces, it is critical to accurately assess the aerodynamic performance of the system. When the FPV panels are elevated by wind, the aerodynamic forces become the primary concern, making it essential to use appropriate models and tools to estimate these forces. To ensure precise modeling, it is important to evaluate which aerodynamic models and computational tools are best suited for analyzing the wind loads on both fixed and floating PV systems. This assessment helps to predict the behavior of the FPV system under various wind conditions, ensuring the system’s stability and reliability. Accurately estimating the forces exerted by wind is crucial for ensuring the stability and resilience of PV installations. Conducting physical measurements on PV systems to estimate the aerodynamic forces can be both time-consuming and expensive. Nevertheless, several wind tunnel studies have attempted to estimate the aerodynamic forces on PV panels. For instance, Ogedengbe (2013) [
12] conducted wind tunnel experiments using scaled aluminum models to calculate pressure coefficients across panel surfaces. While some studies, such as those by Bogdan and Cretu, 2019 [
13,
14], have utilized scaled models in wind tunnels, these experiments are expensive and limited in scope to only a few PV modules.
An alternative approach to estimating the forces acting on these structures is the use of numerical models. The numerical approaches allow for the simulation of various environmental conditions and can provide valuable insights into the behavior of FPV panels under different scenarios. Computational Fluid Dynamics (CFD) is a powerful tool for predicting and analyzing fluid flow phenomena. Numerous studies have been carried out to understand the behavior of PV structures, focusing particularly on the aerodynamic forces acting on PV arrays. Many previous studies have been conducted on fixed PV systems, and these studies can be broadly categorized into three groups: ground-mounted, commercial roof-mounted, and residential roof-mounted systems. Some studies focus solely on investigating wind effects on ground-mounted systems [
15,
16,
17], while others examine both ground-mounted and roof-mounted systems, providing comparative data on wind load effects between the two [
18,
19].
Bitsumalik [
20] employed CFD to evaluate wind loads on ground-mounted solar panels across four different scenarios, demonstrating strong agreement between numerical simulations and experimental data. Jubayer and Hagen [
21] conducted both numerical and experimental analyses, examining the angles of attacks ranging from 0 to 180 degrees to determine coefficients of drag, lift, and overturning moment. Warsido [
22] investigated the sheltering effect of consecutively placed solar panels through wind tunnel experiments, exploring a larger number of panels and different spacing factors. Radu et al. [
23] highlighted that the first row of solar panels can reduce wind load on subsequent rows due to a sheltering effect. Garcia et al. [
18] introduced the concept of wind breaks to mitigate wind loads on solar troughs for optimized structures. The authors investigated windbreaks consisting of a solid wall with an upper porous fence, exploring different geometrical configurations by varying the solid wall height and the separation between the windbreak and the parabolic trough row. Aerodynamic loads were measured over time to determine mean and peak values. Results showed that both mean aerodynamic drag and peak loads decreased with increasing distance between the windbreak and the parabolic trough, but beyond a certain threshold, drag loads increased with distance.
The majority of existing studies, as explained in the previous paragraphs, have predominantly focused on analyzing wind loads on solar panels in ground-based installations. However, the challenges encountered by floating PV systems deployed on water bodies are different. Unlike ground-mounted systems where the forces are managed by fixed support structures and panels are firmly anchored to the ground, floating PV systems face inherent flexibility and buoyancy issues. Simply increasing the weight of materials to strengthen them may not be adequate, as an overweight system could lead to sinking to the bottom. Given the need to balance buoyancy and weight for stability and the inability to increase system weight to withstand wind loads, it is necessary to conduct a comprehensive assessment of drag and lift coefficients at varying inlet angles. Such analyses are crucial for designing structurally robust systems, including mooring and anchoring systems capable of withstanding fluctuating wind conditions.
There have been some studies on the aerodynamic assessment of floating PV systems. Mignone et al. [
24] performed CFD studies on a specific FPV solution, the gable structure consisting of 24 PV Modules. However, the main objective of their study was to validate the PLUTO code. This code is designed for astrophysical purposes, particularly for classic and relativistic low-density plasmas in stars and the interstellar medium, with a focus on viscous applications. Choi et al. [
11] investigated wind load effects on a solar panel array for floating photovoltaic systems. Their studies revealed higher drag and lift coefficients for the first and last rows of panels due to direct wind exposure, with subsequent rows experiencing reduced forces due to a sheltering effect. Su et al. [
25] conducted a numerical simulation of wind loads on an offshore PV panel. Their study also considers the effect of wind and wave angles on pontoon motion.
In this study, CFD simulations were performed for various PV panel configurations, and using these CFD simulation correlations were developed to estimate lift and drag forces as a function of the number of panels. These correlations provide valuable tools for designing large-scale FPV systems with multiple PV panels.
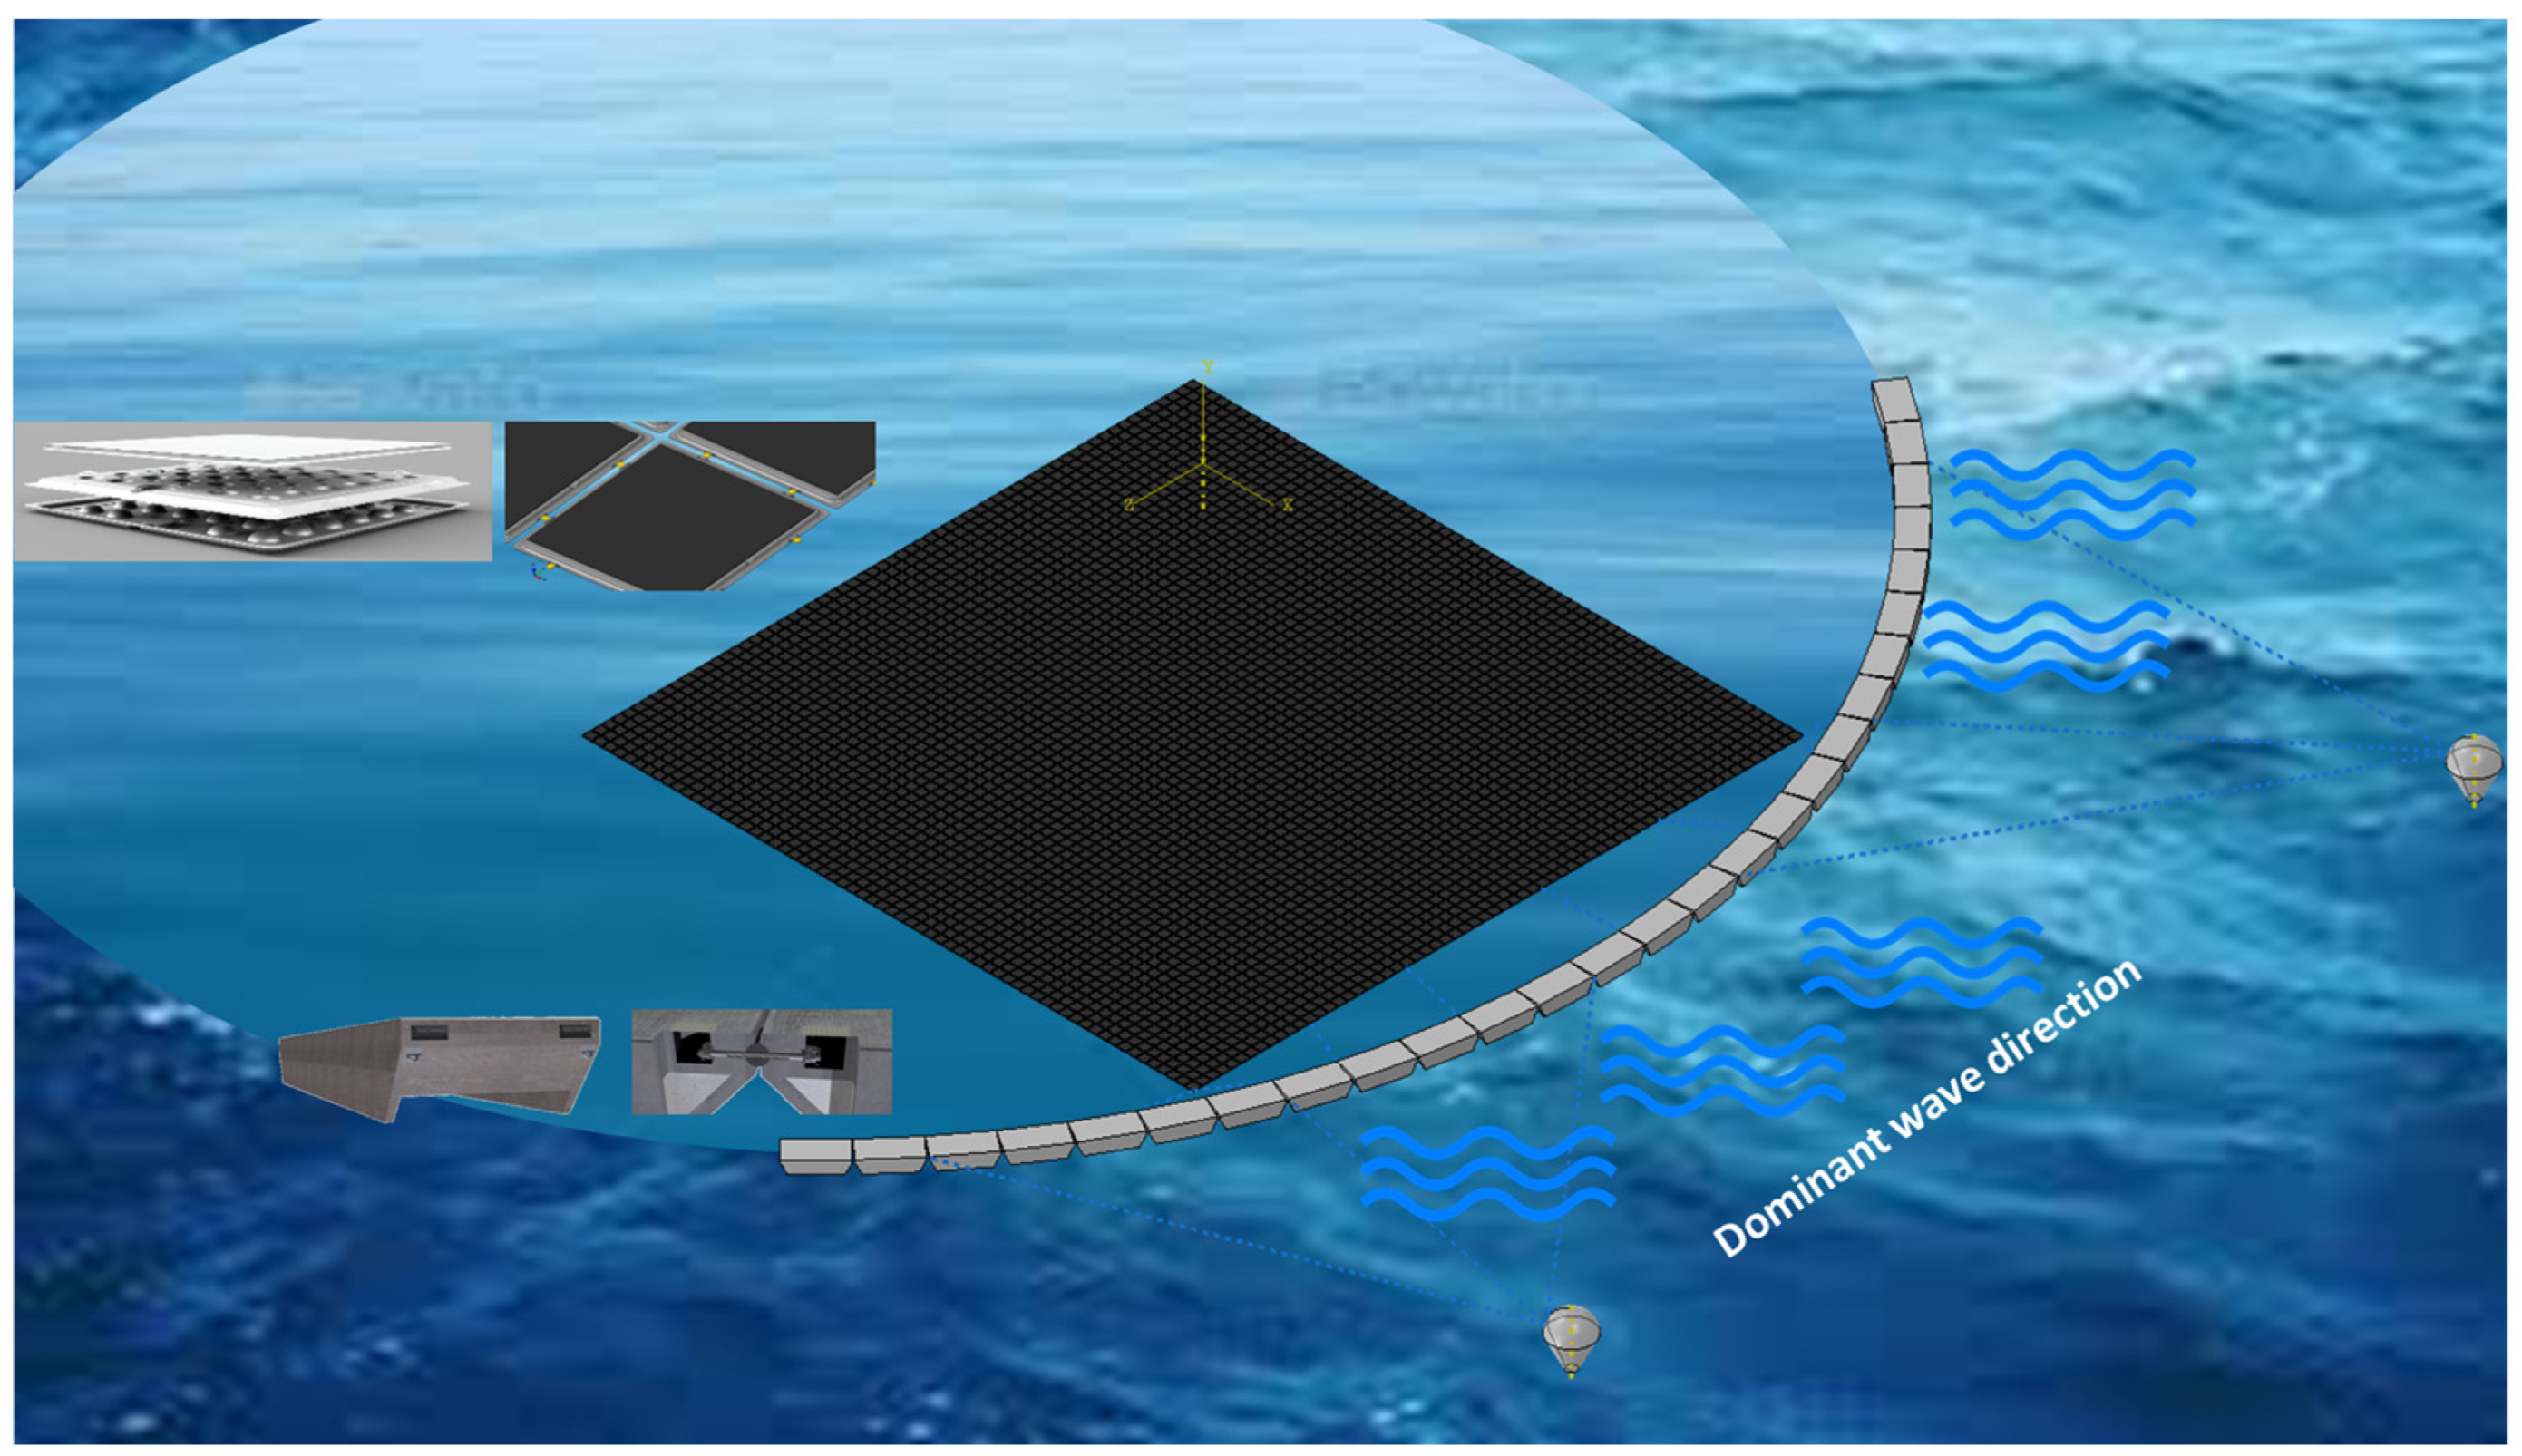
The primary objective of this study is to investigate how breakwaters can mitigate aerodynamic forces on floating PV panels, reducing the risks of lifting and overtopping. Breakwaters not only attenuate wave energy but also alter local wind flow patterns, which can significantly enhance the stability and performance of floating structures. For FPV systems, reducing aerodynamic forces is essential for maintaining the structural integrity and energy yield of the panels. Well-designed breakwaters can lead to substantial reductions in wind-induced forces, lowering the likelihood of mechanical failures due to uplift or overtopping [
26]. This study advances previous research by focusing specifically on the role of breakwaters in mitigating aerodynamic forces through comprehensive CFD simulations. Unlike prior studies, which did not consider the influence of breakwaters, this work evaluates their effectiveness by positioning them ahead of a matrix of PV panels and varying angles of attack. By exploring the potential of breakwaters under specific wind conditions, this study offers critical guidance for optimizing their design and placement. Ultimately, these insights contribute to enhancing the resilience and performance of FPV systems in diverse environmental contexts, addressing a key gap in the research regarding the role of breakwaters.
3. Results and Discussions
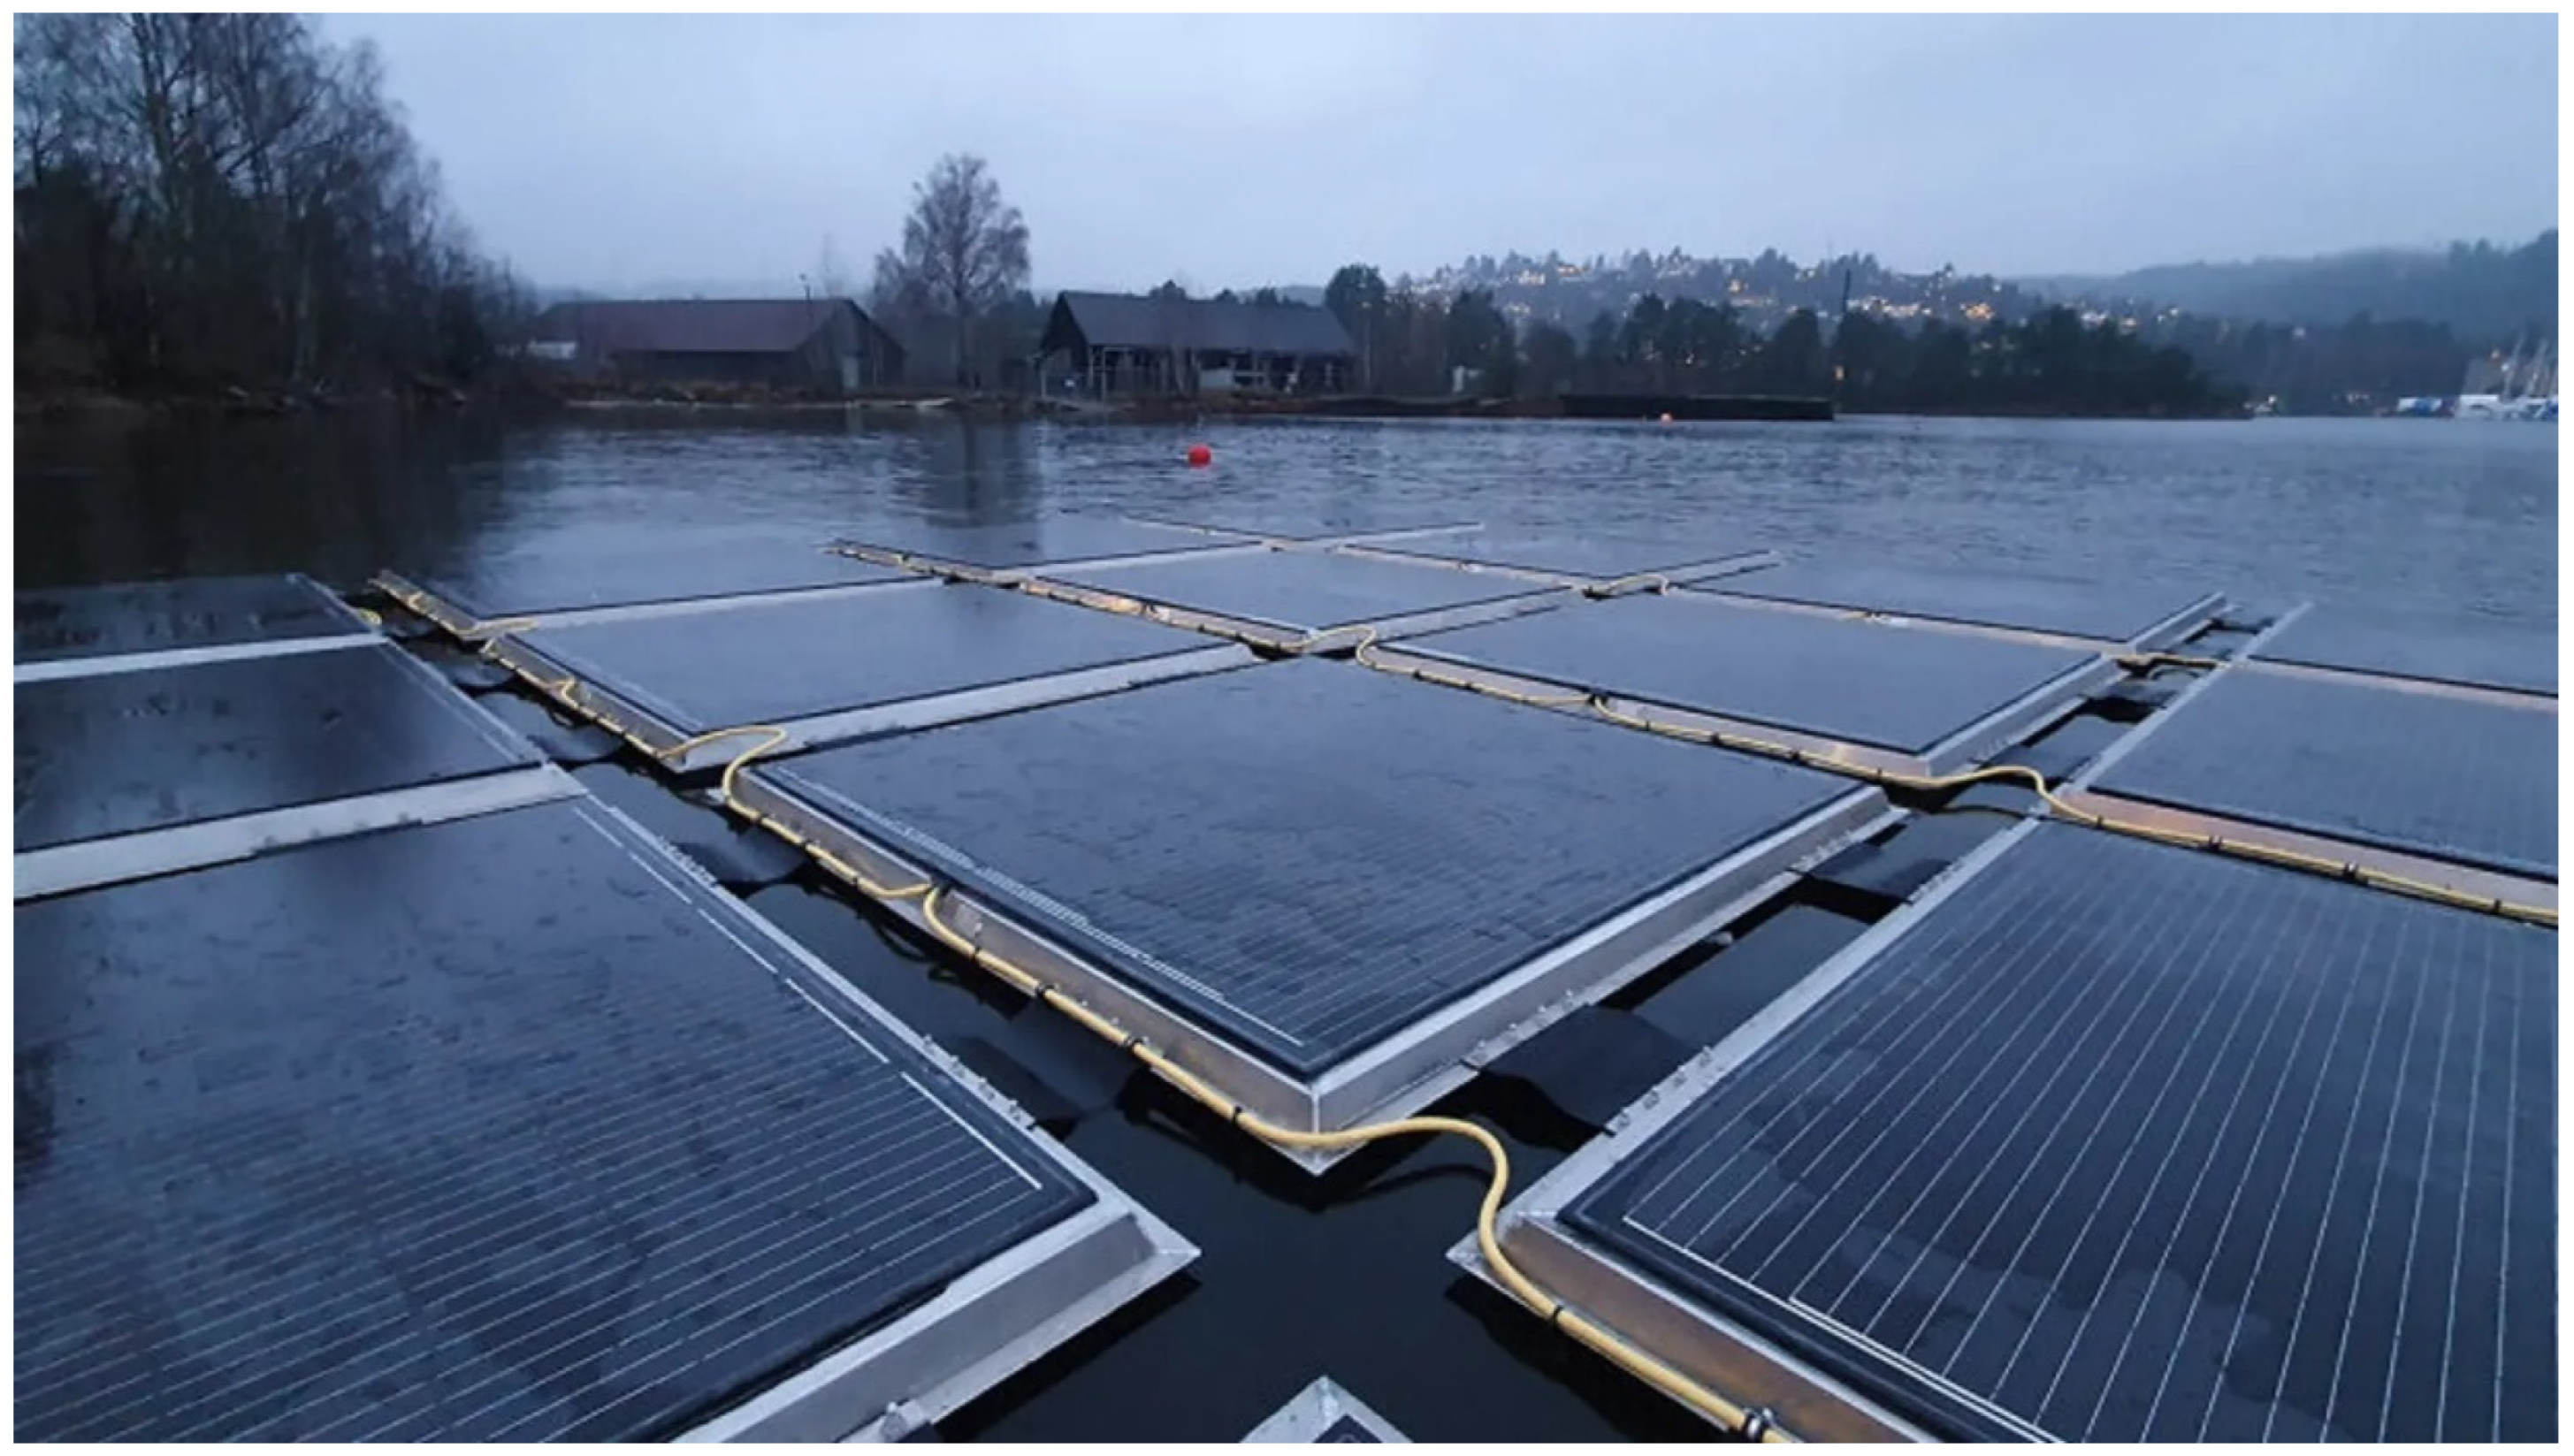
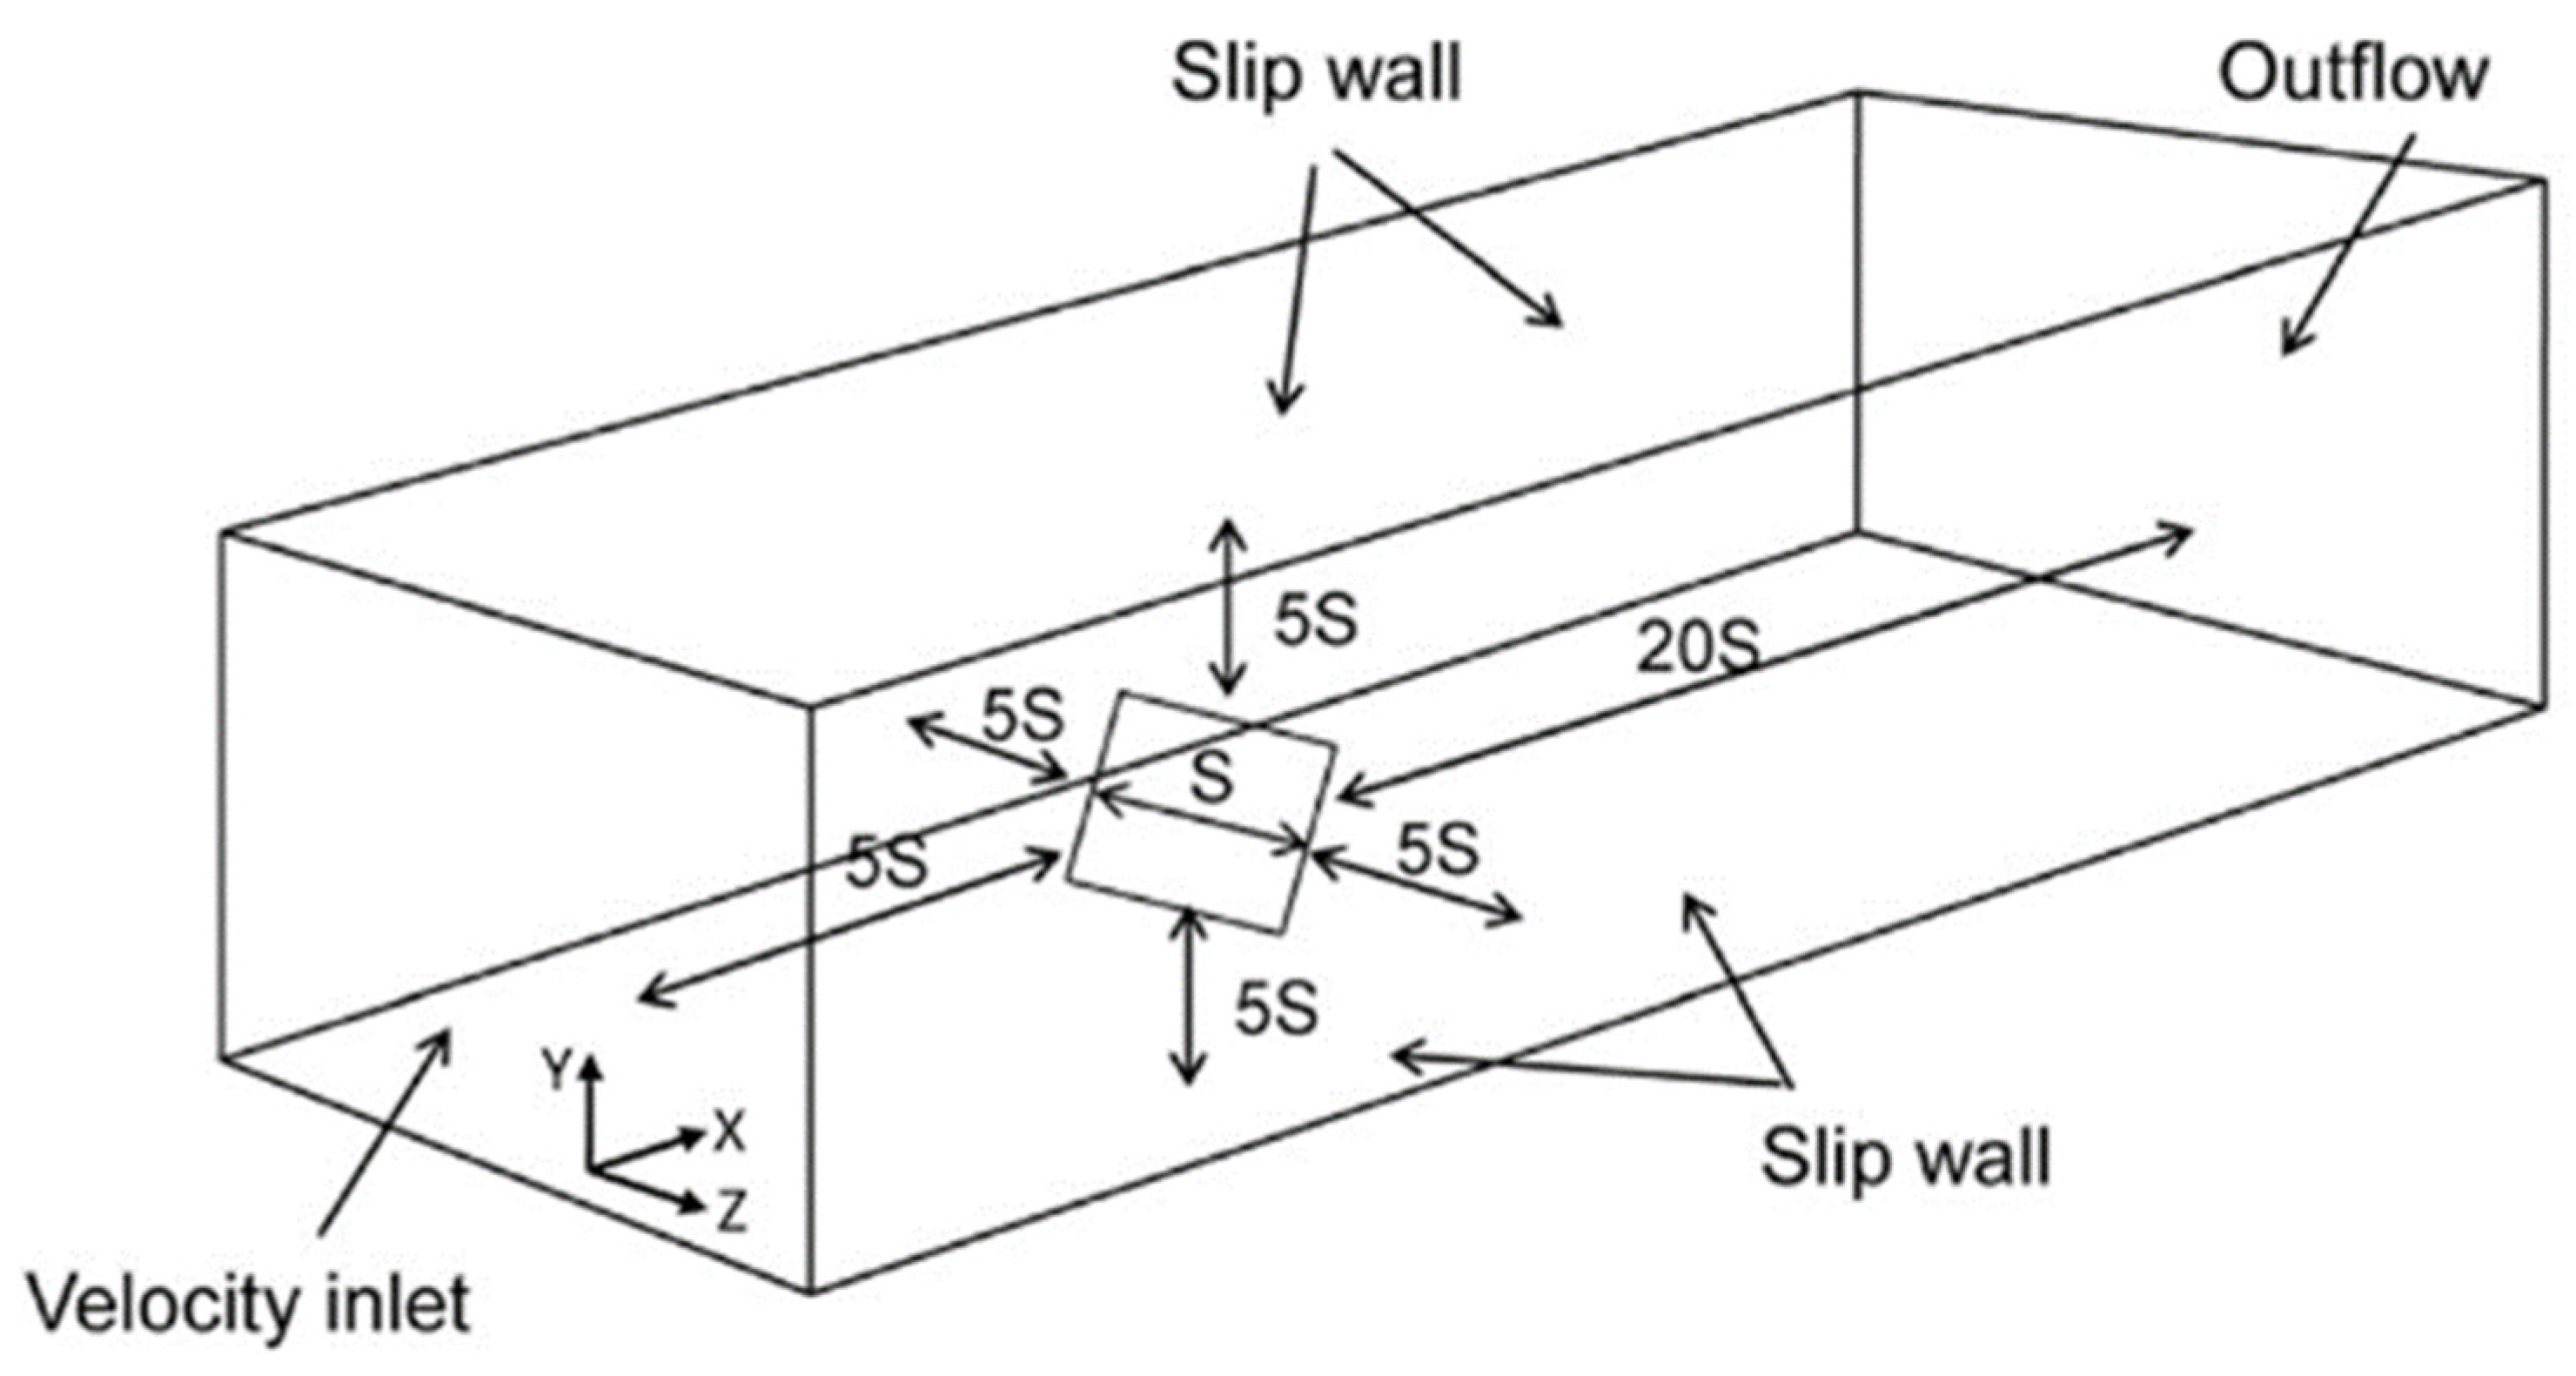
After benchmarking our numerical setup, our objective was to use it to estimate the aerodynamic forces acting on the FPV. To achieve this, we constructed a computational domain around the FPV, which includes a matrix of PV modules and the surrounding computational domain. For PV modules, an STL file provided by the SunLit Sea As (
https://sunlitsea.no/) was used. CFD simulations were conducted for four different configurations of the PV module matrix: 4 × 8, 8 × 8, 12 × 8, and 16 × 8. Within each configuration, simulations were performed at various angles of attack values ranging from 0 to 20 degrees. In these simulations, we accounted for rigid hinges and assumed that the PV matrix remains fixed, with no relative motions of the floats. The assumption was made primarily for simplification and to reduce computational complexity. While it is true that hinged connections are commonly used in floating offshore structures to allow flexibility and movement, incorporating fully dynamic hinged connections into aerodynamic simulations would significantly increase the complexity and computational cost.
Moreover, the focus of this study is on understanding the aerodynamic forces acting on the FPV panels, specifically the uplift caused by wind. By assuming fixed connections, we were able to isolate and examine the aerodynamic effects more clearly without the added variables of hinge dynamics, which may introduce additional uncertainties. Previous studies have demonstrated that fixed-hinge models provide a reasonably accurate estimation of aerodynamic forces for initial assessments in floating structures.
In addition to simplifying the model and reducing computational complexity, the assumption of fixed hinges is justified by the fact that, once the FPV panels are lifted by aerodynamic forces, the flexibility of the hinges plays a smaller role. This is because the lift forces primarily cause tension in the hinges, causing them to behave more like rigid connections. In this state, the hinged flexibility becomes less significant, and the system acts similarly to a fixed-hinge configuration, providing a reliable foundation for studying aerodynamic effects.
The simulation matrix is shown in
Table 1. Four different panel configurations—4 × 8, 8 × 8, 12 × 8, and 16 × 8—were examined to assess the aerodynamic forces acting on the floating PV systems. For each configuration, simulations were performed at angles of attack ranging from 0°, 5°, 10°, 15°, and 20°. This matrix of simulations allows for a comprehensive understanding of how the number of PV panels and the angle of incoming wind affect both lift and drag forces. By analyzing these configurations, we aim to develop correlations that can inform the design and stability of large-scale FPV systems under varying wind conditions.
The lift and drag forces were computed for each configuration and angle of attack. The following equations were used for estimating the lift and drag forces:
The Equations (2) and (3) are used for estimating the lift force coefficient (Cl) and drag force coefficient (Cd). Where, L and D are lift and drag forces respectively, Aref is the reference area, Uref is the reference velocity freestream velocity, ρ is the density.
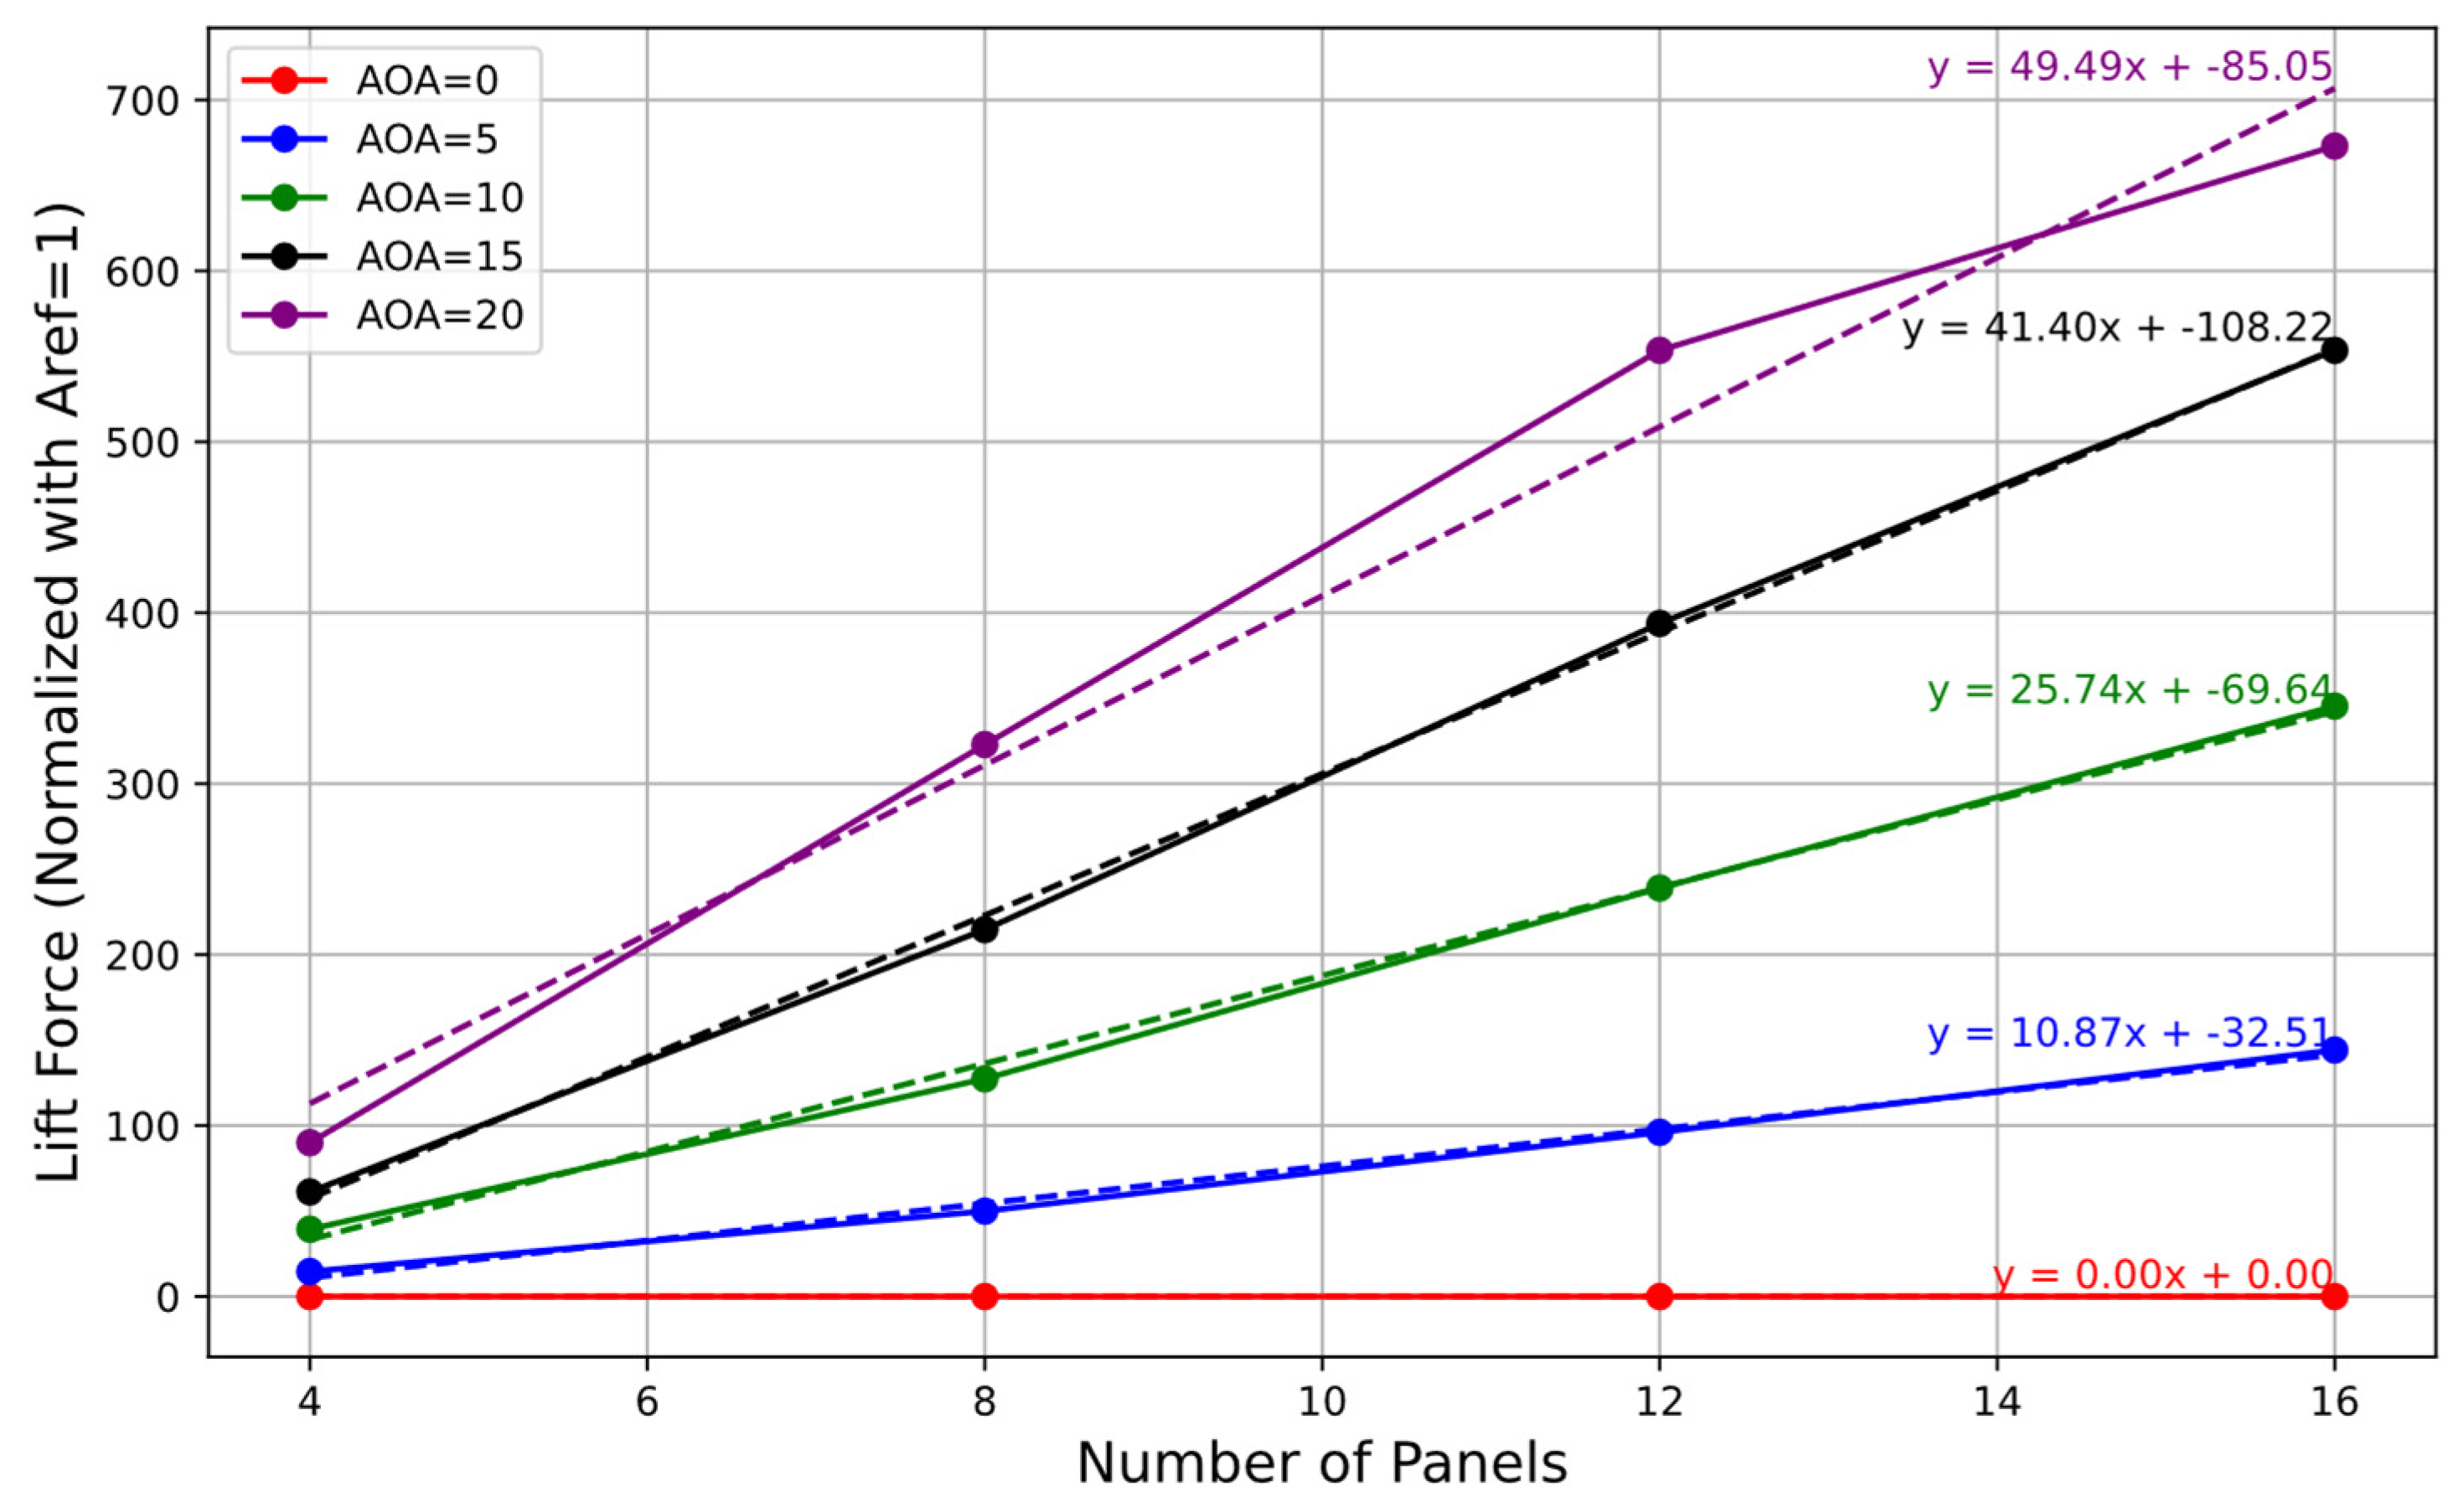
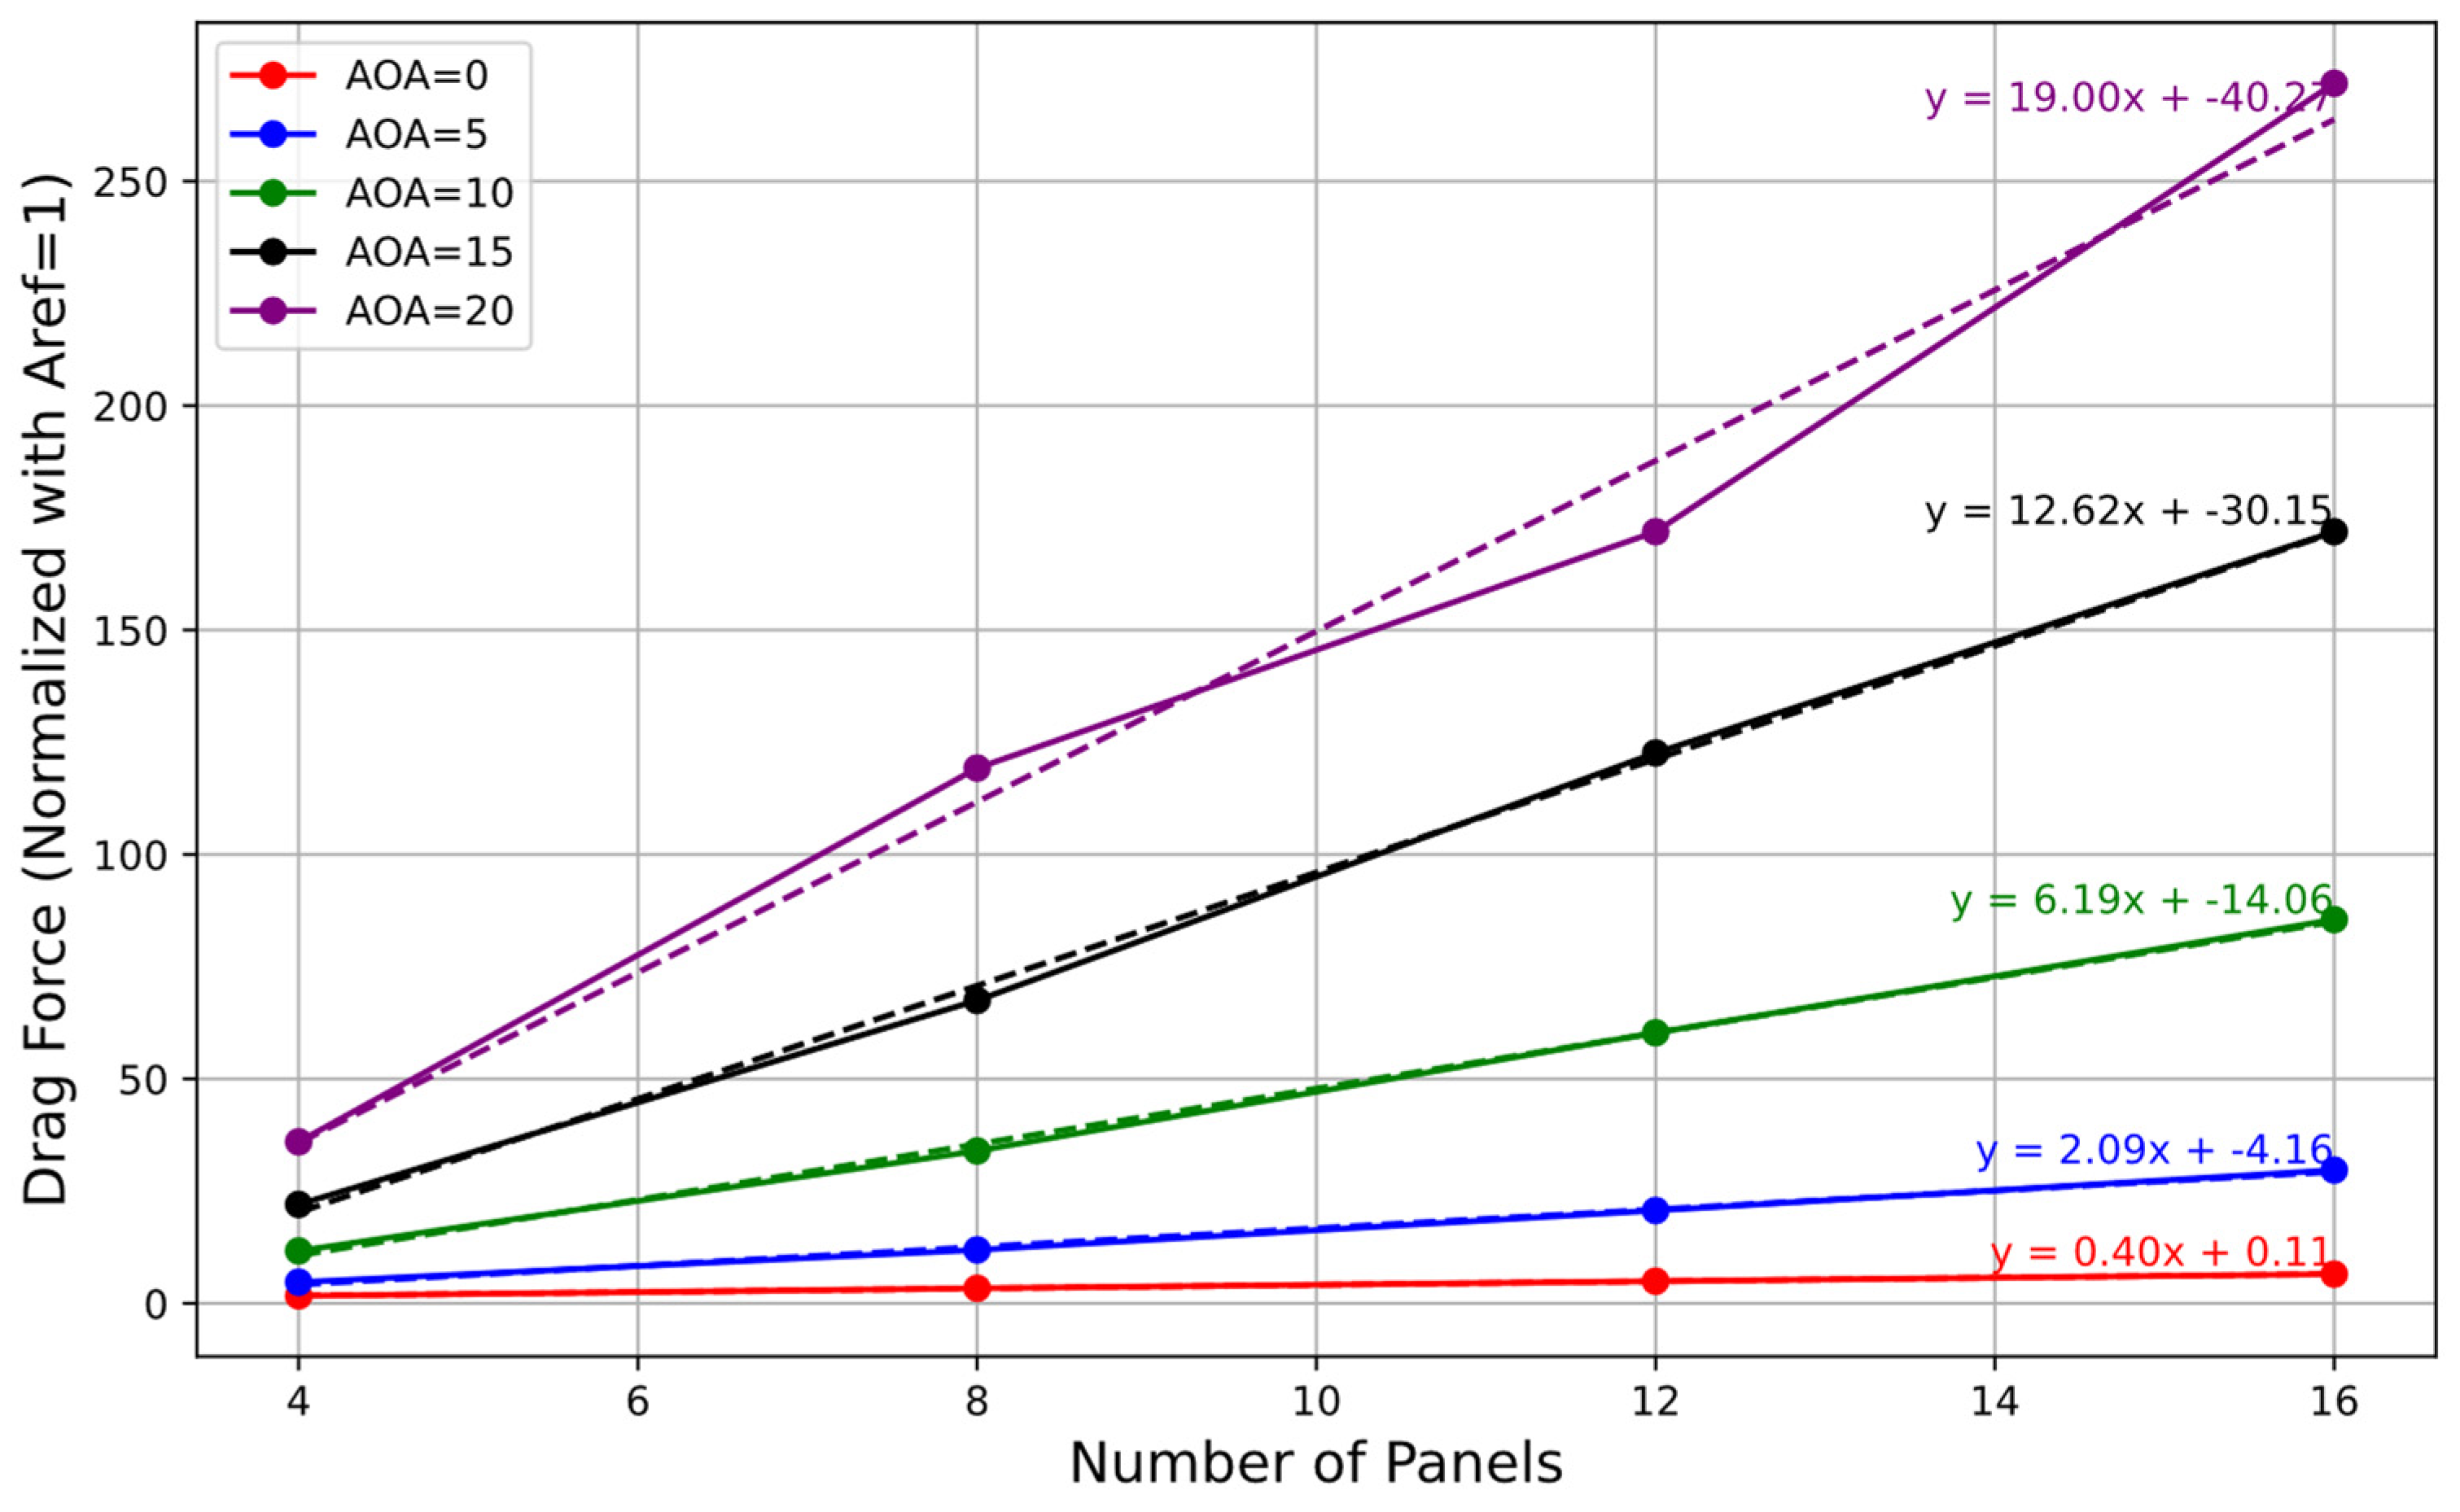
These lift and drag coefficients were then plotted as functions of the number of panels in the first row (4, 8, 12, and 16) for each angle of attack and shown in
Figure 9 and
Figure 10. In all the lift and drag calculations, the reference areas (
Aref) of 1 m
2 and
Uref of 10 m/s have been utilized. The reference area of 1 m
2 was chosen for ease of simplification. While the 1 m
2 reference area was used for simplicity and consistency, the results can be scaled to different areas if needed. By using a consistent reference area of 1 m
2, we can compare the performance of different breakwater designs or floating photovoltaic systems on a common basis, ensuring that differences in results are due to the configurations themselves rather than variations in the reference area.
This study showed that both lift and drag forces were affected by the number of panels in the first row and the angle of attack. Generally, an increase in the number of panels in the first row led to higher lift and drag forces, as expected. Additionally, the angle of attack influenced the magnitudes of these forces, with higher angles typically resulting in increased forces due to changes in flow patterns and pressure distributions around the PV modules.
3.1. Aerodynamic Coefficients of the Panels
The focus was on analyzing the variations in lift and drag coefficients with changes in the number of panels.
Figure 9 and
Figure 10 show the variations of lift and drag coefficients, respectively, as a function of the number of panels. In addition, the results for all the configurations are given in
Table 2,
Table 3,
Table 4,
Table 5 and
Table 6. As the number of panels increased from 4 × 8 to 16 × 8 configurations, there was a noticeable increase in the lift coefficient. Both the lift and drag coefficients showed a linear relationship with the number of panels across all angles of attack up to 15°. A curve fitting was performed to obtain the relationship between the lift and drag coefficients with the number of panels (N). A linear relationship was observed between aerodynamic coefficients (lift and drag) and the number of panels, and these correlations are provided in
Table 2,
Table 3,
Table 4,
Table 5 and
Table 6. However, beyond the 15° angle of attack, the correlation deviated from linearity, suggesting a change in aerodynamic behavior. This deviation could be attributed to flow separation occurring at higher angles of attack, leading to nonlinear variations in lift coefficient as the airflow becomes detached from the panel surfaces. Overall, the findings highlight the significant influence of the number of panels on the aerodynamic behavior of FPV. In the correlation, as shown in
Table 2,
Table 3,
Table 4,
Table 5 and
Table 6, N is the number of panels in the front row.
The contour plots depicting the pressure distribution (see
Figure 11) and velocity distribution (see
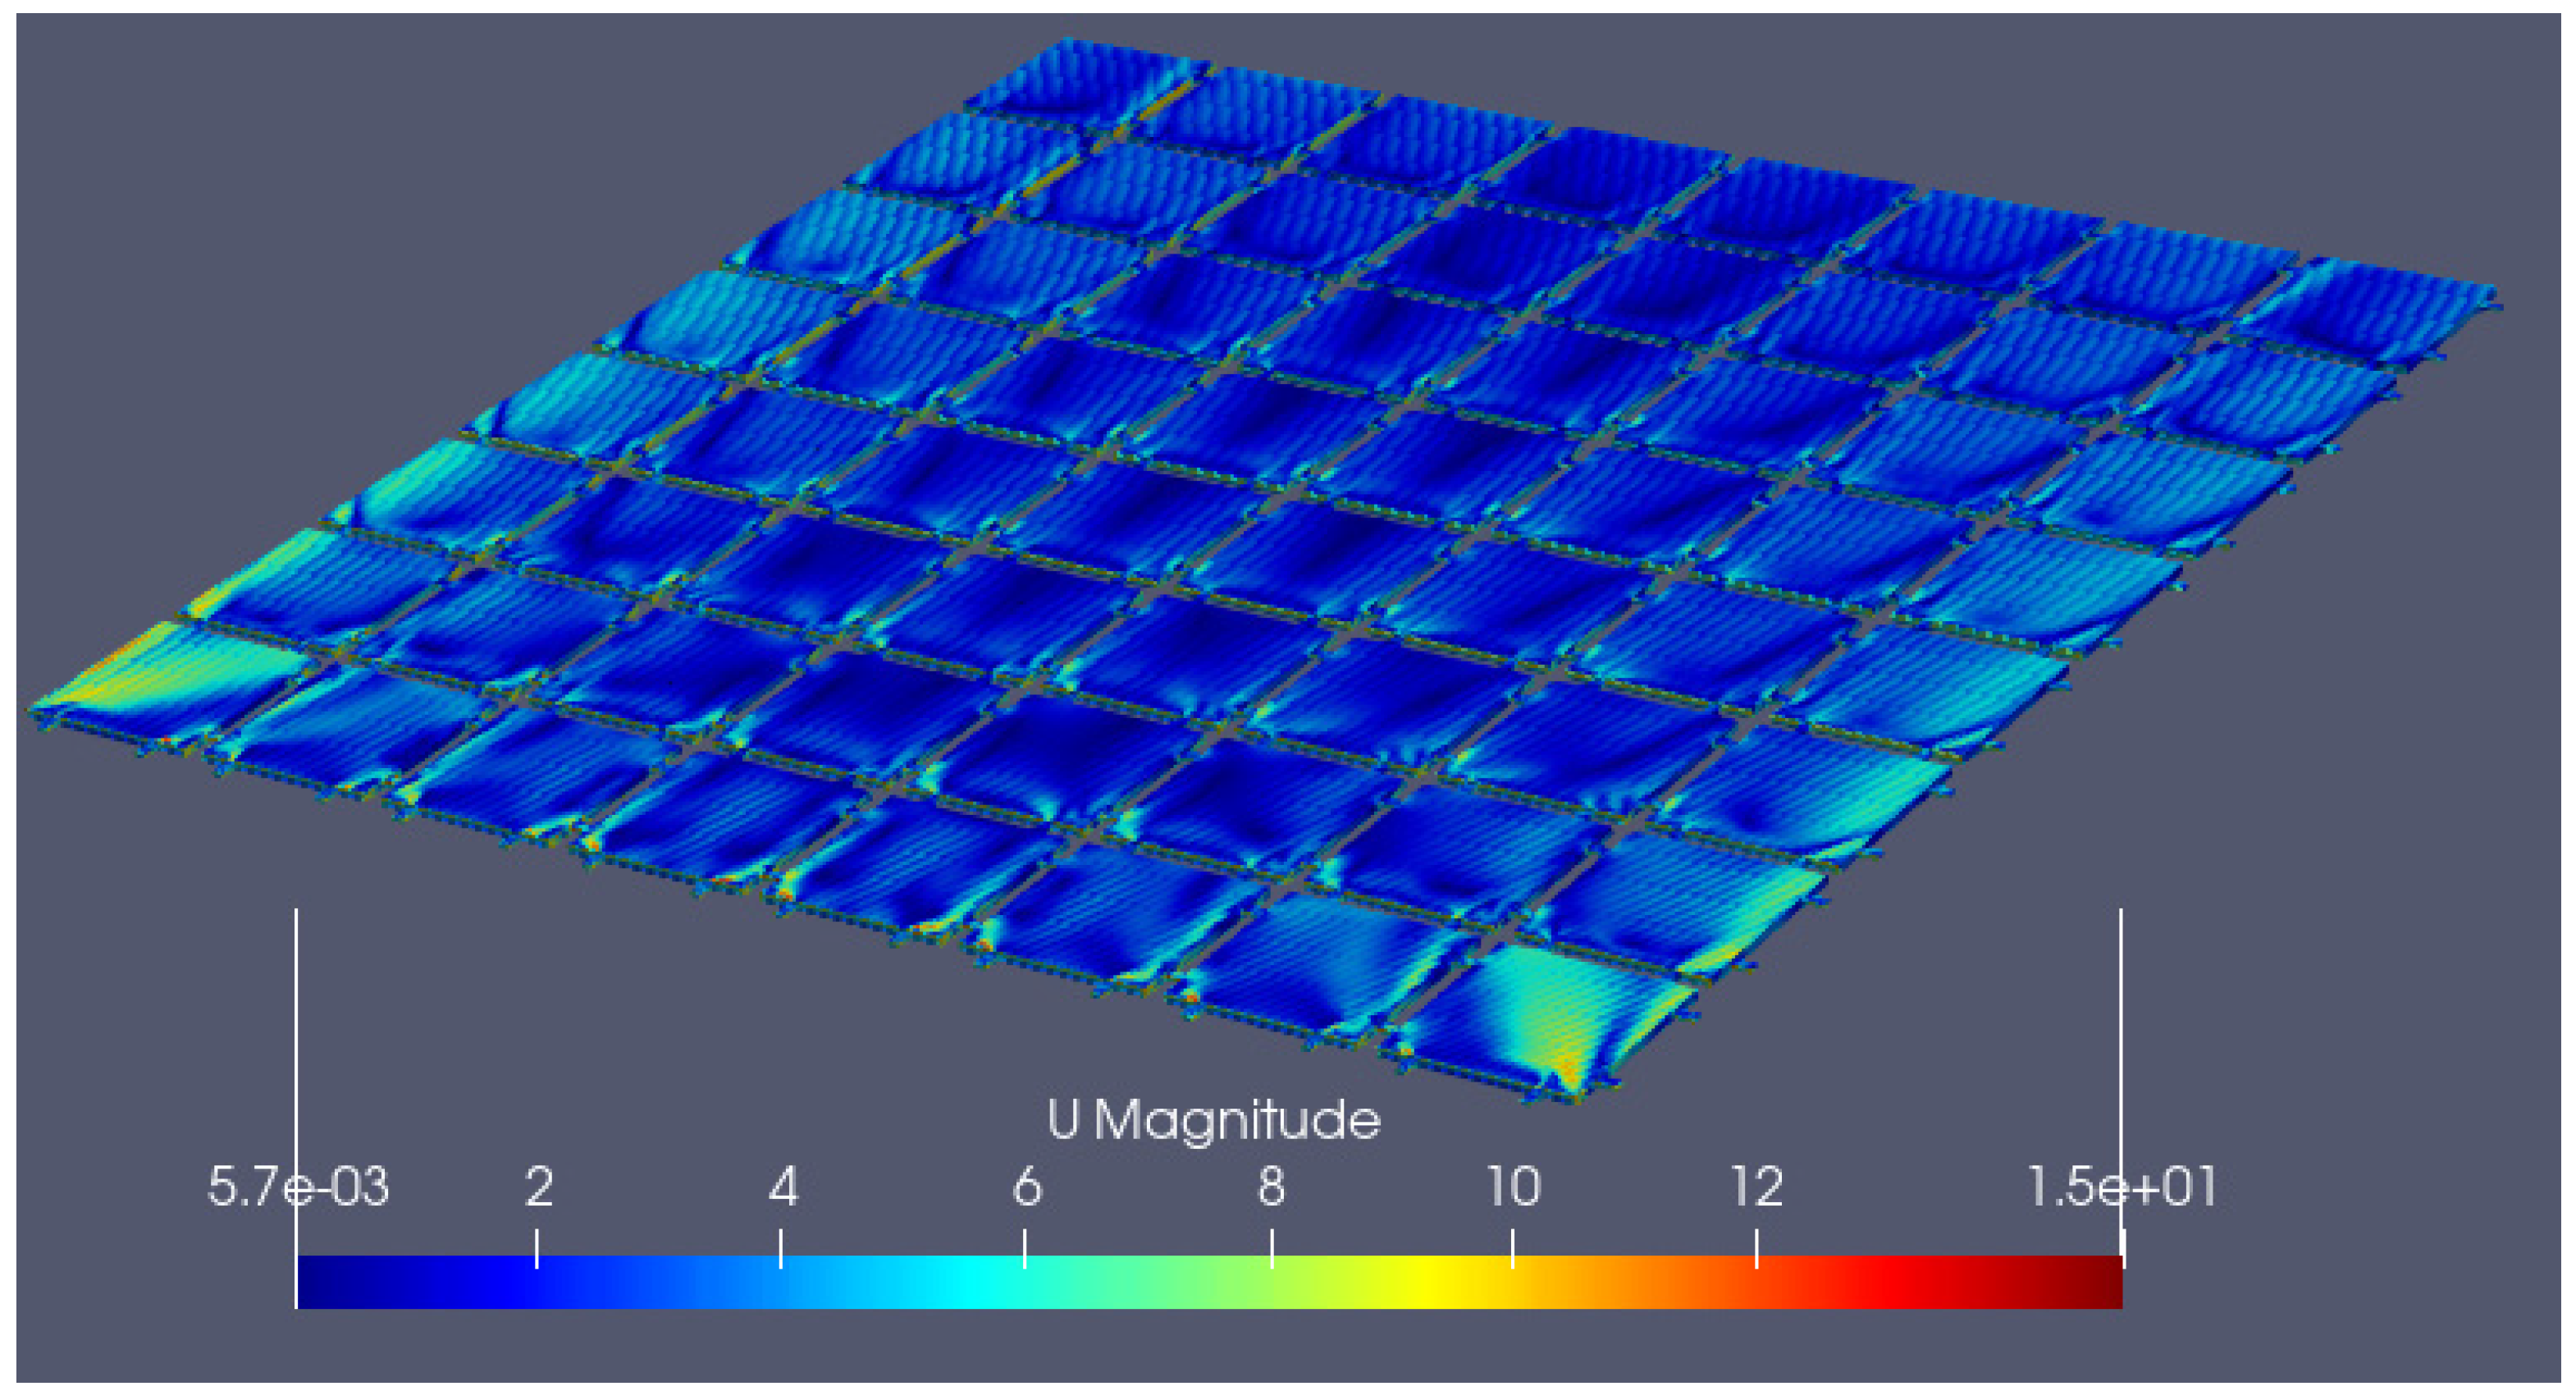
Figure 12 and
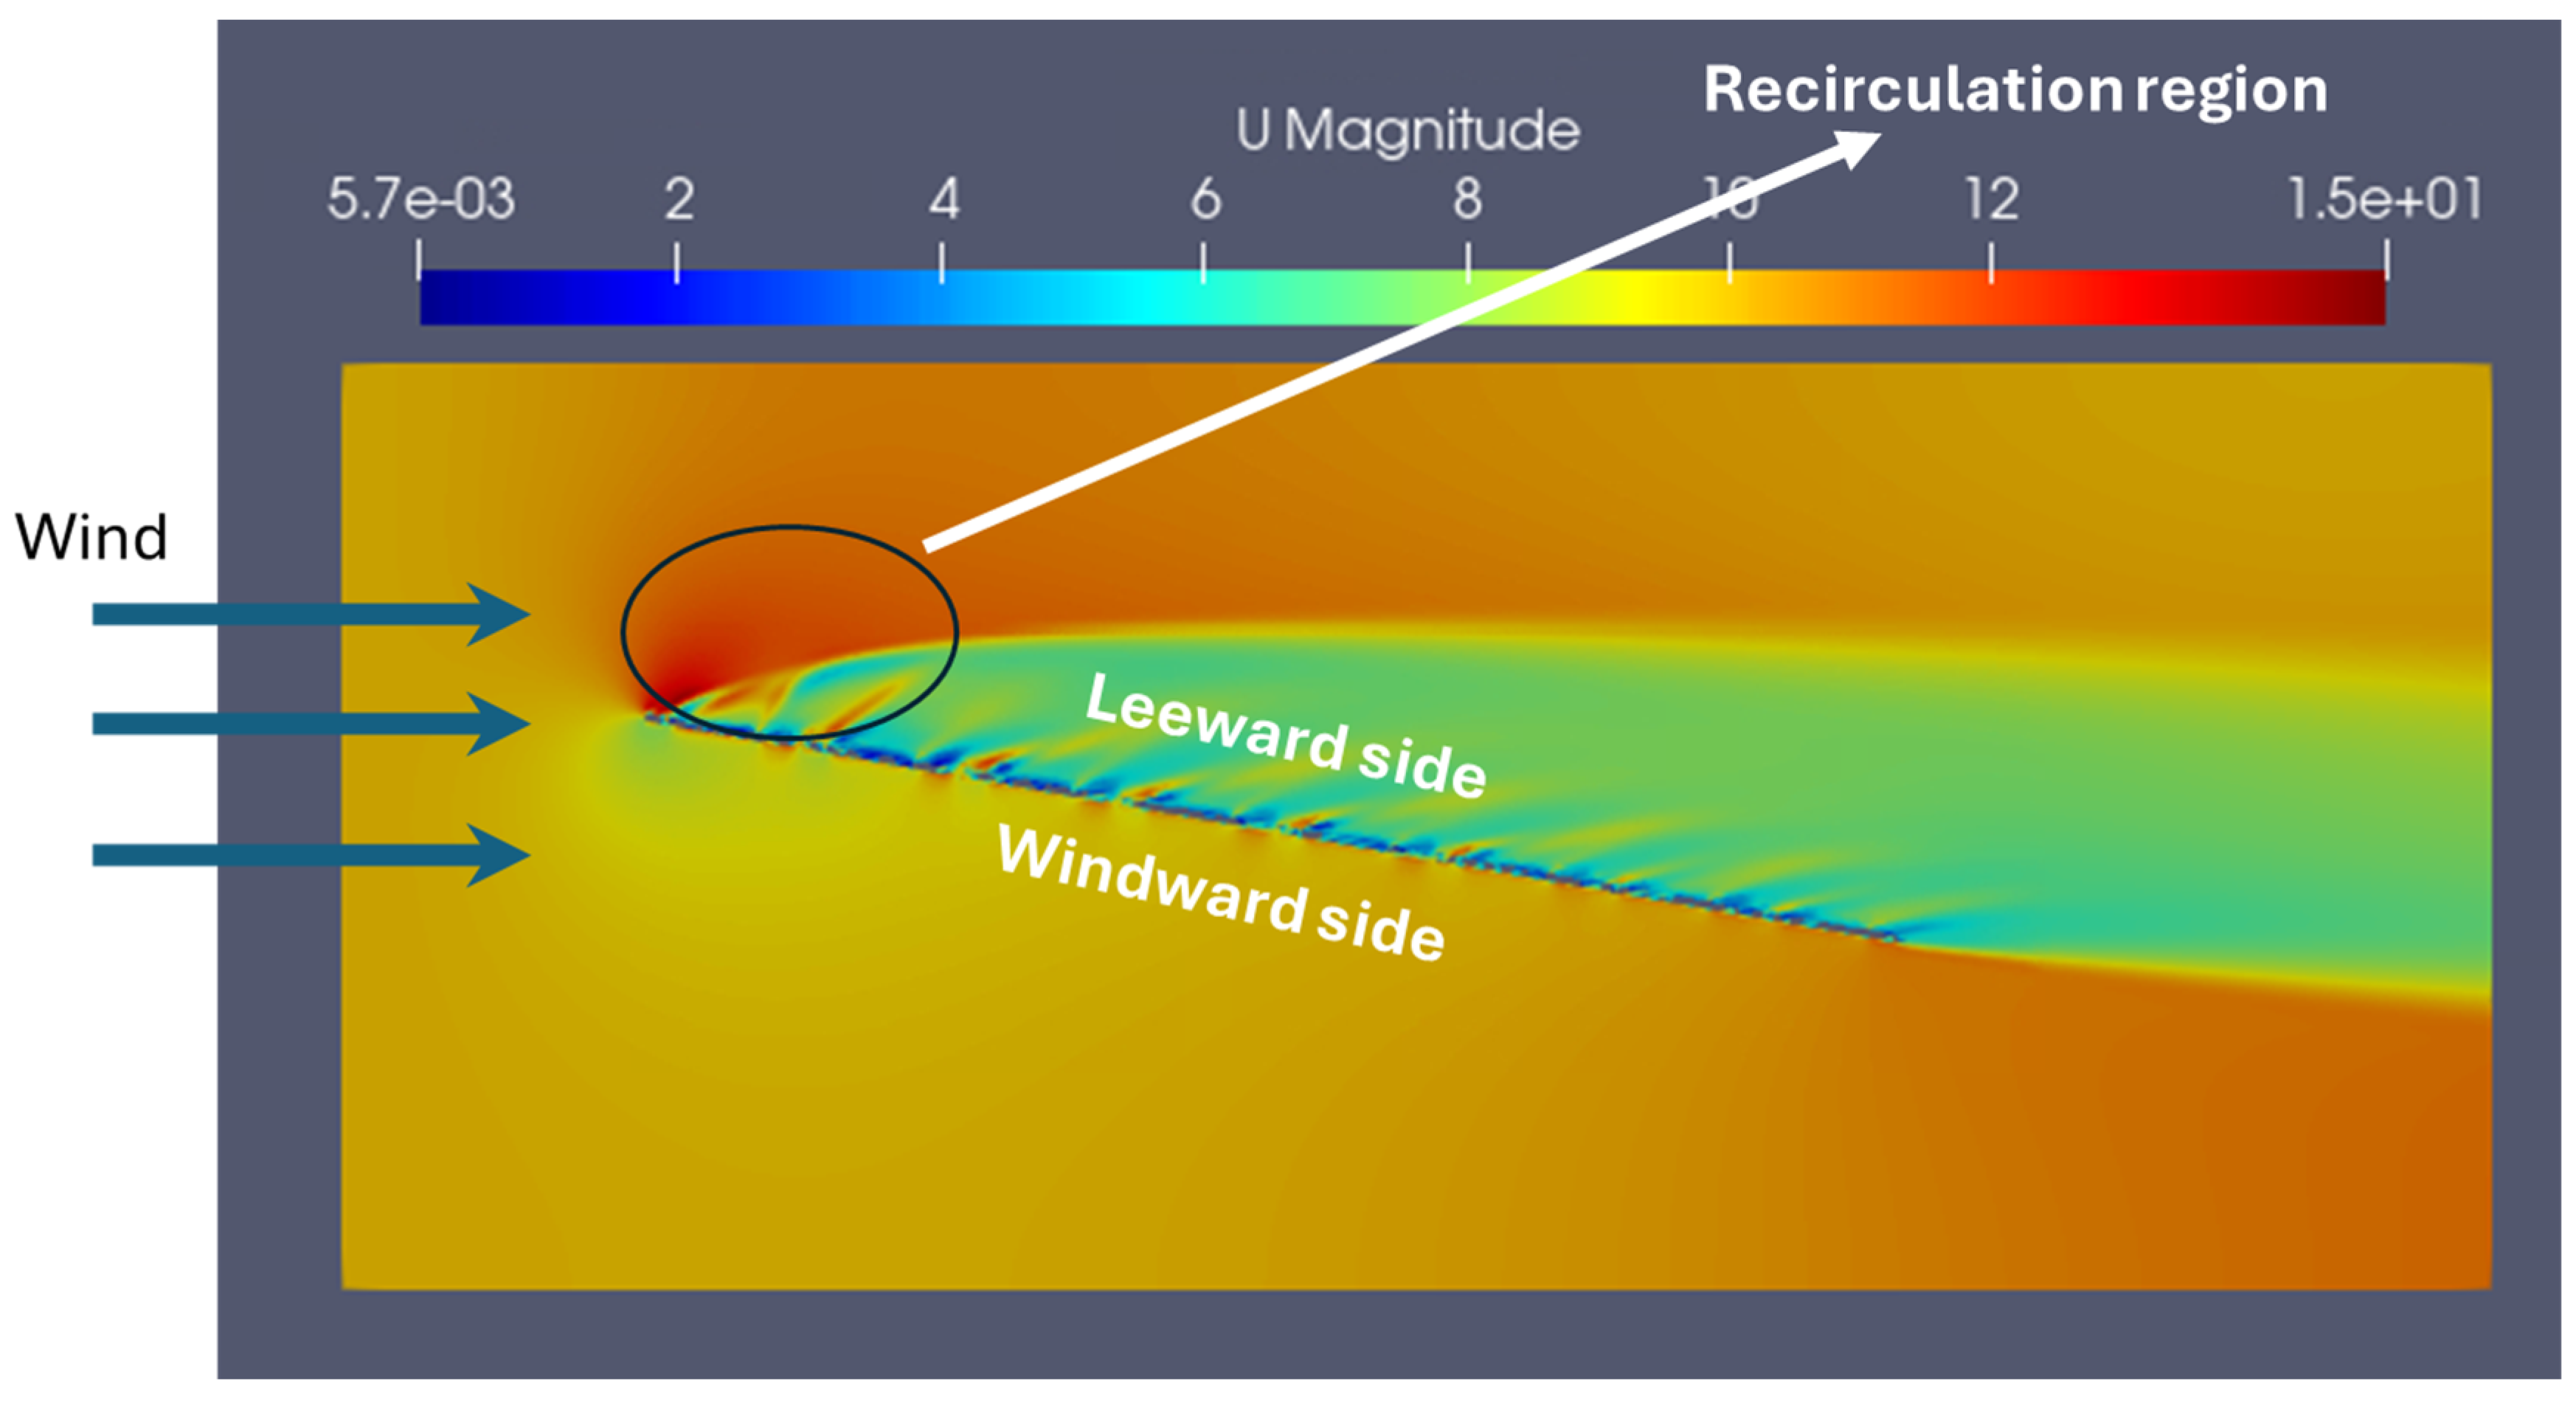
Figure 13) over the PV panel arrays provide detailed information about the aerodynamic characteristics of the FPV. A region of higher pressure on the windward side and a region of lower pressure on the lee side is visible (see
Figure 11), and these pressure differences result in the lift and drag forces. A region of lower velocities on the lee side of the PV panels is also clearly visible (see
Figure 12 and
Figure 13). These contour plots enable the identification of flow separation regions, presenting deeper insights into the aerodynamic performance of the FPV system.
3.2. Verification of Lift and Drag Relationships
In the previous CFD simulations, varying front panel numbers—4 × 8, 8 × 8, 12 × 8, and 16 × 8 configurations—were utilized, and a correlation was developed to establish the relationship between the number of front panels and the corresponding lift and drag coefficients. To verify the reliability and applicability of this correlation, additional simulations were performed at 0, 5, 10, and 20-degree angles of attack (AOA), focusing on a larger 32 × 8 panel configuration. The purpose was to examine the predictive capability of the correlation when applied to an array size beyond those originally considered.
For comparison, independent CFD simulations of the 32 × 8 panel configuration were conducted for each AOA, and the lift and drag obtained from these simulations were compared with the developed correlation. The results showed that for 0- and 5-degrees AOA, the discrepancy between the correlation and CFD simulations was approximately 5–6% for both lift and drag coefficients. At 10 degrees AOA, the discrepancy increased to approximately 10% and 7% for lift and drag, respectively. For the higher angle of 20 degrees, a larger discrepancy of 12–16% was observed.
The observed discrepancies can be attributed to several factors. As the panel configuration increases from those originally considered (up to 16 × 8) to the larger 32 × 8 configuration, geometric scaling effects may introduce nonlinearities that the original correlation did not account for. Larger configurations, particularly at higher angles of attack, may experience different flow characteristics, such as increased turbulence, flow separation, or altered pressure distribution, leading to variations in aerodynamic forces. These effects become more pronounced as the angle of attack increases, contributing to the larger discrepancies at 20 degrees.
3.3. Effect of the Breakwater on the Aerodynamic Coefficients
Previous studies [
9,
10] have demonstrated that the FPV will be subjected to extreme aerodynamic forces. Consequently, one of the primary objectives of this study is to identify a solution to mitigate these forces acting on the FPV. This present study is essential for improving the performance and safety of the FPV, ensuring it can withstand the challenging aerodynamic conditions it will face. One of the solutions is to introduce a wind/wavebreaker. Introducing the breaker not only attenuates high-frequency waves, but it acts as a barrier against wind, which offers a promising solution to minimize aerodynamic forces on floating photovoltaic (PV) panels. In aerodynamic simulations without breakwater, it was observed that the lift and drag forces increased with the angle of attack, indicating a potential challenge for floating PV systems exposed to wind. By strategically placing breakwaters around the floating PV array, several benefits can be realized. Firstly, the breakwater serves as a physical barrier, and placing the panels in the sheltered zone behind the breakwater ensures that they experience reduced wind speeds and smoother airflow, minimizing the aerodynamic forces acting upon them. This attenuation of wind speed due to breakwater effectively mitigates the aerodynamic forces experienced by the panels. Moreover, the breakwater helps to create a calmer microenvironment within its sheltered area, further reducing the impact of turbulent wind conditions on the panels.
3.3.1. Breakwater with 8 × 8 Matrix
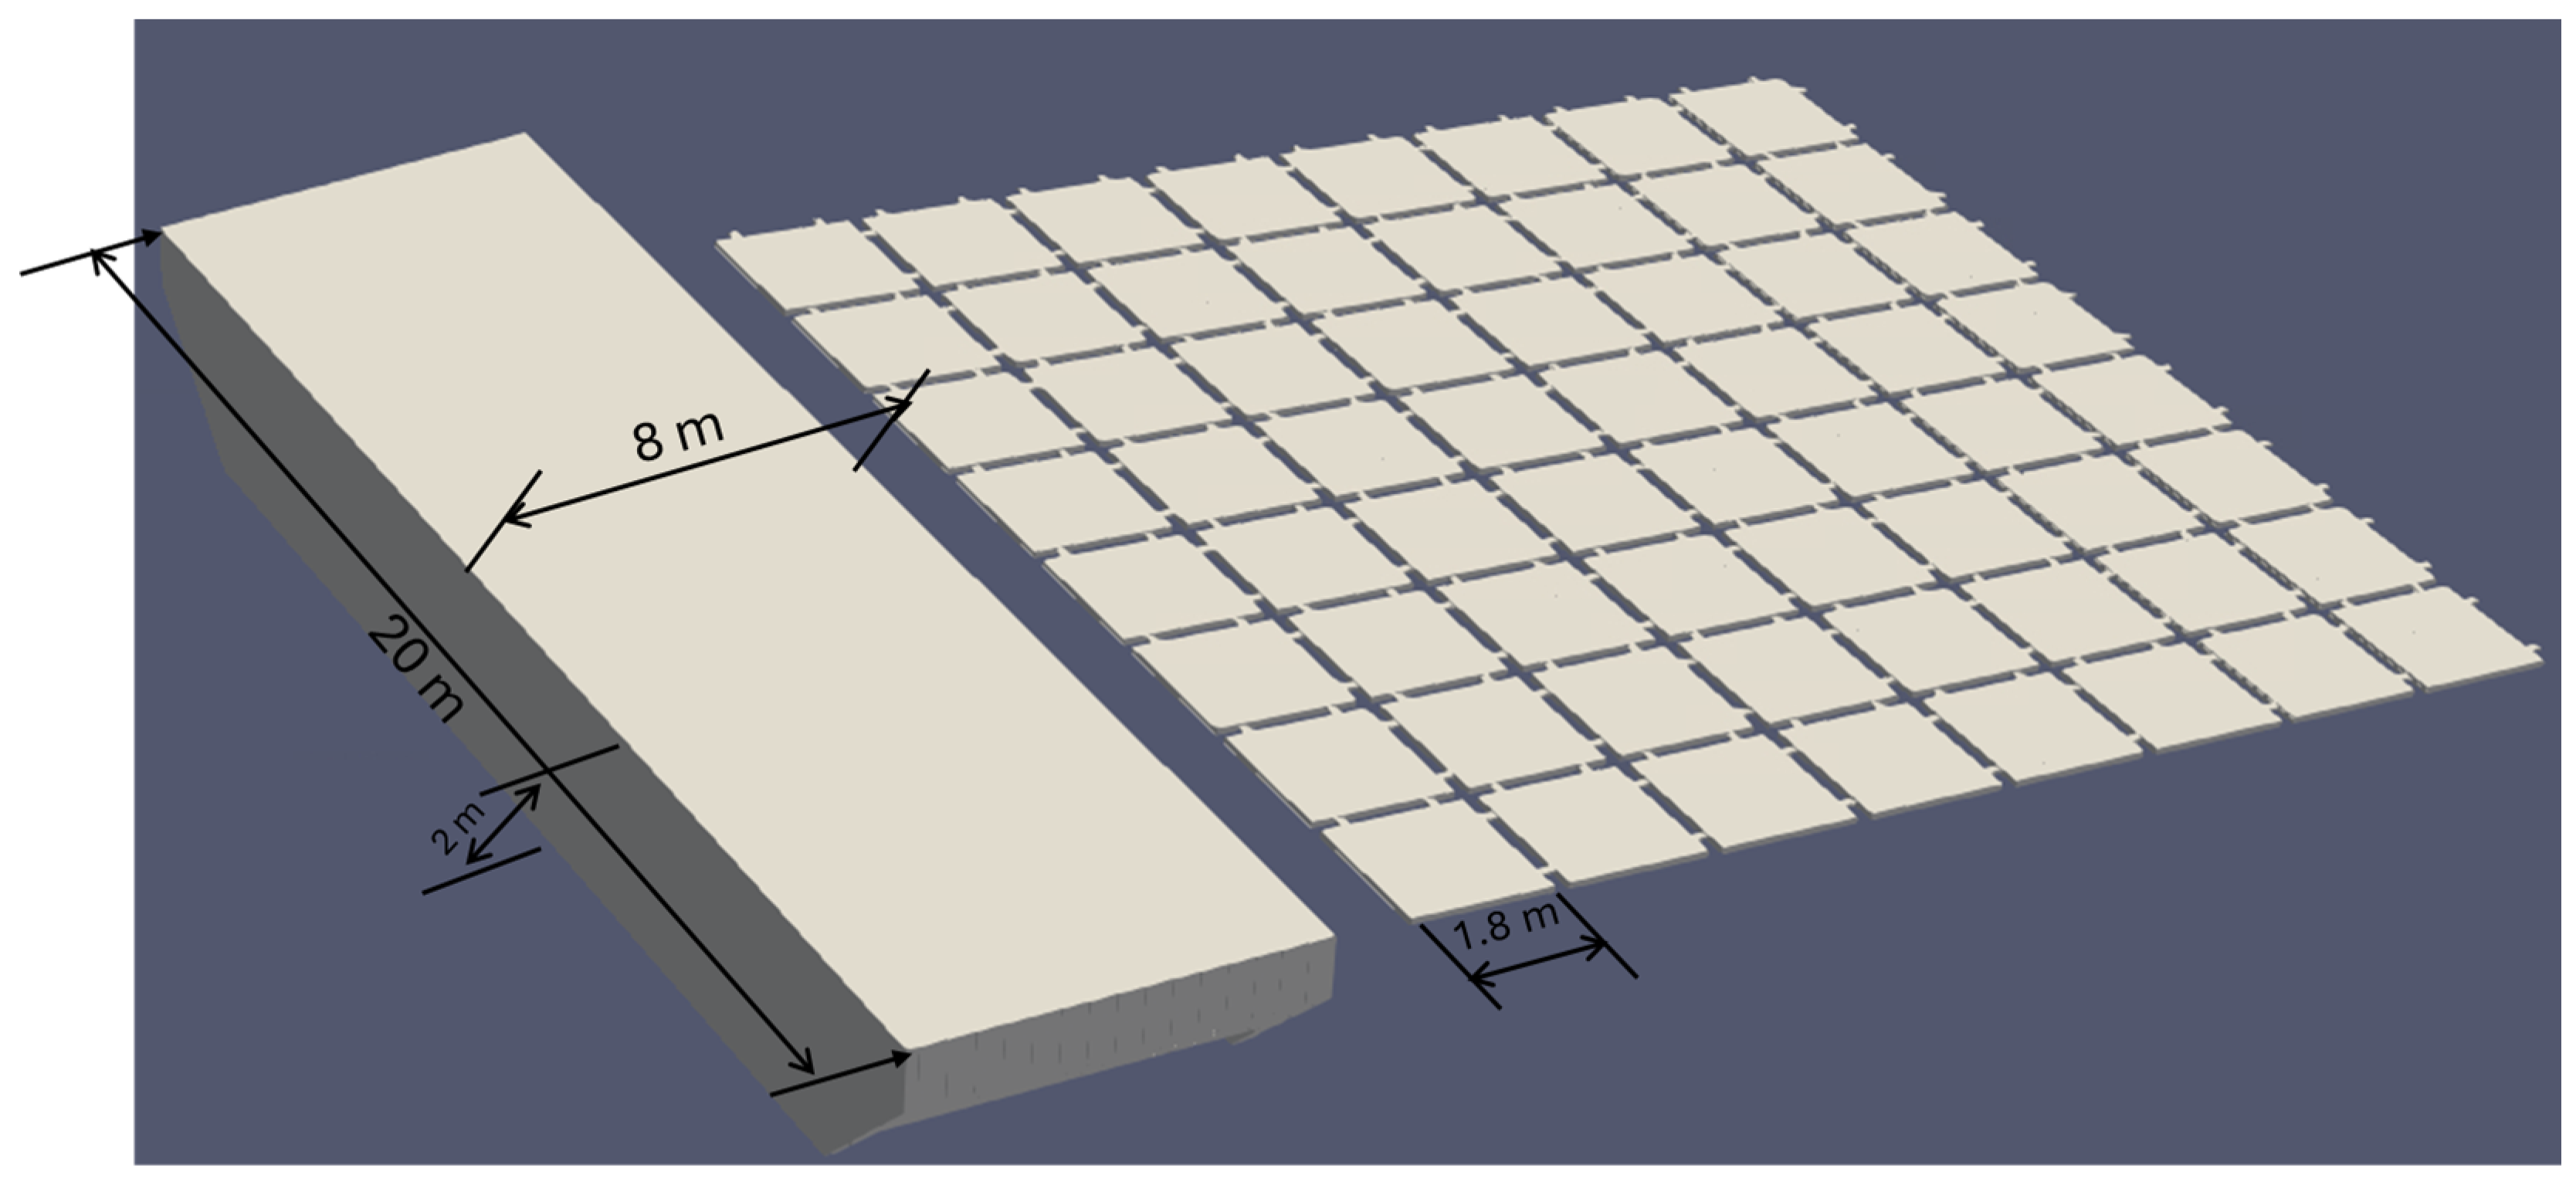
To assess the effectiveness of the breakwater in reducing aerodynamic forces on the floating PV panels, a series of CFD simulations were conducted. In these simulations, a single breakwater of dimensions 20
× 5
× 2 (L
× W
× H) was positioned ahead of an 8
× 8 matrix of PV panels, maintaining a distance of 2 and 5 m between the breakwater and the panels. The distance was chosen based on the wave conditions. For a significant wave height of 14 m, a distance of 5 m is required to prevent water from reaching the PV panels after impacting the breakwater. A 2-m distance was selected because the breakwater height is also 2 m. A configuration with a breakwater and FPV panel is shown in
Figure 14. The PV panels were subjected to two angles of attack/inclination angle (5 and 10 degrees) to represent different wind conditions. The entire PV matrix was subjected to inclination angles of attack of 5 and 10 degrees to simulate different wind conditions. These angles represent the inclination of the entire array relative to the wind direction, which affects how aerodynamic forces are distributed across the matrix. By varying these lifting angles, we aim to capture the impact of different wind orientations on the overall aerodynamic performance of the PV array. The selection of 5 and 10 degrees of FPV panel inclination was based on the observed sheltering effect provided by the breakwater at these angles. With a fixed breakwater height of 2 m, the FPV panels remain largely shielded from wind when inclined at 10 degrees or less. Beyond this angle, the PV modules begin to be exposed to direct wind, reducing the effectiveness of the breakwater. Thus, simulations beyond 10 degrees were not performed, as the primary purpose was to evaluate the breakwater’s aerodynamic shielding effect.
For higher inclinations, the FPV panels would require an increased height to maintain their protection by the breakwater, and such scenarios fall outside the scope of this study. Our focus was on the performance of the existing breakwater configuration, which is optimized for low-inclination angles.
Table 7 shows the simulation matrix performed with the breakwater.
A few CFD simulations were performed for each angle of attack/inclination angle, comparing the lift and drag coefficients of the PV panels with and without the presence of the breakwater. The results of these simulations, summarized in
Table 8, provided valuable insights into the impact of the breakwater on aerodynamic forces experienced by the PV panels.
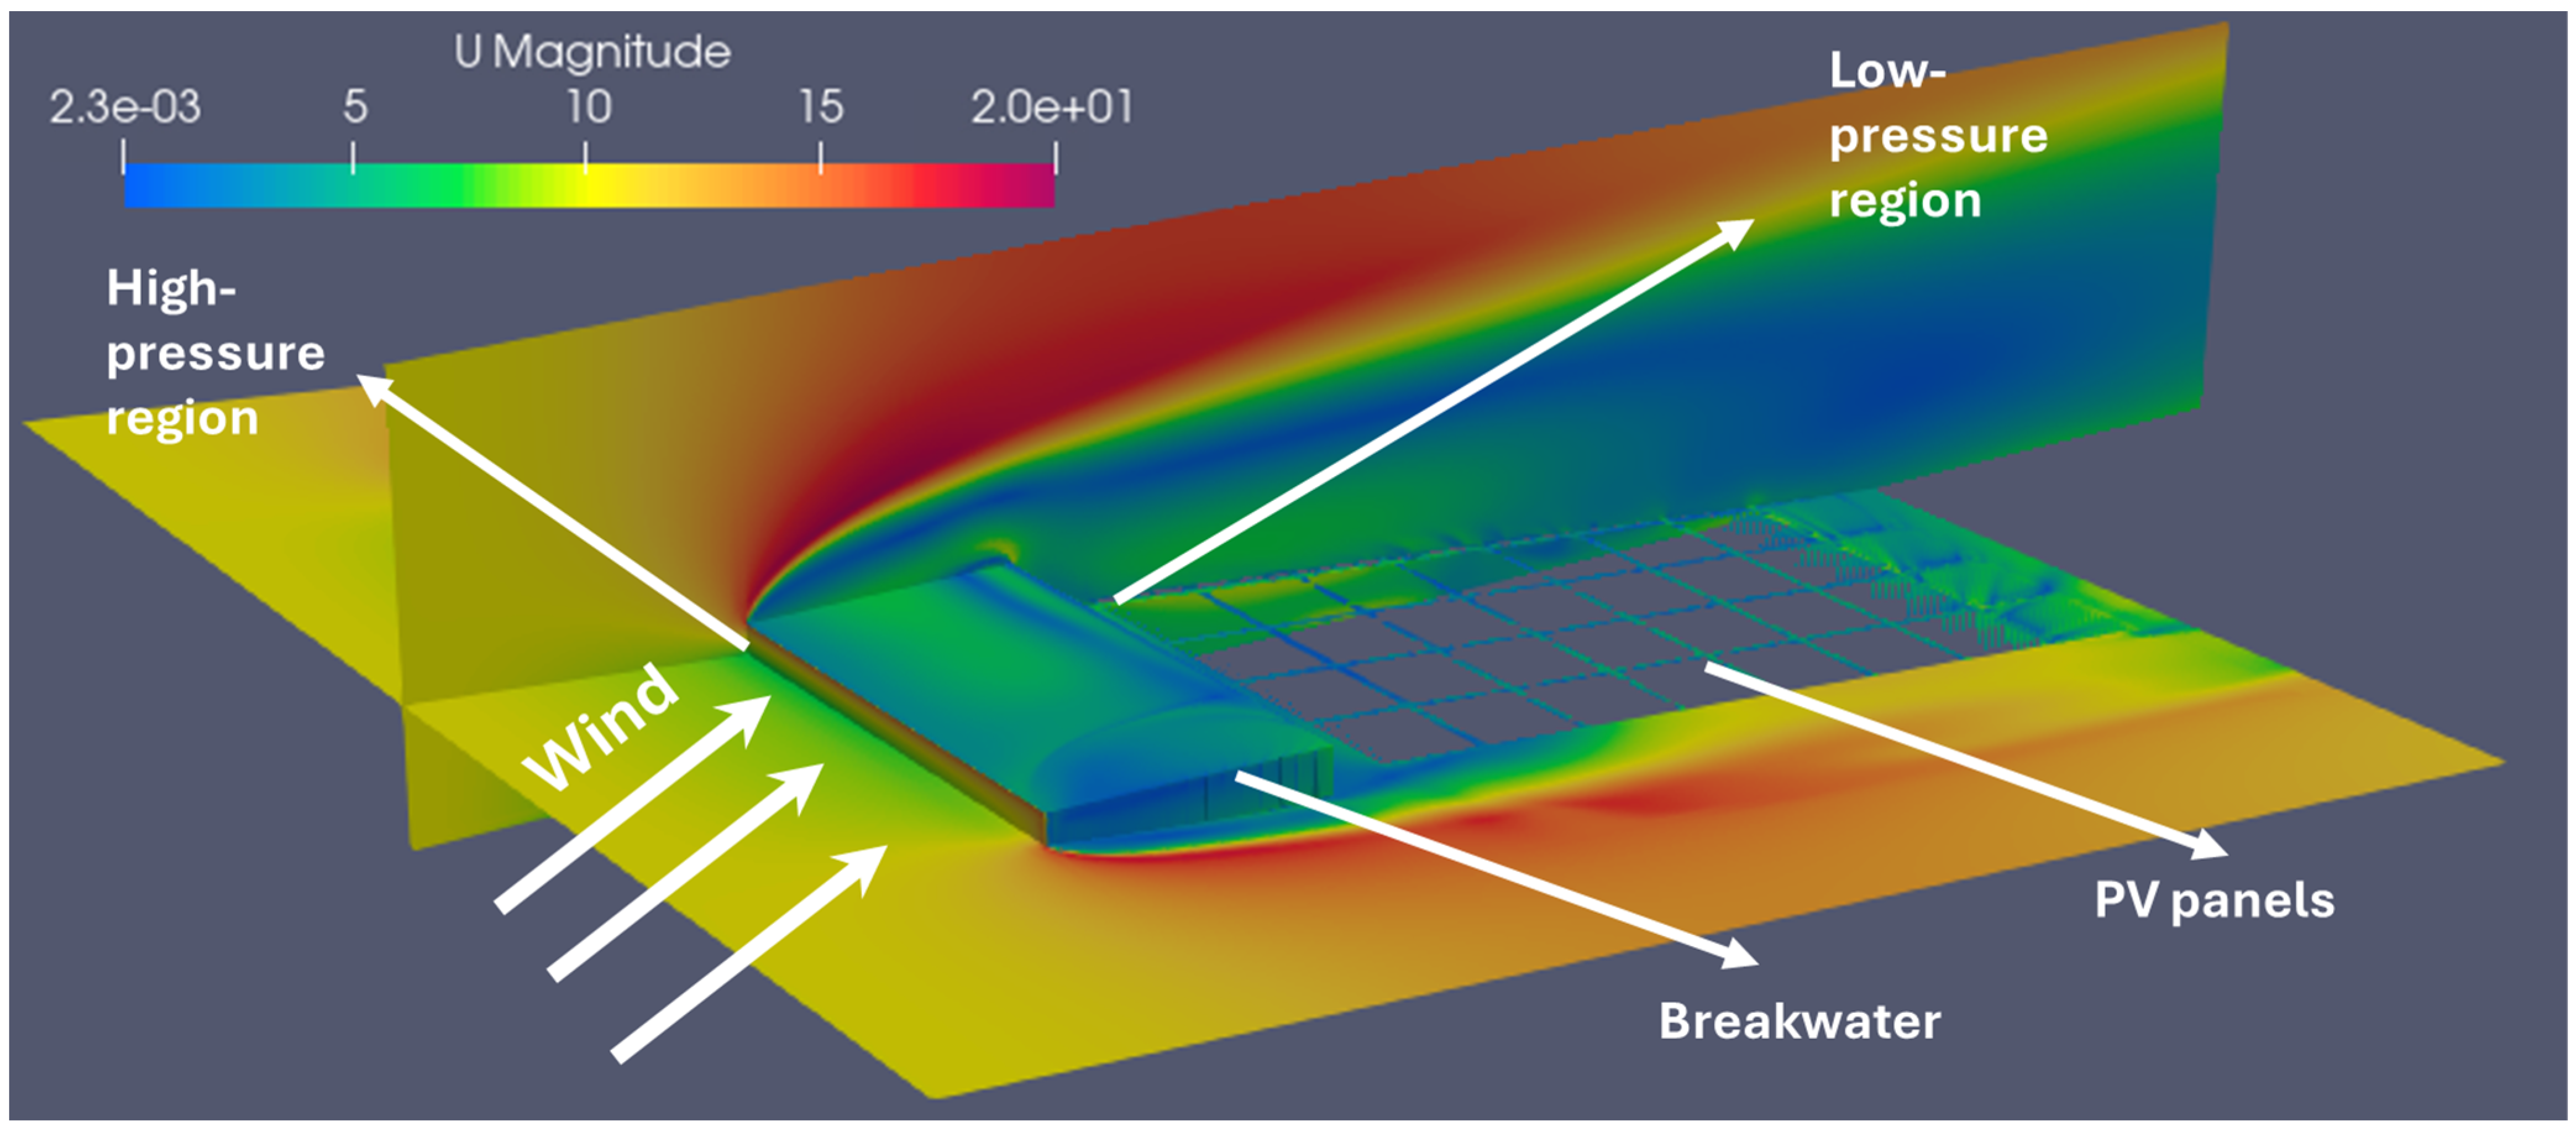
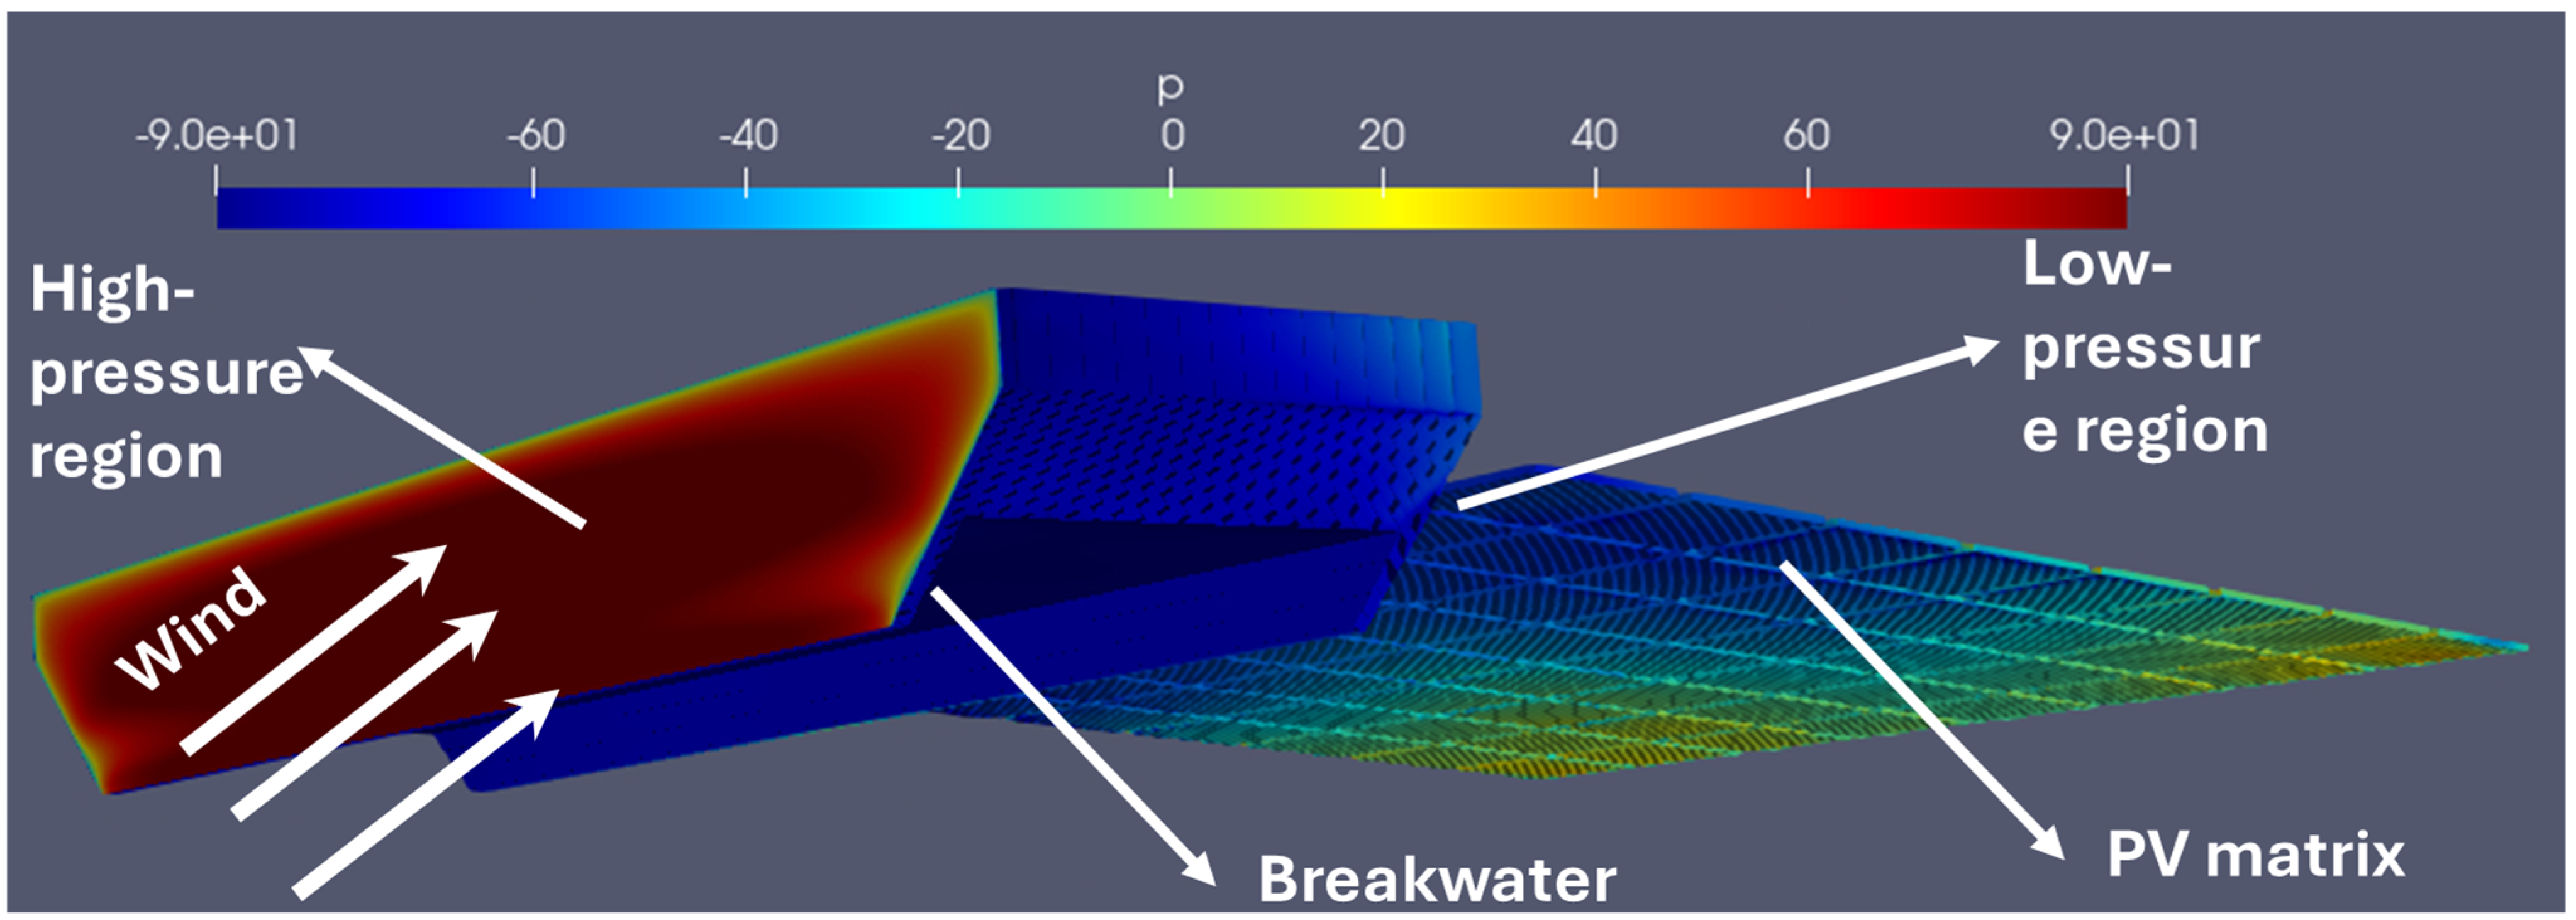
This study showed a significant reduction in both lift and drag forces when the breakwater was introduced, particularly for angles of attack/inclination angle up to 10 degrees. The breakwater successfully dampened wind speeds and altered airflow patterns (see
Figure 15 and
Figure 16), leading to reduced aerodynamic loads on the PV panels within its sheltered area. Velocity and pressure contour plots with breakwater are shown in
Figure 15 and
Figure 16.
The reduction of wind forces on floating PV systems can be attributed to the sheltering effect provided by the breakwaters. This sheltering effect acts as a wind buffer, disrupting airflow and reducing the direct wind pressure on the PV panels. In particular, when a breakwater is strategically positioned in front of the PV array, it deflects or absorbs a portion of the incoming wind forces, reducing their impact on the panels. The effectiveness of this wind force reduction depends on several factors, including the height, distance, and orientation of the breakwater relative to the wind direction. At lower angles of attack, the sheltering effect is more pronounced, leading to a significant decrease in wind-induced drag and lift forces on the PV panels.
Nonetheless, as the distance between the breakwater and the FPV system increases, the effectiveness of the breakwater diminishes. Additionally, beyond an angle of attack of 10 degrees, the PV panels are exposed to wind conditions that exceed the protective reach of the breakwater. At these higher angles, the breakwater’s ability to mitigate aerodynamic forces decreases, resulting in increased lift and drag coefficients compared to conditions where the breakwater provides effective shelter.
However, it is important to note that the height of the breakwater also plays a crucial role in its effectiveness. While the current study evaluates a 2-meter-high breakwater, increasing its height could enhance its protective capability, particularly at higher angles of attack. A taller breakwater would extend the effective wind shielding range, potentially improving the reduction of aerodynamic forces on the PV panels under more severe wind conditions. These findings underscore the importance of both strategic positioning and appropriate height of the breakwater to optimize its performance in mitigating aerodynamic forces across a range of wind angles.
3.3.2. Breakwater with 16 × 16 Matrix
In addition to the 8 × 8 matrix of PV, CFD simulations were conducted to investigate the aerodynamic behavior of a 16 × 16 floating photovoltaic (PV) matrix with and without the presence of a breakwater. The 16 × 16 matrix configuration serves as a representative model for real-world applications, facilitating a thorough examination of the aerodynamic forces of floating PV arrays.
A configuration with a breakwater and FPV with 0-degree and 5-degree FPV inclination is shown in
Figure 17 and
Figure 18, respectively. The 16
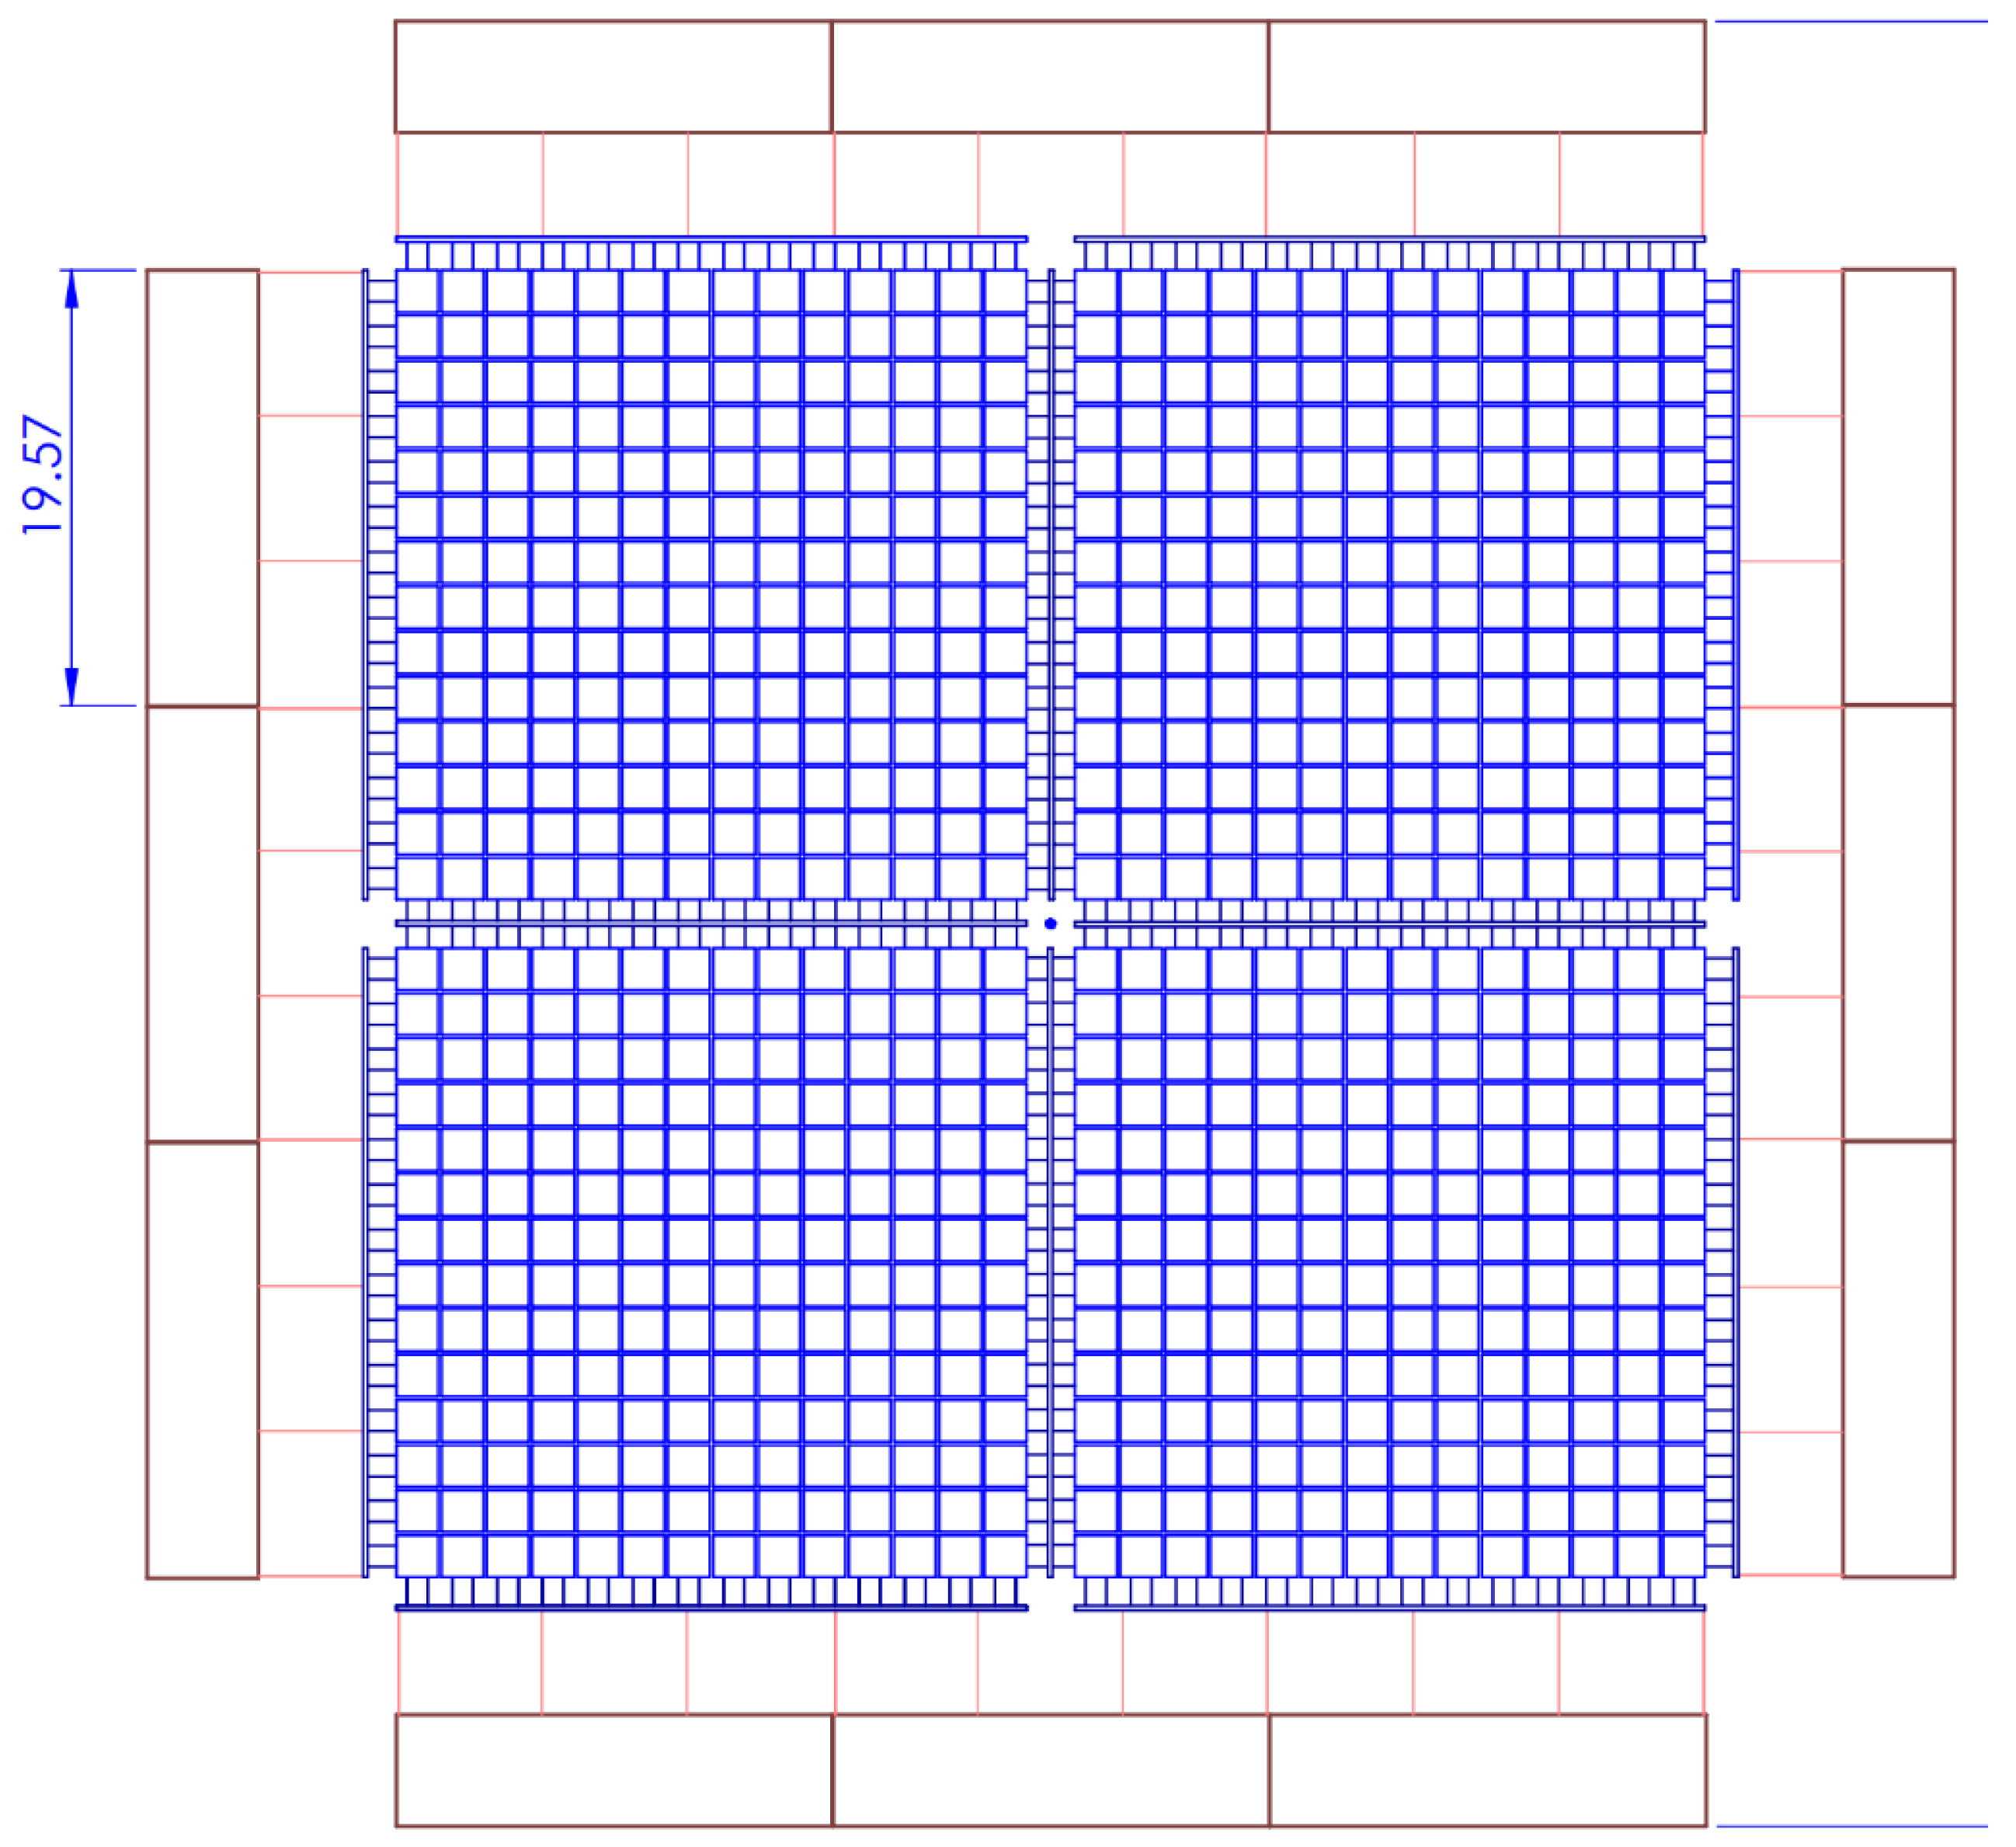
× 16 matrix configuration resembles the commercial concept, consisting of a grid layout comprising 14 strings, with each string consisting of 14 PV modules, resulting in a total capacity of 105 kWp (see
Figure 3). One of the key aspects analyzed in this study was the estimation of lift and drag coefficients to assess the forces acting on the floating PV system. By employing CFD techniques, the lift and drag coefficients were calculated for both scenarios (with and without breakwater). The results were then compared between the configurations with and without the breakwater to determine the influence of the breakwater on the aerodynamic performance of the system. An improved understanding of the lift and drag forces will allow us to design an FPV system with improved stability. The results are presented in the next section.
The simulation results are presented in
Table 9, highlighting the notable differences in the aerodynamic performance between the 16 × 16 PV matrix configurations with and without the breakwater at a 5-degree angle of attack (AOA) and a breakwater distance of 2 m. Specifically, for the configuration without the breakwater, the drag coefficient (C
d) was recorded at 372 and the lift coefficient (C
l) at 2350. In contrast, when the breakwater was introduced, the C
d was significantly reduced to 10, and the C
l dropped to 300.
These results underscore the substantial impact of the breakwater in reducing both drag and lift forces on the FPV system. Without the breakwater, the PV array is fully exposed to wind forces, leading to much higher aerodynamic forces that can compromise the system’s stability. The drastic reduction in both Cd and Cl when the breakwater is in place demonstrates its effectiveness in shielding the array from direct wind exposure, greatly minimizing wind-induced pressures and forces on the panels.
The reduction in aerodynamic forces contributes to enhanced structural stability, reducing the risk of panel overturning or displacement due to strong winds. This protective effect becomes particularly important in offshore environments, where wind conditions can be more severe and consistent. Moreover, the results suggest that the breakwater is not only effective in reducing the magnitude of aerodynamic forces but also in ensuring uniform force distribution across the larger configuration, which is crucial for maintaining the structural integrity of large-scale FPV systems.
In summary, the comparison between the simulations with and without the breakwater highlights the crucial role of breakwaters in mitigating wind forces, thereby improving the operational safety and durability of floating PV systems. In this study, two configurations were considered: the 8 × 8 matrix and the 16 × 16 matrix. Both configurations demonstrated a positive effect of the breakwater in reducing lift and drag forces. Based on the results, we believe that the sheltering effect of the breakwater is largely independent of the PV configuration, as the primary function of the breakwater is to shield the PV panels from wind forces, irrespective of array size. However, we agree that a more detailed analysis for larger configurations could provide additional insights.
4. Conclusions
A method for estimating wind loads on PV arrays in floating PV (FPV) systems using comprehensive CFD simulations is presented. Using the CFD results, we developed detailed correlations for lift and drag coefficients as functions of the number of PV panels, considering panel configurations of 4 × 8, 8 × 8, 12 × 8, 16 × 8, and 32 × 8, and various angles of attack (0, 5, 10, and 20 degrees). These correlations provide critical insights into how aerodynamic forces vary with PV array size and wind direction, offering a valuable tool for designing large-scale FPV farms. Accurate estimation of these aerodynamic forces is essential for ensuring structural integrity and mitigating failure risks. In practical applications, the developed correlations can guide engineers in selecting optimal panel configurations and predicting aerodynamic performance for different wind conditions, thus enhancing the design and safety of FPV systems. This will also help in reducing overall design time.
However, it is important to note the limitations of these correlations. The correlations were developed based on a specific set of panel configurations and angles of attack. Consequently, their applicability to configurations outside this range or to different environmental conditions may be limited. Additionally, the correlations may not account for all factors influencing aerodynamic performance, such as complex interactions between panels or varying wind turbulence. Therefore, while these correlations offer valuable insights, they should be used with caution and supplemented with further simulations or experimental validation when applied to different configurations or more extreme conditions.
Additionally, this study assessed the use of breakwaters as a protective measure against wind forces. We observed that a breakwater height of 2 m, with distances of 2 and 5 m from the PV panels, effectively reduced wind forces at lower angles of attack (0, 5, and 10 degrees). This indicates that incorporating breakwaters can significantly enhance the stability of FPV systems under specific wind conditions. However, the reduction in wind forces was less pronounced at higher angles of attack (10 degrees), suggesting that the breakwater’s effectiveness is influenced by the angle of attack.
5. Practical Application of the Proposed Study
The conclusions drawn from this study have significant practical implications for the design and optimization of floating PV (FPV) systems. The developed correlations for lift and drag coefficients as a function of the number of PV panels and angles of attack provide engineers with a practical tool for estimating aerodynamic forces in the early stages of design. These correlations help reduce the need for time-consuming simulations in routine design processes, especially for configurations similar to those studied (4 × 8, 8 × 8, 12 × 8, 16 × 8, and 32 × 8) and angles of attack (0, 5, 10, and 20 degrees). This can streamline the design of FPV systems by allowing engineers to predict wind loads accurately, optimize panel configurations, and reduce the risk of system failure due to wind-induced forces.
However, the practical use of these correlations is limited to the configurations and wind angles studied in this research. For larger configurations or more extreme wind conditions, the correlations should be used with caution and supplemented by additional CFD simulations or experimental validation to ensure accuracy. This is particularly relevant in environments with high wind turbulence or other environmental factors that were not fully explored in this study.
In terms of breakwater application, the findings offer practical insights into the design of protective structures for FPV systems. By incorporating a breakwater with a height of 2 m at distances of 2 and 5 m from the PV panels, designers can significantly reduce wind loads at lower angles of attack (0, 5, and 10 degrees), improving the overall stability of the system. This has direct implications for offshore FPV deployment, where harsh wind conditions can affect both the performance and safety of the system. The breakwater’s ability to mitigate wind forces, particularly in moderate wind conditions, makes it a viable protective measure for FPV systems. However, for higher angles of attack (10 degrees or more), the effectiveness of the breakwater is reduced, suggesting that breakwater design and placement must be tailored to the specific environmental conditions of the FPV installation.
The correlations developed in this study, along with the evaluation of breakwater effectiveness, provide actionable guidance for engineers involved in the design and deployment of FPV systems, particularly under moderate wind conditions. By applying these findings, engineers can enhance both the stability and safety of large-scale FPV systems while optimizing design efficiency and reducing project costs.
