
Parametric Building Envelopes Rationalized in Terms of Their Solar Performance in a Temperate Climate
Abstract
1. Introduction
2. State of the Arts
2.1. Direct Solar Irradiation
2.2. Solar Performance of Building Envelopes
2.3. Parametric Artificial Neural Networks
3. The Aim
4. Methodology
5. Results
6. Analysis
6.1. Correlations
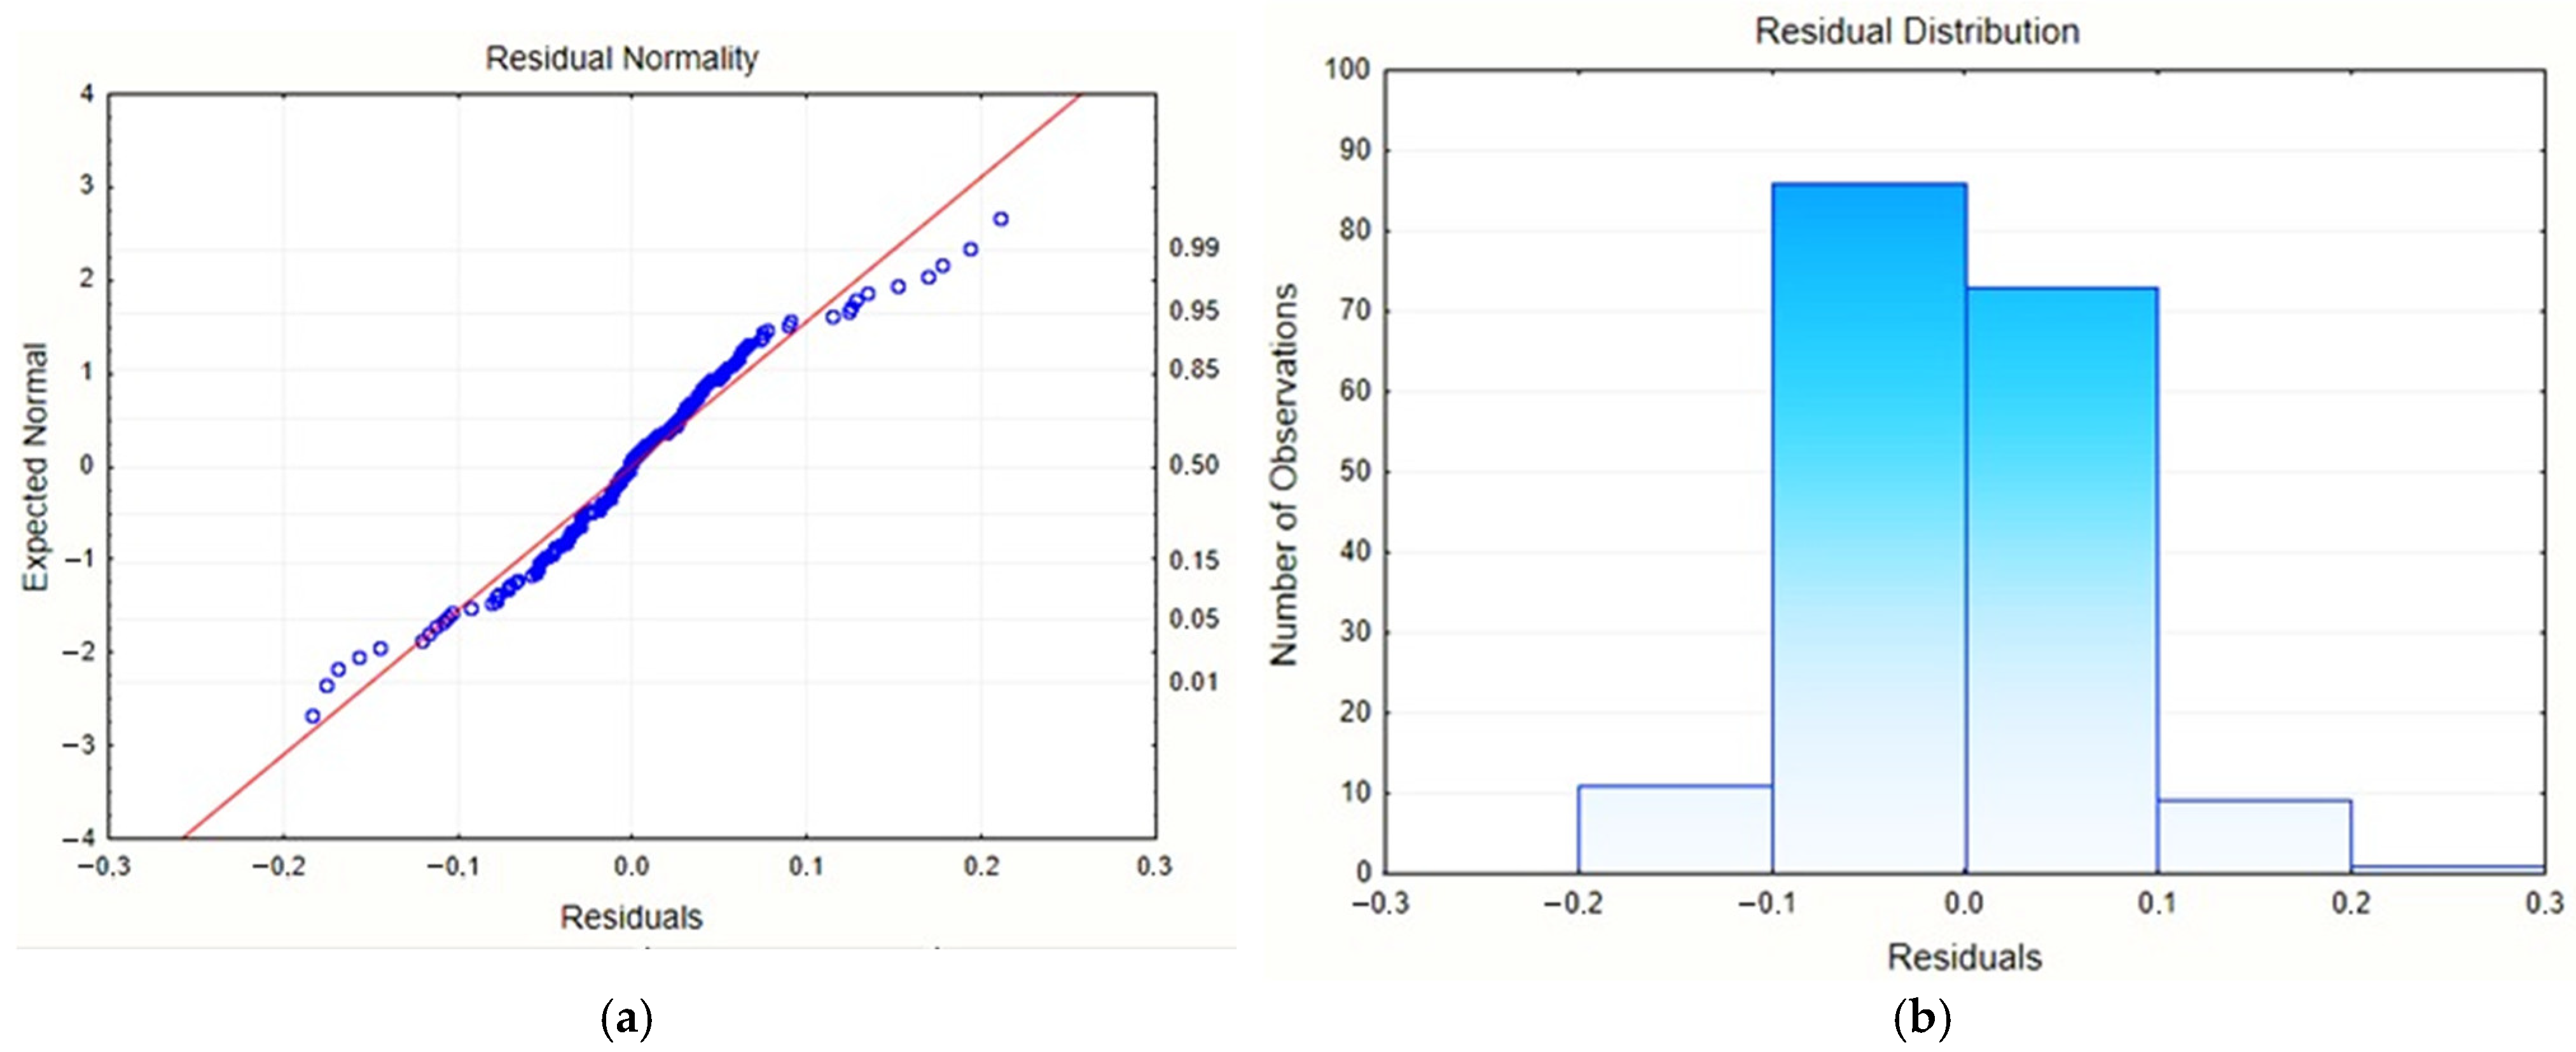
6.2. Regression
6.3. Parametric Neural Network
7. Discussion
8. Conclusions
Author Contributions
Funding
Data Availability Statement
Acknowledgments
Conflicts of Interest
Abbreviations
| Cb | The basic building envelope |
| Cdi | The ith derivative building envelope |
| Cfp | The parametric geometric initial model |
| Cfsp | The parametric resultant solar model |
| Cfdi | The ith discrete geometric initial model |
| Cfsdi | The ith discrete resultant solar model |
| Pi | The vertex or point of a building envelope model |
| Eso | The dependent variable |
| Eso,n | The normalized dependent variable |
| ai | The ith independent variable |
| wi | The ith normalized independent variable |
| γi | The ith plane or dihedral angle |
References
- WMO. Meteorological Aspects of Utilization of Solar Radiation as an Energy Source. In World Meteorological Organisation Technical Note 172; World Meteorological Organisation: Geneva, Switzerland, 1981. [Google Scholar]
- Kabir, H.; Abu Jihad, H.; Chowdhury, S. Analysis of Solar Panel Power Investigation using Fixed Axis, Single Axis and Dual Axis Solar Tracker. 4th International Conference on Evolutionary Computing and Mobile Sustainable Networks. Procedia Comput. Sci. 2025, 252, 708–714. [Google Scholar] [CrossRef]
- Feng, J.; Luo, X.; Gao, M.; Abbas, A.; Xu, Y.-P.; Pouramini, S. Minimization of energy consumption by building shape optimization using an improved Manta-Ray Foraging Optimization algorithm. Energy Rep. 2021, 7, 1068–1078. [Google Scholar] [CrossRef]
- Krippner, R. Building-Integrated Solar Technology, Architectural Design with Photovoltaics and Solar Thermal Energy; Detail Green Books: München, Germany, 2017. [Google Scholar]
- Muneer, T. Solar Radiation and Daylight Models for Energy Efficient Design of Buildings; Architectural Press: Oxford, UK, 1997. [Google Scholar]
- Page, J.K. The Estimation of Monthly Mean Values of Daily Total Short-Wave Radiation of Vertical and Inclined Surfaces from Sunshine Records for Latitudes 40oN-40Os. Proc. UN Conf. New Sources Energy 1964, 4, 378. [Google Scholar]
- Norris, D.J. Correlation of Solar Radiation with Clouds. Sol. Energy 1968, 12, 107. [Google Scholar] [CrossRef]
- Paltridge, G.W.; Proctor, D. Monthly Mean Solar Radiation Statistics for Australia. Sol. Energy 1976, 18, 235–243. [Google Scholar] [CrossRef]
- Jordan, D.C.; Kurtz, S.R. Photovoltaic Degradation Rates—An Analytical Review. Prog. Photovolt. Res. Appl. 2013, 21, 12–29. [Google Scholar] [CrossRef]
- Jones, A.D.; Underwood, C.P. A thermal model for photovoltaic systems. Sol. Energy 2001, 70, 349–359. [Google Scholar] [CrossRef]
- Crosbie, M.J. The Passive Solar Design and Construction Handbook; Steven Winter Associates: Norwalk, CT, USA; John Willey & Sons: New York, NY, USA, 1998. [Google Scholar]
- Kolokotosa, D.; Santamouris, M.; Synneta, A. Passive Solar Architecture. Compr. Renew. Energy 2014, 3, 637–665. [Google Scholar]
- Liu, J.; Zang, H.; Zhang, F.; Cheng, L.; Ding, T.; Wei, Z.; Sun, G. A hybrid meteorological data simulation framework based on time-series generative adversarial network for global daily solar radiation estimation. Renew. Energy 2023, 219, 119374. [Google Scholar] [CrossRef]
- Freitas, S.; Catita, C.; Redweik, P.; Brito, M. Modelling solar potential in the urban environment: State-of-the-art review. Renew. Sustain. Energy Rev. 2015, 41, 915–931. [Google Scholar] [CrossRef]
- Desthieux, G.; Carneiro, C.; Susini, A.; Abdennadher, N.; Boulmier, A.; Dubois, A.; Camponovo, R.; Beni, D.; Bach, M.; Leverington, P. Solar cadaster of Geneva: A decision support system for sustainable energy management. In From Science to Society: New Trends in Environmental Informatics; Otjacques, B., Hitzelberger, P., Naumann, S., Wohlgemuth, V., Eds.; Springer: Cham, Switzerland, 2018. [Google Scholar]
- Badarnah, L. From Follows Environment, Biomimetic approaches to building envelope design for environmental adaptation. Buildings 2017, 7, 40. [Google Scholar] [CrossRef]
- Desthieux, G.; Carneiro, C.; Camponovo, R.; Ineichen, P.; Morello, E.; Boulmier, A.; Abdennadher, N.; Dervey, S.; Ellert, C. Solar Energy Potential Assessment on Rooftops and Façades in Large Built Environments Based on LiDAR Data, Image Processing, and Cloud Computing. Methodological Background, Application, and Validation in Geneva (Solar Cadaster). Front. Built Environ. 2018, 4, 14. [Google Scholar] [CrossRef]
- Saretta, E.; Bonomo, P.; Frontini, F. Active BIPV Glass Façades: Current Trends of Innovation. In Proceedings of the Glass Performance Days 2017, Tampere, Finland, 28–30 June 2017. [Google Scholar]
- Institute of Geophysics University of Warsaw. Available online: https://www.igf.fuw.edu.pl/~kmark/stacja/weather_map.php (accessed on 20 December 2024).
- ECMWF—European Centre for Medium-Range Weather Forecasts. Available online: https://www.ecmwf.int/ (accessed on 20 December 2024).
- Mueller, R.; Behrendt, T.; Hammer, A.; Kemper, A. A new algorithm for the satellite-based retrieval of solar surface irradiance in spectral bands. Remote. Sens. 2012, 4, 622–647. [Google Scholar] [CrossRef]
- Hofierka, J. Direct solar radiation modelling within an open GIS environment. In Proceedings of the Joint European GI Conference 1997, Vienna, Austria, 16–18 April 1997; pp. 575–584. [Google Scholar]
- European Commission Science Hub PVGIS. Available online: https://re.jrc.ec.europa.eu/pvg_tools/ (accessed on 20 December 2024).
- Mueller, R.; Matsoukas, C.; Gratzki, A.; Behr, H.; Hollmann, R. The CM-SAF operational scheme for the satellite based retrieval of solar surface irradiance—A LUT based eigenvector hybrid approach. Remote. Sens. Environ. 2009, 113, 1012–1024. [Google Scholar] [CrossRef]
- Súri, M.; Dunlop, E.D.; Jones, A.R. GIS-based inventory of the potential photovoltaic output in Central and Eastern Europe. In Proceedings of the Photovoltaic in Europe: From PV Technology to Energy Solutions Conference and Exhibition, Rome, Italy, 7–11 October 2002. [Google Scholar]
- Bollmeyer, C.; Keller, J.D.; Ohlwein, C.; Wahl, S.; Crewell, S.; Friederichs, P.; Hense, A.; Keune, J.; Kneifel, S.; Pscheidt, I.; et al. Towards a high-resolution regional reanalysis for the European CORDEX domain. Quart. J. Roy. Meteor. Soc. 2014, 141, 1–15. [Google Scholar] [CrossRef]
- WRMC-BSRN—Word Radiation Monitoring Center- Baseline Surface Radiation Network. Available online: https://bsrn.awi.de/ (accessed on 20 December 2024).
- SAT23.COM—The Meteo Company. Available online: https://www.meteoradar.co.uk/en-gb/subscribe (accessed on 10 May 2025).
- GRASS GIS 8 Programmer’s Manual, GRASS Development Team. GRASS GIS 2025. Available online: http://grass.itc.it/ (accessed on 5 May 2025).
- Lovelace, R.; Nowosad, J.; Muenchow, J. Geocomputation with R, 2nd ed; Chapman and Hall/CRC: New York, NY, USA, 2025. [Google Scholar] [CrossRef]
- Buchalova, D.; Hofierka, J.; Supinsky, J.; Kanuk, J. Estimating Subcanopy Solar Radiation Using Point Clouds and GIS-Based Solar Radiation Models. Remote Sens. 2025, 17, 328. [Google Scholar] [CrossRef]
- European Commission Science Hub PVGIS. Available online: https://joint-research-centre.ec.europa.eu/photovoltaic-geographical-information-system-pvgis/getting-started-pvgis/pvgis-data-sources-calculation-methods_en (accessed on 10 May 2025).
- Valiyappurakkal, V.K.; Shabarise, Y.; Natawadkar, K.; Misra, K. A methodology to assess the constructibility of free-form buildings using building and surface performance indicators: Application to a case study. Energy Build. 2022, 270, 112303. [Google Scholar] [CrossRef]
- Perez, R.R.; Seals, P.; Ineichen, P.; Steward, R.; Menicucci, D. New Simplified Version of the Perez Diffuse Irradiance Model for Tilted Surfaces. Sol. Energy 1987, 39, 221. [Google Scholar] [CrossRef]
- Klein, S.A. Calculation of Monthly Average Insolation on Tilted Surfaces. In Proceedings of the Joint conference of the American Section of the International Solar Energy Society and The Solar Energy Society of Canada, Inc., Winnipeg, MB, Canada, 15 August 1976. [Google Scholar]
- Hottel, H.C. A Simple Model for Estimating the Transmittance of Direct Solar Radiation Through Clear Atmospheres. Sol. Energy 1976, 18, 129. [Google Scholar] [CrossRef]
- Liu, B.Y.H.; Jordan, R.C. The interrelationship and Characteristic Distribution of Direct, Diffuse and Total Solar Radiation. Sol. Energy 1960, 4, 1. [Google Scholar] [CrossRef]
- Bocca, A.; Bergamasco, L.; Fasano, M.; Bottaccioli, L.; Chiavazzo, E.; Macii, A.; Asinari, P. Multiple-Regression Method for Fast Estimation of Solar Irradiation and Photovoltaic Energy Potentials over Europe and Africa. Energies 2018, 11, 3477. [Google Scholar] [CrossRef]
- Müller, R.; Pfeifroth, U. Remote sensing of solar surface radiation—a reflection of concepts, applications and input data based on experience with the effective cloud albedo. Atmos. Meas. Tech. 2022, 15, 1537–1561. [Google Scholar] [CrossRef]
- Qadeer, A.; Parvez, M.; Khan, O.; Jafri, H.Z.; Lal, S. Optimization of solar radiation on tilted surface in isotropic and anisotropic atmospheric conditions. Next Res. 2024, 1, 100075. [Google Scholar] [CrossRef]
- Bushra, N. Parametric design of urban forms and building-integrated two-stage solar concentrators (TSSCs) to assess solar potential, daylight, and energy balance in various climates. Appl. Energy 2025, 377, 124413. [Google Scholar] [CrossRef]
- Tim, L.; Sievers, E.; Pargmann, M.; Quinto, D.; Hoffschmidt, B. End-to-end sensitivity analysis of a hybrid heliostat calibration process involving artificial neural networks. Sol. Energy 2025, 287, 113219. [Google Scholar] [CrossRef]
- Tian, J.; Ooka, R. Prediction of building-scale solar energy potential in urban environment based on parametric modelling and machine learning algorithms. Sustain. Cities Soc. 2025, 119, 106057. [Google Scholar] [CrossRef]
- Abramczyk, J. Parametric building forms rationalizing the incident direct solar irradiation. Build. Environ. 2022, 215, 108963. [Google Scholar] [CrossRef]
- Xu, K.; Song, S.; Xiang, C. Parametric design for combined solar facades for high-rise residential buildings. Sustain. Energy Technol. Assess. 2025, 74, 104167. [Google Scholar] [CrossRef]
- Płoszaj-Mazurek, M.; Ryńska, E.; Grochulska-Salak, M. Methods to optimize carbon footprint of buildings in regenerative architectural design with the use of machine learning, convolutional neural network, and parametric design. Energies 2020, 13, 5289. [Google Scholar] [CrossRef]
- Wang, S.S.; Yi, Y.K.; Liu, N.X. Multi-objective optimization (MOO) for high-rise residential buildings’ layout centered on daylight, visual, and outdoor thermal metrics in China. Build. Environ. 2021, 205, 108263. [Google Scholar] [CrossRef]
- Sharif, S.A.; Hammad, A. Developing surrogate ANN for selecting near-optimal building energy renovation methods considering energy consumption, LCC and LCA. J. Build. Eng. 2019, 25, 100790. [Google Scholar] [CrossRef]
- Mosbeh, R.; Kaloop, K.; Ahmad, F.; Samui, P.; Elbeltagi, E.; Hu, J.-W.; Wefki, H. Predicting energy consumption of residential buildings using metaheuristic-optimized artificial neural network technique in early design stage. Build. Environ. 2025, 274, 112749. [Google Scholar] [CrossRef]
- Szul, T.; Nęcka, K.; Mathia, T.G. Neural methods comparison for prediction of heating energy based on few hundreds enhanced buildings in four season’s climate. Energies 2020, 13, 5453. [Google Scholar] [CrossRef]
- Naji, S.; Keivani, A.; Shamshirband, S.; Alengaram, U.J.; Jumaat, M.Z.; Mansor, Z.; Lee, M. Estimating building energy consumption using extreme learning machine method. Energy 2016, 97, 506–516. [Google Scholar] [CrossRef]
- Higgins, S.; Stathopoulos, T. Application of artificial intelligence to urban wind energy. Build. Environ. 2021, 197, 107848. [Google Scholar] [CrossRef]
- Moayedi, H.; Mosavi, A. Double-target based neural networks in predicting energy consumption in residential buildings. Energies 2021, 14, 1331. [Google Scholar] [CrossRef]
- Bushra, N. A comprehensive analysis of parametric design approaches for solar integration with buildings: A literature review. Renew. Sustain. Energy Rev. 2022, 168, 112849. [Google Scholar] [CrossRef]
- Ekici, B.; Kazanasmaz, Z.T.; Turrin, M.; Tasgetiren, M.F.; Sariyildiz, I.S. Multi-zone optimisation of high-rise buildings using artificial intelligence for sustainable metropolises. Part 1: Background, methodology, setup, and machine learning results. Sol. Energy 2021, 224, 373–389. [Google Scholar] [CrossRef]
- Yi, H.; Kim, Y. Self-shaping building skin: Comparative environmental performance investigation of shape-memory-alloy (SMA) response and artificial-intelligence (AI) kinetic control. J. Build. Eng. 2021, 35, 102113. [Google Scholar] [CrossRef]
- Xu, M.; Pan, W. Informative design exploration of tower building geometry typology and solar potential using SOM-MLPNN with generalized form-description-based parametric modelling. J. Build. Eng. 2024, 95, 110114. [Google Scholar] [CrossRef]
- Nur, W.; Roshdan, A.; Jarimi, H.; Al-Waeli, A.H.A.; Razak, T.; Ahmad, E.Z.; Syafiq, U.; Ibrahim, A.; Sopian, K. Assessment of flat, symmetric, and asymmetric CPC photovoltaic thermal air solar collectors for building façades using artificial Neural Network Modelling. J. Build. Eng. 2024, 98, 111221. [Google Scholar] [CrossRef]
- Ghenai, C.; Ahmad, F.F.; Rejeb, O.; Bettayeb, M. Artificial neural networks for power output forecasting from bifacial solar PV system with enhanced building roof surface Albedo. J. Build. Eng. 2022, 56, 104799. [Google Scholar] [CrossRef]
- Autodesk Robot. Available online: https://www.autodesk.com/products/robot-structural-analysis (accessed on 19 November 2024).
- Rhino/Grasshopper. Available online: https://www.rhino3d.pl/grasshopper (accessed on 19 November 2024).
- Statistica. Available online: https://www.statistica.com (accessed on 19 November 2024).


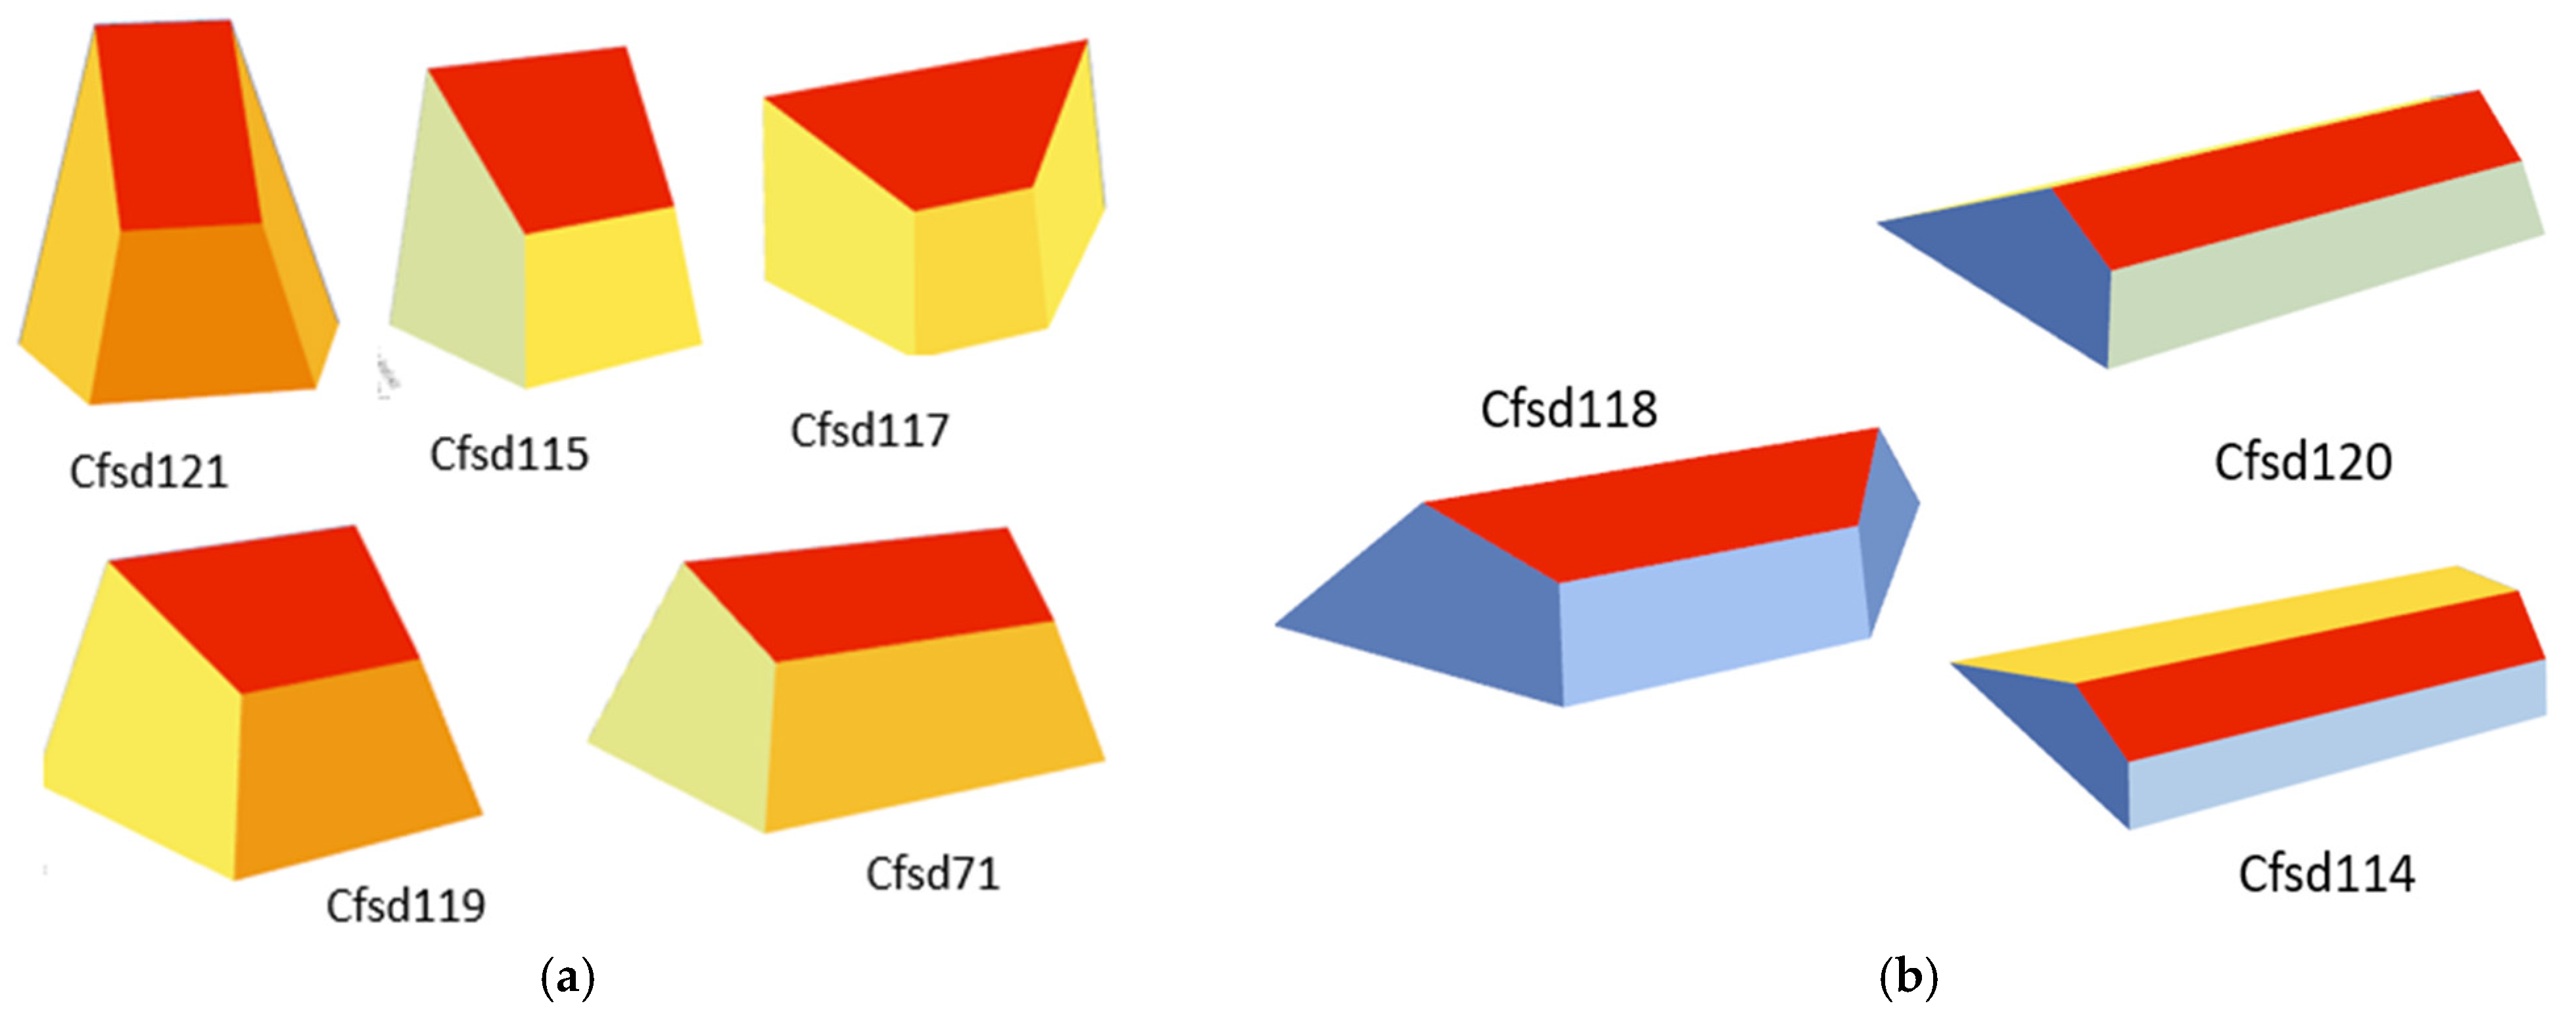
| Config./Var. | w1 | w2 | w3 | w4 | w5 | w6 | w7 | w8 | Eso,n |
|---|---|---|---|---|---|---|---|---|---|
| Cfsd114 | 0.000 | 0.000 | 0.500 | 0.500 | 0.000 | 0.000 | 0.292 | 0.697 | 1.000 |
| Cfsd115 | 0.000 | 0.000 | 0.500 | 0.500 | 1.000 | 0.000 | 0.830 | 0.090 | 0.097 |
| Cfsd116 | 0.000 | 0.000 | 0.500 | 0.500 | 1.000 | 0.000 | 0.271 | 0.697 | 0.760 |
| Cfsd117 | 0.000 | 0.000 | 0.500 | 0.500 | 0.000 | 1.000 | 0.907 | 0.242 | 0.204 |
| Cfsd118 | 0.000 | 0.000 | 0.500 | 0.500 | 0.000 | 1.000 | 0.511 | 0.697 | 0.346 |
| Cfsd119 | 0.000 | 0.000 | 0.000 | 0.000 | 0.000 | 0.000 | 0.780 | 0.191 | 0.100 |
| Cfsd120 | 0.000 | 0.000 | 0.000 | 0.000 | 0.000 | 0.000 | 0.325 | 0.697 | 0.995 |
| Cfsd121 | 0.000 | 0.000 | 0.000 | 0.000 | 1.000 | 0.000 | 0.303 | 0.697 | 0.757 |
| Cfsd122 | 0.000 | 1.000 | 0.500 | 0.500 | 0.000 | 0.000 | 0.170 | 0.697 | 0.776 |
| Cfsd66 | 0.000 | 1.000 | 0.000 | 0.000 | 0.000 | 0.000 | 0.399 | 0.320 | 0.776 |
| Cfsd71 | 0.000 | 1.000 | 0.000 | 0.000 | 0.000 | 0.000 | 0.195 | 0.697 | 0.143 |
| Cfsd72 | 0.000 | 0.000 | 0.500 | 0.500 | 0.000 | 0.000 | 0.292 | 0.697 | 0.758 |
| rc1 | rc2 | rc3 | rc4 | rc5 | rc6 | rc7 | rc8 | |
|---|---|---|---|---|---|---|---|---|
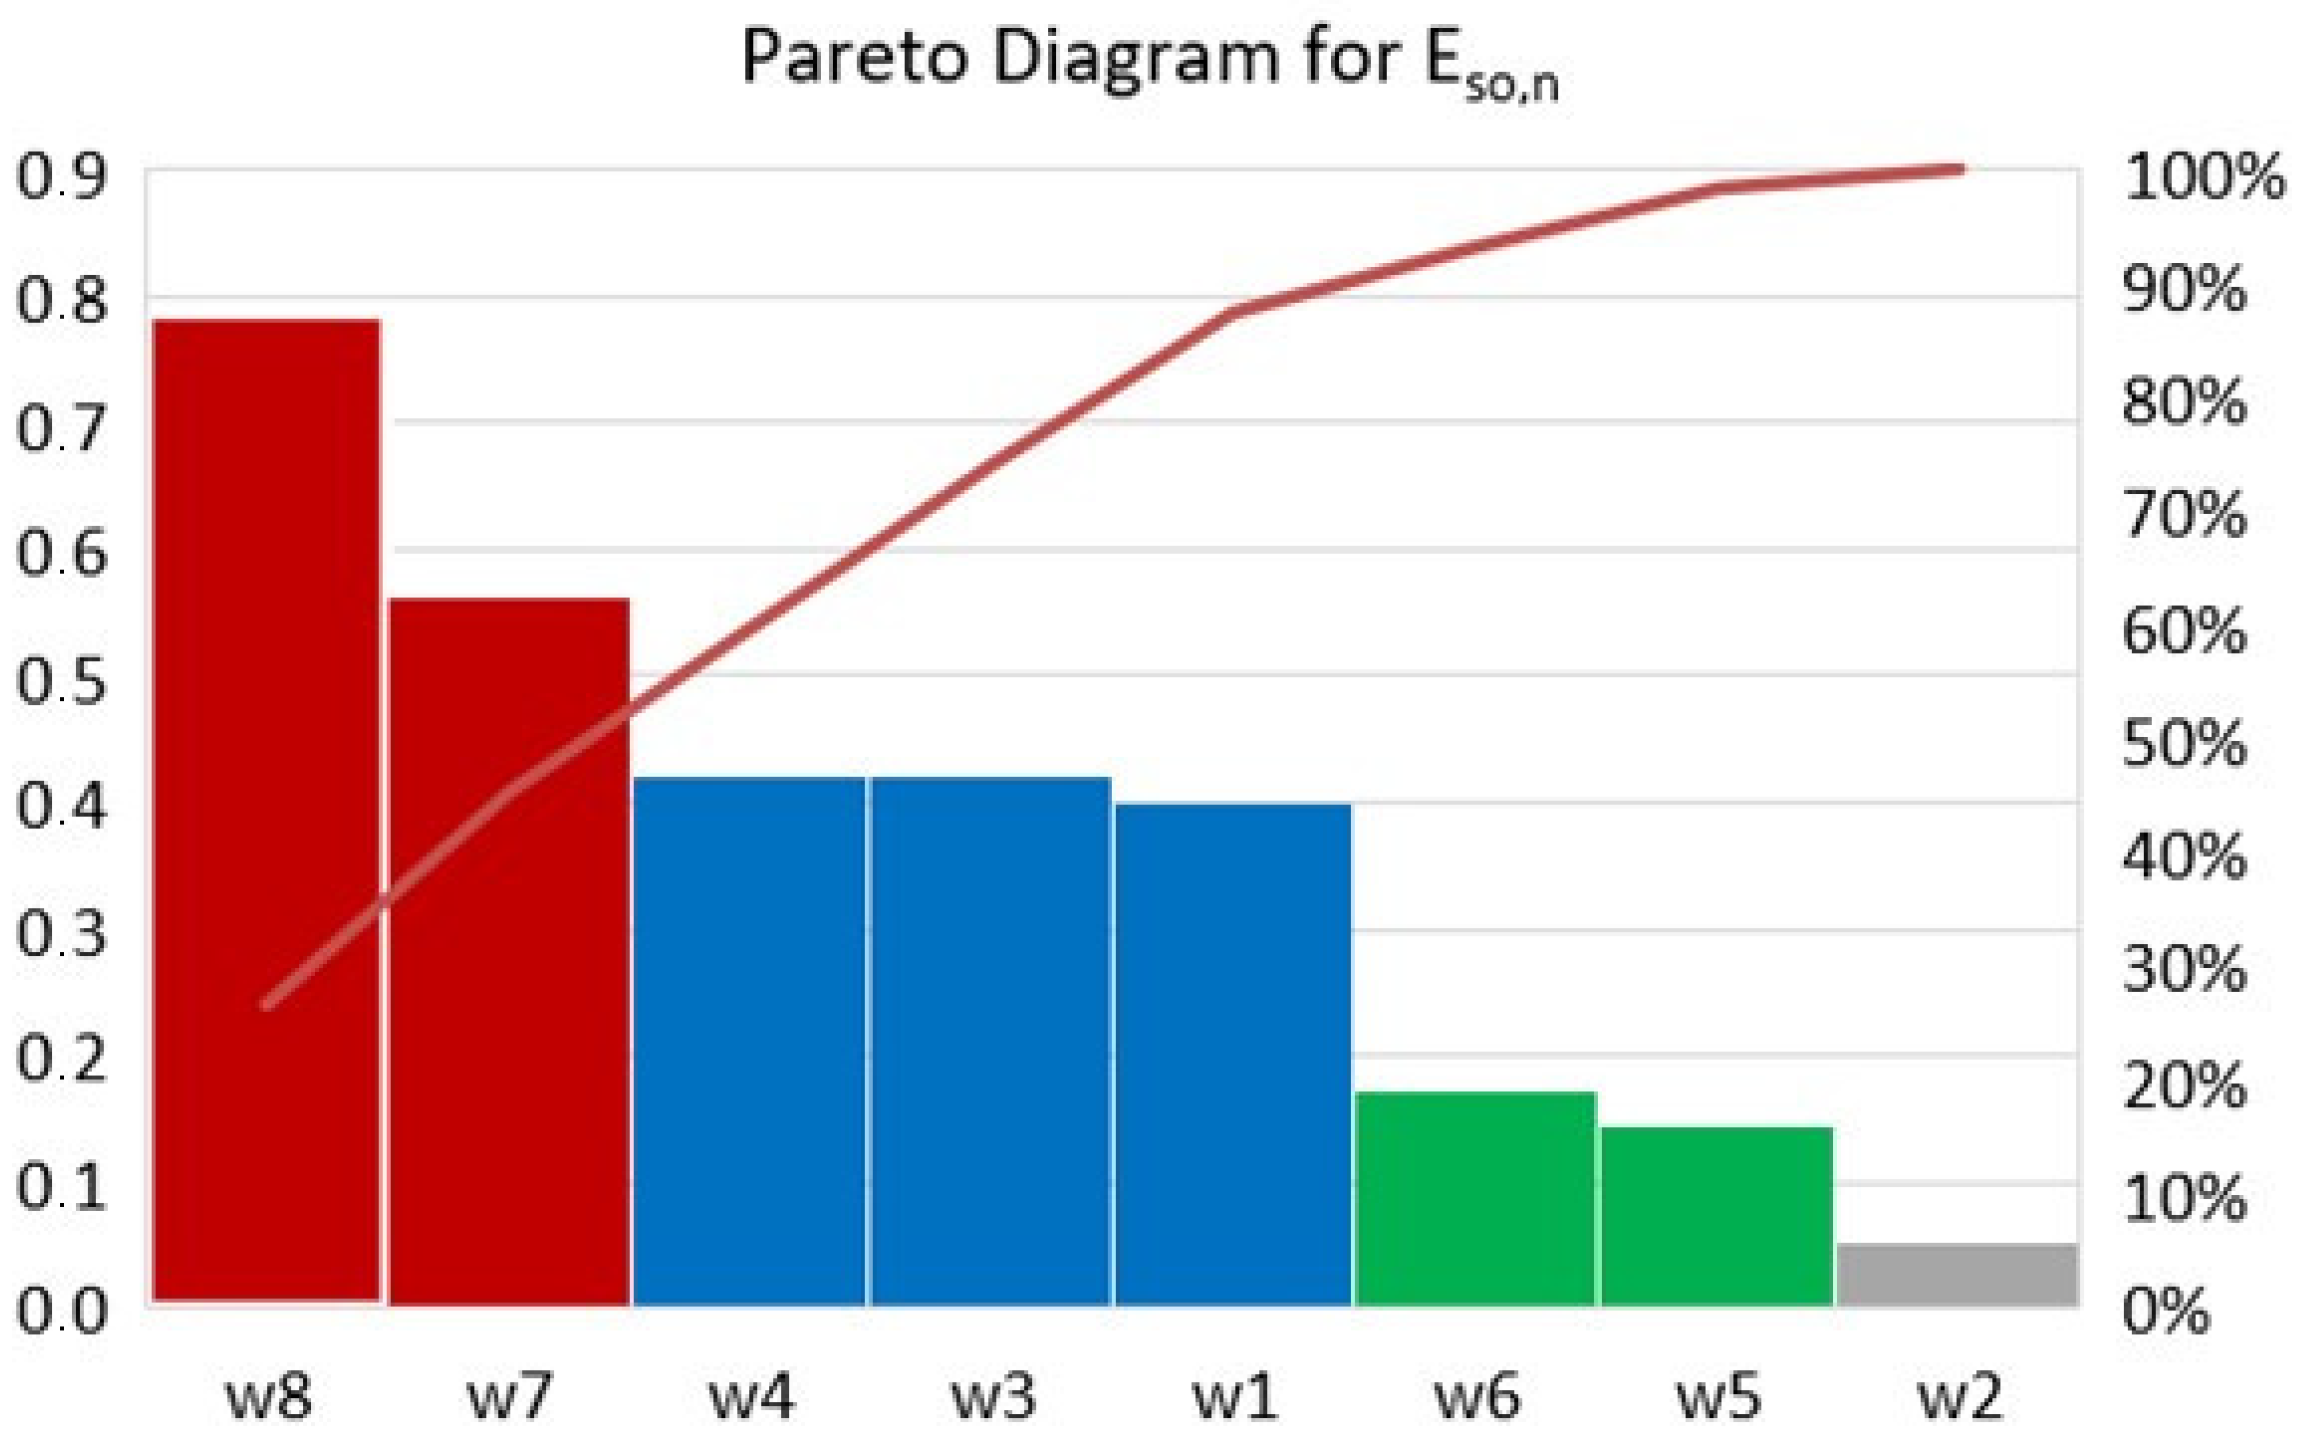
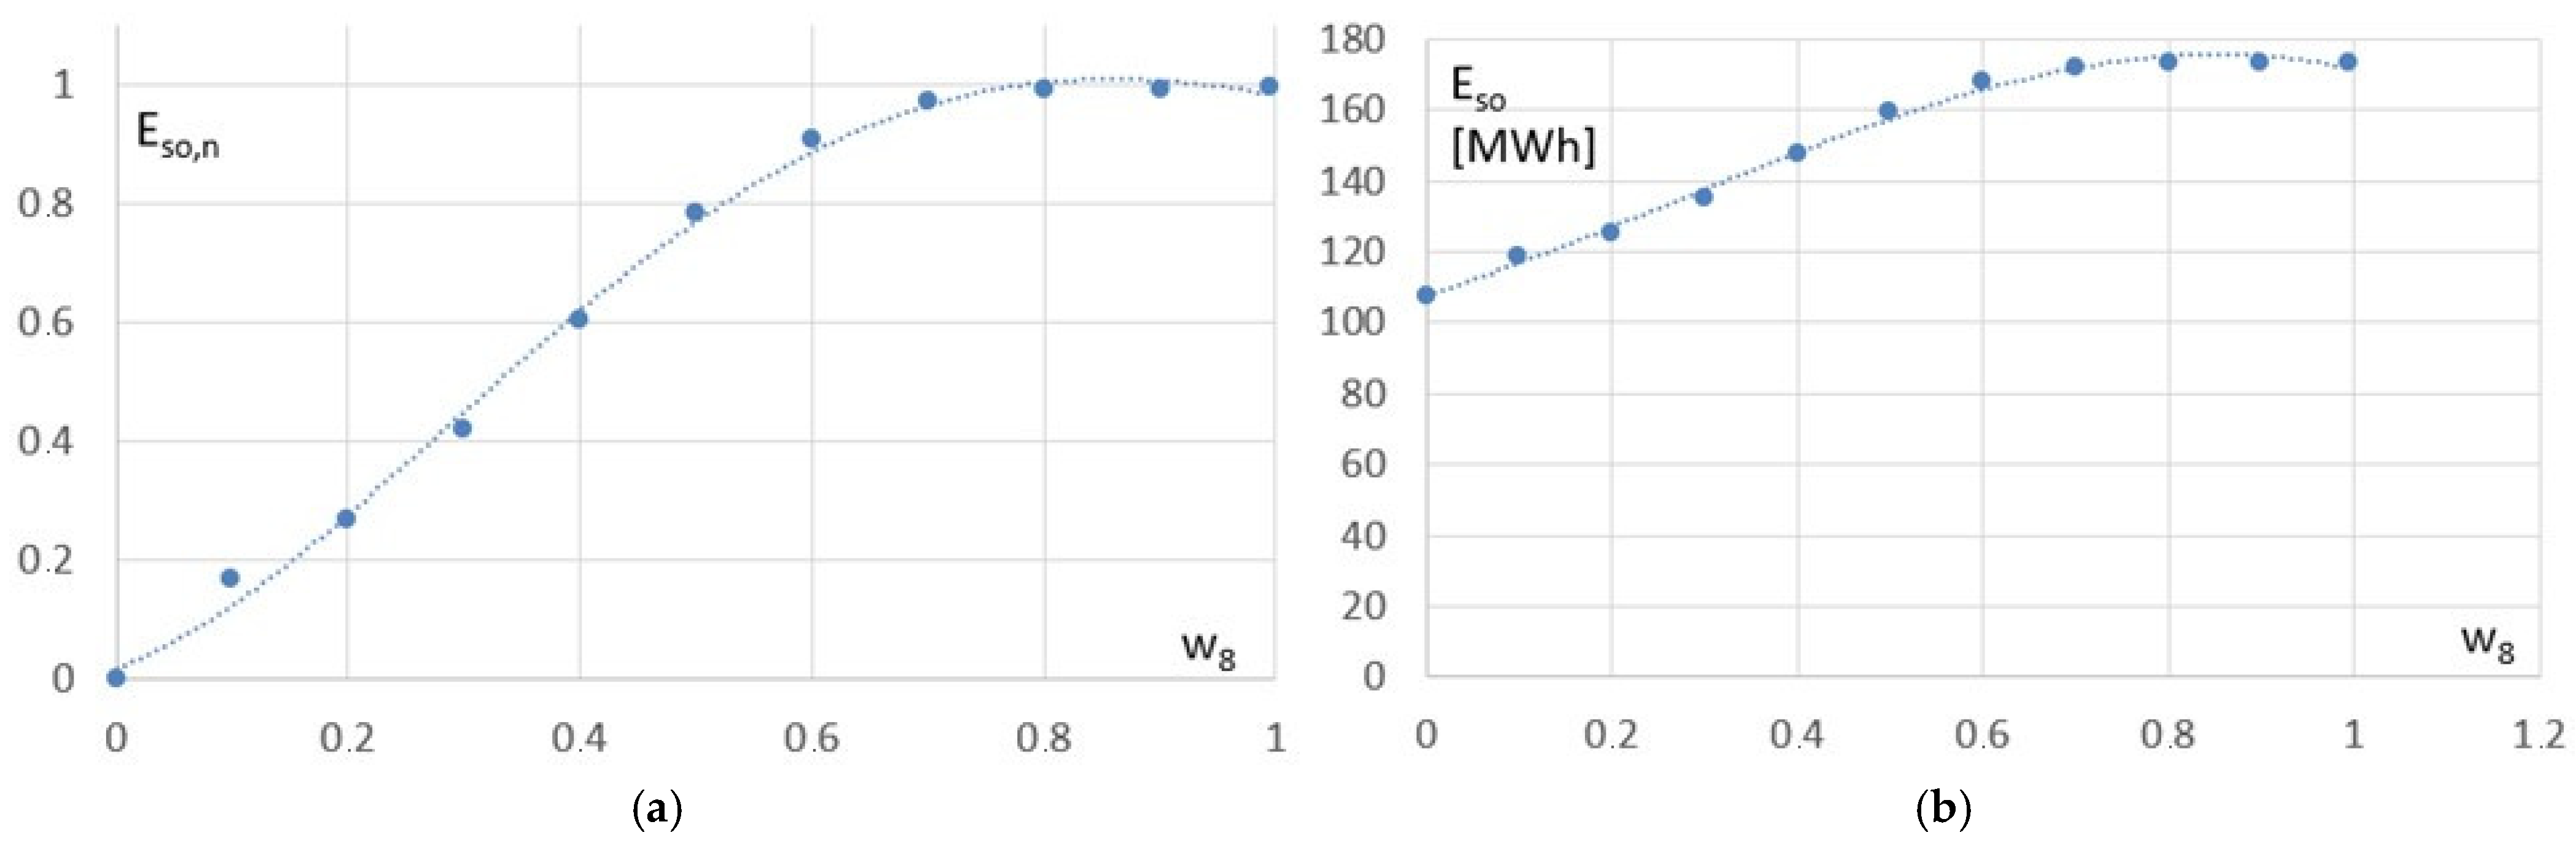
| Correlation Coefficient: rci | 0.401 | 0.051 | −0.422 | −0.422 | 0.145 | 0.171 | −0.563 | 0.789 |
| Critical Significance Level: pci | 0.000 | 0.499 | 0.000 | 0.000 | 0.052 | 0.000 | 0.000 | 0.000 |
| Var./Regr. Coeff. | B0 | w1 | w2 | w3 | w4 | w5 | w6 | w7 | w8 |
|---|---|---|---|---|---|---|---|---|---|
| Fist Segment | 0.072 | 0.157 | 0.030 | −0.040 | −0.040 | 0.059 | 0.075 | 0.011 | 0.198 |
| Second Segment | 0.440 | ||||||||
| Transition Point | 0.359 | −0.167 | −0.044 | −0.001 | −0.001 | 0.009 | −0.062 | −0.124 | 0.397 |
| Config./Var. | Eso,n | Eso,n Predictions | Residuals |
|---|---|---|---|
| Cfsd114 | 1.000 | 0.679 | 0.321 |
| Cfsd115 | 0.097 | 0.118 | −0.021 |
| Cfsd116 | 0.760 | 0.691 | 0.069 |
| Cfsd117 | 0.204 | 0.165 | 0.039 |
| Cfsd118 | 0.346 | 0.251 | 0.095 |
| Cfsd119 | 0.100 | 0.118 | −0.018 |
| Cfsd120 | 0.995 | 0.676 | 0.319 |
| Cfsd121 | 0.239 | 0.160 | 0.079 |
| Cfsd122 | 0.757 | 0.688 | 0.069 |
| Cfsd66 | 0.776 | 0.650 | 0.126 |
| Cfsd71 | 0.143 | 0.170 | −0.026 |
| Cfsd72 | 0.758 | 0.648 | 0.110 |
| Config./Var. | Eso,n | Eso,n Predictions | Residuals |
|---|---|---|---|
| Cfsd114 | 0.407 | 0.23 | 0.177 |
| Cfsd115 | 0.097 | 0.107 | −0.010 |
| Cfsd116 | 0.760 | 0.826 | −0.066 |
| Cfsd117 | 0.204 | 0.196 | 0.008 |
| Cfsd118 | 0.346 | 0.397 | 0.051 |
| Cfsd119 | 0.100 | 0.130 | −0.030 |
| Cfsd120 | 0.995 | 0.785 | 0.210 |
| Cfsd121 | 0.239 | 0.240 | −0.002 |
| Cfsd122 | 0.757 | 0.795 | −0.038 |
| Cfsd66 | 0.776 | 0.624 | 0.152 |
| Cfsd71 | 0.144 | 0.288 | −0.144 |
| Cfsd72 | 0.758 | 0.624 | 0.134 |
| MLP 8-11-1 | BFGS 125 | Learning Error | 0.00015 |
| Learning Quality | 0.995 | Testing Error | 0.00083 |
| Testing Quality | 0.977 | Validation Error | 0.00047 |
| Validation Quality | 0.991 | ||
| Hidden Activation Function | Than | Activation Function | Exponential |
| Configuration | Eso_n | Predicted Eso_n | Residuals |
| Cfsd114 | 1.000 | 0.978 | 0.022 |
| Cfsd115 | 0.097 | 0.126 | −0.029 |
| Cfsd116 | 0.760 | 0.823 | −0.063 |
| Cfsd117 | 0.204 | 0.180 | 0.024 |
| Cfsd118 | 0.346 | 0.386 | −0.040 |
| Cfsd119 | 0.100 | 0.119 | −0.019 |
| Cfsd120 | 0.995 | 0.971 | 0.024 |
| Cfsd121 | 0.239 | 0.242 | −0.003 |
| Cfsd122 | 0.757 | 0.759 | −0.002 |
| Cfsd66 | 0.776 | 0.775 | 0.001 |
| Cfsd71 | 0.144 | 0.134 | 0.010 |
| Cfsd72 | 0.758 | 0.751 | 0.007 |
Disclaimer/Publisher’s Note: The statements, opinions and data contained in all publications are solely those of the individual author(s) and contributor(s) and not of MDPI and/or the editor(s). MDPI and/or the editor(s) disclaim responsibility for any injury to people or property resulting from any ideas, methods, instructions or products referred to in the content. |
© 2025 by the authors. Licensee MDPI, Basel, Switzerland. This article is an open access article distributed under the terms and conditions of the Creative Commons Attribution (CC BY) license (https://creativecommons.org/licenses/by/4.0/).
Share and Cite
Abramczyk, J.; Bielak, W. Parametric Building Envelopes Rationalized in Terms of Their Solar Performance in a Temperate Climate. Energies 2025, 18, 2479. https://doi.org/10.3390/en18102479
Abramczyk J, Bielak W. Parametric Building Envelopes Rationalized in Terms of Their Solar Performance in a Temperate Climate. Energies. 2025; 18(10):2479. https://doi.org/10.3390/en18102479
Chicago/Turabian StyleAbramczyk, Jacek, and Wiesław Bielak. 2025. "Parametric Building Envelopes Rationalized in Terms of Their Solar Performance in a Temperate Climate" Energies 18, no. 10: 2479. https://doi.org/10.3390/en18102479
APA StyleAbramczyk, J., & Bielak, W. (2025). Parametric Building Envelopes Rationalized in Terms of Their Solar Performance in a Temperate Climate. Energies, 18(10), 2479. https://doi.org/10.3390/en18102479