1. Introduction
Energy-intensive sectors contributed approximately 25% of total CO
2 emissions in 2020 [
1]. Within this category, the cement and steel sectors are the leading non-power industrial CO
2 emitters. Coal is a primary energy resource for iron production and its derivative, coke, is also used as a reducing agent in blast furnaces. At 2.6 GtCO
2, the direct emissions from fossil fuel usage related to steel production accounts for 7 to 9% of global CO
2 emissions [
2]. To align with the overarching objective of achieving net-zero emissions, the steel sector must achieve a 90% reduction in direct emissions and related carbon intensity from 2020 levels by 2050 [
1].
The Blast Furnace-Basic Oxygen Furnace (BF-BOF) route dominates steel production, consuming ca. 70% of sector energy whilst producing 74.3% of global steel [
3]. This route is expected to still exceed 50% of steel production by 2050. The European Steel Association [
4] emphasizes CCUS in its carbon reduction strategy, aiming to decrease emissions while maintaining existing steel production methods.
The main steel off-gases are Blast Furnace Gas (BFG) (ca. 85% of total), Coke Oven Gas (COG), and Basic Oxygen Furnace Gas (BOFG). The valorisation of these gases into valuable products such as methanol and ammonia is attracting global attention [
5].
Table 1 shows composition, flow rate, thermal power, and Lower Heating Value (LHV) for each off-gas in modern steel plants. BFG is N
2-rich but has substantial amounts of CO
2 and is low in H
2. COG is H
2-rich and is used for energy within the steelworks. BOFG is CO-rich and used as BF feed gas. These gases are traditionally used for electricity generation within the plant.
The steel plant off-gases typically fuel rolling mills or combined heat and power plants [
6]. Alternatively, these gases can be decarbonised using CO
2 capture and storage or valorised into chemicals such as methanol [
8]. To valorize these gases into valuable chemicals, key components such as H
2, CO
2, and CO must first be separated from the multicomponent steelworks off-gases. Adsorption-based technologies have shown significant potential in a range of gas separation applications, including CO
2 capture applications [
9].
Research on PSA systems has primarily focused on process innovation and adsorbent Key Performance Indicators (KPIs), including product purity, recovery, parasitic energy consumption, and adsorbent productivity [
10]. However, comprehensive cost estimates are essential for technology comparison [
11]. Accurate industrial-scale PSA plant assessment requires integrating experimental and numerical approaches, with lab-scale data informing larger unit designs [
12].
The selection of the appropriate adsorbent is an important factor governing the PSA performance. Common adsorbents include activated carbons (ACs), silica gels, zeolites, and activated aluminas [
13]. All offer high CO
2 adsorption capacity and cost-effectiveness, with tailorable surface areas [
14]. Zeolites characterized by an open crystal lattice, uniform pore structures, and narrow micropore size distribution exhibit exceptional adsorption properties [
15]. Layered beds of AC, zeolites, and alumina have been studied for high-purity H
2 separation from syngas [
16,
17,
18]. AC-supported CuCl adsorbents show promise for CO separation [
17,
18], while zeolites 13X and 5A demonstrate high-purity CO
2 production capabilities [
19].
Some studies present detailed scale-up and cost methodologies for industrial adsorption-based separation. Notably, Khurana et al. [
20] developed an integrated optimization platform for determining optimal adsorbent and process conditions, including a costing framework for Vacuum Pressure Swing Adsorption (VPSA) scale-up in CO
2 capture. They also established a rigorous costing model for post-combustion capture using the VPSA process, evaluating CO
2 capture costs for four-step and six-step VPSA cycles with a metal–organic framework and zeolite 13X adsorbents. The authors also developed a scale-up design of the VPSA-based capture unit and process scheduling. Roussanaly et al. [
11] developed a comprehensive techno-economic optimization model for VPSA in an SMR-based H
2 plant. Marcinek et al. [
21] developed a pilot plant scale-up concept for a twin-bed PSA process to produce high-purity N
2, applicable to other PSA systems. Ammar et al. [
22] investigated biogas adsorption in silica gel adsorption beds at industrial scale. Their objective was to examine how specific parameters impact the adsorption efficiency on methane purity and recovery. Wilkes et al. [
23] developed and scaled up a VPSA system for CO
2 capture from a 10 MWe open-cycle gas turbine.
Gas capture using PSA presents challenges, necessitating multiple PSA columns for effective separation under industrial conditions. Thorough column scheduling and scale-up are essential for continuous gas supply. Adsorbent cost remains a significant constraint in this process.
While the PSA configurations and adsorbents employed in this study draw on established literature, this work presents a detailed performance analysis of the technical and economic feasibility of using PSA systems to recover H
2, CO, and CO
2 from steelworks off-gases on an industrial scale. It presents a comparative assessment of three tailored and validated PSA systems, each configured for a specific gas stream, with isotherm parameters adjusted to reflect actual feed compositions. It addresses the challenges of multiple PSA columns and adsorbent costs. The study applies a systematic scale-up methodology for PSA accounting for the fluid dynamics and heat transfer impacts on mass diffusion [
21] whilst considering separation cost and other relevant KPIs as key decision tools for process selection. The PSA performance in terms of cost/tonne separated is determined. Prior studies have generally addressed these streams in isolation, often without standardized costing frameworks or direct performance comparisons. The main objectives are as follows: (i) to simulate and compare PSA performance for each off-gas stream using Aspen Adsorption V14; (ii) to validate and optimize process performance where possible with published experimental data; and (iii) to perform a detailed capital and operating cost analysis to identify the most viable separation route.
2. Materials and Methods
The following outlines the methodology and assumptions employed to develop and evaluate PSA systems for gas recovery from steelworks off-gases. Three PSA units are modelled using Aspen Adsorption (V14, Bedford, MA, USA). The discussion covers modelling techniques, validation processes, and economic assessment methods, collectively demonstrating PSA’s suitability for industrial applications.
The PSA model uses material, energy, and momentum balances for dynamic simulation.
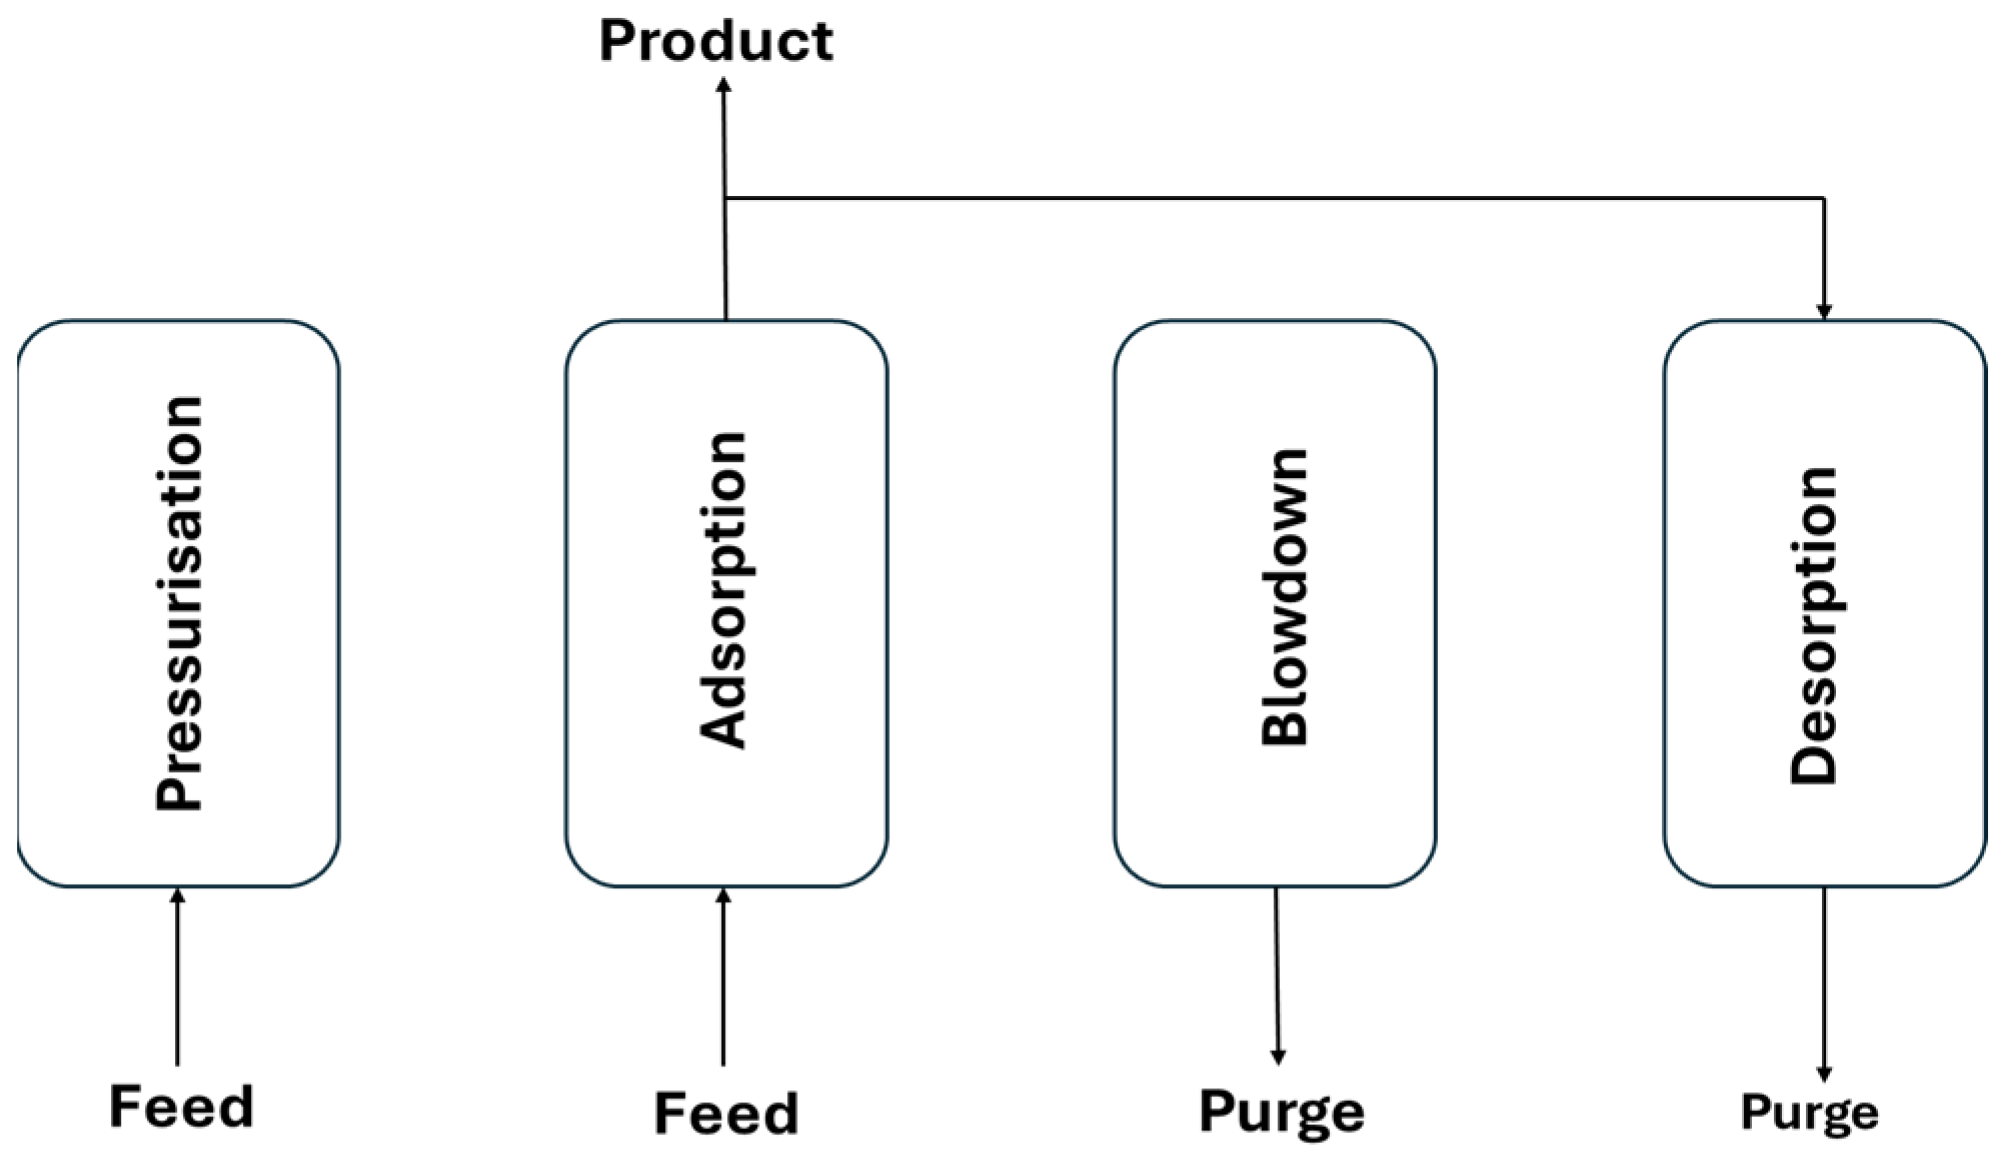
Figure 1 shows the schematic of the Skarstrom cycle [
24], a common PSA configuration, which is applied in this work. It involves two beds alternating between feed pressurisation, adsorption, counter-current blowdown, and purge steps [
25]. The Skarstrom 4-step cycle was chosen for its simplicity, widespread use, and suitability as a benchmark for comparative analysis. While more complex cycles can offer improved efficiency, they often require case-specific optimization and add operational complexity. This study focuses on establishing a consistent baseline across different steel off-gases using validated models. Future work can build on this by exploring advanced cycle configurations once baseline feasibility is established.
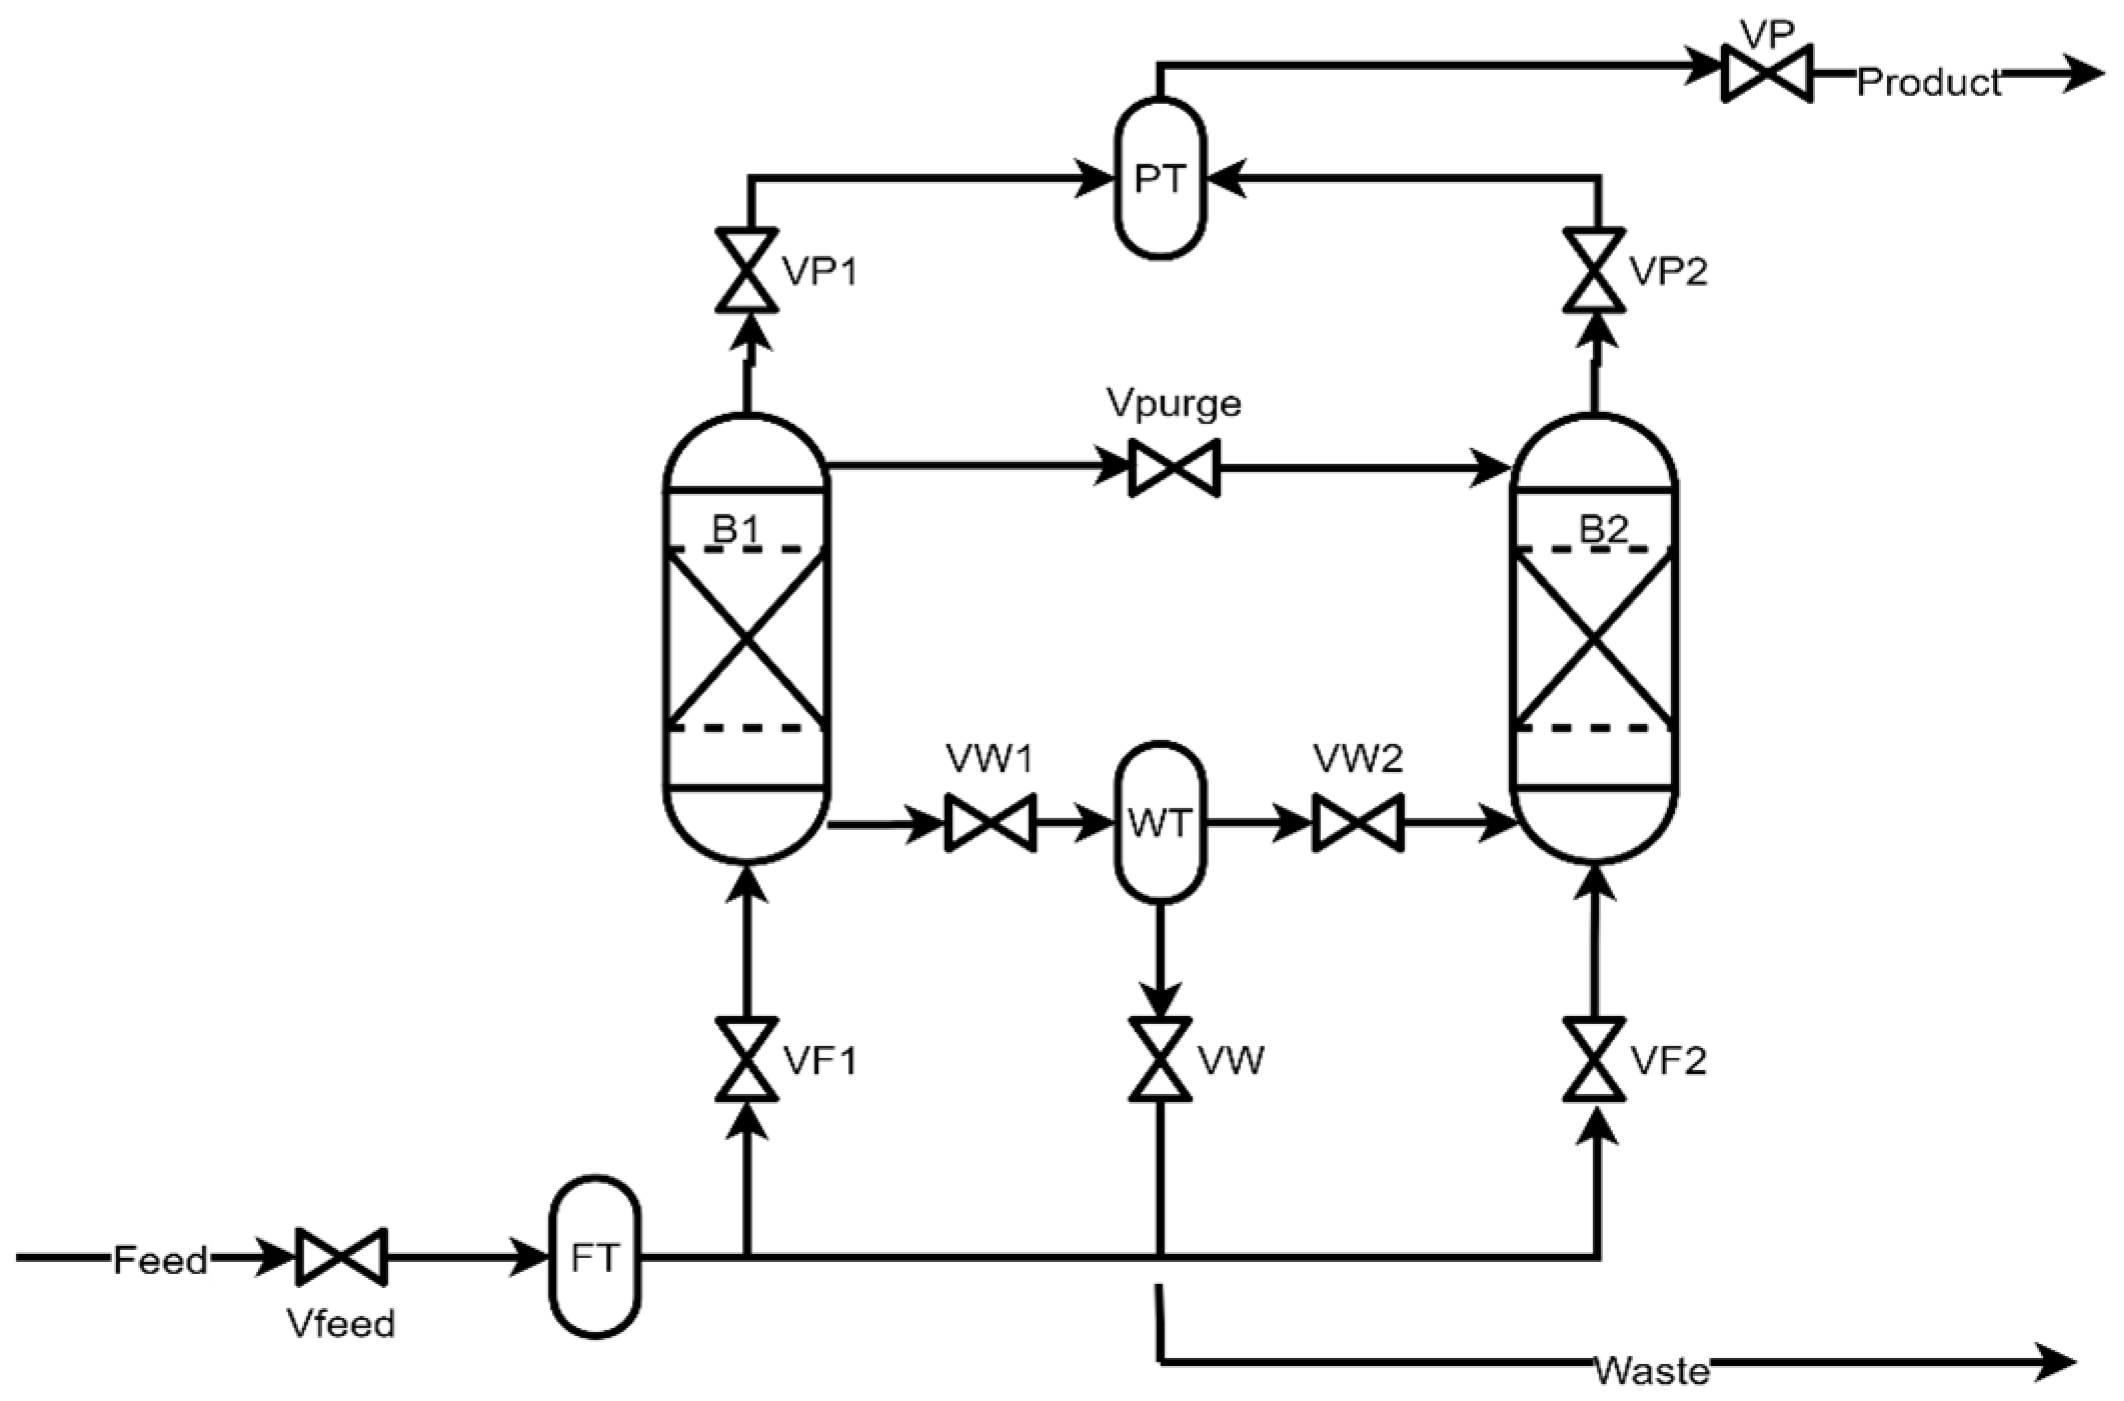
Figure 2 shows a general process flow diagram of the PSA system.
The two-bed, four-step Skarstrom PSA cycle includes [
27]:
1. Pressurise Bed 1; Blowdown Bed 2 (PR-B1; BD-B2)
2. Adsorption Bed 1; Purge Bed 2 (AD-B1; PG-B2)
3. Blowdown Bed 1; Pressurise Bed 2 (BD-B1; PR-B2)
4. Purge Bed 1; Adsorption Bed 2 (PG-B1; AD-B2)
During the cycle, high-pressure feed gas pressurises and saturates one bed, while the other undergoes depressurisation and regeneration.
Table 2 presents the cycle variation applied in this work, showing step times for the different PSA configurations.
The linear driving force model with a single lumped mass transfer parameter describes the sorption rate in adsorbent pellets. The Langmuir adsorption model quantifies adsorbent capacity by balancing relative adsorption and desorption rates at dynamic equilibrium [
28].
Aspen Adsorption V14 [
24] is used to optimize gas separation processes, employing comprehensive equations for mass, momentum, and energy balances, along with kinetic and equilibrium models.
The modelling equations considered in modelling these PSA systems are presented below (see nomenclature list for definition of symbols):
The following main assumptions are made in developing a full dynamic model of PSA system:
- i.
The axial dispersion plug flow model as proposed by Wakao et al [
29] can be used to describe the flow pattern in the bed;
- ii.
The solid and gas phases reach thermal equilibrium instantly;
- iii.
Radial concentration and temperature gradients in the adsorption bed are negligible;
- iv.
Axial conduction in the wall can be ignored.
2.1. Adsorbent Selection
The adsorbents selected for each PSA system were based on their proven industrial applicability, compatibility with the targeted gas separations, and support from published performance data. For H
2 recovery from COG, a layered bed consisting of a layer of AC and of zeolite 5A was employed due to their low affinity for H
2 and strong interaction with heavier hydrocarbons, facilitating effective H
2 purification [
30,
31]. Zeolite 13X was used in the CO
2 separation unit for BFG, owing to its high CO
2 uptake capacity, selectivity under relevant operating conditions, and widespread commercial use [
32,
33]. For CO recovery from BOFG, CuCl-impregnated activated carbon (AC-CuCl) was used, leveraging its chemisorptive interaction with CO via π-complexation, which offers significantly improved selectivity over CO
2 and N
2 [
34,
35]. These materials have been widely evaluated in PSA contexts and are supported by reliable isotherm and kinetic data. In this study, certain isotherm parameters were further refined using linear regression to better represent the composition of real steel industry off-gases, enhancing simulation accuracy. Overall, the chosen adsorbents reflect a balance between separation efficiency, model reliability, and practical suitability for industrial deployment.
2.2. Process Scale-Up and Sizing
The column Length-to-Diameter (L/D) ratio is a critical parameter for scaling up PSA systems, though a detailed rationale for its appropriate value is scarce. The total column length, L, comprises two parts; the active adsorbent bed length and the unused length, which together must achieve the required capture/separation efficiency without solute waste generation. On the other hand, the column diameter, D, is primarily governed by feed flow rate and cycle duration. The mass transfer zone’s development strongly correlates with bed length, where longer beds can reduce the transfer zone fraction but may increase pressure drops and evacuation times. Therefore, selecting appropriate L/D ratios requires balancing mass transfer efficiency with operational constraints to achieve optimal system performance.
For vertical PSA columns, reported L/D ratios for effective separation vary, with Ammar et al. [
22] proposing values between 5 and 7, while Subraveti et al. [
11] and Khurana et al. [
20] recommend lower ratios of between 3 and 4.25. For scale-up purposes, the present study uses a fixed L/D ratio of 4, more in line with Khurana et al.’s [
20] recommendation given their more rigorous assessment. Typical superficial velocities for PSA columns range from 0.15 to 0.45 m/s [
22]. Using the maximum superficial velocity of 0.45 m/s and the given gas volumetric flow rates, the column’s cross-sectional area and subsequently the diameter are computed. From the selected L/D ratio, the corresponding length of the adsorption column is then determined.
The procedure adopted for calculating the required amount of adsorbent for a commercial plant follows that outlined in the ASCOA-3 bench-scale test facility with the capacity to recover 3tCO
2/d from JFE Steel’s West Japan Works in Fukuyama [
36].
It is also important to use the feed flow rate of each train, not the aggregate flow of the entire PSA system. This is because, the scale-up process presupposes a constant ratio of feed gas flowrate to adsorbent volume in the adsorption column, as verified by bench-scale studies in Aspen Adsorption. Utilizing this ratio and the large-scale feed flow rate, the requisite quantity of adsorbent for all trains is calculated. For H2 PSA systems featuring two adsorbent layers, this ratio is determined individually for each layer.
Based on the selected L/D, the feed flow rate and the required adsorbent amount, the breakthrough curves for each PSA column are determined. Subsequently, L and D values of the adsorption columns are adjusted according to the specific point along the axial bed where the bed breaks through. Details of the calculation and assumptions are presented in the
Supplementary Materials.
2.3. PSA System Configuration and Column Scheduling
In this work, the procedure proposed by Khurana et al. [
20] is adopted to determine the number of columns required for efficient gas processing where each PSA train contains the minimum number of columns and vacuum pumps required for continual operation. It involves columns operating out of phase where their scheduling is governed by the following factors:
The feed is continuous and constant throughout the cycle;
The blowdown and evacuation effluents are maintained separately, thus separate blowdown and vacuum pumps are required;
For a step where the product provides the feed for another step, both operations take place in two columns simultaneously. This is required to avoid storing.
After the blowdown/evacuation process, the pump is used to repeat the operation in another column in the train.
Based on the above factors, the number of columns (
N) can be determined using the following ceiling function:
where
ti and
tADS are the active step duration, and the adsorption step duration in the cycle, respectively.
Further details on the process scale-up and scheduling such as determining the number of pumps, the idle step duration, and the required compression ratio [
37] are provided in the
Supplementary Materials.
2.4. Process Costing
The economic analysis was carried out using a detailed bottom-up methodology beyond the built-in costing module of Aspen Adsorption. Equipment-level costs, utilities, and maintenance were derived using correlations from existing literature. While this work does not compare PSA against other separation technologies, such as cryogenic or membrane options, future work will expand to include such benchmarks. The cost index method, which accounts for inflation by comparing present and past costs given by the following expression is employed [
38]:
where
Ct and
C0 are the estimated current costs at time,
t, and at reference time,
t0, respectively. On the other hand,
It and
I0 are the index values at time,
t, and at reference time,
t0, respectively. The costing approach applied to PSA technologies includes generating estimates for both Capital (CapEx) and Operational Expenditure (OpEx). All estimated costs produced by Aspen were in USD (
$) according to 2023 prices, in this study reported in GBP (£) at a conversion rate of £1 =
$1.25. Older cost estimates are updated to 2024 using the Chemical Engineering Plant Cost Index [
39] to account for inflation. The cost analysis takes account of adsorbent costs, cycle duration, compression costs, operating pressure, heat, labour, and electricity costs. Direct equipment and utility costs are calculated using Aspen Plus cost analyzer V14, which employs the ICARUS™ model [
38]. The Total Capital Requirement (TCR) is determined by combining Total Direct Costs (TDCs), process contingencies, indirect expenditures, project contingencies, owner costs, and interest during construction. Specific percentages are applied for each category, such as 15% of TDC for process contingency and 14% of Total Direct Cost Plus Contingency (TDCPC) for indirect expenditures [
39]. Additionally, the interest incurred during construction is calculated based on the assumption that the construction costs are distributed over three years, adhering to a 40/30/30 percentage spread. The corresponding detailed breakdown of these capital cost estimates is presented in
Section 3.5 and the
Supplementary Materials.
Blowdown and vacuum pump costs are calculated using regressed equations from literature [
11,
40], with provisions for parallel arrangements when necessary.
Table 3 presents the preliminary economic parameters for the PSA systems and pertaining assumptions were made in this work.
OpEx includes fixed and variable operational costs. Fixed costs comprise annual maintenance (2.5% of TPC, with 40% for labour), insurance and taxes (2% of TPC) [
38], labour costs (five operators at £52,000/year, plus 50% for benefits), and administrative expenses (30% of operation and maintenance labour costs). Variable costs include utilities such as electricity and cooling water, calculated from Aspen analyzer V14 results, based on PSA simulation consumption estimates [
11]. Adsorbent replacement costs are significant, with a conservative 5-year replacement period assumed for all adsorbents [
11]. The TDC of adsorbent in each column, including purchase, transport, and installation, is amortised over this period to determine annual replacement costs. Feedstock prices for COG, BFG, and BOFG are calculated based on their LHV [
43], using natural gas’s 2016 market price and LHV as a reference.
2.5. PSA Process Modelling and Simulation
The bench-scale bed and adsorbent conditions used as input for the PSA/VPSA performance assessment using Aspen Adsorption are presented in
Table 4.
The isotherm data used in this study were obtained from previously published experimental literature (Yang et al. [
44], Gao et al. [
17] and Brea et al. [
45]). Where feed compositions differed, isotherm parameters were adjusted using linear regression to match simulated feed conditions. Validation of model performance was performed by comparing with published breakthrough curves where available. The COG-H
2 and BFG-CO
2 PSA models were validated against published breakthrough data, with results shown. For the BOFG-CO unit, no direct experimental data were available, but the model uses established isotherms and kinetics from literature. While this introduces some uncertainty, it remains suitable for comparative analysis.
Adsorption isotherm data were fitted to Langmuir isotherm systems in Aspen. Experimental isotherms from the literature were linearly regressed and adjusted to fit the simulation data input format.
2.5.1. H2 Separation from COG
For H
2 separation from COG, the adsorption bed design followed Yang et al. [
44], using a two-layered bed with AC and zeolite 5A to achieve high-purity H
2 from syngas at high pressure. The PSA process is simulated in a pressure-driven mode with fixed feed and bed pressures, while the feed temperature is set at 298.15 K. The Extended Langmuir-3 model is used, which was adopted from previous works by Ahn et al. [
46] with the corresponding component parameters provided in
Table 5.
2.5.2. CO Separation from BOFG
For CO separation from BOFG, the CO adsorption bed configuration and isotherm parameters, including VPSA bed data adopted in the present work were based on the detailed experimental work by Gao et al. [
17], where a single-layer bed was used to produce high-purity CO with desorption operated under vacuum pressure conditions. The bed adsorption was configured to match the Gao et al. [
17] feed gas specification and conditions. Breakthrough validation was not performed due to a lack of experimental data. The isotherm type used, along with the parameters utilised, are presented in
Table 6.
2.5.3. CO2 Separation from BFG
For CO
2 separation from BFG, the CO
2 adsorption bed configuration and isotherm parameters are based on previous works by Brea et al. [
45] and Park et al. [
47], where in both studies, a single layer bed using zeolite 13X was used to produce high-purity CO
2. In the present work, the VPSA is configured to operate under vacuum pressure conditions up to 1 bar. The bed data are obtained from literature [
30,
31]. The adsorbent isotherm model type used was Langmuir-3, with the corresponding parameters presented in
Table 7.
3. Results
This section presents the results of breakthrough validation results using experimental data. The analysis examines how operating conditions, including temperature and adsorption and desorption pressure, affect the average and overall purity of the product gas.
System scale-up, sizing, and scheduling were obtained by varying a single control parameter such as bed temperature, adsorption, and desorption pressures at a time while keeping the remaining parameters constant. The cost of separation was then estimated for the scaled-up systems. Results are organized by the PSA type, followed by overall scale-up, sizing, and cost evaluation.
3.1. H2 from COG
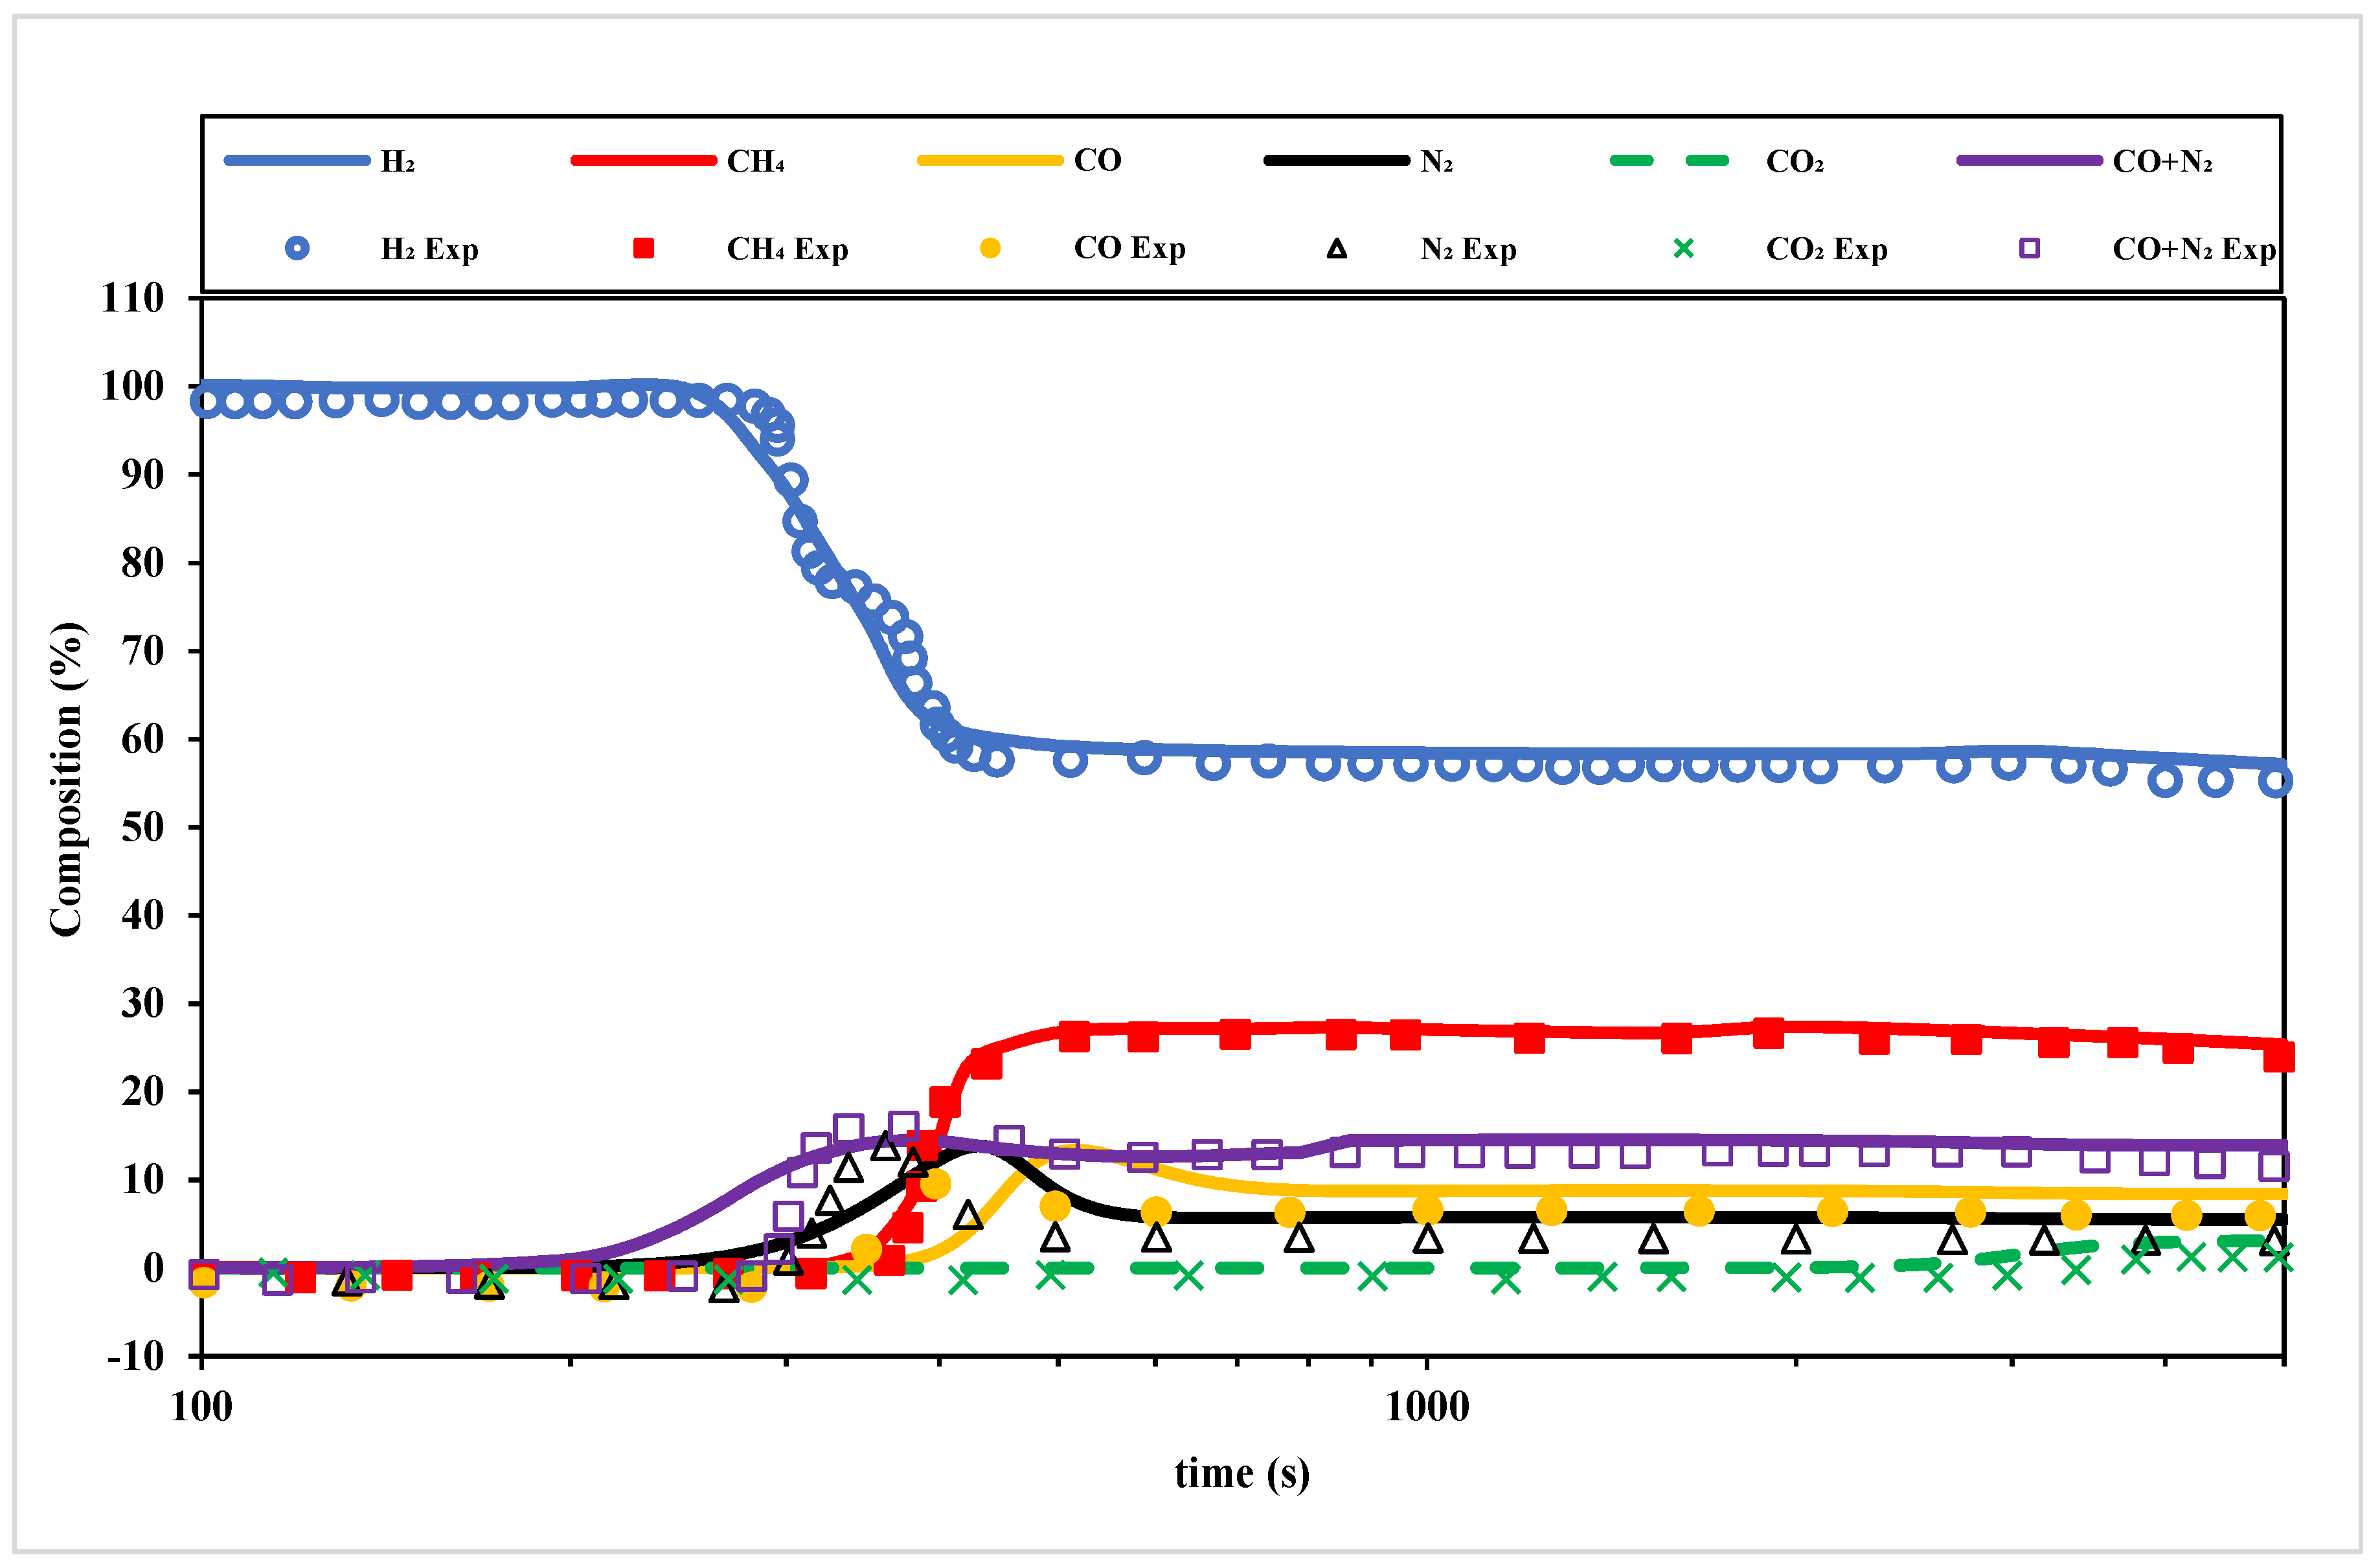
Figure 3 shows a comparison of the simulated and experimental breakthrough curves for an H
2 from COG PSA bed with 0.65 m of AC and 0.35 m of zeolite 5A at 10 atm and 8.6 L/min feed rate over 1200 s. The experimental breakthrough curves showing the dynamic composition profiles over time for multiple gas components—H
2, CH
4, CO, N
2, and CO
2—were obtained from Yang et al. [
44]. As it may be observed, there is a good accord between the Aspen simulated and experimental data. The H
2 curve exhibits an early breakthrough (ca. 400 s), indicating its weak adsorption affinity compared to the other heavier components such as CH
4, which shows delayed breakthroughs due to stronger adsorption. CO
2 demonstrates the strongest adsorption, with its breakthrough occurring much later (ca. 4200 s).
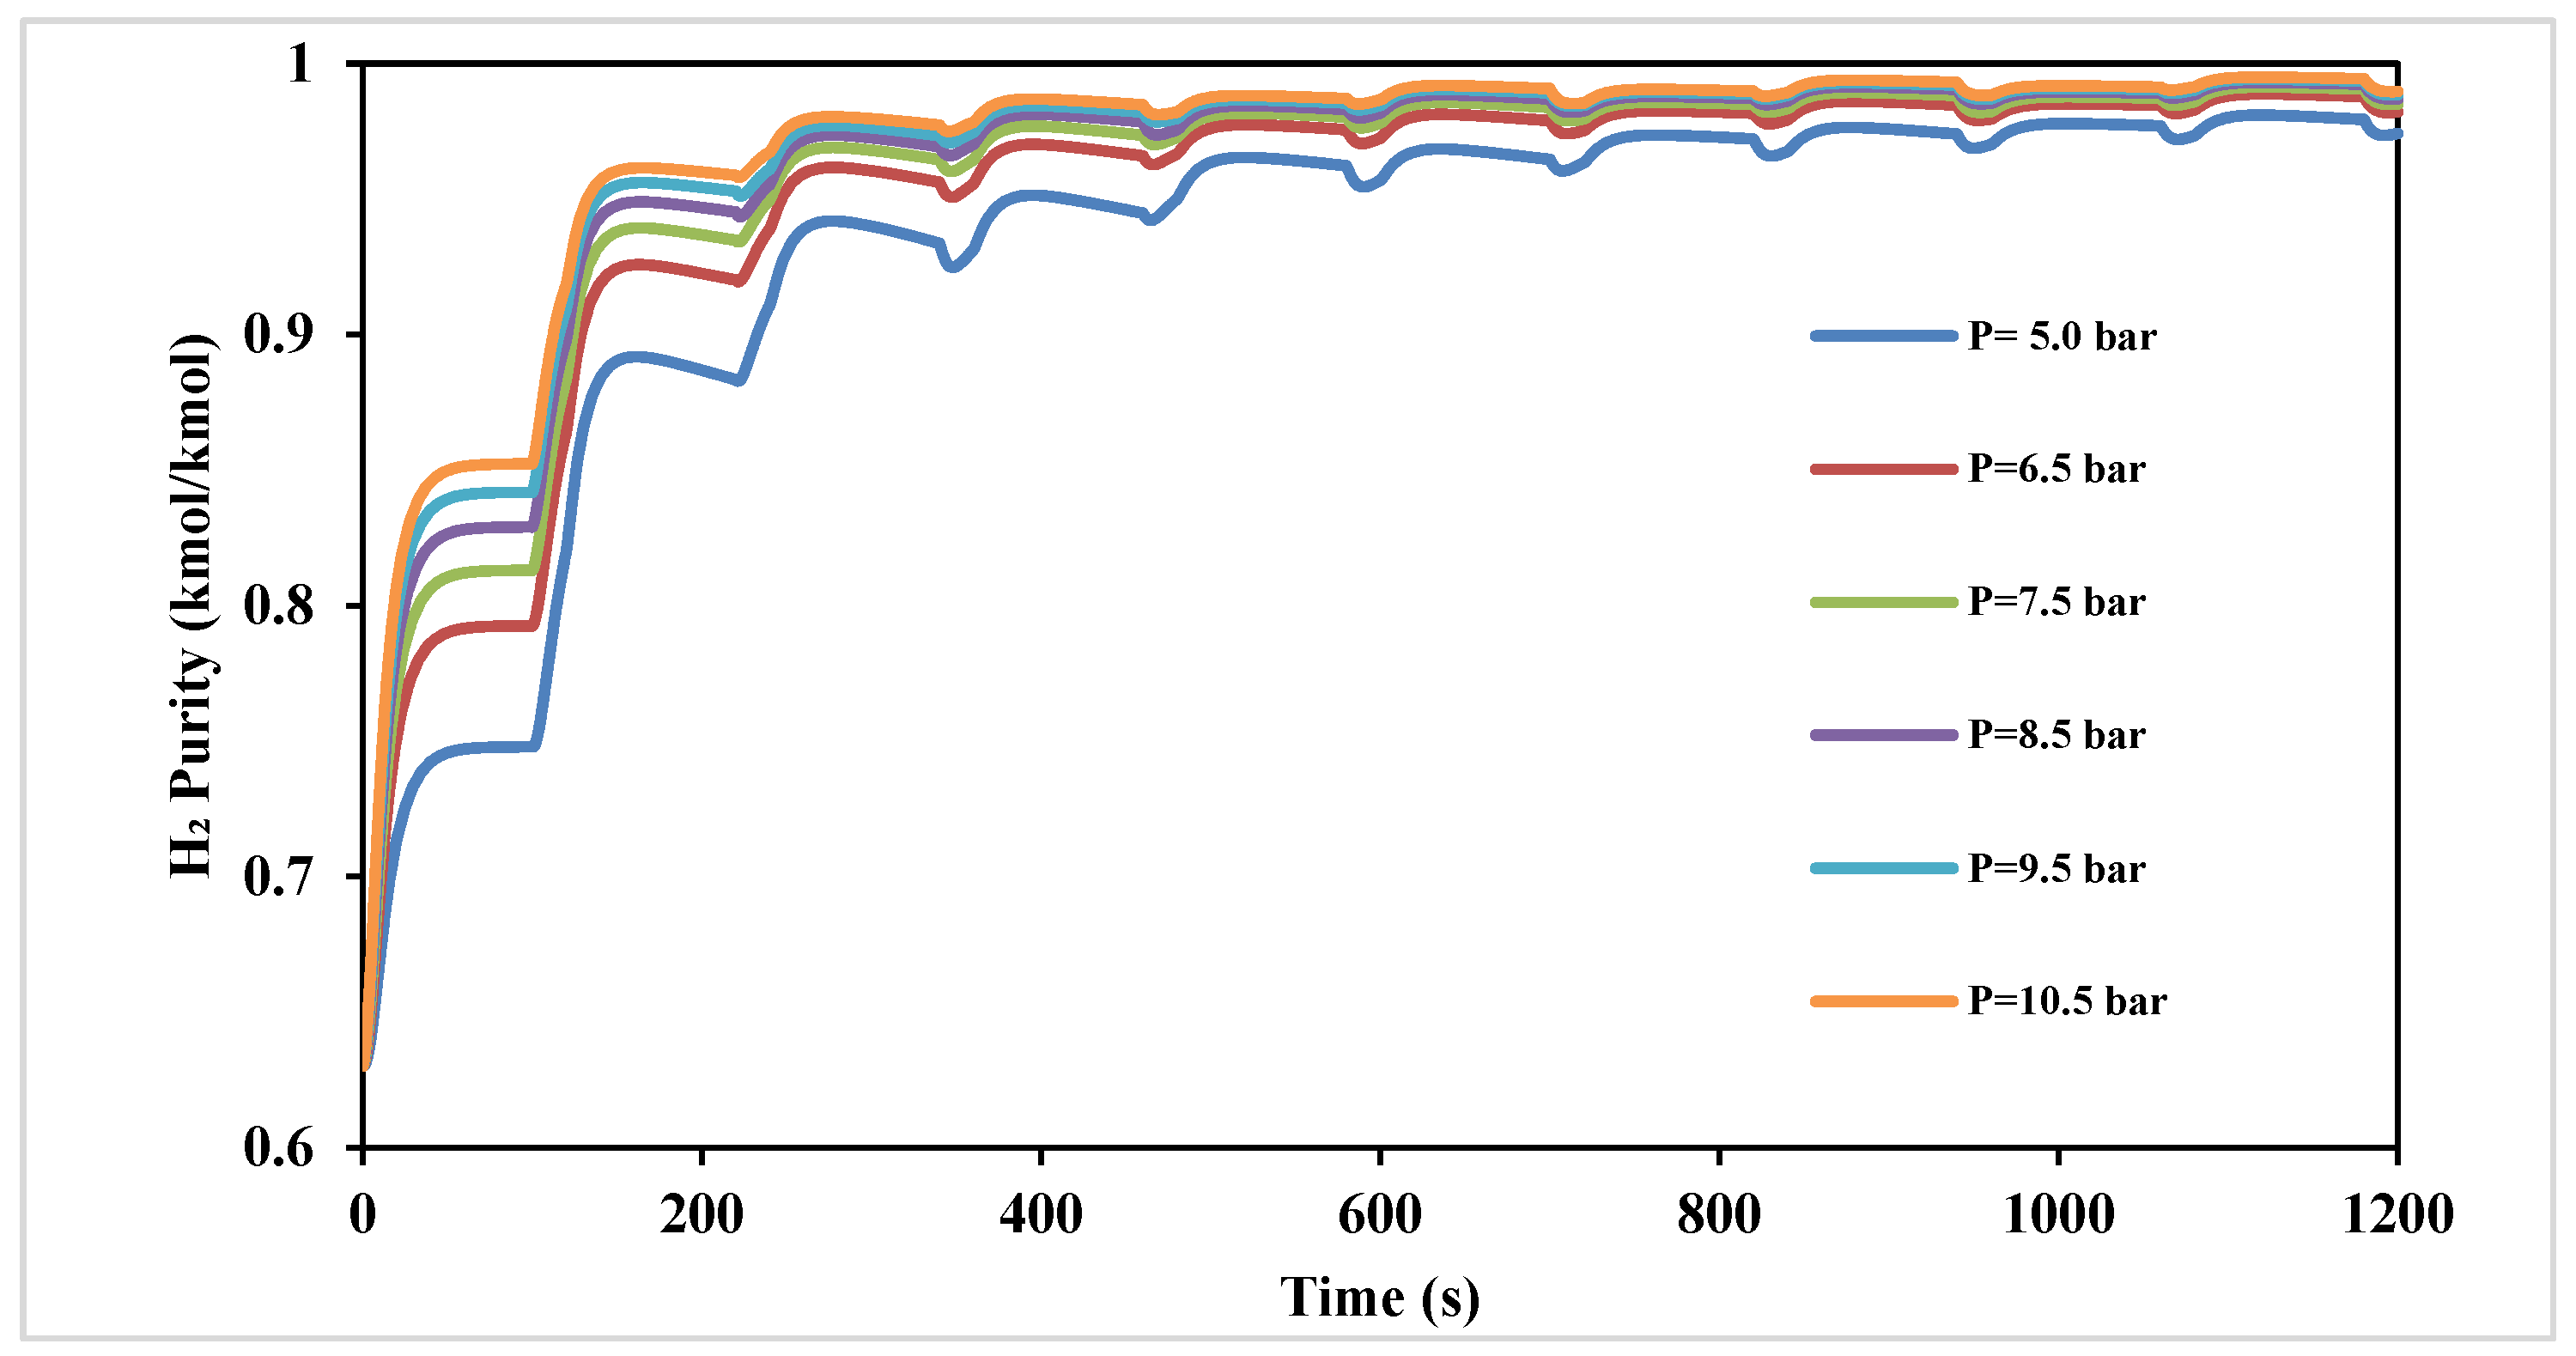
Figure 4 shows the effect of varying the adsorption pressure in the range of 5.0 to 10.5 bar on the H
2 product purity over 1200 s. The data show that in the first two cycles (480 s), a relatively significant increase in H
2 concentration may be observed with an increase in pressure. Following this time interval, the impact of pressure becomes less pronounced, reaching a marginal 0.2% increase in H
2 purity at 1200 s, thus not justifying any further increase in pressure to improve performance.
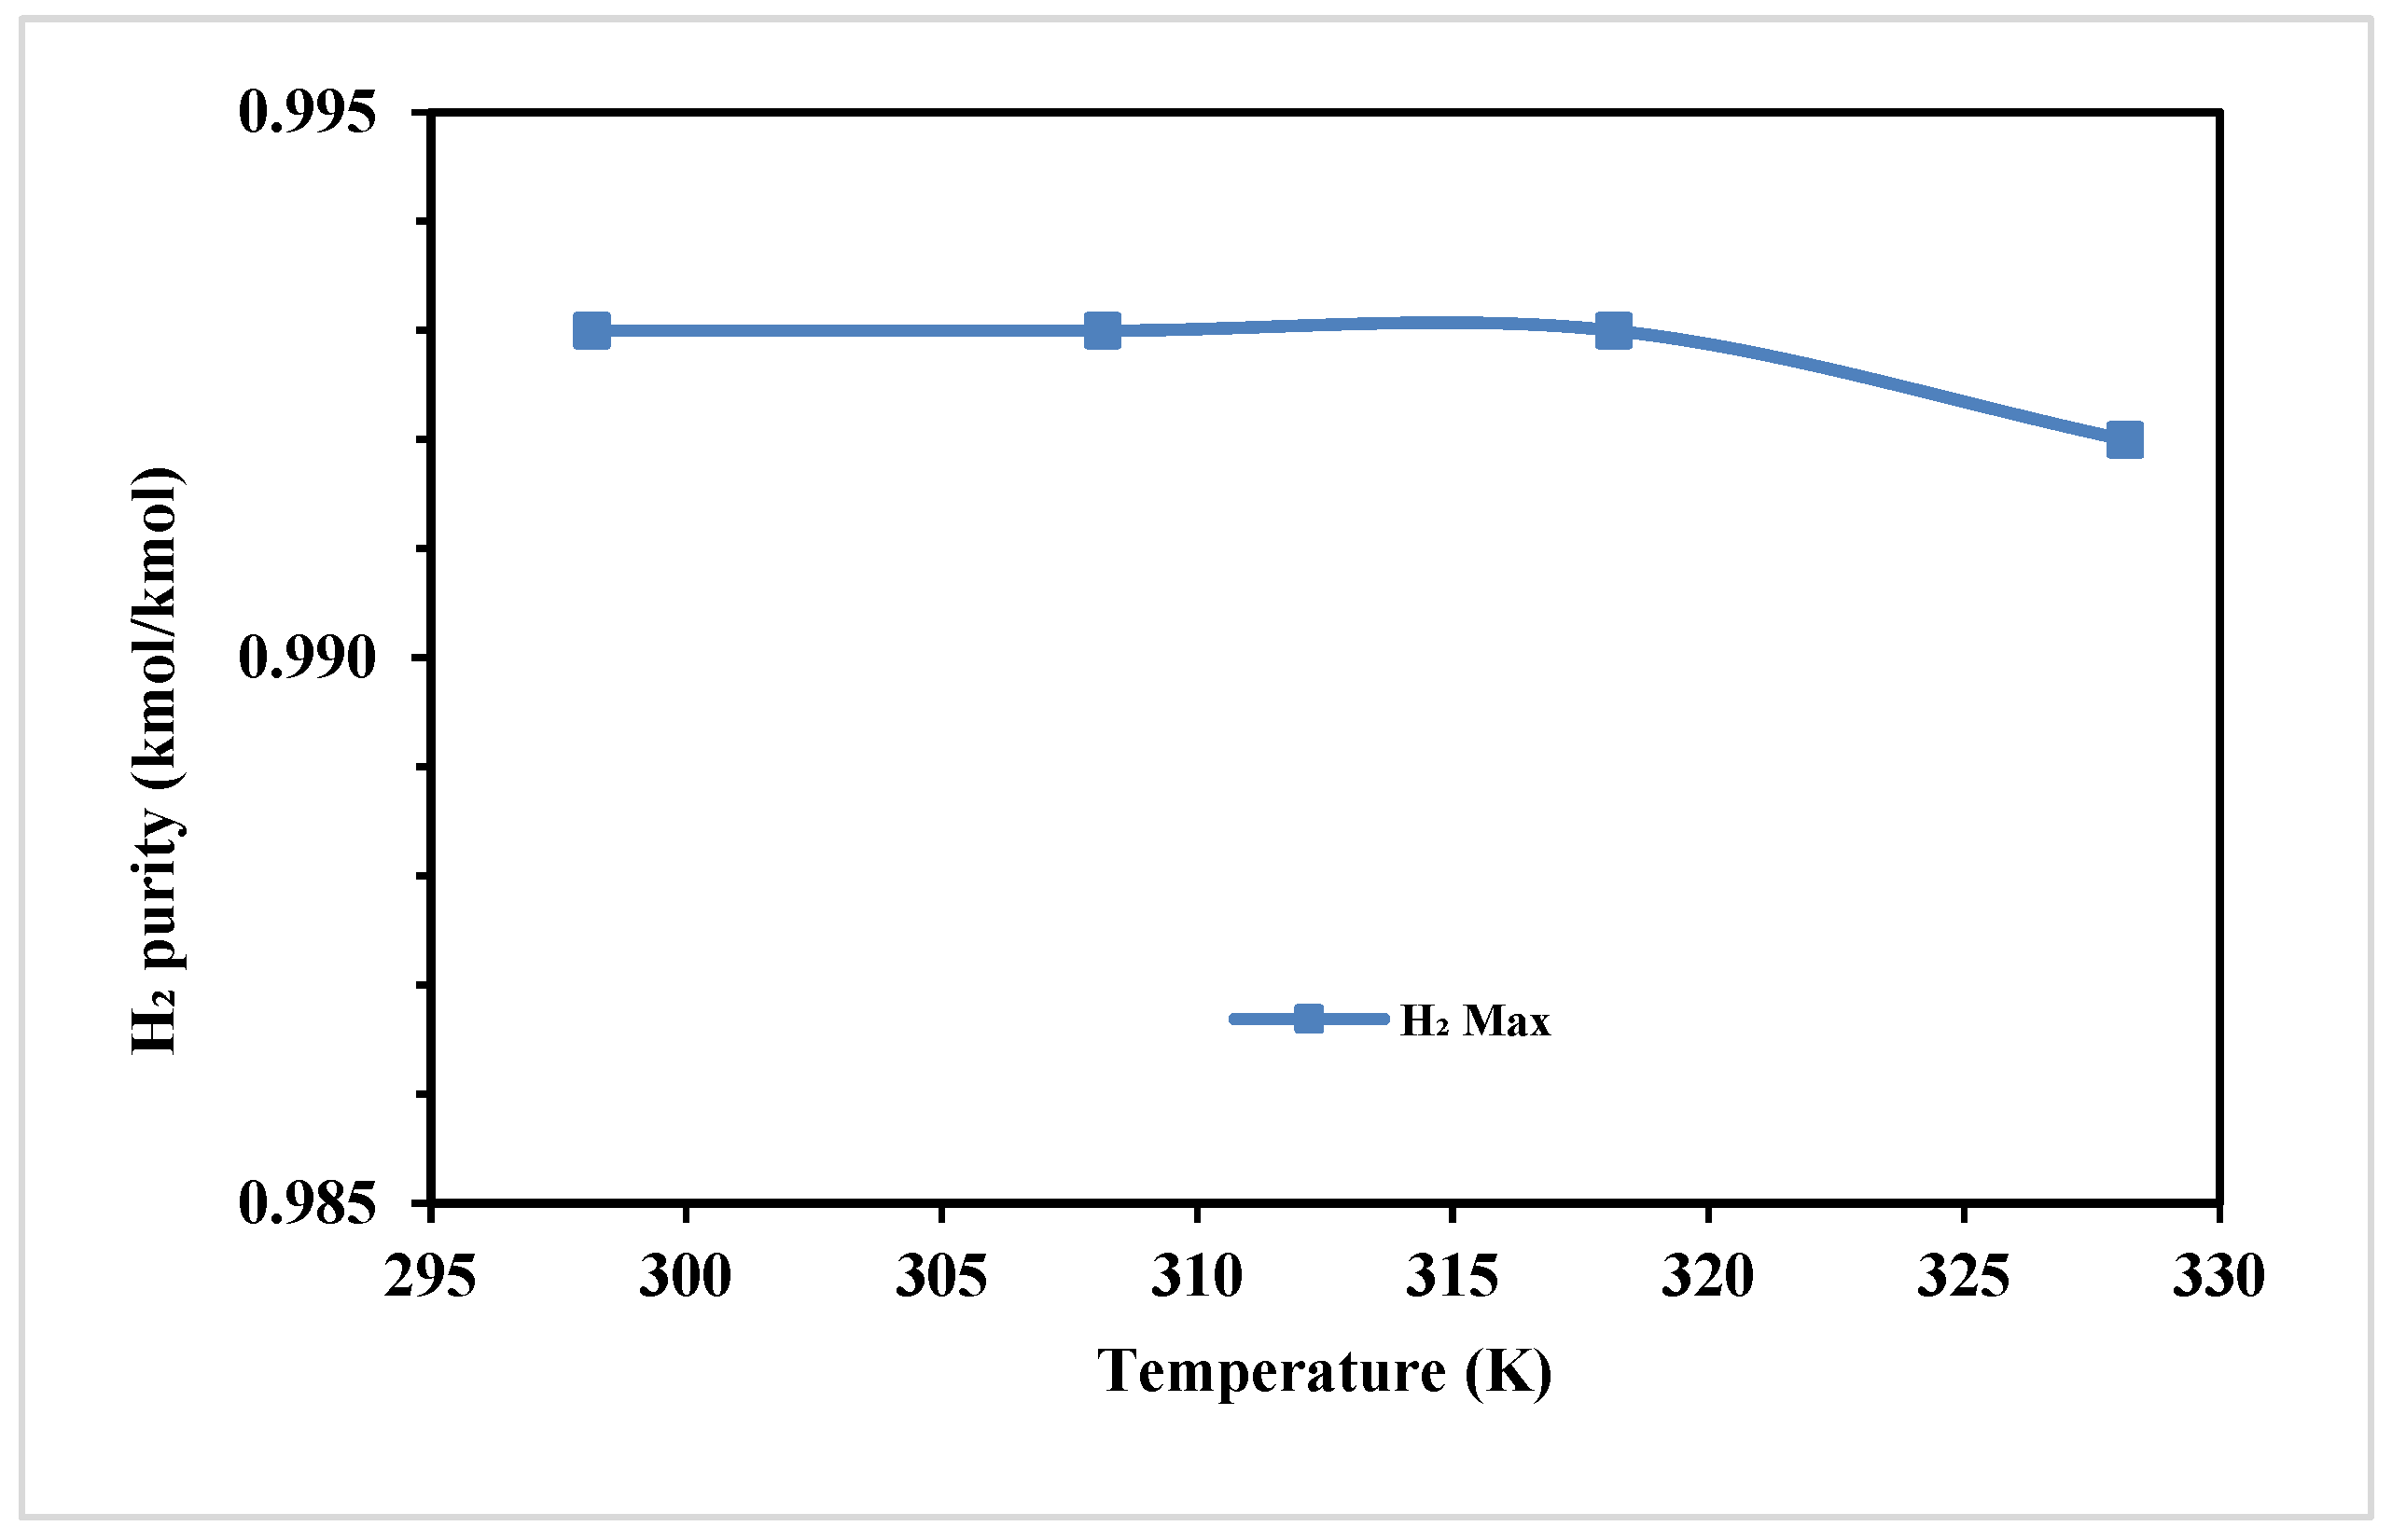
Figure 5 shows the corresponding effect of feed temperature on the H
2 purity. As the temperature varies from 295 K to 330 K, the H
2 purity remains consistent between 295 K and about 320 K. However, a noticeable decrease in purity is observed when temperatures exceed 320 K.
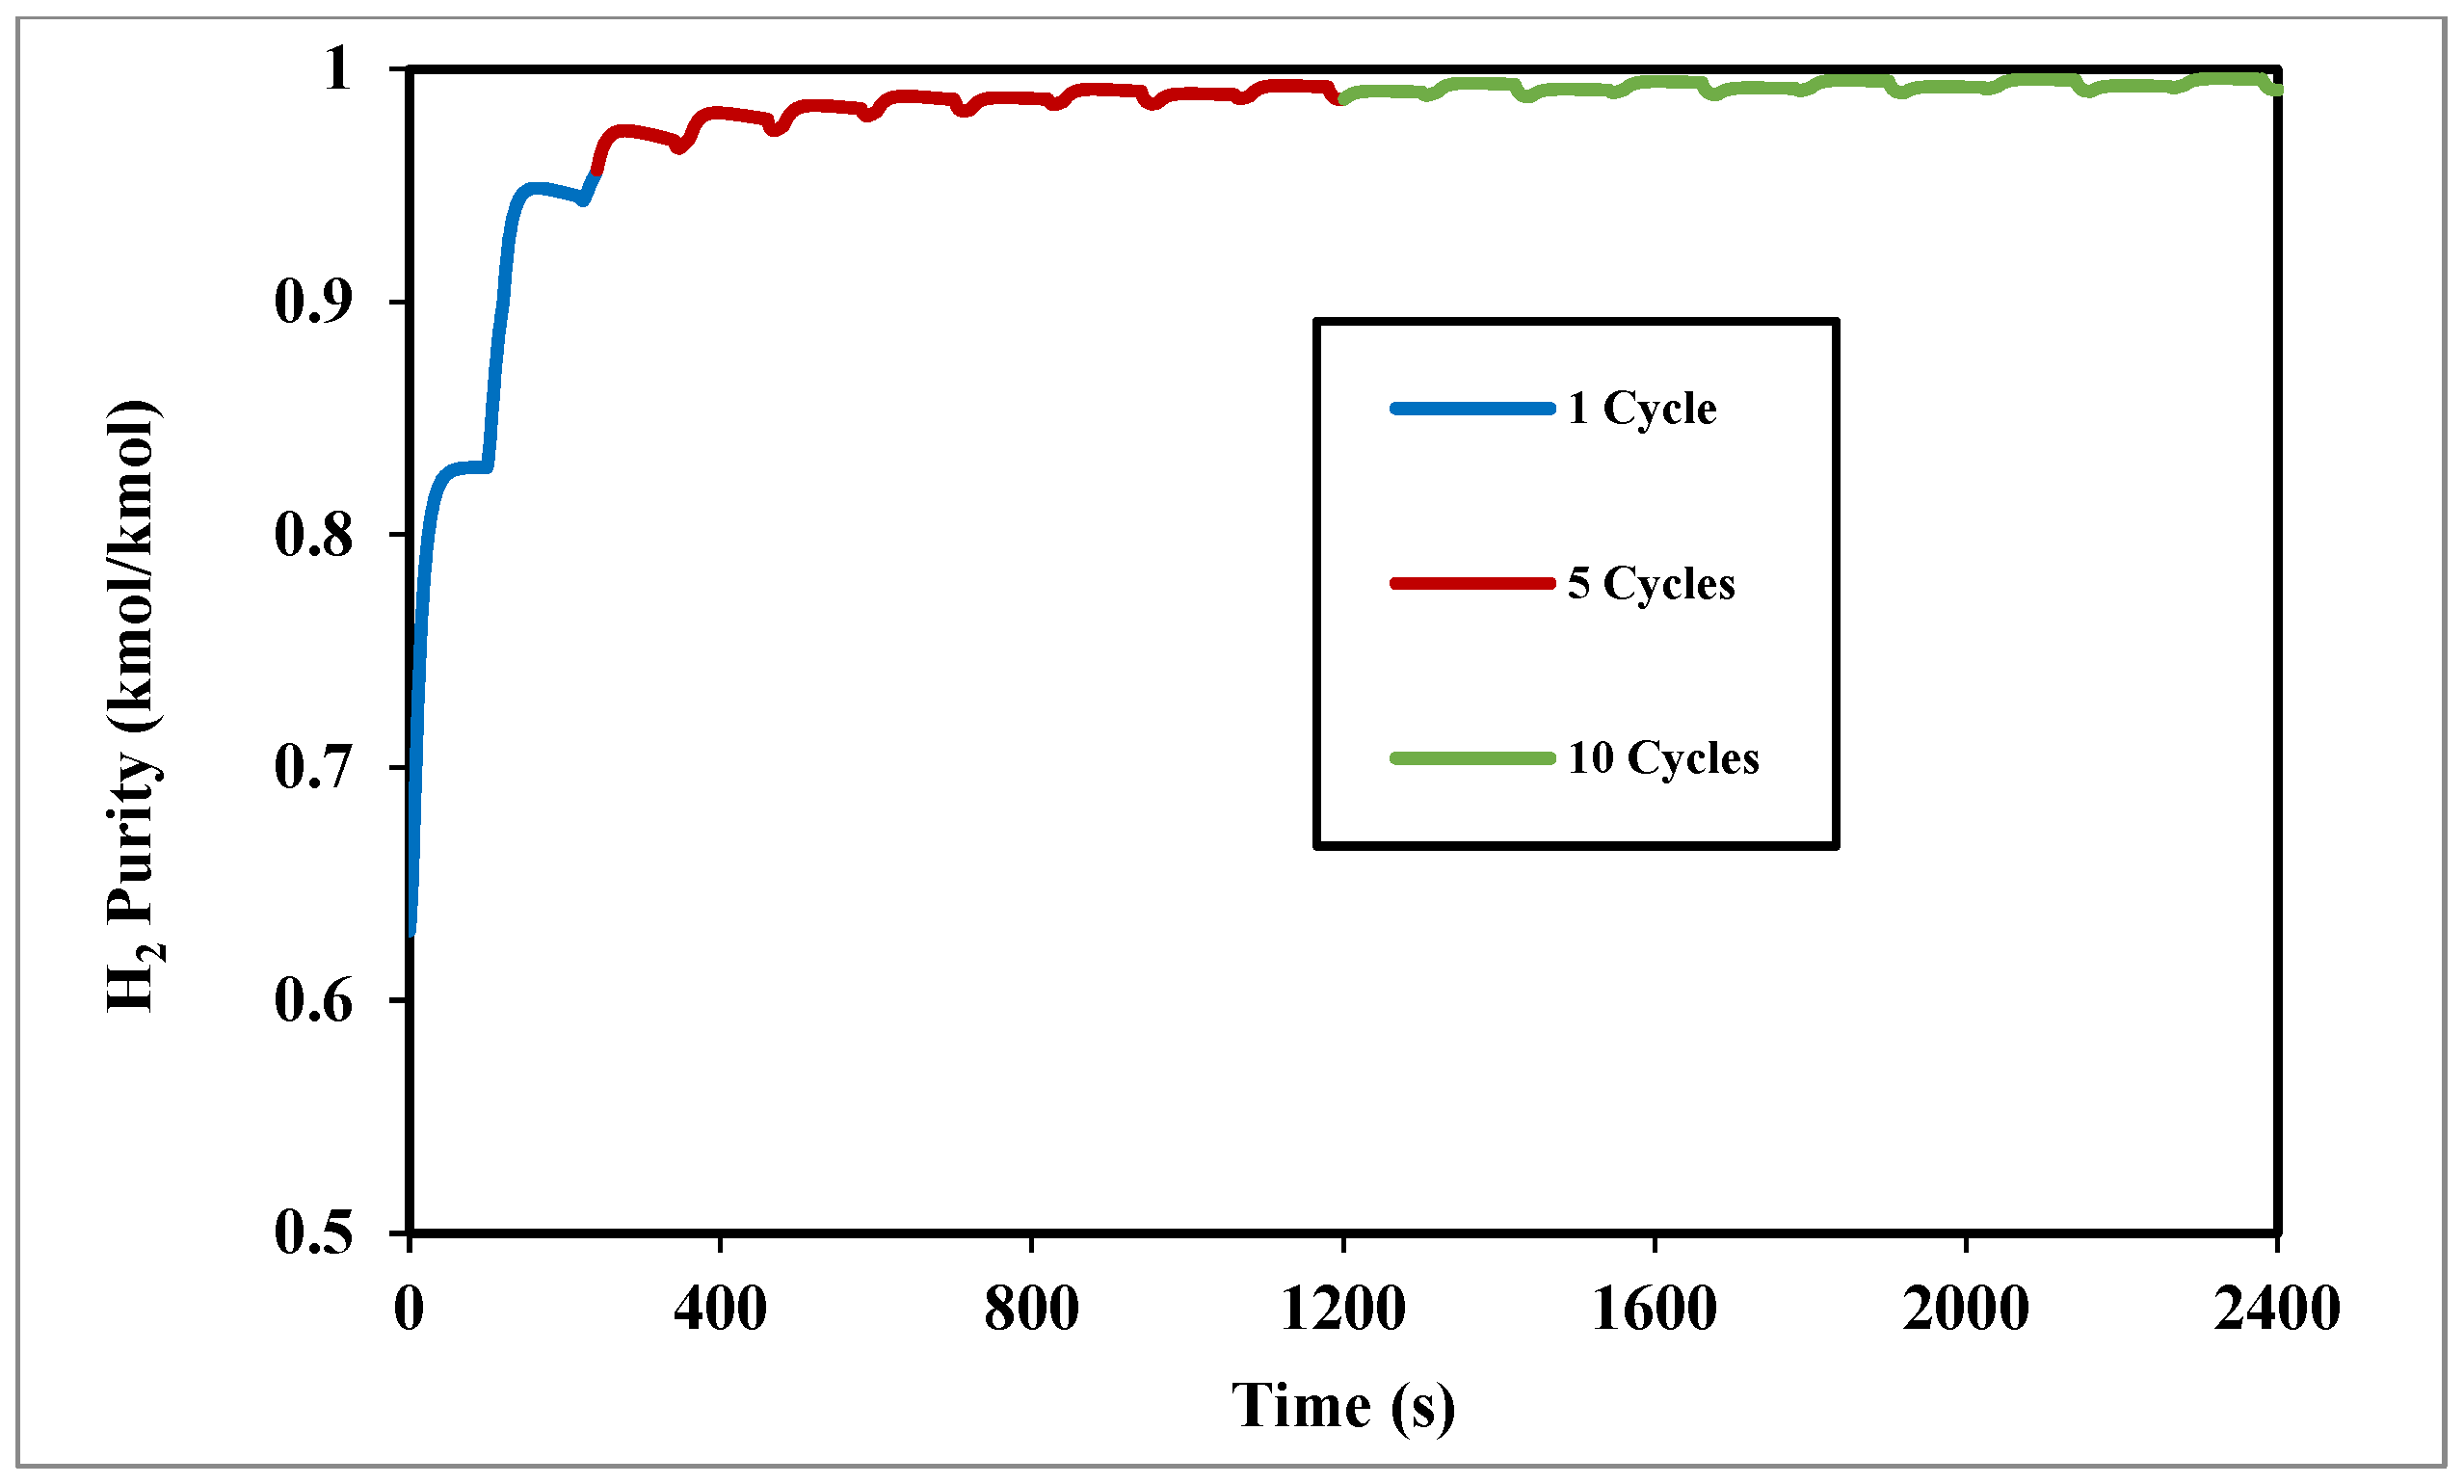
Figure 6 shows the effect of the number of cycles on H
2 purity, where the H
2 purity increased progressively with more cycles, rising from 95.6% in the first cycle (240 s) to 99.3% for 10 cycles, indicating the system’s approach to steady state during the start-up phase.
3.2. CO from BOFG
Figure 7 shows the impact of vacuum pressure in the range 0.07–0.2 bar on CO purity separated from BOFG spanning over 1500 s through five cycles. According to the data, as the vacuum pressure increases, CO purity declines. A significant improvement in CO purity may be observed when the pressure is reduced from 0.2 to 0.1 bar. However, a further reduction from 0.1 bar to 0.07 bar yields further purity improvement. A 0.07 bar vacuum pressure yields 98.0% CO purity, while 0.20 bar gives approximately 94.0% purity.
Feed temperature changes in the range 295 K to 330 K were found to have minimal effect on CO purity.
3.3. CO2 from BFG
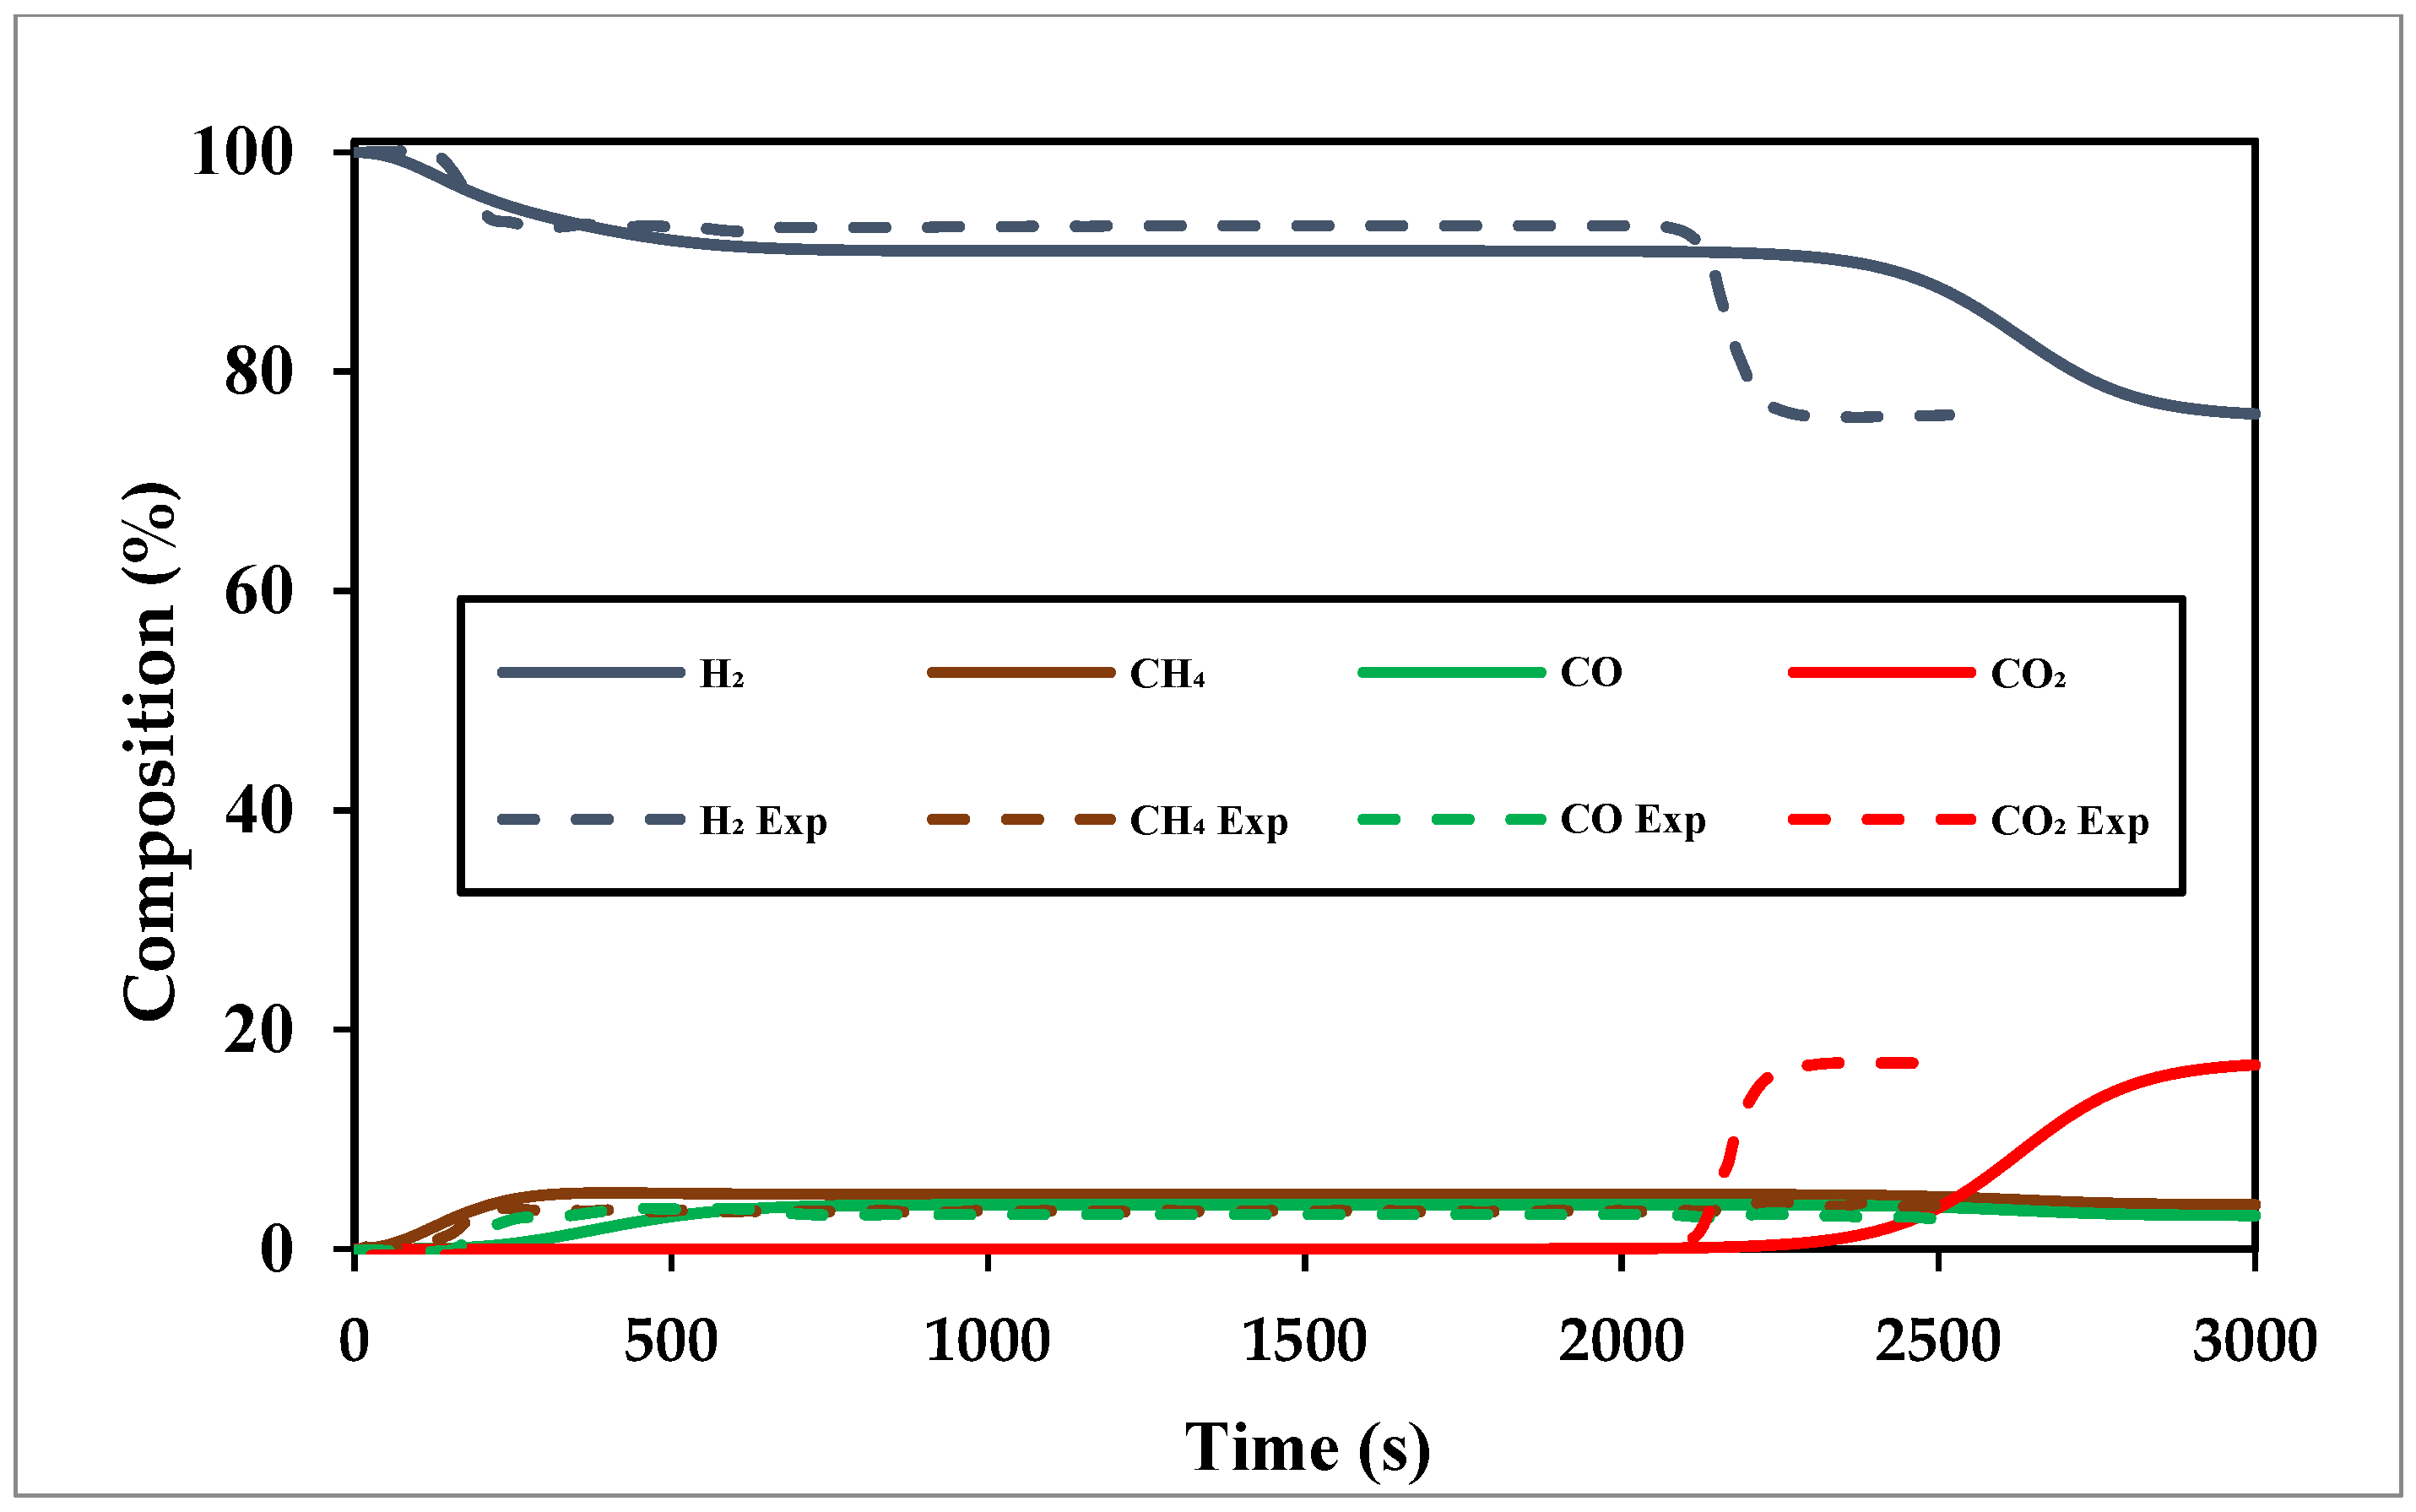
Figure 8 shows the validation of breakthrough curves obtained from the experimental work of Brea et al. [
45], over 3000 s for the separation of CO
2 from BFG, showing fair agreement. Due to limited experimental data, the gas stream examined for the breakthrough analysis differs slightly in composition from BFG.
The data show the CO
2 breaks through towards the end of the bed (ca. 2800 s); the delayed CO
2 breakthrough indicates its strong affinity to the zeolite 13X adsorbent, allowing selective separation and purification of CO
2 from the gas mixture.
Figure 9 shows the concentration profiles of the BFG over 10 cycles (4000 s), analysing the effects of the number of cycles. During the dynamic simulation, the system reaches steady state after about 8 cycles. The notable differences in the first two cycles (800 s) are due to unsaturated bed conditions. As time progresses, CO
2 purity increases and stabilizes, indicating successful separation. Concurrently, the concentrations of CH
4, CO, H
2, and N
2 decrease after the initial cycles, reflecting the efficient removal of these components from the adsorbent bed. This demonstrates the system’s capability for consistent CO
2 separation.
The BFG set-up was configured to operate under vacuum desorption pressure.
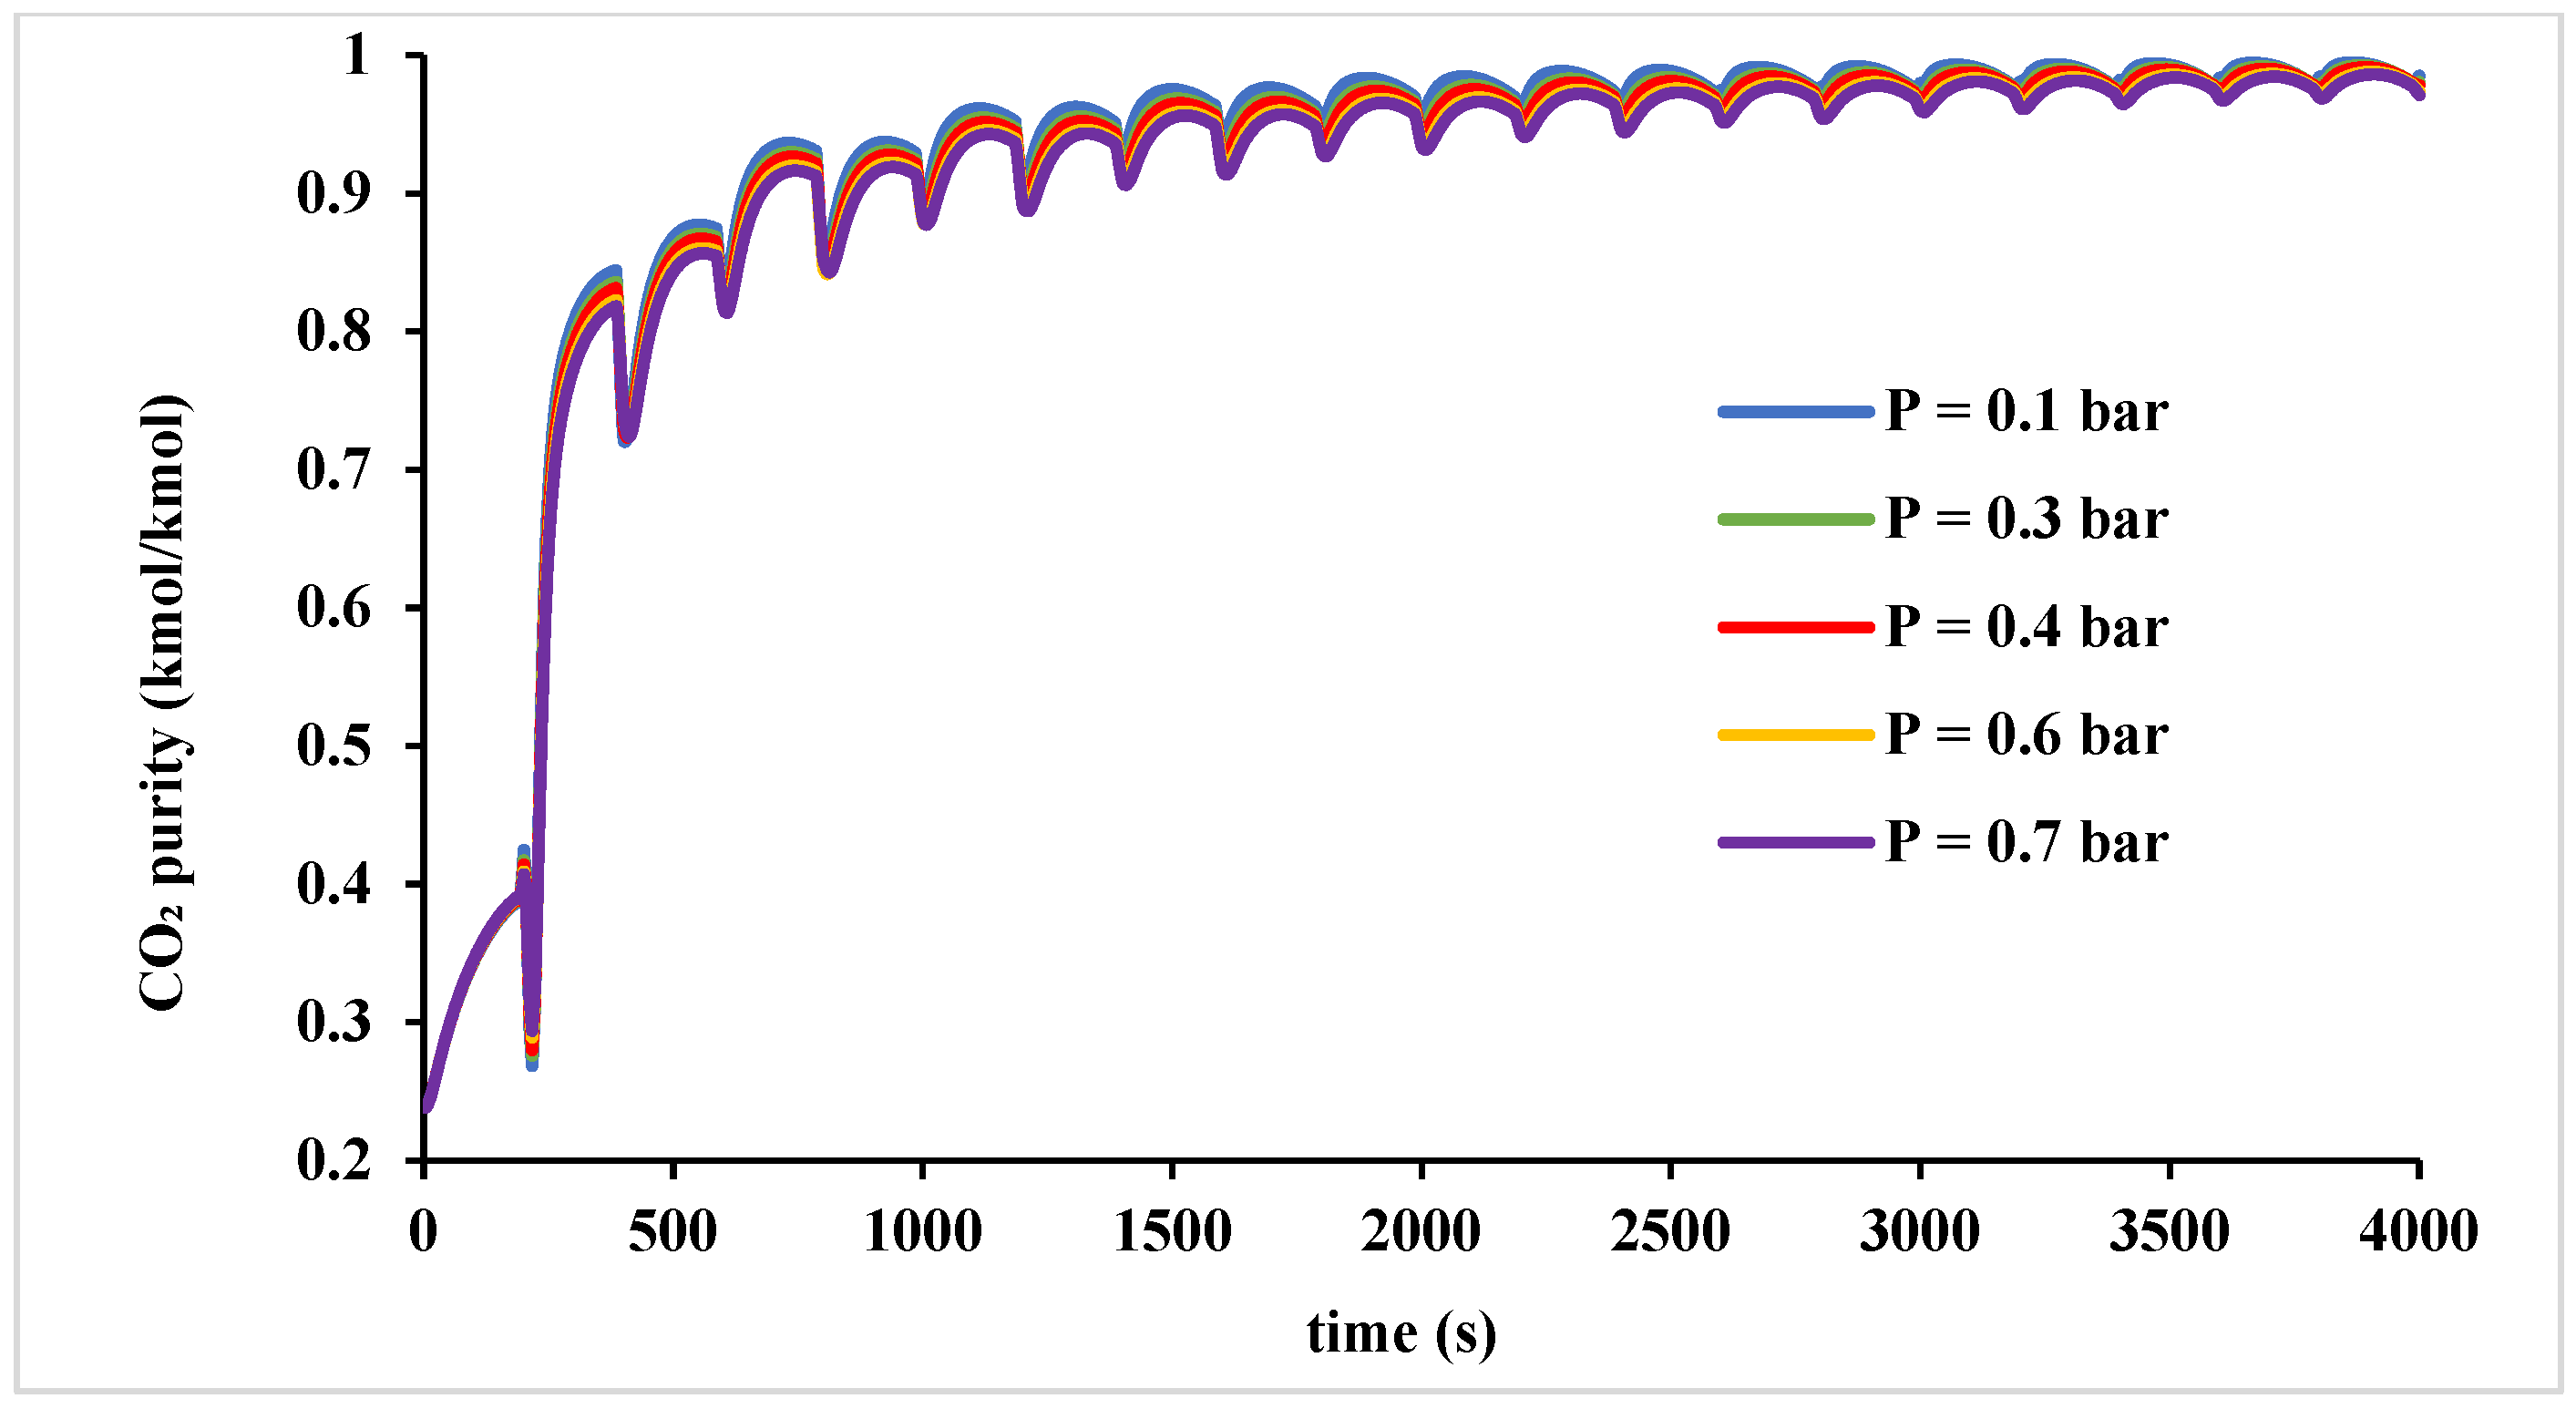
Figure 10 shows the variation in the desorption pressure ranging from 0.1 to 0.7 bar over 10 cycles (4000 s). The findings show decreasing the desorption pressure slightly enhances CO
2 purity, as lower pressures facilitate more efficient desorption of impurities, enhancing CO
2 recovery. Based on these findings, a vacuum pressure of 0.4 bar was selected for this study, achieving a CO
2 purity of 96.9% while effectively minimizing unnecessary vacuum-related costs.
Figure 11 shows the progression of CO
2 concentration profiles along the axial adsorption bed (0.14 m) over time (40 s to 180 s). Initially, CO
2 is uniformly distributed, but as the adsorption front advances, a sharper concentration gradient develops. By 180 s, the inlet region saturates, while the downstream section continues capturing CO
2 effectively. The profiles highlight efficient separation, minimal breakthrough, and optimal bed utilization, informing cycle time optimization. Changes in the feed temperature were found to have minimal impact on CO
2 purity, with 298.15 K corresponding to the ambient temperature being selected.
3.4. Scale-Up and Sizing
Predefined pressure trends in PSA modelling often overstate capture plant performance. PSA energy calculations typically assume high vacuum pump efficiency, disregarding the fact that efficiency decreases at the very low pressures that are needed for high purity and recovery [
48]. The present analysis accounts for practical vacuum pump issues through appropriate column scheduling and scale-up methodology. Detailed specifications of the PSAs such as the amount of adsorbent, and the number of pumps and columns are given in the
Supplementary Materials.
Table 8 provides the pertinent specifications for the respective PSAs.
3.5. Cost Analysis
Cost analysis was conducted for the PSAs using the preceding simulation results and scale-up methodology.
The KPI’s such as recovery, purity, and separation cost analysis are presented as follows.
The Levelized Cost of separation for H
2 (LCOH
2) or CO (LCOCO) based on TAC is calculated according to the following formula:
where
is the mass flow rate (mt/h) of H
2 or CO-rich stream leaving the COG and BOFG PSA, respectively [
11].
A different approach for the costing PSA system for CO
2 capture was taken as compared to those for H
2 and CO separation. In the case of H
2 and CO PSAs, only the capture/levelized cost of production cost was calculated, solely accounting for the cost of producing H
2 or CO as a chemical commodity in a commercial context. For the CO
2 PSA, compression, transport, and storage costs corresponded to £37.6/tCO
2 as estimated in previous studies [
49,
50,
51].
The CO
2 avoided cost is a key performance indicator for CO
2 capture from BFG using PSA. As incorporating CCS does not affect a plant’s overall steel output as the main product, the CO
2 avoided cost is determined using a net present value method [
11] as follows:
where
i and
d refer to the index year and the discount rate (%), respectively.
The CO
2 capture cost on the other hand is given by [
51]
The CO2 emissions avoided by CCS deployment is defined as the difference between the amount of CO2 captured through the deployment of CCS and those for direct emissions related to CCS implementation due to heat and electricity consumption. The magnitude of this difference enables a direct comparison of the performance of various capture methods.
The spreadsheet used to perform the techno-economic evaluation of the PSA processes is available in the
Supplementary Materials. Using the calculated TAC presented in the spreadsheet, and Equation (10), the levelized separation cost (LCOH
2) to produce 99.3% purity and 90% recovery of H
2 from 40,000 Nm
3/hr COG using a layered bed PSA is estimated at £2768/t
H2. This cost is lower than the reported industry costs that range from £3200–6400/t
H2 [
52], depending on the process employed and the feed gas composition.
Using the same procedure, the corresponding levelized separation cost (LCOCO) for producing 98% pure CO from 35,000 Nm
3/h BOFG using the VPSA is estimated at £52.8/tCO, which is largely attributed to the overall process CapEx. This cost falls within the lower range of CO separation costs of £48–160/tCO reported in the open literature [
53,
54,
55].
The corresponding CO
2 capture cost from BFG at a flow rate of 750,000 Nm
3/h using the VPSA system to achieve 96.9% purity and 75% recovery is calculated as £16.9/t. This cost aligns with the DOE target of <£32/t for second-generation capture technologies such as PSA [
20].
The corresponding calculated CO
2 avoided cost is £54.5/t, making the VPSA system competitive compared to CO
2 capture and separation in power plants, which range from £20/t to £56/t [
42,
44]. It is noteworthy that a significant proportion of the CO
2 avoided cost is associated with not utilizing the high flow rate (750,000 Nm
3/h) BFG LHV.
Payback analysis (see
Supplementary Materials) based on 2024 UK energy prices [
45,
46] shows payback periods of less than three years for all PSA systems evaluated in this study.
Table 9 presents the calculated key economic performance parameters for the three PSAs.
To strengthen the economic context, a comparison is made between PSA and membrane separation, cryogenic distillation, and amine absorption. PSA offers strong performance at moderate cost, especially for variable off-gas compositions typical in steel plants. Membranes are cost-effective at lower purities (<98%) but less suitable for high-purity H
2 or CO recovery due to lower selectivity [
56]. Cryogenic systems can achieve high purities but are energy-intensive (up to 200 kWh/ton O
2) and capital-heavy. Amine absorption is effective for CO
2 capture but incurs higher operating costs due to solvent regeneration (up to
$115/ton CO
2) [
57]. PSA, thus, offers a practical, scalable alternative for steel off-gas recovery. By benchmarking PSA against these alternatives, the study contextualizes its viability not just from a cost standpoint but also in terms of operational simplicity and adaptability to fluctuating gas streams typical of integrated steel plants.
4. Conclusions
This study explored the development and evaluation of PSA models for the pre-combustion separation of valuable components from steelworks off-gases, enabling their capture or utilization depending on the specific application. The study detailed how these gases can be separated using a modified version of the Skarstrom cycle. Additionally, a parametric analysis was carried out to examine the effect of adsorption and vacuum pressure, temperature, and adsorption time on the overall performance of the units. The study examined three different PSA units: a conventional high-pressure PSA for H2 separation from COG at 8.5 bar adsorption and 1 bar desorption, a VPSA for CO separation from BOFG at 1.2 bar adsorption and 0.07 bar vacuum desorption, and CO2 VPSA units at 1 bar adsorption and 0.4 bar vacuum desorption. The models were validated against experimental data, achieving impressive results: 99.3% purity and 80% recovery for H2, 98% purity and 87% recovery for CO, and 96.9% purity and 75% recovery for CO2. These outcomes demonstrate the efficacy of the customised PSA and VPSA configurations for each gas separation process.
The respective PSA systems were subsequently methodologically scaled up and sized to meet realistic industrial specifications and were subsequently costed using industrial cost models, considering capital and operational costs. The initial CapEx of these PSA systems was found to be higher than similar gas separation techniques due to the large number of columns and pumps required. However, when considering the OpEx, a compelling economic argument for the deployment of PSA technology emerges. The cost analysis in this study reveals that, as compared to conventional gas separation methods, the operational costs of PSA systems are substantially decreased during their lifespan. The inherent energy efficiency of PSA systems, which harness the variable adsorptive characteristics of gases at changing pressures without the need for significant heat inputs, accounts for this cost efficiency. Furthermore, the cyclic nature of the adsorption and desorption process reduces maintenance requirements for PSA systems since there are fewer moving parts and less chemical wear on system components. From a technical standpoint, the PSA units under consideration not only exhibit a favourable economic profile but also demonstrate superiority in operational parameters, guaranteeing that the output gases fulfil high-quality criteria for subsequent industrial application. Recovered high-purity gas streams are critical for the synthesis of different compounds as well as applications where contaminants might have a negative impact on downstream processes or product quality.
Furthermore, the safety benefits of PSA systems should not be overlooked. Their design, which operates at lower pressures and temperatures compared to conventional capture technologies, reduces the risk of flammable or hazardous gas leaks and minimizes the likelihood of operational mishaps associated with high-temperature or high-pressure separation processes.


