Article

Innovative Bibliometric Methodology: A New Big Data-Based Framework for Scientific Research

by
Eduardo Marlés-Sáenz
1,
Eduardo Gómez-Luna
1,
Josep M. Guerrero
2 and
Juan C. Vasquez
2,*
1
High Voltage Research Group—GRALTA, School of Electrical and Electronic Engineering, Universidad del Valle, Cali 760015, Colombia
2
Center for Research on Microgrids (CROM), AAU Energy, Aalborg University, 9220 Aalborg, Denmark
*
Author to whom correspondence should be addressed.
Energies 2025, 18(10), 2437; https://doi.org/10.3390/en18102437
Submission received: 1 April 2025 / Revised: 22 April 2025 / Accepted: 6 May 2025 / Published: 9 May 2025

Abstract

:
The accelerated growth of scientific publications in renowned databases such as Scopus (Elsevier) and Web of Science (Clarivate) has made the identification of unresolved research problems increasingly complex. This challenge is exacerbated by the vast amount of information that must be analyzed, highlighting the imminent need for the application of big data techniques to extract relevant information for researchers, stakeholders in innovation and development, and regulatory policymakers. To address this challenge, this article presents an innovative, structured, and systematic methodology for conducting bibliometric analyses of scientific publications. The proposed approach is designed for researchers who only have an initial research idea, a broad problem context, or a general study area and require methodological tools to precisely define their research problem. The methodology follows a recommended flowchart-guided process, leveraging open-source tools such as Bibliometrix (R), spreadsheets, and text processing techniques to conduct a comprehensive bibliometric study. This enables the analysis of the intellectual, conceptual, and social structures of a research field, facilitating the identification of research gaps and emerging trends. As a practical application, the proposed methodology was implemented for the 2004–2024 period, within the framework of an applied research project in engineering. This case study aimed to answer key research questions formulated during the study design phase, demonstrating the effectiveness of the approach in systematically analyzing scientific production. Beyond the energy sector and energy systems, this methodology has proven to be adaptable to diverse disciplines, such as health sciences, industrial management, construction, and urban development, provided that relevant databases are accessible. Through this structured approach, researchers can better define their research problems and identify future challenges in various areas of knowledge.

1. Introduction

Methods and strategies for information retrieval have evolved with technological advancements, transitioning from consulting printed documents and using document managers without bibliometric tools [1], to online access to large-scale databases. Given the exponential increase in scientific publications, a systematic and efficient approach is required to analyze this vast volume of information. This article introduces knowledge discovery techniques grounded in big data as an innovative solution to conduct in-depth and efficient studies for identifying specific research topics and problems.
One of the primary motivations for employing bibliometric analysis is the need to establish a systematic methodology that provides a comprehensive, detailed, and up-to-date overview of a given research topic. The absence of structured methodologies has led to fragmented and uncoordinated research flows, making it difficult to extract relevant information. Since 2017, the adoption of the open-source tool Bibliometrix has expanded across various disciplines [1], leveraging the quantitative analysis capabilities of R. Bibliometric analysis enables the assessment of research progress on a specific topic, such as the risks associated with prefabricated construction, the identification of literature trends [2], or an exploratory bibliometric review of any research subject, even in a context where scientific evaluation of information has become increasingly relevant [1]. The applicability of bibliometric analysis has been demonstrated in diverse fields of knowledge. In health sciences, for instance, bibliometric mapping has been used to consolidate the scientific literature on Familial Mediterranean Fever (FMF) [3], HIV-1 genetic diversity [4], and MERS-CoV [5], identifying key trends, authors, and journals using data from the Web of Science. Similarly, vaccine research has benefited from bibliometric methods to map global contributions, such as in studies on the anthrax vaccine [6]. In industrial and business settings, tools like Bibliometrix-R have facilitated the visualization of research flows on Lean Six Sigma in India [7] and Business Improvement Districts (BIDs) [8], enabling the identification of epistemic communities and potential research gaps. Moreover, in the domain of architecture and design, bibliometric analysis has been applied to understand the evolution of research on the Metaverse, outlining current trends and future directions [9].
Given the diversity of applications, bibliometric analysis has emerged as a reliable and alternative tool for identifying emerging research areas, mapping scientific advancements, and ensuring structured evaluations of academic knowledge. The methodology proposed in this article builds upon these principles, offering a structured and scalable approach for systematically analyzing scientific production, detecting research gaps, and defining prospective directions for future studies.
Therefore, this article is divided into five sections, including the introduction. Section 2 provides an overview of the Innovative Bibliometric Methodology, highlighting its foundations and distinctive features. Section 3 presents the application of the methodology through an engineering case study. Section 4 discusses the key findings, research gaps, and future research opportunities. Finally, Section 5 presents the main conclusions regarding the proposed methodology and its contributions to researchers and innovators.
The contributions of this article are listed and described as follows:
  • A new bibliometric tool for large-scale research analysis. The methodology leverages free-to-use tools such as Bibliometrix (An R-tool: version 4.3.0), R (4.4.2) (31 October 2024 ucrt), RStudio (4.4.1) (1 September 2024 Build 394), spreadsheets, and text processing techniques, enabling a comprehensive bibliometric analysis of scientific dissemination documents. Additionally, the app Biblioshiny expands the applicability of the methodology by supporting data import from various sources, including API, PubMed, and DS Dimensions, ensuring flexibility across different research fields.
  • The development of a new systematic bibliometric methodology to improve efficiency in reviewing large volumes of scientific literature. This approach provides a structured and reliable alternative to manual searches, addressing the accelerated growth of scientific publications. The proposed methodology optimizes the identification of research topics, ensuring a systematic exploration of contributions while reducing bias and inefficiencies.
  • Identification of emerging topics and research trends in a given field of knowledge The methodology employs timeline analysis to offer a prospective view of technological advancements, supporting the definition of key areas for future research, as demonstrated in the case study on DER integration, where developments include tools for planning, operation, control, dispatch, future maintenance, and regulatory frameworks.
  • The proposed methodology incorporates a new scientific mapping approach based on the identification of key characteristics aligned with the research objectives defined in the initial phase (Stage 1), according to the specific aims of PhD students, researchers, or innovators. Despite the growing importance of scientific evaluation, bibliometric analysis has become a fundamental tool for ensuring data-driven assessments of knowledge evolution. This methodological framework supports the development of topic-specific analyses through a structured mapping process anchored in the logical foundation of initial research questions and objectives.

2. Innovative Bibliometric Methodology: General Overview

The proposed methodology stems from the need to establish a structured and scalable bibliometric framework capable of addressing the growing complexity of scientific production. It is based on the identification of key thematic, methodological, and conceptual dimensions aligned with the objectives defined in the initial stage by PhD students, researchers, and innovators. Through a systematic process, this methodology facilitates the extraction of critical elements from the scientific literature, enabling a coherent analysis of the intellectual, conceptual, and social structures of a research field.
Unlike other approaches that rely solely on isolated tools or basic visual representations, the proposed methodology articulates a structured, replicable, and adaptable workflow. This process guides the researcher from the formulation of the search equation to the conceptual and thematic analysis of the research field, ensuring traceability of the results. The approach combines descriptive analysis with knowledge network extraction, through tools such as Bibliometrix (R), Biblioshiny, spreadsheets, and text processing techniques, enabling a rigorous correlation among emerging trends, key authors, and the most commonly adopted methodological strategies.
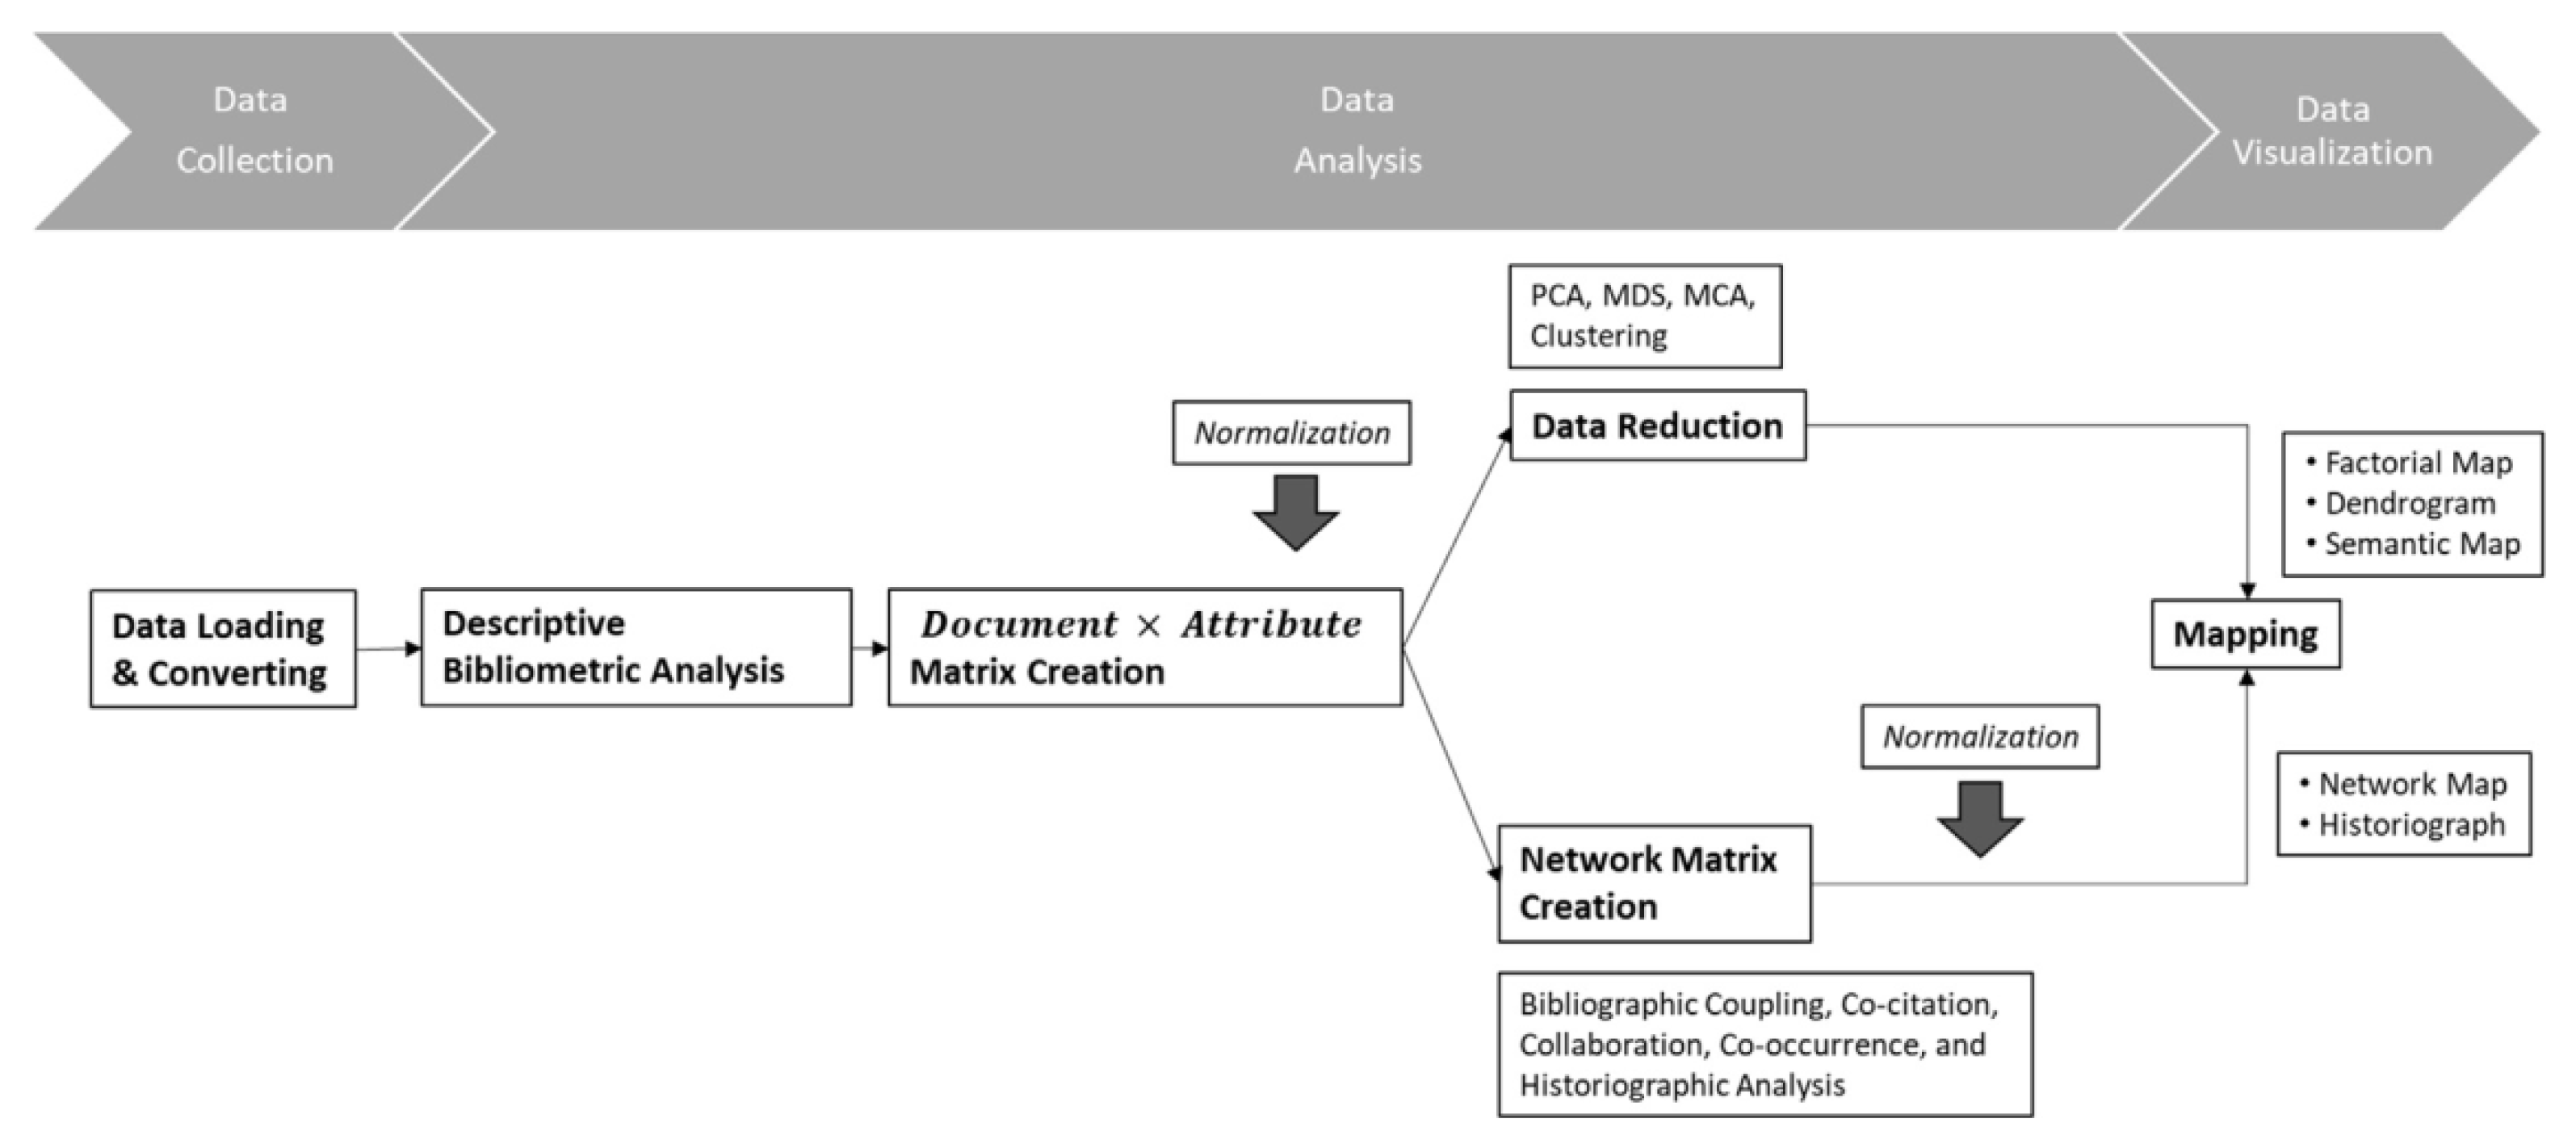
The implementation of the methodology draws upon the recommended workflow outlined in the literature (Figure 1) [1], which presents a variety of methods and strategies applied in bibliometric analysis. Based on this reference, the methodology develops a proposal that adapts said workflow to scientific analysis focused on research topics from the research field, using available databases as data sources. This approach incorporates multiple tools, such as Bibliometrix (R), the Biblioshiny application, spreadsheets, and text processing techniques, for retrieving, cleaning, and structuring scientific documents.
The methodology integrates quantitative tools, such as trend analysis, co-occurrence networks, factorial analysis (MCA), and thematic mapping, with a contextualized qualitative interpretation that reinforces the coherence and validity of the findings throughout the entire research process.
The proposed methodology allows for the integration of mixed approaches combining qualitative systematic reviews with quantitative bibliometric analysis, as applied in prior studies using tools such as the Bibliometrix package in R, keyword analysis, cluster analysis, and thematic assessment [2]. Additionally, bibliometric studies may adopt a retrospective and visual approach, utilizing databases such as the Science Citation Index Expanded from Web of Science to retrieve scientific literature, as in the case of MERS-CoV studies, and employing tools such as HistCiteTM (version 12.3.17) and VOSviewer (version 1.6.17) to calculate citations and interpret collaboration, thematic, and conceptual evolution networks [5]. These strategies facilitate the extraction of intellectual structures, relationships between countries or regions, and emerging topics in the area of study.
The methodology also considers the integration of information from multiple databases, such as Scopus and Web of Science. This has been demonstrated in studies using tools like the Biblioshiny application and the Bibliometrix package in R to conduct scientific mapping related to a specific research area [7]. Similarly, a combination of bibliometric methods and the Bibliometrix-R tool has been used to map academic knowledge through a temporal and geographical analysis of scientific output, the identification of author collaboration networks, and the evaluation of dominant themes in the published literature [8].
The development of the “study design” phase is a flexible and decisive stage within the proposed methodology, as it allows the analysis to be adapted to the researcher’s specific objectives. This stage is characterized by its originality, since the formulation of research questions and the selection of methodological strategies depend on the context of the problem, the scope of the study, and the disciplinary approach defined by the researcher. While it is common for the workflow to be defined solely based on the data collected during the “data collection” phase [1], it may also be complemented with additional bibliometric analysis levels, such as knowledge structure analysis [7], or through a mixed approach that considers results from prior systematic reviews [2]. As a result of its implementation, the proposed methodology has made it possible to achieve a set of specific objectives through structured scientific mapping. Among these is the identification of emerging topics and potential research areas, as well as the associated methods, theories, and solution strategies. It has also facilitated the detection of prospective technological developments through temporal analysis and the incorporation of problem-solving approaches based on solution proposals found in the scientific literature. Furthermore, the mapping process can be aligned with the specific characteristics of each research project, according to the objectives defined in the design phase, enabling its adaptation to the needs of PhD students, researchers, or innovators. These capabilities were systematized through a critical review of previous approaches and are consolidated as distinctive elements of the methodological framework developed in this study.
In line with the methodological challenges encountered during the analysis, a comparative perspective was established between conventional bibliometric approaches and the proposed bibliometric methodology, highlighting its capacity to comprehensively structure the recommended workflow. This proposal incorporates a methodological design that spans five clearly defined stages: study formulation, data collection, analysis, visualization, and discussion. Each stage is developed using accessible tools such as Bibliometrix, spreadsheets, and text editors, depending on the research objectives. The systematization of the process relies on the treatment of analysis units: Keywords Plus, Abstracts, and Author’s Keywords, which enables the articulation of both the intellectual and conceptual structure of the research field. This organization supports a coherent interpretation of the data, aimed at identifying statistically relevant publications, methodological patterns, and opportunities for future research, and stands as a practical alternative to schemes that fragment the analysis or restrict it to the use of specialized tools.
The following section details the full implementation of this approach, highlighting its application in a case study on distributed energy resource (DER) integration in electrical systems.

3. Development of the New Methodology

The proposed methodology, detailed below, was applied to a case in electrical engineering focused on the integration of distributed energy resources (DERs) into the electrical power system. Its implementation follows the scientific mapping workflow guidelines recommended in [1] and further expanded as shown in Figure 2.
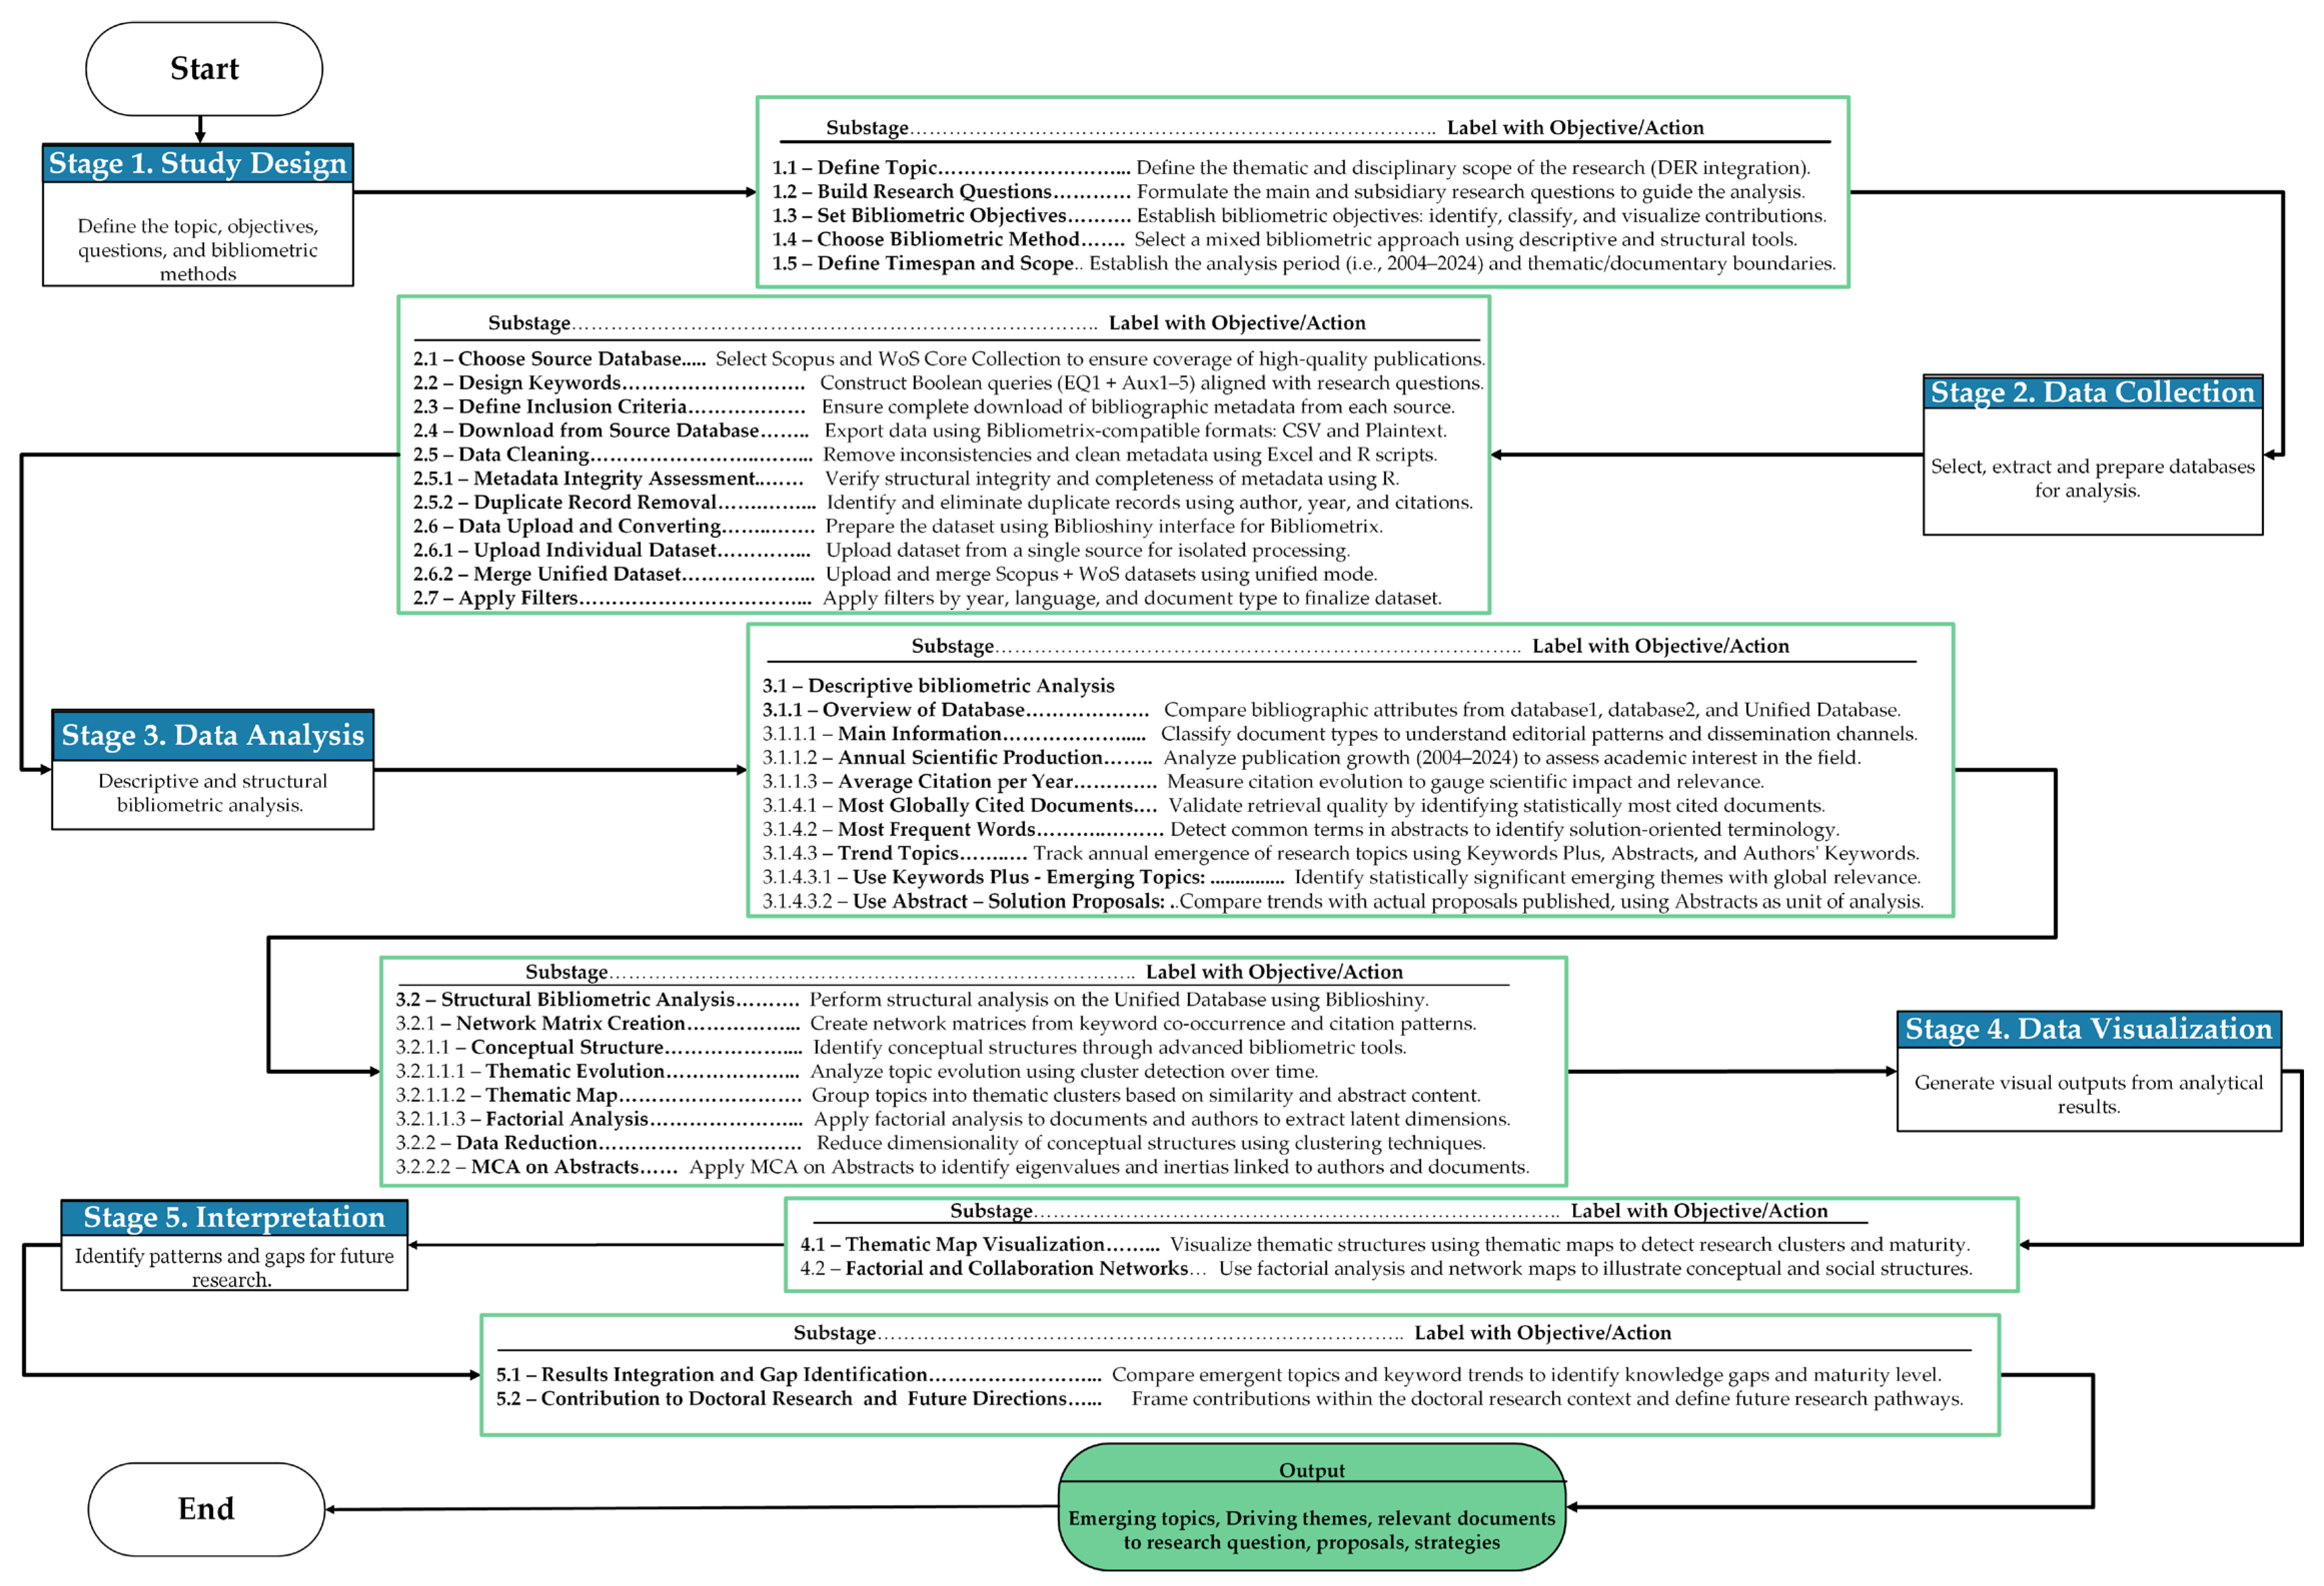
As illustrated in Figure 3, the methodology comprises five stages that align with the recommended flow in Figure 2. The process utilizes open-source and freely available tools, including the Biblioshiny application from the Bibliometrix package in R, RStudio, Excel, and a basic Windows text editor. Table 1 outlines the color-coding conventions (RGB and Hex values) used to support the development and interpretation of the flow diagram in Figure 3. The diagram outlines the sequential stages implemented in this study—from study design to interpretation—and highlights the methodological outputs, including emerging topics, driving themes, relevant documents aligned with the research questions, and proposed strategies.
Stage 1 (study design) is considered the most critical, as the researcher defines the research questions, selects the objectives of the bibliometric analysis, and identifies the appropriate statistical tools. Stage 2 (data collection) focuses on retrieving metadata from selected databases after applying appropriate filters. Stage 3 (data analysis) involves applying statistical metrics at various levels and constructing knowledge structures using advanced statistical techniques.
The data analysis stage, conducted through the Bibliometrix tool, includes both descriptive bibliometric analysis and network data extraction. Stage 4 (data visualization) leverages intuitive formats such as two-dimensional maps and social networks, incorporating timeline-based visualizations to illustrate the evolution of intellectual, conceptual, and social structures. Finally, Stage 5 (interpretation) involves the synthesis, interpretation, and discussion of the findings, along with an evaluation of the strengths and limitations of the bibliometric results.

3.1. Stage 1—Study Design

The study design stage constitutes the foundation of the proposed bibliometric methodology framework, as it defines the strategic and analytical orientation of the entire process. In this phase, the researcher must delimit the topic or research field, formulate precise research questions, and establish the bibliometric objectives that will guide the analysis. The methodology emphasizes that this phase is not merely preparatory but rather a decisive component that ensures methodological coherence and relevance across the subsequent stages.
Stage 1.1—Define Topic or Research Field. In the present application, the defined research field focused on the technical impacts of distributed energy resources (DERs) integration into the power system. Stage 1.2—Build Research Questions. From this thematic scope, key research questions were formulated to understand what types of impacts have been studied, how those impacts have been assessed, what solution proposals have been advanced, and what knowledge gaps persist in the scientific literature. Stage 1.3—Define Research Objectives. These questions shaped the bibliometric objectives, aimed at identifying the intellectual, conceptual, and social structures of the field. As part of this stage, the core analytical units were also defined, including abstracts, Author’s Keywords, and Keywords Plus, which enable the structured extraction of critical knowledge elements and the construction of coherent conceptual relationships.
Stage 1.4—Choose Bibliometric Method. A key contribution of this study is the formalization of a systematic strategy that aligns research questions with the selection of appropriate bibliometric tools and analytical techniques. To that end, free and open-source tools were selected, including Bibliometrix (via the Biblioshiny app), RStudio, Excel, and a Windows text editor, allowing the configuration and execution of both descriptive and structural analyses.
Stage 1.5—Choose Time Span. Finally, the temporal scope of the analysis was defined, covering the 2004–2024 period in order to capture the evolution of knowledge on DER integration over the past two decades. This structured methodological framework transforms the study design into a critical mechanism for ensuring analytical precision, thematic coherence, and the applicability of the methodology to doctoral research and other exploratory scientific projects.

3.2. Stage 2—Data Collection

The present stage describes in detail the structured search strategy applied to construct the bibliographic dataset, following a stepwise and reproducible process.
The processes from Stage 2.1 to Stage 2.5 were executed directly using the tools and export functionalities provided by the scientific databases Scopus and Web of Science Core Collection.
The data collection stage is essential to ensure the reliability of bibliometric results and the successful achievement of the research objectives. Stage 2.1—Choose Source Database. In this phase, the methodology proposes the construction of a unified database using recognized scientific dissemination sources selecting Scopus (Elsevier) and Web of Science Core Collection (Clarivate) as complementary databases to cover a broad spectrum of top-tier scientific publications.
Stage 2.2—Design Keywords to Each Research Question. To retrieve metadata aligned with the research field and questions defined in Stage 1, a systematic Boolean search strategy was developed using technical vocabulary directly associated with distributed energy resources (DERs) and their integration into power systems. This strategy was structured around a sequence of auxiliary queries (Aux1 to Aux5) that progressively incorporated semantic filters targeting different conceptual layers of the field.
  • Aux1 = DER AND distribut* energy resourc*
captures the general document universe on distributed energy resources, while excluding unrelated DER acronym uses in other disciplines.
  • Aux2 = (DER AND distribut* energy resourc*) AND (MG OR microgrid* OR “micro grid*” OR micro-grid* OR “smart grid*”)
filters records linking DER with microgrids (MG) or smart grids (SG).
  • Aux3 = (DER AND distribut* energy resourc*) AND (evaluat* OR valuat* OR assessment OR rat*)
retrieves documents involving any type of evaluation or assessment of DERs.
  • Aux4 = (DER AND distribut* energy resourc*) AND impact*
focuses on literature discussing the technical impacts produced by DERs.
  • Aux5 = (DER AND distribut* energy resourc*) AND (evaluat* OR valuat* OR assessment OR rat*) AND impact*
narrows the scope to documents evaluating specific impacts caused by DER integration.
These auxiliary queries formed the basis for constructing the final optimized search expression tailored to the objectives of the proposed methodology:
(DER AND distribut* energy resourc*) AND (MG OR microgrid* OR “micro grid*” OR micro-grid* OR “smart grid*”) AND (evaluat* OR valuat* OR assessment OR rat*) AND impact*
This final query was designed to retrieve studies that evaluate the impacts caused by DER integration into microgrids and smart grids under technical criteria. Its Boolean structure strategically combines variants of the core concepts—DER, microgrids, evaluation, and impacts—ensuring that the equation captures all relevant terminological permutations used in the field when discussing the assessment of technical impacts.
The Boolean logic applied follows standard database conventions:
  • Quotation marks (“”) indicate exact phrase matching.
  • An asterisk (*) represents any ending (wildcard suffix).
  • A quotation mark (?) stands for a single-character wildcard.
  • (A) AND (B) returns results that satisfy both conditions A and B.
  • (A) OR (B) returns results that satisfy either A, B, or both.
  • (A) AND NOT (B) excludes from A any result that meets condition B.
All query results were recorded and organized systematically. This record was later used in the descriptive statistical analysis (Stage 3.1) to explore scientific production trends and provide quantitative support for understanding the evolution of knowledge in the field.
Stage 2.3—Define Inclusion Criteria. Once the search strategy was defined, inclusion criteria were adjusted to ensure the download of all available bibliographic data from each source, maximizing the analytical potential of the retrieved information. Stage 2.4—Download from Source Database. Export formats were selected according to Bibliometrix specifications: CSV for Scopus and Plaintext for Web of Science.
Stage 2.5—Data Cleaning. A meticulous data cleaning process was then conducted, involving the analysis of completeness, structure, and consistency of metadata, as well as the identification and removal of duplicate records using Excel spreadsheets and R scripts. This process led to the construction of a unified database composed of 148 documents, including articles, reviews, conference papers, book chapters, and other scientific publication types.
Stage 2.5.1—Metadata Integrity Assessment. In line with responsible bibliometric practices, and prior to executing any analytical stage, an integrity assessment was conducted on the metadata retrieved from Scopus and Web of Science using R version 4.4.1. This verification revealed a data loss of 2.5% in the Scopus dataset and 20.2% in the WoS dataset, mainly concentrated in fields related to institutional affiliations (e.g., AU_UN_NR and AU_UN). However, these missing values do not compromise the overall structure of the metadata, nor do they affect the standard fields required by Bibliometrix for bibliometric analysis, which include AB, AU, TI, PY, SO, CR, DE, and ID, among others [1]. Using R version 4.4.1, structural verification was performed with the “str(M)” function, and missing values were visualized using the “vis_miss()” function from the “visdat” package. This step confirmed the adequacy of the dataset for analysis within the proposed methodological framework. These structural limitations and their implications have been previously documented [10,11], whose recommendations were taken into account in this work.
Stage 2.5.2—Duplicate Record Removal. A manual deduplication process was initially performed using Excel spreadsheets, based on a combination of author names, publication year, and citation counts to identify and eliminate records found in both databases. As of August 2024, Bibliometrix version 4.3.0 (via the Biblioshiny app) incorporated new functionality allowing direct bibliometric analysis of unified datasets, which was adopted in this study to enhance consistency and reduce human error.
Stage 2.6—Data Upload and Conversion. All processes from Stage 2.6 to Stage 2.7 were conducted directly using the Biblioshiny application of the Bibliometrix software package. The datasets were then uploaded into the Biblioshiny platform for processing, either individually (Stage 2.6.1—Data Upload and Conversion for Individual Database) or simultaneously merged (Stage 2.6.2—Data Upload and Conversion for Unified Database) using new features available since version 4.3.0 of the software. Stage 2.7—Apply Filters. Finally, internal filters were applied to configure key bibliographic attributes such as language, document type, and analysis time span, thus completing the preparation of the dataset for advanced bibliometric analysis. This stage consolidates a replicable and verifiable data infrastructure that supports the technical rigor and traceability of the proposed methodology.

3.3. Stage 3—Data Analysis

The data analysis stage represents the methodological core of the proposed bibliometric process and is directly linked to the research questions and objectives defined during the initial study design (Stage 1.4). In this phase, appropriate statistical techniques are selected to be applied to the unified database, enabling work at different levels of analysis [1,7].
The choice of each bibliometric technique depends on its unit of analysis: authors, documents, and journals in bibliographic coupling; authors, references, and journals in co-citation; authors, countries, and institutions in co-author; and keywords or terms extracted from titles, abstracts, or full texts in co-word analysis—the latter being the only bibliometric technique that uses the actual textual content of the documents [1].
As part of the proposed methodology, Figure 3 (Stage 3) resent the hierarchical guides of the bibliometric techniques implemented, as recommended in the workflow for the use of the Bibliometrix software (via Biblioshiny app) [1]. The data analysis process is developed along two main lines: (1) descriptive and comparative bibliometric analysis, which can be complemented with tools such as R, RStudio, Excel, or native functions from Scopus and Web of Science; (2) structural analysis, carried out entirely within Biblioshiny.
Notably, within this methodology, bibliographic coupling is applied as a retrospective technique to assess the consolidated state of knowledge, while co-citation is recommended as a prospective approach to identify future trends. In addition, the methodology supports a mixed-review strategy that combines bibliometric outputs with qualitative insights derived from previous systematic reviews, enriching interpretation and fostering the generation of new research hypotheses.
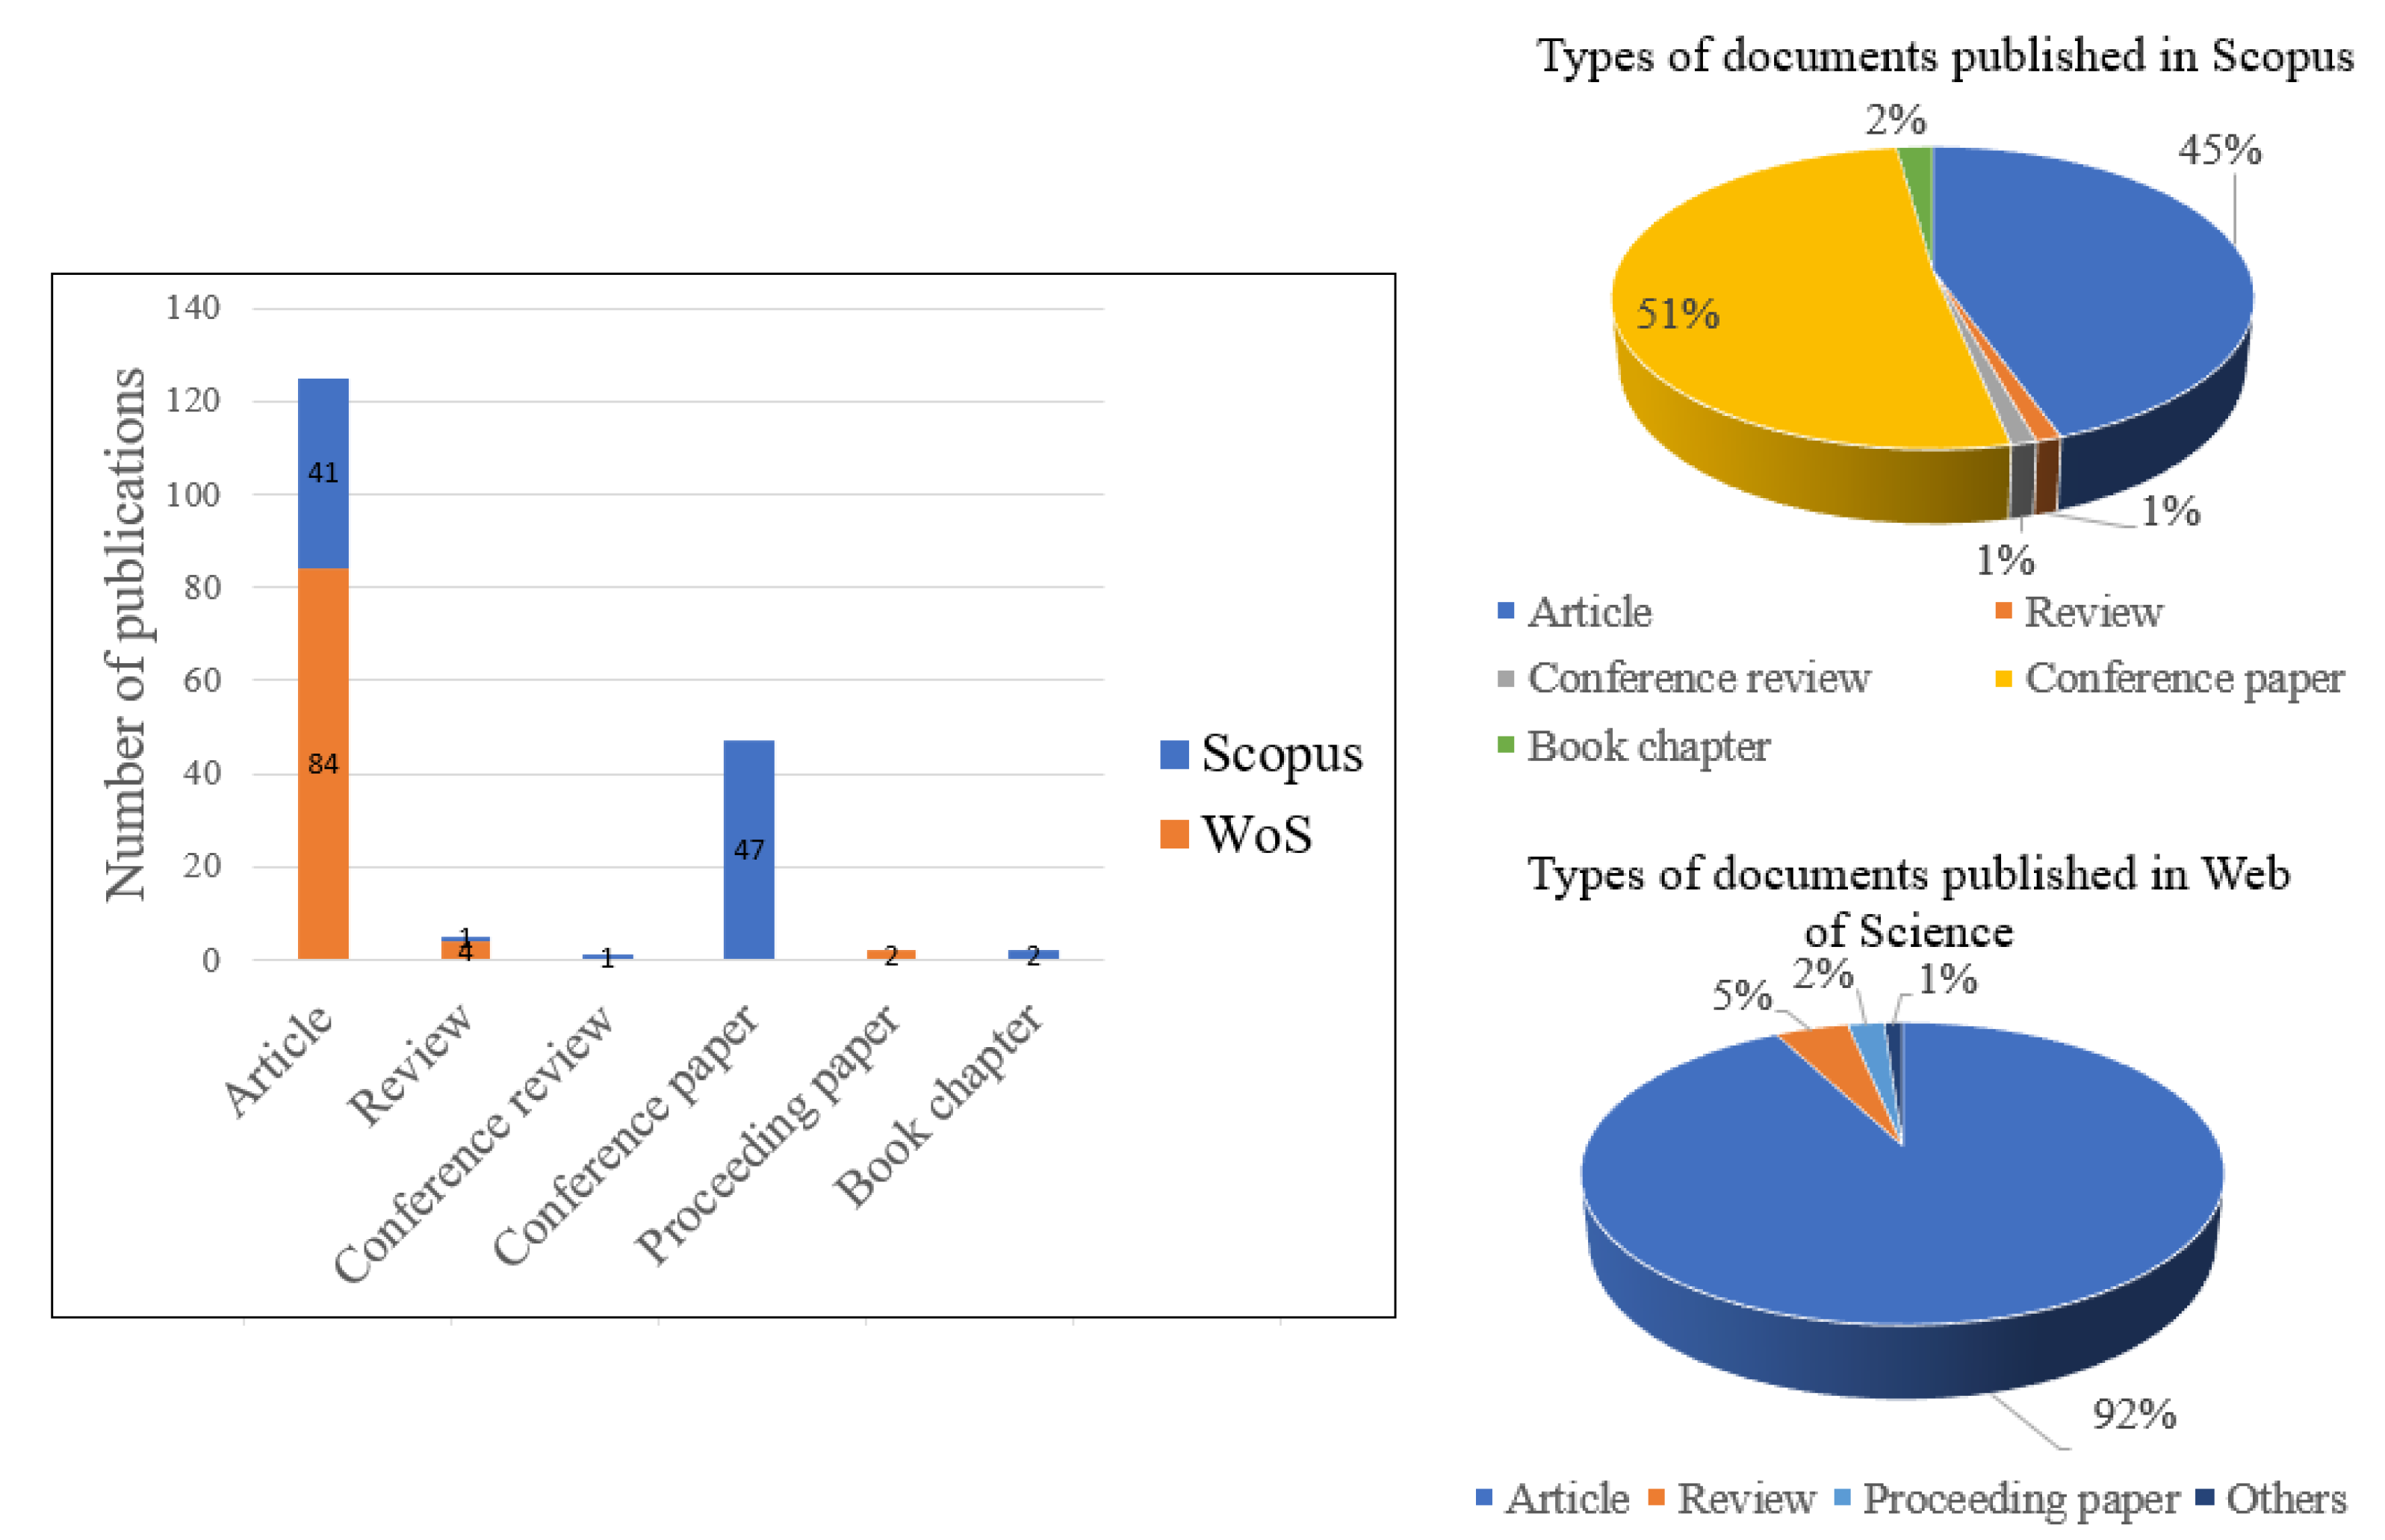
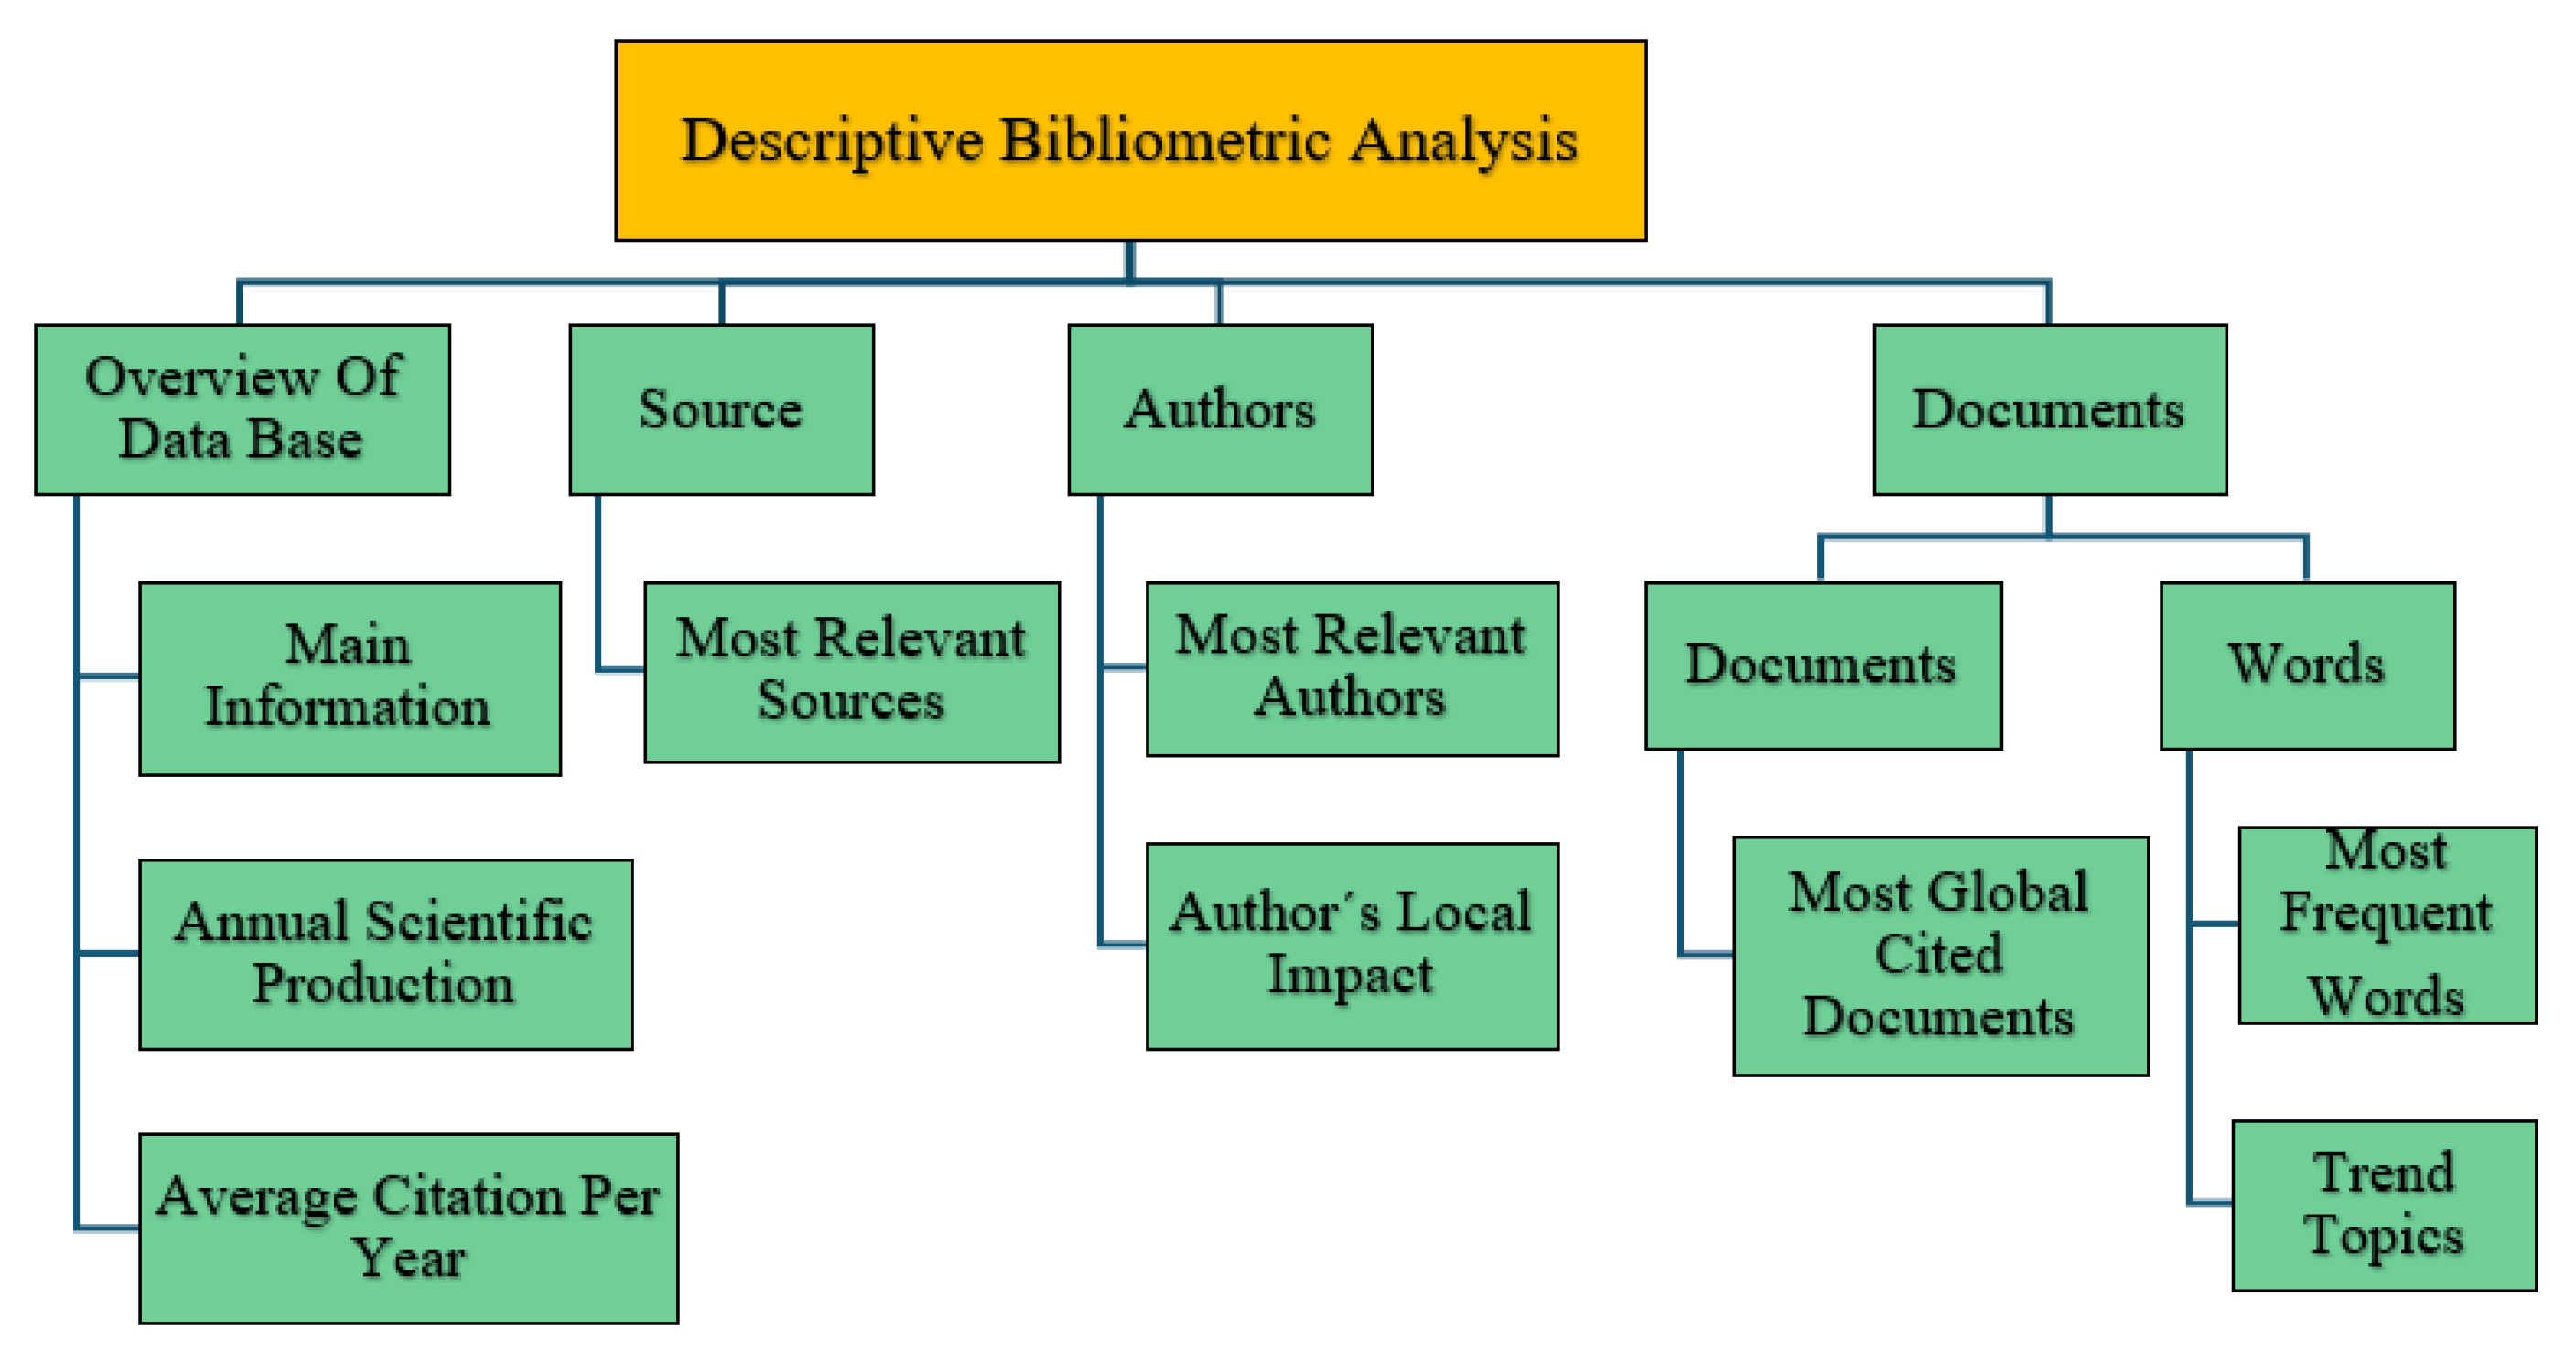
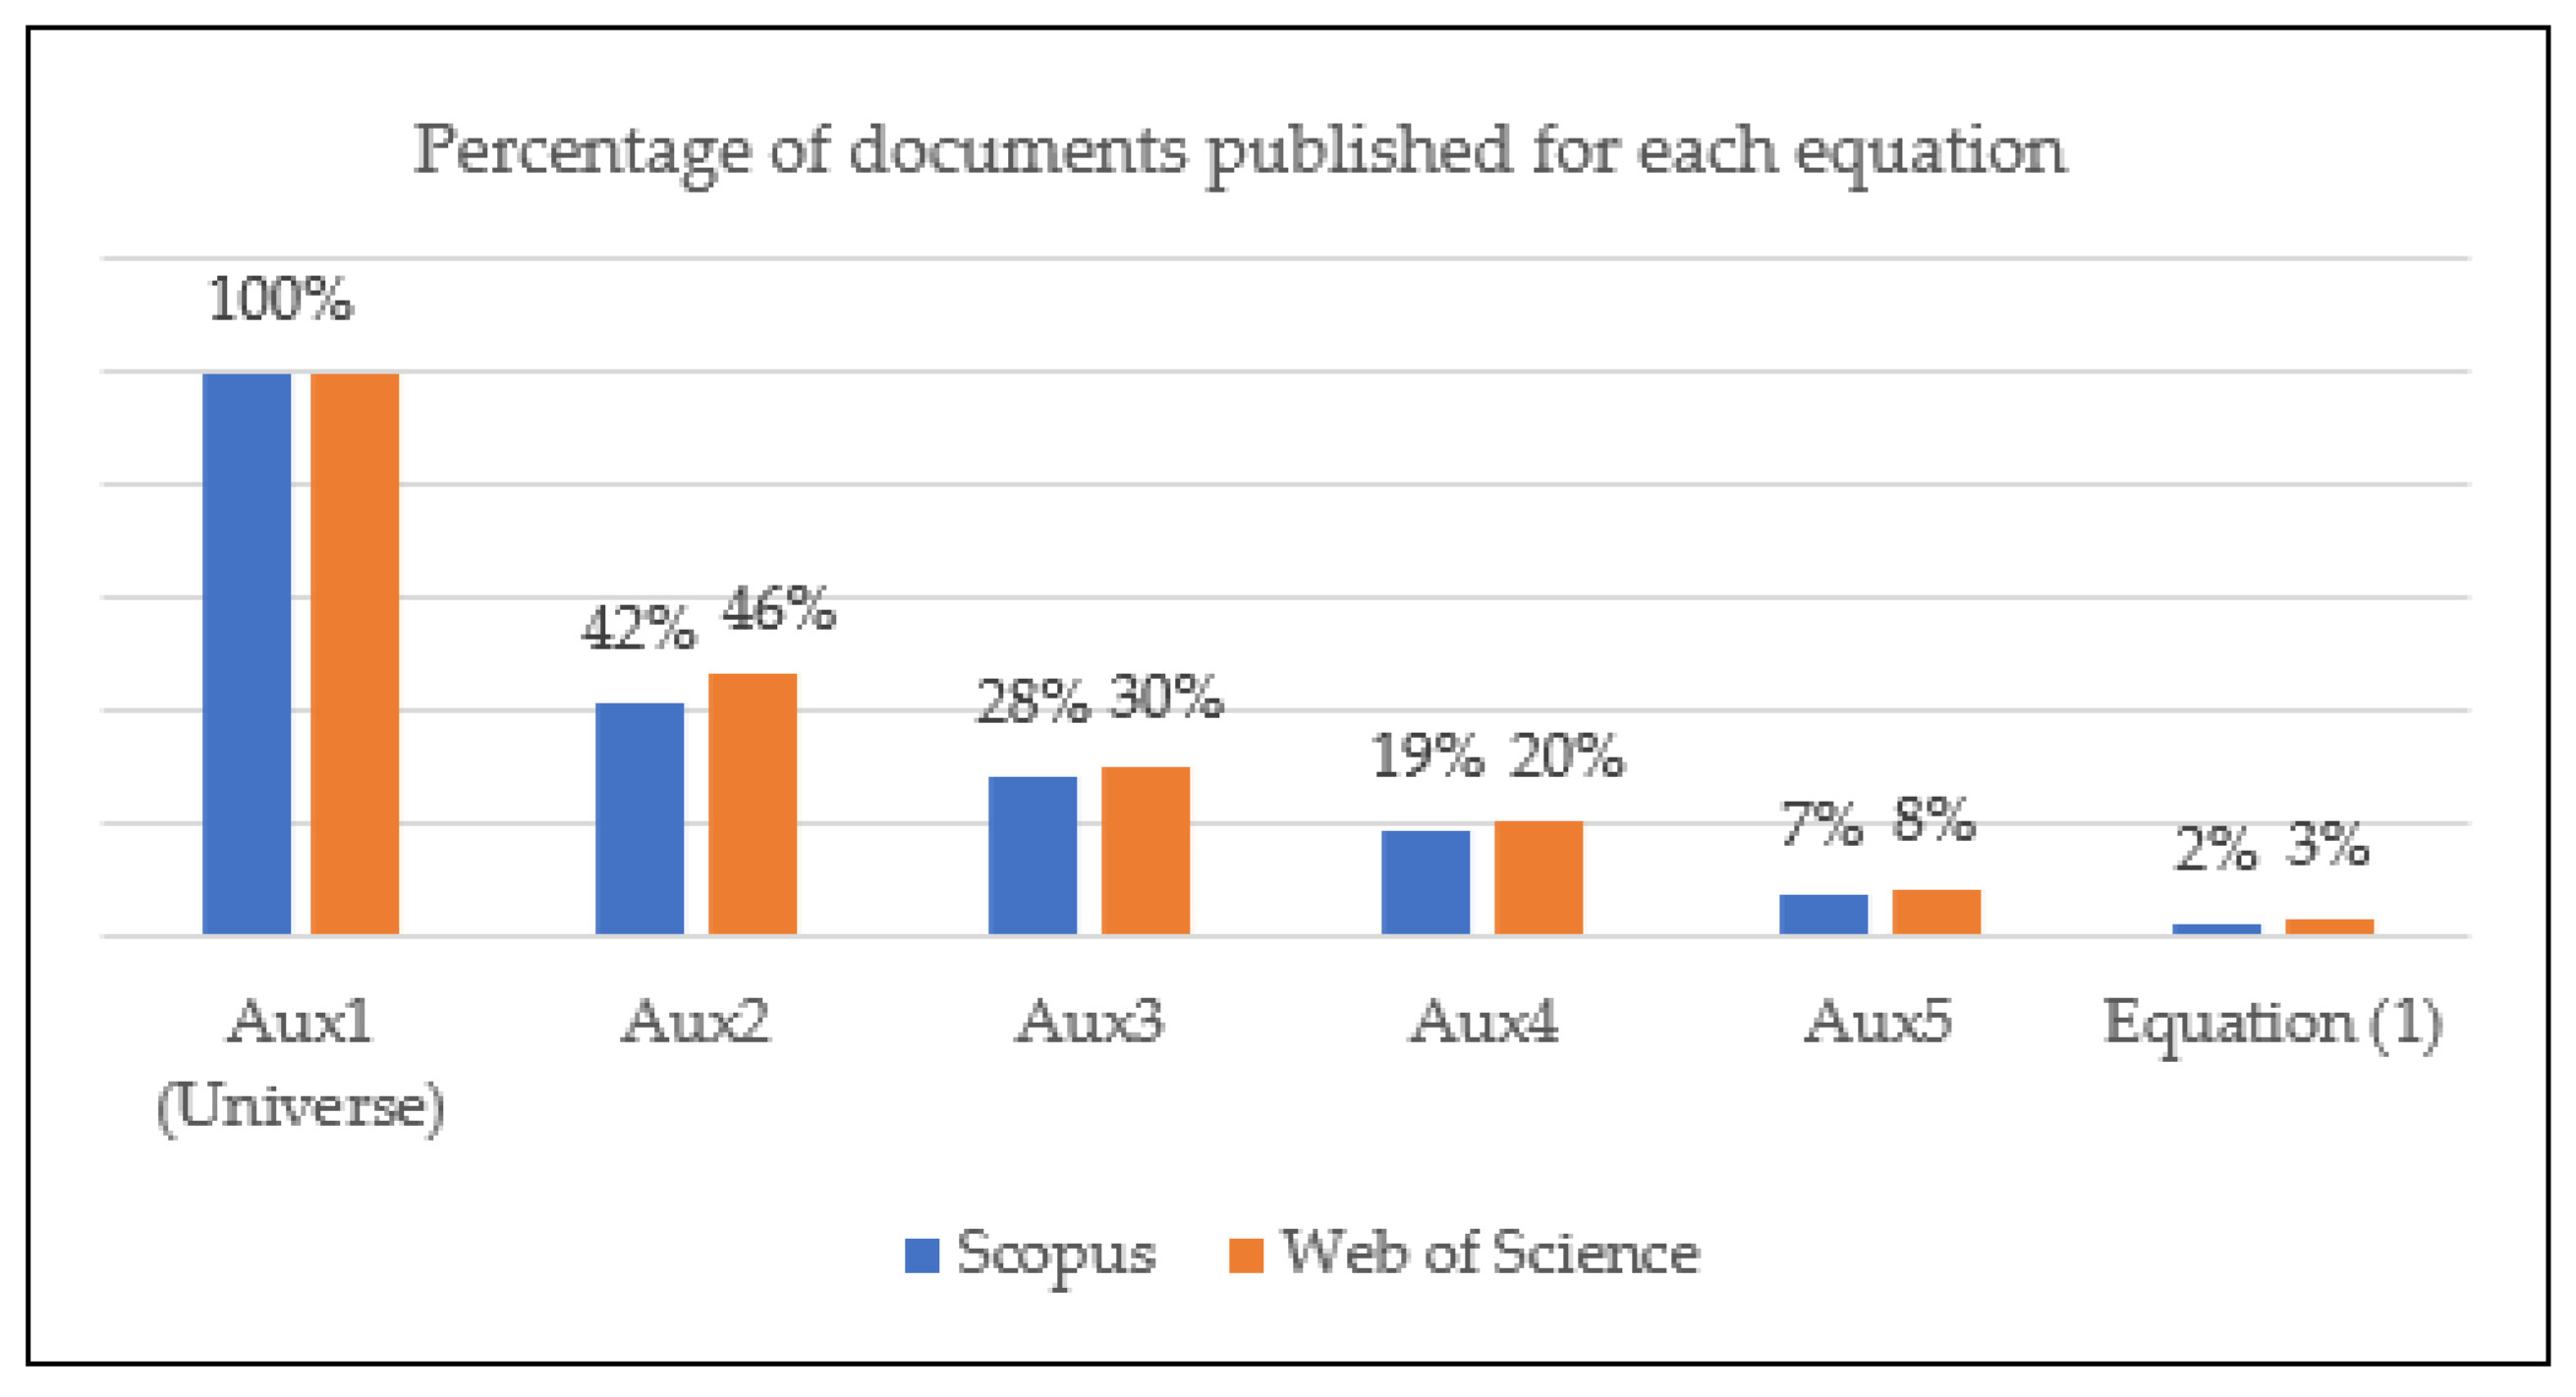
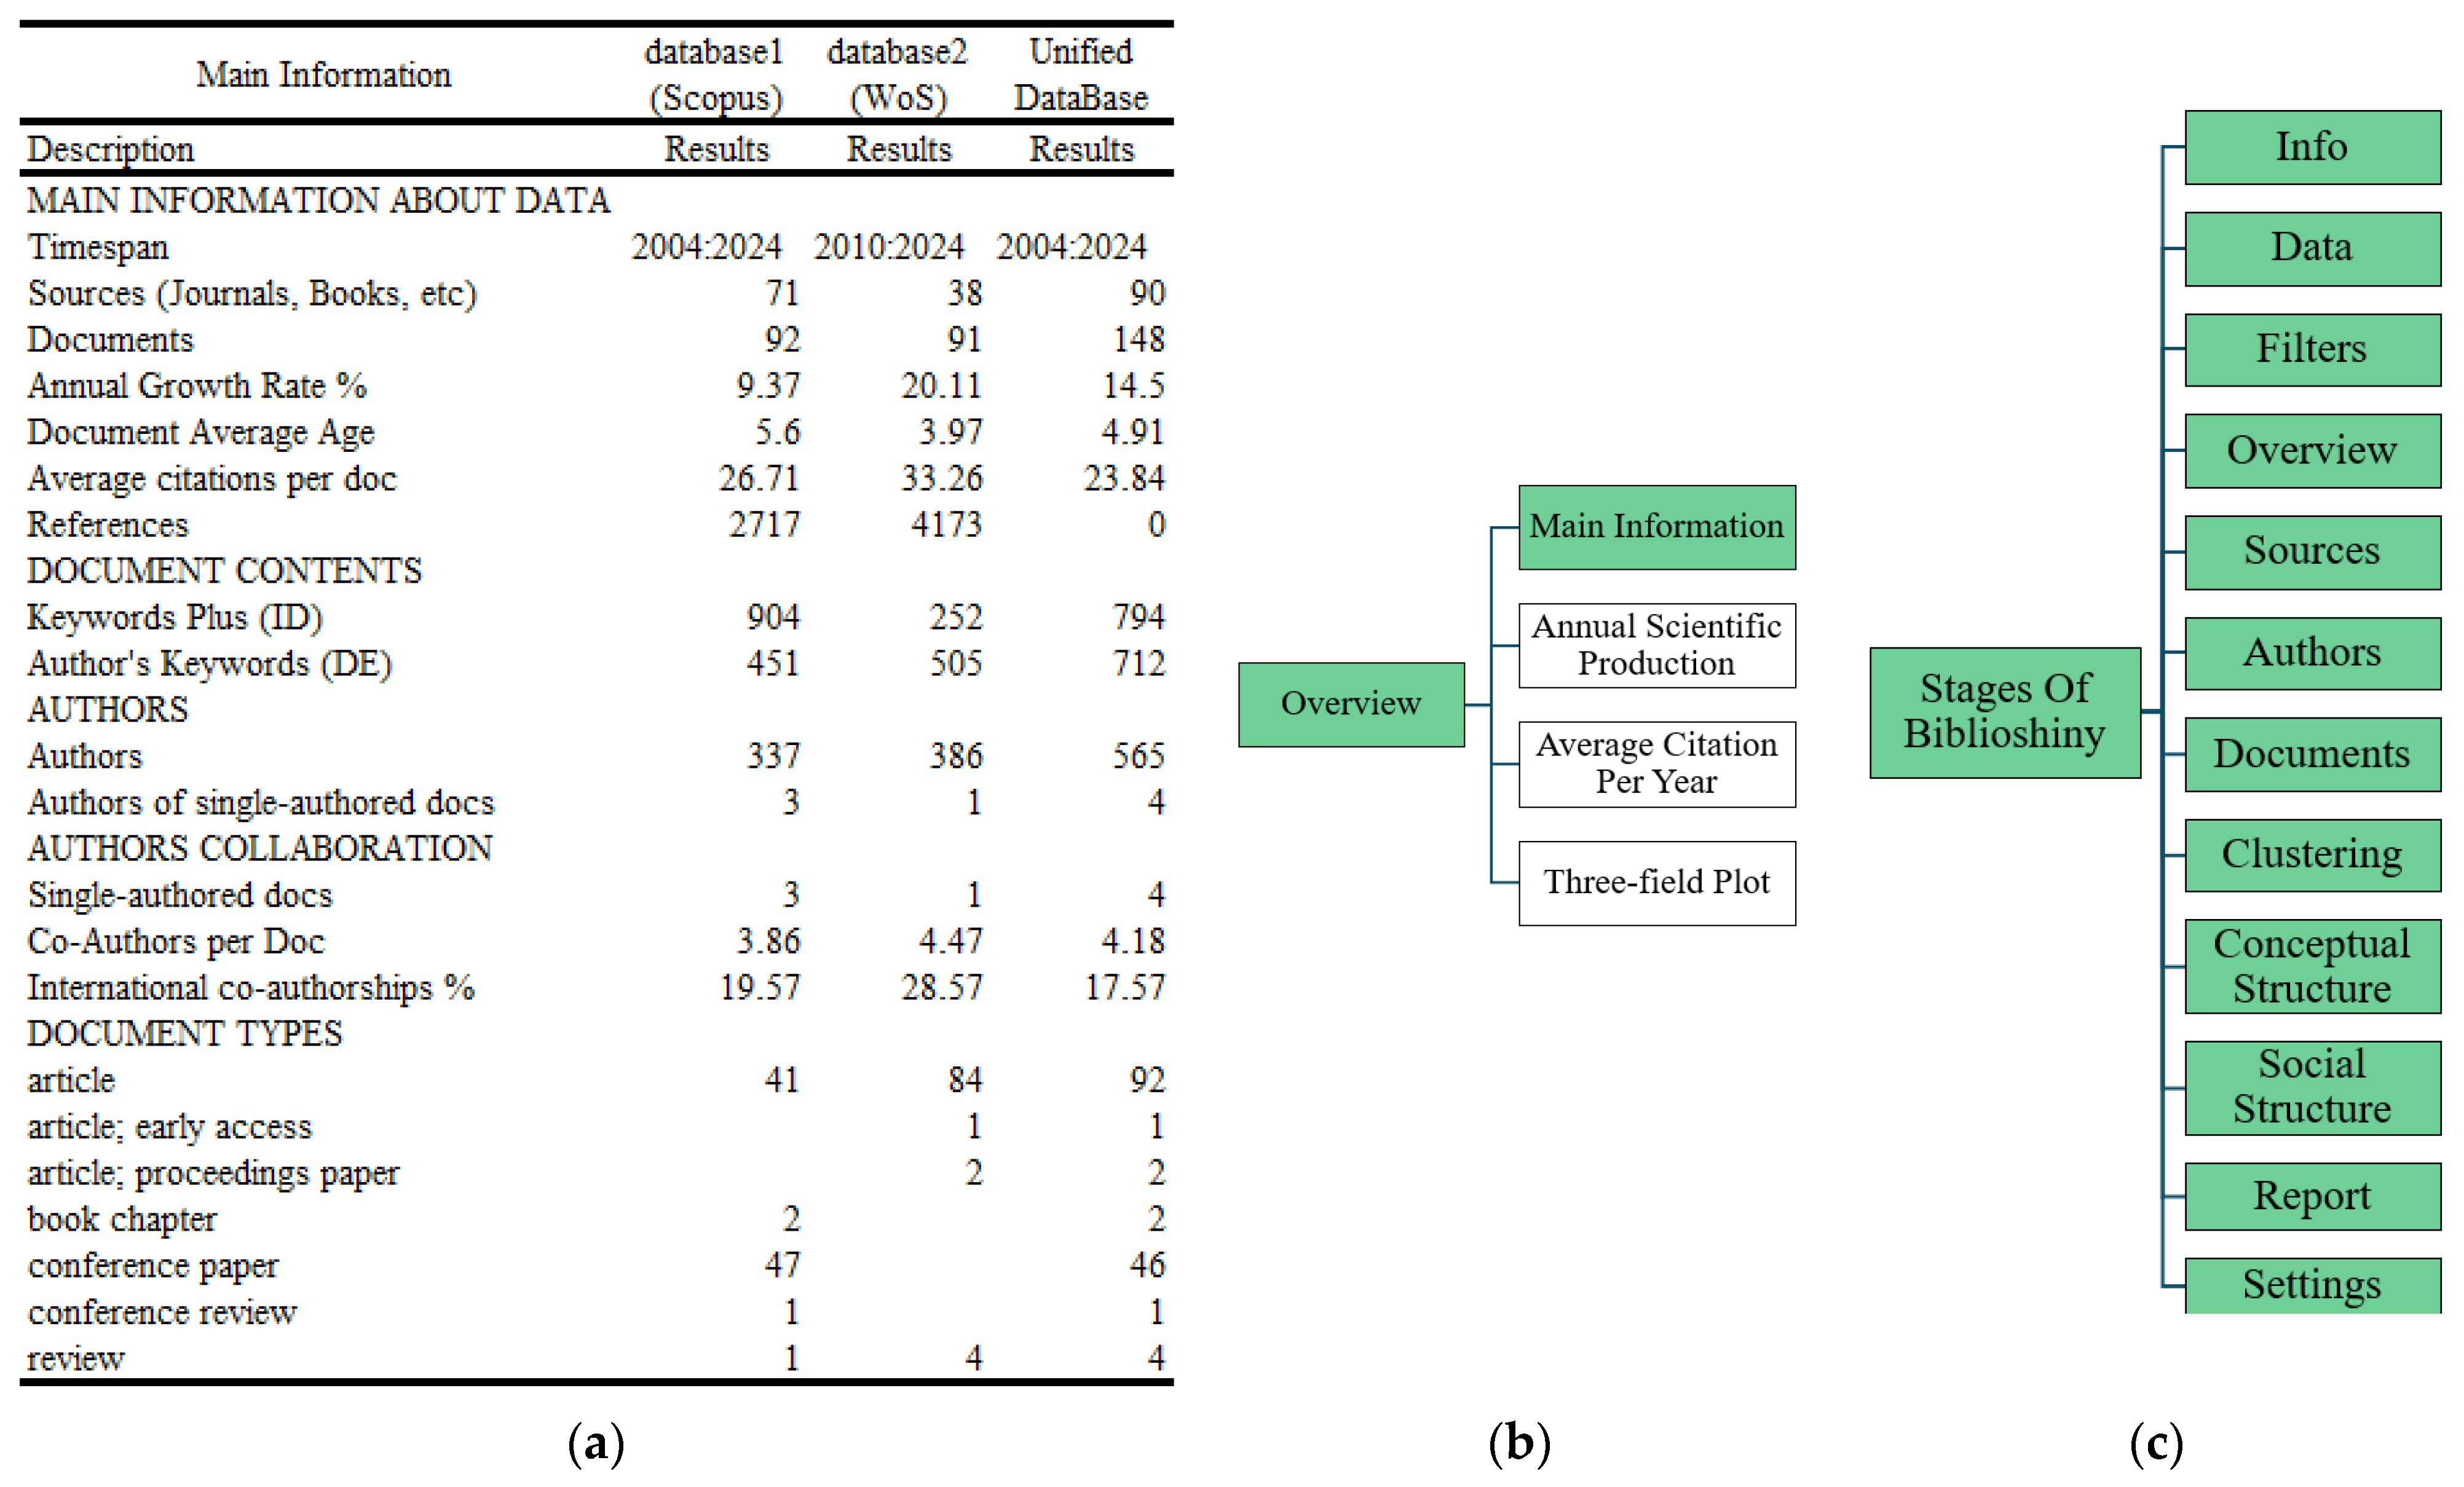
Stage 3.1—Descriptive Bibliometric Analysis. The application of descriptive bibliometric analysis in the proposed methodology was conducted on the unified database, which comprises 148 documents, including articles, reviews, conference papers, and book chapters, as detailed in Figure 4. Statistical tools and bibliometric metrics were applied at the levels of Source, Authors, and Documents, as well as at the sublevels Words and Documents, as illustrated in Figure 5, levels and tools of descriptive bibliometric analysis. This substage is executed directly through the Biblioshiny app, using its hierarchical structure of the tool. However, as part of the extended approach proposed, additional tools such as R, RStudio, and Excel are also incorporated, enabling prior comparative analyses between database1 (Scopus) and database2 (Web of Science). This multi-source integration is particularly valuable in the context of electrical engineering, where it is essential to validate the consistency and complementarity of different types of documents (see, Figure 4). As shown in Figure 6, the number of documents retrieved for each search equation designed in Stage 2.2 is presented. While Aux1 yielded a broad set of results, statistical analysis showed that fewer than 3% of the documents retrieved from both databases simultaneously addressed all thematic components captured by Equation (1). This finding reveals a low degree of research maturity in the specific area of interest and highlights the relevance of applying the proposed methodology.
Although this approach allows for the identification of potential duplication or complementarity among different document types, it is also necessary to consider the inclusion of additional bibliographic data sources, such as Google Scholar, ScienceDirect, and others recognized in specific disciplines. Several bibliometric studies have warned that relying solely on Web of Science and Scopus may lead to biased or incomplete retrievals due to database-specific coverage gaps [1,8,9]. For example, the need to map the limitations of database coverage when conducting science mapping of emerging topics has been explicitly highlighted in [8]. This underscores a major limitation in relying exclusively on Web of Science Core Collection or Scopus: the risk of overlooking discrepancies or uncertainties in bibliometric results caused by domain-specific omissions or metadata inconsistencies.
A relevant methodological aspect is the possibility of extending this stage with data from prior bibliographic studies on the evaluation of technical impacts resulting from DER integration, thereby consolidating a descriptive analysis line that combines quantitative precision with structured qualitative interpretation.
Stage 3.1.1—Overview of Database. As part of the proposed descriptive bibliometric analysis, the “Overview” input tab of the Biblioshiny app was used, as positioned within the hierarchical interface. This substage provided the most representative general information from the individual databases (database1 and database2), as well as from the unified database generated through their merger. This information enables the researcher to obtain a comparative view of the fundamental bibliographic characteristics of both scientific dissemination sources and the consolidated database used for the analysis.
The application of this substage was particularly relevant in the context of the study on the technical impacts derived from the integration of DER into the electrical system, as it provided the initial indicators for determining thematic coverage, predominant document types, and the evolution of interest in the field defined by Equation (1). The information was verified through both manual procedures in Excel and automated reports generated by the Biblioshiny software (August 2024 version), allowing the results from each source to be contrasted with those obtained from the unified database.
Stage 3.1.1.1—Main Information. In this substage, the detailed classification of document types found in the unified database, as shown in Figure 7 and complemented by Figure 4 provides valuable insight into the editorial policies and thematic priorities of the selected scientific sources. This analysis enables researchers to identify not only the most frequent publication formats—such as articles, reviews, conference papers, or book chapters—but also the most suitable channels for scientific dissemination on the specific topic defined by Equation (1). Within the applied context of electrical engineering, this substage becomes essential for determining which type of document may be most appropriate depending on the research scope, whether it involves methodological proposals, technical applications, or regulatory discussions. Moreover, the cross-validation between the automated processing carried out in Biblioshiny and the manual consolidation performed in Excel reinforces the reliability of the dataset and confirms the complementarity between the two bibliographic sources (database1 and database2), thereby establishing the unified database as a consistent and dependable input for subsequent stages of bibliometric analysis.
The consolidated retrieval of document types and quantities, based on the search strategies defined in Stage 2.2, supports an initial descriptive assessment of both the level of academic interest and the maturity of scientific output in the field. As illustrated in Figure 6, only 3% or fewer of the total records retrieved through the preliminary query (Aux1) match the refined criteria defined by Equation (1), which focuses on studies proposing specific solutions to the challenges addressed by the research topic. This finding underscores a critical gap in the literature and reinforces the originality of the proposed methodology, which is grounded in a structured and selective bibliometric filtering process. The interpretation of these results substantiates the methodological rigor applied to the construction of the unified database and highlights how few studies fully comply with the defined criteria for evaluating technical impacts associated with DER integration in electrical systems.
The consolidated overview of document types and volumes across database1, database2, and the unified database is presented in Figure 7, which was generated using the Main Information option within the “Overview” tab of the Biblioshiny app. This visualization plays a strategic role in the proposed methodology by integrating the fundamental bibliographic attributes necessary for comparing the characteristics of both individual databases with the consolidated results. The consistency achieved through cross-verification—between manual data collection and automated reports—ensures traceability and confirms the structural integrity of the dataset, providing a robust foundation for the bibliometric analyses developed in the following stages.
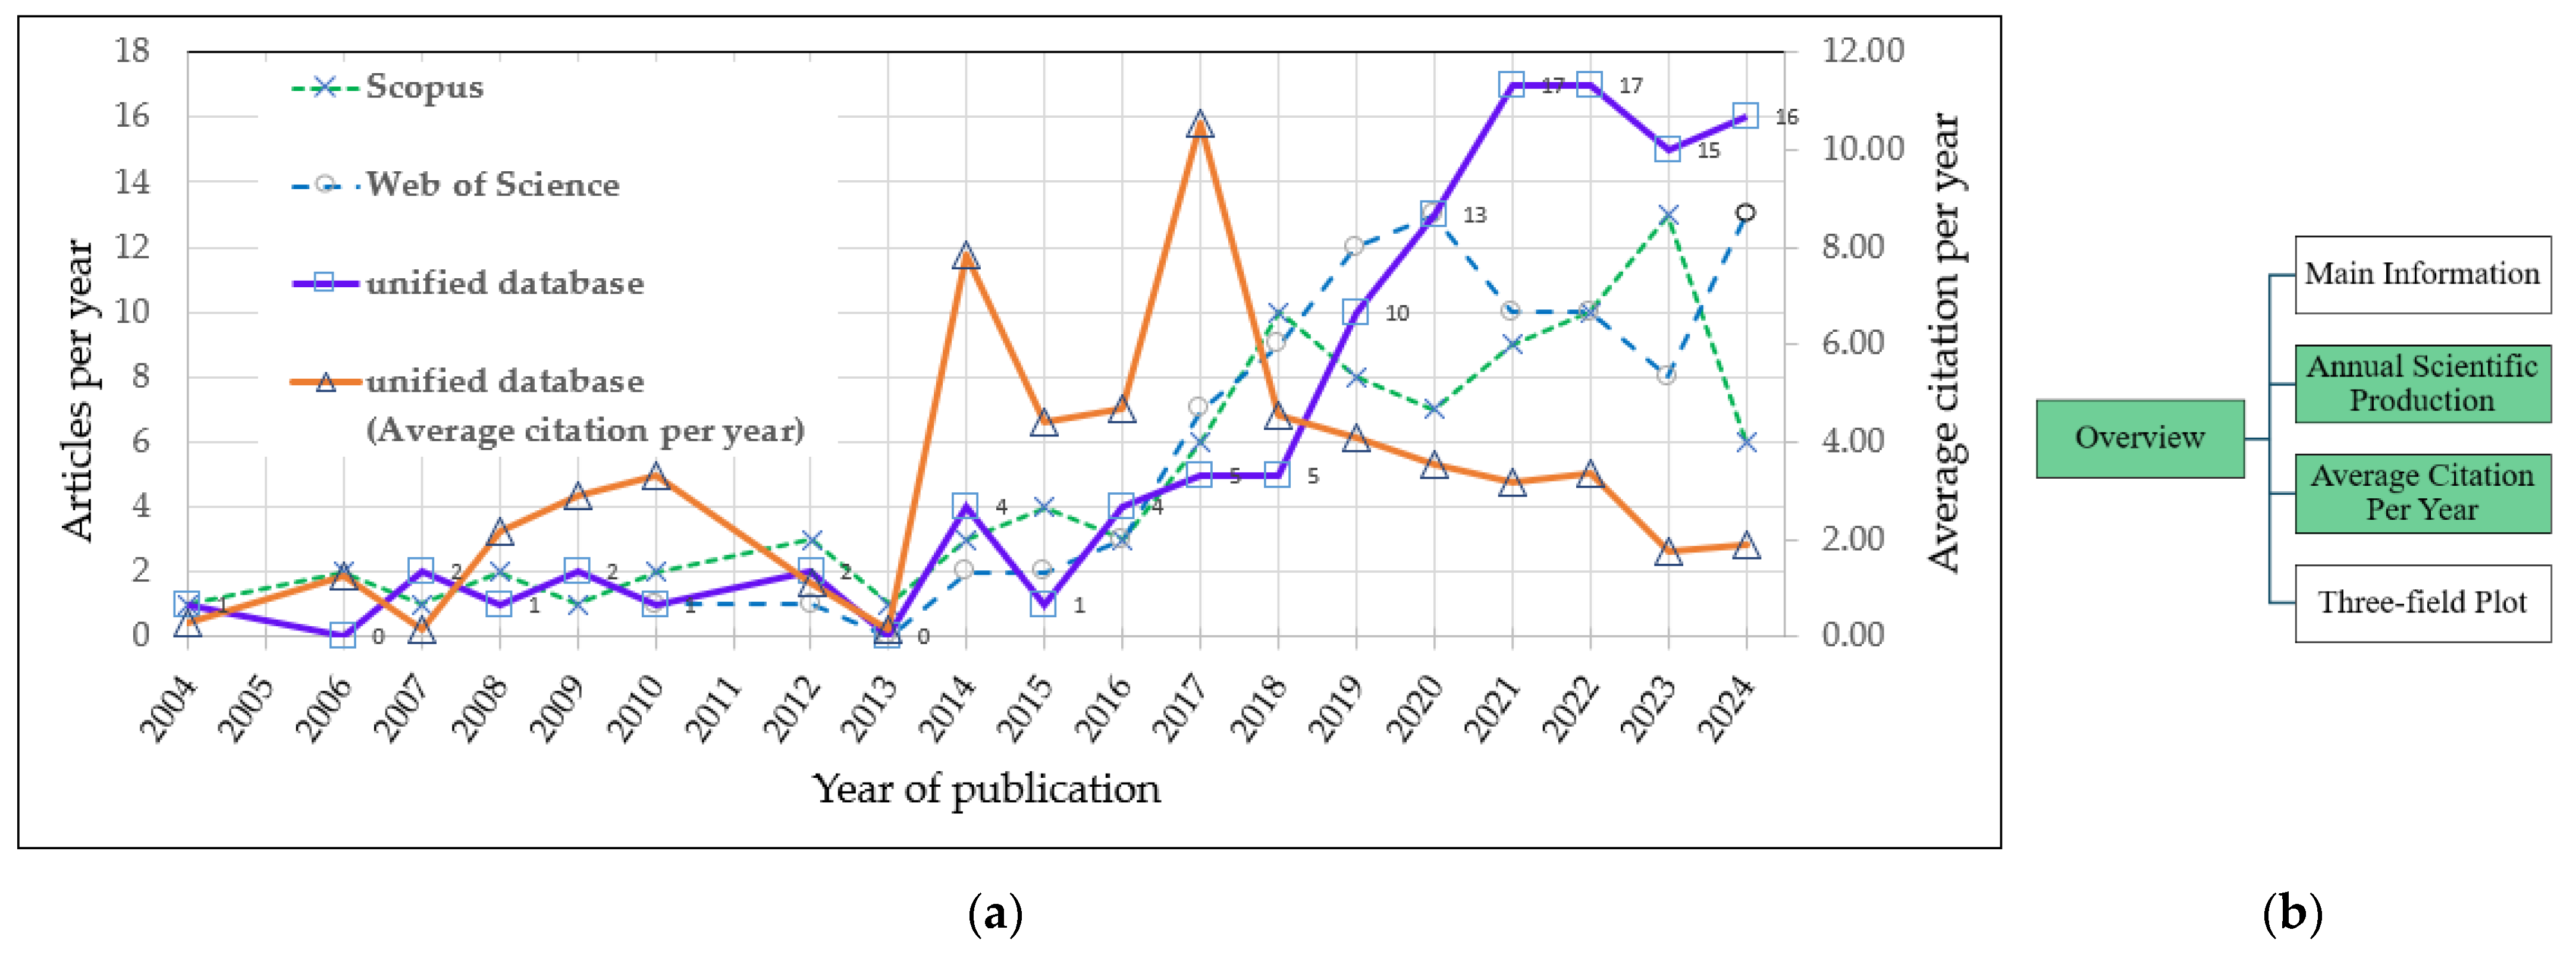
In Substage 3.1.1.2—Annual Scientific Production and Substage 3.1.1.3—Average Citation per Year Published, the evolution of publications between 2004 and 2024 is analyzed to assess global interest in the topic addressed by Equation (1). This analysis was carried out using R scripts and spreadsheet tools and was cross-validated through the “Annual Scientific Production” tab available in the Biblioshiny interface. The results are shown in Figure 7 which displays the annual number of scientific documents extracted from database1, database2, and the unified database.
The annual growth trend reveals an increasing number of contributions on the subject, with particular emphasis over the last decade. Moreover, the Annual Percentage Growth Rate (APGR), calculated from the source databases for Figure 8, shows values of 9.37% for Scopus, 20.1% for Web of Science, and 14.5% for the unified database, according to the information presented in Figure 7. These indicators, along with the observed increase in the average number of citations per year during 2014 and especially 2017, reflect not only a growing academic interest in addressing the challenges related to distributed energy resources (DERs), but also partially correspond to the structural expansion of Web of Science and Scopus coverage. This trend aligns with the international urgency to strengthen sustainable energy systems and guide technical proposals toward effective integration models [12].
Substage 3.1.4.1—Most Globally Cited Documents and Substage 3.1.4.2—Most Frequent Words. In the proposed methodology, the results obtained in these substages enable an evaluation of the effectiveness of the bibliometric strategy by comparing the retrieved dataset with those documents identified as the most statistically relevant. Substage 3.1.4.1 focuses on globally cited documents, allowing for the validation of whether the refined search expressions (e.g., Equation (1)) successfully retrieve high-impact references in the field. Substage 3.1.4.2, conducted alongside 3.1.4.1 within the Bibliometrix environment (Biblioshiny app), identifies the most frequently used terms across the corpus. When using “Abstract” as the unit of analysis, this substage becomes particularly valuable for exploring potential methods, strategies, or alternative solutions proposed by the authors themselves. Together, these substages reinforce the diagnostic capacity of the proposed methodology by combining relevance-based validation and thematic exploration.

3.3.1. Trend Topics

In the substage 3.1.4.3—Trend Topics, a descriptive analysis is conducted to identify, over the time range 2004–2024, the main topics and research areas linked to Equation (1).
This substage is critical within the proposed methodology, as it enables tracking the annual emergence, evolution, and frequency of research themes using three analytical dimensions: Keywords Plus—to capture the emergence of new topics; Abstracts—to identify solution-oriented developments; and Authors’ Keywords—to detect thematic orientations directly declared by researchers.
The analysis was performed using the “Trend Topics” tab of the Biblioshiny interface, applying it to the data extracted from the unified database. This step enables the detection of statistically relevant emerging topics that are gradually gaining traction in the scientific community and sets the foundation for identifying whether these trends have been addressed with concrete proposals—or whether they remain as underexplored opportunities in the research agenda.

3.3.2. Trends and Annual Frequency of Occurrence of Emerging Research Topics

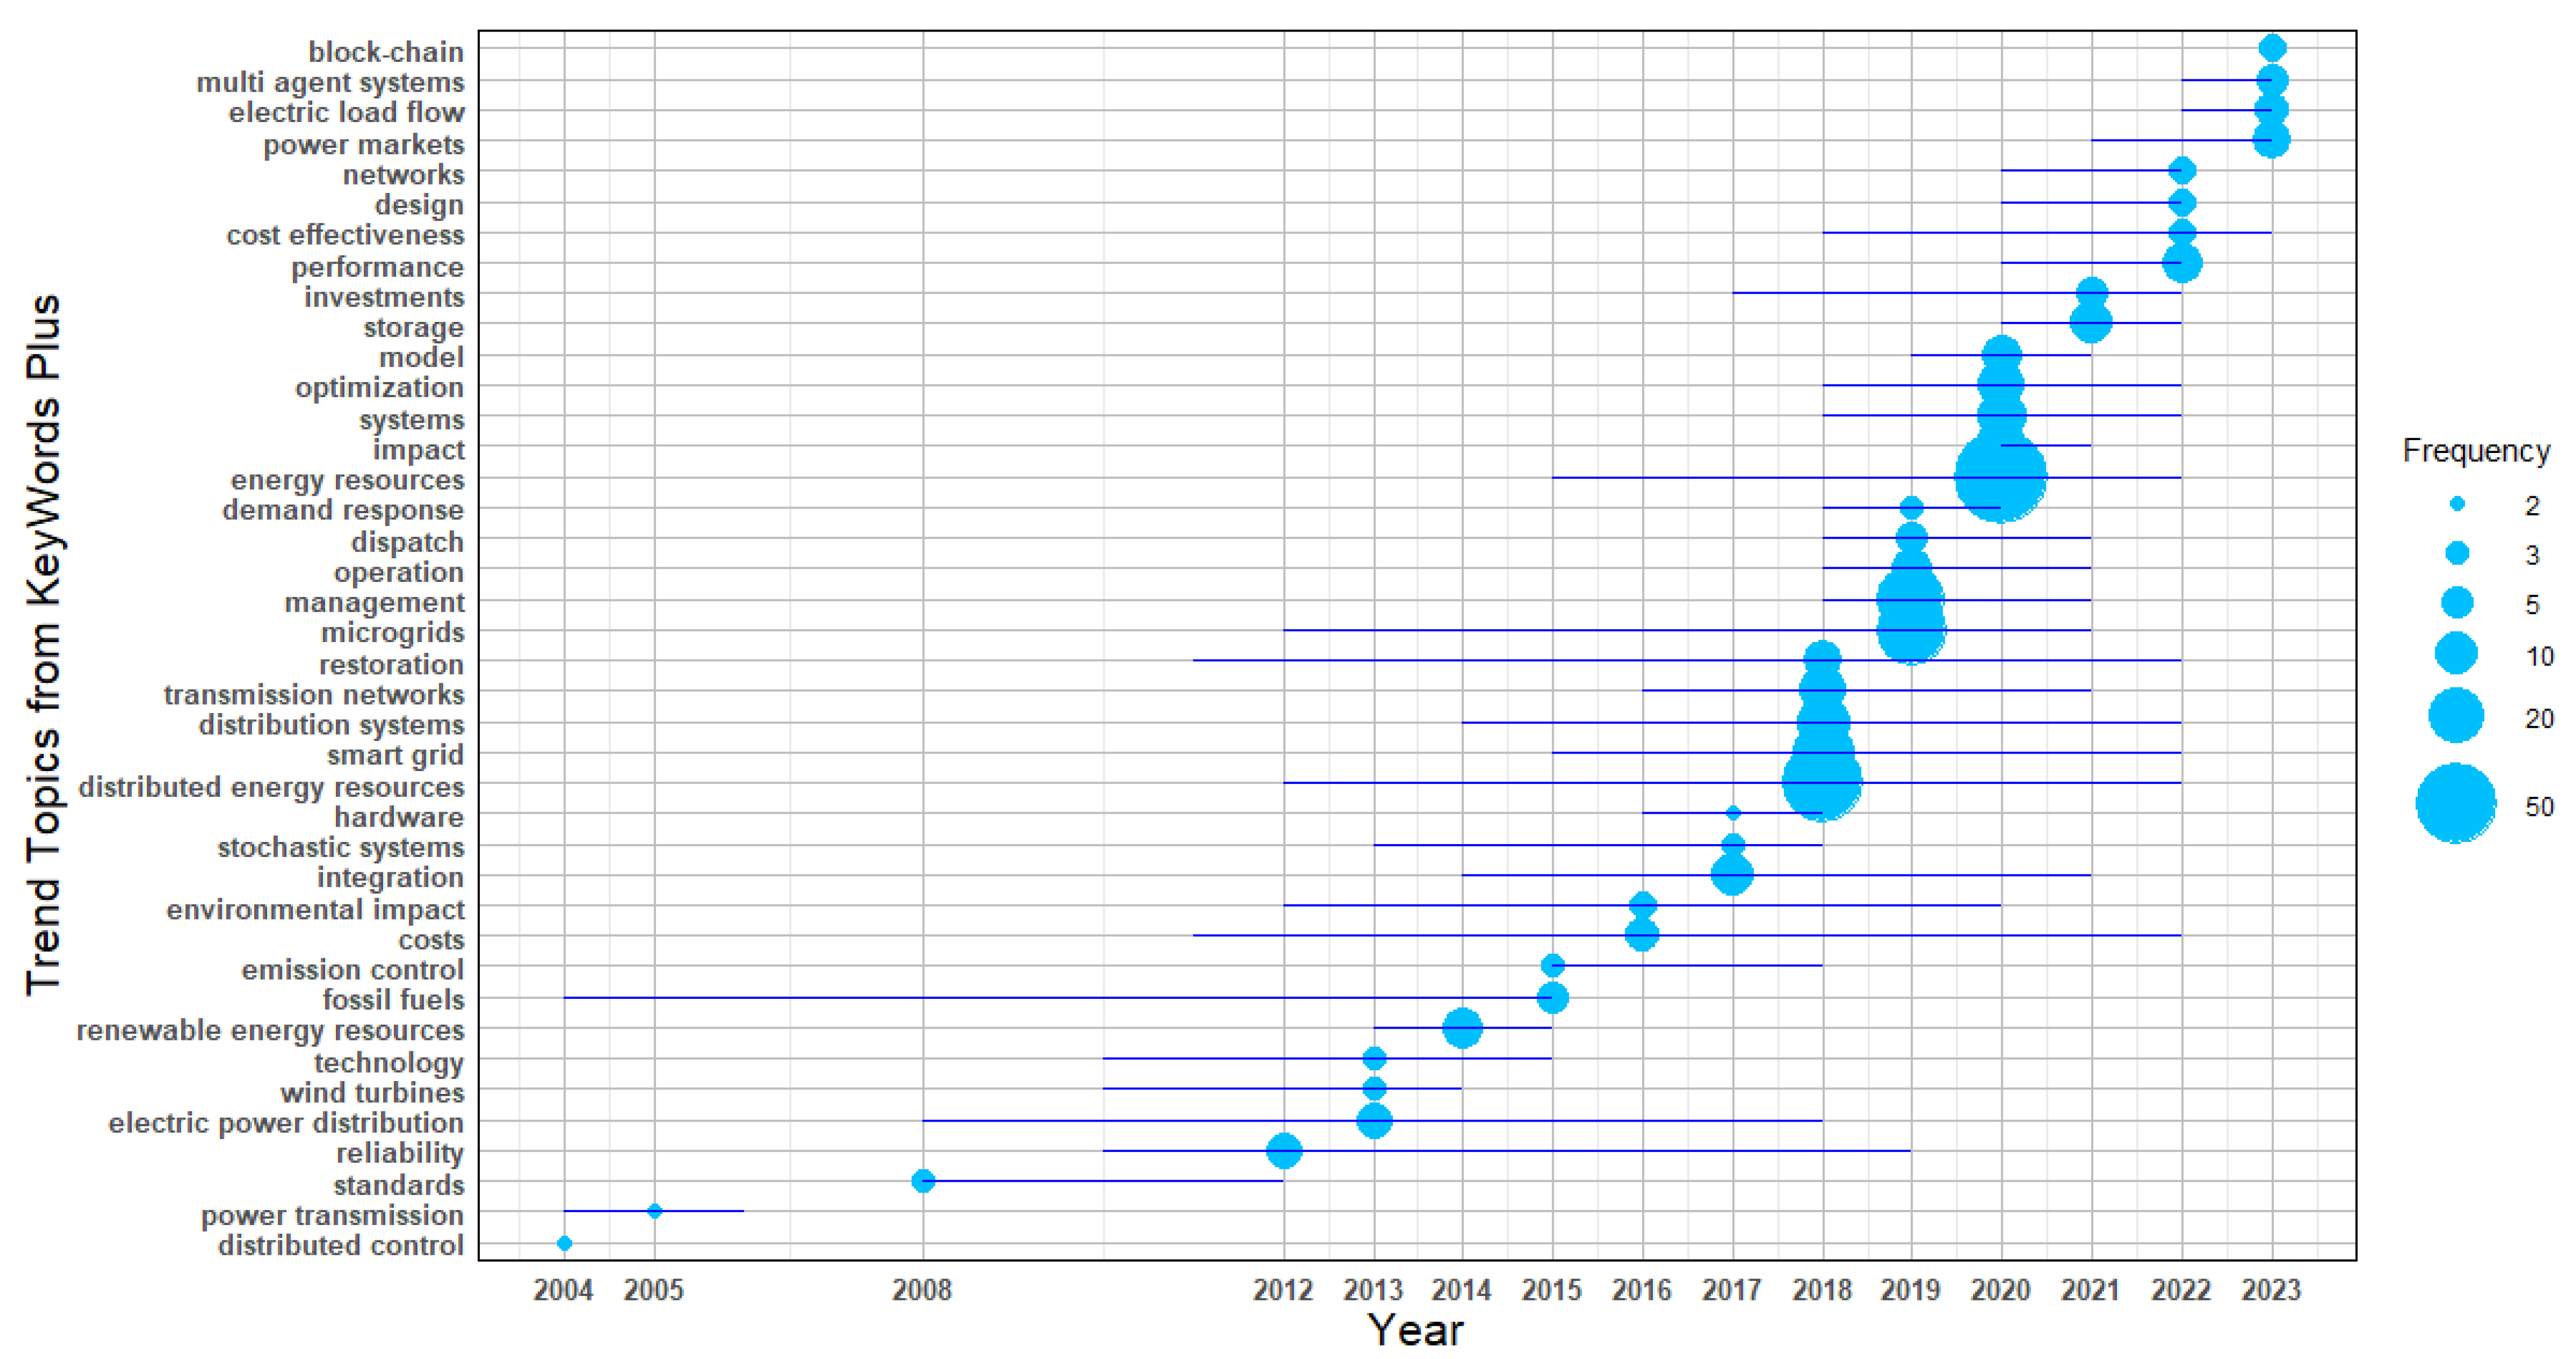
The results corresponding to substage 3.1.4.3.1 are presented in Figure 9, which illustrates the annual frequency and emergence of the most statistically significant Keywords Plus between 2004 and 2024. These terms reflect globally relevant research challenges that evolve over time and stimulate scientific production aimed at generating solution-oriented contributions.
In this substage, the unit of analysis is Keywords Plus, which enables the identification of new research directions and emerging topics within the current scientific literature. This stage is essential for assessing whether such emerging themes have been addressed through specific proposals, an aspect analyzed in the following substage through the study of Abstracts, or whether they remain as unresolved research opportunities.
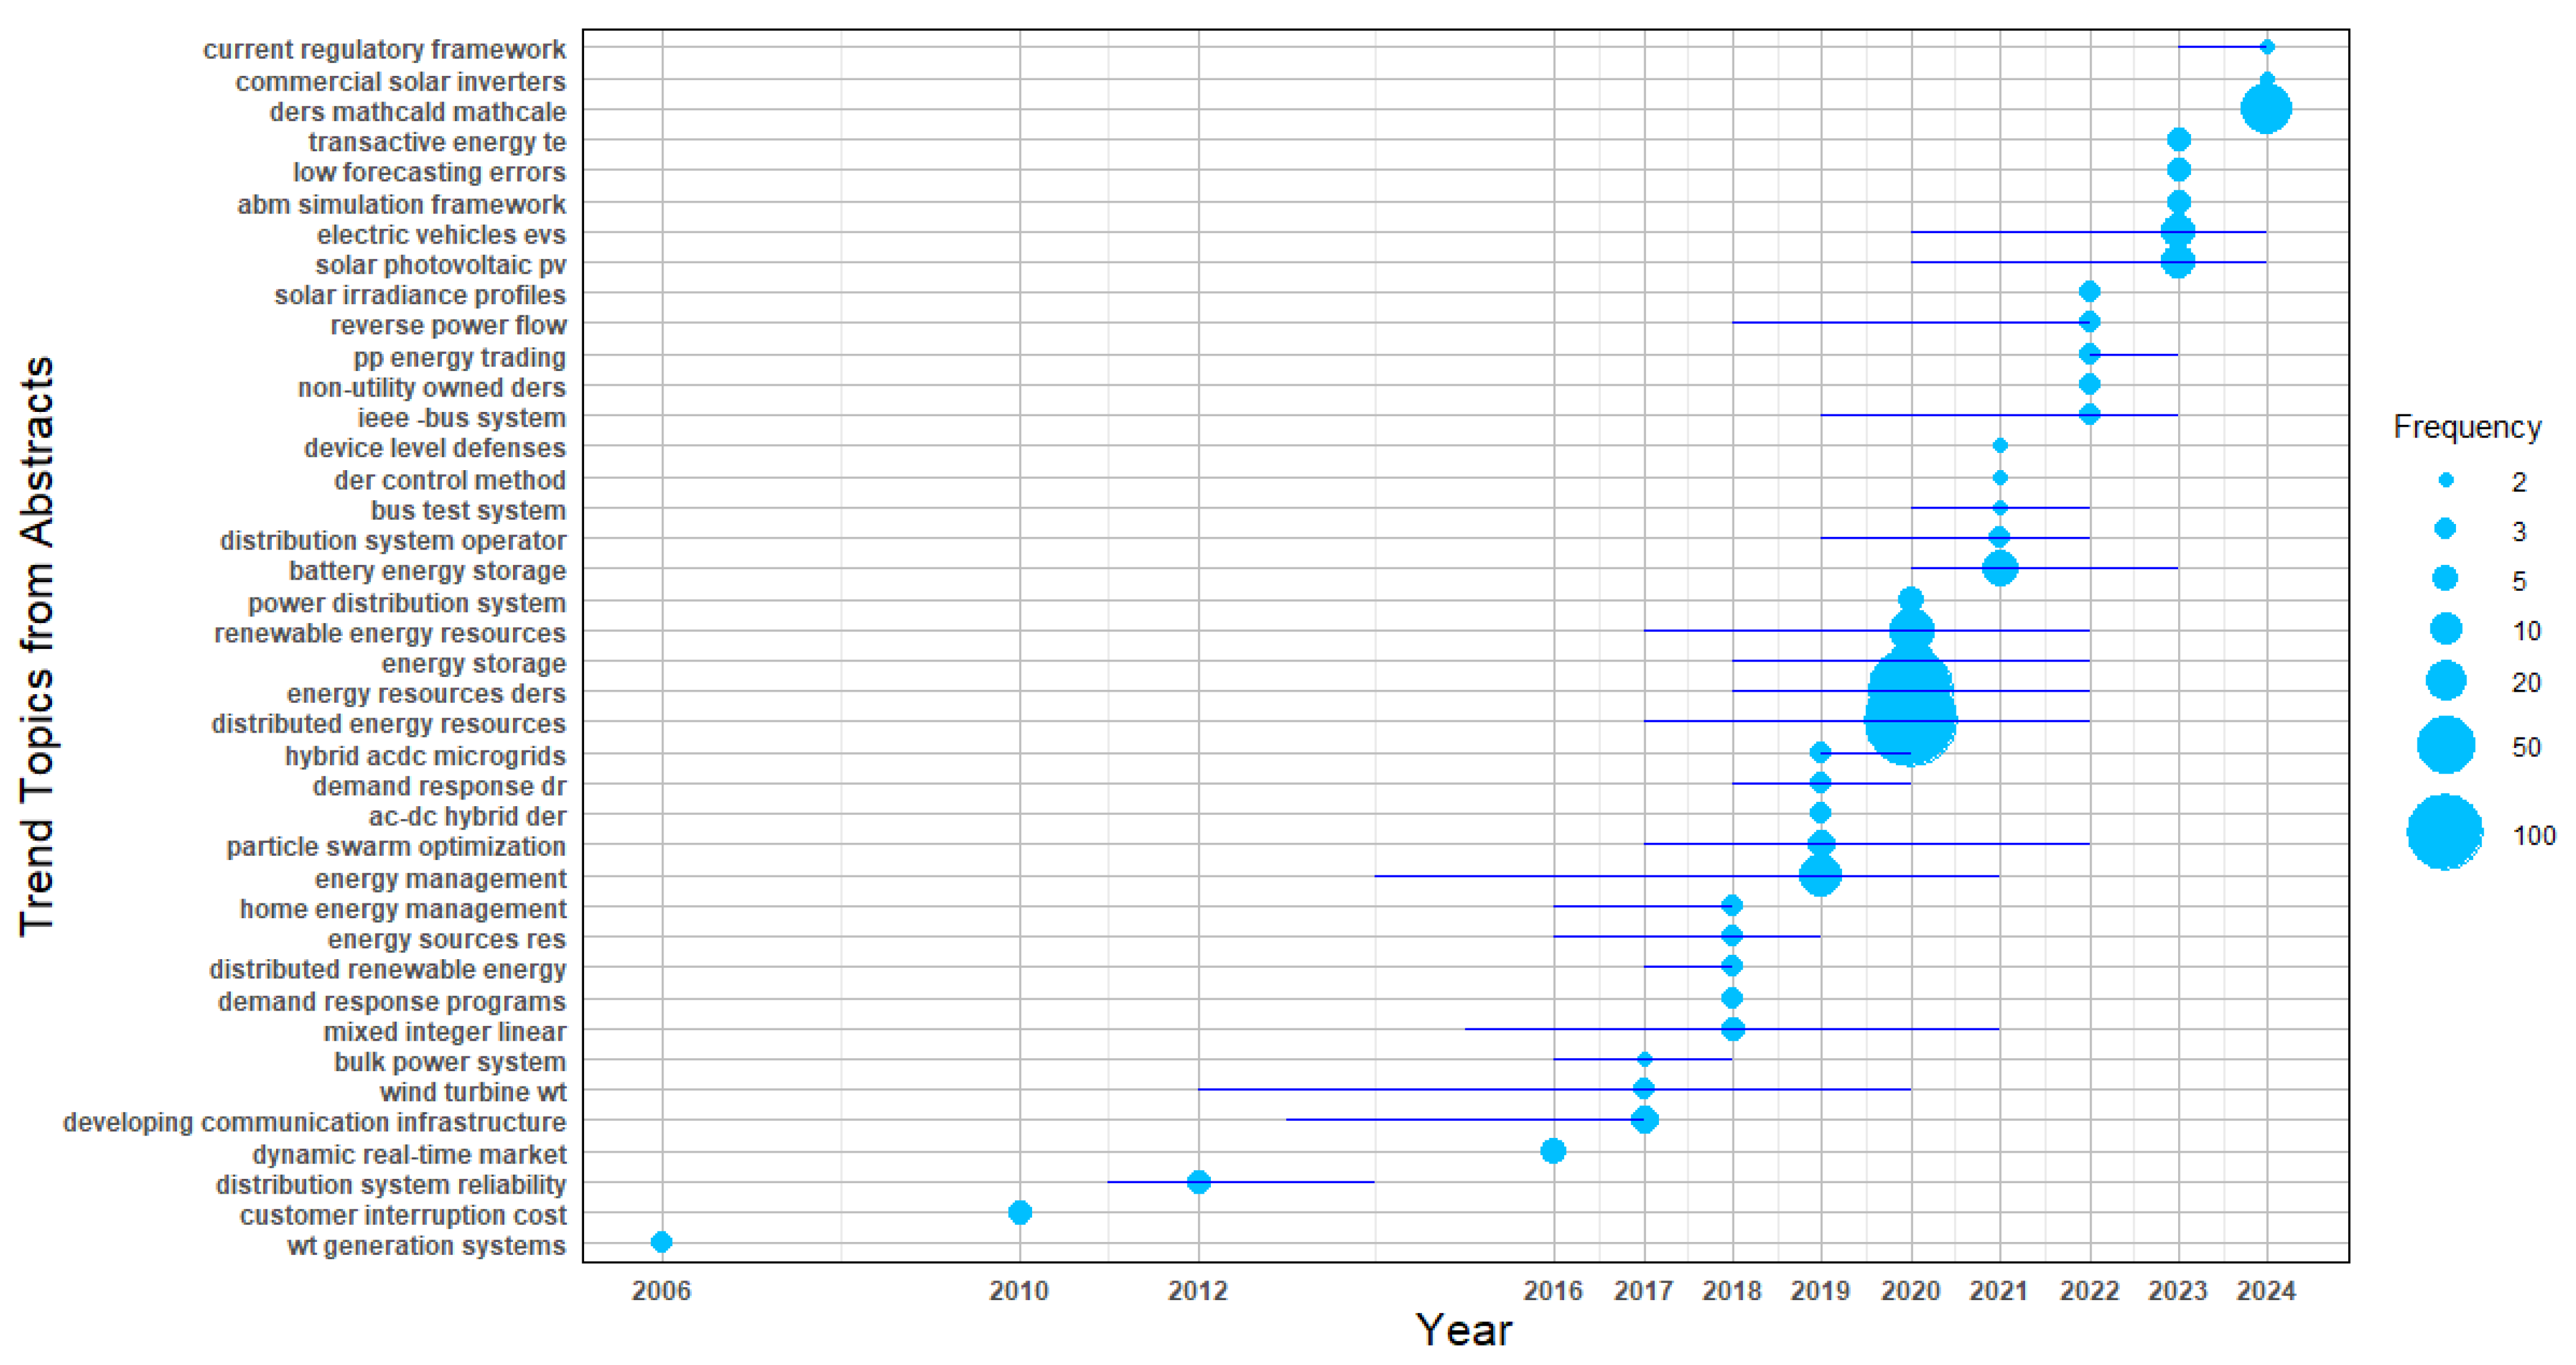
The results corresponding to substage 3.1.4.3.2 are shown in Figure 10, which presents the most statistically relevant terms extracted from abstracts, corresponding to research topics developed as solution proposals and disseminated annually between 2004 and 2024. This analysis allows a direct comparison with the previous substage 3.1.4.3.1, making it possible to identify which emerging topics have been addressed and which remain unexplored. The unit of analysis is the Abstract, offering a direct view of how the scientific community has responded to the challenges previously identified through Keywords Plus.
This comparative approach is essential for detecting gaps in the literature and supports the subsequent stages of the proposed methodology, focused on mapping conceptual structures and identifying potential areas for future research.
In Stage 3.2—Matrix Creation and Normalization, the software Bibliometrix (Biblioshiny app) performs the internal generation of a document-by-attribute matrix that defines the relationships necessary to build bibliometric networks. This matrix structure allows for the creation of analytical models used in subsequent stages to explore conceptual, intellectual, and social structures. Each document is associated with its corresponding attributes—such as authors, affiliations, citations, and terms—which are then processed using normalization algorithms that reduce distortions caused by inconsistent naming, duplication, or linguistic variation. Stage 3.2.1– Network Matrix Creation. This normalization step ensures statistical consistency across the dataset and is essential for executing reliable network extraction techniques, which form the foundation for the structural analysis. By maintaining data integrity and ensuring uniformity in attribute associations, this stage supports the construction of high-quality conceptual maps and cluster analyses that reflect the actual scientific dynamics within the unified database, aligned with the research topic defined by Equation (1).
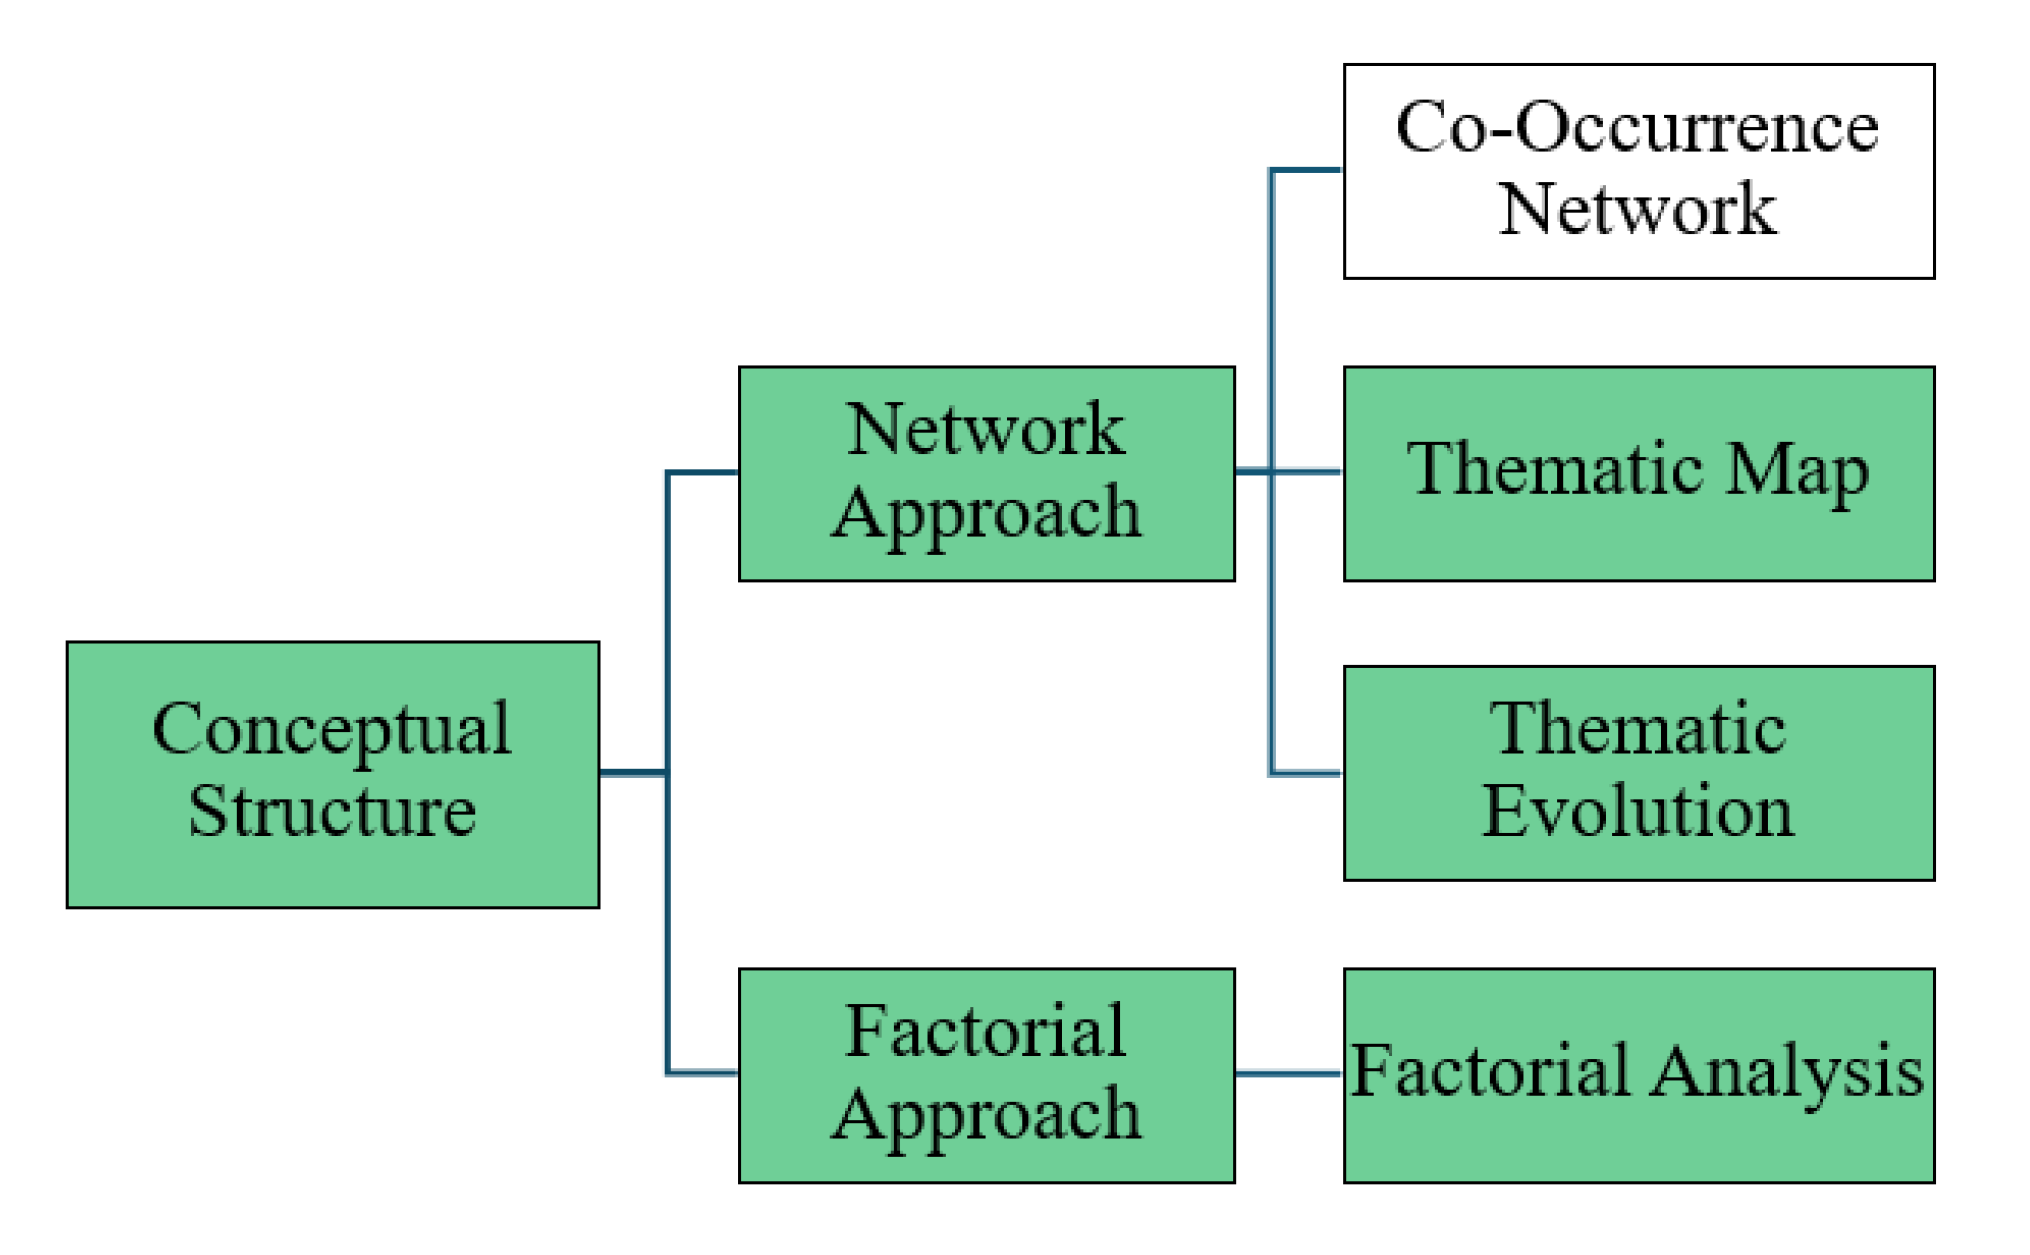
In Stage 3.2.1.1—Conceptual Structure, the goal is to identify the most recent and innovative research developments related to the topic defined by Equation (1). This substage is essential to the proposed methodology because it enables a direct comparison between the trending topics identified through descriptive analysis (via Keywords Plus in Trend Topics) and the deeper thematic relationships emerging from network extraction techniques. Using the tools available in Biblioshiny, the conceptual structure is built from the document-by-attribute matrix created and normalized in Stage 3.2. These analyses are performed within the “Conceptual Structure” tab of the software and accessed through the “Network Approach” functions, specifically through the “Thematic Evolution”, “Thematic Map”, and “Factorial Analysis” input options, as shown in Figure 11. This stage contributes to identifying conceptual clusters and thematic trends over time, allowing researchers to detect which emerging topics are supported by cumulative scientific contributions and which remain underexplored. The ability to visualize how topics converge or diverge provides strategic insight for defining potential research directions and reinforces the methodological value of integrating both descriptive and structural perspectives.

3.3.3. Thematic Evolution

In Stage 3.2.1.1.1—Thematic Evolution, data mining and cluster analysis techniques are applied to observe how key research topics (based on Keywords Plus) evolve in terms of relevance and connectivity across multiple time periods. This substage is particularly important in the proposed methodology because it enables comparison between the outcomes of descriptive trend analysis (Stage 3.1.4.3.1) and those derived from structural network analysis. The Thematic Evolution function is located under the Network Approach menu within the Conceptual Structure stage of Biblioshiny, as shown in Figure 11.
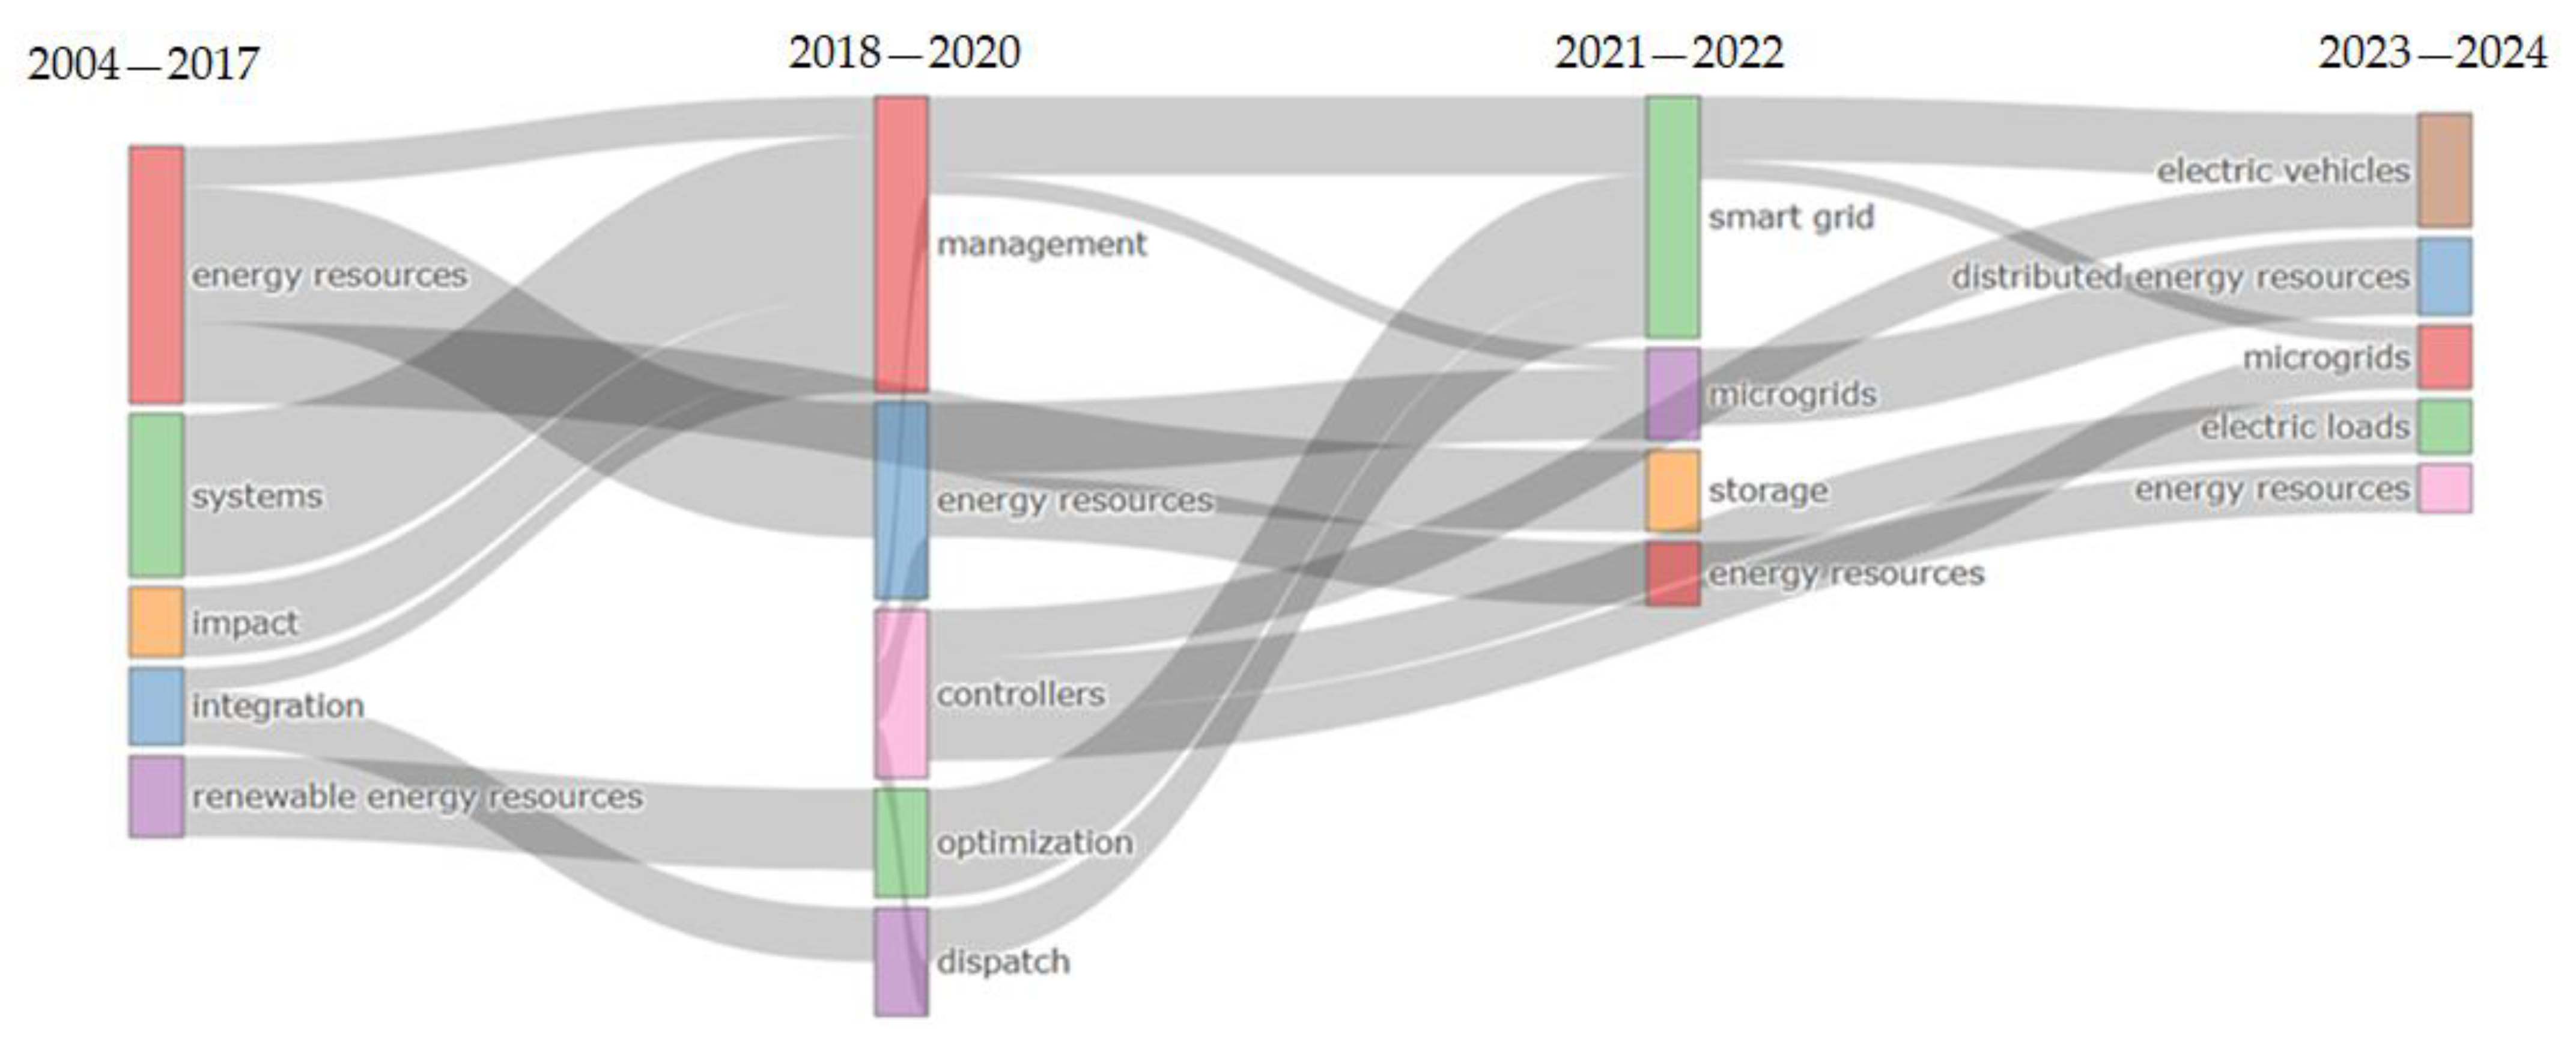
This analysis allows the classification of themes into four strategic types—Emerging, Niche, Motor, and Basic—based on their level of development (density) and centrality. The software automatically segments the analysis period (2004–2024) into customizable time slices and applies clustering algorithms (Walktrap) to organize thematically coherent keyword clusters. The configuration used in this methodology prioritizes maximum coverage and granularity, adjusting frequency thresholds and algorithmic parameters to reveal underexplored or emerging topics within the research domain defined by Equation (1). The evolution of these clusters over time is visualized in Figure 12.

3.3.4. Thematic Map

In Stage 3.2.1.1.2—Thematic Map, as in Thematic Evolution, the proposed methodology applies data mining and network clustering techniques to examine how research topics defined by Equation (1) have been positioned within the scientific discourse between 2004 and 2024. This substage allows for the visualization of thematic clusters derived from the unified database using the indicators of centrality (betweenness, closeness, PageRank) and density. Its methodological relevance lies in two distinct contributions: first, generating a second refined list of potential topics for future work (stage II); and second, classifying documents by types of impacts according to their statistical association with the dominant themes in each cluster. In this case, the unit of analysis is the Abstract, and the processing is performed using the “Thematic Map” tab within the “Network Approach” section of Biblioshiny, as shown in Figure 13.
For the proposed methodology, the configuration applied in Biblioshiny prioritizes thematic specificity and interpretability. The analysis is conducted using Abstracts as the field, configured with Trigrams to capture researcher-declared actions related to Equation (1). Text preprocessing includes the use of curated stop-word and synonym lists, and the parameters are set to ensure analytical granularity (number of words = 794; minimum cluster frequency = 1 per thousand documents; number of labels = 3). The clustering algorithm WalkTrap is used to group terms into meaningful clusters. The output consists of three datasets extracted from Biblioshiny: 133 terms, 23 clusters, and 148 documents, respectively. By comparing the trigrams extracted in this substage (Thematic Map) with the Keywords Plus obtained in Trend Topics, the methodology identifies the subset of trending topics that remain unaddressed in the abstracts. These are consolidated in a second list of potential topics for future work (Stage II).
In the second part of this substage, the methodology focuses on classifying documents from the unified database based on their statistical contribution to the thematic clusters generated in Thematic Map. The classification is performed by evaluating the normalized frequency score assigned to each document within a given cluster (freq > 0), indicating its relevance to a specific impact area. The resulting grouping reflects the structural relationship between the documents and the main research topics extracted via the WalkTrap clustering algorithm. This classification enables the identification of 148 documents distributed across 23 thematically coherent clusters, providing a structured overview of the most relevant scientific contributions addressing the technical impacts of DER and microgrid integration, as defined by Equation (1).
In Stage 3.2.1.1.3—Factorial Analysis, a statistical technique is applied to identify the most significant contributions within the unified database by simplifying complex relationships into two main dimensions (dim1 and dim2). This substage uses Multiple Correspondence Analysis (MCA), implemented through the Factorial Analysis module of Bibliometrix/Biblioshiny, to classify documents based on their association with the main thematic clusters derived from the structural analysis.
Substage 3.2.2—Data Reduction. As part of the proposed methodology, dimensionality reduction was applied to enhance the interpretability of the conceptual structures extracted from the dataset. This process was conducted using cluster analysis techniques and implemented in Substage 3.2.2.2 through the Multiple Correspondence Analysis (MCA) method integrated within the factorial analysis tools of Bibliometrix. By selecting “Abstract” as the unit of analysis, MCA enabled the identification of the most statistically significant scores (i.e., eigenvalues) and the corresponding inertias associated with authors and scientific documents. These indicators were used to reinforce the robustness of thematic groupings and to validate the latent dimensions that structure the field under study.
The procedure allows for the identification of the most relevant scientific contributions on the topic of the evaluation of technical impacts in electrical distribution systems with DERs and microgrid integration, as defined by Equation (1). As shown in Table 2, documents are ranked in two ways:
(1) First, by their statistical contribution to the factorial dimensions (contrib > 0)
(2) Second, by their citation strength (most cited ≥ 30).
Table 2. Top 18 statistically most relevant documents using factorial analysis.
Yeardim1dim2contribTCClusterr(dim1, dim2)Type of DocReference
20233.353.350.2334100%Conference paper[13]
20233.283.280.190498%Conference paper[14]
20230.670.670.162220%Conference paper[15]
20220.670.670.130220%Conference paper[16]
2021−0.08−0.030.09012%Conference paper[17]
2017−0.06−0.060.0028412%Article[18]
2014−0.08−0.080.0021612%Article[19]
20170.000.000.0019210%Article[20]
2018−0.05−0.050.0014211%Article[21]
2016−0.06−0.060.0013112%Article[22]
2017−0.06−0.060.0013012%Article[23]
2014−0.05−0.050.0012111%Article[24]
2015−0.05−0.050.0011511%Article[25]
2019−0.06−0.060.0010612%Article[26]
2017−0.05−0.050.0010311%Article[27]
2021−0.05−0.050.0010111%Review[28]
2010−0.06−0.060.009912%Article[29]
2015−0.06−0.060.008912%Article[30]
The same Table 2 reports the year and the coordinates of the components in the plane of the dimensions indicated in the table as “dim1” and “dim2” normalizing on the largest distance r(dim1, dim2) from the origin, so that the reference [13] presents the greatest contribution to the dimensions of factorial analysis (cluster 4) and so on, the same interpretation for the other documents. This allows to be more objective and reduces resources when dealing with huge databases. Additionally, Table 3 presents a filtered selection of documents from the unified database that focus specifically on the evaluation of technical impacts resulting from DER integration into electrical distribution systems. This filtering process, grounded in the proposed methodological framework, demonstrates the ability of the approach to isolate thematically targeted contributions from a broader set of scientific production. It reinforces the analytical precision of the methodology and illustrates its practical applicability in engineering contexts where topic sensitivity and specificity are required.

3.4. Stage 4—Data Visualization

This section concludes the implementation of the proposed bibliometric methodology by integrating and interpreting the results obtained in Stage 3 through a strategic set of visual tools. This stage does not introduce new analysis techniques but instead consolidates the insights derived from descriptive and structural bibliometric analysis, presenting them through interpretative visualizations that support decision-making and future research planning. Among the representations used are two-dimensional thematic maps, network diagrams, and institutional collaboration structures, each contributing to a comprehensive understanding of how research on Equation (1) has evolved between 2004 and 2024. The elements selected for visualization were generated directly through Bibliometrix/Biblioshiny, including the outputs from Trend Topics, Thematic Evolution, and Factorial Analysis. Additionally, the classification of documents and their thematic contributions, serves as a synthesis layer that links the analytical process to the doctoral research proposal. These visual outputs not only reinforce the structural consistency of the methodology but also provide the interpretative foundation for the next stage: Stage 5—Data Interpretation and Discussion.
The data visualization in this article was developed using temporal analysis techniques that allow the detection of trends, patterns, and thematic transitions over time in the intellectual, conceptual, and social dimensions of the research topic defined by Equation (1). In particular, the results from the Thematic Evolution tool in Biblioshiny reveal how the most relevant topics identified via Keywords Plus have evolved between 2004 and 2024. As shown in Figure 12, these visualizations enable the researcher to distinguish between emerging, consolidating, or declining themes, highlighting their level of maturity and connectivity within the field.
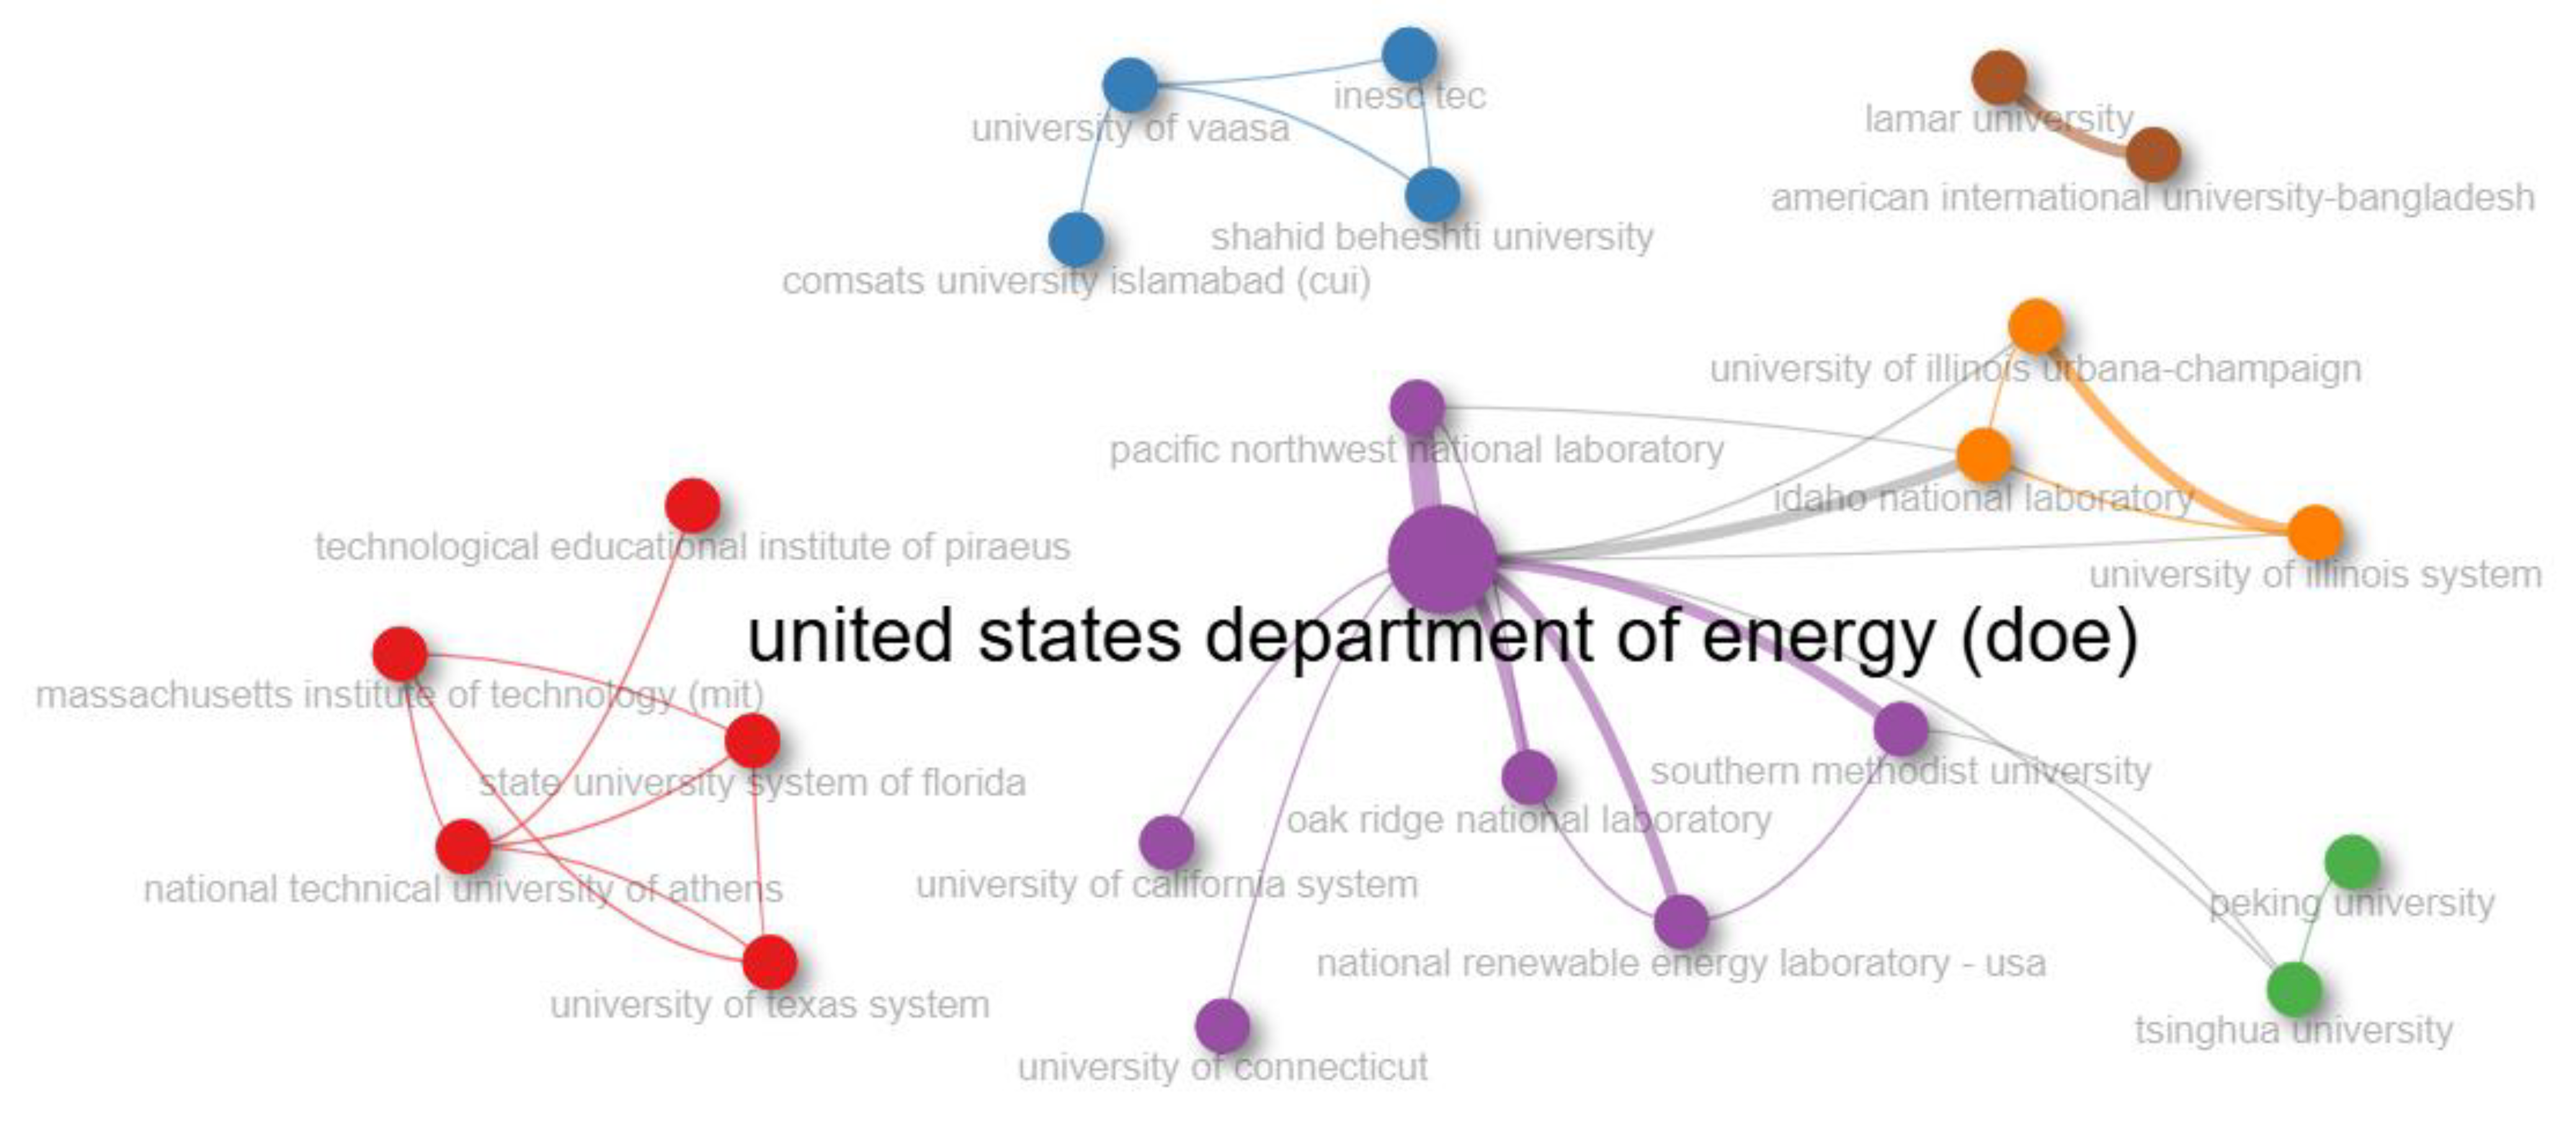
In addition to the thematic patterns, another key visualization in Stage 4 is the institutional collaboration network depicted in the application, which represents the relationships between institutions actively publishing on the topics defined by Equation (1), as shown in Figure 13. By focusing on the 2023–2024 period, the visualization highlights current collaborations and reveals the structural position of institutions within the research landscape. The interpretation of this figure enables the researcher not only to identify leading contributors in the field but also to detect potential strategic partners and sponsoring institutions for future research initiatives. This level of insight reinforces the practical applicability of the proposed methodology by linking bibliometric analysis with real-world collaboration and funding dynamics. Figure 14 focuses specifically on the 2023–2024 period, providing a high-resolution snapshot of current academic priorities. This dual representation supports the methodological objective of identifying conceptual continuity and gaps across time, which is essential for defining the strategic orientation of the doctoral proposal.
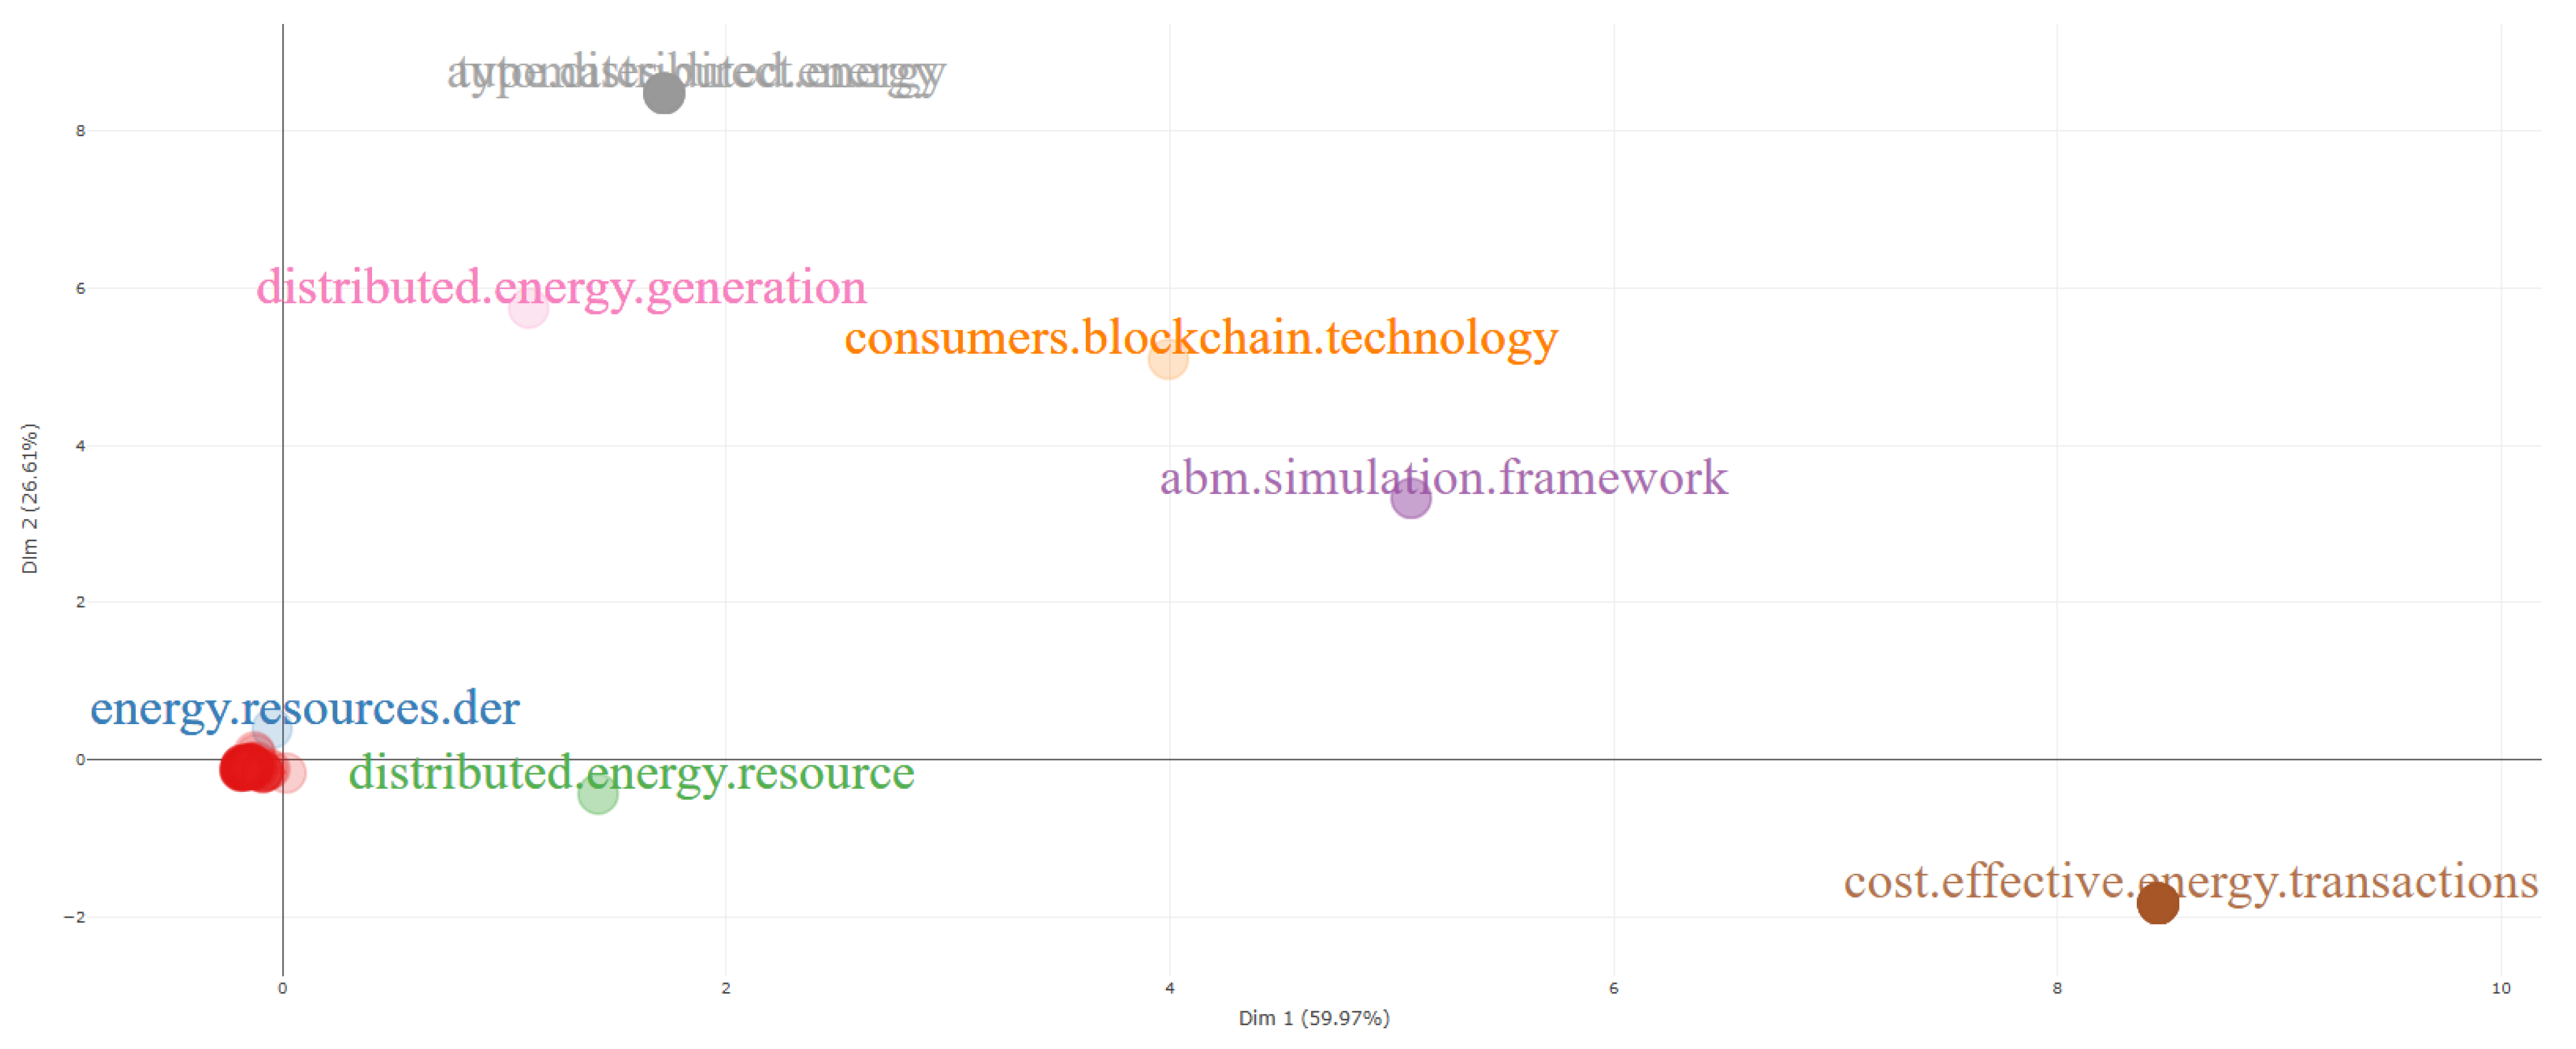
A final key visualization integrated into this stage is the factorial map derived from the Multiple Correspondence Analysis (MCA) applied to the unified database, as shown in Figure 14. This map represents the projection of thematic categories (trigrams) across two dimensions—dim1 (59.97%) and dim2 (26.61%)—which together explain 86.58% of the total inertia in the dataset. The distribution of terms along these axes reflects the conceptual structure of the field and highlights the degree of contribution of each category to the factorial dimensions. In particular, those trigrams located farthest from the origin along the positive directions of the axes represent the most influential thematic elements related to Equation (1). This visualization provides a high-resolution analytical frame for interpreting thematic relevance and supports the prioritization of technical impact areas within the doctoral research scope.
To complement the visual interpretations generated in this stage, Tables 9 and 10 present a consolidated synthesis of the findings derived from the thematic clustering and document classification developed in Stage 3. These tables summarize which research contributions have already addressed the technical impacts defined by Equation (1), which areas remain underexplored, and what specific challenges and future directions can be identified within the scientific discourse. The structured integration of this information provides a decision-support layer for the doctoral proposal, allowing the researcher to align methodology, scope, and objectives based on verified thematic relevance. As such, Stage 4 not only visualizes the current state of the field but also bridges the analytical process with the interpretative and planning components that define Stage 5—Data Interpretation and Discussion.
3.5. Stage 5—Data Interpretation and Discussion

Stage 5 marks the final phase of the applied bibliometric methodology, where the results generated through the previous stages are synthesized, interpreted, and evaluated in relation to the research objectives established in Stage 1.3. This stage provides a structured discussion of the findings, emphasizing the advantages of using bibliometric analysis and network extraction techniques for mapping the scientific discourse surrounding the topic defined by Equation (1). In this phase, the focus shifts from processing and visualization to extracting actionable knowledge—highlighting trends, challenges, contributions, and strategic directions to guide the doctoral research. Each set of results presented in Stage 3 and visualized in Stage 4 is now analyzed for its thematic coherence, conceptual relevance, and potential to inform future research strategies.

3.5.1. Consolidation of Results and Identification of Future Research Topics

In Stage 5.1—Description of Results, the findings obtained through the bibliometric and structural analysis are consolidated in relation to the research objectives established at the outset of the study. The methodology was designed not only to characterize the scientific production associated with Equation (1), but also to identify gaps, conceptual trends, and solution strategies addressed in the literature. One of the primary aims of the proposed methodology was to define new research topics that could serve as potential future work in the context of the doctoral proposal. To this end, the process includes the systematic construction of two topic lists: Stage I and Stage II potential research topics. These are derived from the comparative analysis of filtered terms and thematic classifications across the Trend Topics, Thematic Evolution, and Thematic Map substages, as shown in Table 4.

3.5.2. Interpretation of Results from Trend Topics (Stage I)

The first list of potential topics for future work (Stage I) was constructed through a comparative analysis of the outputs from the Trend Topics substage. This process involved examining the terms extracted from the Keywords Plus field (Figure 9) alongside those identified through trigrams in Abstracts (Figure 10). By comparing both sets, the methodology identified 39 terms—out of a total of 92 possible—that appeared in the Keywords Plus dataset but were not explicitly reported or explained in Abstracts. These terms represent conceptually relevant topics that have been recognized in the literature but lack detailed development in terms of solution proposals. As shown in Table 4, these 39 topics form the foundation of the first list of research gaps, making them suitable candidates for exploration in the doctoral proposal.

3.5.3. Interpretation from Thematic Evolution

The next analytical layer corresponds to the Thematic Evolution substage, which classifies research topics identified through Keywords Plus according to their temporal and structural behavior. Based on their positioning within the thematic evolution map (Figure 12), the methodology distinguishes between emerging and driving themes. These classifications provide insight into the level of maturity and strategic importance of each topic within the research field defined by Equation (1).
As shown in Table 5 and Table 6, the Keywords Plus results previously listed in Trend Topics (Stage I) were evaluated against the thematic structure revealed by the evolution analysis. This led to the creation of a refined classification, List 2, which organizes those terms into categories based on their developmental stage. The relationship between trend occurrence and thematic consolidation is documented in Table 6, serving as a bridge between descriptive trend detection and structural thematic validation. As a complement to the previous classification, Table 7 presents a contrastive analysis between the filtered trigrams obtained from Substage 3.2.1.1.2—Thematic Map (unit of analysis: Abstracts (TM)) and those identified in Trend Topics (Substage 3.1.4.3.1, unit of analysis: Keywords Plus). This comparison aims to determine which terms from the latter set are absent or unaddressed in the abstract-based thematic structure. By identifying these gaps, the analysis reinforces the contribution of Stage 3.2.1.1.1—Thematic Evolution, under which the remaining terms are reclassified according to their developmental relevance.

3.5.4. Selection and Analysis of Filtered Documents

To finalize the analysis and consolidate the methodological findings, the proposed approach includes a targeted selection of documents from the unified database based on the presence of methodological keywords—such as “method,” “methodology,” “strategy,” and “analysis”—within their abstracts. This filtering step was designed to align the document selection with the research objectives stated in Stage 1.3, particularly with respect to identifying how authors have structured their contributions to address technical impacts related to DER integration. As shown in Table 8, the resulting subset of documents serves as a representative sample of scientific efforts that propose or apply concrete strategies to the problem defined by Equation (1). These documents were further analyzed to extract detailed information across multiple dimensions, including the type of DERs, impact categories, solution approaches, variables involved, and identified future work.
Table 8. Filtered references from the top statistically most relevant documents listed in Table 3.
Terms to Refine Search in Equation (1)
(Proposed Solutions)
Unit of Analysis to Refine Search in Database
Abstract
Methodology [17,38,42,51,61]
Method [28,36,39,41,45,48,52,58]
Strategy [34,49,59]
Sensitivity Analysis [45,48]
Monitoring [19,35,55]
NILM[57]
Others, non-classified [26,31,32,33,37,44]

3.5.5. Interpretative Synthesis and Definition of the Research Topic

The synthesis of findings from the selected documents, as presented in Table 9 and Table 10, consolidates the core contributions, challenges, and future directions identified through the proposed methodology. The results shown in Table 9 are consistent with previous studies [63,64], in which the different types of impacts—technical, environmental, economic, political, social, and sectoral—resulting from the use and integration of DERs into power systems have already been identified. Moreover, coherence and accuracy can be observed in the sensitivity trends of system characteristics—such as reliability, stability, efficiency, service continuity, flexibility, and resilience—when responding to technical impacts on monitored system variables across different parametrized sectors (Protection, Control Systems, Energy Sectors, Decentralization, Energy Sources in Distribution, Power Quality, and Future Maintenance), which have already been identified, though in less detail, in earlier studies [64,65]; this demonstrates the precision achieved in the results obtained through the proposed methodology.
Based on these results, the following apply.
  • The doctoral research topic is formally defined as follows:
Technical impacts on the distribution system due to DER integration (emerging and driving topic).
  • The methodological strategy proposed to address this topic is as follows:
Sensitivity analysis and non-intrusive monitoring.
  • This research will contribute directly to tools for the following:
Planning, operation, control, dispatch, future maintenance, and regulatory decision-making in electrical distribution systems with DER integration.
This stage thus concludes the interpretative phase of the methodology, establishing a validated foundation for the doctoral research and demonstrating the capacity of bibliometric methods to support topic definition, scope delimitation, and strategic alignment of scientific inquiry.
Table 9. Consolidated technical findings from the comprehensive analysis of the documents in Table 8.
Aims of Bibliometric AnalysisTechnical Findings from Comprehensive Bibliometric Analysis
Timespan of Analysis2004–2024
Methodological Approach SolutionMethodologies Applied = 5, Methods Implemented = 8, Strategies Used = 7, Other Solution Proposals = 8
Type of ImpactsTechnical, Economics, Environmental, Political: Regulatory Policies, Social, Sectoral, Technical–Economic, Technical–Environmental, Technical–Environmental–Economic, Technical–Economic–Social–Environmental, Technical–Environmental–Economic–Political, Performance evaluation: TechnicAl–Environmental–Economic and Social
Type of DER/MGDistributed Generation and Self-GenerationMG with RES and ESS, DG interconnected with ESS, SG-DER, Solar (PV), Wind, Diesel-G, RES, Microturbines, FC, Biomass, VSI-based MG
Demand ResponseDC-AC Inverters, Nonlinear Loads, Grid Interaction: Electrical Surplus and DSM
Smart Charging Electric VehiclesEV, EV Batteries with Bidirectional Chargers
Energy StorageBESS, ESS, ESS in VSI-based MR, ESS and Power Electronics
Critical variablesAssociated with variations in:Impacting:
Protection, Control Systems, Energy SectorsReliability, Stability, Service Continuity, Resilience
DecentralizationFeasibility, Reliability, Stability, Service, Continuity, Efficiency, Resilience
Energy Sources in DistributionFeasibility, Reliability, Stability, Service, Continuity, Efficiency, Flexibility, Resilience
Power QualityReliability, Stability, Service Continuity, Efficiency
Future MaintenanceReliability
Table 10. Consolidated conceptual findings from the comprehensive analysis of the documents in Table 8.
Aims of Bibliometric Analysis (2004–2024)Conceptual Findings from Comprehensive Bibliometric AnalysisReferences
What Has Been Done?ContributionsIntegration of microgrids and energy management for supply/demand[17,19,28]
Technical assessment of DER in distribution power networks[32,42,57]
Evaluation of power quality and stability in microgrids[52,58]
Strategies for security and resilience in power networks with DER integration[33,49]
Strategies for DER control and coordination[31,34,44]
Environmental impact, policies, and resilience against external events[38,59]
What Has Not Been Done?Future WorksOptimization of generation and energy management in microgrids[17,31]
Evaluation of infrastructure and the modeling of electrical systems[31,42,43]
Prediction and advanced Control for DER integration[48,52]
Regulation and policies for the integration of DERs into the power system[26]
Cybersecurity and the protection of networks with DER integration[28,49,61]
Active management of energy consumption and the lifecycle assessment of assets[32,57]
Future ChallengesCoordination of protection systems and grid stability[38,41,42,51]
Real-time monitoring and power quality assessment in distribution networks[42,45,58]
Regulatory frameworks, planning tools, and modeling approaches for DER integration[39,42]
Real-world implementation and validation of automation in power systems[19,35]

4. Discussion

The proposed bibliometric methodology is a potential tool and guideline for the structured analysis of trends in the scientific literature. The combination of descriptive statistical analysis (Trend Topics) with network extraction techniques (Thematic Evolution, Thematic Map, and Factorial Analysis using MCA) enables the correlation of knowledge evolution in a specific research area. Additionally, the optimization of computational and human resources allows the analysis to focus on the most statistically relevant documents, preventing inefficient exploration of the literature.
The study design phase is a critical component in the implementation of this methodology, as it defines the research scope, key questions, and objectives that guide the bibliometric analysis. Before conducting the analysis, ensuring data integrity through a rigorous data-cleaning process is essential to minimize errors in document selection and guarantee the reliability of the results.
The methodology enables partial or comprehensive analyses of scientific databases, depending on the study’s objectives. For a descriptive analysis, specific workflow stages can be used without executing the entire methodological process. However, to achieve a holistic view of the research field, it is essential to complete all stages defined in the methodology. This approach not only facilitates the identification of emerging trends and research gaps but also enables the analysis of intellectual, conceptual, and social structures within the research area, mapping relationships between authors, predominant theoretical approaches, and thematic connections.
The bibliometric trend analysis in scientific literature was conducted using advanced tools such as Trend Topics, Thematic Map, Thematic Evolution, and Factorial Analysis using MCA from Bibliometrix. These techniques enabled the tracking of key term evolution between 2004 and 2024, differentiating emerging themes (keywords plus), proposed solutions (abstracts of analyzed articles), developing research lines (author’s keywords), and statistical relevance of documents (abstracts). Additionally, Thematic Evolution facilitated the identification of term transition and consolidation over time, providing a dynamic perspective on the progress within the research field.
The obtained results highlight the importance of a rigorous document selection process based on statistical criteria, which optimizes analysis time without compromising the depth of the study. However, automation alone does not guarantee a contextualized interpretation of findings, reaffirming the central role of the researcher in validating and classifying the extracted information within the conceptual framework of the study.
Although this article focuses on the most relevant results obtained through descriptive and structural analysis using Keywords Plus and abstracts, additional tools were explored during the methodological development. These included trend analysis based on Author’s Keywords and the Thematic Map function, which enabled the identification of author-declared research lines and the association of documents with thematic clusters linked to various types of impact—technical, economic, environmental, social, political, and sectoral. While these analyses were not included in the main body of the article in order to preserve methodological clarity and maintain focus on the core findings, they are part of the technical design of the proposed methodology. In future applications, these components may be incorporated into comparative studies or extended implementations of the model.

4.1. Research Gaps and Challenges

Several challenges and assumptions may impact the representativeness and effectiveness of the analysis.
The current dependence on Bibliometrix software and the use of only two specific databases, which may introduce selection bias in the document retrieval process and limit the diversity of the results. Expanding the study to complementary databases would provide a more balanced representation of the state of the art across different disciplines.
The filtering and data curation process still relies heavily on manual validation by the researcher, requiring a high degree of human intervention. Although the implementation of artificial intelligence (AI) could optimize certain tasks, such as generating lists of excluded terms or identifying relevant synonyms, AI still faces limitations in the semantic and conceptual interpretation of scientific data. The classification accuracy of Keywords Plus terms continues to require expert knowledge from the researcher to prevent biases or misinterpretations in bibliometric trend analysis.

4.2. Future Works

To enhance the applicability and robustness of the proposed bibliometric methodology, several future research directions are outlined, focusing on its expansion, validation, and continuous improvement.
First, it is recommended to expand the study to multiple scientific databases to reduce selection bias and ensure greater representativeness in bibliometric analyses. Although the methodology has been validated using Web of Science (WoS) and Scopus, integrating additional sources such as Dimensions, Lens.org, IEEE Xplore, and Semantic Scholar would provide broader coverage and enable a more precise comparison across different scientific ecosystems.
Another key future research direction is the development of structured validation criteria to assess the coherence and accuracy of identified trends. The implementation of quantifiable metrics will facilitate comparisons of findings across different databases and methodologies, ensuring that the results are replicable and aligned with the state of the art in each discipline.

5. Conclusions

The proposed bibliometric methodology is a comprehensive and structured approach for trend analysis of the scientific literature. Its capability to integrate descriptive statistical analysis tools (Trend Topics) with network extraction techniques (Thematic Evolution, Thematic Map, and Factorial Analysis using MCA) enables the precise identification of evolutionary patterns in scientific knowledge. This methodology not only optimizes the selection of relevant documents through statistical criteria but also facilitates the correlation between emerging trends, predominant themes, and methodological approaches across various fields of study.
As part of the methodological development, a unified database was implemented, integrating information from multiple sources. This initiative enhances bibliometric analysis coverage by reducing reliance on a single database, providing a more comprehensive and representative view of scientific production within the research field.
The methodology ensures reproducibility and validity across different application contexts. To achieve this, it is essential to compare the results obtained through descriptive, inferential, and network-based analyses. This process involves evaluating the coherence between the most cited and most influential documents in terms of scientific contribution, as well as the alignment between emerging trends identified using Trend Topics and the thematic structures obtained with Thematic Evolution and Thematic Map. Such comparisons not only validate the methodology but also enable the refinement of search criteria and data filtering for future applications.
The results highlight the importance of applying a rigorous document selection process, where automation, although valuable for processing large datasets, requires expert validation to ensure the accurate interpretation of findings. The combination of bibliometric tools and expert judgment has enabled a more structured and representative assessment of the state of the art in the analyzed research field.
Additionally, the implementation of this methodology has provided a data-driven framework for informed decision-making in academic research, facilitating the identification of research gaps and the establishment of new research directions. Its applicability across different knowledge domains makes it a versatile tool for systematically exploring scientific production, allowing researchers to structure knowledge and anticipate future trends.
Through bibliometric analysis, the main research topics were identified and classified according to their impact and evolution within the field of study. This categorization distinguishes emerging topics (newly introduced research areas), driving topics (those that dynamically influence knowledge development), linking topics (concepts connecting different research lines), specialized topics (highly specific niches), and basic topics (fundamental knowledge of the field). This classification is essential for understanding the growth dynamics and consolidation of various research streams.
Finally, the methodology has been designed to be adaptable and replicable, allowing its implementation across various contexts and disciplines. Its evolution will depend on the integration of complementary databases, the incorporation of advanced bibliometric tools, and the application of structured validation metrics to reinforce the coherence and reliability of findings. Consequently, it is expected to continue providing a solid foundation for future bibliometric studies and contribute to the continuous improvement of trend analysis in scientific research.

6. Definitions

Emerging Themes: These refer to topics that are beginning to gain importance, that are growing, and that, over time, are attracting more attention from the scientific community in the specific research area defined by (Equation (1)).
Declining Themes: These refer to the themes that, over time (years), are losing relevance in the specific research area defined by (Equation (1)).
Niche Themes: These refer to specialized research topics that are specific and do not receive as much attention as the driving themes of thematic evolution or emerging themes but are still important for certain subfields of study around a study topic.
Motor Themes (Driver Themes): These are central themes that have been in constant evolution, driving the thematic evolution of research and that have had a significant impact on a given area of research. They tend to be broad and general. Their evolution over time is essential to understanding the direction and development of a topic of study.
Basic Themes: These are the themes that form the basis of a field of research and that have been stable and constant over time (usually for years). They provide the foundations and basic concepts on which research is built.
Centrality: In a thematic node network analysis, it measures the degree of importance (topic relevance)—in terms of the maximum number of connections with respect to the total possible—that a research topic has with the other thematic nodes.
Density: In a thematic node network analysis, it determines how densely connected the nodes are within a specific region of the network. This is an indicator that allows one to determine the degree of development of the research topic.

Author Contributions

Conceptualization and writing—review and editing, E.M.-S. and E.G.-L.; writing—review and editing, E.M.-S., E.G.-L., J.M.G. and J.C.V. All authors have read and agreed to the published version of the manuscript.

Funding

This research received no external funding.

Data Availability Statement

The data supporting the conclusions of this article are contained within the manuscript.

Acknowledgments

The authors express their gratitude to the GRALTA Research Group from the School of Electrical and Electronic Engineering of the Universidad del Valle and to the Center for Research on Microgrids (CROM) for their discussions and contributions during the development of this paper.

Conflicts of Interest

The authors declare no conflicts of interest.

Abbreviations

BESSBattery Energy Storage Systems
CNONational Operations Council
DERDistributed Energy Resource
DGDistributed Generation
Diesel-GDiesel Generator
DRDemand Response
ENSEnergy Not Supplied
ESSEnergy Storage Systems
EVElectric Vehicles
FCFuel Cells
FNCERNon-Conventional Source of Renewable Energy
MGMicrogrid
NLLNonlinear Loads
PQPower Quality
PVPhotovoltaic
RESRenewable Energy Sources
SG-DERSelf-Generation Distributed Energy Resources

References

  1. Aria, M.; Alterisio, A.; Scandurra, A.; Pinelli, C.; D’Aniello, B. The scholar’s best friend: Research trends in dog cognitive and behavioral studies. Anim. Cogn. 2021, 24, 541–553. [Google Scholar] [CrossRef] [PubMed]
  2. Anaç, M.; Ayalp, G.G.; Erdayandi, K. Prefabricated Construction Risks: A Holistic Exploration through Advanced Bibliometric Tool and Content Analysis. Sustainability 2023, 15, 1916. [Google Scholar] [CrossRef]
  3. Ahmad, T. Mapping of global research on familial Mediterranean fever: A SCI-Expanded-based bibliometric analysis. Rheumatol. Int. 2022, 42, 2231–2239. [Google Scholar] [CrossRef]
  4. Rashid, A.; Li, K.; Feng, Y.; Ahmad, T.; Getaneh, Y.; Yu, Y.; Hu, X.; Abidi, S.H.; Shao, Y. HIV-1 genetic diversity a challenge for AIDS vaccine development: A retrospective bibliometric analysis. Hum. Vaccines Immunother. 2022, 18, 2014733. [Google Scholar] [CrossRef]
  5. Ahmad, T. Global research trends in MERS-CoV: A comprehensive bibliometric analysis from 2012 to 2021. Front. Public Health 2022, 10, 933333. [Google Scholar] [CrossRef]
  6. Ahmad, T.; Malik, M.; Ahmed, K.; Bin Mohd Yusof, N.; Khan, M.; Nawaz, M. Bibliometric analysis and visualization mapping of anthrax vaccine publications from 1991 through 2021. Vaccines 2022, 10, 1007. [Google Scholar] [CrossRef]
  7. Citybabu, G.; Yamini, S. A state of the art of Lean Six Sigma in the Indian context—21st century: A bibliometric analysis. TQM J. 2023, 36, 2154–2192. [Google Scholar] [CrossRef]
  8. Silva, D.G.; Cachinho, H.; Ward, K. Science mapping the academic knowledge on business improvement districts. Computation 2022, 10, 29. [Google Scholar] [CrossRef]
  9. Mutlu Avinç, G.; Yıldız, A. A bibliometric and systematic review of scientific publications on metaverse research in architecture: Web of Science (WoS). Int. J. Technol. Des. Educ. 2024, 35, 825–849. [Google Scholar] [CrossRef]
  10. Franceschini, F.; Maisano, D.; Mastrogiacomo, L. The museum of errors/horrors in Scopus. J. Informetr. 2016, 10, 174–182. [Google Scholar] [CrossRef]
  11. Liu, W. Caveats for the use of Web of Science Core Collection in old literature retrieval and historical bibliometric analysis. Technol. Forecast. Soc. Change 2021, 172, 121023. [Google Scholar] [CrossRef]
  12. IRENA. Renewable energy policies in a time of transition. Int. Renew. Energy Agency 2018, 53, 1–56. Available online: https://www.irena.org (accessed on 8 April 2025).
  13. Boumaiza, A.; Sanfilippo, A. Local energy marketplace agents-based analysis. In Proceedings of the International Conference on Electrical, Computer, Communications and Mechatronics Engineering (ICECCME 2023), Tenerife, Spain, 19–20 October 2023. [Google Scholar] [CrossRef]
  14. Boumaiza, A.; Sanfilippo, A. Blockchain-enabled energy marketplace. In Proceedings of the 29th International Conference on Information, Communication and Automation Technologies (ICAT 2023), Sarajevo, Bosnia and Herzegovina, 26–28 October 2023. [Google Scholar] [CrossRef]
  15. Boumaiza, A.; Sanfilippo, A. Blockchain-based electricity marketplace. In Proceedings of the International Conference on Electrical, Computer, Communications and Mechatronics Engineering (ICECCME 2023), Tenerife, Spain, 19–20 October 2023. [Google Scholar] [CrossRef]
  16. Boumaiza, A.; Sanfilippo, A. Data prediction for a blockchain-based energy market. In Proceedings of the 17th IEEE Conference on Industrial Electronics and Applications (ICIEA 2022), Chengdu, China, 17–20 July 2022; pp. 181–185. [Google Scholar] [CrossRef]
  17. Ahamad, N.B.; Othman, M.; Che Mid, E.; Fahmi, M.I.; Suboh, S.M.; Guerrero, J.M. Feasibility study of future seaports. J. Phys. Conf. Ser. 2021, 1878, 012028. [Google Scholar] [CrossRef]
  18. Lotfi, H.; Khodaei, A. AC versus DC microgrid planning. IEEE Trans. Smart Grid 2017, 8, 296–304. [Google Scholar] [CrossRef]
  19. El-Hawary, M.E. The smart grid—State-of-the-art and future trends. Electr. Power Compon. Syst. 2014, 42, 239–250. [Google Scholar] [CrossRef]
  20. Nazari-Heris, M.; Abapour, S.; Mohammadi-Ivatloo, B. Optimal economic dispatch of FC-CHP based heat and power micro-grids. Appl. Therm. Eng. 2017, 114, 756–769. [Google Scholar] [CrossRef]
  21. SoltaniNejad Farsangi, A.; Hadayeghparast, S.; Mehdinejad, M.; Shayanfar, H. A novel stochastic energy management of a microgrid with various types of distributed energy resources in presence of demand response programs. Energy 2018, 160, 257–274. [Google Scholar] [CrossRef]
  22. Ma, J.; Chen, H.H.; Song, L.; Li, Y. Residential load scheduling in smart grid: A cost efficiency perspective. IEEE Trans. Smart Grid 2016, 7, 771–784. [Google Scholar] [CrossRef]
  23. Azaza, M.; Wallin, F. Multi objective particle swarm optimization of hybrid micro-grid system: A case study in Sweden. Energy 2017, 123, 108–118. [Google Scholar] [CrossRef]
  24. Van Roy, J.; Leemput, N.; Geth, F.; Buscher, J.; Salenbien, R.; Driesen, J. Electric vehicle charging in an office building microgrid with distributed energy resources. IEEE Trans. Sustain. Energy 2014, 5, 1389–1396. [Google Scholar] [CrossRef]
  25. Zhang, D.; Evangelisti, S.; Lettieri, P.; Papageorgiou, L.G. Optimal design of CHP-based microgrids: Multiobjective optimisation and life cycle assessment. Energy 2015, 85, 181–193. [Google Scholar] [CrossRef]
  26. Arias, N.B.; Hashemi, S. Distribution system services provided by electric vehicles: Recent status, challenges, and future prospects. IEEE Trans. Intell. Transp. Syst. 2019, 20, 4277–4296. [Google Scholar] [CrossRef]
  27. Farrokhabadi, M.; Cañizares, C.A.; Bhattacharya, K. Frequency control in isolated/islanded microgrids through voltage regulation. IEEE Trans. Smart Grid 2017, 8, 1185–1194. [Google Scholar] [CrossRef]
  28. Dagar, A.; Gupta, P.; Niranjan, V. Microgrid protection: A comprehensive review. Renew. Sustain. Energy Rev. 2021, 152, 111401. [Google Scholar] [CrossRef]
  29. Basu, A.K.; Chowdhury, S.; Chowdhury, S.P. Impact of strategic deployment of CHP-based DERs on microgrid reliability. IEEE Trans. Power Deliv. 2010, 25, 1697–1705. [Google Scholar] [CrossRef]
  30. Milan, C.; Stadler, M.; Cardoso, G.; Mashayekh, S. Modeling of non-linear CHP efficiency curves in distributed energy systems. Appl. Energy 2015, 148, 334–347. [Google Scholar] [CrossRef]
  31. Liu, X.; Liu, Y. Optimal planning of AC-DC hybrid transmission and distributed energy resource system: Review and prospects. CSEE J. Power Energy Syst. 2019, 5, 409–422. [Google Scholar] [CrossRef]
  32. Zheng, L.; Hasandka, A.; Alam, S.M.S.; Elgindy, T.; Florita, A.R.; Hodge, B.M. Solid-state transformer and hybrid transformer with integrated energy storage in active distribution grids: Technical and economic comparison, dispatch, and control. IEEE J. Emerg. Sel. Top. Power Electron. 2022, 10, 3771–3787. [Google Scholar] [CrossRef]
  33. Krishna, V.B.; Gunter, C.A.; Sanders, W.H. Evaluating detectors on optimal attack vectors that enable electricity theft and DER fraud. IEEE J. Sel. Top. Signal Process. 2018, 12, 790–805. [Google Scholar] [CrossRef]
  34. Mayhorn, E.; Xie, L.; Butler-Purry, K. Multi-time scale coordination of distributed energy resources in isolated power systems. IEEE Trans. Smart Grid 2017, 8, 998–1005. [Google Scholar] [CrossRef]
  35. López, G.; Moreno, J.I.; Sánchez, E.; Martínez, C.; Martín, F. Noise sources, effects and countermeasures in narrowband power-line communications networks: A practical approach. Energies 2017, 10, 1238. [Google Scholar] [CrossRef]
  36. Makrygiorgou, D.I.; Alexandridis, A.T. Distributed stabilizing modular control for stand-alone microgrids. Appl. Energy 2018, 210, 925–935. [Google Scholar] [CrossRef]
  37. Fujioka, Y.; Maejima, H.; Nakamura, S.; Kojima, Y.; Okudera, M.; Uesaka, S. Regional power grid with renewable energy resources: A demonstrative project in Hachinohe. In Proceedings of the 41st International Conference on Large High Voltage Electric Systems (CIGRÉ 2006), Paris, France, 27 August–1 September 2006. [Google Scholar]
  38. Anastasiadis, A.; Konstantinopoulos, S.; Kondylis, G.; Vokas, G.A.; Salame, M.J. Carbon tax, system marginal price and environmental policies on smart microgrid operation. Manag. Environ. Qual. 2018, 29, 76–88. [Google Scholar] [CrossRef]
  39. Zhang, J.; Hasandka, A.; Alam, S.M.S.; Elgindy, T.; Florita, A.R.; Hodge, B.M. Analysis of hybrid smart grid communication network designs for distributed energy resources coordination. In Proceedings of the 2019 IEEE Power and Energy Society Innovative Smart Grid Technologies Conference (ISGT), Washington, DC, USA, 17–20 February 2019; pp. 6–10. [Google Scholar] [CrossRef]
  40. Chen, Y.; Zeng, Z.; Zhou, Z.; Zhang, Y.; Zhang, Q.; Liu, Y. Planning of distributed energy resources for distribution network considering dispatchable region of microgrids. Autom. Electr. Power Syst. 2019, 43, 83–91. [Google Scholar] [CrossRef]
  41. Choi, J.; Illindala, M.S. Effect of prime mover’s characteristics on the survivability of a synchronous generator-based distributed energy resource during transient overload conditions. IEEE Trans. Ind. Appl. 2020, 56, 88–94. [Google Scholar] [CrossRef]
  42. Chihota, M.J.; Bekker, B.; Gaunt, C.T. Technical assessment of the impacts of distributed energy resources on distribution feeders. In Uncertainties in Modern Power Systems; Elsevier: Amsterdam, The Netherlands, 2020; pp. 397–439. [Google Scholar] [CrossRef]
  43. Li, Y.; Zhang, P.; Althoff, M.; Yue, M. Distributed formal analysis for power networks with deep integration of distributed energy resources. IEEE Trans. Power Syst. 2019, 34, 5147–5156. [Google Scholar] [CrossRef]
  44. Harb, H.; Schütz, T.; Streblow, R.; Müller, D. A multi-agent based approach for energy management in microgrids. In Proceedings of the 27th International Conference on Efficiency, Cost, Optimization, Simulation and Environmental Impact of Energy Systems (ECOS 2014), Turku, Finland, 15–19 June 2014. [Google Scholar]
  45. Buonanno, A.; Caliano, M.; Di Somma, M.; Graditi, G.; Valenti, M. A comprehensive tool for scenario generation of solar irradiance profiles. Energies 2022, 15, 8830. [Google Scholar] [CrossRef]
  46. Jasiński, M.; Sikorski, T.; Kaczorowska, D.; Rezmer, J.; Suresh, V.; Leonowicz, Z.; Kostyła, P.; Szymańda, J.; Janik, P.; Bieńkowski, J.; et al. A Case Study on Data Mining Application in a Virtual Power Plant: Cluster Analysis of Power Quality Measurements. Energies 2021, 14, 974. [Google Scholar] [CrossRef]
  47. Bowen, T.; Koebrich, S.; McCabe, K.; Sigrin, B. The locational value of distributed energy resources: A parcel-level evaluation of solar and wind potential in New York State. Energy Policy 2022, 166, 112744. [Google Scholar] [CrossRef]
  48. Nie, J.; Zheng, T.; Liu, W.; Li, Y.; Liu, C.; Zhang, Y. High-performance optimal power flow estimation for EV-interfaced microgrids with standardized grid services. IEEE Trans. Ind. Appl. 2023, 59, 1199–1211. [Google Scholar] [CrossRef]
  49. Culler, M.; Burroughs, H. Cybersecurity considerations for grid-connected batteries with hardware demonstrations. Energies 2021, 14, 3067. [Google Scholar] [CrossRef]
  50. Dondossola, G.; Terruggia, R. Security of communications in voltage control for grids connecting DER: Impact analysis and anomalous behaviours. In Proceedings of the 45th International CIGRÉ Session, Paris, France, 24–29 August 2014. [Google Scholar]
  51. Carneiro, C.A.; Silva, G.B.; Junior, J.G.; Cebrian, J.C.; Morales-Paredes, H.K. Impact of distributed energy resources on fault location, isolation, and service restoration. In Proceedings of the 16th International Conference on Probabilistic Methods Applied to Power Systems (PMAPS), Manchester, UK, 12–15 June 2022. [Google Scholar] [CrossRef]
  52. Hezzi, A.; Elbouchikhi, E.; Bouzid, A.; Ben Elghali, S.; Zerrougui, M.; Benbouzid, M. Active disturbance rejection control for distributed energy resources in microgrids. Machines 2024, 12, 67. [Google Scholar] [CrossRef]
  53. Kulkarni, M.S.; Mishra, S.; Sudabattula, S.K.; Sharma, N.K.; Basha, D.B.; Bajaj, M.; Tuka, M.B. Enhancing grid resiliency in distributed energy systems through a comprehensive review and comparative analysis of islanding detection methods. Sci. Rep. 2024, 14, 12124. [Google Scholar] [CrossRef]
  54. Aguilar, S.; Kean, E.; Kushner, D.; Larsen, P.; Schlegelmilch, J. Partnerships to enable smart cities and support resiliency. In Proceedings of the 2021 IEEE Conference on Technologies for Sustainability (SusTech), Irvine, CA, USA, 22–24 April 2021; pp. 90–93. [Google Scholar] [CrossRef]
  55. Fotopoulou, M.; Rakopoulos, D.; Petridis, S. Development of a multi-dimensional key performance indicators’ framework for the holistic performance assessment of smart grids. In Proceedings of the 35th International Conference on Efficiency, Cost, Optimization, Simulation and Environmental Impact of Energy Systems (ECOS 2022), Osaka, Japan, 3–7 July 2022; pp. 173–183. [Google Scholar]
  56. Hu, Y.; Xian, X.; Jin, Y. RADM: A risk-aware DER management framework with real-time DER trustworthiness evaluation. In Proceedings of the 12th ACM/IEEE International Conference on Cyber-Physical Systems (ICCPS), Nashville, TN, USA, 18–21 May 2021; pp. 77–86. [Google Scholar] [CrossRef]
  57. Moreno Jaramillo, A.F.; Lopez-Lorente, J.; Brogan, P.; Laverty, D.; Del Rincon, J.M.; Foley, A. Impact assessment of NILM methods for an enhanced observability of low voltage distribution networks. In Proceedings of the 6th IEEE International Smart Cities Conference (ISC2), Pafos, Cyprus, 26–29 September 2022. [Google Scholar] [CrossRef]
  58. Sánchez, E.; Anduaga, J.; Santiago, F.J.; Gil De Muro, A. Microgrids integration into the distribution network. In Proceedings of the 42nd International Conference on Large High Voltage Electric Systems (CIGRÉ 2008), Paris, France, 24–29 August 2008. [Google Scholar]
  59. Kovvuri, S.; Chatterjee, P.; Basumallik, S.; Srivastava, A. Wildfire-induced risk assessment to enable resilient and sustainable electric power grid. Energies 2024, 17, 297. [Google Scholar] [CrossRef]
  60. Küster, K.K.; Ferrer, D.L.; Schäfer, T.; Waffenschmidt, E. Adoption of local peer-to-peer energy markets: Technical and economical perspectives for utilities. Energies 2023, 16, 2364. [Google Scholar] [CrossRef]
  61. Moschos, I.; Ferrer, D.L.; Cairó, J.I. Design and development of a test environment to analyze the impact of cyber attacks on the electrical distribution network. Renew. Energy Power Qual. J. 2016, 1, 583–588. [Google Scholar] [CrossRef]
  62. Singh, G.; D’Arpino, M.; Goveas, T. A techno-economic assessment of DC fast-charging stations with storage, renewable resources and low-power grid connection. Energies 2024, 17, 4012. [Google Scholar] [CrossRef]
  63. Escobar-Orozco, L.F.; Gómez-Luna, E.; Marlés-Sáenz, E. Identification and analysis of technical impacts in the electric power system due to the integration of microgrids. Energies 2023, 16, 6412. [Google Scholar] [CrossRef]
  64. Marlés-Sáenz, E.; Gómez-Luna, E.; Guerrero, J.M.; Vasquez, J.C. Analysis of impacts in electric power grids due to the integration of distributed energy resources. Energies 2025, 18, 745. [Google Scholar] [CrossRef]
  65. Villarreal-Montoya, J.G.; Gómez-Luna, E.; Marlés-Sáenz, E. Power quality assessment of the interconnection of a microgrid to a local distribution system using real-time simulation. DYNA 2020, 87, 28–33. [Google Scholar] [CrossRef]
Figure 1. Recommended workflow by the authors of the software Bibliometrix (version 4.3.0) [1].
Energies 18 02437 g001
Figure 2. Recommended workflow for scientific mapping using proposed bibliometric methodology.
Energies 18 02437 g002
Figure 3. Structured workflow of proposed bibliometric methodology.
Energies 18 02437 g003
Figure 4. Details of types of documents evidenced in database1 and database2 for Equation (1).
Energies 18 02437 g004
Figure 5. Levels and tools of descriptive bibliometric analysis.
Energies 18 02437 g005
Figure 6. Distribution of documents retrieved for each search equation. Reference totals: 4458 documents from Scopus and 3058 from Web of Science.
Energies 18 02437 g006
Figure 7. (a) The consolidation of the main information for database1, database2, and the unified database. (b) Access to the “Main information” tab within the Biblioshiny structure. (c) The stages of the Biblioshiny app from Bibliometrix available as free software through R or RStudio.
Energies 18 02437 g007
Figure 8. (a) Annual scientific production published in the database1, database2 and unified database with Average Citation per Year published. (b) Access to the “Annual Scientific Production” and “Average Citation per Year published” tabs within the Biblioshiny structure.
Energies 18 02437 g008
Figure 9. The chronology of new topics (Keywords Plus) extracted from the unified database, 2004–2024.
Energies 18 02437 g009
Figure 10. Chronology of new Topics (Abstracts) extracted from unified database, 2004–2024.
Energies 18 02437 g010
Figure 11. Access to the statistical tools available under the “Conceptual Structure” tab within the Biblioshiny structure.
Energies 18 02437 g011
Figure 12. The thematic evolution of the Keywords Plus topics in the analysis period 2004–2024. Source: Biblioshiny app—Bibliometrix.
Energies 18 02437 g012
Figure 13. Collaboration network between institutions working on the topics given by Equation (1). Analysis period 2023–2024. Source: Biblioshiny app—Bibliometrix.
Energies 18 02437 g013
Figure 14. The plane of dimensions dim1 (59.97%), dim2 (26.61%) applied to the unified database for Equation (1) using the MCA (Multiple Correspondence Analysis) and using a number of terms: 48. Source: Biblioshiny app—Bibliometrix.
Energies 18 02437 g014
Table 1. The color conventions used to support the interpretation of the bibliometric flow diagram Figure 3.
Color(R, G, B); (Hex.)Note
(27, 125, 169); (#1B7DA9)First-level methodological stages (Stage 1 to Stage 5)
(111, 207, 151); (#6FCF97)Process developed and executed in the proposed methodology
(255, 192, 0); (#FFC000)Descriptive bibliometric analysis using Bibliometrix or Biblioshiny
(255, 255, 255); (#FFFFFF)Optional process not implemented in this study
Bold text(0, 0, 0); (#000000)Stage titles and block identifiers (mandatory elements)
Table 3. Top statistically most relevant documents of technical impacts using factorial analysis.
Yeardim1dim2contribTCClusterr(dim1, dim2)Type of Doc Reference
2021−0.08−0.030.09012%Conference paper[17]
2014−0.08−0.080.0021612%Article[19]
2019−0.06−0.060.0010612%Article[31]
2021−0.05−0.050.0010111%Review[28]
2019−0.05−0.050.007711%Review[31]
2022−0.06−0.060.005312%Article[32]
2018−0.06−0.060.004612%Article[33]
2017−0.06−0.060.004512%Article[34]
2017−0.05−0.050.002411%Article[35]
20180.010.010.002010%Article[36]
2006−0.05−0.050.001711%Conference paper[37]
2018−0.06−0.060.001612%Article[38]
2019−0.06−0.060.001412%Conference paper[39]
2019−0.07−0.070.001112%Article[40]
20200.010.010.001110%Proceeding paper[41]
2020−0.06−0.060.00912%Book Chapter[42]
2019−0.06−0.060.00912%Article[43]
2014−0.08−0.080.00812%Conference paper[44]
2022−0.05−0.050.00711%Article[45]
2021−0.05−0.050.00511%Article[46]
2022−0.06−0.060.00412%Article[47]
2023−0.05−0.050.00411%Proceeding paper[48]
2021−0.06−0.060.00312%Article[49]
2014−0.05−0.050.00311%Conference paper[50]
2022−0.04−0.040.00211%Conference paper[51]
2024−0.05−0.050.00211%Article[52]
2024−0.06−0.060.00212%Article[53]
2021−0.05−0.050.00111%Conference paper[54]
2022−0.06−0.060.00112%Conference paper[55]
2021−0.06−0.060.00112%Conference paper[56]
2022−0.06−0.060.00112%Conference paper[57]
2008−0.05−0.050.00111%Conference paper[58]
2024−0.06−0.060.00012%Article[59]
2023−0.06−0.060.00012%Article[60]
2016−0.05−0.050.00011%Article[61]
2024−0.06−0.060.00012%Article[62]
Table 4. Potential topics for future work from Trend Topics. (Stage I).
ItemFreq.Year MedianItemFreq.Year Median
adaptive microgrid protection12024cyber security22015
adaptive neural fuzzy22024risk assessment22014
power-system resilience22024state estimation22014
long short-term memory62023developing countries12013
multi agent systems52023experiments12013
design 42022reliability 72012
performance92022customer satisfaction12010
strategy 62022innovation 12010
attacks 22021scheduling22010
autonomous operation22021dynamic re-configuration12009
investments52021evaluation methodologies12009
impact 162020historical data12009
systems 152020local faults12009
operation 92019ambient temperatures12008
hardware 22017standards 32008
relay protection22017circuit breakers12006
stochastic systems32017intentional islanding12006
environmental impact42016power transmission22005
security requirements22016coordination12004
architectural design22015
Table 5. The emerging themes of the unified database of Equation (1) (2004–2024).
Emerging Themes From Thematic Evolution
Words2004—20172018—20202021—20222023—2024
Systems *x
operationx
power marketsx
power transmissionx
transmission and distribution x
autonomous operation x
distributed energy resources * x
distributed energy-resources * x
multiagent system x
electric loads x
inverter x
performance x
power-system resilience x
* Topics with higher occurrence y centrality degree. X Evidence of the presence of Emerging Themes during the period.
Table 6. Classification of Keywords Plus (Trend Topics) using the results of Thematic Evolution.
Item Emerging ThemesMotor ThemesYear Median
power-system resiliencex 2024
multi agent systemsx 2023
performancex 2022
autonomous operationx 2021
impact x2020
operationx 2019
smart grid x2018
renewable energy resources x2014
power transmissionx 2005
X Evidence of the presence of emerging and motor themes during the period with Year Median indicated.
Table 7. Potential topics for future work from Thematic Map. (Stage II).
Item Emerging ThemeMotor ThemeYear Median
Adaptive microgrid protection 2024
Long short-term memory 2023
Design 2022
Performancex 2022
Investments 2021
impact x2020
operationx 2019
relay protection 2017
environmental impact 2016
customer satisfaction 2010
innovation 2010
scheduling 2010
dynamic re-configuration 2009
evaluation methodologies 2009
local faults 2009
standards 2008
intentional islanding 2006
power transmissionx 2005
coordination 2004
X Evidence of the presence of emerging and motor themes during the period with Year Median indicated.
Disclaimer/Publisher’s Note: The statements, opinions and data contained in all publications are solely those of the individual author(s) and contributor(s) and not of MDPI and/or the editor(s). MDPI and/or the editor(s) disclaim responsibility for any injury to people or property resulting from any ideas, methods, instructions or products referred to in the content.