1. Introduction
The rapid evolution of electrical infrastructure has led to the emergence of smart power distribution systems (SPDSs), which are at the heart of modern energy management [
1,
2,
3]. These systems incorporate advanced communication technologies, real-time monitoring, automated control, and predictive analytics to ensure efficient, stable, and responsive electricity delivery [
4,
5,
6]. Unlike traditional grid models, SPDSs are designed to dynamically adjust to demand fluctuations, incorporate renewable energy sources, and support bi-directional power flows between producers and consumers [
5]. As such, they play a central role in building sustainable, low-carbon smart cities and resilient energy ecosystems. However, as the complexity of SPDSs increases, so do the operational challenges. The integration of diverse components (ranging from smart meters and IoT-enabled sensors to cloud-based controllers and decentralized energy assets) exposes the system to a broad range of vulnerabilities [
7,
8]. These include cyberattacks, sensor malfunctions, data transmission errors, and physical faults. In this highly interconnected environment, even a minor anomaly can propagate quickly, disrupting grid stability and affecting energy availability and safety [
9,
10].
Ensuring the security, reliability, and resilience of SPDSs has thus become a critical research priority. Early detection of anomalies is essential to prevent fault escalation, minimize service disruptions, and maintain grid health [
11]. Given the time-sensitive and mission-critical nature of power delivery, any anomaly detection solution must be both highly accurate and computationally efficient. The data generated by SPDSs (characterized by their high volume, heterogeneity, and temporal dependencies) further complicates the design of robust monitoring and detection frameworks [
12,
13,
14]. These demands highlight the necessity for intelligent, adaptive, and scalable solutions that can operate autonomously within complex, dynamic environments [
15,
16,
17,
18]. Anomaly detection models must be capable of understanding context, learning temporal behavior, and generalizing to unseen patterns (without relying on rigid rules or static thresholds) [
19,
20,
21]. This sets the stage for advanced machine learning (ML) and deep learning (DL) approaches in this domain [
22,
23,
24]. Despite recent advances in the application of DL to anomaly detection, significant limitations persist [
25]. Traditional statistical and threshold-based methods often fail to generalize beyond predefined conditions and are highly sensitive to noise or distributional shifts [
26,
27,
28]. On the other hand, many DL-based methods rely heavily on large labeled datasets, which are scarce in real-world SPDSs due to the rarity of labeled anomalies. Moreover, the majority of existing models lack mechanisms for adaptive decision-making and often ignore the sequential nature of power grid data [
29,
30].
While models like convolutional neural networks (CNNs) excel at spatial feature extraction and recurrent neural networks (RNNs) handle sequential learning, their isolated use is insufficient for complex anomaly scenarios [
31,
32,
33]. CNNs may fail to capture long-range temporal dependencies, whereas RNNs often suffer from vanishing gradients or training instability when applied to deep architectures [
34]. Additionally, classical reinforcement learning (RL) models have been explored for adaptive control in smart grids, but they typically struggle with sparse reward signals, inefficient exploration, and slow convergence [
35,
36,
37]. Another key challenge lies in hyper-parameter sensitivity. DL models require careful tuning of structural parameters such as the number of layers, learning rates, activation functions, and neuron configurations [
38,
39]. Suboptimal choices may lead to slow learning, overfitting, or poor generalization. Yet, in many existing studies, hyper-parameter tuning is either manual or based on brute-force search, which is inefficient and computationally expensive, especially in deep architectures deployed over large-scale grid data. These limitations collectively motivate the need for a novel, intelligent framework that unifies the strengths of spatial, temporal, and adaptive learning while also incorporating a systematic and automated optimization mechanism. A next-generation anomaly detection model must be not only accurate and adaptive, but also able to converge efficiently with minimal human intervention and computational overhead [
40].
In this work, we propose a novel framework that integrates deep RL (DRL) with CNN and RNN to effectively extract both spatial and temporal features from SPDS data while learning optimal policies for anomaly classification. The CNN component is responsible for extracting localized patterns and spatial correlations from multidimensional sensor inputs. The RNN module captures sequential dependencies and evolving trends across time, which are critical for modeling system behavior in time-series formats. To further enhance performance, we introduce a novel optimization algorithm based on the non-dominated sorting artificial bee colony (NSABC) method. This evolutionary strategy is used to automatically fine-tune key hyper-parameters of the DRL architecture, including learning rates, neuron counts, layer configurations, and exploration strategies. By combining multi-objective search and swarm intelligence, the NSABC method allows our framework to achieve improved convergence speed, accuracy, and generalization without relying on manual trial-and-error.
While traditional ML and optimization techniques such as support vector machines (SVM), particle swarm optimization (PSO), and ABC have been widely applied to anomaly detection in smart grid environments, they exhibit inherent limitations in scalability and adaptability [
41]. SVM-based models, though effective for binary classification tasks on moderate-sized datasets, often struggle with high-dimensional and heterogeneous SPDS data. Their static decision boundaries and dependency on manual feature engineering limit their ability to generalize across dynamically evolving grid environments. Similarly, PSO-based frameworks, while offering efficient parameter optimization, typically face convergence issues in high-dimensional search spaces and are sensitive to initial conditions, leading to suboptimal exploration of complex anomaly patterns. In contrast, the proposed DRL-NSABC framework, which synergistically integrates RL, CNN, RNN, and NSABC optimizer, overcomes these limitations. The hybrid architecture not only captures both spatial and temporal dependencies inherent in SPDS data but also adapts its learning policy dynamically through reinforcement signals. The embedded NSABC optimization further enhances model scalability by intelligently fine-tuning hyper-parameters in large search spaces without exhaustive search, ensuring robust performance across diverse operational conditions. This comprehensive integration ensures superior adaptability, convergence efficiency, and generalization capability compared to conventional SVM or PSO-based anomaly detection methods. The proposed DRL-NSABC model is designed to operate across a wide range of SPDS configurations and is evaluated on four publicly available benchmark datasets. Our results demonstrate significant improvements in detection accuracy, reduced false positives, and faster convergence compared to state-of-the-art methods. Through the integration of CNN, RNN, DRL, and evolutionary optimization, our approach offers a robust and scalable solution for real-time anomaly detection in next-generation power distribution systems.
1.1. Related Works
In recent years, the rapid evolution of smart grid infrastructures and the growing reliance on data-driven control mechanisms have led to increased interest in intelligent anomaly detection techniques. Accurate and timely identification of anomalies is essential for maintaining the reliability, safety, and resilience of SPDSs. To this end, a wide range of ML and DL approaches have been proposed, each aiming to address different facets of the anomaly detection problem, including classification accuracy, real-time response, adaptability, and computational efficiency. In this section, we review and compare several state-of-the-art studies that apply various ML, DL, and optimization techniques to anomaly detection in power grids, with a particular focus on their methods, datasets, performance, and limitations. These works provide valuable insights and serve as comparative baselines for evaluating the novelty and effectiveness of our proposed DRL-NSABC framework.
Gu et al. [
25] introduced a method called LFPR-DNN to detect electricity theft in advanced metering infrastructure (AMI) systems with a focus on minimizing the false positive rate (FPR), which is a significant issue in data-driven anomaly detection. Their model combines a one-dimensional CNN and a residual network to automatically extract features from electricity consumption data. The innovation lies in the proposed two-stage training approach: initially using a traditional gradient descent with focal loss to handle class imbalance, followed by an evolutionary PSO algorithm specifically to optimize FPR. They constructed multiple objective functions to guide this optimization, ensuring a balanced trade-off between detection performance and minimizing false alarms. The Irish smart meter dataset was used for evaluation, where synthetic fraud scenarios were injected into normal consumption patterns to simulate theft. The model achieved outstanding results, with an area under the curve (AUC) of 99.42% and FPR as low as 0.29%, significantly outperforming conventional classifiers such as SVM, decision trees, and even other DL-based approaches like CNNs. A comprehensive sensitivity analysis further demonstrated the robustness of the proposed method under varying sampling rates and dataset sizes. Despite the model’s high accuracy and reliability, limitations include dependency on large labeled datasets and a relatively complex architecture. The study concluded that optimizing FPR directly using evolutionary strategies within a DL framework can substantially enhance the commercial feasibility of electricity theft detection systems in real-world AMI deployments.
Duan [
30] proposed a novel DL framework for anomaly detection in intelligent power distribution systems by integrating transformer architectures with GAN. The key challenge addressed in this work is the difficulty of detecting anomalies in power systems due to the dynamic and complex nature of the data and the limited generalizability of conventional models. The proposed transformer-GAN model leverages the attention mechanism of transformers to capture temporal dependencies and uses the generative strength of GANs to better learn and reconstruct complex data distributions, which helps in identifying subtle or unknown anomalies. This approach allows the model to adapt robustly across different datasets and variable data patterns, improving both anomaly classification and resilience to unseen disturbances. The experimental results demonstrated strong performance across multiple power system datasets, achieving an accuracy of up to 95.18% and a maximum AUC of 96.64%, along with high recall and F1-scores. These outcomes validate the model’s ability to accurately distinguish between normal and anomalous events. The main advantages of this work include its superior adaptability, high anomaly detection precision, and scalability across diverse smart grid scenarios. The combination of transformer and GAN technologies in a single framework represents a significant advancement in DL-based anomaly detection for AI-powered power systems, with promising implications for industrial automation and future smart grid infrastructures.
Siniosoglou et al. [
5] proposed a DL-based intrusion detection system (IDS) named MENSA, specifically designed for smart grid environments. The system addresses the dual problem of detecting anomalies and classifying cyberattacks in critical infrastructures using a unified architecture that combines an autoencoder (AE) and a generative adversarial network (GAN). Their methodology supports two core functionalities: (1) anomaly detection on operational data (e.g., time-series electricity measurements), and (2) multiclass classification of Modbus/TCP and DNP3 cyberattacks. A significant innovation in MENSA is its dynamic deep threshold discovery, enabling it to adapt its detection threshold per case for optimal performance. The authors validated MENSA using real-world datasets collected from four different smart grid environments: a smart grid lab, a distribution substation, a hydropower plant, and a power plant. These datasets included both Modbus/TCP and DNP3 protocol flows as well as operational measurements. In terms of performance, MENSA demonstrated strong results. It achieved an average accuracy of 94.7%, a recall of 81.2%, and an F1 score of 79.4%. In several test cases, MENSA outperformed conventional ML models as well as other advanced IDS frameworks such as ARIES and BlackBox IDS. Notably, its modular and non-intrusive architecture allows real-time operation without burdening existing smart grid components. However, one of the key limitations is the dependence on labeled data for classification tasks and the experimental tuning required for optimal latent layer selection in its encoder–decoder pipeline. Nonetheless, MENSA stands out for its scalability, robust cyberattack discrimination, and adaptability to various protocols and smart grid setups, making it a strong contender for deployment in complex smart grid environments.
Jithish et al. [
6] proposed a distributed anomaly detection framework for smart grid systems based on federated learning (FL). Instead of sending raw energy consumption data from smart meters to a central server, their method trains ML models directly on local edge devices, preserving user privacy and reducing the risks associated with centralized data aggregation. The system addresses challenges such as limited bandwidth, latency, and centralized computational load. They evaluated seven different ML models in both centralized and federated settings. The experiments were conducted on three benchmark datasets: KDD99, NSL-KDD, and CIDDS-001, widely used for intrusion and anomaly detection. Their results showed that the federated models achieved performance close to centralized training while significantly reducing communication overhead and maintaining data security. To further validate their approach in a practical context, they deployed their models using real-world data from the Ausgrid dataset, which contains three years of residential electricity consumption data from Australia. A prototype smart meter system was implemented using Raspberry
Pi hardware, and the models were trained locally on-device. Among the models, 1D-CNN in federated mode demonstrated excellent performance in terms of accuracy, recall, and AUC, while also being efficient in terms of CPU usage, memory consumption, power draw, and bandwidth. The key innovation of the study lies in applying FL to smart grid metering environments with real hardware and conducting a comprehensive resource usage analysis. The advantages of their approach include high privacy preservation, low latency, and feasibility in resource-constrained settings. However, they noted limitations related to network synchronization and the challenge of training on non-IID data distributions, which are common in real-world federated setups.
Qi et al. [
7] proposed a semi-supervised anomaly detection framework tailored for identifying cyberattacks in smart grid environments. Their key motivation lies in the challenges of collecting labeled attack data for supervised models, which may lead to poor generalization to novel or unseen attacks. They utilized phasor measurement unit (PMU) data from the ICS power system attack datasets, which simulate multiple realistic attack scenarios like false data injection, relay setting modification, and remote tripping. Their core methodology integrates deep AE for deep representation learning, reducing dimensionality and extracting robust latent features, followed by the application of various semi-supervised outlier detection algorithms. The innovation here is the augmentation of unsupervised anomaly detection methods with DAE, which had not been explored previously using PMU-based cyber-physical data in smart grids. Their experiments were conducted using 15 datasets derived from simulated attack scenarios in the power system framework. Performance was evaluated using AUC and F1-score, where the best semi-supervised models demonstrated superior ability to detect attacks compared to the supervised counterparts. The use of DAE further improved both AUC and F1 scores significantly, outperforming classical linear dimensionality reduction methods like PCA. Among the noted limitations were a higher false positive rate (FPR) in semi-supervised methods and the need for further optimization. Nonetheless, the study presents a robust, scalable solution for anomaly detection in smart grids, emphasizing privacy preservation and adaptability to unknown threats.
Takiddin et al. [
8] designed an unsupervised anomaly detection method for electricity theft in smart grids, focusing on overcoming the scarcity of malicious labeled data. They proposed a suite of deep AE architectures, each enhanced with sequence-to-sequence long short-term memory (LSTM) layers to better capture the temporal patterns in smart meter data. These models were trained only on benign consumption profiles, making them suitable for zero-day cyberattack scenarios. The AEA model, in particular, used an attention mechanism to overcome limitations in traditional sequence encoders and demonstrated the highest performance. Their work utilized two datasets: the State Grid Corporation of China (SGCC) dataset and the Irish Smart Energy Trial (ISET), each offering real or synthetically attacked consumption patterns. The best model achieved a detection rate (DR) of 94% and a false alarm (FA) rate of 5%, outperforming other AE variants and traditional models. Their method demonstrated strong generalization and the ability to detect complex, time-varying anomalies, even under unseen attack scenarios. The primary advantage of this study lies in its practical, low-complexity deployment capability for real-time monitoring without relying on malicious data during training. However, the models are still reliant on optimal hyper-parameter tuning and attention mechanisms, which may require adaptation across diverse smart grid environments.
Choubey et al. [
9] proposed a contrastive learning-based model to enhance anomaly detection in electricity load data. The central idea involves using a Siamese neural network to extract discriminative features by generating positive and negative pairs of consumption patterns. This approach reduces the need for large labeled datasets, addressing the limitations of traditional supervised models that often underperform in scenarios with limited or imbalanced data. Their innovation lies in leveraging contrastive loss to train the model to bring similar pairs closer and push dissimilar pairs apart in feature space, thereby improving the ability to distinguish between normal and anomalous behaviors. They used data from the SGCC, which had been preprocessed to handle imbalance and standardized before being fed into the model. Notably, the AE reached the highest performance with 95.65% accuracy, 96% precision, 93% recall, and an AUC of 95.32%. While traditional models achieved accuracy rates ranging from 59% to 69%, integrating contrastive learning significantly boosted these scores. The key advantage of their method is its strong generalization capability, scalability, and reduced reliance on labeled data. However, they also noted limitations in scalability for very large datasets and suggested future directions in distributed learning and domain adaptation to overcome these constraints.
Alam et al. [
10] introduced a real-time fault detection system aimed at monitoring leakage current in electrical appliances without requiring sensor installation on each individual device. Their framework combines a rule-based classifier (RBC) to detect device and overload faults, with a multiclass SVM (MSVM) to identify and classify leakage current anomalies using historical current data. The system utilizes a microcontroller-based safety monitoring device (SMD) equipped with LoRa for low-power, long-range communication, transmitting real-time electrical parameters to a cloud-based server. Their experiments, conducted across five residential buildings in South Korea, evaluated MSVM using various kernel functions and achieved a peak accuracy of 98.77% using a linear kernel, along with a strong F1-score and ROC-AUC values. While the system shows excellent performance in terms of detection accuracy, responsiveness, and energy efficiency, it comes with certain limitations. The approach relies on predefined thresholds and labeled data, making it less flexible in dynamic environments or large-scale smart grid infrastructures. Its design is more suited for static residential monitoring and may not adapt well to evolving grid behaviors or unknown anomalies. Although it provides a practical and efficient solution for home safety, the lack of DL or adaptive modeling limits its scalability for broader, unsupervised anomaly detection scenarios in complex IoT-enabled systems.
Wang et al. [
13] proposed a unified ML-based framework for real-time electrical load forecasting and unsupervised anomaly detection, aiming to handle challenges related to energy efficiency, anomaly identification, and computational complexity in smart grid environments. Their method integrates three main modules: a Training Data Generator (TDG), a one-step-ahead prediction model (OSAP) based on XGBoost with quantile regression, and a look-back optimizer (LBO). The TDG module efficiently selects relevant data from raw historical meter readings, allowing its system to operate without relying on weather or occupancy data. The LBO further enhances prediction accuracy by dynamically adjusting prediction intervals and detecting anomalies based on deviations from expected trends. Their approach was evaluated using a real-world dataset from the University of California, Irvine, which features high complexity due to a mix of energy sources and consumption patterns. The framework achieved strong results across 12 evaluation metrics, outperforming conventional methods, including DNN, LSTM, and attention-based Bi-LSTM. For anomaly detection, they used an unsupervised mechanism that avoided the need for labeled data and demonstrated robustness to class imbalance, a common limitation in anomaly detection systems. The UCI dataset they used had over 57,000 data points and presented an extreme imbalance ratio (~1171), yet their model maintained high detection accuracy. Overall, their method stands out for data efficiency, high accuracy, and practical feasibility.
1.2. Paper Contributions and Organization
The main contributions of this paper can be summarized as follows:
We propose a novel DRL-based framework that integrates CNN and RNN with a meta-heuristic optimizer to address the challenges of accurate, adaptive, and efficient anomaly detection in smart power distribution systems, simultaneously improving detection accuracy, convergence speed, and generalization across diverse IoT-based datasets;
In this work, we design a custom deep architecture that integrates CNN with RNN to exploit both spatial and temporal patterns inherent in SPDS data. While the CNN component effectively captures localized anomaly signatures from multi-channel sensor inputs, the RNN layer models temporal dependencies and dynamic transitions over time. This hybrid CNN-RNN structure ensures robust feature extraction across heterogeneous and sequential datasets, enabling the model to detect complex and subtle anomalies that static methods may overlook;
To optimize the learning process and improve model adaptability, we propose a novel NSABC algorithm that performs multi-objective optimization over the hyper-parameters of the DRL framework. Unlike traditional versions of ABC, which rely on basic scout and employed bee strategies, the proposed NSABC integrates a custom migration mechanism inspired by biogeography-based optimization (BBO) to enhance exploitation without sacrificing exploration. This allows for the dynamic tuning of critical parameters such as learning rates, neuron counts, and discount factors, resulting in faster convergence, reduced overfitting, and improved generalization to unseen data;
We conduct an extensive experimental evaluation of the proposed DRL-NSABC framework using four publicly available and diverse benchmark datasets (smart grid, AMI, smart meter, and Pecan Street). These datasets cover a wide range of IoT-enabled power distribution scenarios and contain time-series measurements with varying complexity, resolution, and domain characteristics. Our comparative analysis includes six well-established baseline models, ensuring that the results are not only statistically significant but also representative of real-world deployment challenges in SPDS anomaly detection;
The proposed DRL-NSABC framework is comprehensively evaluated against six widely used baseline models, including RL, CNN, RNN, GAN, time-series transformer (TST), and bidirectional encoder representations from transformers (BERT). Experimental results across four benchmark datasets demonstrate that the proposed model consistently outperforms all baselines in terms of accuracy, recall, and AUC. In addition to improved predictive performance, the DRL-NSABC model achieves faster convergence and lower execution time, confirming its computational efficiency and suitability for real-time anomaly detection in smart power distribution systems.
The remainder of this paper is organized as follows:
Section 2 describes the four benchmark datasets used in the study, outlines the data preprocessing pipeline, and provides a detailed explanation of the developed algorithms, including the proposed DRL-NSABC model and its individual components.
Section 3 presents a comprehensive evaluation of the proposed method compared to six baseline models, covering multiple performance metrics across all datasets.
Section 4 (discussion) analyzes the findings in terms of detection accuracy, computational efficiency, and practical implications in smart grid environments. Finally,
Section 5 summarizes the main contributions, highlights the significance of the proposed framework, and outlines potential directions for future research.
2. Materials and Proposed Methods
This section presents the key materials, datasets, and methodological components utilized in the development and evaluation of the proposed DRL-NSABC framework. We begin by introducing four benchmark datasets (smart grid, AMI, smart meter, and Pecan Street), each offering diverse and representative samples of real-world power system behavior. A comprehensive data preprocessing pipeline is then outlined, detailing cleaning, normalization, and sequence preparation steps to ensure that the input data are consistent, accurate, and well-structured for training DL and RL models. Following the data-related foundation, the remainder of this section systematically describes the core algorithmic modules integrated into the proposed architecture. First, we provide background on standard RL and its mathematical formulation. Then, the roles of CNNs and RNNs are explained in the context of spatial and temporal feature extraction, respectively. The section continues with a detailed explanation of the proposed NSABC algorithm, designed to optimize the hyper-parameters. Finally, the complete DRL-NSABC model is presented, combining RL, CNNs, RNNs, and the NSABC method into a unified anomaly detection framework for smart power distribution systems.
2.1. Dataset
To ensure a thorough and diverse evaluation of the proposed DRL-NSABC framework, we employ four publicly available and widely acknowledged datasets: smart grid, AMI, smart meter, and Pecan Street. These datasets originate from authoritative sources and encompass a broad spectrum of power system data, making them ideal for testing the robustness, adaptability, and accuracy of anomaly detection models in smart power distribution environments. Each dataset contributes uniquely to the experimental setup, offering variations in temporal behavior, consumption profiles, system events, and environmental factors. These four datasets provide a comprehensive benchmark for validating the proposed DRL-NSABC model across a variety of real-world conditions and operational scales. They allow us to assess the model’s accuracy, generalization, and resilience in detecting anomalies in highly dynamic and data-rich power distribution systems [
30].
The smart grid dataset, based on data compiled by Zidi et al. (2023) [
42], represents a rich collection of real-world operational metrics from modern power grids. It contains detailed records such as electricity load profiles, meter readings, power quality indicators, renewable generation data (solar and wind), electricity pricing, and historical outage events. These features are essential for analyzing system efficiency, reliability, and fault conditions within the context of a smart grid infrastructure. By utilizing 2500 samples, we aim to capture a wide range of system states and scenarios to train and validate our model under dynamic grid conditions;
The AMI dataset, introduced by Ibrahem et al. (2022) [
43], provides extensive insights into electricity usage collected through smart metering infrastructure. It includes high-resolution measurements of energy consumption, voltage and current fluctuations, power factor variations, and time-stamped usage behavior. Such data plays a pivotal role in studying consumer demand patterns, monitoring power quality, and supporting intelligent energy management. In our study, we leverage over 3000 samples from this dataset to evaluate the model’s performance in scenarios involving large-scale smart metering and granular demand-side data;
Next, the smart meter dataset, as presented by Pereira et al. (2022) [
44], focuses on energy usage at the residential and commercial building level. It offers a detailed breakdown of consumption patterns, voltage levels, and indicators of power quality, providing a clear view of localized energy behaviors. This dataset is particularly useful for evaluating the model’s capability to detect anomalies arising from end-user consumption irregularities or local system disturbances. We employ 2000 samples to represent typical building-level variations and to test the model’s adaptability to small-scale yet complex usage profiles;
Lastly, the Pecan Street dataset, collected and shared by Yang et al. (2022) [
45], offers a holistic view of residential energy consumption in combination with environmental context. It includes not only electricity usage data from smart meters but also environmental measurements such as temperature, humidity, and solar radiation. This combination enables deeper analysis of how external factors influence energy demand, which is crucial for understanding anomaly patterns in eco-aware smart grids. We use 1500 samples from this dataset to evaluate the model’s performance under varying environmental and behavioral conditions [
30].
To prepare the datasets for robust and consistent training across all evaluated models, we designed a comprehensive preprocessing pipeline that ensures data quality, uniformity, and suitability for both DL and RL frameworks. Given that the datasets originate from different sources with varying structures, feature distributions, and units, initial efforts were directed toward data cleaning. This step involved identifying and handling missing values using interpolation techniques when the proportion of missing data exceeded 5%. In cases of extreme incompleteness, corresponding records were removed to prevent skewed learning. Additionally, outlier detection was performed using statistical thresholds such as the interquartile range (IQR), and identified anomalies were either corrected or excluded to enhance dataset consistency.
Following cleaning, feature selection was applied to retain only meaningful numerical attributes relevant to the anomaly detection task, including voltage, current, energy consumption, power factor, and environmental conditions such as temperature and solar radiation. To bring all features onto a comparable scale and stabilize gradient-based optimization, we applied normalization using the min-max method, rescaling all values into the [0, 1] range. In contrast to standard Z-score normalization, this method was selected for its simplicity and compatibility with models sensitive to bounded input values. Furthermore, the temporal order of the data was preserved to enable effective sequence modeling within time-series-aware architectures such as RNNs and LSTM. In the final stage, the datasets were divided into training, validation, and testing subsets using a 70%-15%-15% split ratio. This structure ensures adequate data availability for model training, hyper-parameter tuning, and final evaluation, while also supporting fair generalization assessment and preventing overfitting. Where appropriate, stratified sampling was used to maintain a representative distribution of temporal patterns across subsets. All input sequences were then padded or truncated to ensure fixed-length representations, making them compatible with batch-wise training in deep models such as CNN-RNN and transformer-based networks.
2.2. RL
RL is a decision-making framework where an agent learns to interact with an environment to achieve long-term objectives through trial and error. As illustrated in
Figure 1, the core components of an RL system include the agent, the environment, and the interaction loop between them. The environment represents the external system with which the agent interacts [
35]. At each time step, the environment provides the agent with a state that describes the current situation. Based on this state, the agent selects an action through its internal policy. The environment then transitions to a new state and provides a corresponding reward signal, which quantifies the immediate benefit (or cost) of the action taken. The agent itself consists of two key elements: the policy, which defines the strategy for selecting actions, and the learning algorithm, which updates this policy over time based on the received feedback. The policy can be deterministic or stochastic, mapping states to actions or action probabilities. The learning algorithm adjusts the policy using the information gathered from the environment in order to improve future decisions. This internal structure is depicted in the lower section of
Figure 1, where the policy is refined via policy updates generated by the learning algorithm.
The interaction cycle forms a continuous feedback loop: the agent observes the state, chooses an action, receives a reward, and transitions to a new state. Over time, the goal of the agent is to learn an optimal policy that maximizes cumulative reward. This cycle allows the agent to learn from delayed consequences of its actions, making RL especially powerful in sequential decision-making tasks [
36]. The RL framework can be rigorously described using a Markov decision process (MDP), defined by the tuple (
). Here,
denotes the set of all possible states the environment can be in,
represents the set of all actions available to the agent,
is the transition probability of reaching state
from state
after taking action
, and
defines the reward function, which provides scalar feedback for action
in state
. The parameter
is the discount factor, which determines how future rewards are valued relative to immediate rewards. At each time step
, the agent receives a reward
and transitions to a new state
. The goal of the agent is to maximize the return, which is the total expected cumulative reward over time. This is mathematically represented by the return function
, shown in Equation (1):
To guide the learning process, RL defines two key evaluation metrics: the state-value function and the action-value function. The state-value function
, defined in Equation (2), measures the expected return when starting in state
and following a policy
thereafter [
37]:
In Equation (2), the expectation
is taken over all possible trajectories induced by the policy
, which specifies the probability of selecting actions in each state. Complementarily, the action-value function
, defined in Equation (3), estimates the expected return when the agent starts in state
, takes action
, and then continues following policy
. This function gives a more fine-grained evaluation by incorporating the initial action, helping the agent to assess the immediate value of each possible decision in a given state.
The update rule for the Q-value is provided in Equation (4). This equation describes how the Q-value for state-action pair is updated using a learning rate
, the observed reward
, the estimated maximum future Q-value
from the next state
, and the current estimate
). The term inside the brackets is known as the temporal difference (TD) error, which measures the gap between the current estimate and a more accurate target based on recent experience [
35,
36,
37].
2.3. CNN
CNNs are a specialized class of deep neural networks (DNNs) primarily designed to process data with a grid-like topology, such as images [
32]. They were first introduced by Yann LeCun in the late 1980s and early 1990s, with the most notable early implementation being the LeNet-5 architecture, developed for handwritten digit recognition. CNNs gained widespread popularity due to their outstanding performance in visual recognition tasks and their ability to automatically learn spatial hierarchies of features from input data. A typical CNN architecture, as shown in
Figure 2, consists of a series of interconnected layers that progressively extract more abstract and complex features from the input data. The pipeline begins with input data, usually in the form of a 2D image. The first major component is the convolutional layer, which applies a set of learnable filters (kernels) to the input image. Each filter slides over the image spatially and computes a dot product between the filter weights and the overlapping input patch, producing a feature map [
33]. This process is mathematically described by Equation (5):
where
is the input image,
represents the kernel weights, and
is the resulting feature map.
After each convolutional operation, the resulting feature maps are typically passed through a non-linear activation function, most commonly the rectified linear unit (ReLU), which replaces negative values with zero. This activation introduces non-linearity into the model, enabling it to learn more complex representations. As the figure illustrates, the convolutional layer is followed by a pooling layer, often referred to as subsampling or down sampling. Pooling reduces the spatial dimensions of the feature maps, preserving the most salient information while reducing the computational complexity and helping to control overfitting. The most common pooling method is max pooling, which selects the maximum value within each patch. Following several convolution and pooling stages, the output is then flattened into a one-dimensional vector preparing the data for the fully connected layers. These layers behave like a traditional feed forward neural network, where each neuron is connected to all neurons in the previous layer. The fully connected layers integrate the high-level features extracted by the convolutional blocks and perform the final classification or regression task, producing the network’s output, seen on the far right of the figure. CNNs offer several significant advantages. First, their use of local receptive fields and parameter sharing (through convolutional kernels) makes them highly efficient and scalable to high-dimensional inputs like images. Second, the hierarchical structure allows CNNs to learn low-level features (e.g., edges) in early layers and progressively build up to more abstract features (e.g., shapes, textures, objects) in deeper layers. Finally, CNNs require minimal pre-processing and feature engineering, making them ideal for tasks such as image classification, object detection, and segmentation [
34].
2.4. RNN
RNNs are a class of neural networks designed specifically for modeling sequential data [
31]. Unlike traditional feed forward networks, RNNs include loops that allow information to persist across time steps, making them ideal for tasks where context and temporal order are crucial. The concept of RNNs was introduced in the 1980s, with foundational work by scholars such as Rumelhart and Williams, who proposed the idea of back propagation through time (BPTT) to train these networks. As depicted in
Figure 3, the architecture of a standard RNN consists of a sequence of repeating neural units. Each unit receives an input vector from the current time step (denoted as
) and a hidden state from the previous time step (
). This hidden state acts as a form of memory, allowing the network to capture temporal dependencies in the input sequence. The RNN processes input one element at a time while maintaining and updating its internal state. This structure forms a feedback loop, clearly illustrated in the figure, where information flows not just forward but also across time steps. After processing the sequence, the final hidden states are typically passed through a dense (fully connected) layer, followed by an output layer that produces the final prediction. The internal computation of an RNN unit is detailed in
Figure 4, which illustrates the internal mechanism of a single RNN cell. At each time step, the network computes the current hidden state
using the input
, the previous hidden state
, and associated weights and biases. This operation is defined mathematically by Equation (6):
In this equation,
represents the weight matrix for the recurrent connection between consecutive hidden states,
is the weight matrix that connects the input to the hidden state, and
is the bias vector. The
tanh function introduces non-linearity and bounds the hidden state values between −1 and 1 [
32].
As seen in
Figure 4, both the input and previous hidden state are linearly transformed and summed with a bias before passing through the activation function. This mechanism allows the RNN to maintain a dynamic memory of past inputs, making it capable of learning time-dependent relationships in data. RNNs offer several key advantages. First, they are inherently suited to temporal modeling, making them effective for tasks such as language modeling, speech recognition, time series forecasting, and anomaly detection in sequential data. Second, they share parameters across time steps, which reduces the total number of parameters and makes them more efficient for sequence processing. Third, their ability to retain previous information through hidden states provides a natural way to incorporate historical context into predictions [
31].
2.5. Proposed NSABC
The ABC algorithm is a bio-inspired meta-heuristic proposed by Karaboğa in 2005, inspired by the foraging behavior of honeybees in nature [
46]. It is based on how bees search for nectar sources, share information, and collectively decide which sources to exploit. The standard ABC algorithm divides the bee colony into three groups: employed bees, onlooker bees, and scout bees. These bees cooperate to explore the search space, exploit promising regions, and maintain diversity. Each food source in this context represents a potential solution to the optimization problem, and the quality of the food source corresponds to its fitness. The search mechanism of the ABC algorithm is defined using a set of key operations. One of the core processes is the probabilistic selection of food sources by onlooker bees based on their relative fitness, as defined in Equation (7) [
46]:
This equation determines the probability
of selecting
i-th solution. Here,
is the fitness value of
i-th individual, and the denominator represents the total fitness of all solutions in the current population (with
being the number of food sources). This mechanism ensures that better solutions are more likely to be chosen for further exploration. Once a food source is selected, employed bees perform local exploitation by generating new candidate solutions around existing ones. This operation is given by Equation (8):
In this expression,
is the new solution generated for
j-th dimension of
i-th food source,
is the current position,
is a randomly selected neighboring solution, and
is a random number within the range [−1, 1]. This operator balances exploration and exploitation by perturbing the current solution in the direction of a neighbor. If a solution cannot be improved over a certain number of iterations, it is abandoned and replaced by a scout bee using an initialization strategy. The scout bee operation is formulated in Equation (9):
Here, is the new randomly generated value for j-th dimension of solution , bounded within the range , and is a uniformly distributed random number. This operation reintroduces diversity and prevents the algorithm from premature convergence.
One of the key strengths of the ABC algorithm lies in its well-balanced structure between exploration and exploitation, enabled by its biologically inspired operator design. Specifically, the scout bee mechanism plays a vital role in exploration by randomly initializing new candidate solutions when others stagnate, effectively introducing diversity and enabling the search to escape local optima. On the other hand, the employed bee phase contributes to exploitation by performing neighborhood searches around high-quality food sources, intensifying the search in promising regions. This division of responsibilities allows ABC to maintain a dynamic search process throughout its iterations. Despite its effectiveness in exploration, ABC tends to suffer from limited exploitation capability, especially in high-dimensional or complex search spaces. While scout bees excel in exploring new areas, the exploitation mechanism based on random perturbations around the current solution can lack precision and depth. To address this limitation, we propose a novel migration-based exploitation model that enhances the refinement phase of the algorithm. This model is specifically inspired by the BBO algorithm [
41], which is known for its powerful migration operators used to improve solution quality through guided information exchange. The proposed migration mechanism introduces three new emigration–immigration strategies, as shown in Equations (10)–(12).
where
represents the rank of the bee in terms of suitability,
is the total number of bees,
is immigration rate, and
is an emigration rate.
In the first strategy (Equation (10)), bees with lower ranks are assigned high emigration rates and low immigration rates, reflecting their role as good donors of information. In the second strategy (Equation (11)), bees with mid-level ranks receive moderate emigration and immigration rates using logarithmic and exponential formulations, balancing their role as both donors and receivers. Finally, the third strategy (Equation (12)) applies to lower-quality bees with higher ranks, assigning them higher immigration rates using a hyperbolic tangent function to encourage them to adopt traits from more successful peers. This migration-based model is applied exclusively to the employed bees, strengthening the local search process and improving the algorithm’s ability to converge toward optimal solutions. By incorporating rank-based migration influenced by BBO, the proposed method significantly improves the exploitation capability of the standard ABC while preserving its natural exploratory strengths, resulting in a more robust and efficient multi-objective optimizer.
The novel non-dominated sorting ABC (NSABC) algorithm extends the original ABC framework to handle multi-objective optimization problems, where multiple conflicting objectives need to be optimized simultaneously. Instead of maintaining a single best solution, NSABC maintains a Pareto front of non-dominated solutions. In this context, a solution is said to be non-dominated if no other solution is better in all objectives. In NSABC, during the selection phase, individuals are assigned to different non-domination levels, and a crowding distance metric is often used to preserve diversity among the Pareto-optimal solutions. The onlooker bees then select food sources not only based on fitness but also on their dominance rank and diversity, ensuring that the search explores a broad range of trade-offs between the objectives. The integration of non-dominated sorting into ABC allows it to effectively solve complex multi-objective problems by simultaneously exploring multiple regions of the objective space and converging towards the true Pareto front. The overall optimization process of the proposed NSABC algorithm is illustrated in
Figure 5, which outlines the full execution flow from start to convergence. Initially, the algorithm begins with population initialization and parameter setup, followed by the generation of scout bees and the evaluation of their corresponding fitness across multiple objectives. The next phase performs non-dominated sorting, where solutions are ranked based on Pareto dominance to identify elite candidates. After checking the termination condition, the algorithm proceeds by selecting the top-performing employed bees, which are then exploited through neighborhood search driven by onlooker bees. Uniquely, a migration mechanism, inspired by BBO, is applied at the end of each cycle to strategically enhance solution diversity and reinforce exploitation. This flow ensures that exploration and exploitation are adaptively balanced across generations, ultimately driving the algorithm toward an accurate and well-distributed Pareto front.
2.6. Proposed DRL-NSABC
The overall architecture of the proposed model is illustrated in
Figure 6, which presents the flowchart of the DRL-NSABC framework designed for efficient anomaly detection in SPDS. The interaction begins with the environment sending the current state to the agent. The agent comprises a deep hybrid model based on CNN-RNNs, which processes the input data and generates an action according to a learned policy, denoted by
π. This action is then sent back to the environment, which responds with a new state and a reward signal. The reward evaluates the quality of the decision, and this feedback is used to improve the agent’s policy. Embedded within the agent is the NSABC optimization unit, which receives the learning error and updates the model’s hyper-parameters to enhance performance iteratively. To address the complexity and temporal dynamics of real-world IoT data in SPDSs, we integrate RL with DL architectures, resulting in a DRL model.
This hybridization leverages the strengths of each component: the CNN is responsible for hierarchical feature extraction from raw multi-dimensional input data, such as voltage readings, load curves, or sensor measurements, enabling the model to detect spatial patterns and local anomalies. Following the convolution and pooling layers, the feature maps are flattened and passed into an RNN, which captures temporal dependencies and sequential behaviors, crucial for recognizing time-series anomalies and detecting patterns that unfold over time. These deep representations are then fed into the policy network, which determines the optimal action based on the learned state-action mappings. This DRL-based architecture is particularly beneficial for anomaly detection in IoT-enabled power grids, as it combines spatial understanding (from CNNs) with temporal awareness (from RNNs) while continuously adapting to evolving environments through reinforcement signals. The DRL component allows the agent to learn not just from labeled data but also from experience, enabling real-time decision-making and robust generalization to unseen scenarios.
To further boost the model’s effectiveness, we introduce the novel NSABC algorithm as a global optimizer for hyper-parameter tuning. The proposed NSABC plays a critical role in enhancing learning efficiency by fine-tuning several components of the DRL model. Specifically, it optimizes the weights and biases of the CNN-RNN layers, the number of neurons and number of hidden layers, and key RL hyper-parameters such as the learning rate and discount factor. The search ranges for each parameter are defined as follows: the learning rate is considered within the range [0.0001, 0.01], the discount factor is varied between [0.8, 0.99], the number of neurons per hidden layer is selected from [16, 128], and the number of hidden layers is explored between [1, 10]. The initial weights and biases are also optimized within small perturbation ranges to accelerate convergence and improve generalization. These search spaces are carefully designed to maintain a balance between model complexity, computational efficiency, and convergence stability during the training process. Unlike grid search or random search, NSABC leverages both evolutionary search and multi-objective ranking (via non-dominated sorting) to identify optimal configurations that balance convergence speed, accuracy, and stability. By embedding this adaptive optimization loop into the agent, the model gains resilience, faster convergence, and improved detection accuracy across different types of anomalies and datasets.
3. Results
All experimental evaluations were conducted using Python 3.9, leveraging widely adopted libraries such as TensorFlow 2.9.1, Keras 2.9.0, and PyTorch 1.13.1 for DL implementation, as well as scikit-learn 1.1.1 for classical ML routines. Data preprocessing, model training, and performance assessment were all executed within this environment. Each model was trained and tested on the four benchmark datasets using consistent preprocessing and evaluation protocols to ensure fairness and comparability across experiments. The experiments were carried out on a high-performance computing setup to support training efficiency, especially for models involving deep architectures and sequence processing. To comprehensively assess the effectiveness of the proposed DRL-NSABC model, we compared its performance against six state-of-the-art baseline algorithms: RL, CNNs, RNNs, GANs, TST, and BERT. Each algorithm was selected based on its proven success in handling anomaly detection or time-series prediction tasks relevant to smart power systems.
RL was chosen for its ability to learn optimal decision-making policies through interaction with dynamic environments, making it directly comparable to our DRL-based agent. The CNN, known for its hierarchical feature extraction capabilities, was included to benchmark the spatial learning component independently. The RNN, with its strength in modeling temporal dependencies in sequential data, offers a natural baseline for comparison in time-series anomaly detection. GANs are widely used in unsupervised anomaly detection for their capacity to learn data distributions and detect deviations, serving as a strong generative baseline. TST, based on attention mechanisms, has recently shown great promise in capturing long-range dependencies in time-series data, offering a powerful alternative to traditional recurrent models. Finally, BERT, originally developed for language understanding, has been successfully adapted to time-series modeling and anomaly detection through self-supervised learning strategies, making it a modern and relevant benchmark for comparison. These baseline models were selected to reflect a diverse set of learning paradigms, allowing us to evaluate the strengths of the DRL-NSABC model across multiple perspectives and against a broad set of contemporary approaches
To evaluate the performance of the proposed DRL-NSABC model and the baseline algorithms, we employed a set of widely recognized metrics commonly used in anomaly detection and classification tasks. These include accuracy, recall, and area under the curve (AUC). Each of these metrics provides a unique perspective on the model’s predictive capability and generalization performance. Accuracy measures the overall correctness of the model’s predictions and is defined as the ratio of correctly classified instances (both true positives and true negatives) to the total number of samples. This metric is particularly useful for understanding the model’s global effectiveness across balanced datasets. In simpler terms, a higher accuracy indicates that the model is making correct predictions most of the time, providing a general sense of how reliable the model is in practice. As shown in Equation (13), accuracy is computed using the formula [
30]:
Recall, also known as sensitivity or true positive rate, quantifies the model’s ability to correctly identify actual anomalies. High recall is critical in anomaly detection tasks, where missing a true anomaly can have serious implications. A high recall means that the model successfully catches most of the real problems or faults in the system, minimizing the chance of undetected failures that could lead to operational risks. It is calculated as the proportion of true positives to the total number of actual positives, as illustrated in Equation (14):
AUC reflects the model’s performance in distinguishing between classes across all classification thresholds. It is computed as the area under the receiver operating characteristic (ROC) curve, which plots the true positive rate against the false positive rate. AUC provides a threshold-independent assessment of the model’s discriminative ability, with higher values indicating stronger performance. A higher AUC value implies that the model can more reliably differentiate between normal and anomalous instances, even when the decision threshold changes, making it a robust indicator of overall detection capability. The AUC is defined mathematically in Equation (15):
where
is the ROC curve at threshold
[
30].
In addition to the above evaluation metrics, we also analyze the convergence behavior and execution time of each model. Convergence is assessed by observing the learning curve, including the reduction in training loss or improvement in performance metrics over epochs, which provides insights into the model’s learning efficiency and stability. Execution time is recorded to evaluate the computational cost, a crucial factor when deploying models in real-time or resource-constrained smart grid environments. Together, these metrics offer a comprehensive evaluation framework, enabling both accuracy-centered and efficiency-centered comparisons across all tested models. An essential factor influencing the performance of ML and DL models is the careful tuning of hyper-parameters, which directly affect model convergence, generalization, and accuracy. Improperly selected hyper-parameters can lead to underfitting, overfitting, or unstable training behavior. To ensure fairness and optimal performance across all models, we employed grid search, a widely used and systematic approach to hyper-parameter selection. Grid search exhaustively explores combinations within predefined parameter ranges to find the configuration that yields the best performance on validation data. However, for the proposed DRL-NSABC framework, we adopted the NSABC meta-heuristic optimization algorithm instead of grid search. The proposed NSABC algorithm enabled more intelligent and adaptive tuning by dynamically adjusting key hyper-parameters based on feedback from the learning process, thus improving convergence speed and predictive accuracy. The full set of tuned parameters for all models is presented in
Table 1, which outlines the calibration details used in the experiments.
For the DRL-NSABC model, NSABC was employed to optimize critical components such as the learning rate (0.003), discount factor (0.93), and ε-greedy range (0.18–0.96), along with architecture-level hyper-parameters like the number of convolution layers (6), kernel size (5 × 5), and pooling strategy (Max pooling 2 × 2). Additionally, the number of employed, onlooker, and scout bees was set to 120, 80, and 150, respectively, and the iteration count was fixed at 300. These values were adaptively selected to balance exploration and exploitation in the policy learning process, contributing to superior model performance. For BERT, the embedding size and sequence length were both set to 64, with four transformer encoder layers and four attention heads per layer. RNN and CNN models were tuned with a learning rate of 0.041 and 0.003, respectively, using six or eight layers, and Tanh or Sigmoid activations. In the GAN model, a low convergence threshold (0.061), along with momentum (0.04) and ReLU activation, helped stabilize training. For RL, the learning rate and ε-greedy schedule (0.006 and 0.21–0.95) were similar to DRL configurations. Finally, the TST model employed four transformer layers, four attention heads, a learning rate of 0.035, and a dropout of 0.2, aligning with best practices for TST. The diverse range of parameters across models, as detailed in
Table 1, reflects the specific architectural and functional needs of each method. This fine-grained calibration ensured that all models operated under their best-known conditions, enabling a fair and meaningful comparison against the proposed DRL-NSABC framework.
Table 2 presents the comparative performance results of the proposed DRL-NSABC model against six baseline algorithms evaluated on four benchmark datasets: smart grid, AMI, smart meter, and Pecan Street. As presented in
Table 2, the performance of all evaluated models was benchmarked across three critical metrics. These metrics reflect the models’ ability to correctly detect anomalies (accuracy), capture true positives (recall), and discriminate between normal and abnormal conditions across different thresholds (AUC). The DRL-NSABC architecture consistently outperforms all other methods across all datasets and metrics, validating its robustness, adaptability, and precision in SPDS anomaly detection. On the smart grid dataset, the DRL-NSABC model achieves the highest accuracy (95.83%), recall (96.21%), and AUC (98.27%). The closest competitor, BERT, trails by approximately 4.4% in accuracy and 5.6% in AUC. Classical models like the CNN and RNN show significantly lower performance, with the RNN scoring the lowest across all three metrics (accuracy: 81.76%, recall: 80.18%, AUC: 82.13%), indicating their limited capability in capturing complex grid behavior patterns. TST performs moderately well due to its attention-based mechanism, but still lags behind DRL-NSABC by at least 5% in AUC.
On the AMI dataset, the superiority of the proposed DRL-NSABC model is even more pronounced. It secures a 96.19% accuracy and a 98.10% AUC—both of which are the highest among all models. BERT and GAN are relatively competitive but still show a gap of 6–8% in AUC. RL, CNN, and RNN models again underperform, especially in recall, where DRL-NSABC’s 96.86% vastly exceeds the RNN’s 83.42% and CNN’s 85.23%. The sequential and heterogeneous nature of AMI data likely challenges shallow or non-attention-based models more severely. The trend remains consistent on the smart meter dataset, where DRL-NSABC achieves 96.61% accuracy and 96.63% AUC. This dataset includes fine-grained, household-level consumption data that requires learning both short-term fluctuations and long-term trends—tasks where the CNN-RNN hybrid architecture, optimized through NSABC, clearly excels. BERT performs second best, but with noticeable gaps (accuracy: 89.24%, AUC: 90.74%). TST, despite being designed for time series, fails to match the effectiveness of DRL-NSABC, particularly in handling real-world variability and noise.
The Pecan Street dataset also validates the consistent advantage of DRL-NSABC, with top scores across the board (accuracy: 96.45%, recall: 96.35%, AUC: 95.63%). BERT and TST again follow in performance, while models like RL, CNNs, and RNNs show limitations in generalization and fail to reach AUC values above 85%. This dataset combines energy usage with environmental data, making it a strong test of multi-dimensional modeling capacity, where the integrated CNN-RNN-DRL structure proves its edge. The superiority of DRL-NSABC in this anomaly detection task can be attributed to several architectural strengths. First, CNN layers excel at extracting spatial and localized anomaly features, while RNNs model sequential dependencies critical in time-series signals. These layers are fine-tuned using DRL, allowing the model to learn optimal representations through trial-and-error interaction with the environment. Moreover, the NSABC optimizer dynamically adjusts the hyper-parameters, providing superior convergence and generalization compared to static settings in baseline models. Together, these elements create a powerful, adaptive, and intelligent anomaly detection framework tailored to the diverse and dynamic nature of smart power distribution systems.
To enhance the interpretability of the numerical results presented in
Table 2, we provide a radar chart visualization in
Figure 7, which focuses specifically on the accuracy metric across all four datasets. This figure offers an intuitive, side-by-side comparison of how each model performed, allowing for quick visual identification of the most and least effective methods under different data conditions. These radar plots reinforce the findings from
Table 2 by offering a visual confirmation of DRL-NSABC’s dominant accuracy performance across heterogeneous smart grid datasets. The circular format of the plots makes it especially easy to observe relative gaps between models and to appreciate the consistently high ranking of the proposed method in a compact, visual form. From the radar plots, it is immediately evident that DRL-NSABC consistently dominates in all four datasets. For example, in
Figure 7a, representing the smart grid dataset, DRL-NSABC clearly outperforms all baseline models, forming the widest spike in the radar plot at the top. BERT follows closely, while traditional models like the CNN and RNN form the inner-most boundaries, indicating lower accuracy levels.
To provide a more focused and visual understanding of the models’ behavior across the recall and AUC metrics,
Figure 8 presents grouped bar charts extracted from the numerical results in
Table 2. Each subplot corresponds to one of the four datasets and compares the performance of DRL-NSABC with six baseline models. Across all datasets and both metrics, DRL-NSABC consistently outperforms other methods, achieving the highest recall and AUC values. This confirms its strength in correctly identifying true anomalies while maintaining robust discriminative ability regardless of classification thresholds. In contrast, models like the RNN and CNN show much lower bars, indicating their limited ability in handling the sequential and complex nature of IoT-based anomaly detection. BERT and TST perform moderately well but still lag behind DRL-NSABC, particularly in recall, which is critical in safety-sensitive smart grid environments. Overall, this figure highlights the generalization power and reliability of the proposed framework when deployed across diverse smart power distribution datasets.
Figure 9 displays the accuracy convergence behavior of all tested models across 300 training epochs, offering a clear view of how quickly and effectively each algorithm learns on each dataset. These curves help assess both convergence speed and final performance stability, which are essential in real-world smart grid scenarios where training time and reliability are critical. In the smart grid dataset, the DRL-NSABC model (blue curve) rapidly reaches over 85% accuracy within the first 50 epochs and stabilizes near 95% by epoch 150, clearly outpacing all baselines. BERT and TST show steady but slower climbs, converging around epochs 200–250. Traditional models like CNN and RNN display sluggish learning, with RNN barely crossing 80% accuracy even at the final stage. In the AMI dataset, the DRL-NSABC curve again shows a sharp ascent early in training, surpassing 90% by epoch 120, and stabilizing well before other methods. The GAN and RL require substantially more time to reach comparable levels, and the CNN/RNN again demonstrate slower, flatter convergence, suggesting difficulty adapting to the variability in AMI data.
In the smart meter dataset, DRL-NSABC achieves over 90% accuracy by epoch 100 and levels off near 97% in the second half of training. GAN, BERT, and TST show similar shapes but lag behind in both speed and final performance. Notably, RNN and CNN remain under 90% throughout, indicating limited temporal modeling capability when applied to finer-grained residential energy data. Pecan Street reinforces the DRL-NSABC model’s dominance, with convergence near 95% by epoch 130 and strong stability thereafter. Competing models take between 200 and 300 epochs to approach that range, and most plateau at lower ceilings. The early acceleration of DRL-NSABC indicates highly efficient learning dynamics, attributed to both its integrated architecture and NSABC-based hyper-parameter tuning. The convergence trends across all datasets validate that DRL-NSABC not only achieves the highest final accuracy but also converges faster and more smoothly than all baselines. This makes it a highly practical and scalable solution for smart grid anomaly detection where training efficiency and performance consistency are crucial.
The ROC curves presented in
Figure 10 illustrate the comparative performance of the proposed DRL-NSABC framework against six baseline models across the four benchmark datasets. In each subplot, the x-axis represents the false positive rate (1-specificity), and the y-axis represents the true positive rate (sensitivity), providing a comprehensive visualization of the trade-offs between correctly detected anomalies and false alarms. Across all datasets, the DRL-NSABC model consistently achieves the highest ROC curves, demonstrating a superior ability to distinguish between normal and anomalous states. Notably, the curves corresponding to DRL-NSABC are significantly closer to the top-left corner, indicating better sensitivity and specificity compared to the baseline models. The improvements are particularly pronounced in the smart grid and AMI datasets, where the DRL-NSABC model exhibits a noticeably steeper ascent in the ROC curve at early thresholds, resulting in higher AUC values. This suggests that the proposed model not only detects more true anomalies with fewer false positives but also maintains robust generalization across different types of temporal and spatial anomalies. Although baseline models such as TST and BERT demonstrate relatively strong performance compared to GANs, CNNs, RL, and RNNs, they still lag behind the DRL-NSABC approach. These results clearly highlight the effectiveness of integrating CNNs, RNNs, and NSABC-based optimization within a reinforcement learning framework for achieving high-fidelity anomaly detection in complex smart power distribution environments.
To further enhance the robustness and interpretability of the evaluation, we performed independent two-sample
t-tests to statistically validate the performance differences between the proposed DRL-NSABC model and the baseline models. This statistical analysis ensures that the observed improvements are not due to random chance but reflect meaningful differences in model effectiveness across different datasets. The independent
t-test is a widely used statistical method for assessing whether the means of two independent groups are significantly different. In this study,
t-tests were applied separately for each dataset (smart grid, AMI, smart meter, and Pecan Street) to compare the DRL-NSABC model against each baseline model (BERT, TST, GANs, RL, CNNs, and RNNs). A significance level (
α) of 0.01 was considered, meaning that
p-values less than 0.01 indicate a statistically significant difference with 99% confidence. The results of the statistical
t-tests are presented in
Table 3. This table summarizes the
p-values obtained from the
t-tests for each model comparison across all four datasets, along with the corresponding significance conclusions.
Table 3 clearly demonstrates that the performance improvements achieved by the DRL-NSABC model are statistically significant across all datasets and in comparison to all baseline models. In every case, the
p-values are considerably lower than the significance threshold of 0.01, confirming that the observed accuracy gains are not random but are statistically meaningful. The results provide strong evidence that the hybrid architecture and optimization strategies of DRL-NSABC yield consistent advantages in anomaly detection for smart power distribution systems. Specifically, the
p-values are lowest when comparing DRL-NSABC against traditional DL models such as CNNs and RNNs, emphasizing the significant impact of integrating RL and evolutionary hyper-parameter tuning. Even when compared to more recent architectures like BERT and TST, DRL-NSABC consistently demonstrates significant superiority. These findings not only validate the effectiveness of the proposed model but also underline its robustness across diverse data characteristics and temporal patterns.
Table 4 presents the variance values of the performance of each model across four benchmark datasets. The variance values were computed after conducting multiple independent runs for each model on each dataset, thereby providing a measure of the consistency and stability of the model outputs. Lower variance indicates more stable and reliable performance across different training instances, while higher variance suggests greater fluctuations and potential sensitivity to initialization or data sampling. Variance is an important metric in evaluating the robustness of ML models, especially in dynamic environments like smart power distribution systems. Models with low variance demonstrate strong generalization capabilities, meaning that their performance is less likely to degrade across different deployments or under varying data conditions.
Conversely, high variance models may achieve high average performance in some runs but fail significantly in others, leading to unreliable behavior. Therefore, a robust anomaly detection framework must not only achieve high accuracy but also maintain low variance across diverse operational scenarios. The results in
Table 4 clearly show that the proposed DRL-NSABC model consistently achieves the lowest variance across all datasets, significantly outperforming all baseline models in terms of stability. In particular, DRL-NSABC’s variance values are orders of magnitude smaller than those of traditional architectures like CNNs, RNNs, and RL, and notably lower than more advanced models such as BERT and TST. This demonstrates that, beyond achieving higher accuracy, DRL-NSABC offers exceptional consistency and robustness, which are critical for real-world smart grid anomaly detection applications where stability and reliability are paramount.
Figure 11 illustrates the learning curves of the proposed DRL-NSABC model compared to six baseline models across the four benchmark datasets. Each subplot depicts the RMSE as a function of training epochs, providing insights into the convergence speed and training stability of each model. A lower RMSE value combined with a steeper decline indicates faster and more stable learning dynamics. As observed, the DRL-NSABC model consistently achieves the most rapid convergence across all datasets, reaching near-optimal RMSE levels significantly earlier than the baseline models. Specifically, the DRL-NSABC model demonstrates convergence within approximately the first 100 epochs on the smart grid and smart meter datasets, and within 120 epochs on the AMI and Pecan Street datasets. In contrast, baseline models such as RNNs, CNNs, and RL exhibit much slower convergence, with RMSE values decreasing gradually over 200 to 300 epochs without reaching comparably low error levels. Models like BERT and TST show relatively better convergence behavior compared to traditional architectures but still lag behind DRL-NSABC. These results highlight the efficiency of the proposed optimization strategy and its ability to accelerate learning while ensuring more stable training outcomes across heterogeneous and dynamic datasets.
4. Discussion
In this section, we interpret the experimental results of the proposed DRL-NSABC framework within the context of existing research and the hypotheses outlined in this study. Our objective was to design a model capable of achieving high anomaly detection performance while maintaining computational efficiency and adaptability across different types of smart power distribution datasets. The evaluation across four diverse datasets and multiple performance metrics confirms that this objective has been effectively achieved. The findings highlight not only the predictive superiority of the proposed approach but also its capability to generalize across heterogeneous environments. This discussion places our results in the broader context of smart grid anomaly detection research and demonstrates how our contributions address critical limitations in existing approaches, particularly in terms of false positive reduction, faster convergence, and deployment readiness in real-time grid monitoring systems.
To enhance the interpretability of the proposed DRL-NSABC framework, we analyzed the feature contributions to anomaly detection. Observations from model behavior suggest that voltage and current fluctuations were the most influential indicators for identifying anomalies across the datasets. Specifically, sudden drops or spikes in voltage values were highly correlated with anomaly detection events, while abnormal patterns in energy consumption provided additional confirmation. These findings align with the physical characteristics of power systems, where voltage instability and unexpected consumption behaviors often signal potential faults. This insight strengthens the practical applicability of the model, ensuring that detection decisions can be better understood and trusted by smart grid operators in real-world deployments.
Table 5 presents a comprehensive comparison between the proposed DRL-NSABC model and eight existing methods from the recent literature, evaluated across the same four datasets using the same three performance metrics. This table is crucial in assessing the competitiveness and novelty of our approach in the broader research context. It not only validates our model against internal baselines but also positions it among leading solutions in anomaly detection for smart power systems. Across all datasets, DRL-NSABC consistently outperforms previous models in nearly every metric. For instance, in the smart grid dataset, it achieves the highest AUC (98.27%) and accuracy (95.83%), surpassing even the strong baselines proposed by Duan et al. [
30] and Gu et al. [
25], which are otherwise among the top-performing approaches. Similarly, in the AMI dataset, DRL-NSABC secures the highest AUC (98.10%) and recall (96.86%), outperforming prior studies that focus heavily on smart metering infrastructures.
In the smart meter dataset, our model again leads in all three metrics, particularly recall (97.09%) and AUC (96.63%), demonstrating its robustness in handling granular household-level consumption data. While methods like those of Gu et al. [
25] and Wang et al. [
13] show competitive accuracy, they fall short in recall and AUC, which are more critical in anomaly detection where missing anomalies is costly. Lastly, in the Pecan Street dataset, DRL-NSABC continues to outperform the rest, with an accuracy of 96.45% and AUC of 95.63%, edging out even Duan et al. [
30], who recorded high but slightly lower values. Ranking the methods across all datasets, DRL-NSABC clearly stands at the top, followed by Duan et al. [
30] and Gu et al. [
25], who consistently appear in the top three for multiple datasets. In contrast, methods by Alam et al. [
10], Liao et al. [
18], and Azeroual et al. [
20] show more variability and generally lower recall or AUC, suggesting limited generalizability across heterogeneous smart grid settings. Overall, the results in
Table 3 highlight the superior generalization ability, precision, and sensitivity of our proposed framework. The integration of DRL with CNN and RNN components, coupled with NSABC-driven hyper-parameter tuning, has enabled our model to surpass not only conventional baselines but also the advanced literature methods, solidifying its relevance for real-world deployment in intelligent anomaly detection within SPDSs. To provide a more intuitive visual understanding of the numerical comparisons presented in
Table 5,
Figure 12 illustrates grouped bar charts of accuracy, recall, and AUC for each dataset.
Figure 12 allows for quicker insight into the relative performance of the proposed DRL-NSABC model compared to the existing literature, highlighting its consistency and superiority across all metrics and datasets. From a visual inspection of the charts, it is evident that DRL-NSABC (blue bars) consistently ranks highest or among the top in every evaluation criterion across all datasets. The gap between DRL-NSABC and other methods (such as those by Alam et al. [
10], Liao et al. [
18], or Azeroual et al. [
20]) is especially notable in AUC and recall, which are critical for reliable anomaly detection in smart power systems. Although a few methods, like Duan et al.’s [
30] or Gu et al.’s [
25], demonstrate strong performance in isolated metrics or datasets, none display the same level of all-around robustness. This visualization supports our claim that the combination of DRL, CNN, RNN, and NSABC optimization creates a powerful synergy that enables our framework to outperform not only conventional models but also advanced research contributions. The improved results are especially impactful for real-world anomaly detection applications in smart grids, where both high sensitivity (recall) and threshold-independent decision reliability (AUC) are crucial.
Table 6 presents the computational complexity analysis of all tested models in terms of the execution time required to reach specific accuracy thresholds. The termination condition for each model was defined as achieving a minimum target accuracy (e.g., >45%, >65%, etc.), and the run time until that threshold was reached was recorded in seconds. This evaluation is essential to understand not just the predictive power but also the practical feasibility and convergence efficiency of each algorithm, particularly for real-time or resource-constrained smart grid deployments. The results clearly demonstrate the superior convergence speed of the proposed DRL-NSABC model. It reaches all target thresholds significantly faster than all other models, including those with simpler architectures. For instance, DRL-NSABC reaches over 95% accuracy in just 859 s, while no other model in this comparison was even able to cross that mark within a reasonable time or training capacity. Even at lower thresholds like 85%, DRL-NSABC converges in 502 s, whereas BERT and GAN require over 800 and 1100 s, respectively, and models like RNN fail to reach higher accuracy levels altogether. These findings emphasize that the integration of NSABC for hyper-parameter tuning plays a vital role not only in achieving higher accuracy but also in accelerating convergence. Traditional models like CNNs, RNNs, and RL tend to be slower due to static parameter tuning and less adaptive learning mechanisms. Similarly, transformer-based models like TST and BERT, despite their modeling strength, exhibit higher computational loads due to their deeper and attention-heavy architectures. DRL-NSABC achieves the best balance between accuracy and efficiency, making it highly suitable for real-world smart grid anomaly detection systems, where fast and reliable decision-making is often mission-critical. Its ability to converge quickly to high-performance thresholds underlines its practicality for online and embedded implementations.
The results discussed in this section affirm that the proposed DRL-NSABC model offers a powerful and reliable framework for anomaly detection in smart power distribution systems. By leveraging the strengths of CNN and RNN for spatial and temporal feature learning, respectively, and combining them with the adaptive decision-making capacity of DRL, the model is capable of accurately capturing complex behaviors in time-series data. Unlike traditional DL methods that rely solely on static pattern recognition, our framework dynamically interacts with its environment to refine its policy over time, allowing for superior generalization and lower false alarm rates. This is particularly critical in smart grid environments, where system anomalies can be subtle, context-dependent, and costly if undetected. The integration of the NSABC algorithm introduces a unique optimization layer that distinguishes this work from prior studies. The use of a migration-enhanced, multi-objective ABC strategy enables the automatic tuning of hyper-parameters that would otherwise require time-consuming manual search or grid-based trial-and-error. This evolutionary mechanism not only accelerates convergence but also ensures that the model operates at optimal capacity across different datasets and operating conditions. From a practical standpoint, the ability to achieve high accuracy, high recall, and strong AUC while maintaining computational efficiency makes DRL-NSABC a highly deployable solution in real-world, IoT-driven energy systems. These strengths underline the significance of the proposed method as a forward-looking approach capable of addressing both the technical and operational challenges of modern smart grid anomaly detection.
5. Conclusions
In this paper, we proposed a novel evolutionary DRL-NSABC, designed to enhance anomaly detection in SPDSs. The proposed architecture integrates CNNs for spatial feature extraction, RNNs for temporal modeling, and RL for adaptive policy learning. To further optimize performance, we introduced a novel NSABC algorithm that dynamically tunes hyper-parameters such as weights, biases, layer configurations, and learning rates. The model was extensively evaluated on four benchmark datasets and benchmarked against six state-of-the-art DL models, including RL, CNNs, RNNs, GANs, BERT, and TST. The experimental results demonstrated that the DRL-NSABC framework consistently outperformed all baseline models in terms of accuracy, recall, AUC, convergence speed, and execution time. Specifically, our proposed model achieved the highest accuracy of 96.61% on the smart meter dataset, followed closely by 96.45% on Pecan Street, 96.19% on AMI, and 95.83% on the smart grid dataset. In terms of recall, DRL-NSABC also led with an average recall improvement of over 2.5% across all datasets compared to the best-performing baseline. Among all the models, BERT and TST were ranked second and third, respectively, while classical RL and CNN architectures demonstrated the lowest performance, further highlighting the advantages of hybrid and optimized frameworks. These outcomes confirm that our architecture not only surpasses traditional detection methods but also outperforms cutting-edge DL approaches previously reported in the literature. Another critical advantage of the DRL-NSABC model lies in its rapid convergence and lower computational overhead, making it suitable for real-time applications in dynamic SPDS environments. The integration of the NSABC optimizer significantly reduced training time while ensuring robust generalization to unseen data. Compared to brute-force or grid search methods commonly used in related works, the NSABC method demonstrated superior search efficiency and stability in high-dimensional hyper-parameter spaces. These findings validate the practical applicability of our approach in both centralized and distributed grid infrastructures.
The outstanding performance of the DRL-NSABC model can be attributed to the synergistic integration of its core components. CNNs enabled precise hierarchical feature extraction, RNNs captured sequential consumption behavior and long-range dependencies, RL facilitated decision-making based on experience, and the NSABC algorithm ensured optimal parameter tuning. This combination proved particularly effective in handling the heterogeneity, non-linearity, and temporal complexity of SPDS data. The fusion of spatial-temporal learning and adaptive control led to a significant reduction in false alarms and improved anomaly classification, which are essential for operational security and energy reliability. Importantly, the proposed method has strong implications for energy systems, as efficient and accurate anomaly detection is vital for minimizing energy losses, detecting cyberattacks, and preventing physical faults. By enabling early detection of abnormalities, the DRL-NSABC framework supports real-time grid monitoring, enhances grid resilience, and contributes to the development of more secure and sustainable smart energy infrastructures.
In addition to its superior performance, the proposed model addresses multiple critical gaps identified in the previous literature. Many earlier approaches suffer from poor generalization across heterogeneous datasets or rely heavily on manually tuned hyper-parameters, which limits their scalability and robustness. By introducing a bio-inspired optimization strategy through the NSABC method, our framework not only automates this tuning process but also ensures convergence to high-quality solutions with lower computational cost. Furthermore, the model’s compatibility with real-time monitoring scenarios makes it practical for deployment in modern grid management systems where decision latency and resource constraints are major considerations. The modular nature of the DRL-NSABC design is another notable strength. Each core component (CNNs, RNNs, RL, and the NSABC method) can be adapted or replaced depending on specific deployment environments or application needs. This flexibility enables the framework to evolve with future advancements in DL or optimization techniques. Moreover, the framework’s ability to extract both temporal and spatial correlations from streaming data makes it well-suited for integration with smart meter infrastructures, IoT-based sensors, and SCADA systems. As such, it provides a comprehensive and future-ready solution for intelligent anomaly detection in next-generation energy networks.
While the proposed DRL-NSABC demonstrates strong performance in anomaly detection across diverse SPDS datasets, future research can focus on extending its applicability to more complex, large-scale, and real-time grid infrastructures. One promising direction is the integration of the model into edge and fog computing architectures, enabling distributed processing closer to the data source. This would reduce latency, preserve bandwidth, and enhance privacy, especially in critical grid monitoring applications. Additionally, real-time implementation on hardware platforms like FPGAs or Raspberry Pi can be explored to evaluate practical deployment scenarios under resource-constrained environments. Another avenue for future exploration lies in the adoption of federated learning (FL) and privacy-preserving learning techniques. Since SPDS data are often generated across geographically dispersed nodes, centralizing them for training can pose privacy and scalability challenges. Incorporating FL into the DRL-NSABC framework would allow the model to be collaboratively trained across different nodes without sharing raw data. This approach can also help address data imbalance and heterogeneity by leveraging localized learning while still achieving global optimization performance. Furthermore, future efforts could expand the model’s input space to include richer contextual information, such as weather data, user behavior patterns, and network topology. The inclusion of such auxiliary features may improve the model’s predictive capabilities and robustness in dynamic environments. Advanced explainability and interpretability tools can also be integrated to provide transparent insights into the model’s decisions, which are crucial for operator trust and regulatory compliance in critical infrastructure systems. Finally, benchmarking the proposed method against new DL architectures, such as graph neural networks (GNNs) or transformer variants, could uncover additional opportunities for refinement and innovation.
In future work, we aim to enhance the real-time processing capabilities of the proposed DRL-NSABC framework by developing lightweight architectures and employing model compression techniques. Such improvements will enable faster inference and decision-making, which are critical for time-sensitive anomaly detection in large-scale smart grids. Integrating edge computing and decentralized learning strategies could further minimize latency and allow the framework to operate efficiently across distributed network nodes. Additionally, exploring the deployment of the DRL-NSABC framework in large-scale, heterogeneous smart grid environments remains a promising research direction. Future studies will focus on validating the model’s scalability and robustness when exposed to complex, geographically dispersed infrastructures, incorporating diverse energy sources, and handling dynamic operational conditions. Adapting the framework to real-world smart grid management systems will also involve addressing interoperability challenges and ensuring compliance with industry standards. Another important avenue for future research is the incorporation of online learning mechanisms, allowing the model to continuously adapt to evolving grid behaviors and emerging anomaly patterns. By enabling continuous learning from streaming data, the system could maintain high detection accuracy over time without requiring complete retraining, thus enhancing its long-term practicality and resilience in operational environments. In addition, we plan to enhance the proposed framework by integrating multimodal data sources, such as weather conditions, load profiles, and IoT sensor measurements. Incorporating such complementary information could significantly enrich feature representations, improve detection robustness, and further adapt the model to complex, dynamic smart grid environments.


 ,
, 

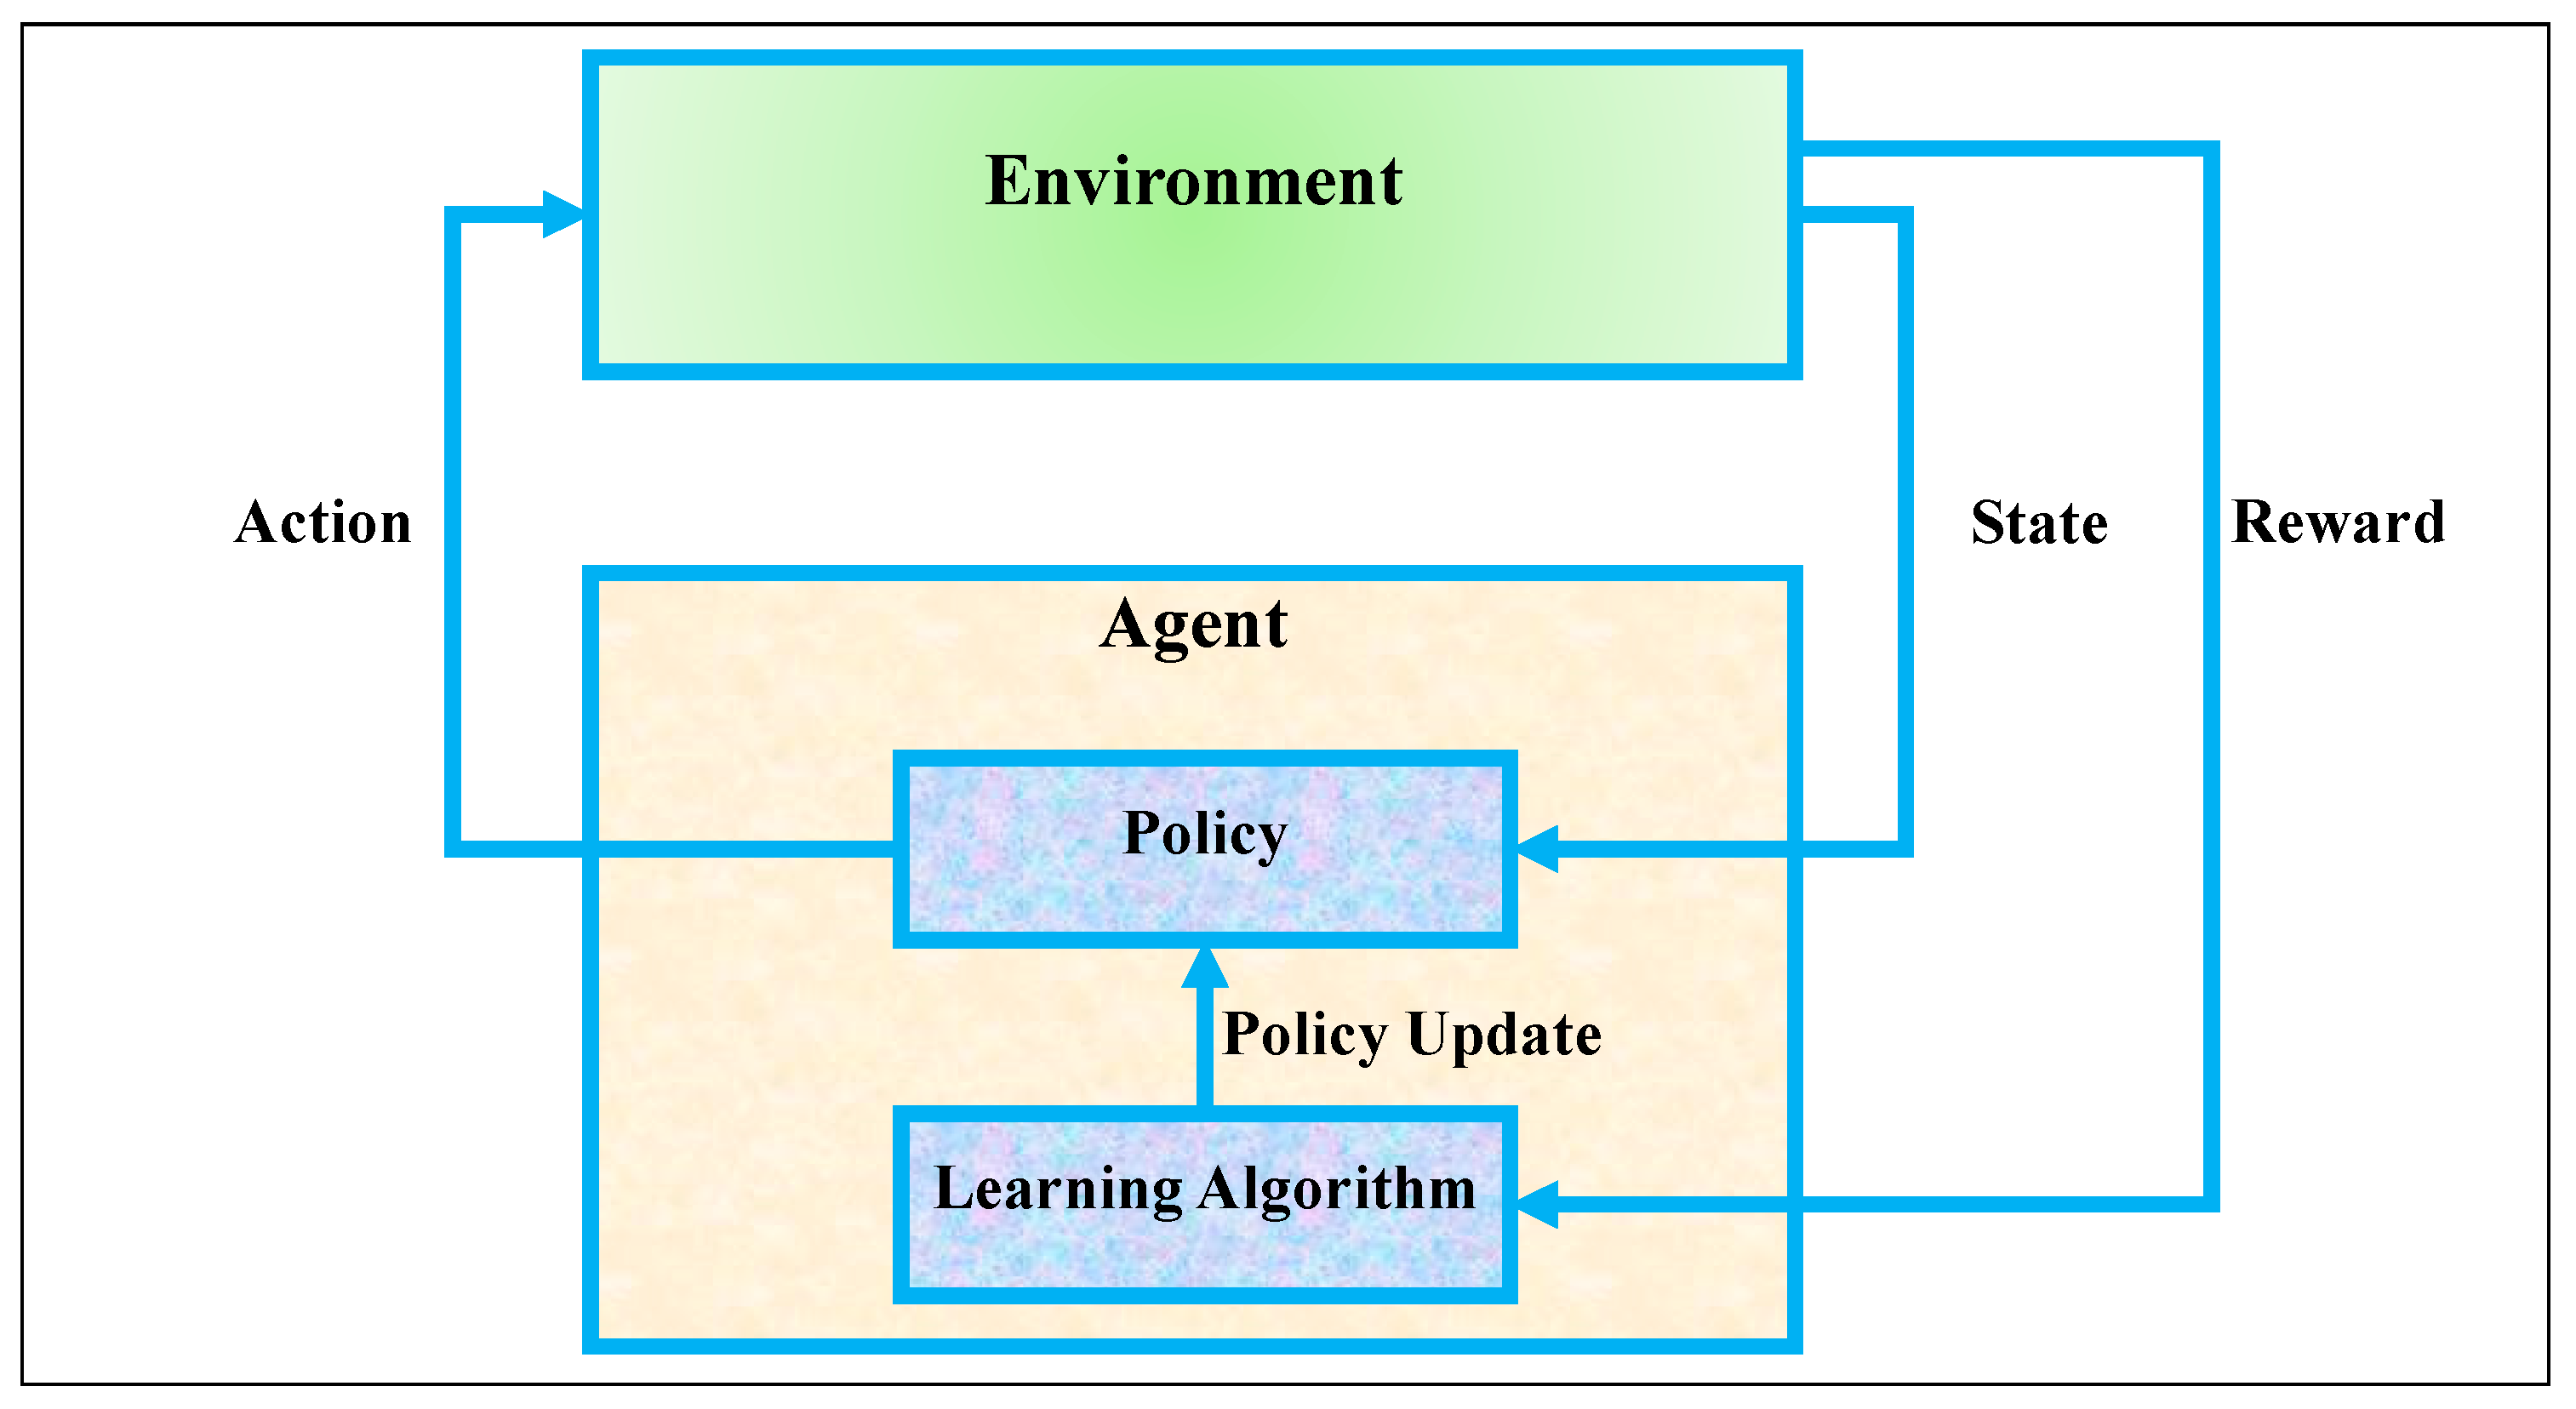
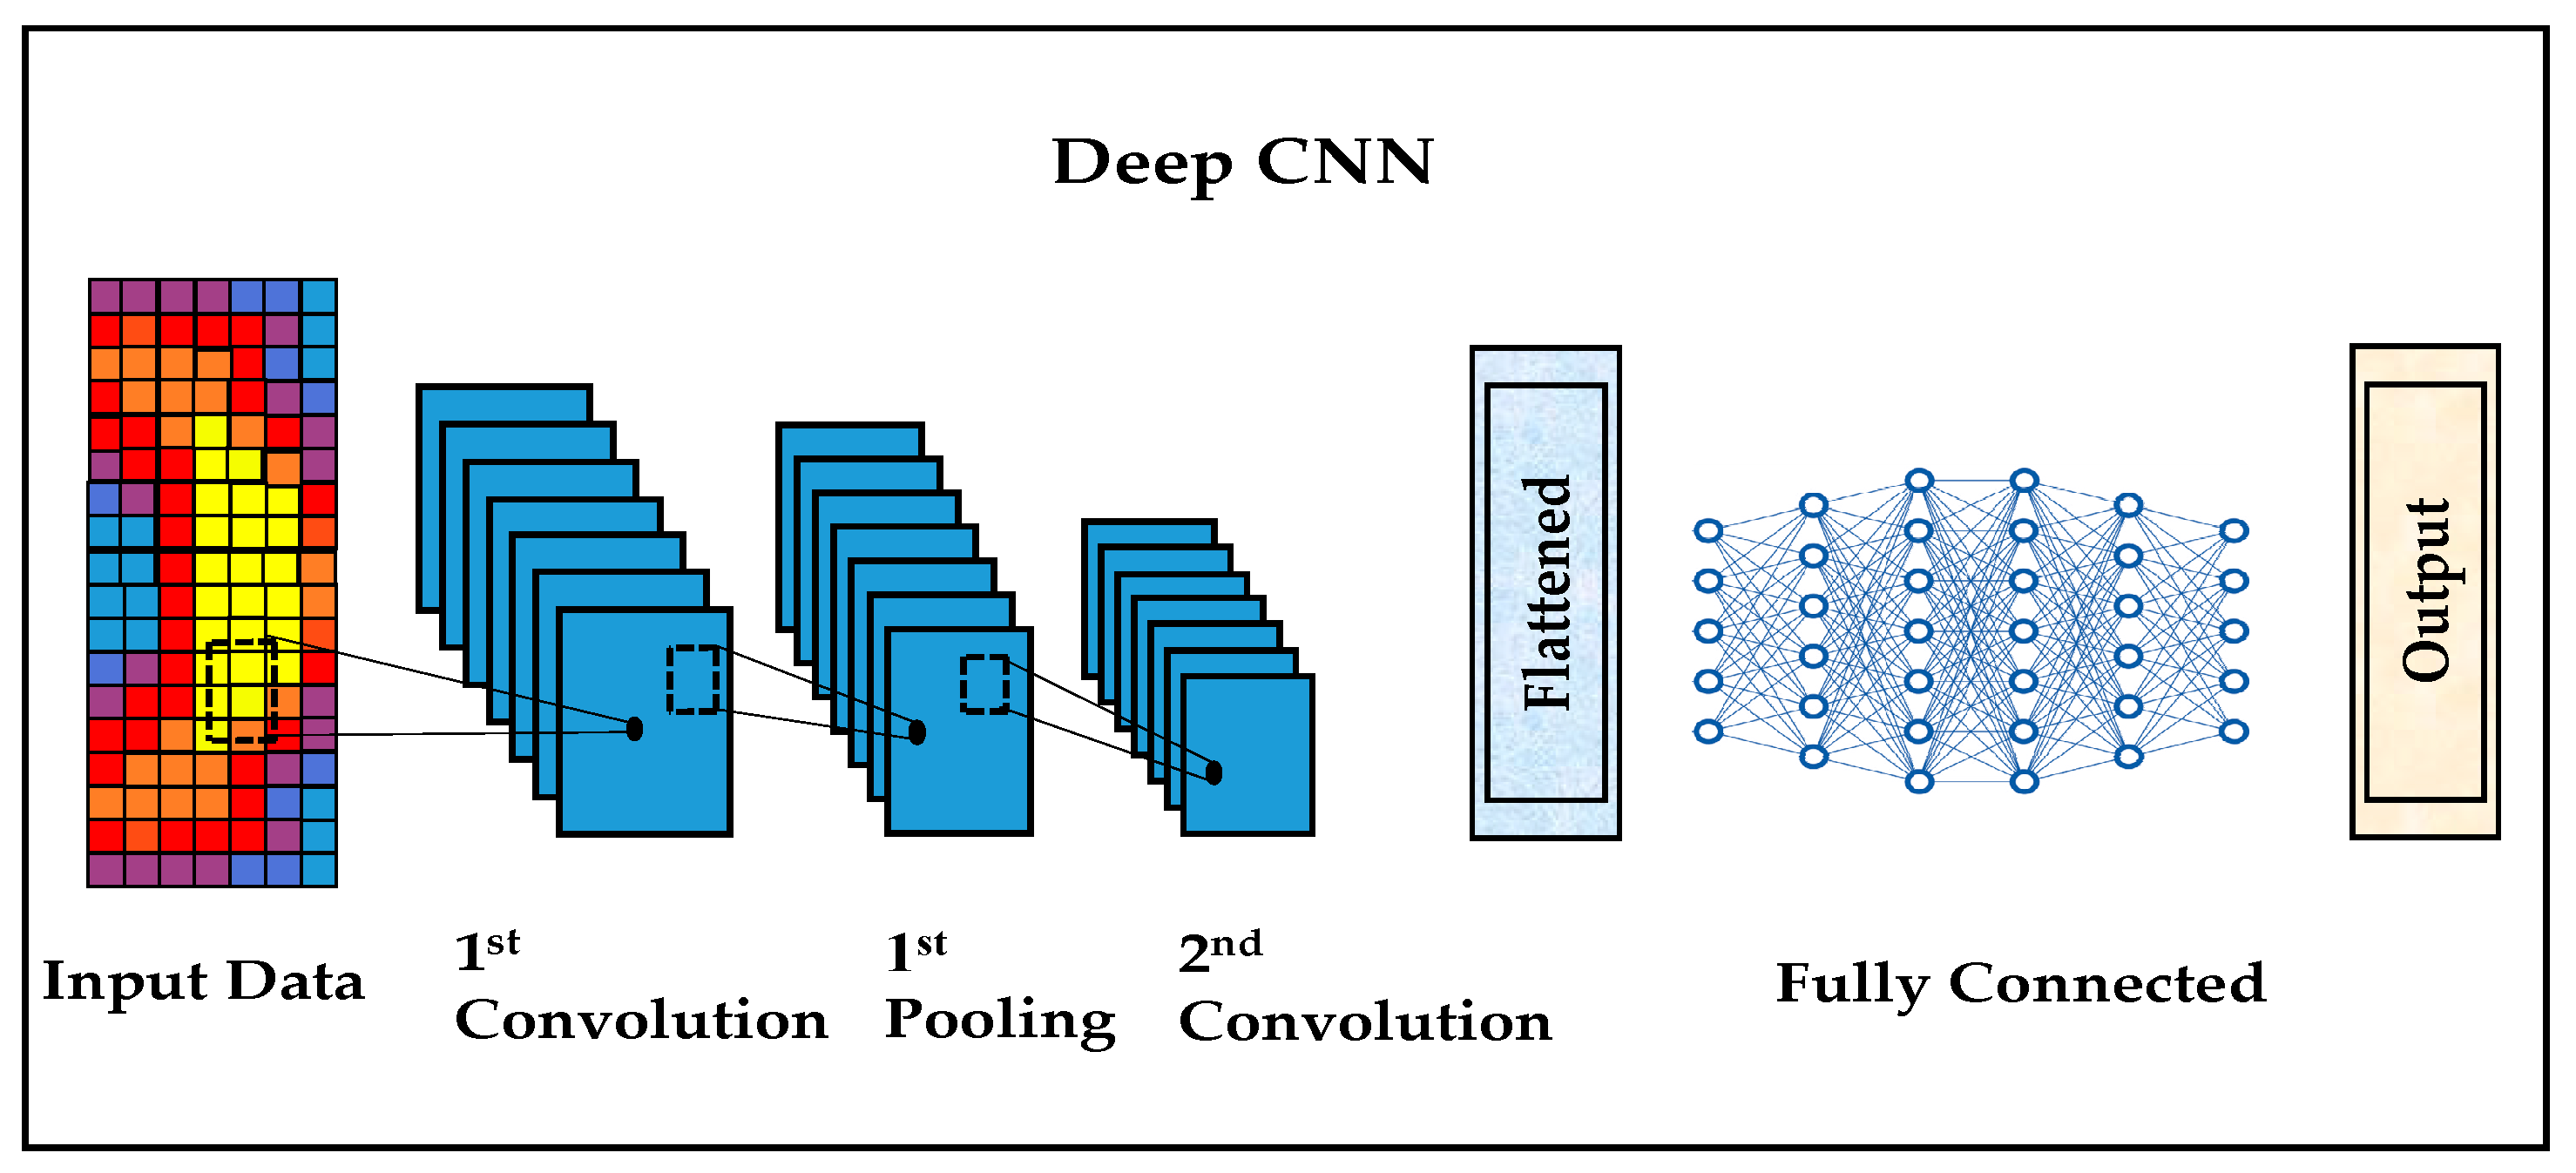
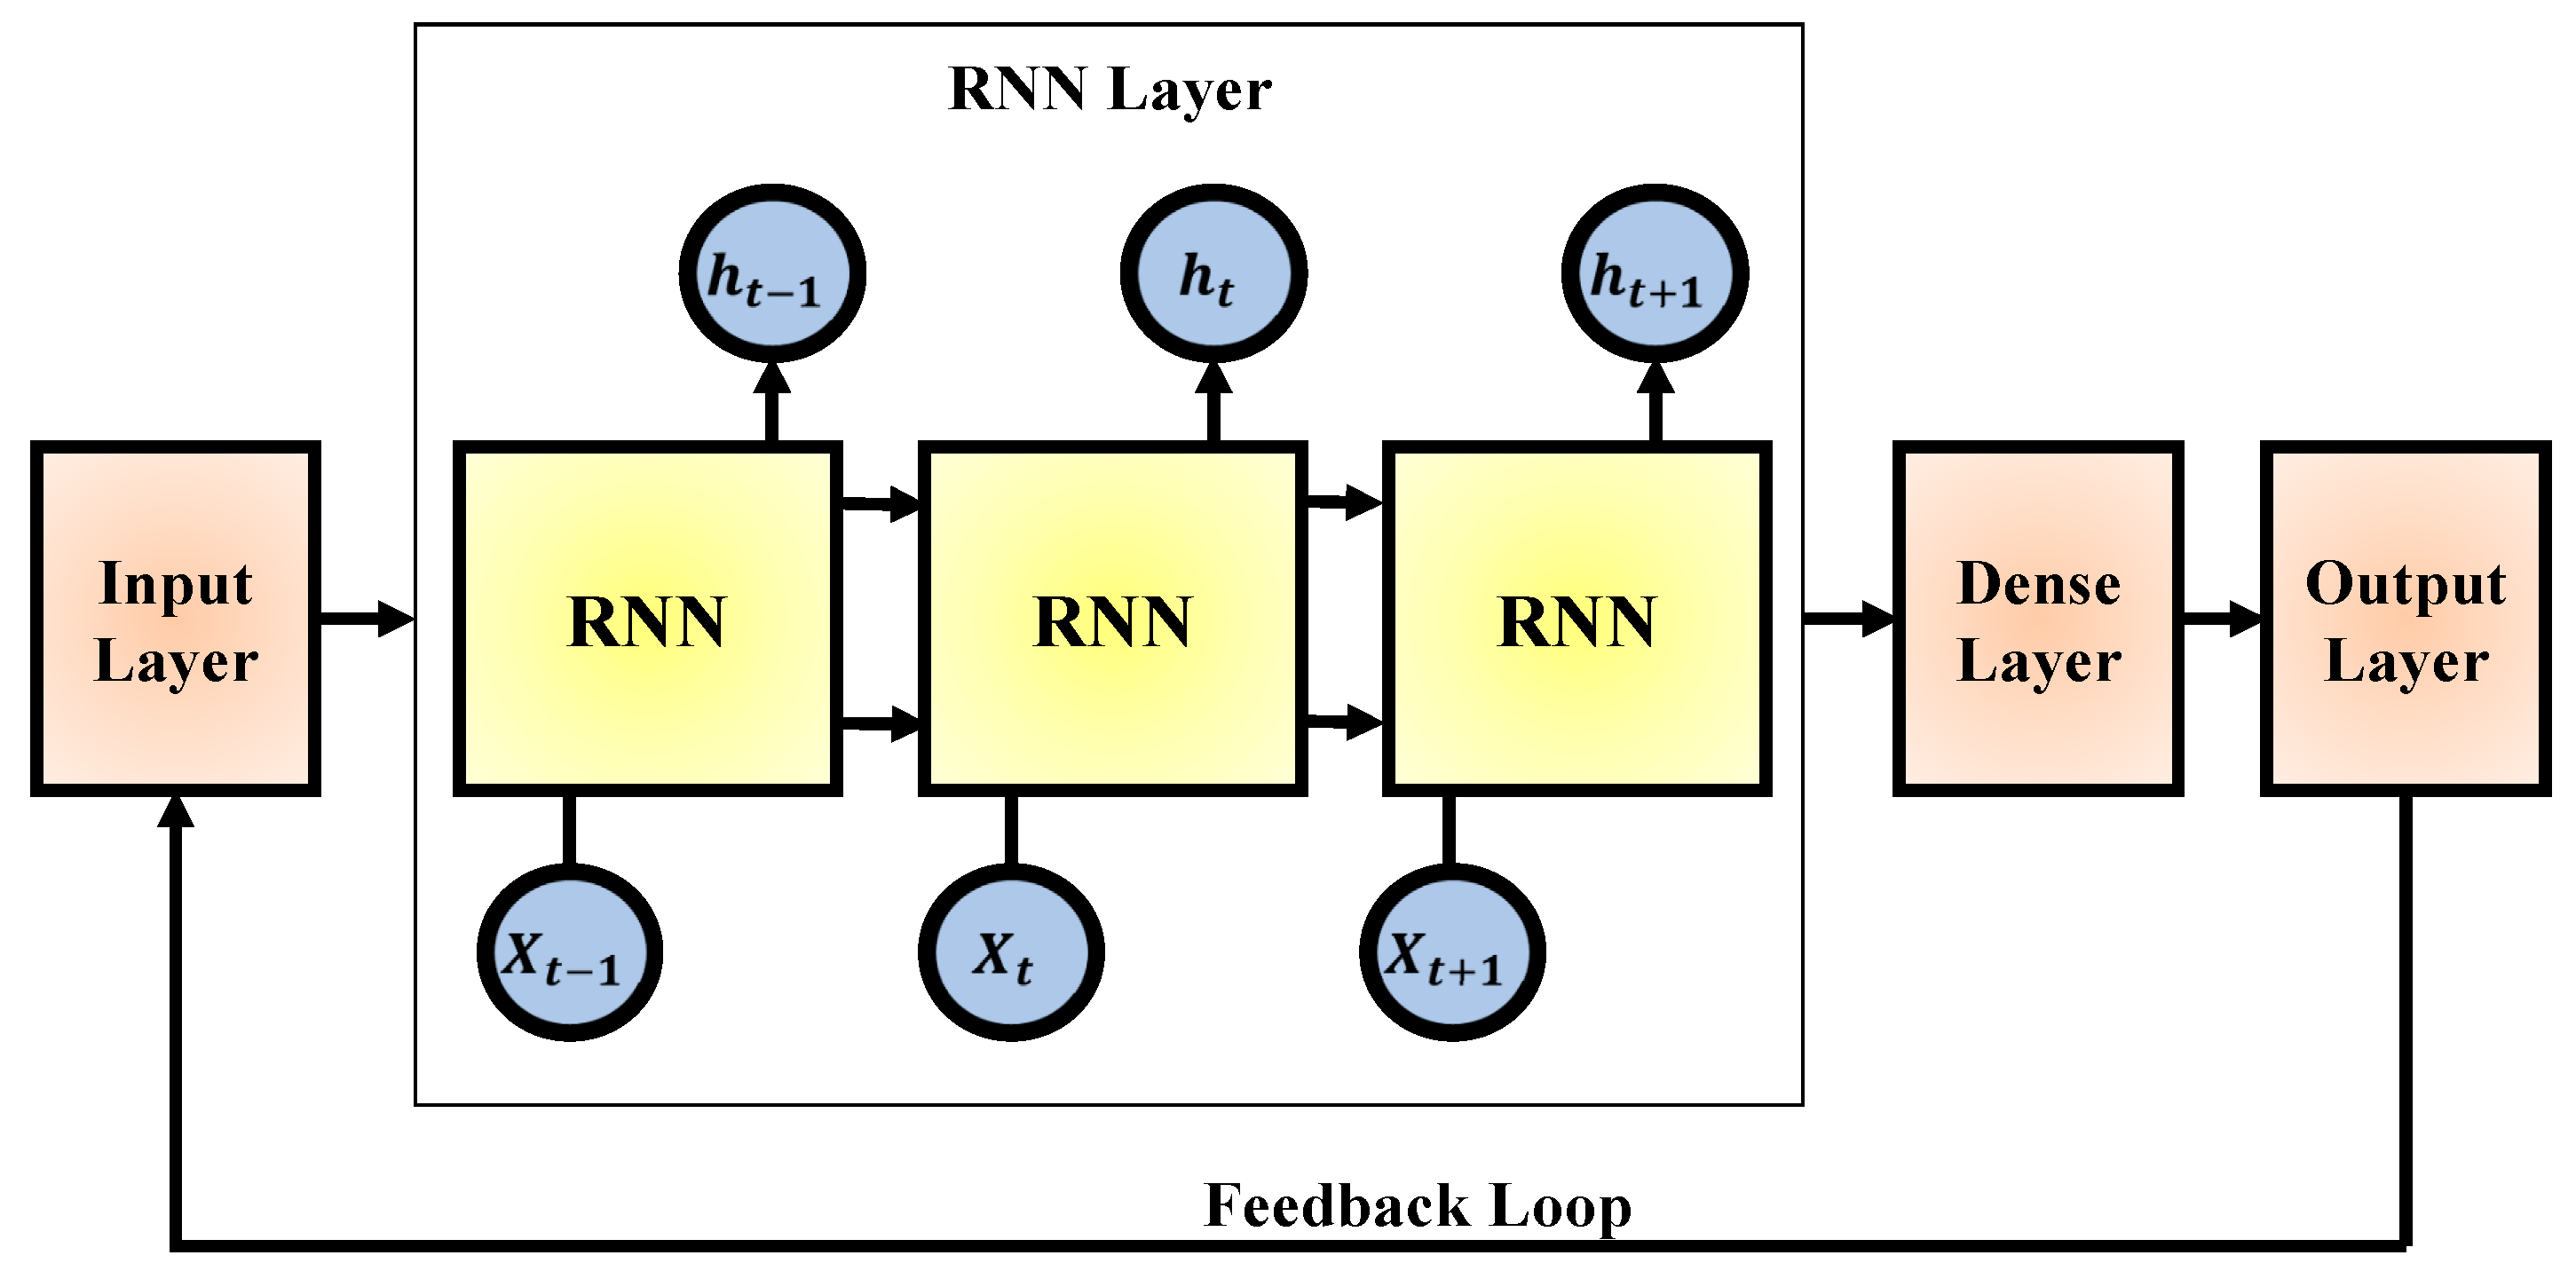
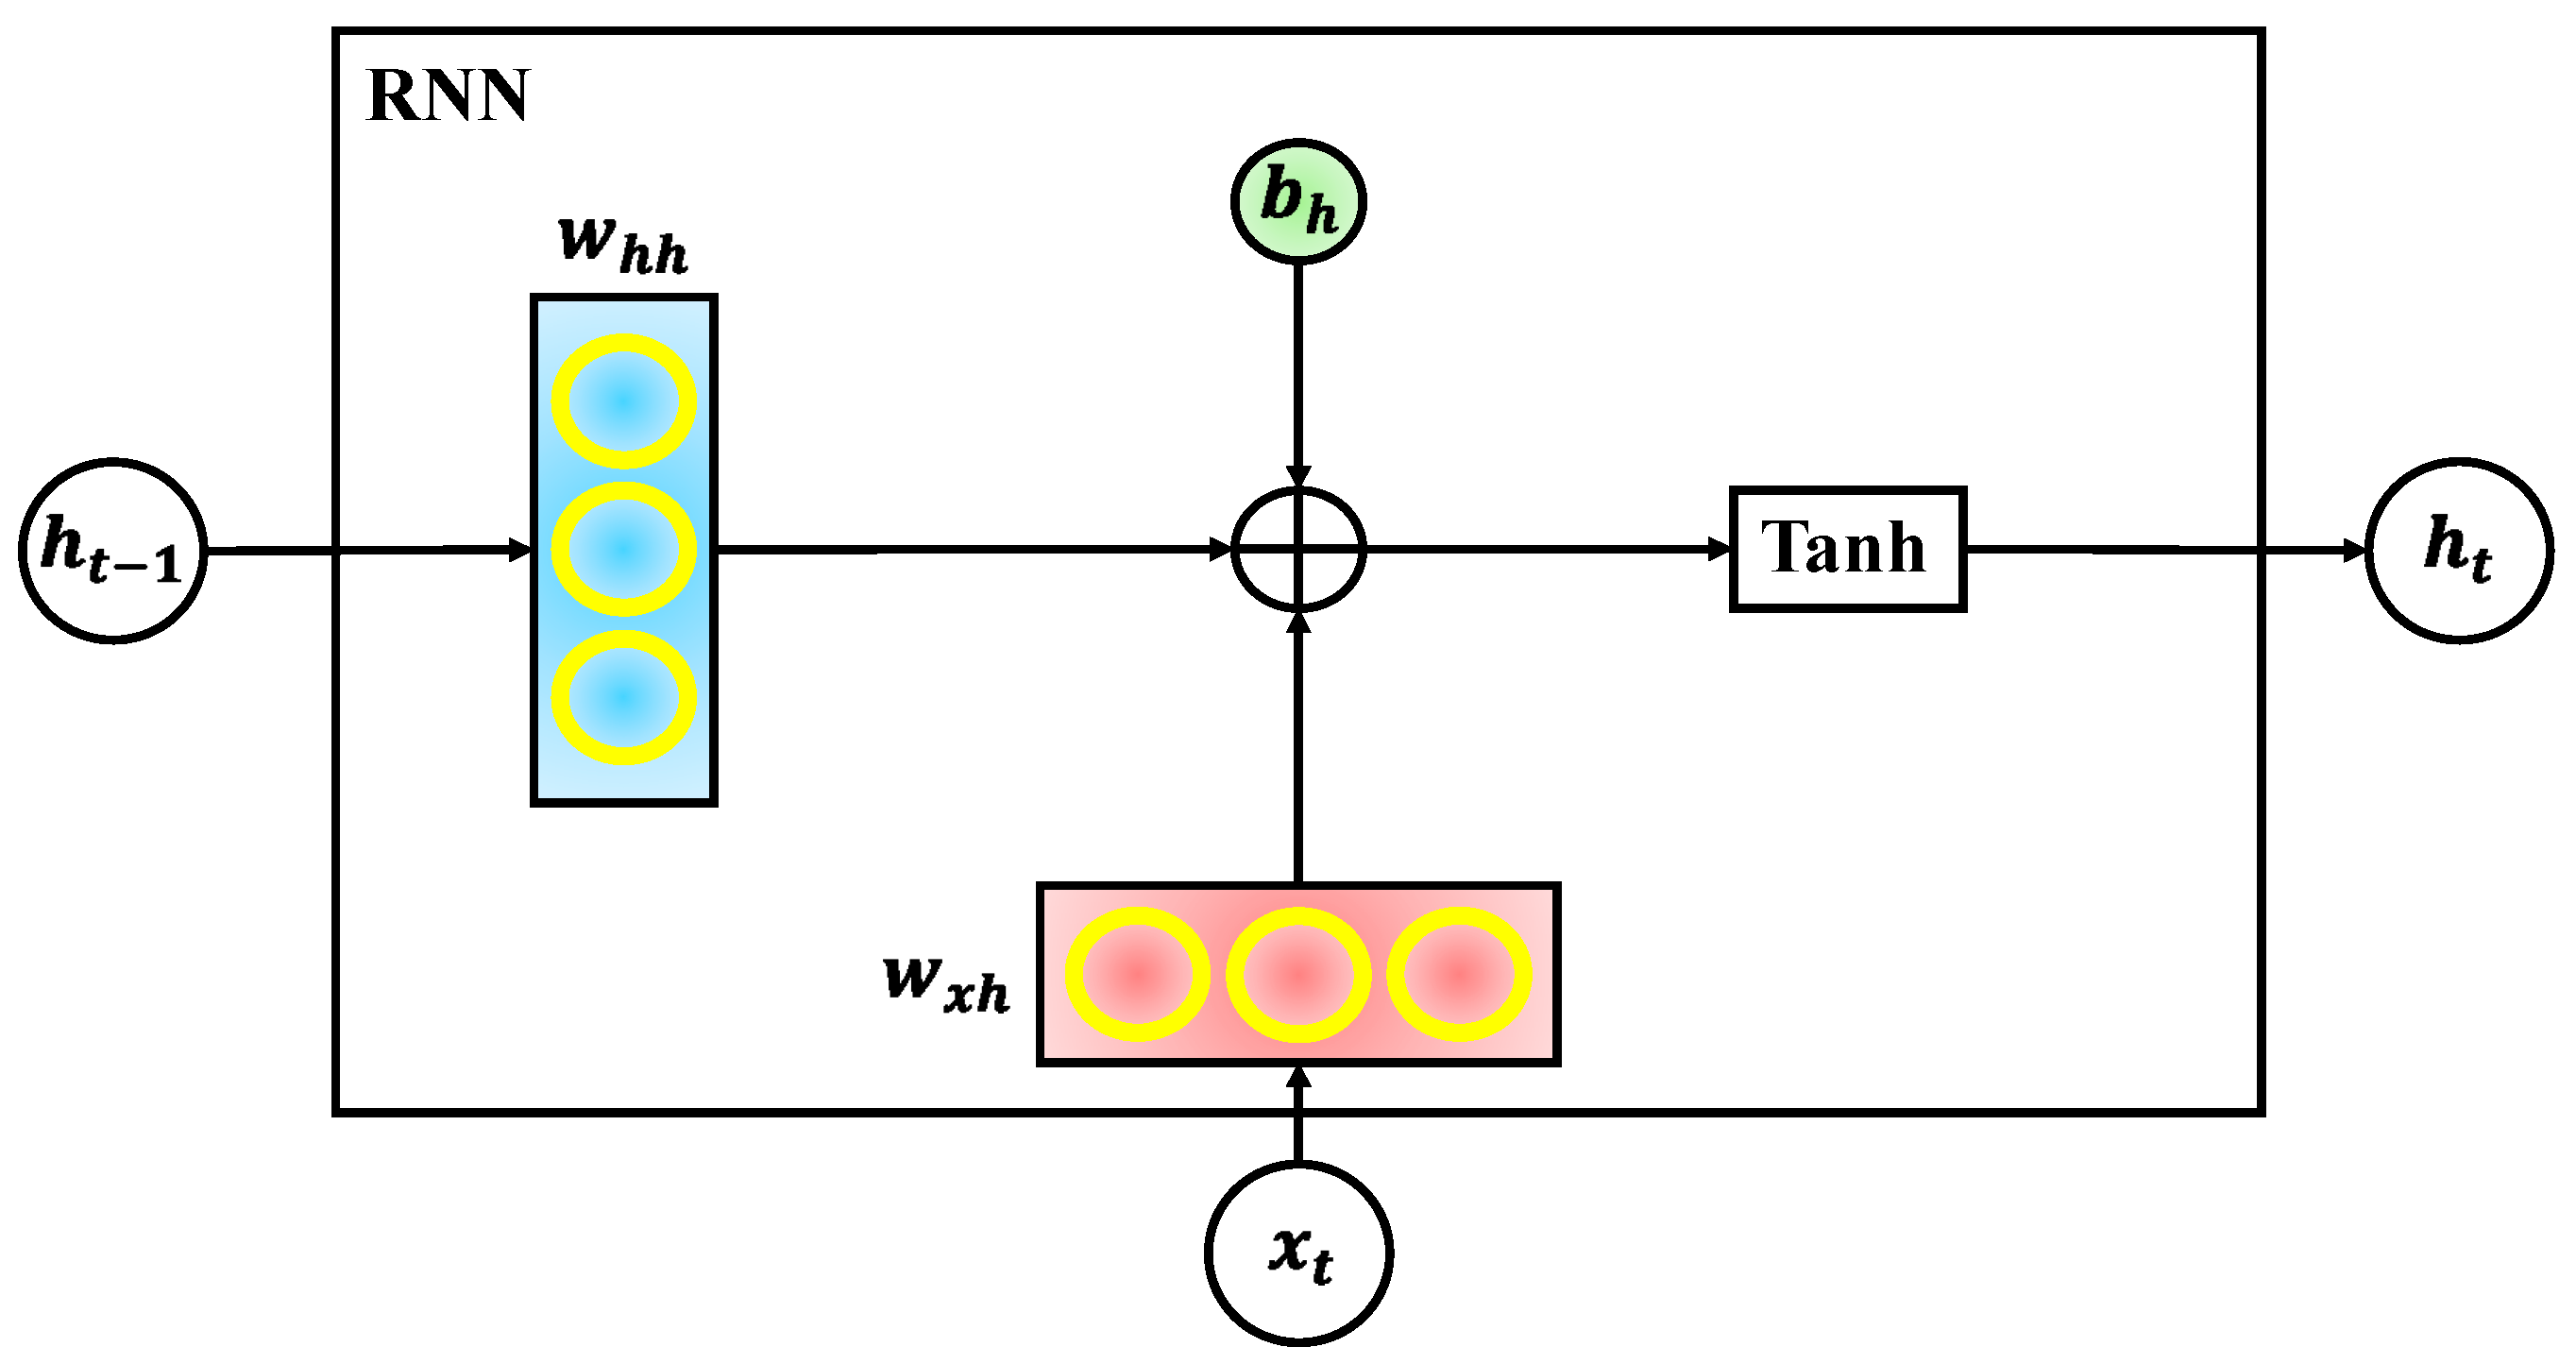
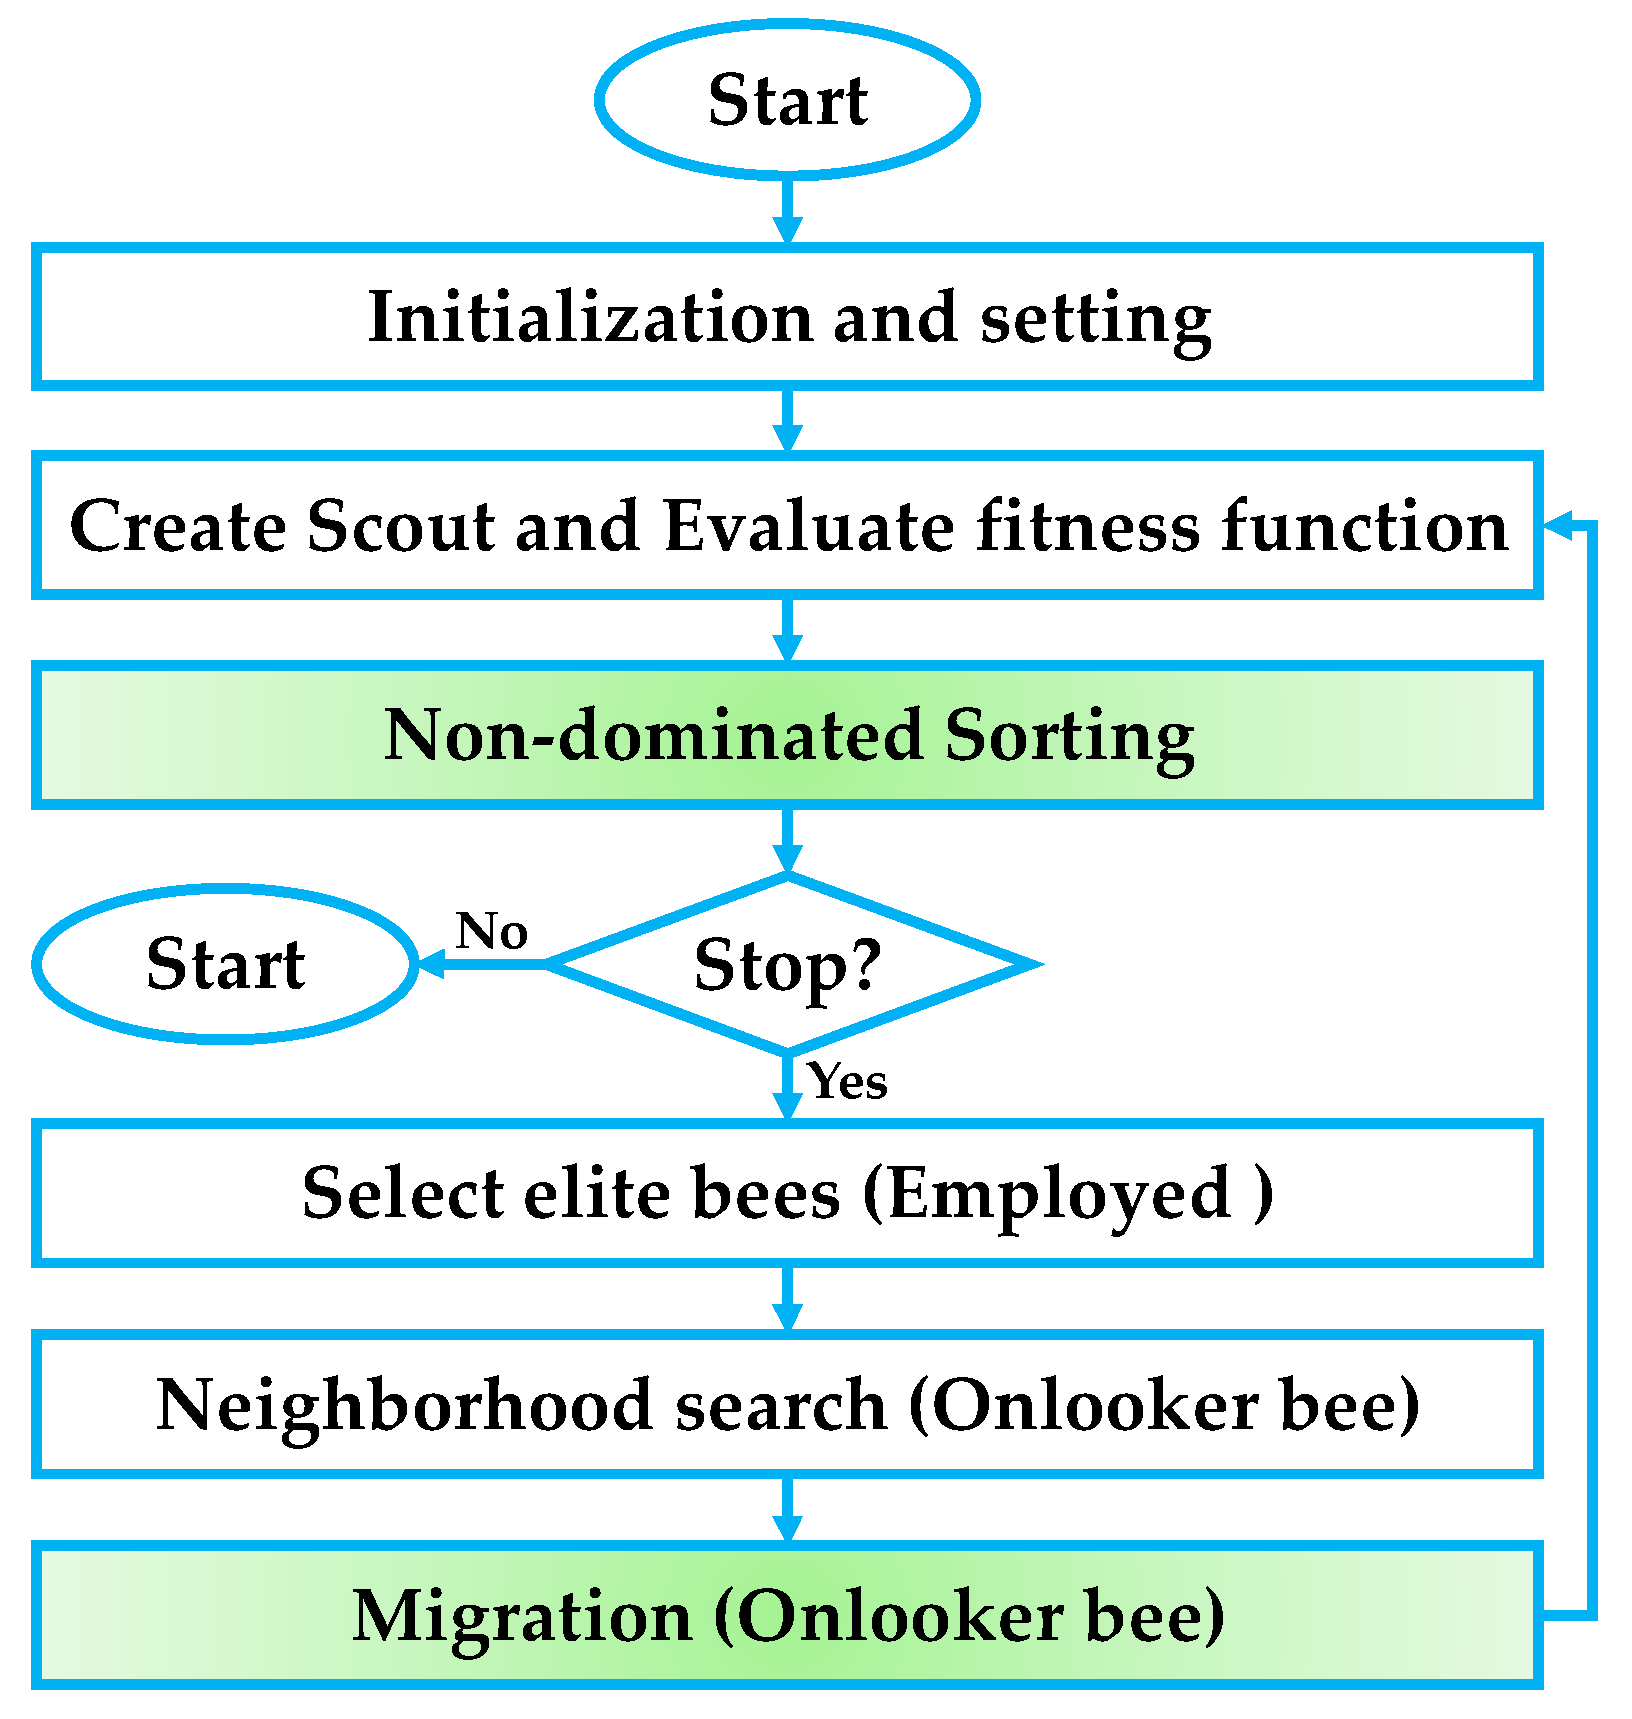
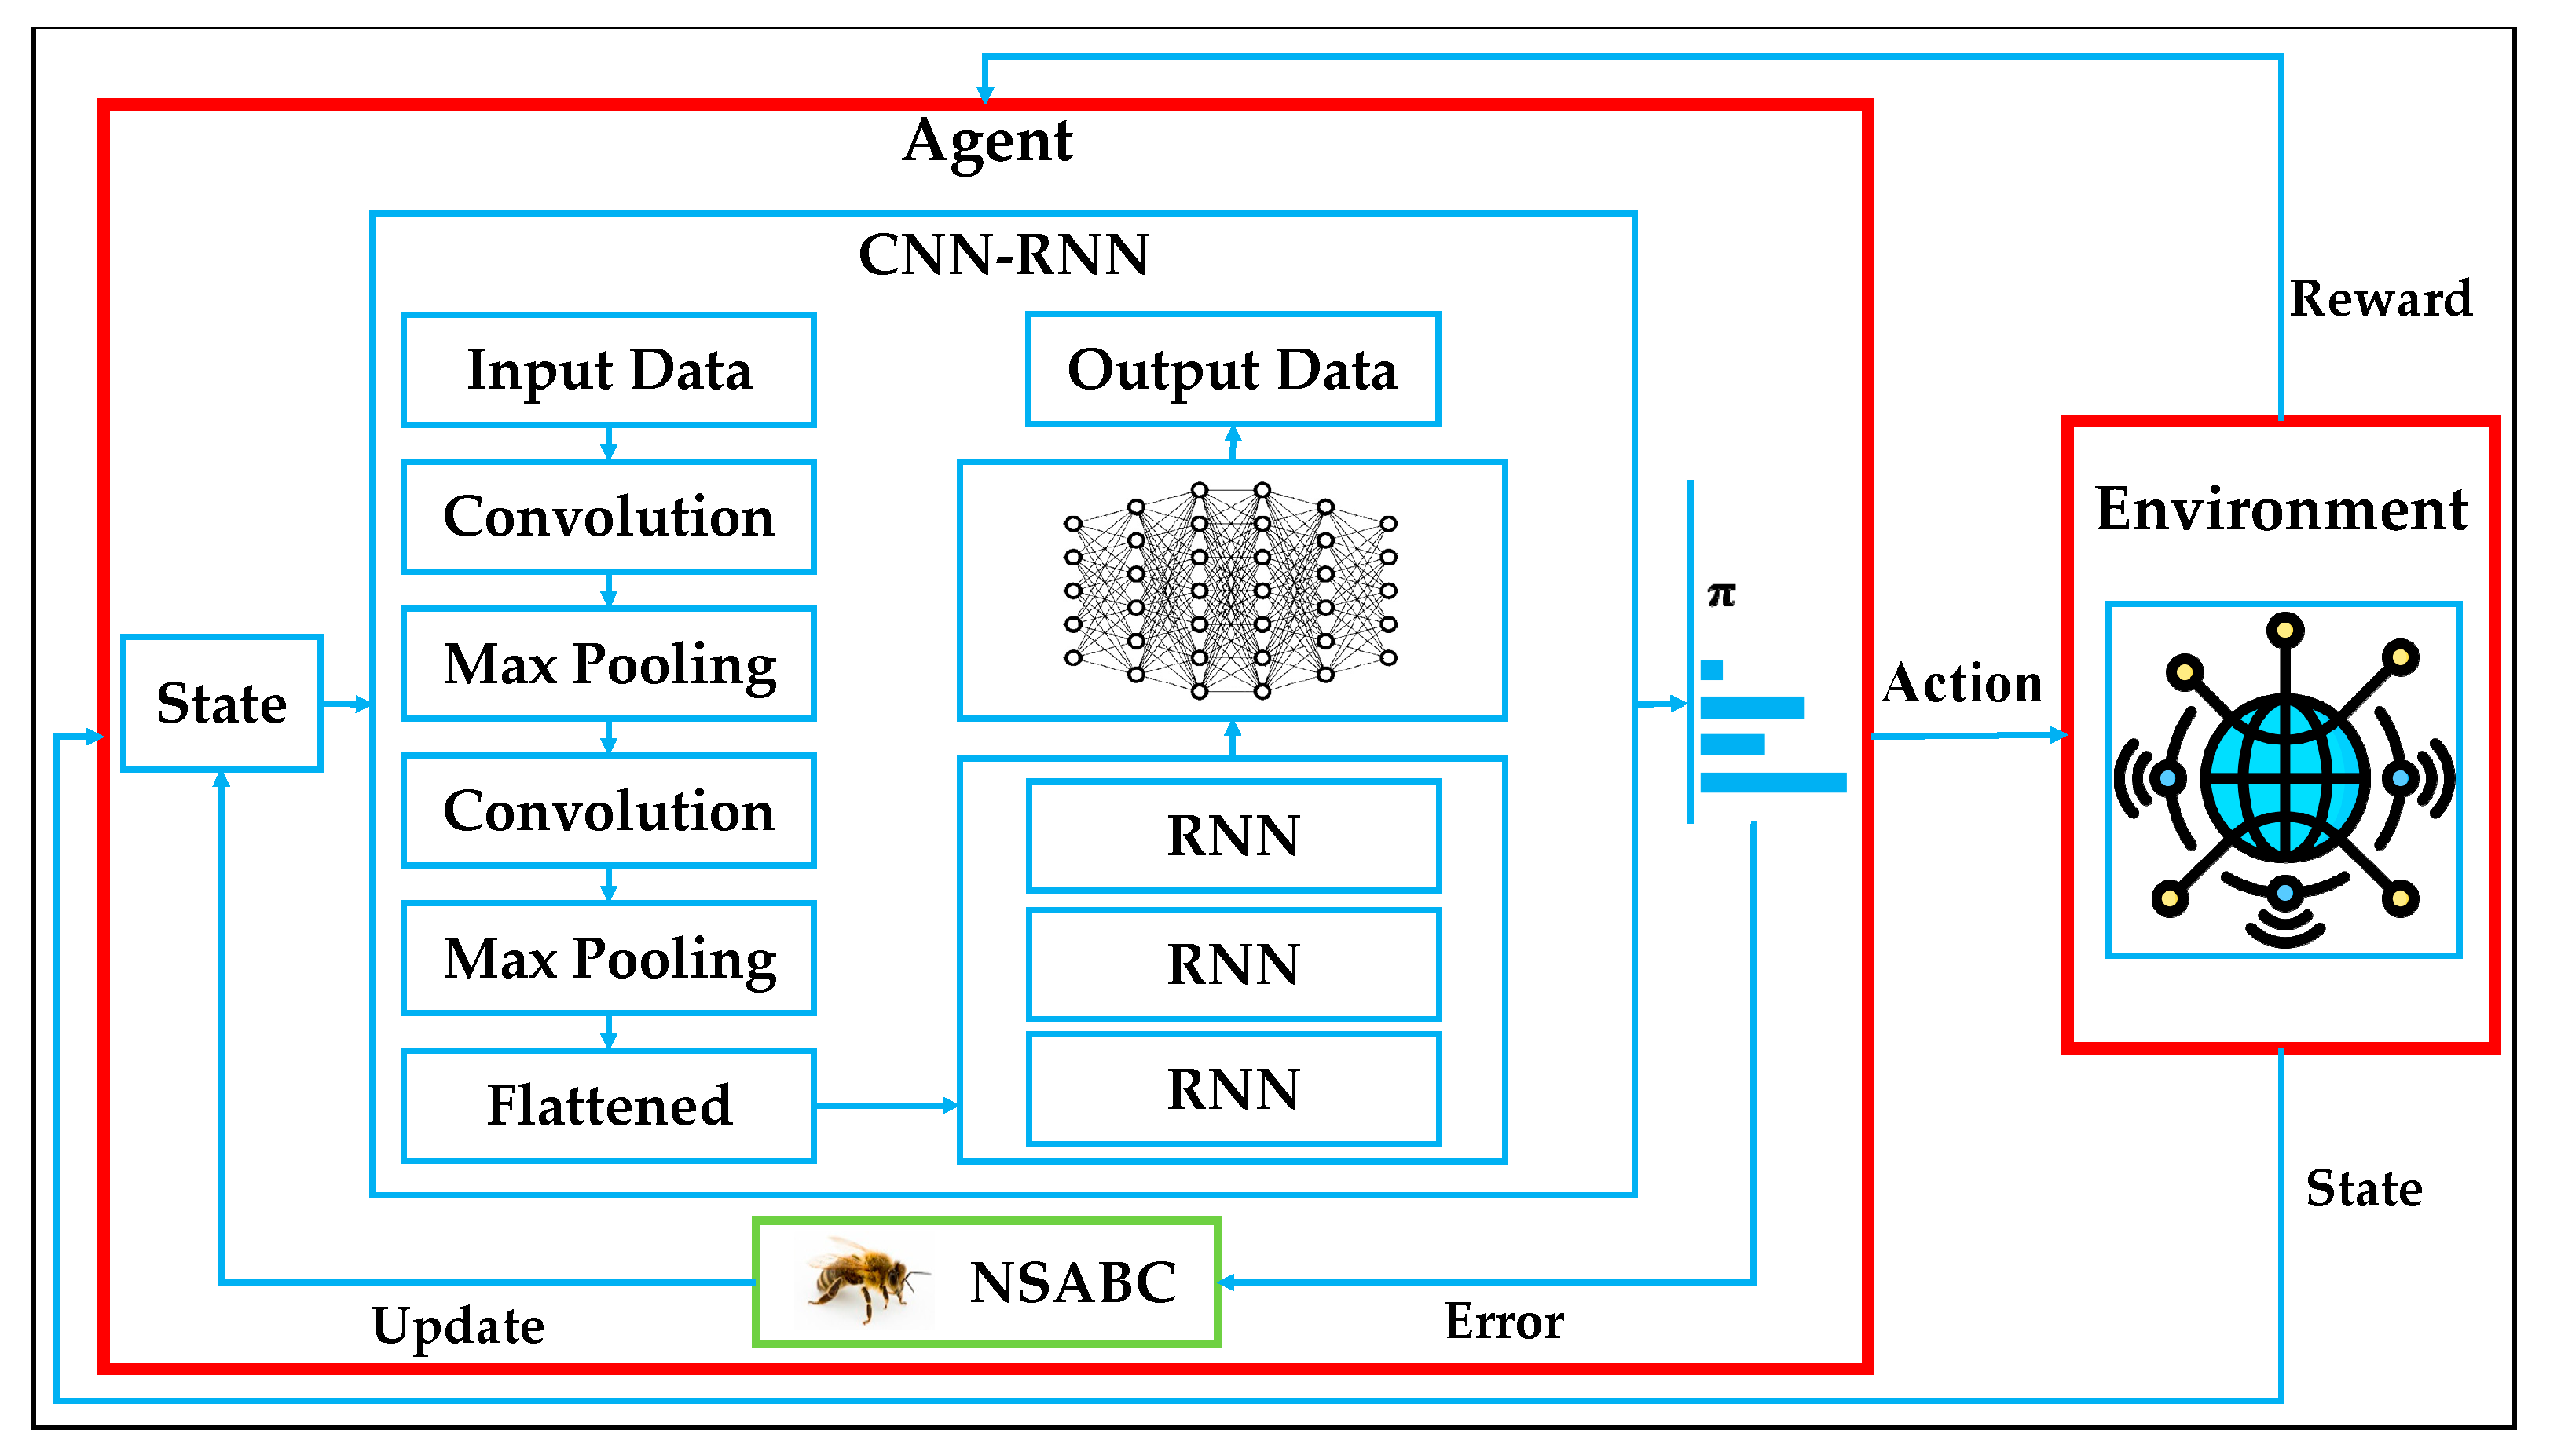
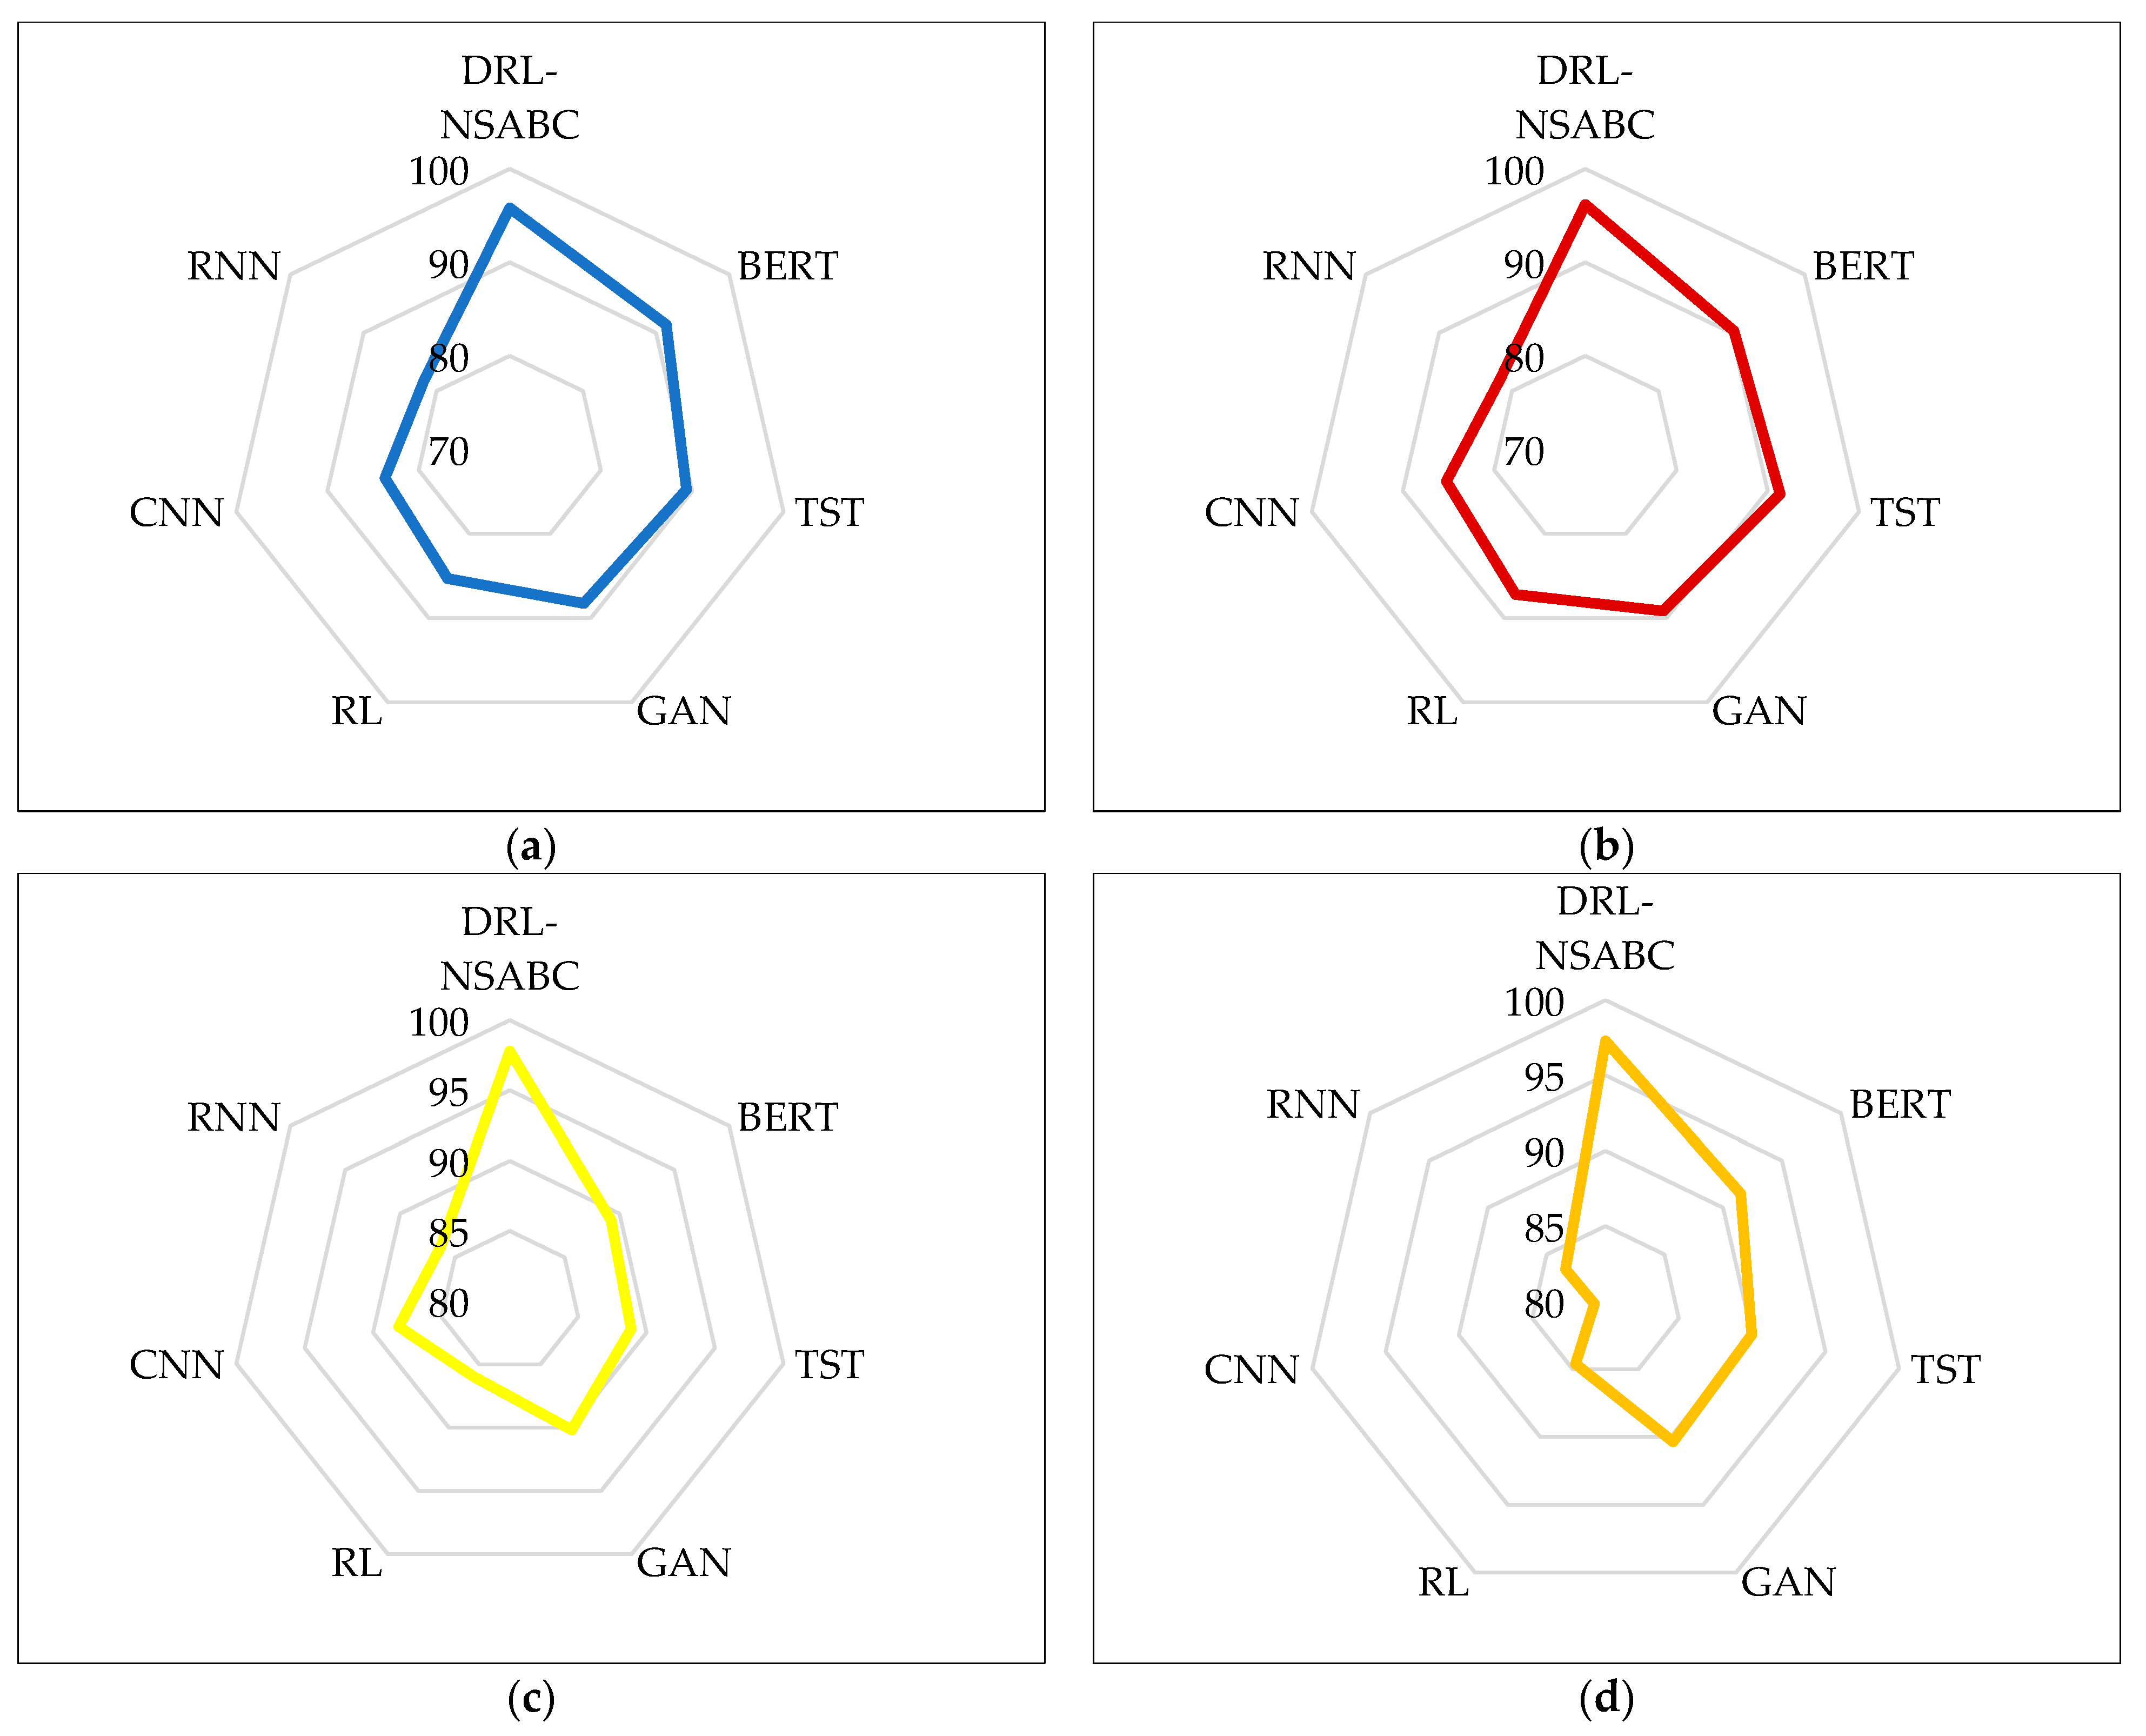
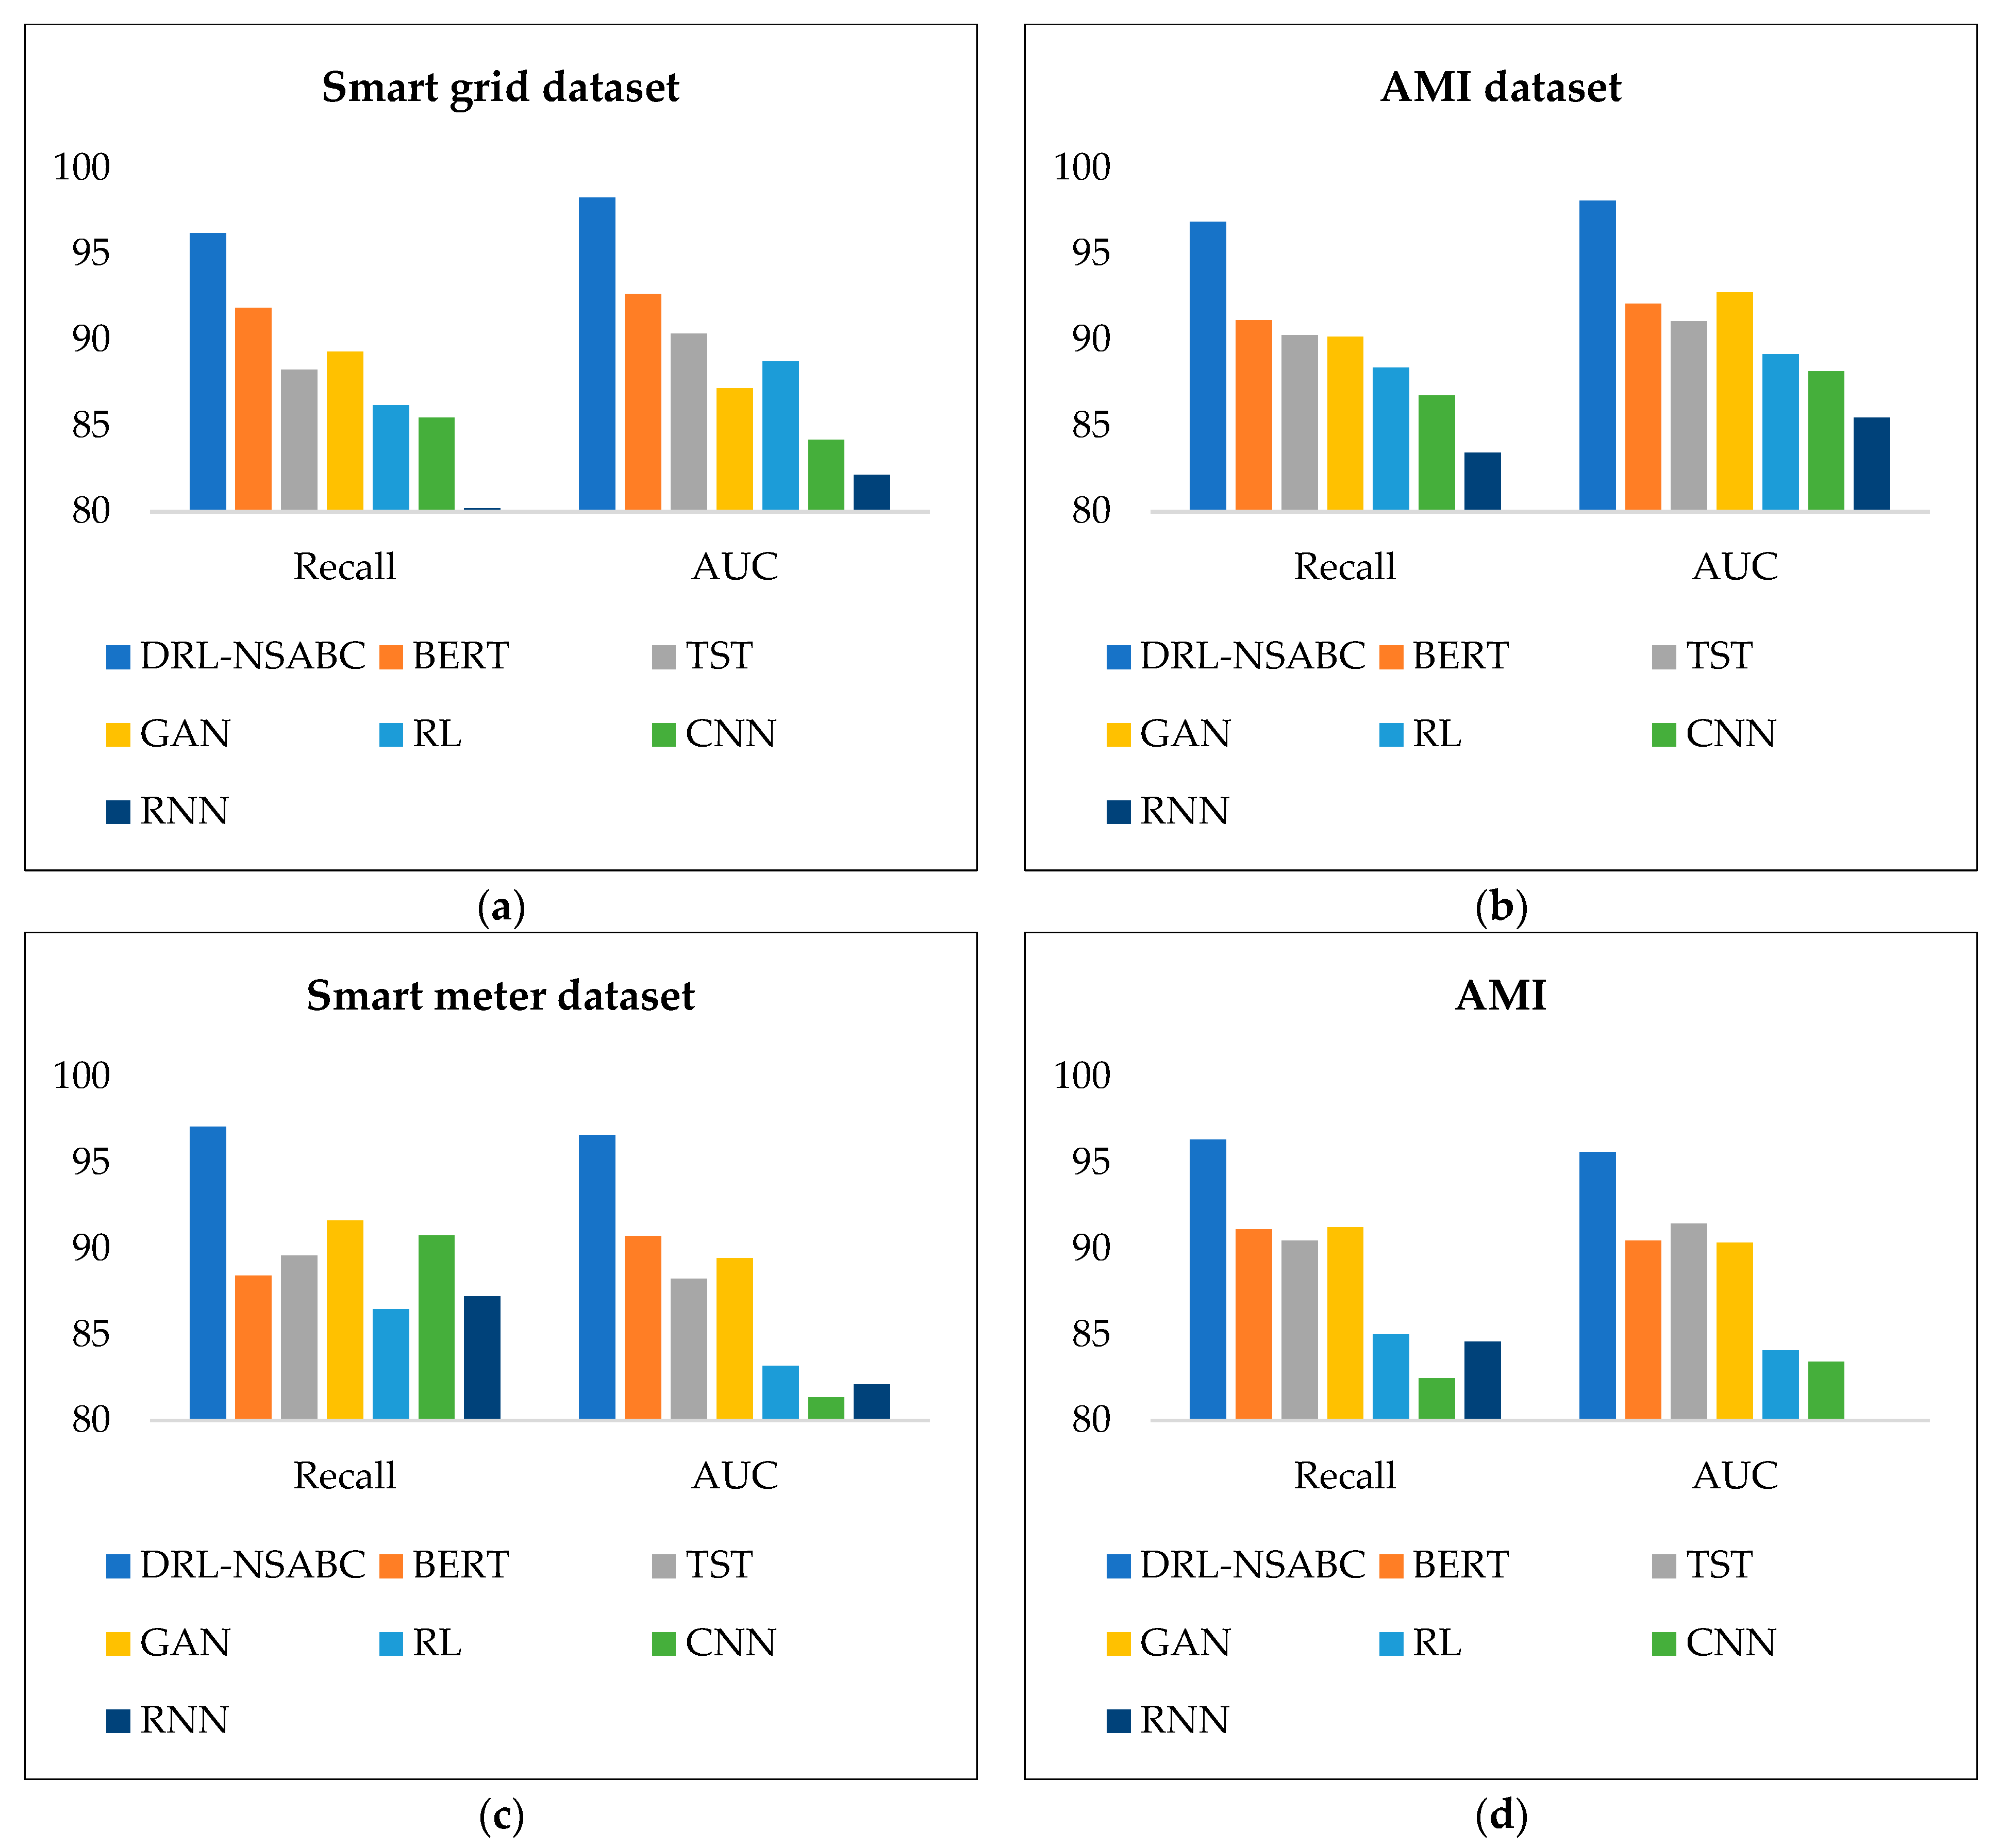
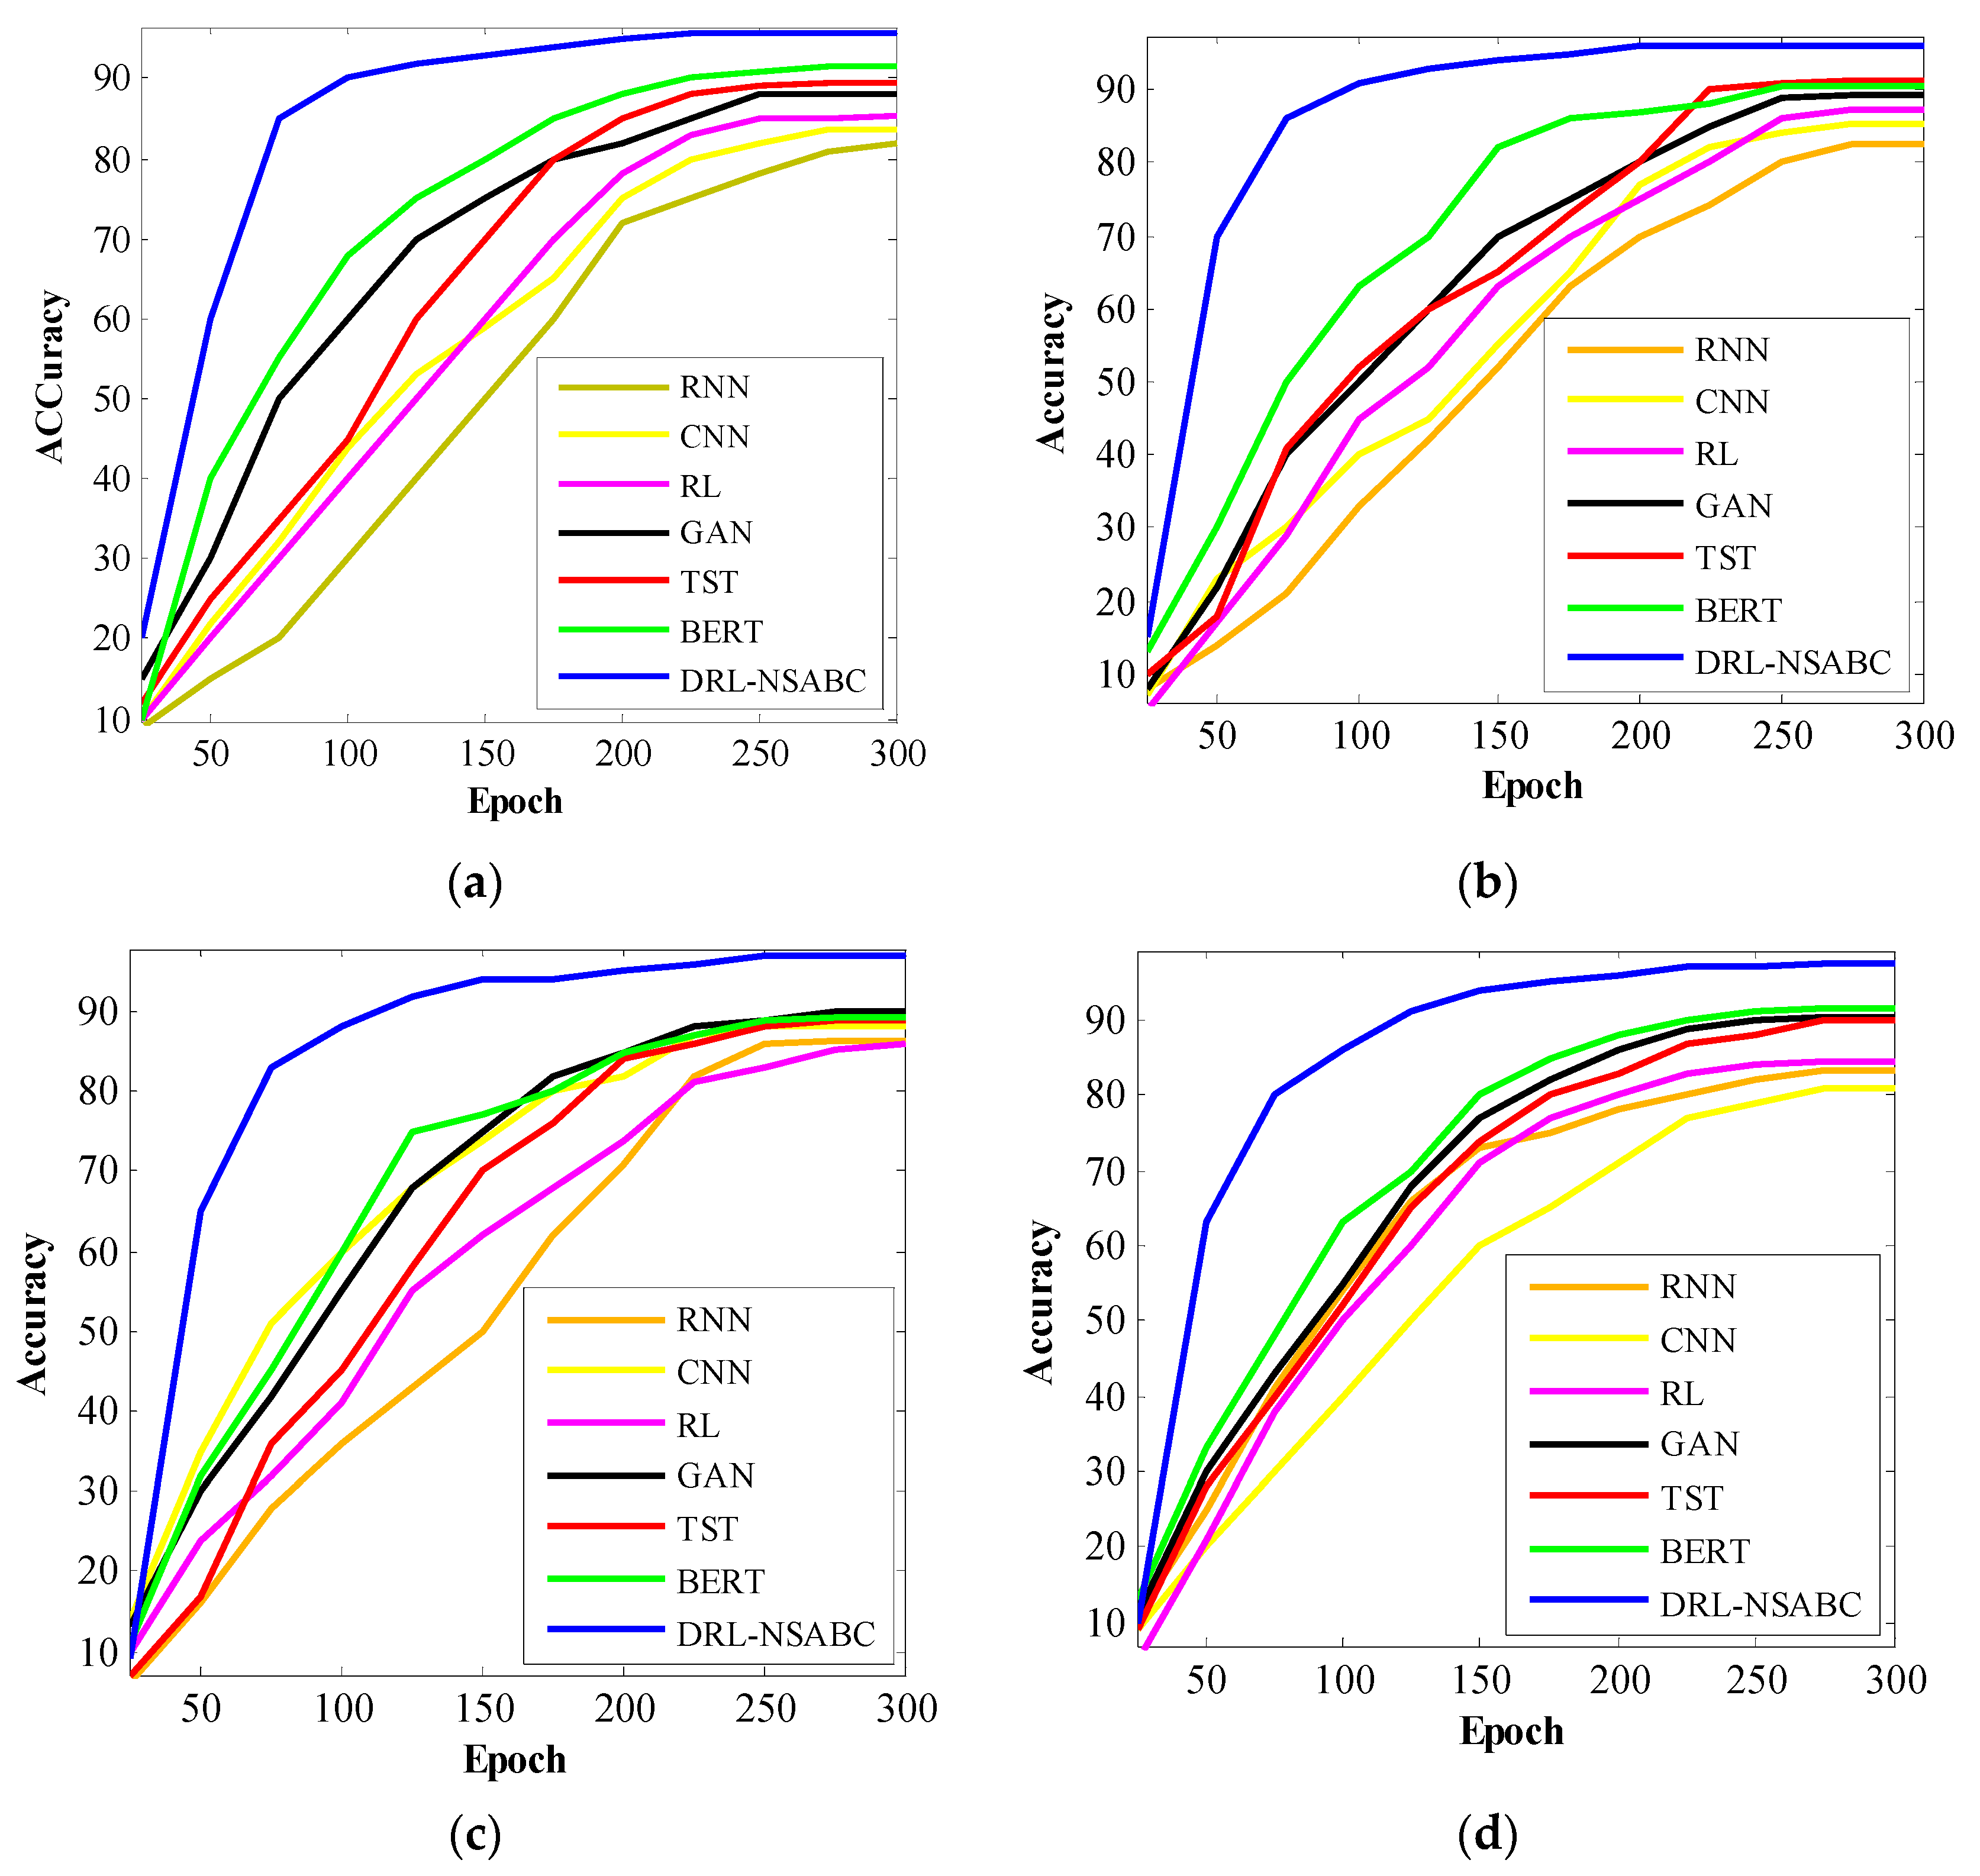
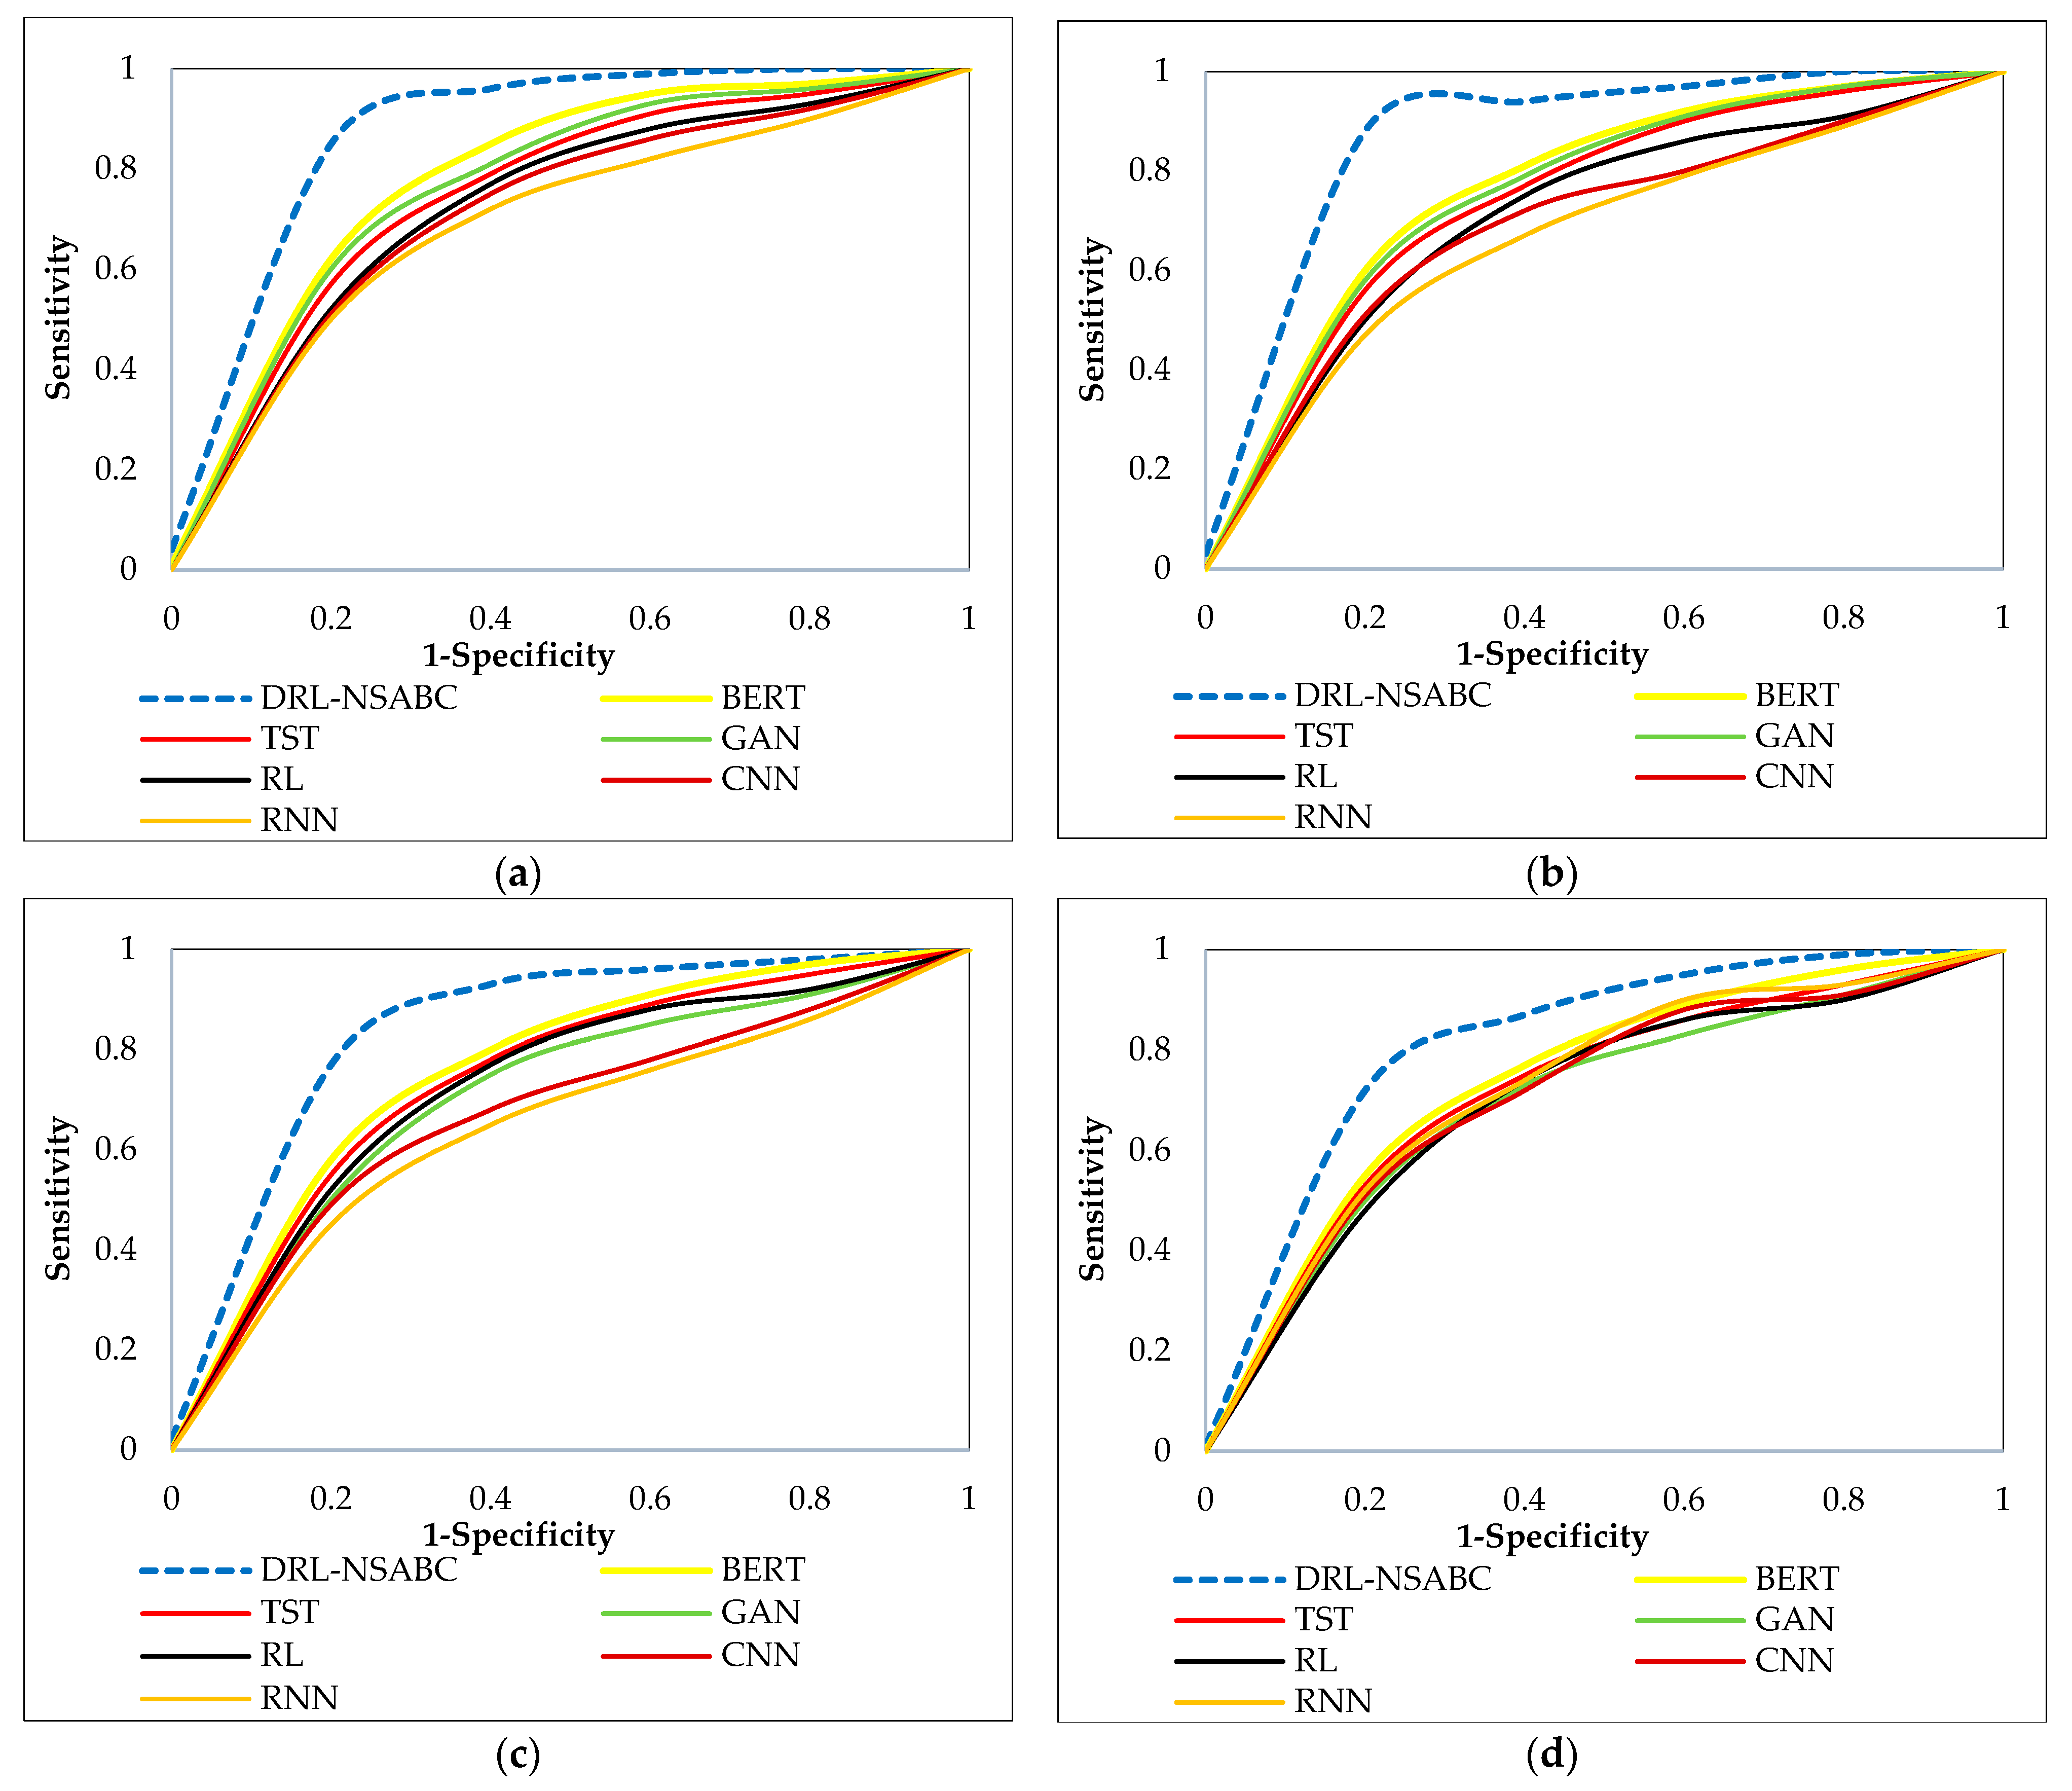
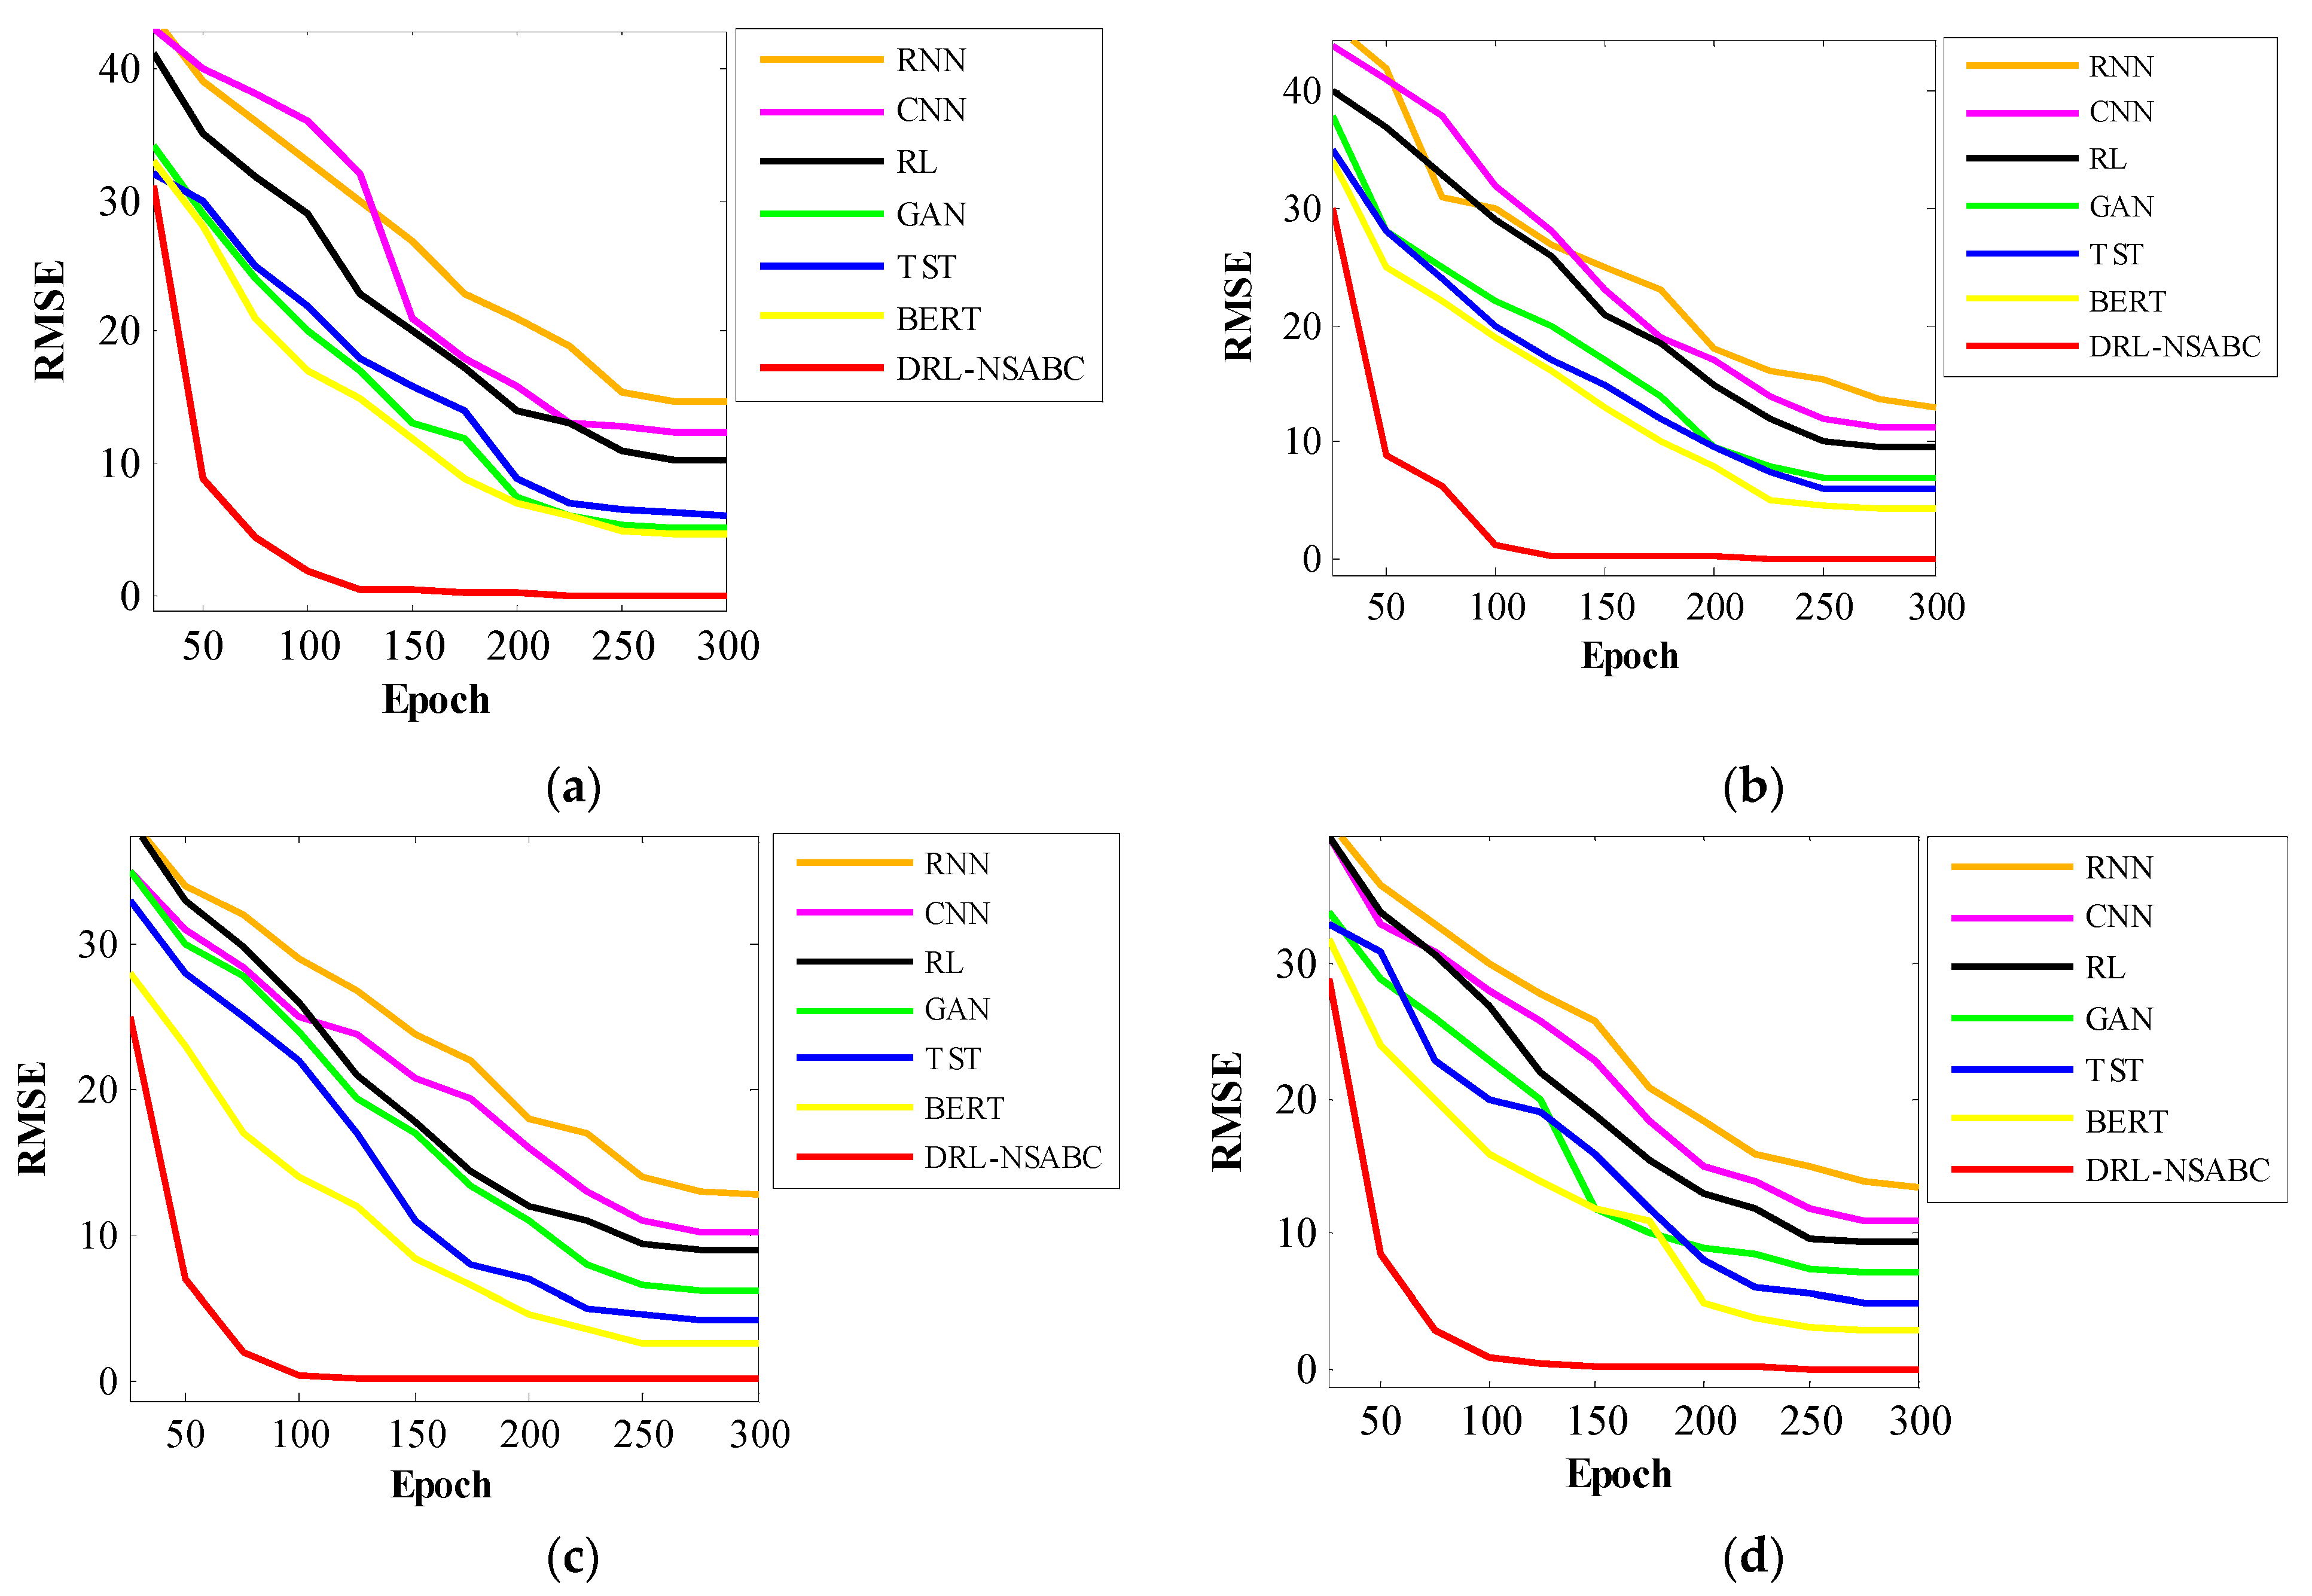
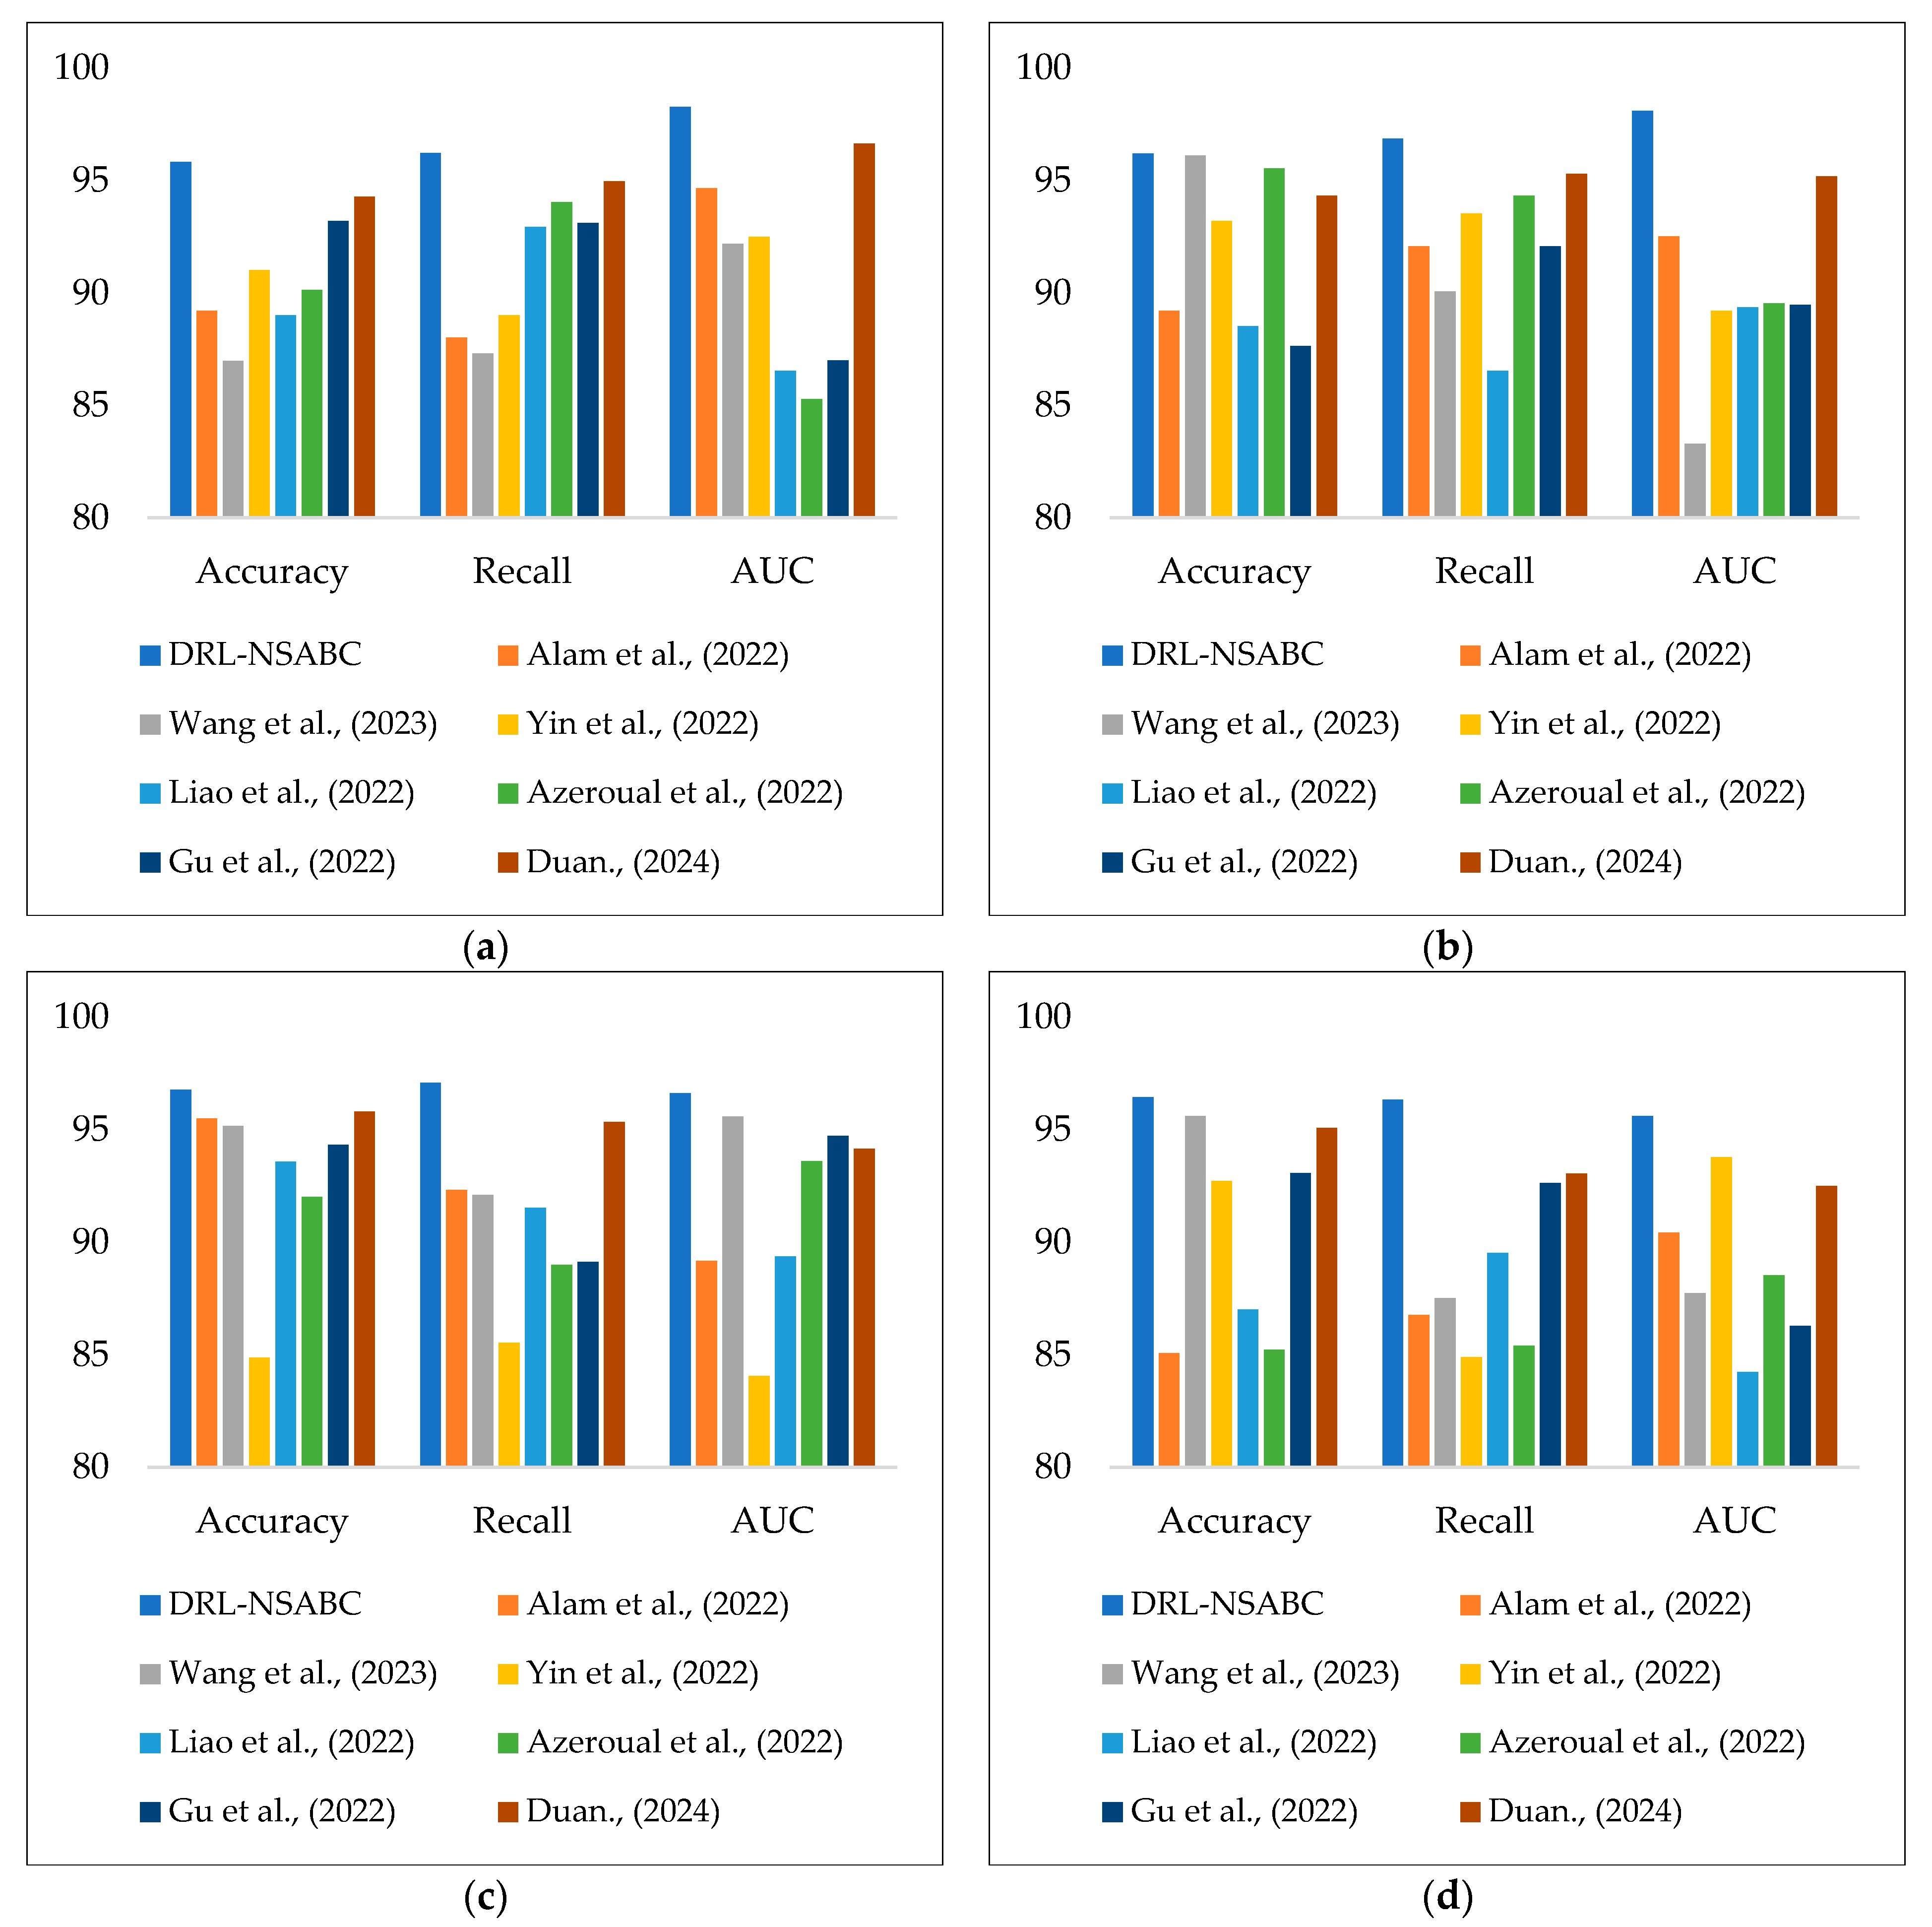
