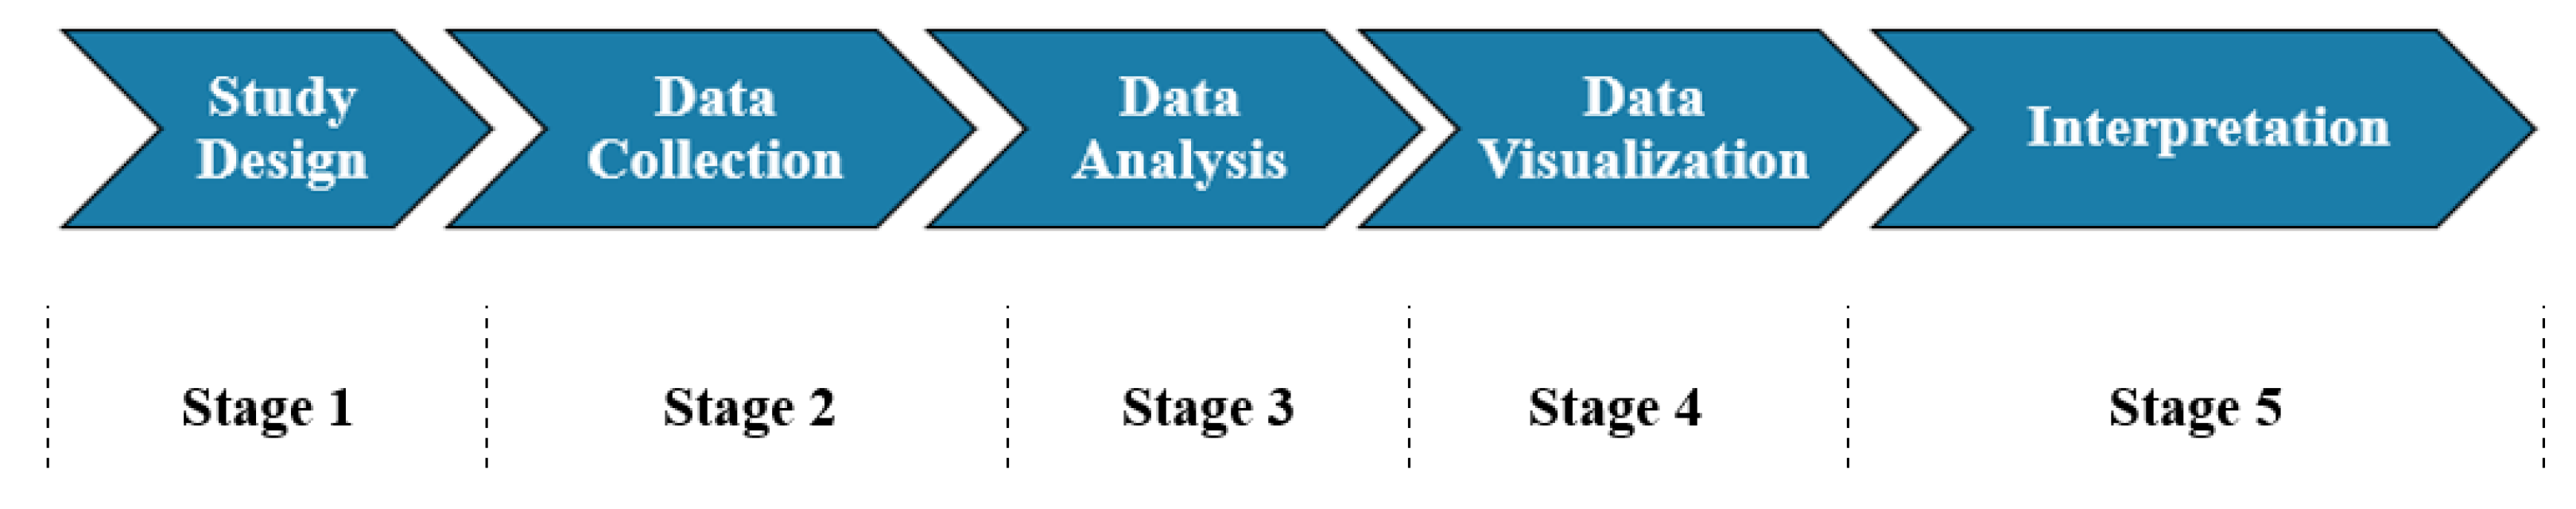
Stage 1 (study design) is considered the most critical, as the researcher defines the research questions, selects the objectives of the bibliometric analysis, and identifies the appropriate statistical tools. Stage 2 (data collection) focuses on retrieving metadata from selected databases after applying appropriate filters. Stage 3 (data analysis) involves applying statistical metrics at various levels and constructing knowledge structures using advanced statistical techniques.
The data analysis stage, conducted through the Bibliometrix tool, includes both descriptive bibliometric analysis and network data extraction. Stage 4 (data visualization) leverages intuitive formats such as two-dimensional maps and social networks, incorporating timeline-based visualizations to illustrate the evolution of intellectual, conceptual, and social structures. Finally, Stage 5 (interpretation) involves the synthesis, interpretation, and discussion of the findings, along with an evaluation of the strengths and limitations of the bibliometric results.
3.1. Stage 1—Study Design
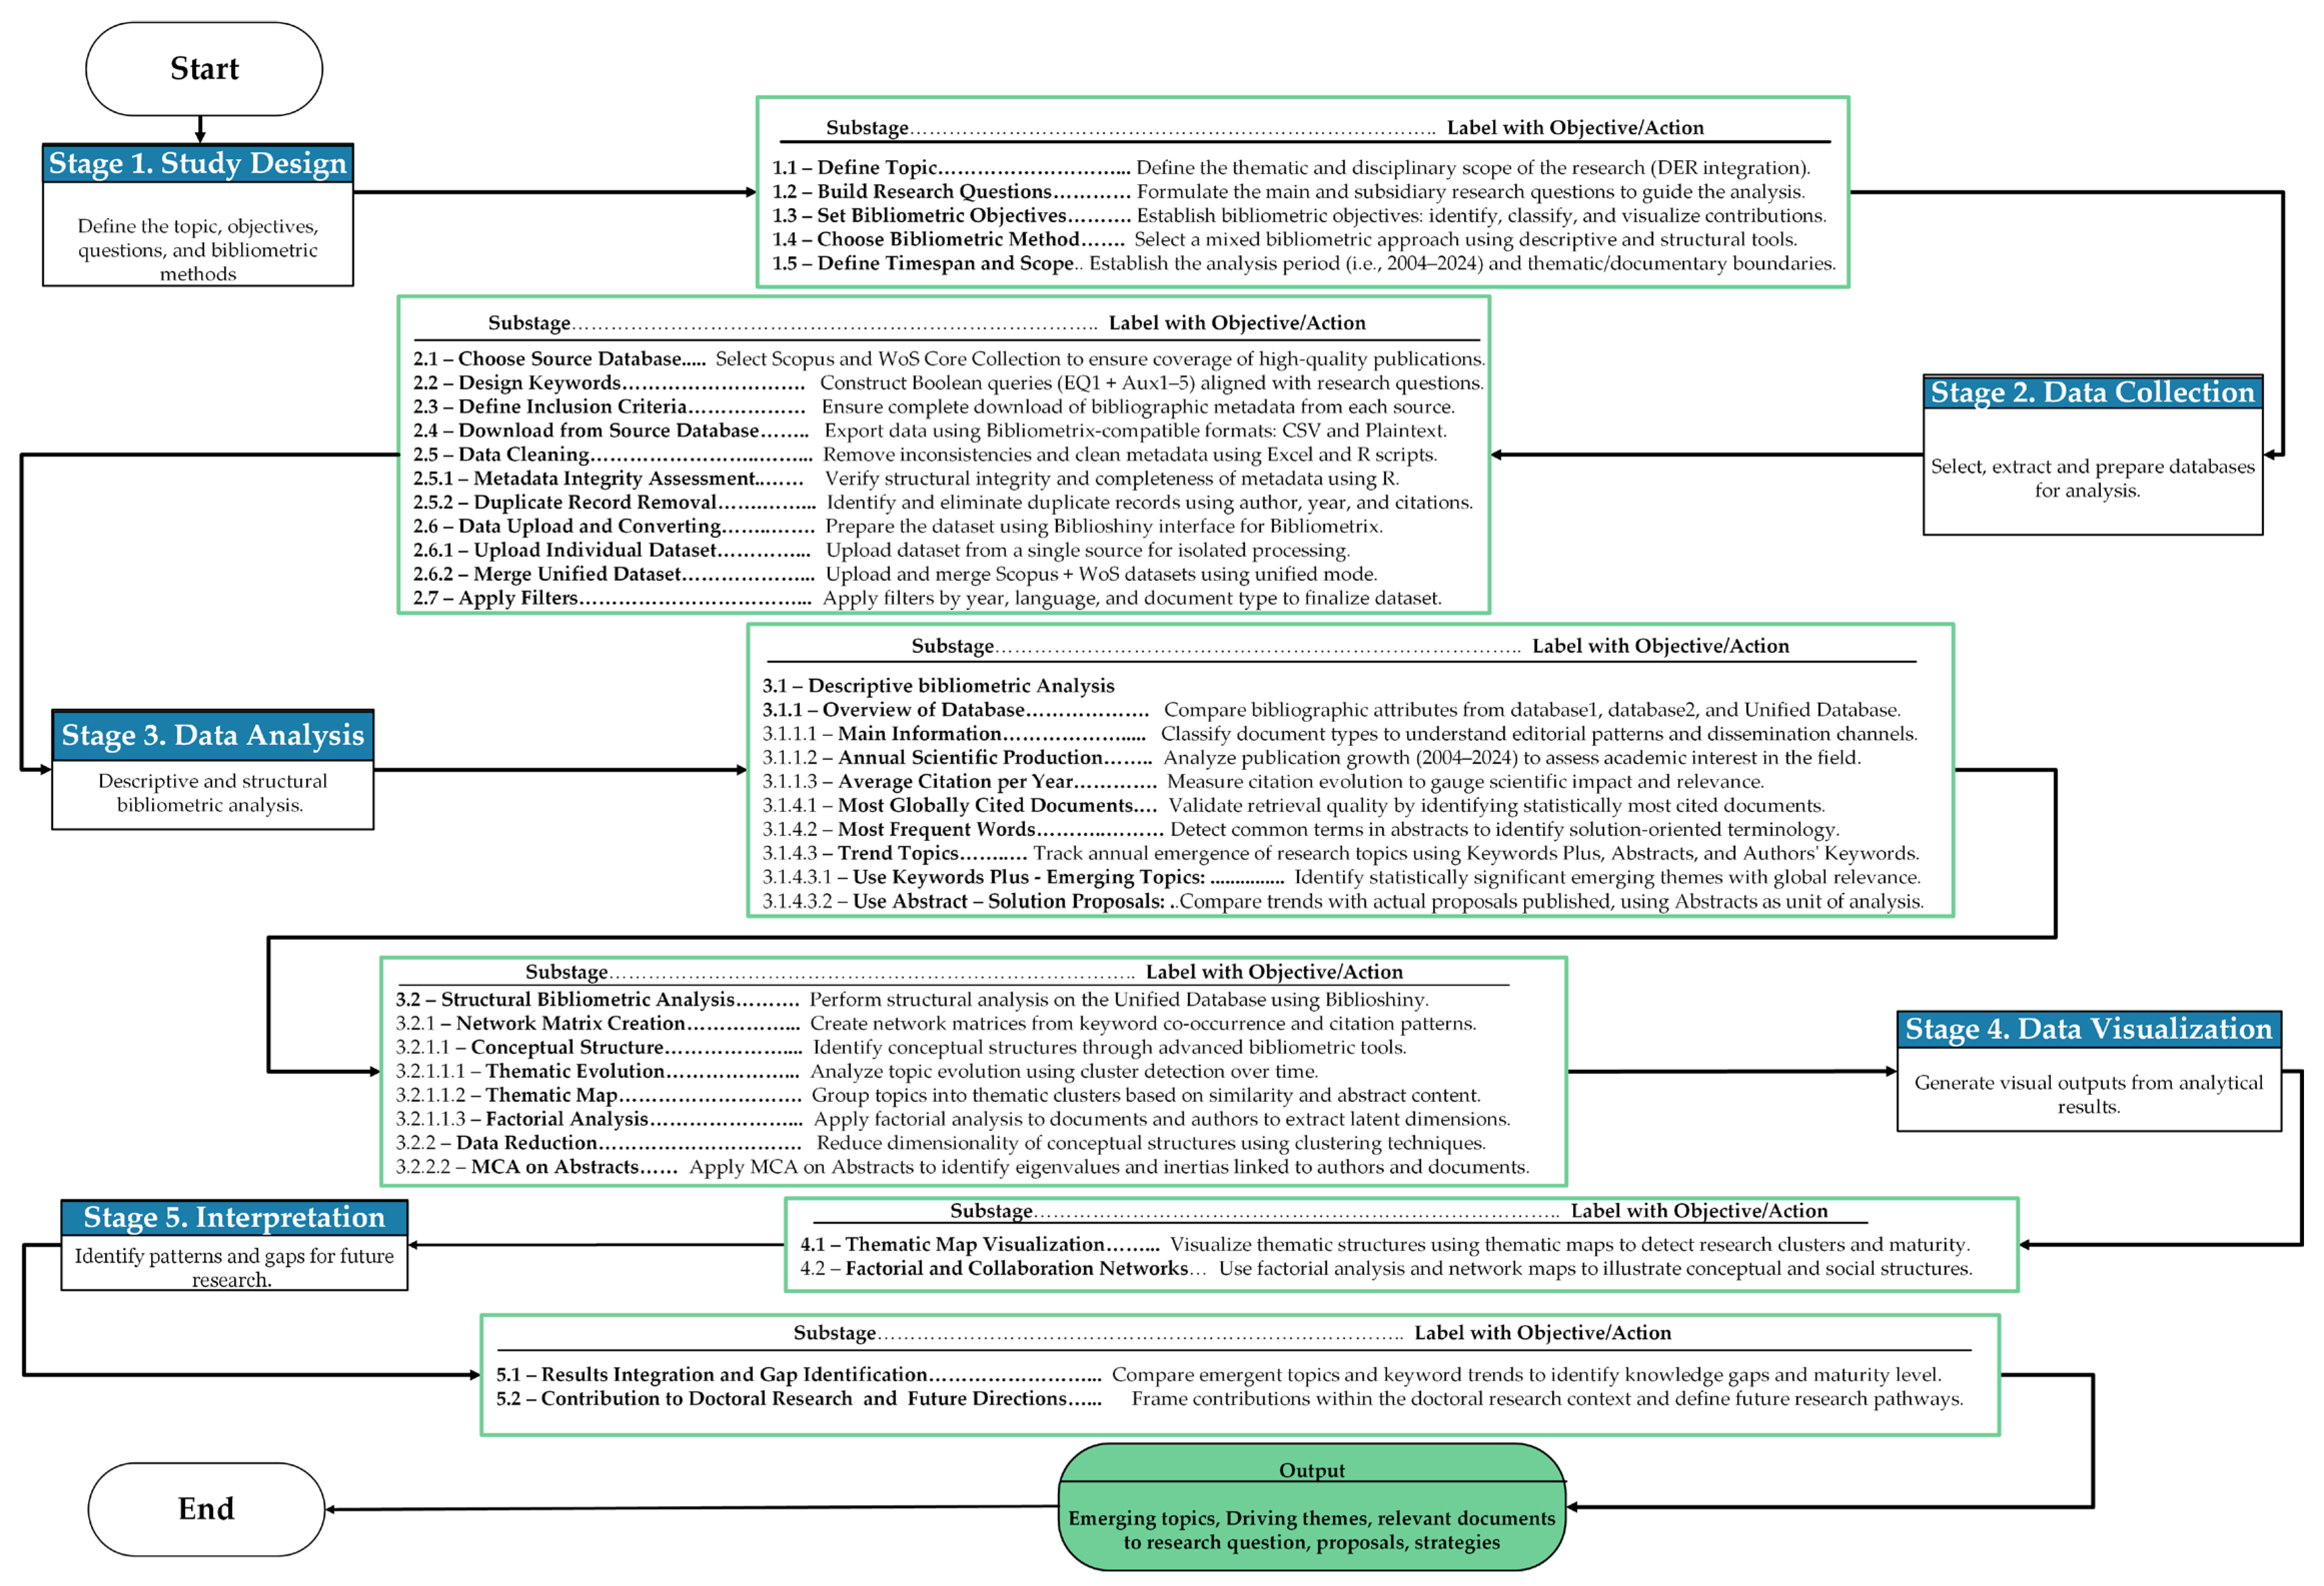
The study design stage constitutes the foundation of the proposed bibliometric methodology framework, as it defines the strategic and analytical orientation of the entire process. In this phase, the researcher must delimit the topic or research field, formulate precise research questions, and establish the bibliometric objectives that will guide the analysis. The methodology emphasizes that this phase is not merely preparatory but rather a decisive component that ensures methodological coherence and relevance across the subsequent stages.
Stage 1.1—Define Topic or Research Field. In the present application, the defined research field focused on the technical impacts of distributed energy resources (DERs) integration into the power system. Stage 1.2—Build Research Questions. From this thematic scope, key research questions were formulated to understand what types of impacts have been studied, how those impacts have been assessed, what solution proposals have been advanced, and what knowledge gaps persist in the scientific literature. Stage 1.3—Define Research Objectives. These questions shaped the bibliometric objectives, aimed at identifying the intellectual, conceptual, and social structures of the field. As part of this stage, the core analytical units were also defined, including abstracts, Author’s Keywords, and Keywords Plus, which enable the structured extraction of critical knowledge elements and the construction of coherent conceptual relationships.
Stage 1.4—Choose Bibliometric Method. A key contribution of this study is the formalization of a systematic strategy that aligns research questions with the selection of appropriate bibliometric tools and analytical techniques. To that end, free and open-source tools were selected, including Bibliometrix (via the Biblioshiny app), RStudio, Excel, and a Windows text editor, allowing the configuration and execution of both descriptive and structural analyses.
Stage 1.5—Choose Time Span. Finally, the temporal scope of the analysis was defined, covering the 2004–2024 period in order to capture the evolution of knowledge on DER integration over the past two decades. This structured methodological framework transforms the study design into a critical mechanism for ensuring analytical precision, thematic coherence, and the applicability of the methodology to doctoral research and other exploratory scientific projects.
3.2. Stage 2—Data Collection
The present stage describes in detail the structured search strategy applied to construct the bibliographic dataset, following a stepwise and reproducible process.
The processes from Stage 2.1 to Stage 2.5 were executed directly using the tools and export functionalities provided by the scientific databases Scopus and Web of Science Core Collection.
The data collection stage is essential to ensure the reliability of bibliometric results and the successful achievement of the research objectives. Stage 2.1—Choose Source Database. In this phase, the methodology proposes the construction of a unified database using recognized scientific dissemination sources selecting Scopus (Elsevier) and Web of Science Core Collection (Clarivate) as complementary databases to cover a broad spectrum of top-tier scientific publications.
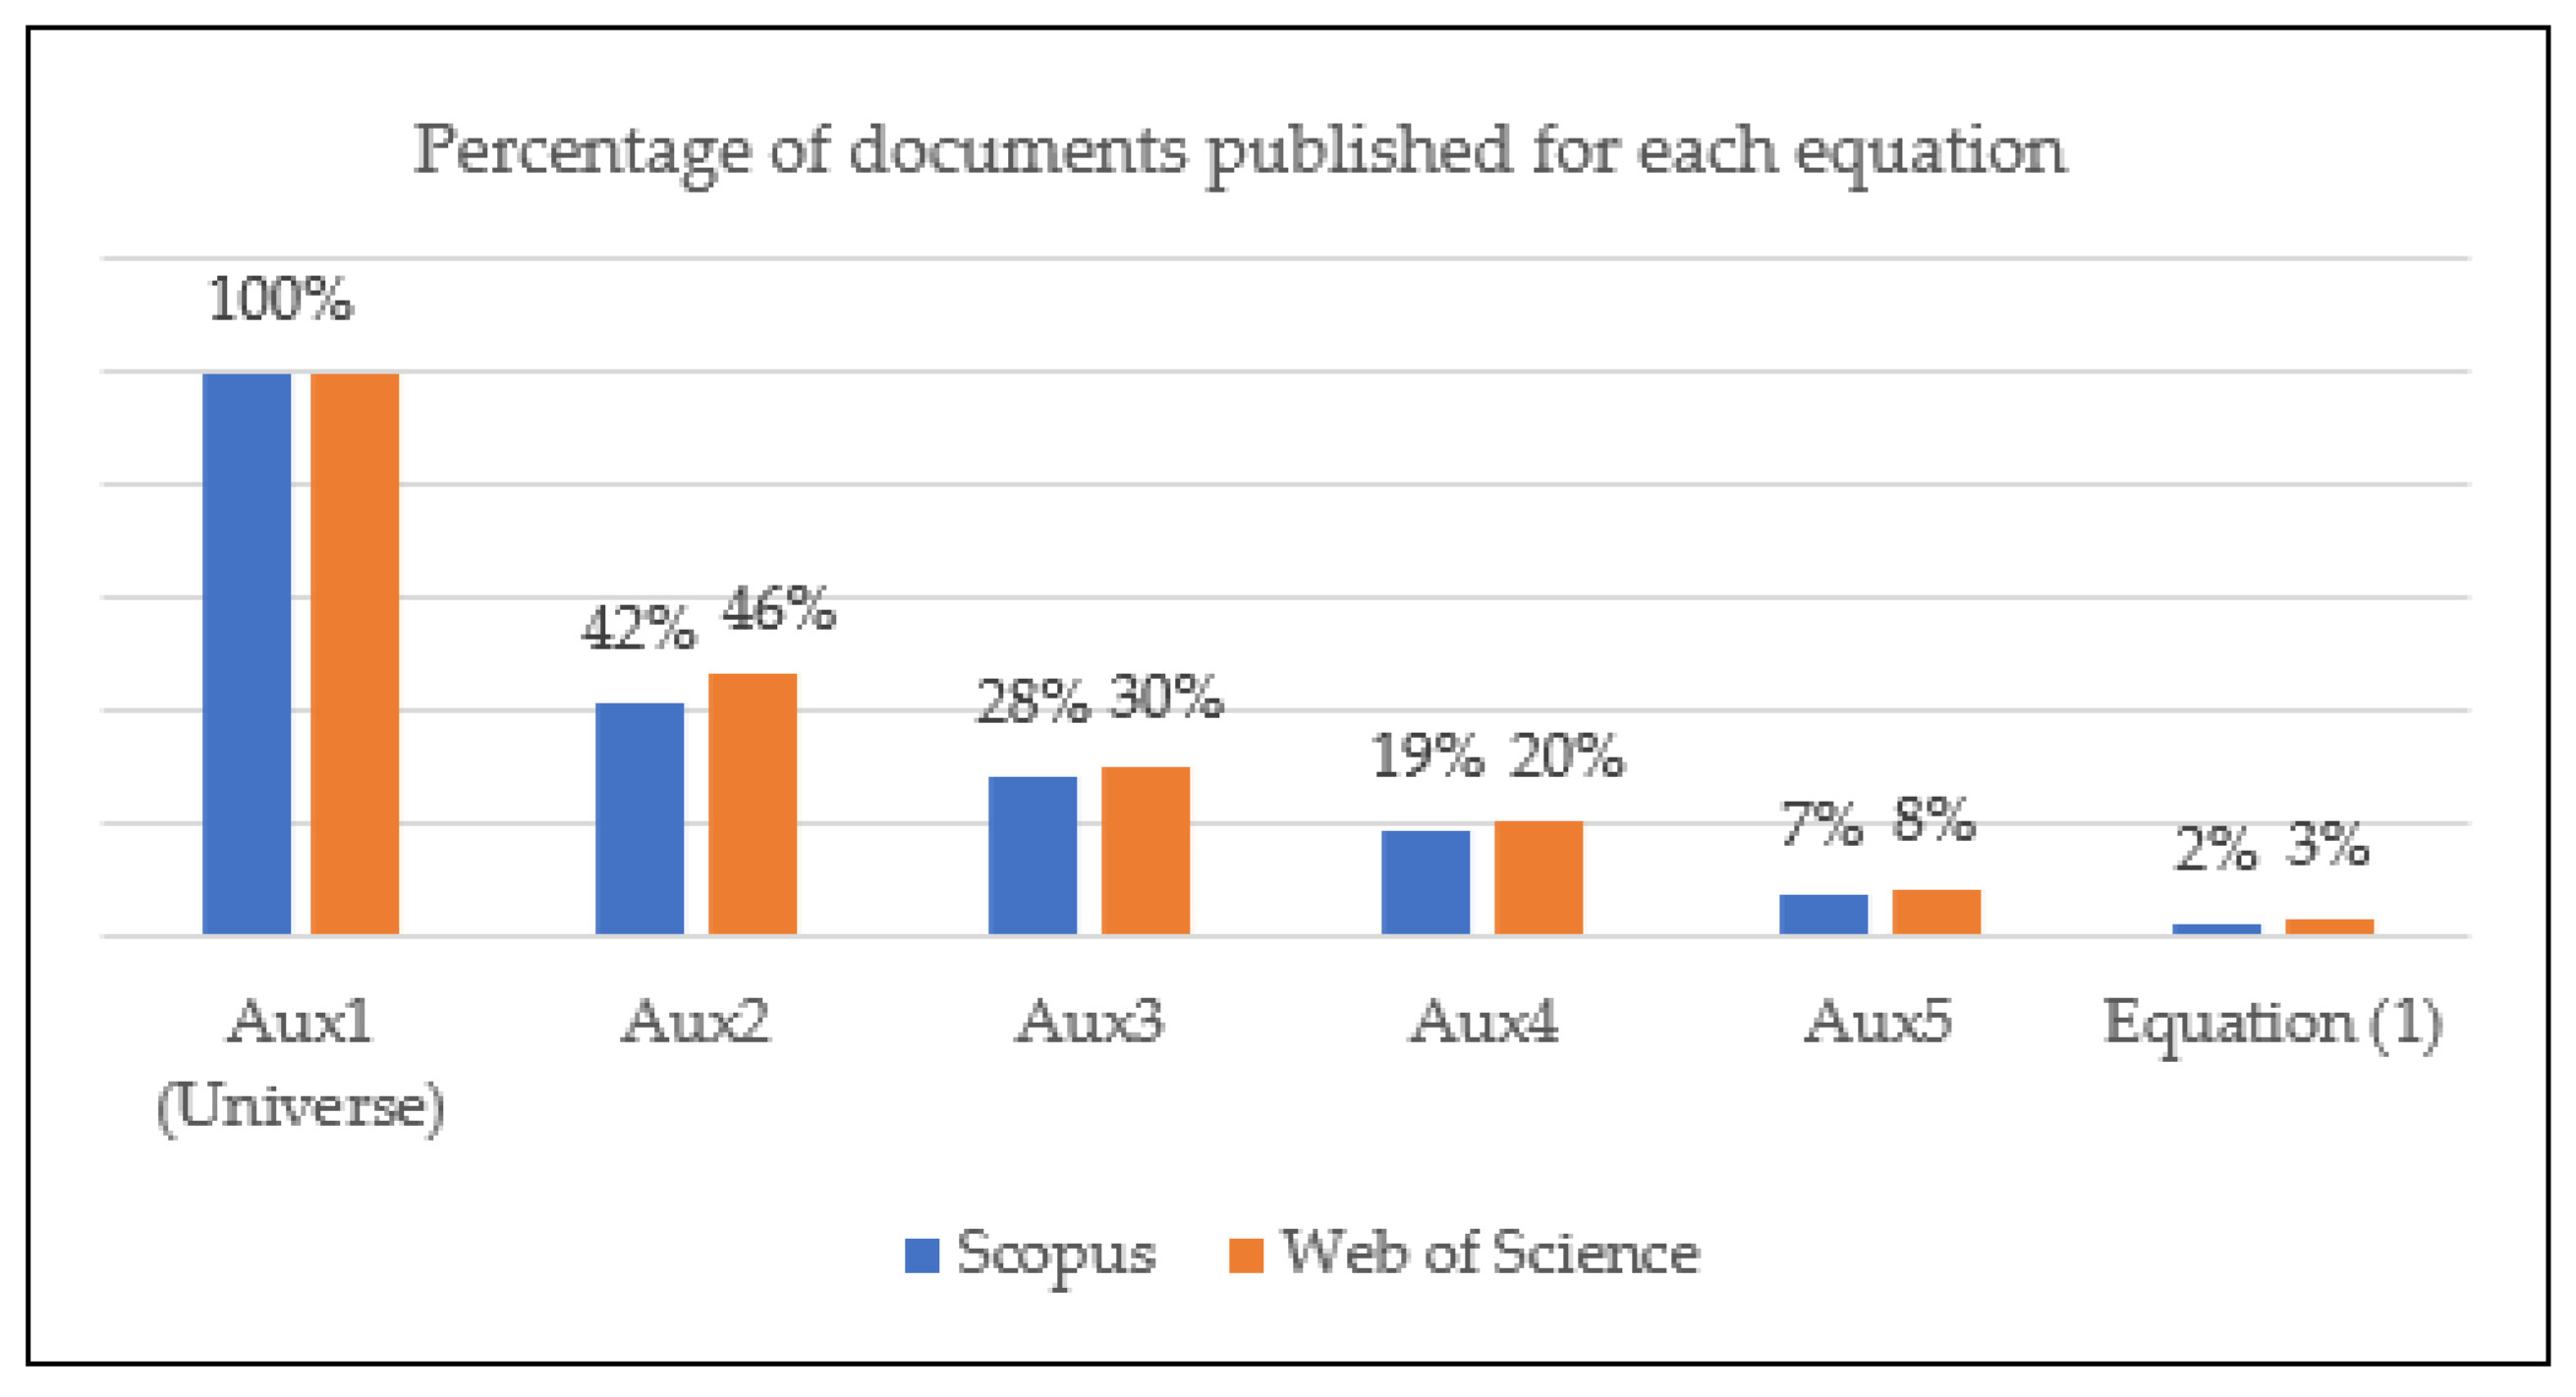
Stage 2.2—Design Keywords to Each Research Question. To retrieve metadata aligned with the research field and questions defined in Stage 1, a systematic Boolean search strategy was developed using technical vocabulary directly associated with distributed energy resources (DERs) and their integration into power systems. This strategy was structured around a sequence of auxiliary queries (Aux1 to Aux5) that progressively incorporated semantic filters targeting different conceptual layers of the field.
captures the general document universe on distributed energy resources, while excluding unrelated DER acronym uses in other disciplines.
filters records linking DER with microgrids (MG) or smart grids (SG).
retrieves documents involving any type of evaluation or assessment of DERs.
focuses on literature discussing the technical impacts produced by DERs.
narrows the scope to documents evaluating specific impacts caused by DER integration.
These auxiliary queries formed the basis for constructing the final optimized search expression tailored to the objectives of the proposed methodology:
This final query was designed to retrieve studies that evaluate the impacts caused by DER integration into microgrids and smart grids under technical criteria. Its Boolean structure strategically combines variants of the core concepts—DER, microgrids, evaluation, and impacts—ensuring that the equation captures all relevant terminological permutations used in the field when discussing the assessment of technical impacts.
The Boolean logic applied follows standard database conventions:
Quotation marks (“”) indicate exact phrase matching.
An asterisk (*) represents any ending (wildcard suffix).
A quotation mark (?) stands for a single-character wildcard.
(A) AND (B) returns results that satisfy both conditions A and B.
(A) OR (B) returns results that satisfy either A, B, or both.
(A) AND NOT (B) excludes from A any result that meets condition B.
All query results were recorded and organized systematically. This record was later used in the descriptive statistical analysis (Stage 3.1) to explore scientific production trends and provide quantitative support for understanding the evolution of knowledge in the field.
Stage 2.3—Define Inclusion Criteria. Once the search strategy was defined, inclusion criteria were adjusted to ensure the download of all available bibliographic data from each source, maximizing the analytical potential of the retrieved information. Stage 2.4—Download from Source Database. Export formats were selected according to Bibliometrix specifications: CSV for Scopus and Plaintext for Web of Science.
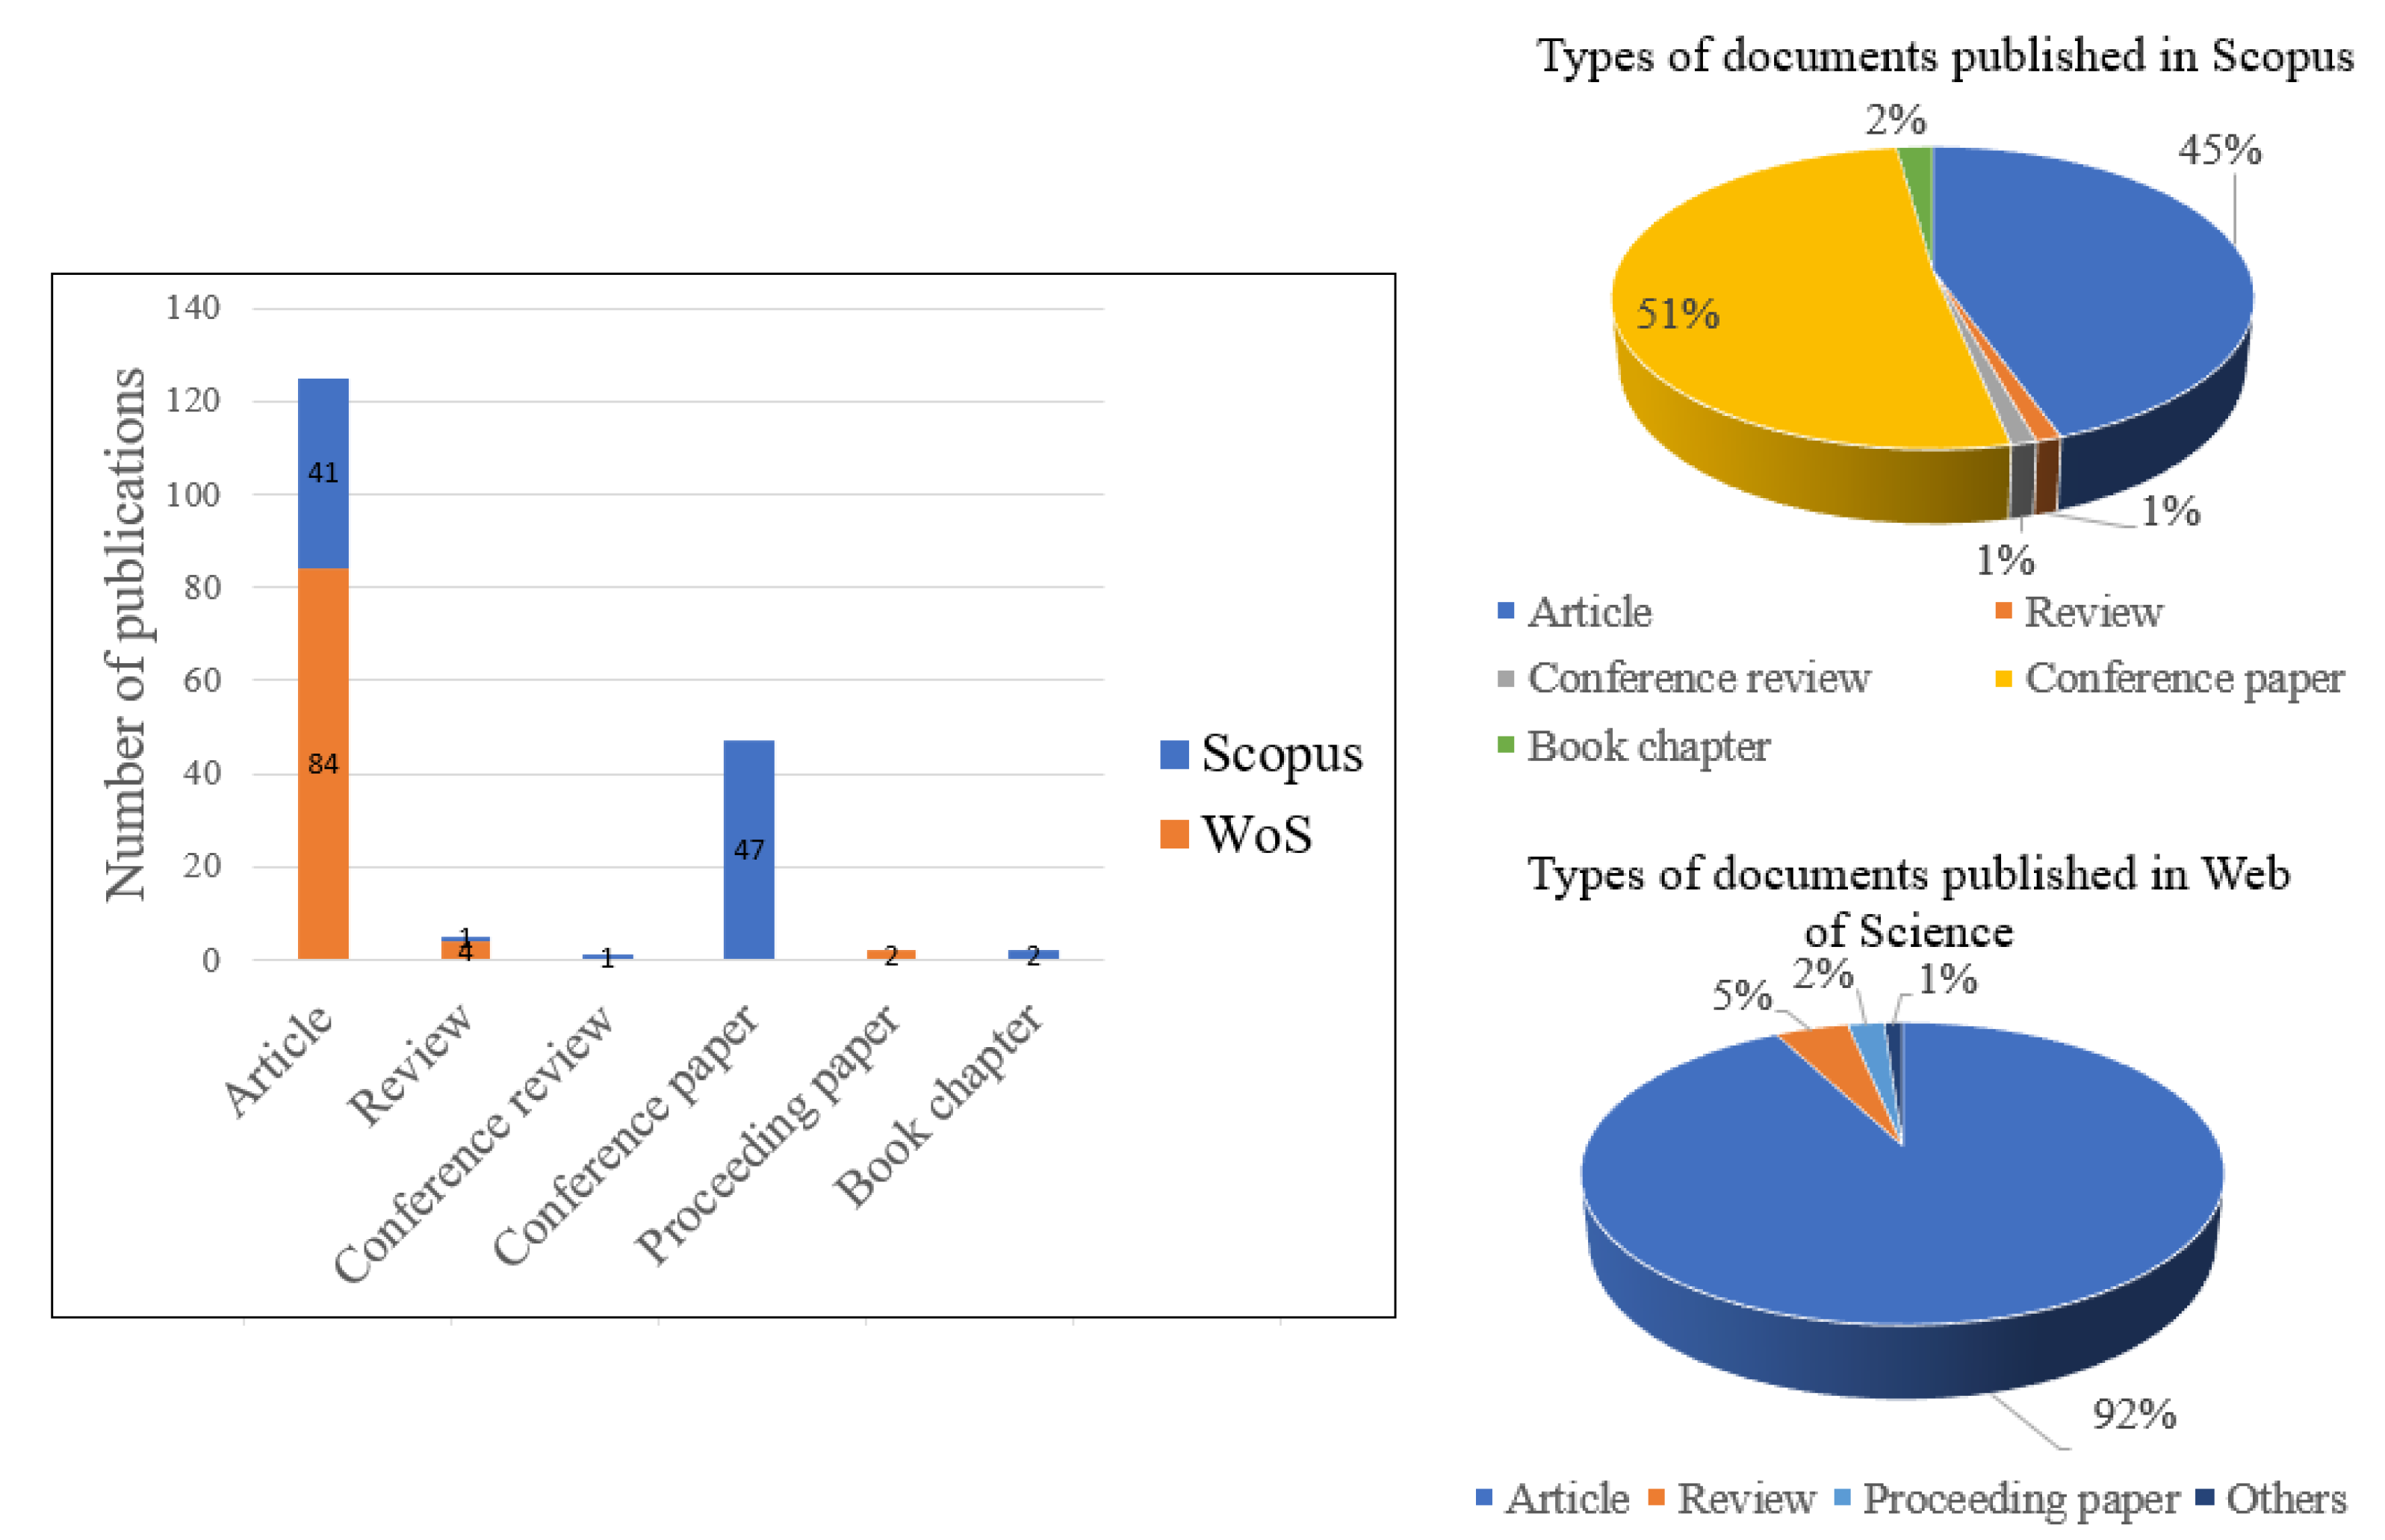
Stage 2.5—Data Cleaning. A meticulous data cleaning process was then conducted, involving the analysis of completeness, structure, and consistency of metadata, as well as the identification and removal of duplicate records using Excel spreadsheets and R scripts. This process led to the construction of a unified database composed of 148 documents, including articles, reviews, conference papers, book chapters, and other scientific publication types.
Stage 2.5.1—Metadata Integrity Assessment. In line with responsible bibliometric practices, and prior to executing any analytical stage, an integrity assessment was conducted on the metadata retrieved from Scopus and Web of Science using R version 4.4.1. This verification revealed a data loss of 2.5% in the Scopus dataset and 20.2% in the WoS dataset, mainly concentrated in fields related to institutional affiliations (e.g., AU_UN_NR and AU_UN). However, these missing values do not compromise the overall structure of the metadata, nor do they affect the standard fields required by Bibliometrix for bibliometric analysis, which include AB, AU, TI, PY, SO, CR, DE, and ID, among others [
1]. Using R version 4.4.1, structural verification was performed with the “str(M)” function, and missing values were visualized using the “vis_miss()” function from the “visdat” package. This step confirmed the adequacy of the dataset for analysis within the proposed methodological framework. These structural limitations and their implications have been previously documented [
10,
11], whose recommendations were taken into account in this work.
Stage 2.5.2—Duplicate Record Removal. A manual deduplication process was initially performed using Excel spreadsheets, based on a combination of author names, publication year, and citation counts to identify and eliminate records found in both databases. As of August 2024, Bibliometrix version 4.3.0 (via the Biblioshiny app) incorporated new functionality allowing direct bibliometric analysis of unified datasets, which was adopted in this study to enhance consistency and reduce human error.
Stage 2.6—Data Upload and Conversion. All processes from Stage 2.6 to Stage 2.7 were conducted directly using the Biblioshiny application of the Bibliometrix software package. The datasets were then uploaded into the Biblioshiny platform for processing, either individually (Stage 2.6.1—Data Upload and Conversion for Individual Database) or simultaneously merged (Stage 2.6.2—Data Upload and Conversion for Unified Database) using new features available since version 4.3.0 of the software. Stage 2.7—Apply Filters. Finally, internal filters were applied to configure key bibliographic attributes such as language, document type, and analysis time span, thus completing the preparation of the dataset for advanced bibliometric analysis. This stage consolidates a replicable and verifiable data infrastructure that supports the technical rigor and traceability of the proposed methodology.
3.3. Stage 3—Data Analysis
The data analysis stage represents the methodological core of the proposed bibliometric process and is directly linked to the research questions and objectives defined during the initial study design (Stage 1.4). In this phase, appropriate statistical techniques are selected to be applied to the unified database, enabling work at different levels of analysis [
1,
7].
The choice of each bibliometric technique depends on its unit of analysis: authors, documents, and journals in bibliographic coupling; authors, references, and journals in co-citation; authors, countries, and institutions in co-author; and keywords or terms extracted from titles, abstracts, or full texts in co-word analysis—the latter being the only bibliometric technique that uses the actual textual content of the documents [
1].
As part of the proposed methodology,
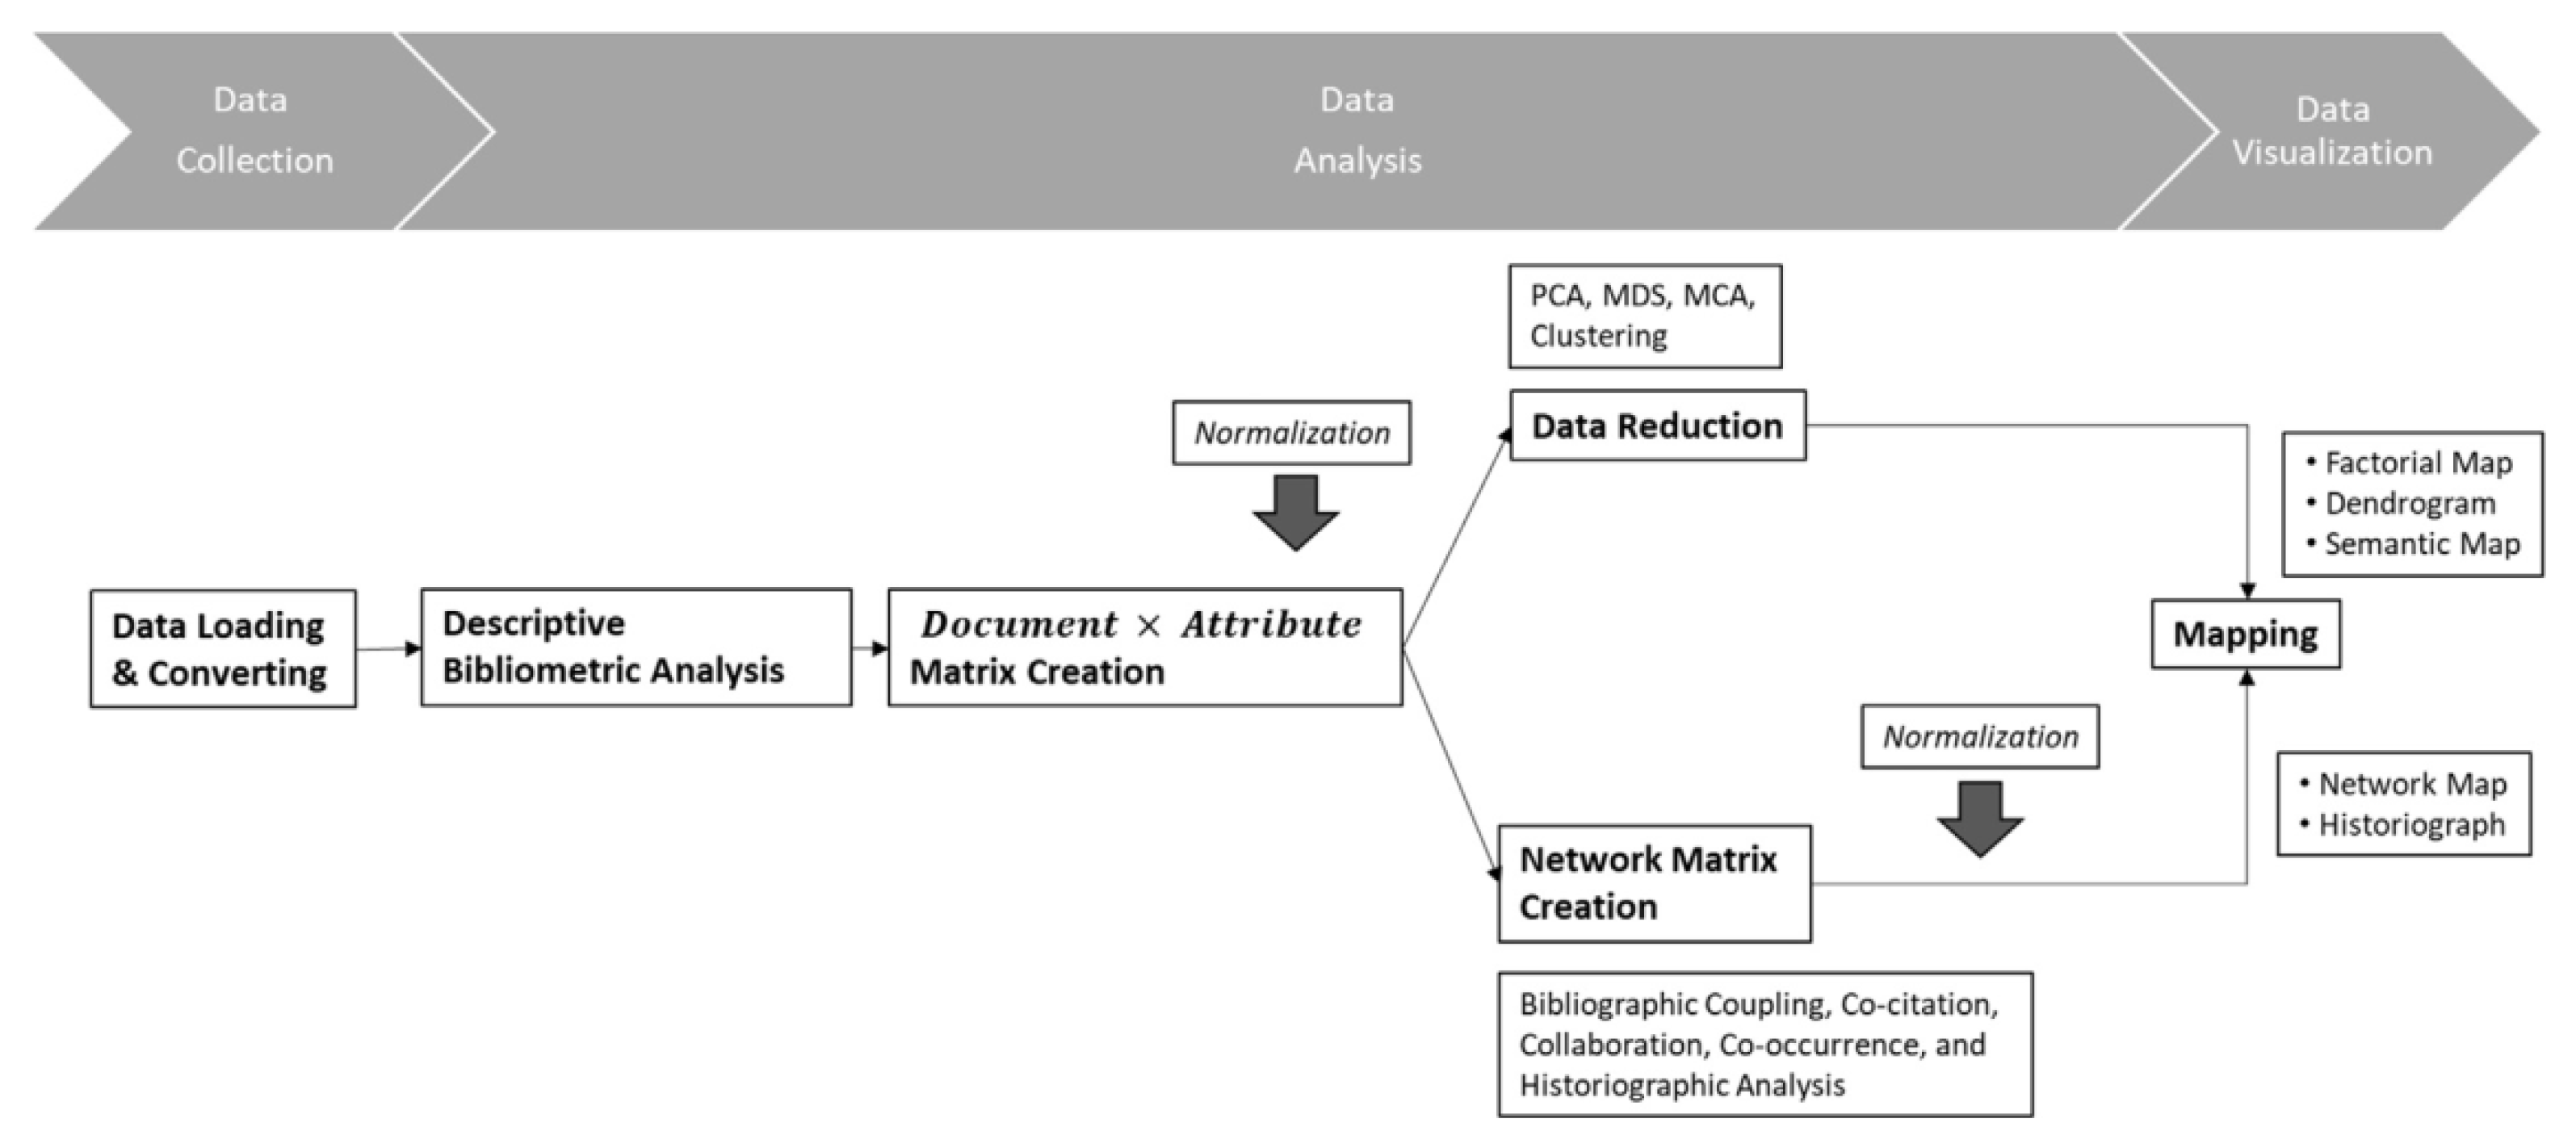
Figure 3 (Stage 3) resent the hierarchical guides of the bibliometric techniques implemented, as recommended in the workflow for the use of the Bibliometrix software (via Biblioshiny app) [
1]. The data analysis process is developed along two main lines: (1) descriptive and comparative bibliometric analysis, which can be complemented with tools such as R, RStudio, Excel, or native functions from Scopus and Web of Science; (2) structural analysis, carried out entirely within Biblioshiny.
Notably, within this methodology, bibliographic coupling is applied as a retrospective technique to assess the consolidated state of knowledge, while co-citation is recommended as a prospective approach to identify future trends. In addition, the methodology supports a mixed-review strategy that combines bibliometric outputs with qualitative insights derived from previous systematic reviews, enriching interpretation and fostering the generation of new research hypotheses.
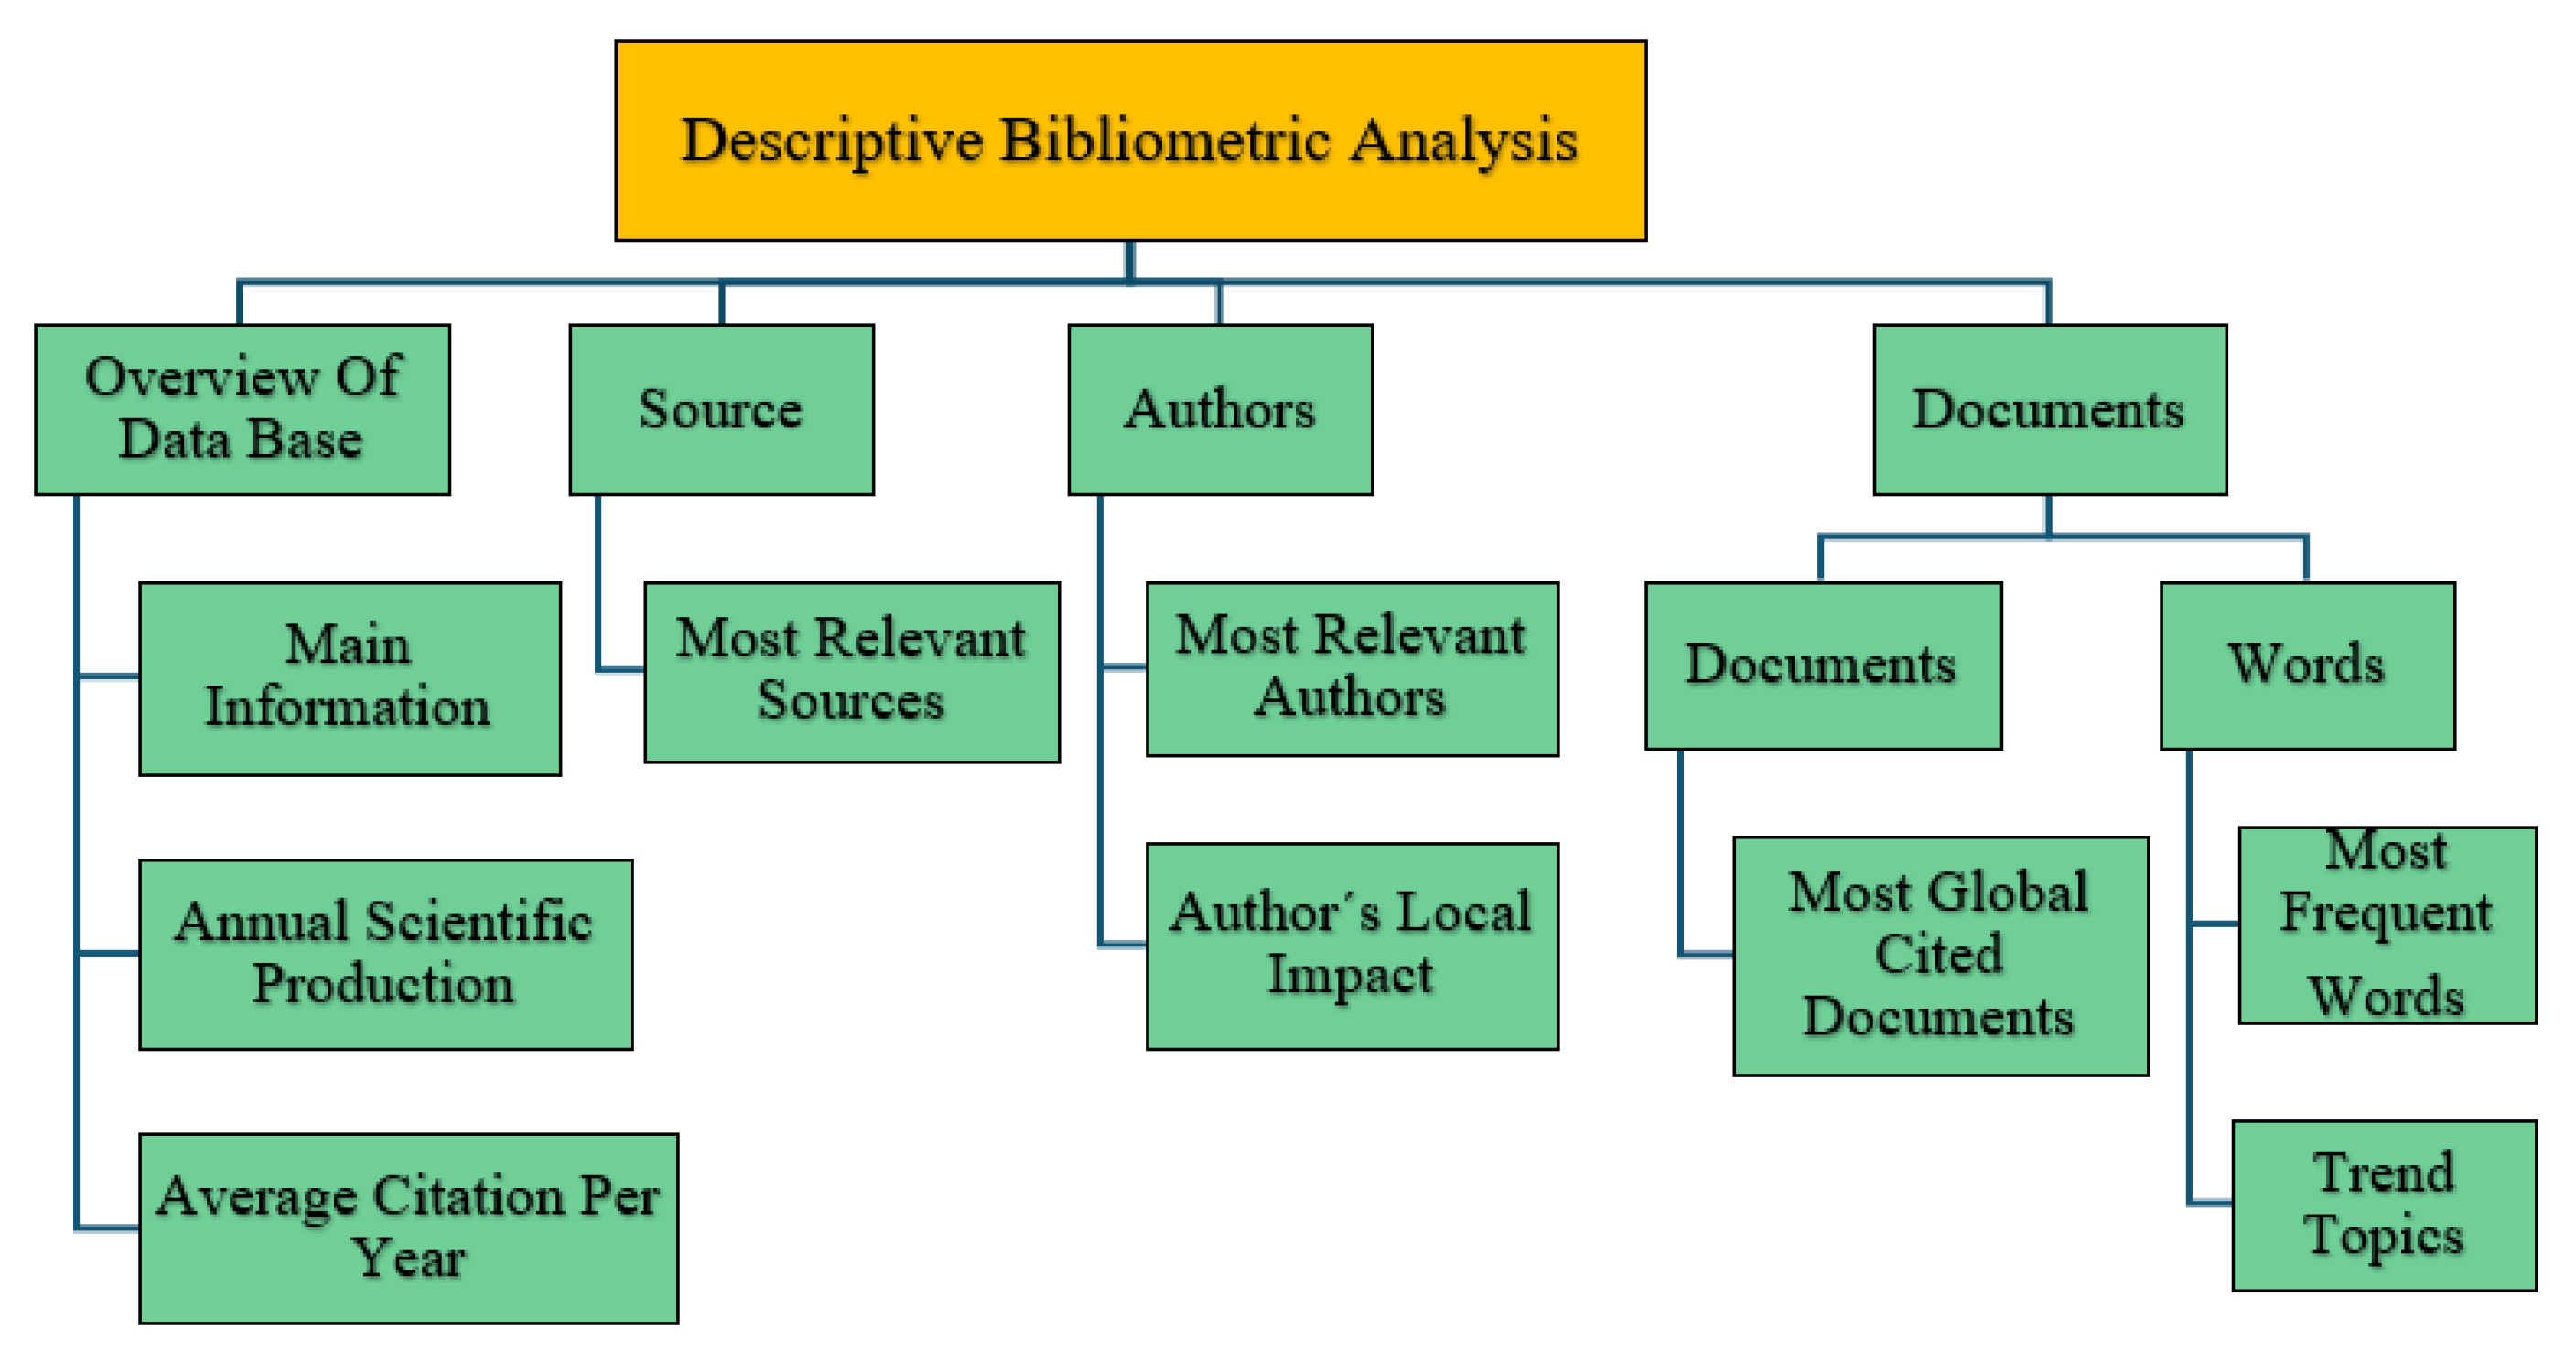
Stage 3.1—Descriptive Bibliometric Analysis. The application of descriptive bibliometric analysis in the proposed methodology was conducted on the unified database, which comprises 148 documents, including articles, reviews, conference papers, and book chapters, as detailed in
Figure 4. Statistical tools and bibliometric metrics were applied at the levels of Source, Authors, and Documents, as well as at the sublevels Words and Documents, as illustrated in
Figure 5, levels and tools of descriptive bibliometric analysis. This substage is executed directly through the Biblioshiny app, using its hierarchical structure of the tool. However, as part of the extended approach proposed, additional tools such as R, RStudio, and Excel are also incorporated, enabling prior comparative analyses between database1 (Scopus) and database2 (Web of Science). This multi-source integration is particularly valuable in the context of electrical engineering, where it is essential to validate the consistency and complementarity of different types of documents (see,
Figure 4). As shown in
Figure 6, the number of documents retrieved for each search equation designed in Stage 2.2 is presented. While Aux1 yielded a broad set of results, statistical analysis showed that fewer than 3% of the documents retrieved from both databases simultaneously addressed all thematic components captured by Equation (1). This finding reveals a low degree of research maturity in the specific area of interest and highlights the relevance of applying the proposed methodology.
Although this approach allows for the identification of potential duplication or complementarity among different document types, it is also necessary to consider the inclusion of additional bibliographic data sources, such as Google Scholar, ScienceDirect, and others recognized in specific disciplines. Several bibliometric studies have warned that relying solely on Web of Science and Scopus may lead to biased or incomplete retrievals due to database-specific coverage gaps [
1,
8,
9]. For example, the need to map the limitations of database coverage when conducting science mapping of emerging topics has been explicitly highlighted in [
8]. This underscores a major limitation in relying exclusively on Web of Science Core Collection or Scopus: the risk of overlooking discrepancies or uncertainties in bibliometric results caused by domain-specific omissions or metadata inconsistencies.
A relevant methodological aspect is the possibility of extending this stage with data from prior bibliographic studies on the evaluation of technical impacts resulting from DER integration, thereby consolidating a descriptive analysis line that combines quantitative precision with structured qualitative interpretation.
Stage 3.1.1—Overview of Database. As part of the proposed descriptive bibliometric analysis, the “Overview” input tab of the Biblioshiny app was used, as positioned within the hierarchical interface. This substage provided the most representative general information from the individual databases (database1 and database2), as well as from the unified database generated through their merger. This information enables the researcher to obtain a comparative view of the fundamental bibliographic characteristics of both scientific dissemination sources and the consolidated database used for the analysis.
The application of this substage was particularly relevant in the context of the study on the technical impacts derived from the integration of DER into the electrical system, as it provided the initial indicators for determining thematic coverage, predominant document types, and the evolution of interest in the field defined by Equation (1). The information was verified through both manual procedures in Excel and automated reports generated by the Biblioshiny software (August 2024 version), allowing the results from each source to be contrasted with those obtained from the unified database.
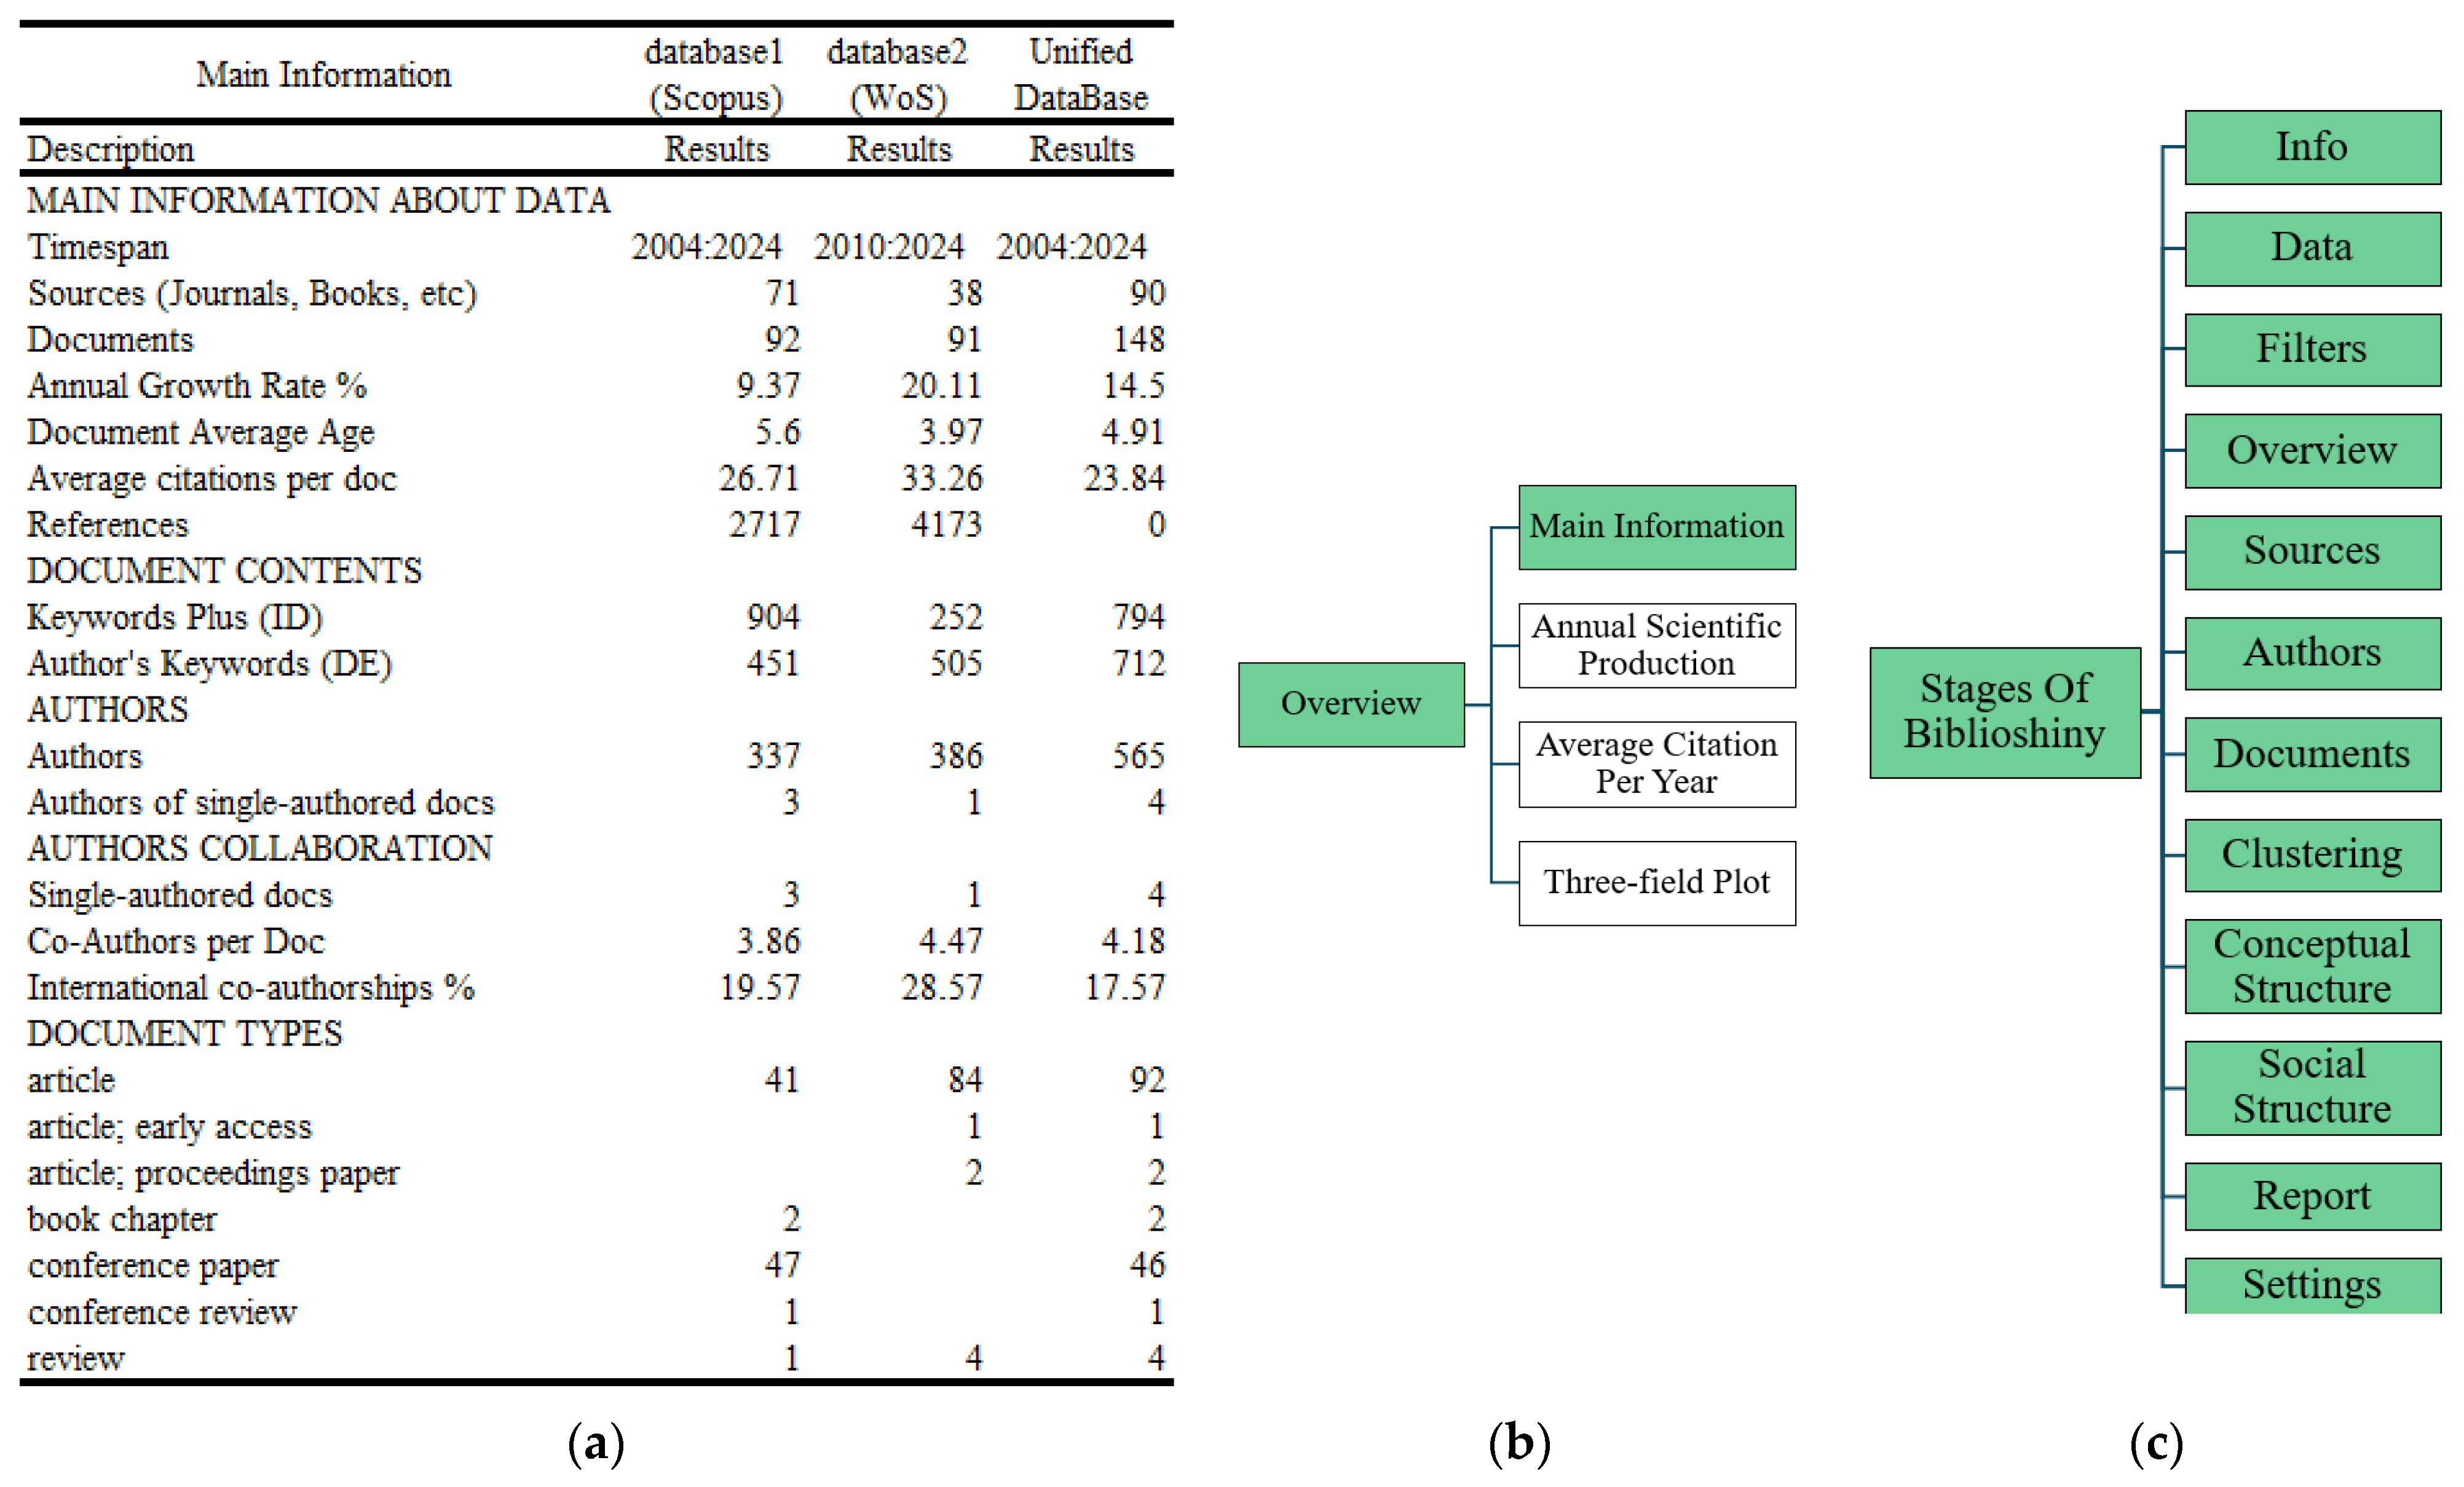
Stage 3.1.1.1—Main Information. In this substage, the detailed classification of document types found in the unified database, as shown in
Figure 7 and complemented by
Figure 4 provides valuable insight into the editorial policies and thematic priorities of the selected scientific sources. This analysis enables researchers to identify not only the most frequent publication formats—such as articles, reviews, conference papers, or book chapters—but also the most suitable channels for scientific dissemination on the specific topic defined by Equation (1). Within the applied context of electrical engineering, this substage becomes essential for determining which type of document may be most appropriate depending on the research scope, whether it involves methodological proposals, technical applications, or regulatory discussions. Moreover, the cross-validation between the automated processing carried out in Biblioshiny and the manual consolidation performed in Excel reinforces the reliability of the dataset and confirms the complementarity between the two bibliographic sources (database1 and database2), thereby establishing the unified database as a consistent and dependable input for subsequent stages of bibliometric analysis.
The consolidated retrieval of document types and quantities, based on the search strategies defined in Stage 2.2, supports an initial descriptive assessment of both the level of academic interest and the maturity of scientific output in the field. As illustrated in
Figure 6, only 3% or fewer of the total records retrieved through the preliminary query (Aux1) match the refined criteria defined by Equation (1), which focuses on studies proposing specific solutions to the challenges addressed by the research topic. This finding underscores a critical gap in the literature and reinforces the originality of the proposed methodology, which is grounded in a structured and selective bibliometric filtering process. The interpretation of these results substantiates the methodological rigor applied to the construction of the unified database and highlights how few studies fully comply with the defined criteria for evaluating technical impacts associated with DER integration in electrical systems.
The consolidated overview of document types and volumes across database1, database2, and the unified database is presented in
Figure 7, which was generated using the Main Information option within the “Overview” tab of the Biblioshiny app. This visualization plays a strategic role in the proposed methodology by integrating the fundamental bibliographic attributes necessary for comparing the characteristics of both individual databases with the consolidated results. The consistency achieved through cross-verification—between manual data collection and automated reports—ensures traceability and confirms the structural integrity of the dataset, providing a robust foundation for the bibliometric analyses developed in the following stages.
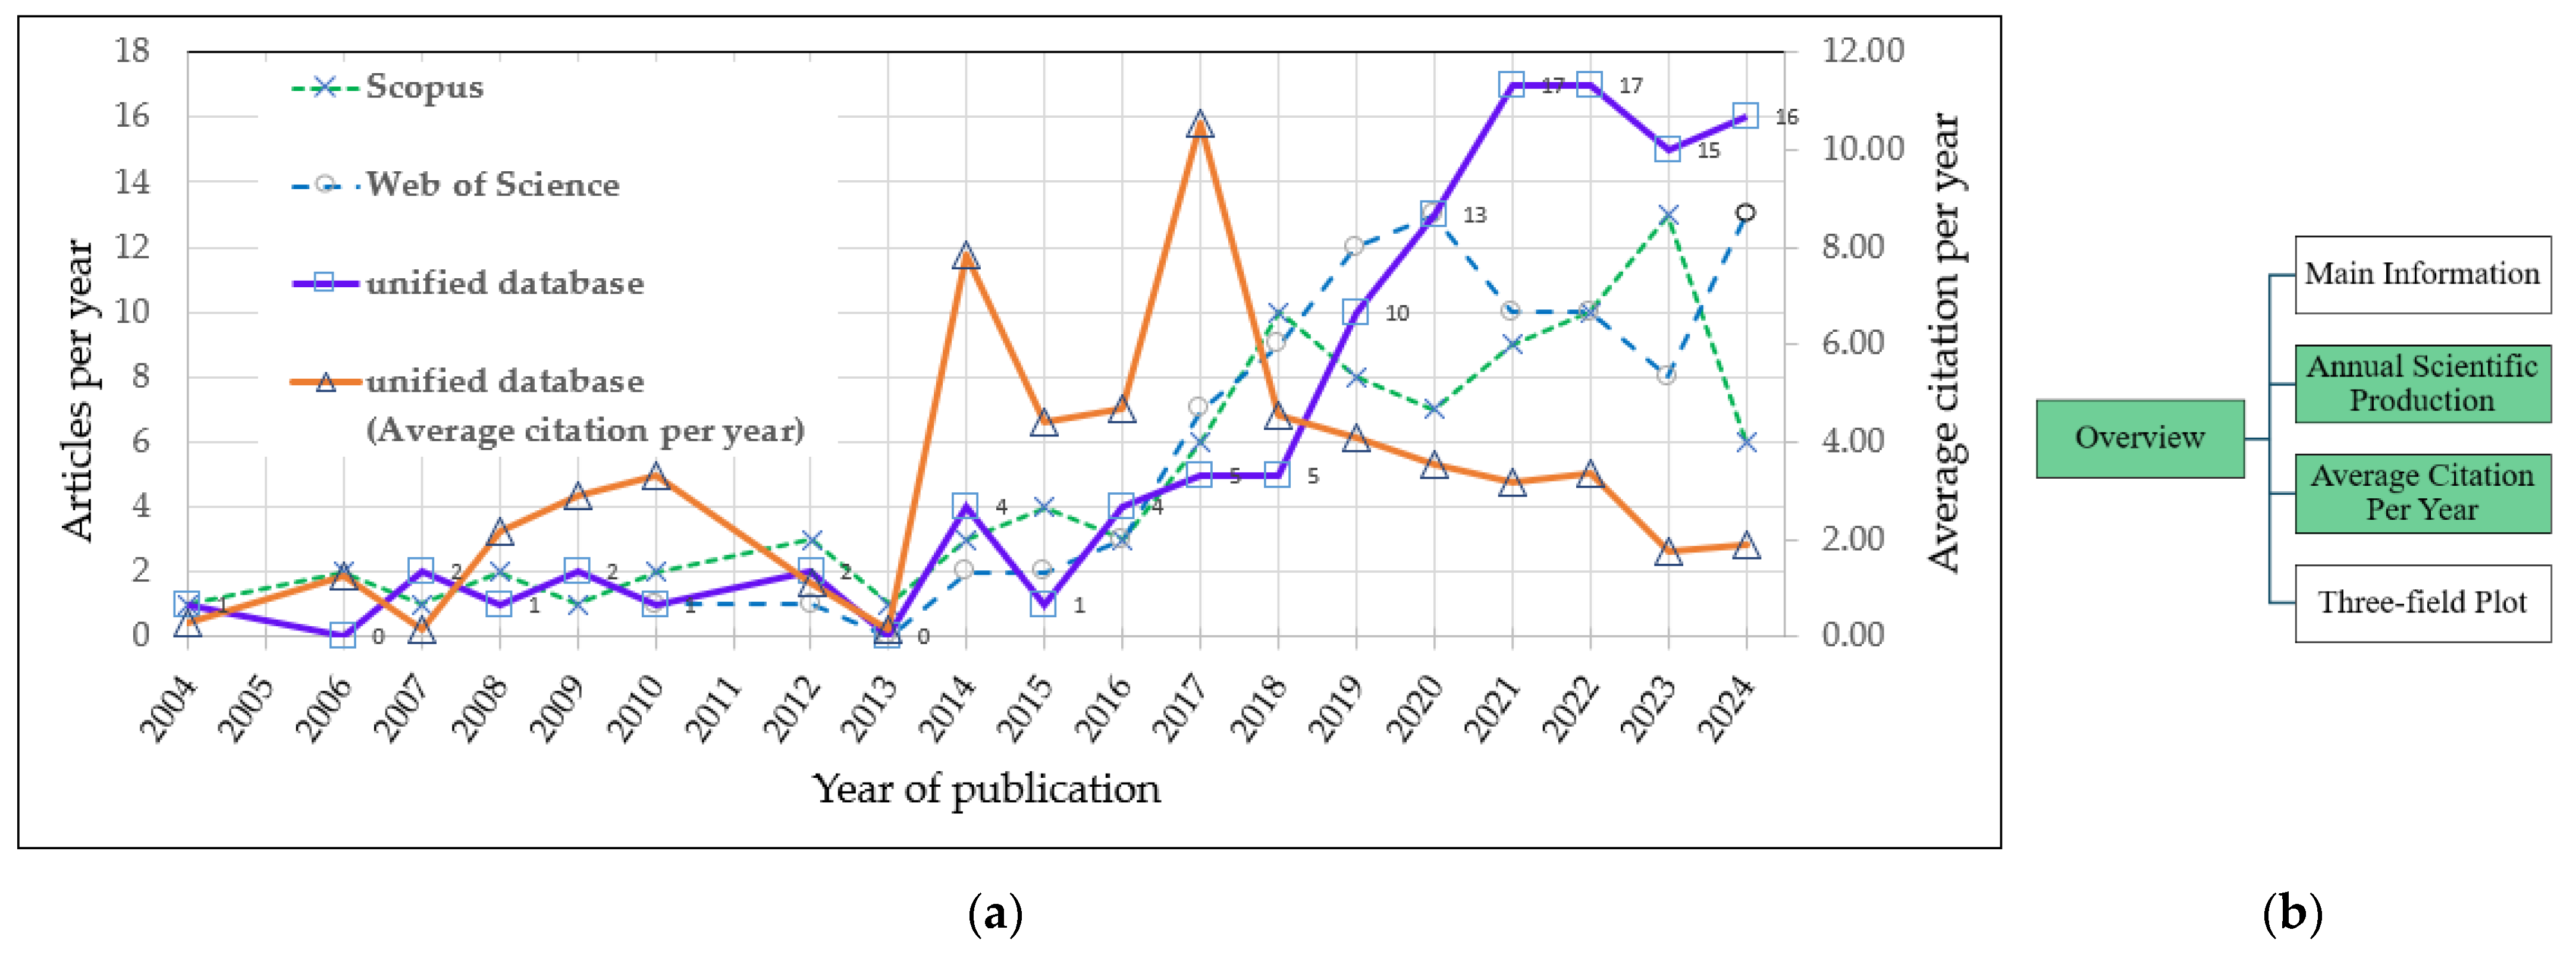
In Substage 3.1.1.2—Annual Scientific Production and Substage 3.1.1.3—Average Citation per Year Published, the evolution of publications between 2004 and 2024 is analyzed to assess global interest in the topic addressed by Equation (1). This analysis was carried out using R scripts and spreadsheet tools and was cross-validated through the “Annual Scientific Production” tab available in the Biblioshiny interface. The results are shown in
Figure 7 which displays the annual number of scientific documents extracted from database1, database2, and the unified database.
The annual growth trend reveals an increasing number of contributions on the subject, with particular emphasis over the last decade. Moreover, the Annual Percentage Growth Rate (APGR), calculated from the source databases for
Figure 8, shows values of 9.37% for Scopus, 20.1% for Web of Science, and 14.5% for the unified database, according to the information presented in
Figure 7. These indicators, along with the observed increase in the average number of citations per year during 2014 and especially 2017, reflect not only a growing academic interest in addressing the challenges related to distributed energy resources (DERs), but also partially correspond to the structural expansion of Web of Science and Scopus coverage. This trend aligns with the international urgency to strengthen sustainable energy systems and guide technical proposals toward effective integration models [
12].
Substage 3.1.4.1—Most Globally Cited Documents and Substage 3.1.4.2—Most Frequent Words. In the proposed methodology, the results obtained in these substages enable an evaluation of the effectiveness of the bibliometric strategy by comparing the retrieved dataset with those documents identified as the most statistically relevant. Substage 3.1.4.1 focuses on globally cited documents, allowing for the validation of whether the refined search expressions (e.g., Equation (1)) successfully retrieve high-impact references in the field. Substage 3.1.4.2, conducted alongside 3.1.4.1 within the Bibliometrix environment (Biblioshiny app), identifies the most frequently used terms across the corpus. When using “Abstract” as the unit of analysis, this substage becomes particularly valuable for exploring potential methods, strategies, or alternative solutions proposed by the authors themselves. Together, these substages reinforce the diagnostic capacity of the proposed methodology by combining relevance-based validation and thematic exploration.
3.3.1. Trend Topics
In the substage 3.1.4.3—Trend Topics, a descriptive analysis is conducted to identify, over the time range 2004–2024, the main topics and research areas linked to Equation (1).
This substage is critical within the proposed methodology, as it enables tracking the annual emergence, evolution, and frequency of research themes using three analytical dimensions: Keywords Plus—to capture the emergence of new topics; Abstracts—to identify solution-oriented developments; and Authors’ Keywords—to detect thematic orientations directly declared by researchers.
The analysis was performed using the “Trend Topics” tab of the Biblioshiny interface, applying it to the data extracted from the unified database. This step enables the detection of statistically relevant emerging topics that are gradually gaining traction in the scientific community and sets the foundation for identifying whether these trends have been addressed with concrete proposals—or whether they remain as underexplored opportunities in the research agenda.
3.3.2. Trends and Annual Frequency of Occurrence of Emerging Research Topics
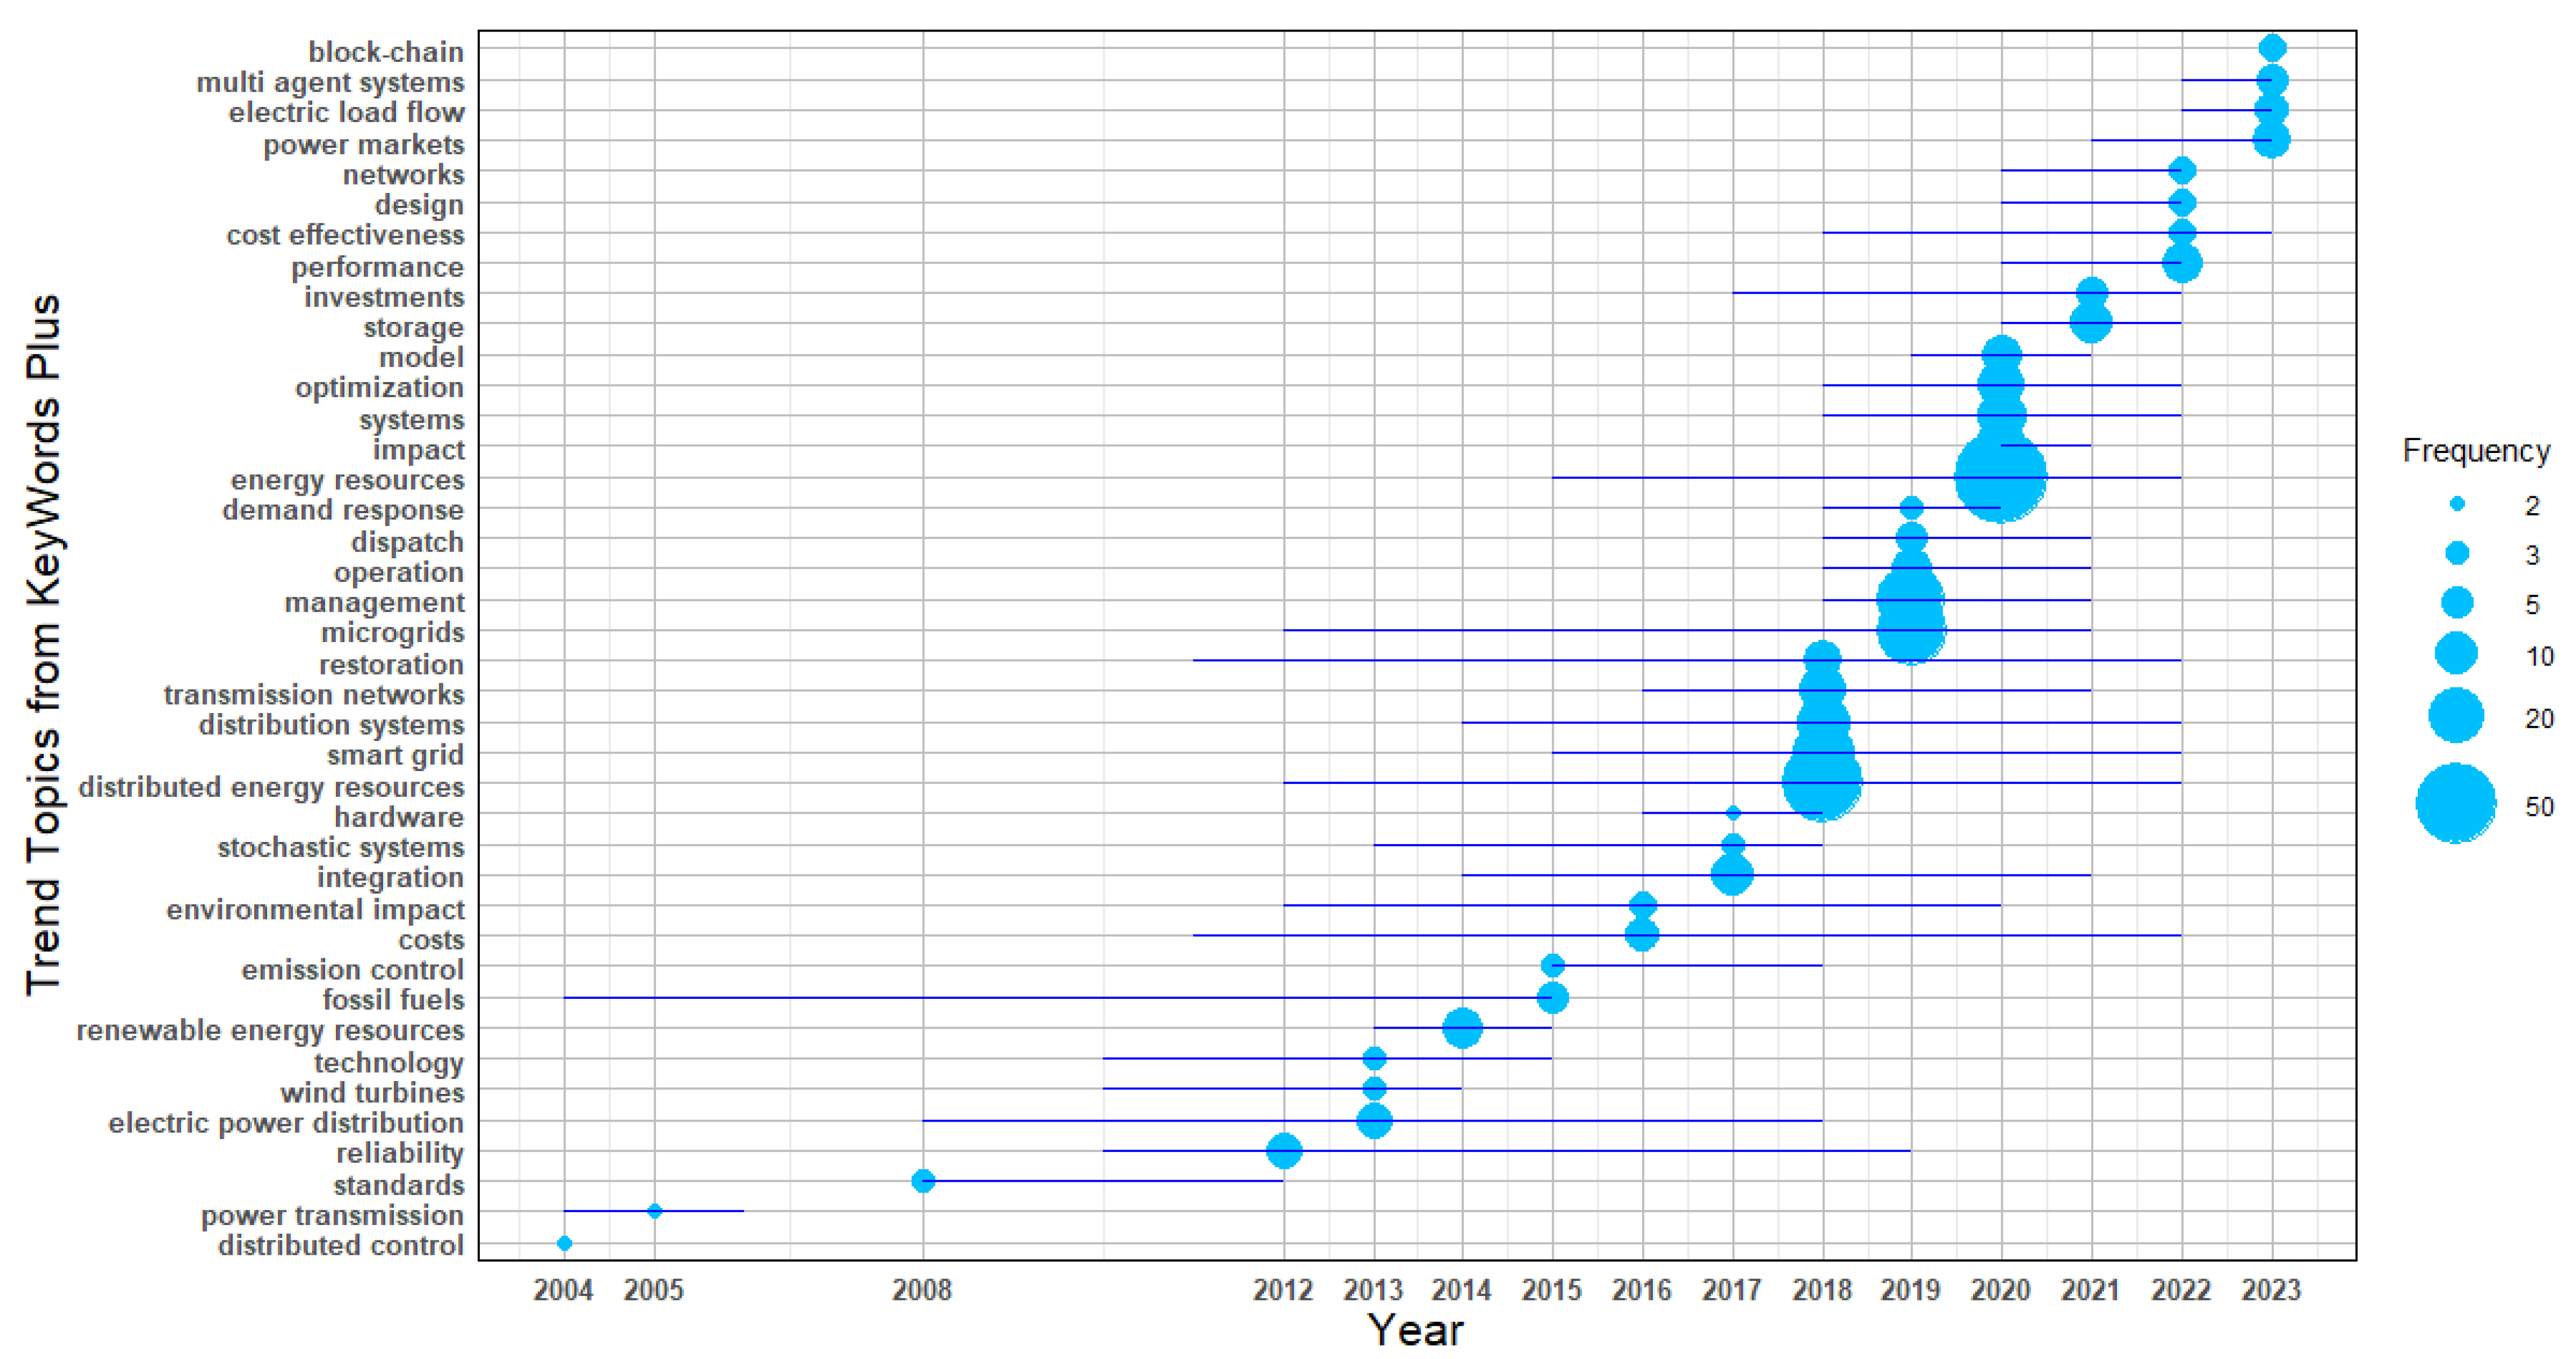
The results corresponding to substage 3.1.4.3.1 are presented in
Figure 9, which illustrates the annual frequency and emergence of the most statistically significant Keywords Plus between 2004 and 2024. These terms reflect globally relevant research challenges that evolve over time and stimulate scientific production aimed at generating solution-oriented contributions.
In this substage, the unit of analysis is Keywords Plus, which enables the identification of new research directions and emerging topics within the current scientific literature. This stage is essential for assessing whether such emerging themes have been addressed through specific proposals, an aspect analyzed in the following substage through the study of Abstracts, or whether they remain as unresolved research opportunities.
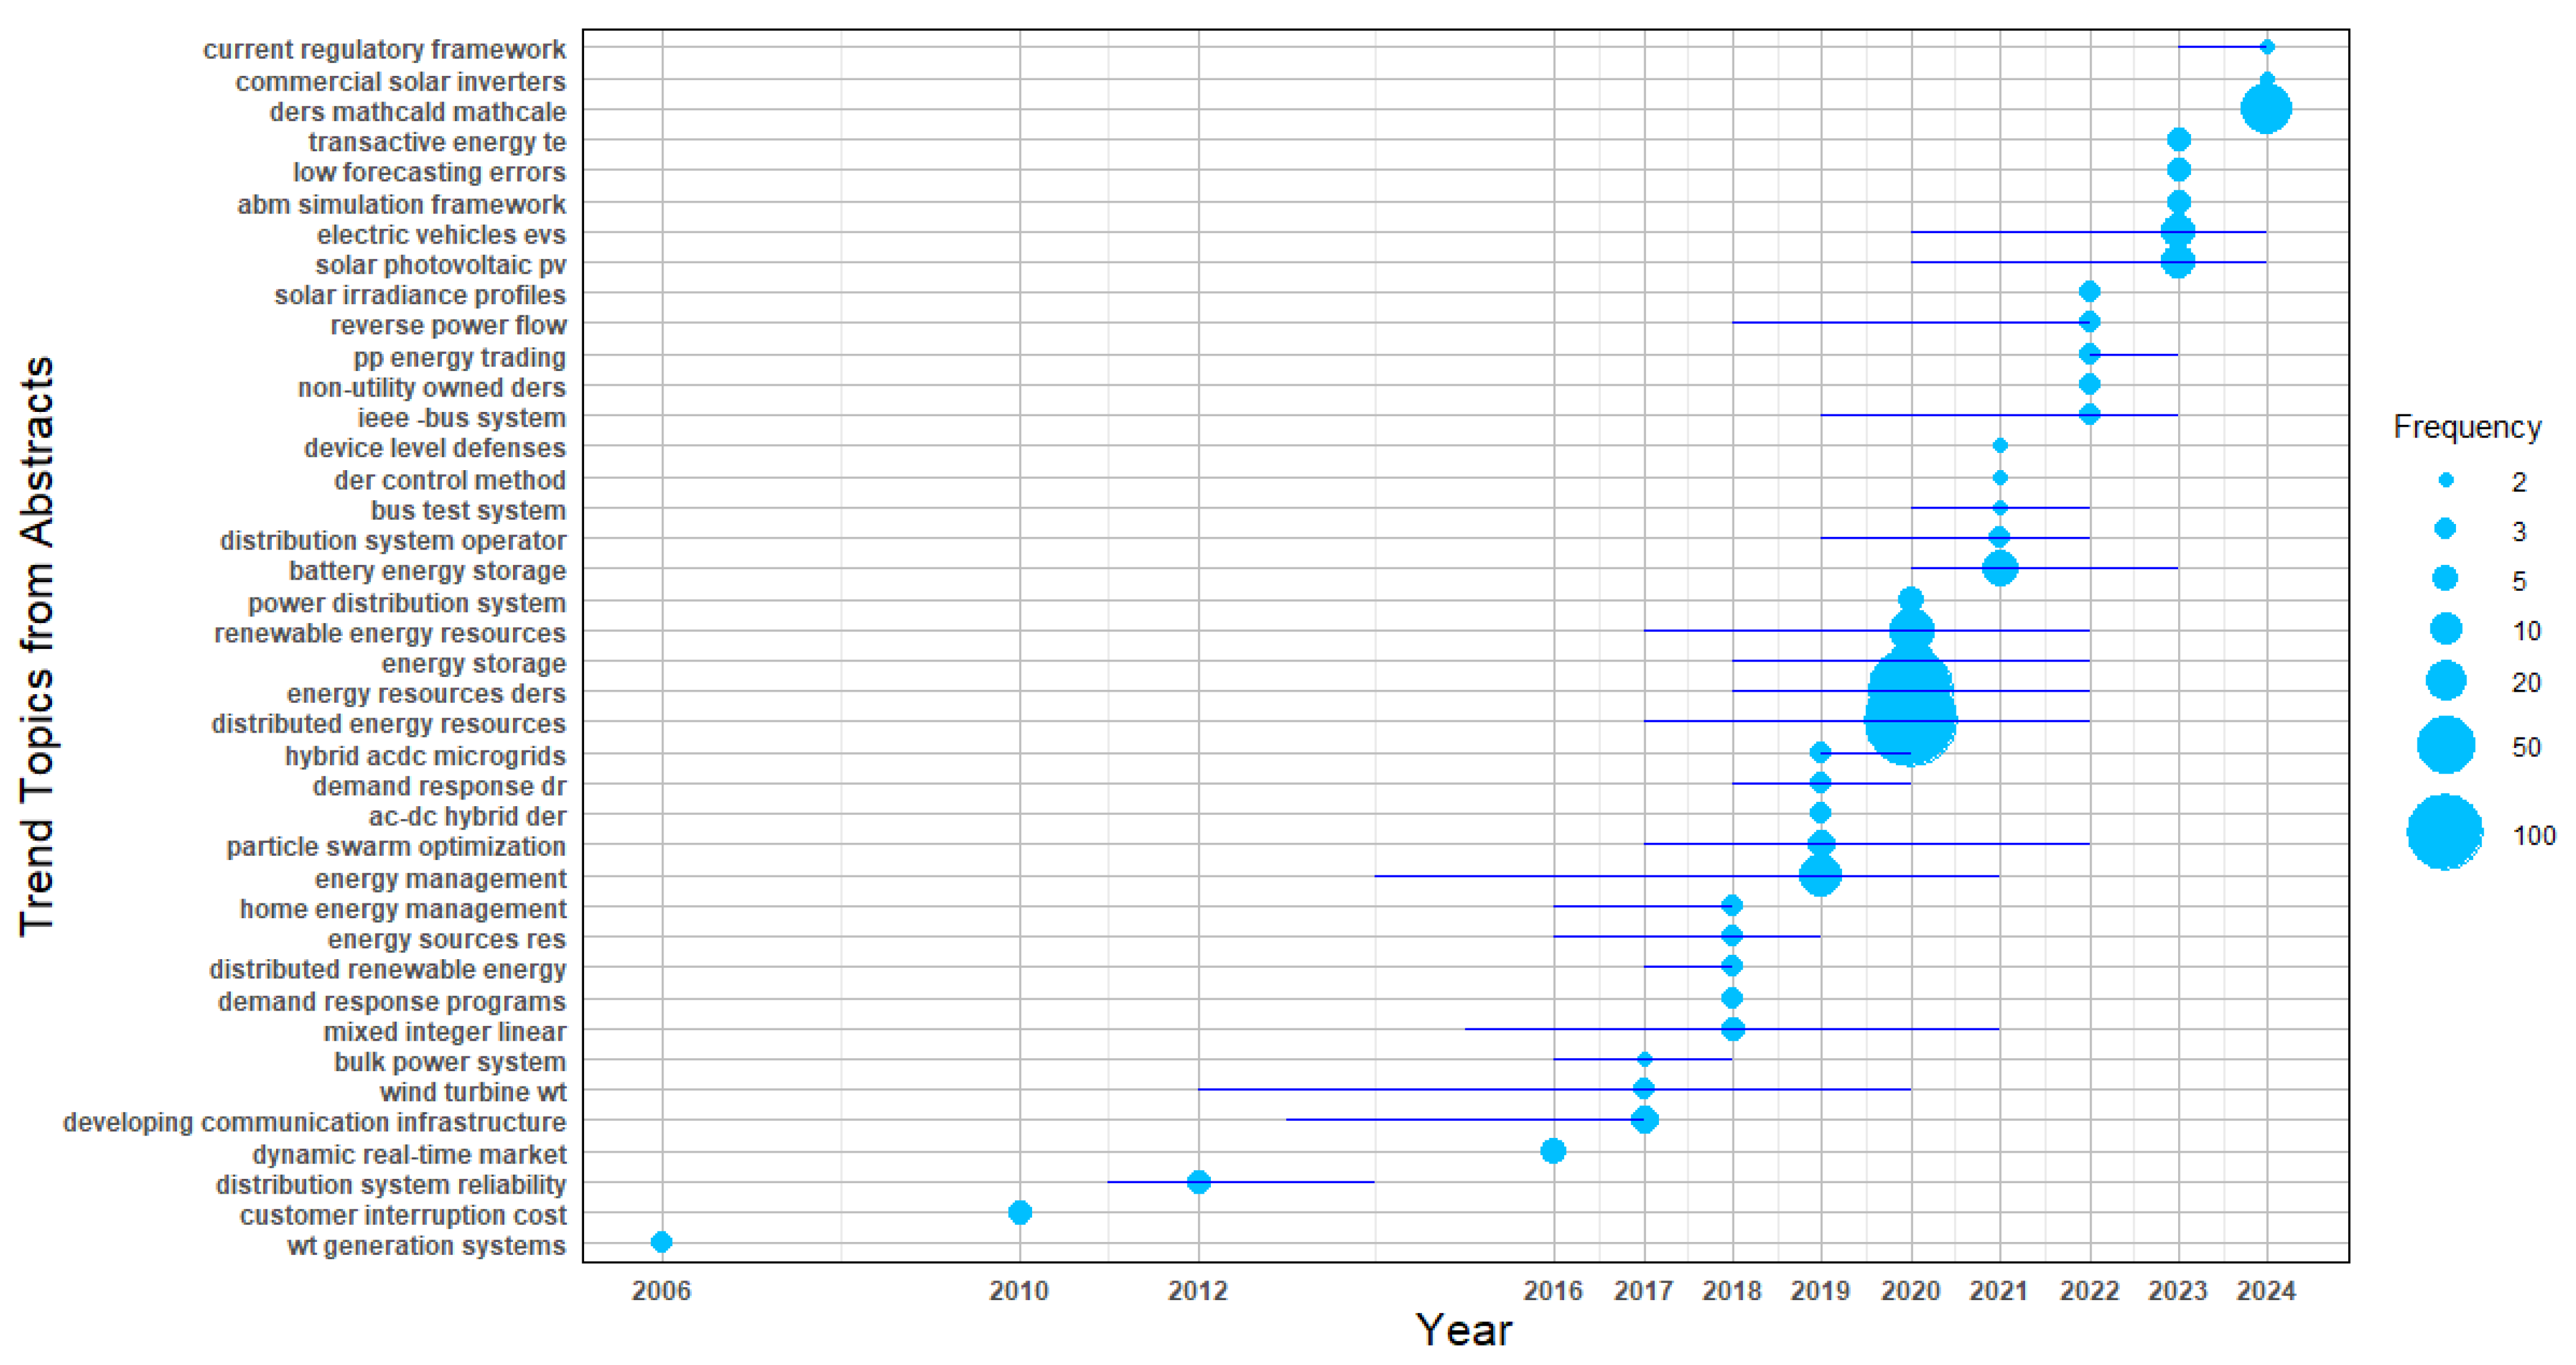
The results corresponding to substage 3.1.4.3.2 are shown in
Figure 10, which presents the most statistically relevant terms extracted from abstracts, corresponding to research topics developed as solution proposals and disseminated annually between 2004 and 2024. This analysis allows a direct comparison with the previous substage 3.1.4.3.1, making it possible to identify which emerging topics have been addressed and which remain unexplored. The unit of analysis is the Abstract, offering a direct view of how the scientific community has responded to the challenges previously identified through Keywords Plus.
This comparative approach is essential for detecting gaps in the literature and supports the subsequent stages of the proposed methodology, focused on mapping conceptual structures and identifying potential areas for future research.
In Stage 3.2—Matrix Creation and Normalization, the software Bibliometrix (Biblioshiny app) performs the internal generation of a document-by-attribute matrix that defines the relationships necessary to build bibliometric networks. This matrix structure allows for the creation of analytical models used in subsequent stages to explore conceptual, intellectual, and social structures. Each document is associated with its corresponding attributes—such as authors, affiliations, citations, and terms—which are then processed using normalization algorithms that reduce distortions caused by inconsistent naming, duplication, or linguistic variation. Stage 3.2.1– Network Matrix Creation. This normalization step ensures statistical consistency across the dataset and is essential for executing reliable network extraction techniques, which form the foundation for the structural analysis. By maintaining data integrity and ensuring uniformity in attribute associations, this stage supports the construction of high-quality conceptual maps and cluster analyses that reflect the actual scientific dynamics within the unified database, aligned with the research topic defined by Equation (1).
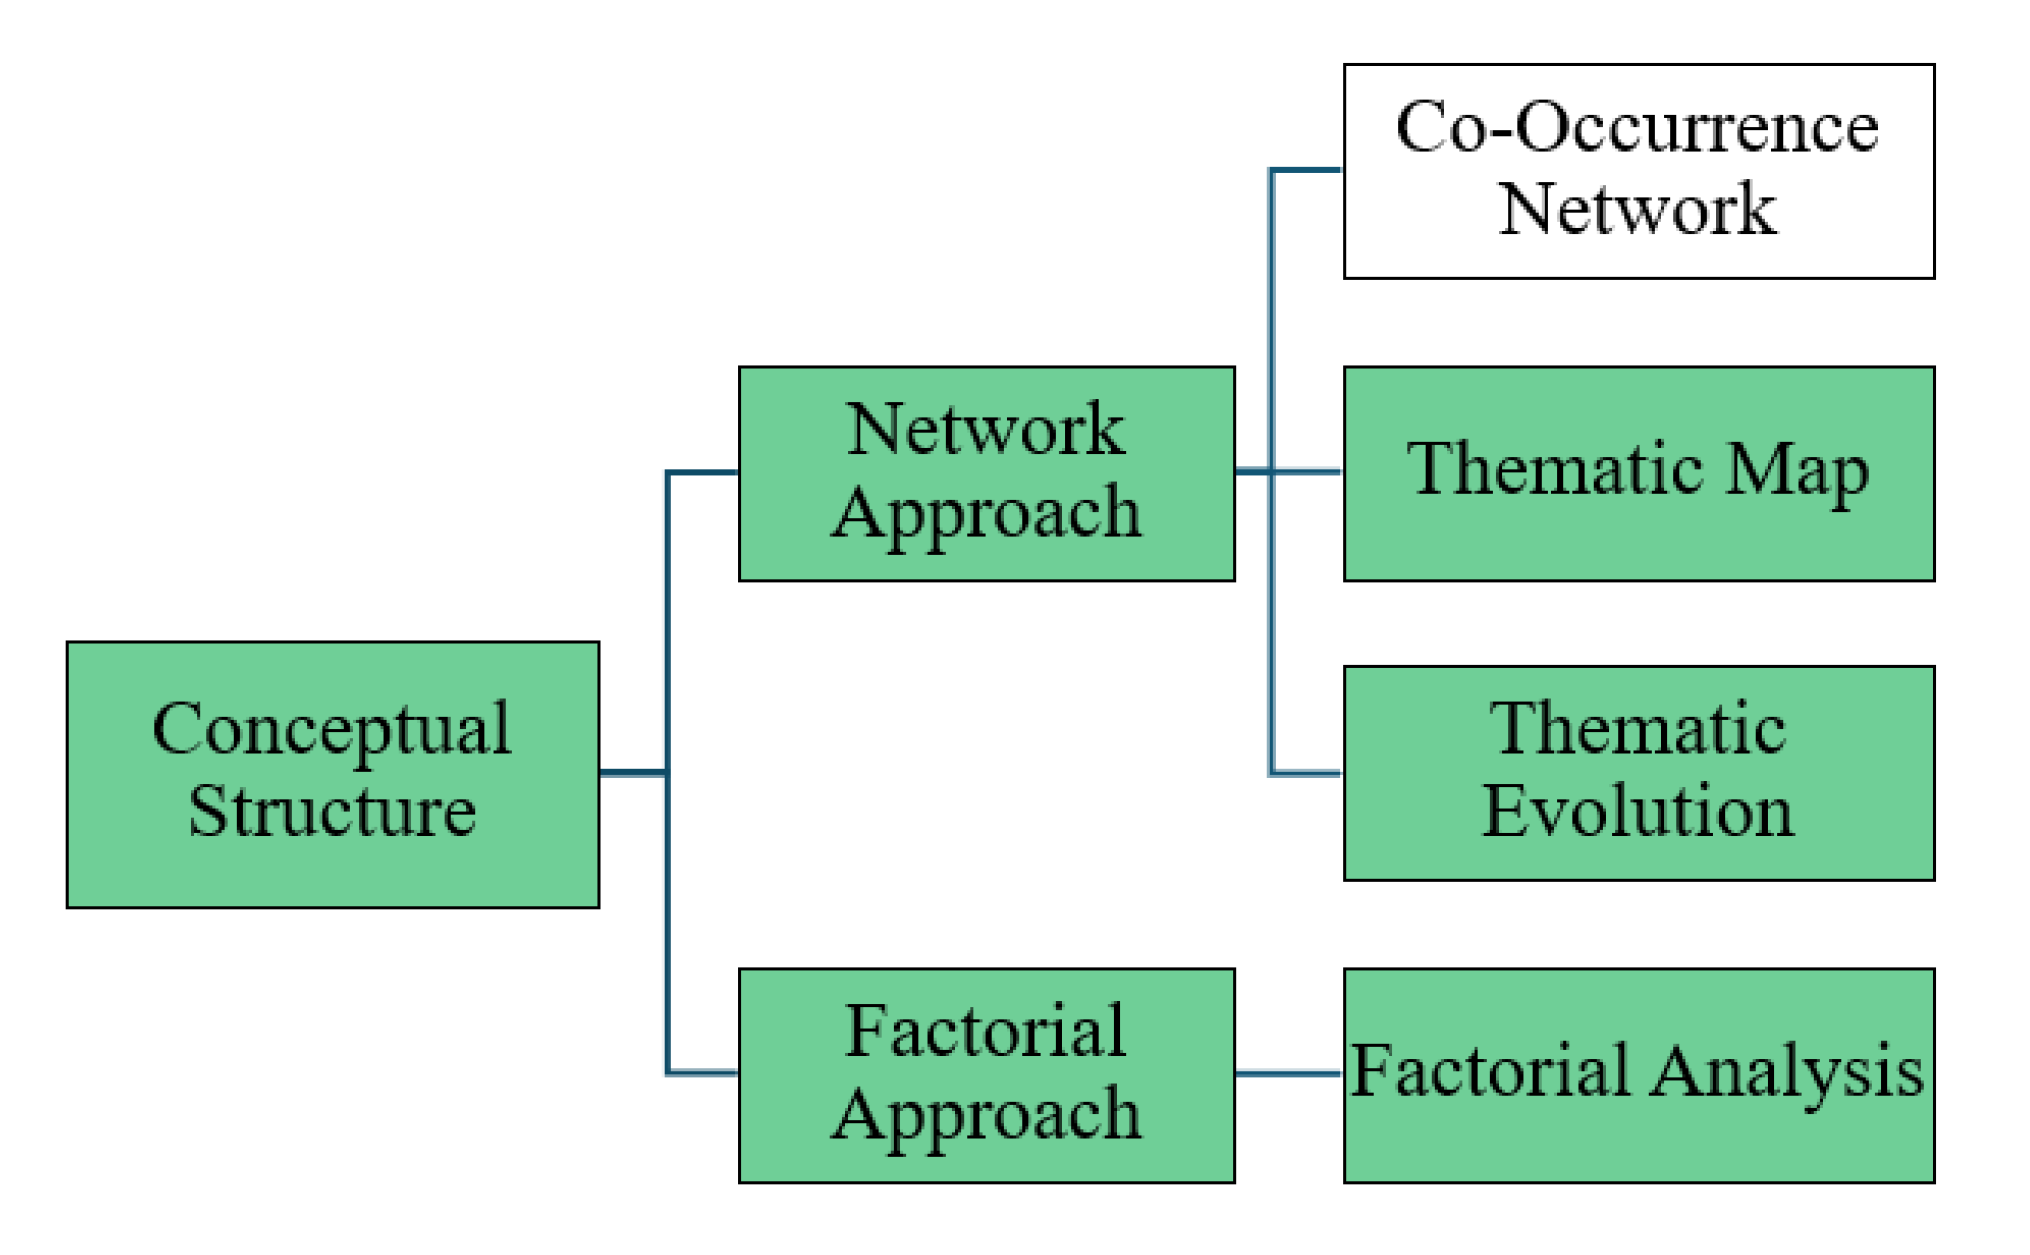
In Stage 3.2.1.1—Conceptual Structure, the goal is to identify the most recent and innovative research developments related to the topic defined by Equation (1). This substage is essential to the proposed methodology because it enables a direct comparison between the trending topics identified through descriptive analysis (via Keywords Plus in Trend Topics) and the deeper thematic relationships emerging from network extraction techniques. Using the tools available in Biblioshiny, the conceptual structure is built from the document-by-attribute matrix created and normalized in Stage 3.2. These analyses are performed within the “Conceptual Structure” tab of the software and accessed through the “Network Approach” functions, specifically through the “Thematic Evolution”, “Thematic Map”, and “Factorial Analysis” input options, as shown in
Figure 11. This stage contributes to identifying conceptual clusters and thematic trends over time, allowing researchers to detect which emerging topics are supported by cumulative scientific contributions and which remain underexplored. The ability to visualize how topics converge or diverge provides strategic insight for defining potential research directions and reinforces the methodological value of integrating both descriptive and structural perspectives.
3.3.3. Thematic Evolution
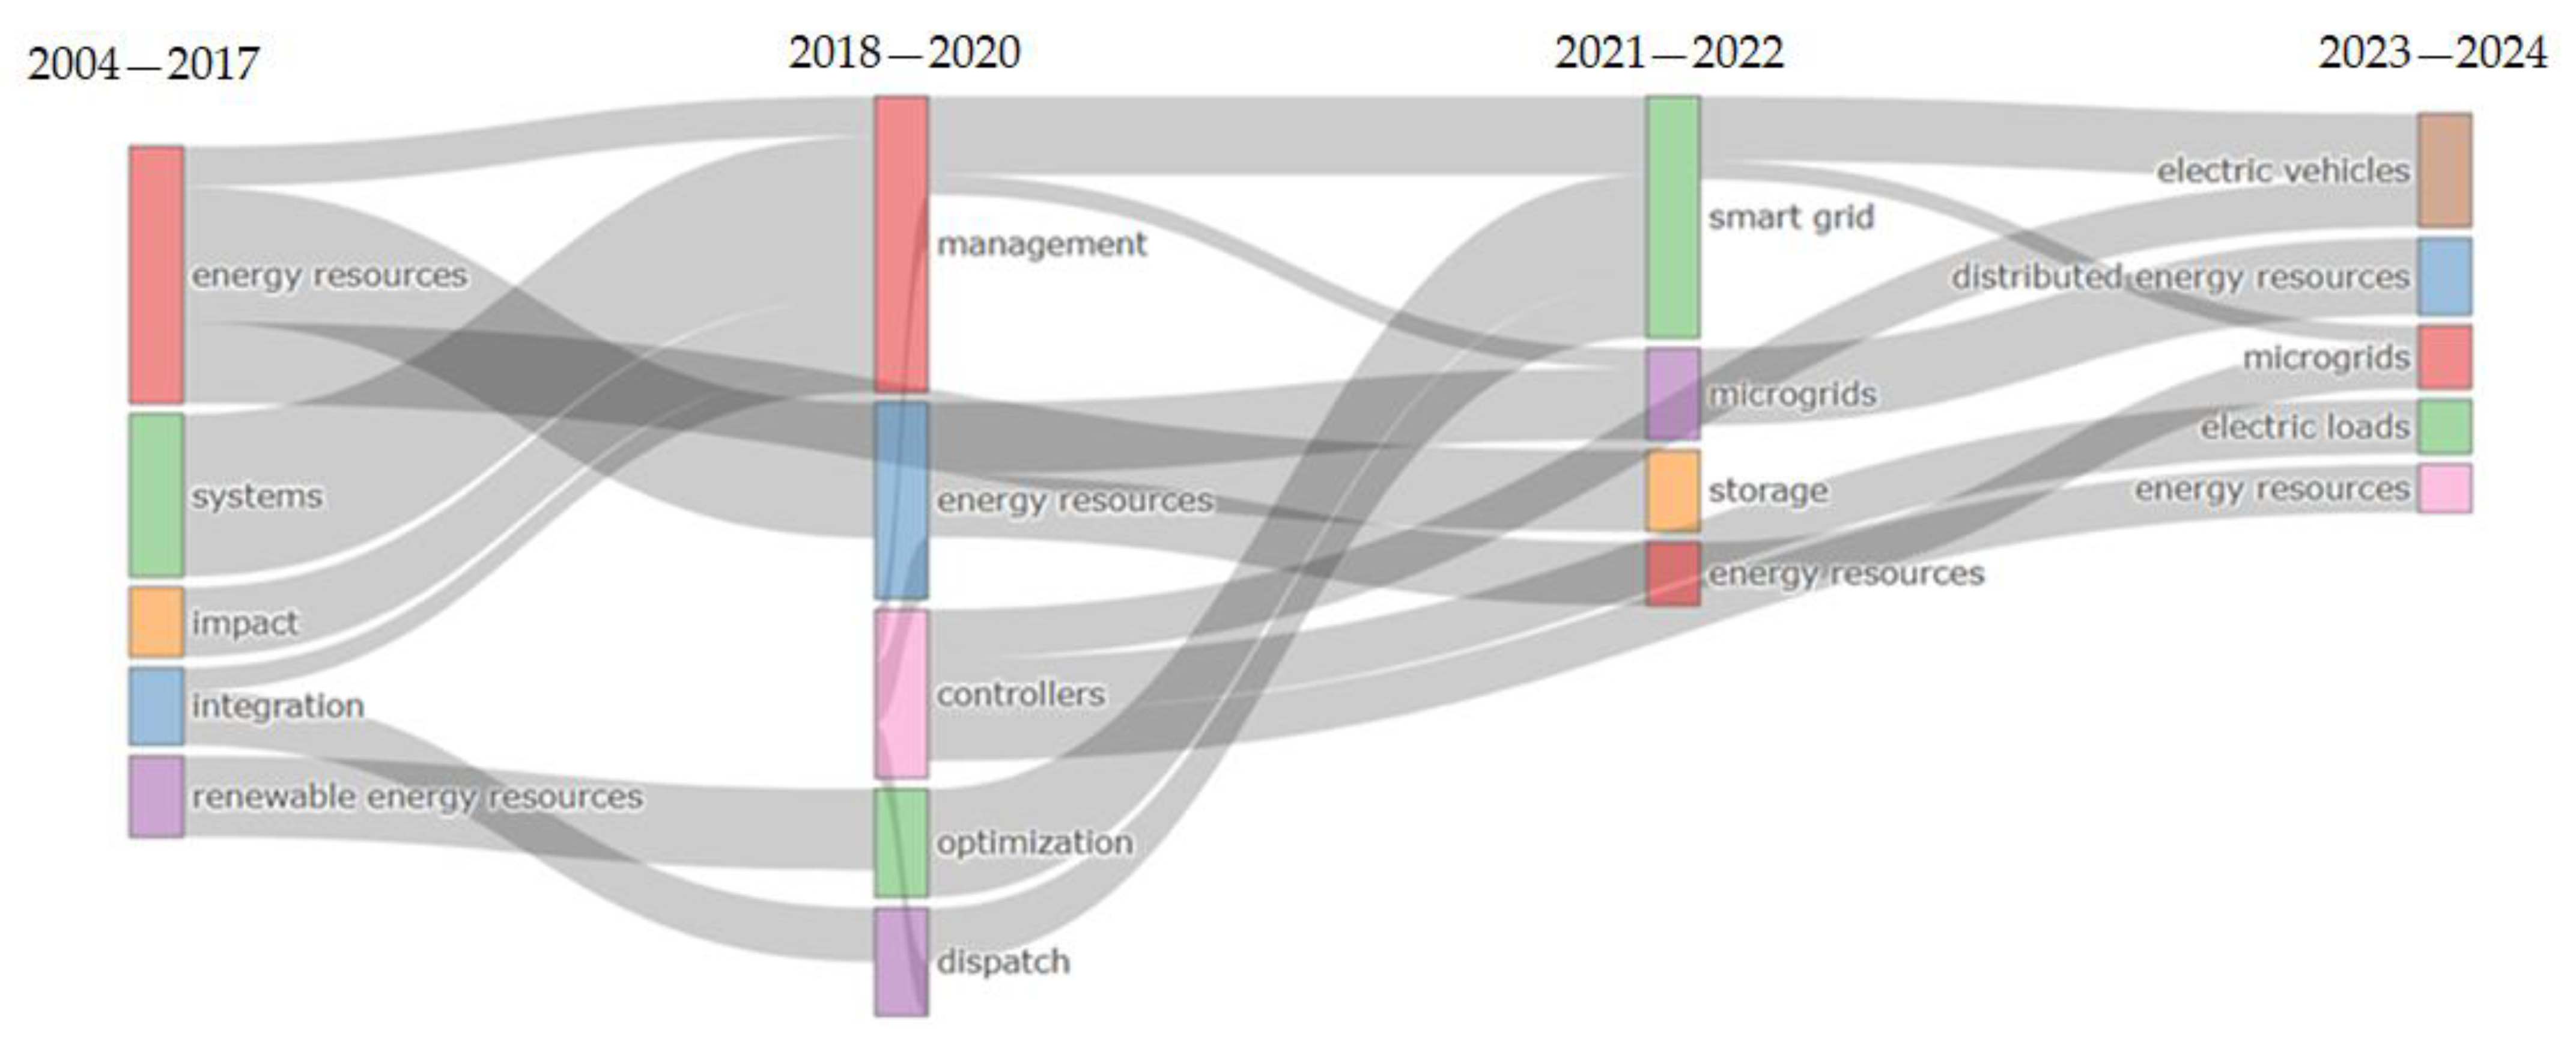
In Stage 3.2.1.1.1—Thematic Evolution, data mining and cluster analysis techniques are applied to observe how key research topics (based on Keywords Plus) evolve in terms of relevance and connectivity across multiple time periods. This substage is particularly important in the proposed methodology because it enables comparison between the outcomes of descriptive trend analysis (Stage 3.1.4.3.1) and those derived from structural network analysis. The Thematic Evolution function is located under the Network Approach menu within the Conceptual Structure stage of Biblioshiny, as shown in
Figure 11.
This analysis allows the classification of themes into four strategic types—Emerging, Niche, Motor, and Basic—based on their level of development (density) and centrality. The software automatically segments the analysis period (2004–2024) into customizable time slices and applies clustering algorithms (Walktrap) to organize thematically coherent keyword clusters. The configuration used in this methodology prioritizes maximum coverage and granularity, adjusting frequency thresholds and algorithmic parameters to reveal underexplored or emerging topics within the research domain defined by Equation (1). The evolution of these clusters over time is visualized in
Figure 12.
3.3.4. Thematic Map
In Stage 3.2.1.1.2—Thematic Map, as in Thematic Evolution, the proposed methodology applies data mining and network clustering techniques to examine how research topics defined by Equation (1) have been positioned within the scientific discourse between 2004 and 2024. This substage allows for the visualization of thematic clusters derived from the unified database using the indicators of centrality (betweenness, closeness, PageRank) and density. Its methodological relevance lies in two distinct contributions: first, generating a second refined list of potential topics for future work (stage II); and second, classifying documents by types of impacts according to their statistical association with the dominant themes in each cluster. In this case, the unit of analysis is the Abstract, and the processing is performed using the “Thematic Map” tab within the “Network Approach” section of Biblioshiny, as shown in
Figure 13.
For the proposed methodology, the configuration applied in Biblioshiny prioritizes thematic specificity and interpretability. The analysis is conducted using Abstracts as the field, configured with Trigrams to capture researcher-declared actions related to Equation (1). Text preprocessing includes the use of curated stop-word and synonym lists, and the parameters are set to ensure analytical granularity (number of words = 794; minimum cluster frequency = 1 per thousand documents; number of labels = 3). The clustering algorithm WalkTrap is used to group terms into meaningful clusters. The output consists of three datasets extracted from Biblioshiny: 133 terms, 23 clusters, and 148 documents, respectively. By comparing the trigrams extracted in this substage (Thematic Map) with the Keywords Plus obtained in Trend Topics, the methodology identifies the subset of trending topics that remain unaddressed in the abstracts. These are consolidated in a second list of potential topics for future work (Stage II).
In the second part of this substage, the methodology focuses on classifying documents from the unified database based on their statistical contribution to the thematic clusters generated in Thematic Map. The classification is performed by evaluating the normalized frequency score assigned to each document within a given cluster (freq > 0), indicating its relevance to a specific impact area. The resulting grouping reflects the structural relationship between the documents and the main research topics extracted via the WalkTrap clustering algorithm. This classification enables the identification of 148 documents distributed across 23 thematically coherent clusters, providing a structured overview of the most relevant scientific contributions addressing the technical impacts of DER and microgrid integration, as defined by Equation (1).
In Stage 3.2.1.1.3—Factorial Analysis, a statistical technique is applied to identify the most significant contributions within the unified database by simplifying complex relationships into two main dimensions (dim1 and dim2). This substage uses Multiple Correspondence Analysis (MCA), implemented through the Factorial Analysis module of Bibliometrix/Biblioshiny, to classify documents based on their association with the main thematic clusters derived from the structural analysis.
Substage 3.2.2—Data Reduction. As part of the proposed methodology, dimensionality reduction was applied to enhance the interpretability of the conceptual structures extracted from the dataset. This process was conducted using cluster analysis techniques and implemented in Substage 3.2.2.2 through the Multiple Correspondence Analysis (MCA) method integrated within the factorial analysis tools of Bibliometrix. By selecting “Abstract” as the unit of analysis, MCA enabled the identification of the most statistically significant scores (i.e., eigenvalues) and the corresponding inertias associated with authors and scientific documents. These indicators were used to reinforce the robustness of thematic groupings and to validate the latent dimensions that structure the field under study.
The procedure allows for the identification of the most relevant scientific contributions on the topic of the evaluation of technical impacts in electrical distribution systems with DERs and microgrid integration, as defined by Equation (1). As shown in
Table 2, documents are ranked in two ways:
(1) First, by their statistical contribution to the factorial dimensions (contrib > 0)
(2) Second, by their citation strength (most cited ≥ 30).
Table 2.
Top 18 statistically most relevant documents using factorial analysis.
Table 2.
Top 18 statistically most relevant documents using factorial analysis.
| Year | dim1 | dim2 | contrib | TC | Cluster | r(dim1, dim2) | Type of Doc | Reference |
|---|
| 2023 | 3.35 | 3.35 | 0.23 | 3 | 4 | 100% | Conference paper | [13] |
| 2023 | 3.28 | 3.28 | 0.19 | 0 | 4 | 98% | Conference paper | [14] |
| 2023 | 0.67 | 0.67 | 0.16 | 2 | 2 | 20% | Conference paper | [15] |
| 2022 | 0.67 | 0.67 | 0.13 | 0 | 2 | 20% | Conference paper | [16] |
| 2021 | −0.08 | −0.03 | 0.09 | 0 | 1 | 2% | Conference paper | [17] |
| 2017 | −0.06 | −0.06 | 0.00 | 284 | 1 | 2% | Article | [18] |
| 2014 | −0.08 | −0.08 | 0.00 | 216 | 1 | 2% | Article | [19] |
| 2017 | 0.00 | 0.00 | 0.00 | 192 | 1 | 0% | Article | [20] |
| 2018 | −0.05 | −0.05 | 0.00 | 142 | 1 | 1% | Article | [21] |
| 2016 | −0.06 | −0.06 | 0.00 | 131 | 1 | 2% | Article | [22] |
| 2017 | −0.06 | −0.06 | 0.00 | 130 | 1 | 2% | Article | [23] |
| 2014 | −0.05 | −0.05 | 0.00 | 121 | 1 | 1% | Article | [24] |
| 2015 | −0.05 | −0.05 | 0.00 | 115 | 1 | 1% | Article | [25] |
| 2019 | −0.06 | −0.06 | 0.00 | 106 | 1 | 2% | Article | [26] |
| 2017 | −0.05 | −0.05 | 0.00 | 103 | 1 | 1% | Article | [27] |
| 2021 | −0.05 | −0.05 | 0.00 | 101 | 1 | 1% | Review | [28] |
| 2010 | −0.06 | −0.06 | 0.00 | 99 | 1 | 2% | Article | [29] |
| 2015 | −0.06 | −0.06 | 0.00 | 89 | 1 | 2% | Article | [30] |
The same
Table 2 reports the year and the coordinates of the components in the plane of the dimensions indicated in the table as “dim1” and “dim2” normalizing on the largest distance r(dim1, dim2) from the origin, so that the reference [
13] presents the greatest contribution to the dimensions of factorial analysis (cluster 4) and so on, the same interpretation for the other documents. This allows to be more objective and reduces resources when dealing with huge databases. Additionally,
Table 3 presents a filtered selection of documents from the unified database that focus specifically on the evaluation of technical impacts resulting from DER integration into electrical distribution systems. This filtering process, grounded in the proposed methodological framework, demonstrates the ability of the approach to isolate thematically targeted contributions from a broader set of scientific production. It reinforces the analytical precision of the methodology and illustrates its practical applicability in engineering contexts where topic sensitivity and specificity are required.
3.4. Stage 4—Data Visualization
This section concludes the implementation of the proposed bibliometric methodology by integrating and interpreting the results obtained in Stage 3 through a strategic set of visual tools. This stage does not introduce new analysis techniques but instead consolidates the insights derived from descriptive and structural bibliometric analysis, presenting them through interpretative visualizations that support decision-making and future research planning. Among the representations used are two-dimensional thematic maps, network diagrams, and institutional collaboration structures, each contributing to a comprehensive understanding of how research on Equation (1) has evolved between 2004 and 2024. The elements selected for visualization were generated directly through Bibliometrix/Biblioshiny, including the outputs from Trend Topics, Thematic Evolution, and Factorial Analysis. Additionally, the classification of documents and their thematic contributions, serves as a synthesis layer that links the analytical process to the doctoral research proposal. These visual outputs not only reinforce the structural consistency of the methodology but also provide the interpretative foundation for the next stage: Stage 5—Data Interpretation and Discussion.
The data visualization in this article was developed using temporal analysis techniques that allow the detection of trends, patterns, and thematic transitions over time in the intellectual, conceptual, and social dimensions of the research topic defined by Equation (1). In particular, the results from the Thematic Evolution tool in Biblioshiny reveal how the most relevant topics identified via Keywords Plus have evolved between 2004 and 2024. As shown in
Figure 12, these visualizations enable the researcher to distinguish between emerging, consolidating, or declining themes, highlighting their level of maturity and connectivity within the field.
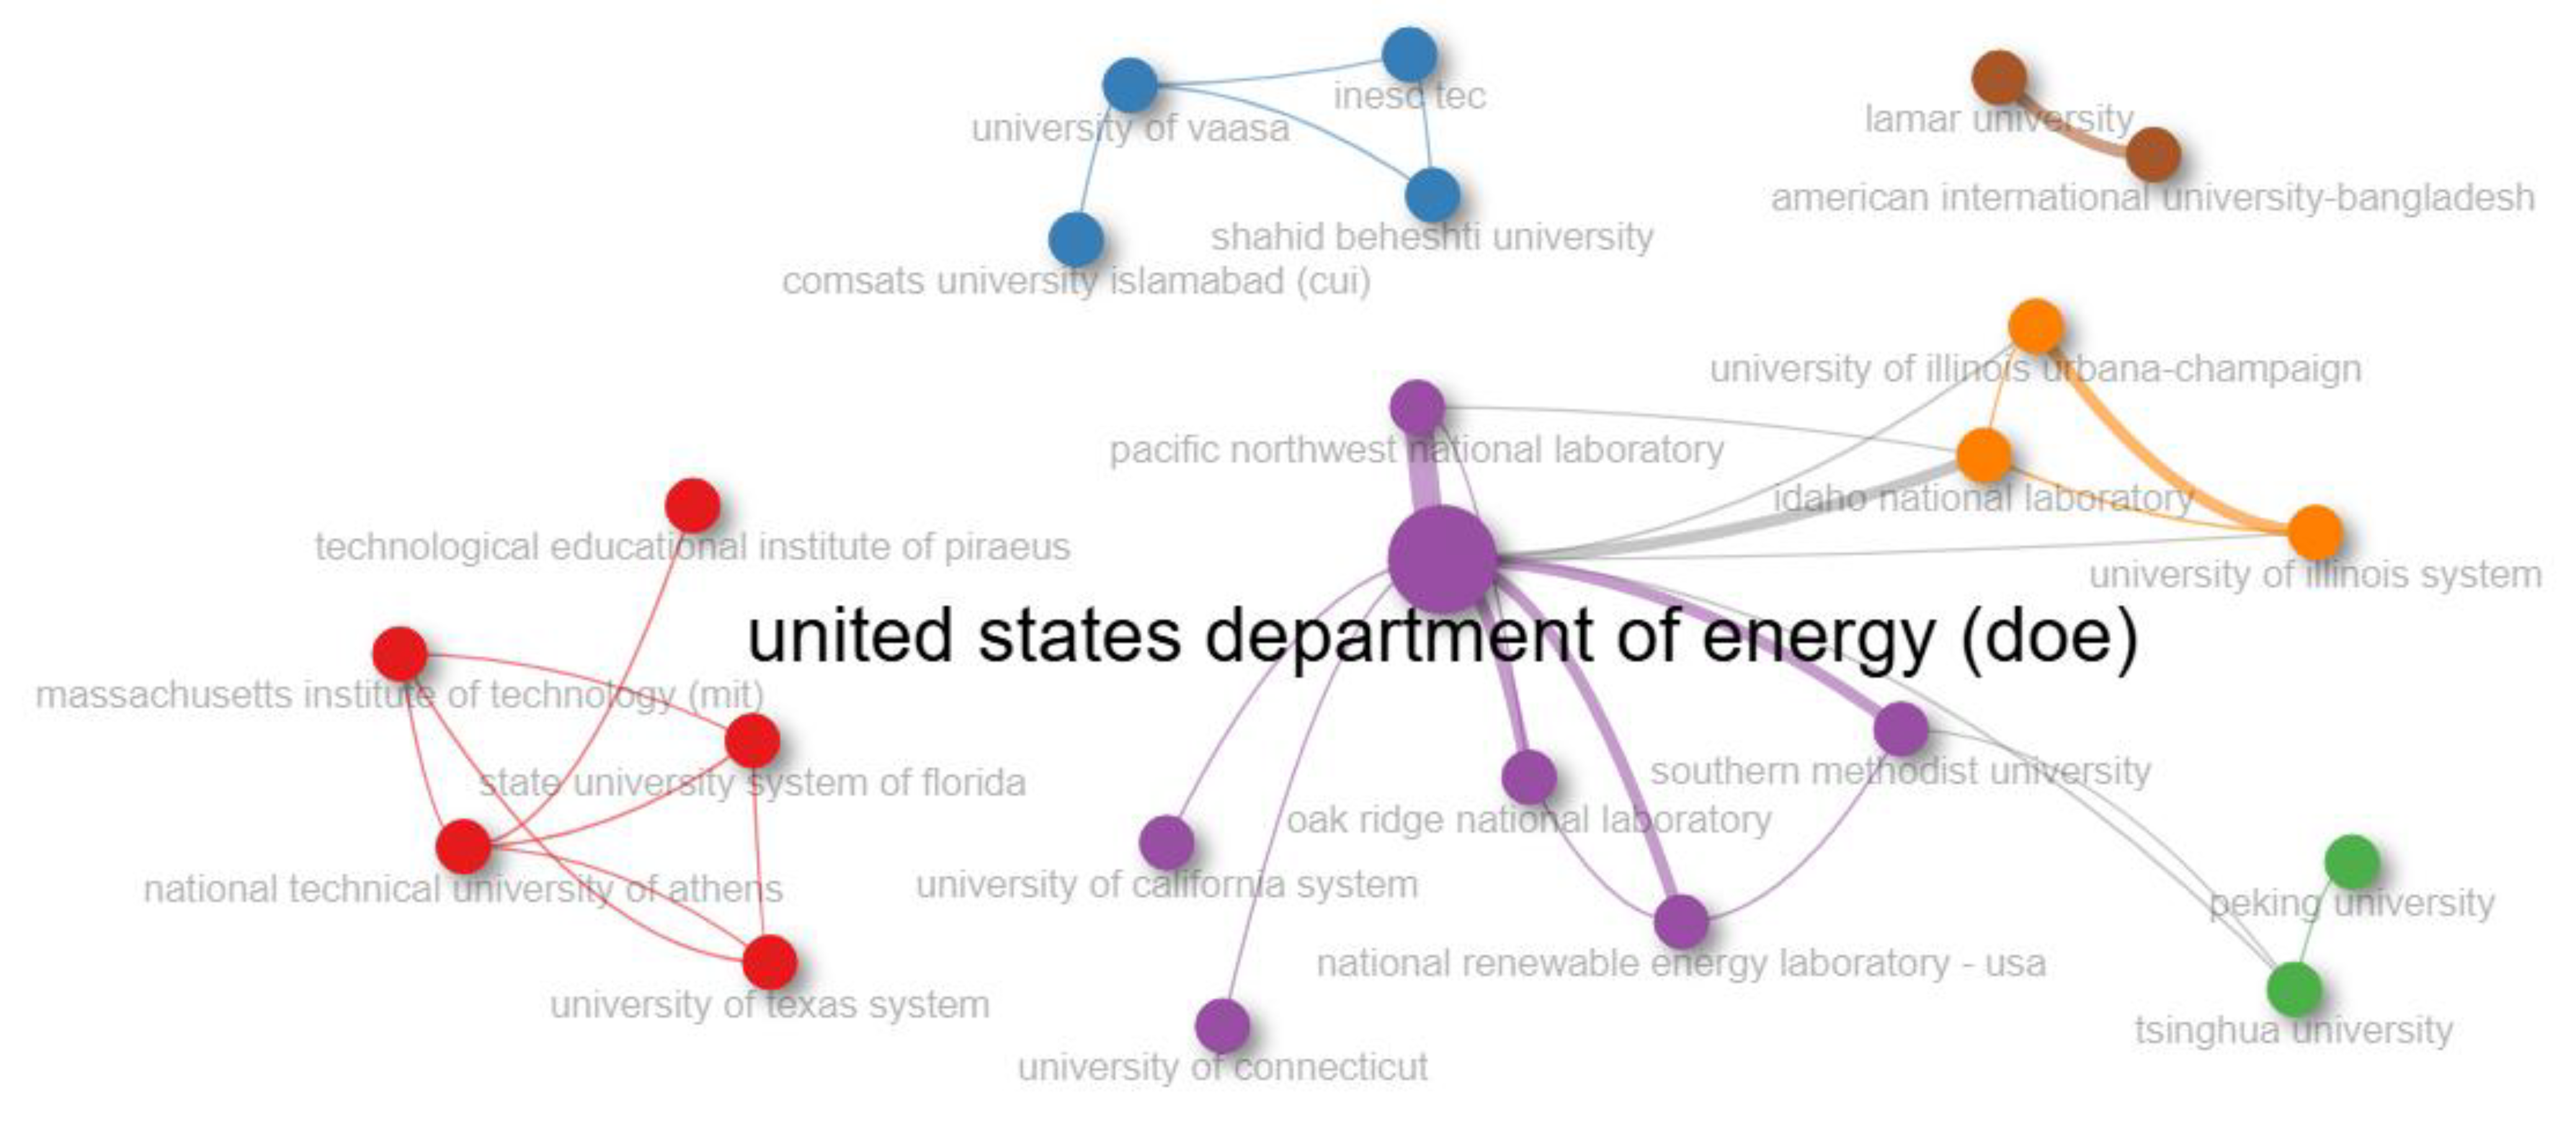
In addition to the thematic patterns, another key visualization in Stage 4 is the institutional collaboration network depicted in the application, which represents the relationships between institutions actively publishing on the topics defined by Equation (1), as shown in
Figure 13. By focusing on the 2023–2024 period, the visualization highlights current collaborations and reveals the structural position of institutions within the research landscape. The interpretation of this figure enables the researcher not only to identify leading contributors in the field but also to detect potential strategic partners and sponsoring institutions for future research initiatives. This level of insight reinforces the practical applicability of the proposed methodology by linking bibliometric analysis with real-world collaboration and funding dynamics.
Figure 14 focuses specifically on the 2023–2024 period, providing a high-resolution snapshot of current academic priorities. This dual representation supports the methodological objective of identifying conceptual continuity and gaps across time, which is essential for defining the strategic orientation of the doctoral proposal.
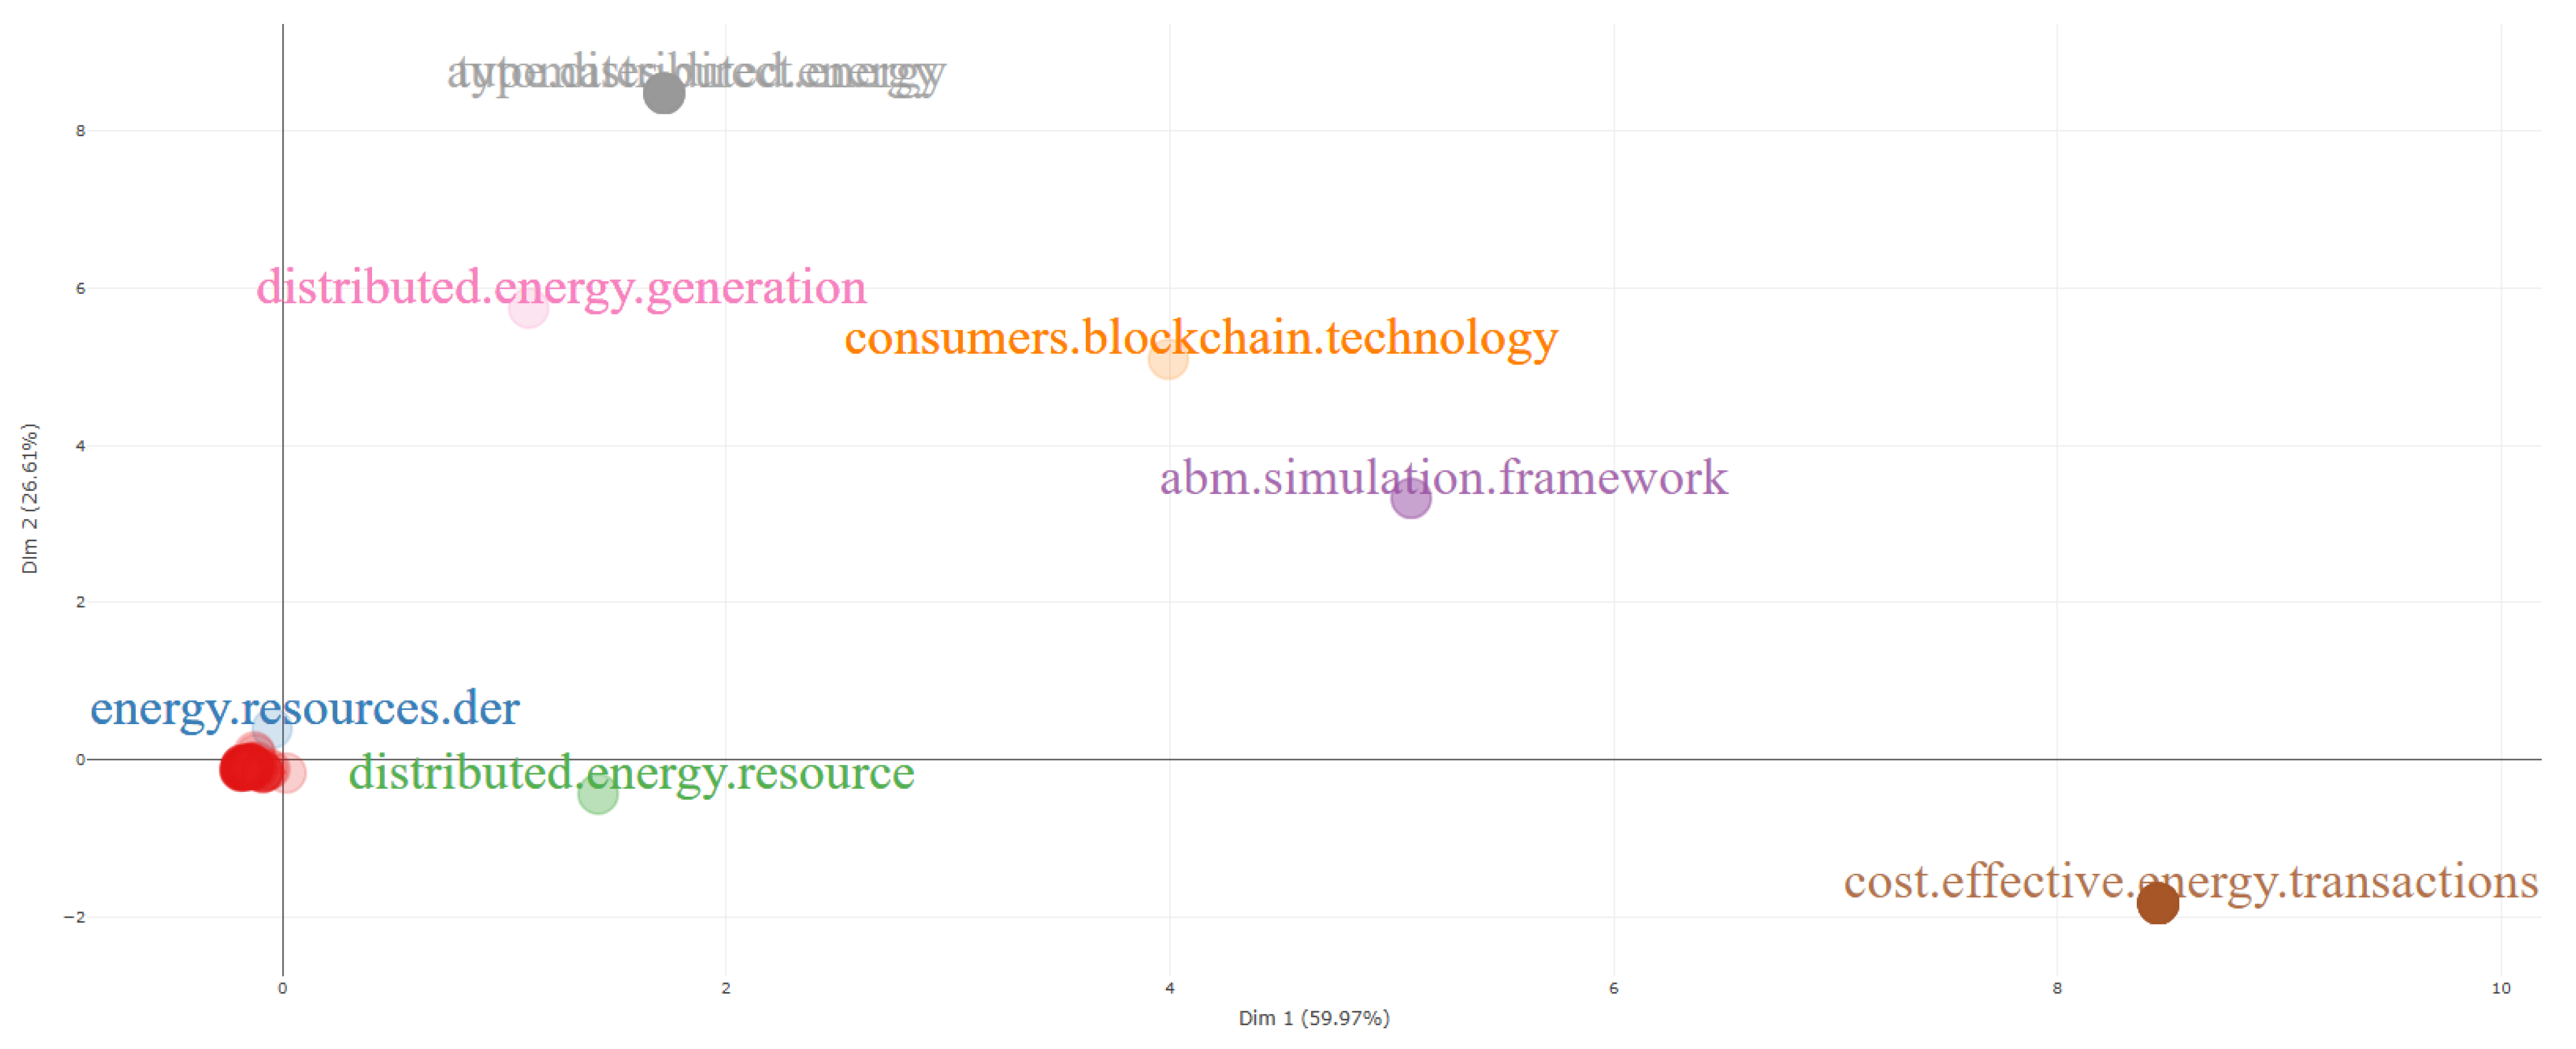
A final key visualization integrated into this stage is the factorial map derived from the Multiple Correspondence Analysis (MCA) applied to the unified database, as shown in
Figure 14. This map represents the projection of thematic categories (trigrams) across two dimensions—dim1 (59.97%) and dim2 (26.61%)—which together explain 86.58% of the total inertia in the dataset. The distribution of terms along these axes reflects the conceptual structure of the field and highlights the degree of contribution of each category to the factorial dimensions. In particular, those trigrams located farthest from the origin along the positive directions of the axes represent the most influential thematic elements related to Equation (1). This visualization provides a high-resolution analytical frame for interpreting thematic relevance and supports the prioritization of technical impact areas within the doctoral research scope.
To complement the visual interpretations generated in this stage, Tables 9 and 10 present a consolidated synthesis of the findings derived from the thematic clustering and document classification developed in Stage 3. These tables summarize which research contributions have already addressed the technical impacts defined by Equation (1), which areas remain underexplored, and what specific challenges and future directions can be identified within the scientific discourse. The structured integration of this information provides a decision-support layer for the doctoral proposal, allowing the researcher to align methodology, scope, and objectives based on verified thematic relevance. As such, Stage 4 not only visualizes the current state of the field but also bridges the analytical process with the interpretative and planning components that define Stage 5—Data Interpretation and Discussion.


