Abstract
In recent years, the trend towards the performance maximization of modern internal combustion engines has led to the creation of accurate simulation models to optimize the engine design and operating conditions. Temperature management is crucial to achieve the performance goals of an internal combustion engine without affecting the component’s reliability. Formula 1 mandates that only a limited number of experimental tests can be performed, which leads to the necessity of simulators capable of substituting empirical tests. Furthermore, the requirement of adapting the vehicle setup before each race weekend to maximize the performance on each circuit layout necessitates short computational time. To address this, the development of a zero-dimensional model of the thermal flows within an engine is presented in this paper. This model allows to precisely compute the dynamic variations of all the heat flows inside the combustion engine, excluding only the radiative ones and the engine components’ temperatures. The new simulation approach has been developed and validated on a Formula 1 engine and shown to be precise and fast. The results demonstrate the value of the proposed model with an average engine fluid temperature error of less than 1 °C for a computational cost comparable with on-board applications.
1. Introduction
In an era where expediting time to market holds paramount significance across industries, the prevalence of virtual simulations has become predominant. Under such circumstances, the majority of physical tests have already given way to precise virtual models, categorized into three main tiers ranging from the intricate and accurate three-dimensional (3D) models to the simpler yet swift one-dimensional (1D) and zero-dimensional models. The latter, being experiment-based models, find utility in real-time simulations and model predictive control (MPC) owing to their adeptness at swiftly simulating complex structures.
In the realm of Formula 1 (F1), the utilization of virtual simulators is further heightened. This is attributed to stringent regulations restricting hardware test hours and the imperative to readjust the car setup each race weekend to optimize vehicle performance in alignment with the specific track layout.
Addressing the reliability and performance optimization of an F1 car, the cooling system emerges as a pivotal aspect. The system is tasked with ensuring the proper cooling of the power unit, electronics, and all thermal-sensitive components [1] while avoiding oversizing that could adversely impact car performance in terms of both dynamics and aerodynamics. To tailor the cooling system layout to track characteristics and ensure optimal performance, the development of a 0D model to compute heat rejected by the internal combustion engine of an F1 power unit to the engine oil and coolant is imperative. The 0D model facilitates simulation under various racing conditions and enables real-time strategy adaptation based on component temperatures.
The decision to develop a more intricate model, building upon the simplified version by Onder and Guzzella [2], highlights the need for precision in F1 applications. The enhanced model addresses limitations by incorporating considerations for heat fluxes from exhaust gases to the engine coolant and the heat transferred to the oil through the engine piston, ensuring a more comprehensive representation of the internal combustion engine’s behavior in high-performance scenarios.
Traditional engine design and optimization processes mainly address a single research topic: the estimation of the in-cylinder heat release rate [3], the increase of thermal efficiency by means of renewable fuels [4], or a specific waste heat recovery system [5]. The model proposed in this study represents a significant advancement in this respect, mainly because of its comprehensive representation of the internal combustion engine across the entire operating cycle. By considering the engine as a thermodynamic system with discrete zones, each with unique heat transfer characteristics and boundary conditions, this approach allows a detailed examination of heat transfer mechanisms and their interactions with engine operating parameters such as engine load, speed, fluid temperatures, and spark advance.
Opting against integrating a 1D model, as discussed in [6], and the associated spray modeling is motivated by the desire to minimize the computational effort. While the combustion model in [6] focuses on estimating heat released inside the cylinder, the approach in this paper aims to provide a broader understanding by considering all heat fluxes within the engine.
Choosing a single-zone model over a two-zone model reduces the number of equations without compromising precision. This preference for the single-zone approach is contrary to the approach presented in [7] but is computationally lighter.
The accuracy and reliability of the model in predicting engine performance under varying operating conditions and in capturing the complex thermal dynamics are demonstrated against experimental results and a state-of-the-art 1D model.
The versatility of the model makes it applicable to any direct-injection internal combustion engine. With access to pertinent data such as component materials, engine geometry, fuel properties, and fluid characteristics, the model parameters can be tailored to suit specific engine configurations and to foresee the engine behavior in case the original working conditions or the original design are modified, avoiding massive tests of the hardware itself. The applicability of the model to internal combustion engines equipped with exhaust gas recirculation (EGR) systems is possible, but additional modeling would be required to account for such configuration.
Furthermore, the proposed approach can be applied to stock engines in which no cylinder pressure measurement is available. In fact, the only combustion index used as an input to the model is the center of combustion (MFB50), which can also be estimated with sufficient accuracy from the analysis of crankshaft speed fluctuations [8].
2. Materials and Methods
In this section, the heat transfer problem for an F1 engine is methodically formulated and resolved through analytical means. The primary objective of this study is to compute the heat transferred to both the engine oil and the engine coolant, with a particular emphasis on assessing the time-averaged power exchanged during a racing lap as a pivotal metric in sizing the cooling system.
In order to uphold heightened precision in the model estimations, only radiative fluxes are excluded, given their significantly lesser contribution compared to conductive and convective ones in the total power heat released by an internal combustion engine [9]. Consequently, the heat exchanges between a fluid and a solid component are depicted as purely convective fluxes, while losses within the solid parts are modeled as purely conductive ones. Figure 1 shows the envisaged heat exchanges, with arrows denoting convective fluxes, while conductive losses remain internal to the respective blocks.
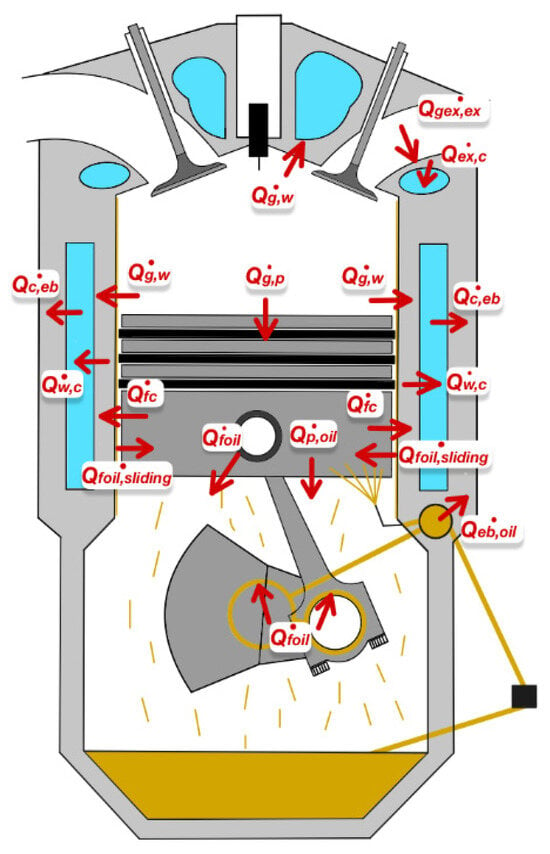
Figure 1.
Engine heat fluxes (red arrows represent the convective fluxes and the heat transfers due to friction forces considered in the model development).
The developed model adopts a single-zone approach [10,11], where no temperature gradient is applied to the cylinder walls. This approach is favored over a dual-zone mode [10] due to its ability to maintain a high precision level with reduced complexity. The assumption of the absence of a temperature gradient along the piston width is supported by the narrow width of the cylinder walls.
While a substantial temperature gradient exists along the cylinder axis [12], the simplicity of the single-zone approach is preserved by assuming that in-cylinder gases simultaneously exchange heat with the entire surface of the cylinder walls. The crudity of this assumption is smoothed assuming this occurs while the gases’ temperature equals the mean temperature value over multiple engine strokes.
In contrast to the model developed in [13], no experimental data were available for the heat flux between the cylinder gases and the cylinder walls. Consequently, a decision was made to compute it directly within the model, starting from input data derivable from car telemetry or other existing models. As mentioned above, the heat exchanged between moving gas and a solid is convective [10]; therefore, the heat flow between the in-cylinder gases and the cylinder walls can be computed, at a generic time t, as reported in Equation (1):
where is the heat transfer coefficient between the gases and the cylinder walls, the cylinder walls area, and are the gases and walls temperature, respectively. The cylinder gas temperature is determined by multiplying the maximum temperature reached inside the cylinder by a correction factor. The maximum gas temperature is computed considering the gases as ideal:
Here, denotes the maximum pressure inside the cylinder during an engine cycle at time , and is the cylinder volume corresponding to the pressure peak. The pressure peak aligns with the motored pressure under cut-off conditions or misfire (absence of regular combustion), while in running conditions, it is the motored pressure plus the combustion pressure [14]. For an F1 engine, the total mass trapped in the cylinder () comprises fresh air, fuel, and residual gases from the previous cycle. Unlike a series engine, the absence of an exhaust gas recirculation (EGR) system in an F1 engine allows excluding this contribution.
The trapped mass is computed using lookup tables in this methodology that could be experimentally derived while running the engine in static working conditions at the test bench. However, since F1 regulations limit the test bench hours, the maps are obtained from a validated 1D model simulating the engine at different engine loads, rotational speeds, spark advance angles, and lambda values.
The nonlinear relationship between the air mass trapped and input variables necessitates two maps: a base map in function of the engine load and the engine rotational speed, and a correction factor map in function of lambda.
As stated earlier, the fuel mass is added to the masses of fresh air and residuals to compute the total trapped mass. The fuel mass is estimated as follows:
Here, denotes the maximum instantaneous mass flow rate (expressed in kg/h), constrained by regulations through the specified equations:
As can be observed, the mass flow rate is capped at 100 kg/h above rpm, linearly decreasing at lower engine speeds. represents the actual percentage of FIA fuel mass flow rate injected into the cylinder, while is the engine rotational speed expressed in . Constants are introduced for unit conversion of the engine speed in and fuel mass per cylinder per cycle computation.
To address the dynamic behavior of the engine in cut-off conditions, where fuel injection cessation leads to a gradual slowdown and reduced air flow cycle by cycle, a transfer function has been introduced.
The pressure peak in Equation (2) is computed through two lookup tables: a base map involving the total air mass trapped, the temperature of the air in the engine after the compressor and the intercooler, engine load, and engine rotational speed; and a correction factor map dependent on the air-to-fuel ratio, the center of combustion (MFB50, crank angle at which 50% of the fuel burned is reached), and mass of residual gases.
The pressure peak base is determined from combustion heat release curves using the first law of thermodynamics [15,16], considering that the rate of increase of the combustion heat release curves at each crank angle can be obtained as [17]:
where is the pressure inside the cylinder at each crank angle, is the rate of change of pressure, is the exposed cylinder volume and is its rate of change.
Equation (6) allows the computation of the in-cylinder pressure variation during an engine cycle, with initial conditions set at the intake valve closure (IVC):
The pressure at IVC can be easily estimated: is available from the previous calculations, is the gas constant, is the temperature in the intake manifold already used in the mass-trapped computation and is the cylinder volume at intake valve closure:
In general, the swept exposed volume is computed as a combination of the combustion chamber volume and the piston’s swept distance. The first one is computed as the piston area times the stroke over the compression ratio minus one, where the compression ratio is the cylinder volume displacement over the combustion chamber volume. The second term is the piston area times the swept distance, which is identified as the distance of the piston from the top dead center (TDC):
with being the ratio of the crank radius over the connecting rod length.
The evolution of the pressure inside the cylinder is used to estimate the peak pressure at each operating condition, considering the maximum of each pressure curve in the function of the crank angle.
The correction factor map, akin to the air mass trapped map, is computed from 1D maps.
For cut-off conditions, where the pressure in the cylinder is governed solely by the motored pressure, a dedicated map is created. A delay is introduced to replicate the dynamic behavior when the engine is turned off. The motored pressure map is computed using the polytropic expression describing the thermodynamic process:
Recalling Equation (2), the determination of is still undefined. The cylinder volume at the pressure peak is computed as the volume at MFB50, increased by a calibrated gain, considering that in gasoline engines, the pressure peak often occurs shortly after MFB50 [18]. Similar to the air mass trapped and pressure peak, the temperature behavior in cut-off conditions is modeled using a transfer function.
When the engine is restarted, a scenario resembling the engine emptying dynamic unfolds. Engine filling is not instantaneous due to throttle valve limitations, and a transfer function is introduced to slow down the in-cylinder temperature increase in relation to fuel injection increase.
Gas temperature is crucial for computing the heat transferred by the gases to the cylinder walls and evaluating the heat flux from the gases to the piston through Equation (10), where is the heat transfer coefficient between the gases and the piston.
Similar to the cylinder walls, the piston’s temperature () is assumed to be homogeneous along its structure. Despite a temperature gradient of around 120–180 °C along the piston, the gradient neglect does not compromise model precision. Unlike [19], the heat exchange is modeled without considering the boundary layer effect, but this simplification does not affect model outputs.
In series aspirated engines, the exhaust gases’ enthalpy is considered a mere loss: it is used to heat the gases rather than generate propulsive power. However, in F1 power units, this energy is recovered to compress incoming air, increase the volumetric efficiency, and recharge the battery or boost the vehicle through the MGU-H (motor generator unit connected to the turbine). Therefore, estimating exhaust gases’ enthalpy is crucial in this model.
Due to the engine configuration, the gas enthalpy at the exhaust valve differs from the enthalpy at the turbine inlet. Exhaust gases exchange heat with the exhaust manifold, which, in turn, transfers heat to the engine coolant.
The heat transfer between the exhaust gases and the exhaust manifold walls is modeled as
The exhaust gases’ temperature is determined within the model using three lookup tables: a base map in function of engine speed and load, a correction factor map considering lambda and MFB50, and another correction factor map depending on . Like the trapped mass, these tables are derived from the outputs of the calibrated 1D model.
Considering the influence of filling and emptying dynamics on exhaust gas temperature, a transfer function slows down the temperature decrease in cut-off conditions, and a delay, proportional to fuel injection increase, models engine filling upon startup.
Friction losses generated by the rotating and sliding motions of the engine components contribute to heat generation. The total heat released by engine friction can be computed using the well-known Chen–Flynn friction model [20].
where is the mean piston speed expressed in rps:
Friction losses are divided between the engine coolant and engine oil. The contribution from the rotating parts is directly transferred to the lubricating oil, while the friction due to the piston sliding against the cylinder is split between the two fluids.
After computing the heat transfer from in-cylinder gases to the cylinder walls, considering the losses through the cylinder walls is essential to estimate heat rejected to the coolant. As the cylinder operates predominantly in transient conditions during a racing lap, the cylinder walls’ temperature never stabilizes, and part of the heat is continuously dissipated by the walls. Assuming a homogeneous cylinder walls’ temperature [21], these losses are computed as
In static conditions, the heat flux from in-cylinder gases and friction heats the cylinder walls until reaching an equilibrium temperature. Once this temperature is attained, the heat entering the walls equals the flux from the walls to the coolant, and no further heat is dissipated by the cylinder walls. In such conditions, the evaluation of heat dissipated by the cylinder walls can be omitted from the model, reducing computational time and effort.
Heat losses through the piston can be computed under the same assumptions made for the cylinder walls:
Considering that coolant frictions are solely due to the piston sliding contribution internal to the cylinder, they are transferred to the coolant through the cylinder walls. Similarly, the piston sliding contribution to friction is transferred through the piston, contributing to piston heat losses.
The heat transfer from the piston to the oil is modeled as a purely convective flux, assuming homogeneous oil temperature equal to the oil temperature measured at the engine inlet:
The oil, entering the engine, carries heat away from the crankshaft components, the piston bottom, the liner, and the camshaft, and flows out. Therefore, the friction contribution is added to the convective heat transfer.
Due to the engine’s compactness, advanced materials, and extreme working conditions in an F1 engine, continuous heat exchange with the coolant and engine oil occurs, leading to variable temperatures in the cylinder block. If this model is applied to static working conditions or to series cars, where the engine block temperature can be considered constant during most operations except for warm-up, the heat exchange between the coolant, engine block, and oil can be neglected.
To account for the total heat transferred to the engine oil, it is necessary to divide the oil heat exchanges into two phases: first, the oil absorbs heat from the piston, and then it flows through the engine transferring heat to the engine block.
The oil temperature rate of change due to the first heat exchange can be evaluated as
The hypothesis is that simultaneously, 2/3 of the total oil mass exchanges heat with the piston, while the remaining mass transfers heat to the engine block.
is defined as
The total oil mass can be computed from the oil mass flow rate (obtained from empirical data) in function of the inlet oil temperature:
In the computation of the total oil mass, assuming a homogeneous oil temperature is acknowledged, recognizing the inaccuracy of this hypothesis. Equating the oil temperature to the engine inlet one, instead of an intermediate or outlet temperature, is chosen for safety reasons: lower oil temperature increases heat rejected to the fluid, necessitating higher power dissipation.
After the first exchange, the oil is heated to an intermediate temperature the highest and most critical engine fluid temperature. Subsequently, the oil releases heat to the engine block during the second exchange:
is positive if the flux is from the engine block to the oil:
Similar to the walls and piston, the engine block dissipates part of the heat before transferring it to the coolant:
Before considering all the contributions entering the engine coolant, a final heat dissipation is considered:
This accounts for the contribution of exhaust gases’ enthalpy used to heat up the exhaust system.
The heat transferred from the exhaust system to the coolant is calculated as follows:
Even though the exhaust system is not directly in contact with the engine coolant, losses through the material in the between are included in Equation (23).
To consider heat exchange from the oil to the coolant through the engine block as a unified flow, the flux is positive when the engine block is heated up by the coolant:
Once all the heat fluxes to the engine coolant have been computed, the rate of variation of the coolant temperature at the engine outlet is [21]
As for the oil, the hypothesis is that the engine coolant maintains a constant temperature equal to the one measured at the engine inlet. The coolant is assumed to exchange heat with the engine block, cylinder walls, and exhaust system simultaneously. This assumption is made for computational simplicity, considering the complexity of dynamic temperature changes throughout the coolant system.
Since not the entire coolant volume is concurrently involved in the heat exchanges, a factor of 4/5 is applied to the coolant mass to account for this reality.
Also in this case, the total coolant mass is defined in function of the coolant temperature at the engine inlet:
In the final stages of developing the model, certain parameters such as heat exchange areas, heat transfer coefficients, solid wall masses, mass flow rates, and specific heat coefficients are yet to be determined. Due to confidentiality reasons, specific values and materials used cannot be disclosed. However, the process of assigning these values will be outlined.
The oil and coolant mass flow rates are dependent on the engine rotational speed, since the pumps are driven by the engine motion. Empirical dependencies are detected through testing at the bench, and these relationships are then converted into maps for integration into the model.
To specify the other parameters, an iterative process is employed. The model is run with a set of input data, and the outputs are compared to those obtained from another simulator run with the same input data. The values assigned to the model parameters are those resulting in the minimum difference between the heat rejection values simulated by the model and those computed by the 1D simulation.
The initial approximations for the areas of the convective fluxes are straightforward:
- is the cross-section area of the piston head normal to the cylinder axis.
- represents the cylinder surface in contact with the gases, including the head and the liner.
- is the external surface of the liner.
- includes the bottom surface of the piston, including the piston bosses and the pins.
- is the external surface of the water jacket.
- and are left unknown.
During the iterative process, the values for parameters are adjusted to achieve the correct behavior of the model with each set of testing data. These adjustments may involve reducing or increasing values based on the observed performance of the model.
Simultaneously, heat transfer coefficients are defined, with initial approximations derived from literature values based on the materials used in the engine, the mechanical process they undergo, and the working conditions. Following a series of tests and literature reviews [22,23,24], maps are created for all heat transfer coefficients in the model. Among these coefficients, is the only constant coefficient, while the others exhibit different behaviors. Specifically, , and are linear functions of the engine load, and , and are non-linear functions of the engine rotational speed. Finally, is a linear function of the engine speed.
This approach makes the model less complex than Woschni’s model [25], as each thermal coefficient is a function of a single variable, resulting in better computational efficiency.
The total engine oil and coolant masses are computed from their density values, while other missing masses are assumed to be equal to the piston mass , the combined mass of the liner and head , and the remaining engine block mass .
The specific heat values are determined from literature values [22,23,24], considering the materials of which they are made. The specific heats of solid materials are kept constant, while those of coolant and oil are modeled functions of their temperatures.
As previously mentioned, the model calculates the peak cylinder temperature, which needs to be converted into the time-averaged temperature [26]. To achieve this, a coefficient in the model is assigned through iterations.
After the initial approximation is assigned to every parameter, each estimation is relaxed, and a range of values is designated for each variable. A comprehensive exploration of all possible combinations is conducted by running a matrix of multiple levels. The optimization process is executed using a MATLAB R2022b script containing a sequence of nested “for” cycles, with one cycle for each variable. The first attempt involves a relatively large range of values for each variable, and subsequently, the ranges are progressively reduced in each run. This iterative approach refines the model parameters to minimize the difference between simulated heat rejection values and those computed by the 1D simulation.
3. Results
The practical implementation of the theoretical outcome involves a SIMULINK model, solving the system of equations through a power balance applied to the engine. The model is iteratively run to determine suitable initial conditions, eliminating the need to wait for stabilization during simulation. If used in an MPC or control strategy, initial conditions can be measured by sensors or be retrieved from previous simulations, streamlining the system of equations’ solution and accelerating simulations.
Validation of the proposed 0D is performed against a benchmark 1D simulator developed inside the factory. Both models share some input data, including engine coolant and oil temperatures measured at the engine inlet, and the engine rotational speed. Although the 0D model requires additional inputs (MFB50, boost temperature, air-to-fuel ratio, fuel mass flow rate), the 1D model can internally compute them. Therefore, before comparing outputs, it is essential to ensure that both models are simulated under the same conditions.
For this purpose, a lap at the circuit of Monza is simulated using telemetry data from a real race with both simulators. Model inputs are derived from this telemetry. To validate the similarity of operating conditions, pressure peak values from both 0D and 1D models are compared (Figure 2). Due to confidentiality, sensitive data are normalized with respect to a reference value.
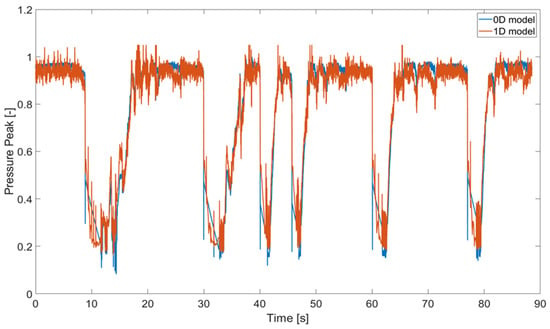
Figure 2.
Pressure peak (normalized) from 0D and 1D models.
The normalized mean error, quantifying the modeling error, is computed as
where is the number of discrete steps, is the normalizing value, the value computed at the discrete step by the 0D model, and the value computed at the discrete step by the 1D model.
The computed normalized mean error for the pressure peak is 4.16%. The error is further reduced when considering only full push zones. Most of the error occurs in the engine cut-off zones at the beginning of corners, where the pressure dynamics are replicated by a simple transfer function. Since these zones are less critical for heat rejection, the normalized mean error is deemed acceptable. In the cut-off regions, the absence of combustion results in lower pressure and a reduction in in-cylinder temperatures, thereby substantially decreasing the heat transferred to the fluids compared to full-load conditions.
With the confirmation of comparable operating conditions, further comparisons can be made between the outputs of the two models.
Figure 3 demonstrates a good match in the total heat rejected by the engine to the coolant, with a normalized mean error of 2.02%. It is also evident that the model exhibits a robust response to gearshifts, as evinced by instances of rapid engine speed reduction and subsequent drops in heat rejection. This phenomenon is visible through the sharp dips observed in Figure 3 and Figure 4.
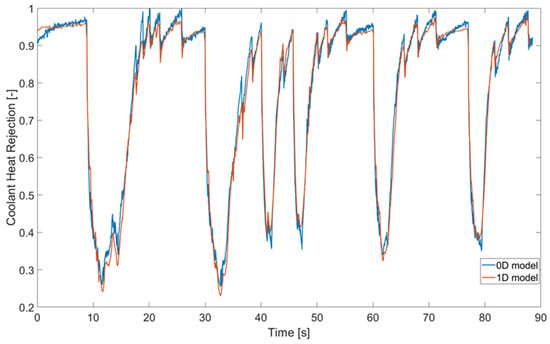
Figure 3.
Coolant heat rejection (normalized) from 0D and 1D models.
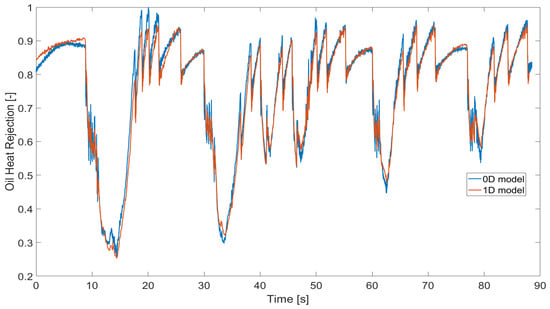
Figure 4.
Oil heat rejection (normalized) from 0D and 1D models.
An even more accurate match is observed in the comparison of the total heat rejected to the engine oil, showing a normalized mean error of 1.82% (Figure 4).
The strategy of computing engine components and fluid temperatures within the model, in contrast to [19,20,27], allows an additional validation step. By comparing the fluid temperatures at the engine outlet computed by the 0D model to those measured during a racing lap, the simulations can be validated against real data. Although heat rejection values inside the engine cannot be directly measured, if the D model accurately predicts fluid temperatures under the same conditions, the heat rejected to the fluids during the lap should be consistent.
Figure 5 illustrates the normalized difference between the coolant temperature at the engine outlet and the engine inlet, comparing the 0D model’s computation and the measurements during a racing lap. While the 0D model appears more sensitive to temperature variations, the difference could be attributed to the sensor inertia. Nevertheless, the maximum error between the model and the telemetry is less than 1 °C, which is considered acceptable.
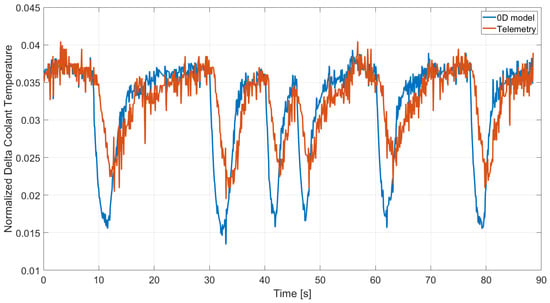
Figure 5.
Coolant delta temperature from 0D and real data.
In Figure 6, the normalized difference between the oil temperature at the engine outlet and the engine inlet computed by the 0D model is compared with the measurements acquired during a racing lap. Similarly, the 0D model appears more sensitive, and in this case, the difference is independent of sensor inertia. Nonetheless, the maximum error is less than 1.5 °C, which remains within acceptable limits.
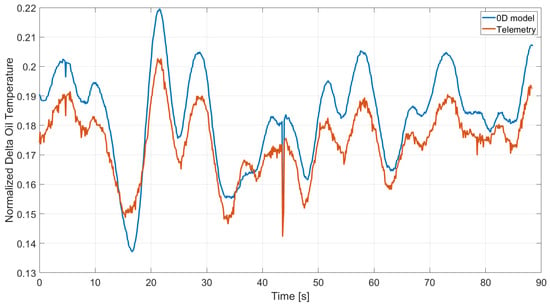
Figure 6.
Oil delta temperature from 0D and real data.
4. Conclusions
In this paper, a 0D model to compute the heat fluxes within an internal combustion engine was developed. The system dynamics were derived and tested. The model successfully computes the heat transferred to the engine fluids and the engine fluid temperatures at the engine outlet.
The model was tested by comparing the results to a validated 1D model. With a normalized mean error of about 2% for heat fluxes and an absolute error under 2 °C for fluid temperatures, the model aligns well with expected values.
Its short simulation time (approximately 2 s to simulate an entire lap) makes the model suitable for on-board applications, facilitating testing under various running conditions and aiding in optimizing engine strategies and vehicle setup before each race weekend on each track layout.
Author Contributions
Conceptualization, F.F., A.C. and V.R.; methodology, F.F.; software, F.F.; validation, F.F. and A.C.; formal analysis, F.F.; investigation, F.F.; resources, F.F., A.C. and C.B.; data curation, F.F.; writing—original draft preparation, F.F.; writing—review and editing, F.F., A.C. and V.R.; visualization, F.F.; supervision, A.C. and V.R.; project administration, C.B.; funding acquisition, V.R. and C.B. All authors have read and agreed to the published version of the manuscript.
Funding
This research received no external funding.
Data Availability Statement
The data presented in this study are available on request from the corresponding author due to confidentiality reasons.
Conflicts of Interest
Authors Alberto Cerofolini and Carlo Bussi were employed by the company Ferrari S.p.A. The remaining authors declare that the research was conducted in the absence of any commercial or financial relationships that could be construed as a potential conflict of interest.
References
- Kern, J.; Ambros, P. Concepts for a Controlled Optimized Vehicle Engine Cooling System; SAE Technical Paper 971816; SAE International: Warrendale, PA, USA, 1997. [Google Scholar]
- Guzzella, L.; Onder, C.H. Introduction to Modeling and Control of Internal Combustion Engine Systems, 2nd ed.; Springer: Berlin, Germany, 2010. [Google Scholar]
- Mauro, S.; Şener, R.; Gül, M.Z.; Lanzafame, Z.; Messina, M.; Brusca, S. Internal combustion engine heat release calculation using single-zone and CFD 3D numerical models. Int. J. Energy Environ. Eng. 2018, 9, 215–226. [Google Scholar] [CrossRef]
- Yoshimura, K.; Isobe, K.; Kawashima, M.; Yamaguchi, K.; Sok, R.; Tokuhara, S.; Kusaka, J. Effects of Pre-spark Heat Release of Ethanol-Blended Gasoline Surrogate Fuels on Engine Combustion Behavior. SAE Int. J. Fuels Lubr. 2024, 17, 37–50. [Google Scholar] [CrossRef]
- Singh, V.; Rijpkema, J.; Li, X.; Munch, K.; Andersson, S.; Verhelst, S. Optimization and Evaluation of a Low Temperature Waste Heat Recovery System for a Heavy-Duty Engine over a Transient Cycle. SAE Int. J. Adv. Curr. Prac. Mobil. 2021, 3, 159–170. [Google Scholar] [CrossRef]
- Pamminger, M.; Hall Carrie, M.; Wang, B.; Wallner, T. A control-oriented combustion model framework for compression ignition engines operating on low-reactivity fuel. Int. J. Engine Res. 2021, 22, 1924–1938. [Google Scholar] [CrossRef]
- Mohand Said, L.; Khaled, L.; Mourad, B.; Mohand, T. Investigation on heat transfer evaluation for a more efficient two-zone combustion model in the case of natural gas SI engines. Appl. Therm. Eng. 2011, 31, 319–328. [Google Scholar]
- Ponti, F.; Ravaglioli, V.; Moro, D.; Serra, G. MFB50 on-board estimation methodology for combustion control. Control. Eng. Pract. 2013, 21, 1821–1829. [Google Scholar] [CrossRef]
- Zongyu, Y.; Rolf, D.R. Numerical investigation of radiative heat transfer in internal combustion engines. Appl. Energy 2019, 235, 147–163. [Google Scholar]
- Foster, D. An Overview of Zero-Dimensional Thermodynamic Models for IC Engine Data Analysis; SAE Technical Paper 852070; SAE International: Warrendale, PA, USA, 1985. [Google Scholar]
- Rezaei, R.; Eckert, P.; Seebode, J.; Behnk, K. Zero-Dimensional Modeling of Combustion and Heat Release Rate in DI Diesel Engines. SAE Int. J. Engines 2012, 5, 874–885. [Google Scholar] [CrossRef]
- Huegel, P.; Kubach, H.; Koch, T.; Velji, A. Investigations on the Heat Transfer in a Single Cylinder Research SI Engine with Gasoline Direct Injection. SAE Int. J. Engines 2015, 8, 557–569. [Google Scholar] [CrossRef]
- Cortona, E.; Onder, C.H.; Guzzella, L. Engine thermomanagement with electrical components for fuel consumption reduction. Int. J. Engine Res. 2002, 3, 157–170. [Google Scholar] [CrossRef]
- Heywood, J.B. Internal Combustion Engine Fundamentals, 2nd ed.; McGraw-Hill Education Ltd.: New York, NY, USA, 2018. [Google Scholar]
- Hariram, V.; Bharathwaaj, R. Application of zero-dimensional thermodynamic model for predicting combustion parameters of CI engine fuelled with biodiesel-diesel blends. Alex. Eng. J. 2016, 55, 3345–3354. [Google Scholar] [CrossRef]
- Zhang, D.; Shen, Z.; Xu, N.; Zhu, T.; Chang, L.; Song, H. Development of a Zero-Dimensional Model for a Low-Speed Two-Stroke Marine Diesel Engine with Exhaust Gas Bypass and Performance Evaluation. Processes 2023, 11, 936. [Google Scholar] [CrossRef]
- Pamminger, M.; Hall, C.; Wang, B.; Wallner, T.; Rajkumar, M. Zero-Dimensional Heat Release Modeling Framework for Gasoline Compression-Ignition Engines with Multiple Injection Events; SAE Technical Paper 2019-24-0083; SAE International: Warrendale, PA, USA, 2019. [Google Scholar]
- Hunicz, J.; Mikulski, M.; Geca, M.; Rybak, A. Applicable approach to mitigate pressure rise rate in an HCCI engine with negative valve overlap. Appl. Energy 2019, 257, 114018. [Google Scholar] [CrossRef]
- Saric, S.; Basara, B. A Hybrid Wall Heat Transfer Model for IC Engine Simulations. SAE Int. J. Engines 2015, 8, 411–418. [Google Scholar] [CrossRef]
- Chen, S.; Flynn, P. Development of a Single Cylinder Compression Ignition Research Engine; SAE Technical Paper 650733; SAE International: Warrendale, PA, USA, 1965. [Google Scholar]
- Shibata, Y.; Shimonosono, H.; Yamai, Y. New Design of Cooling System with Computer Simulation and Engine Compartment Simulator; SAE Technical Paper 931075; SAE International: Warrendale, PA, USA, 1993. [Google Scholar]
- Rajput, R.K. Engineering Thermodynamics, 3rd ed.; Laxmi Publications: New Delhi, India, 2007. [Google Scholar]
- Lienhard, J.H., IV; Lienhard, J.H., V. A Heat Transfer Textbook, 5th ed.; Phlogiston Press: Cambridge, MA, USA, 2020. [Google Scholar]
- Moran, M.J.; Shapiro, H.N.; Boettner, D.D.; Bailey, M.B. Fundamentals of Engineering Thermodynamics, 8th ed.; Wiley: Hoboken, NJ, USA, 2014. [Google Scholar]
- Zak, Z.; Emrich, M.; Takats, M.; Macek, J. In-Cylinder Heat Transfer Modelling. February. MECCA J. Middle Eur. Constr. Des. Cars 2016, 14, 2–10. [Google Scholar] [CrossRef]
- Arici, O.; Johnson, J.; Kulkarni, A. The Vehicle Engine Cooling System Simulation Part 1—Model Development; SAE Technical Paper 1999-01-0240; SAE International: Warrendale, PA, USA, 1999. [Google Scholar]
- Sinyavski, V.V.; Shatrov, M.G.; Dunin, A.Y.; Shishlov, I.G.; Vakulenko, A.V. A Zero-Dimensional Model for Internal Combustion Engine Simulation and Some Modeling Results. In Proceedings of the International Conference on Engineering Management of Communication and Technology (EMCTECH), Vienna, Austria, 20–22 October 2022; pp. 1–6. [Google Scholar]
Disclaimer/Publisher’s Note: The statements, opinions and data contained in all publications are solely those of the individual author(s) and contributor(s) and not of MDPI and/or the editor(s). MDPI and/or the editor(s) disclaim responsibility for any injury to people or property resulting from any ideas, methods, instructions or products referred to in the content. |
© 2024 by the authors. Licensee MDPI, Basel, Switzerland. This article is an open access article distributed under the terms and conditions of the Creative Commons Attribution (CC BY) license (https://creativecommons.org/licenses/by/4.0/).