Article

Hydrothermal Co-Liquefaction of Food and Plastic Waste for Biocrude Production

1
AAU Energy, Aalborg University, Pontoppidanstræde 111, 9220 Aalborg, Denmark
2
LNEG—Laboratório Nacional de Energia e Geologia, Estrada do Paço do Lumiar 22, 1649-038 Lisboa, Portugal
*
Author to whom correspondence should be addressed.
Energies 2024, 17(9), 2098; https://doi.org/10.3390/en17092098
Submission received: 28 March 2024 / Revised: 24 April 2024 / Accepted: 25 April 2024 / Published: 27 April 2024
(This article belongs to the Special Issue New Trends in Biofuels and Bioenergy for Sustainable Development II)

Abstract

:
In this study, hydrothermal co-liquefaction of restaurant waste for biocrude production was conducted. The feedstock was resembled using the organic fraction of restaurant waste and low-density polyethylene, polypropylene, polystyrene, and polyethylene terephthalate, four plastic types commonly present in municipal solid waste. Using design of experiment and a face-centered central composite design, three factors (feedstock plastic fraction, temperature, time) were varied at three levels each: feedstock plastic fraction (0, 0.25, 0.5), temperature (290 °C, 330 °C, 370 °C), and reaction time (0 min, 30 min, 60 min). The literature reports positive synergistic interactions in hydrothermal co-liquefaction of biomass and plastics; however, in this work, only negative synergistic interactions could be observed. A reason could be the high thermal stability of produced fatty acids that give little room for interactions with plastics. At the same time, mass might transfer to other product phases.

1. Introduction

In 2015, as part of the Paris Agreement, the global community agreed to limit the global rise in temperature to 2 °C compared to the reference period, ideally staying below 1.5 °C [1]. However, greenhouse gas emissions have still not peaked and, as of 2023, the global average near-surface temperature had already increased to around 1.45 °C above preindustrial levels [2]. If no significant reduction in greenhouse gas emissions is undertaken, the threshold of an increase in global mean temperature of 1.5 °C compared to the preindustrial era will be reached around the year of 2040 at the current rate of warming.
The International Energy Agency (IEA) expects fossil energies to still account for a large share of the final energy consumption in 2050, one culprit being the transportation sector [3]. It currently consumes around a quarter of the world’s total final energy and is expected to still be heavily dependent on oil in 2050, both in road and non-road transportation. This justifies the increased interest in the development of processes for the substitution of fossil oil with sustainable counterparts.
At the same time, humanity created other problems due to industrialization and high living standards: currently, around 7–9 billion tons of waste are produced yearly [4]. This amounts to around 500 kg waste per capita per year in highly developed countries. Initiatives exist to re-utilize valuable compounds found in the waste. Approaches include composting of organic waste compounds, recycling, or incineration for waste-to-energy [4]. Nevertheless, around 70% of the world’s waste is disposed of in landfills, leading to pollution and production of greenhouse gases (GHG) such as methane. In 2006, the resulting GHG emissions were responsible for around 3–4% of global GHG emissions. As waste volumes have increased in the meantime, this number is expected to have increased accordingly. Municipal solid waste (MSW) is the fraction of total waste that originates in households. The waste mostly consists of bio residues, but plastics are contained in the waste at around 10 wt% and are of special concern, as they persist in nature for a long time and cause problems when entering the food chain [4,5]. This underlines the necessity for the development of waste treatment and valorization methods. Common recycling of plastic contained in waste requires intensive sorting and cleaning steps [6]. Using thermochemical recycling processes, it might be possible to skip these steps, while, at the same time, obtaining value-added products from other compounds contained in the waste.
Hydrothermal liquefaction (HTL) is a thermochemical process occurring at moderately high temperatures close to the critical point of water (T ≈ 374 °C) and corresponding pressures where water is used as a solvent, reactant, and catalyst [7]. It can potentially provide a remedy for the two described problems by converting the abundant resource of MSW that is otherwise still mostly disposed of in landfill into biocrude and potentially value-added products. Produced biocrude shares some characteristics with crude oil and can be upgraded to be used as fuel substitute in the transportation sector [8]. HTL by-products also allow for valorization, e.g., valuable platform chemicals can be recovered from the produced aqueous phase or hydrochar can be used as adsorbent or soil enhancer [9,10].
Previously, it has been reported that combinations of biomass and plastics in HTL feedstocks lead to synergistic interactions where the observed biocrude yields of co-liquefaction are higher than expected. An analogue phenomenon has been known to occur for over 20 years in pyrolysis [11]. Yuan et al. [12] investigated HTL of sawdust and rice straw with high-density polyethylene (HDPE) in varying compositions and found maximum yield and interactions at a biomass/HDPE mass ratio of 80/20, the yield being around three times larger than a weight-fraction averaged oil yield of the individual components. Furthermore, the biocrude produced in co-liquefaction showed increased heating values (HHVs) relative to those from biomass-only HTL. Worth mentioning are the works on the topic by Seshasayee and Savage [13,14]. Thorough co-liquefaction studies were performed where different biomolecule–biomolecule, plastic–plastic, and biomolecule–plastic interactions were investigated. Most tested combinations exhibited strong synergies, increasing biocrude yields. Most relevant for the present study are experiments between biomolecules and plastics that were tested in an equi-mass setup of polypropylene (PP), polycarbonate (PC), polystyrene (PS), and polyethylene terephthalate (PET) with 5 wt% each and a biomass mixture resembling MSW. Biocrude yields of approx. 32 wt% and synergistic interactions between biomass and plastics leading to an increase of yields by over 40% were observed at the lowest tested temperature of 300 °C.
As part of this work, hydrothermal co-liquefaction of another common waste stream of restaurant waste that contains both biomass and plastic was conducted. To assess the existence of synergistic interactions between biomass and plastics and the influence of feedstock composition, temperature, and time, an experimental campaign was conducted using design of experiment. The system response was evaluated statistically and the factor combination with the highest biocrude yield was identified. However, no synergistic interactions were found, but rather antagonistic interactions, i.e., addition of plastic decreased biocrude yields disproportionately. Analyses of created products by standard analyses methods were conducted, allowing for the formulation of hypotheses on the causes of these antagonistic interactions. Interestingly, the lower biocrude yields seemed to be associated with a higher production of aqueous phase organics, while solids yields did not seem to be affected.

2. Materials and Methods

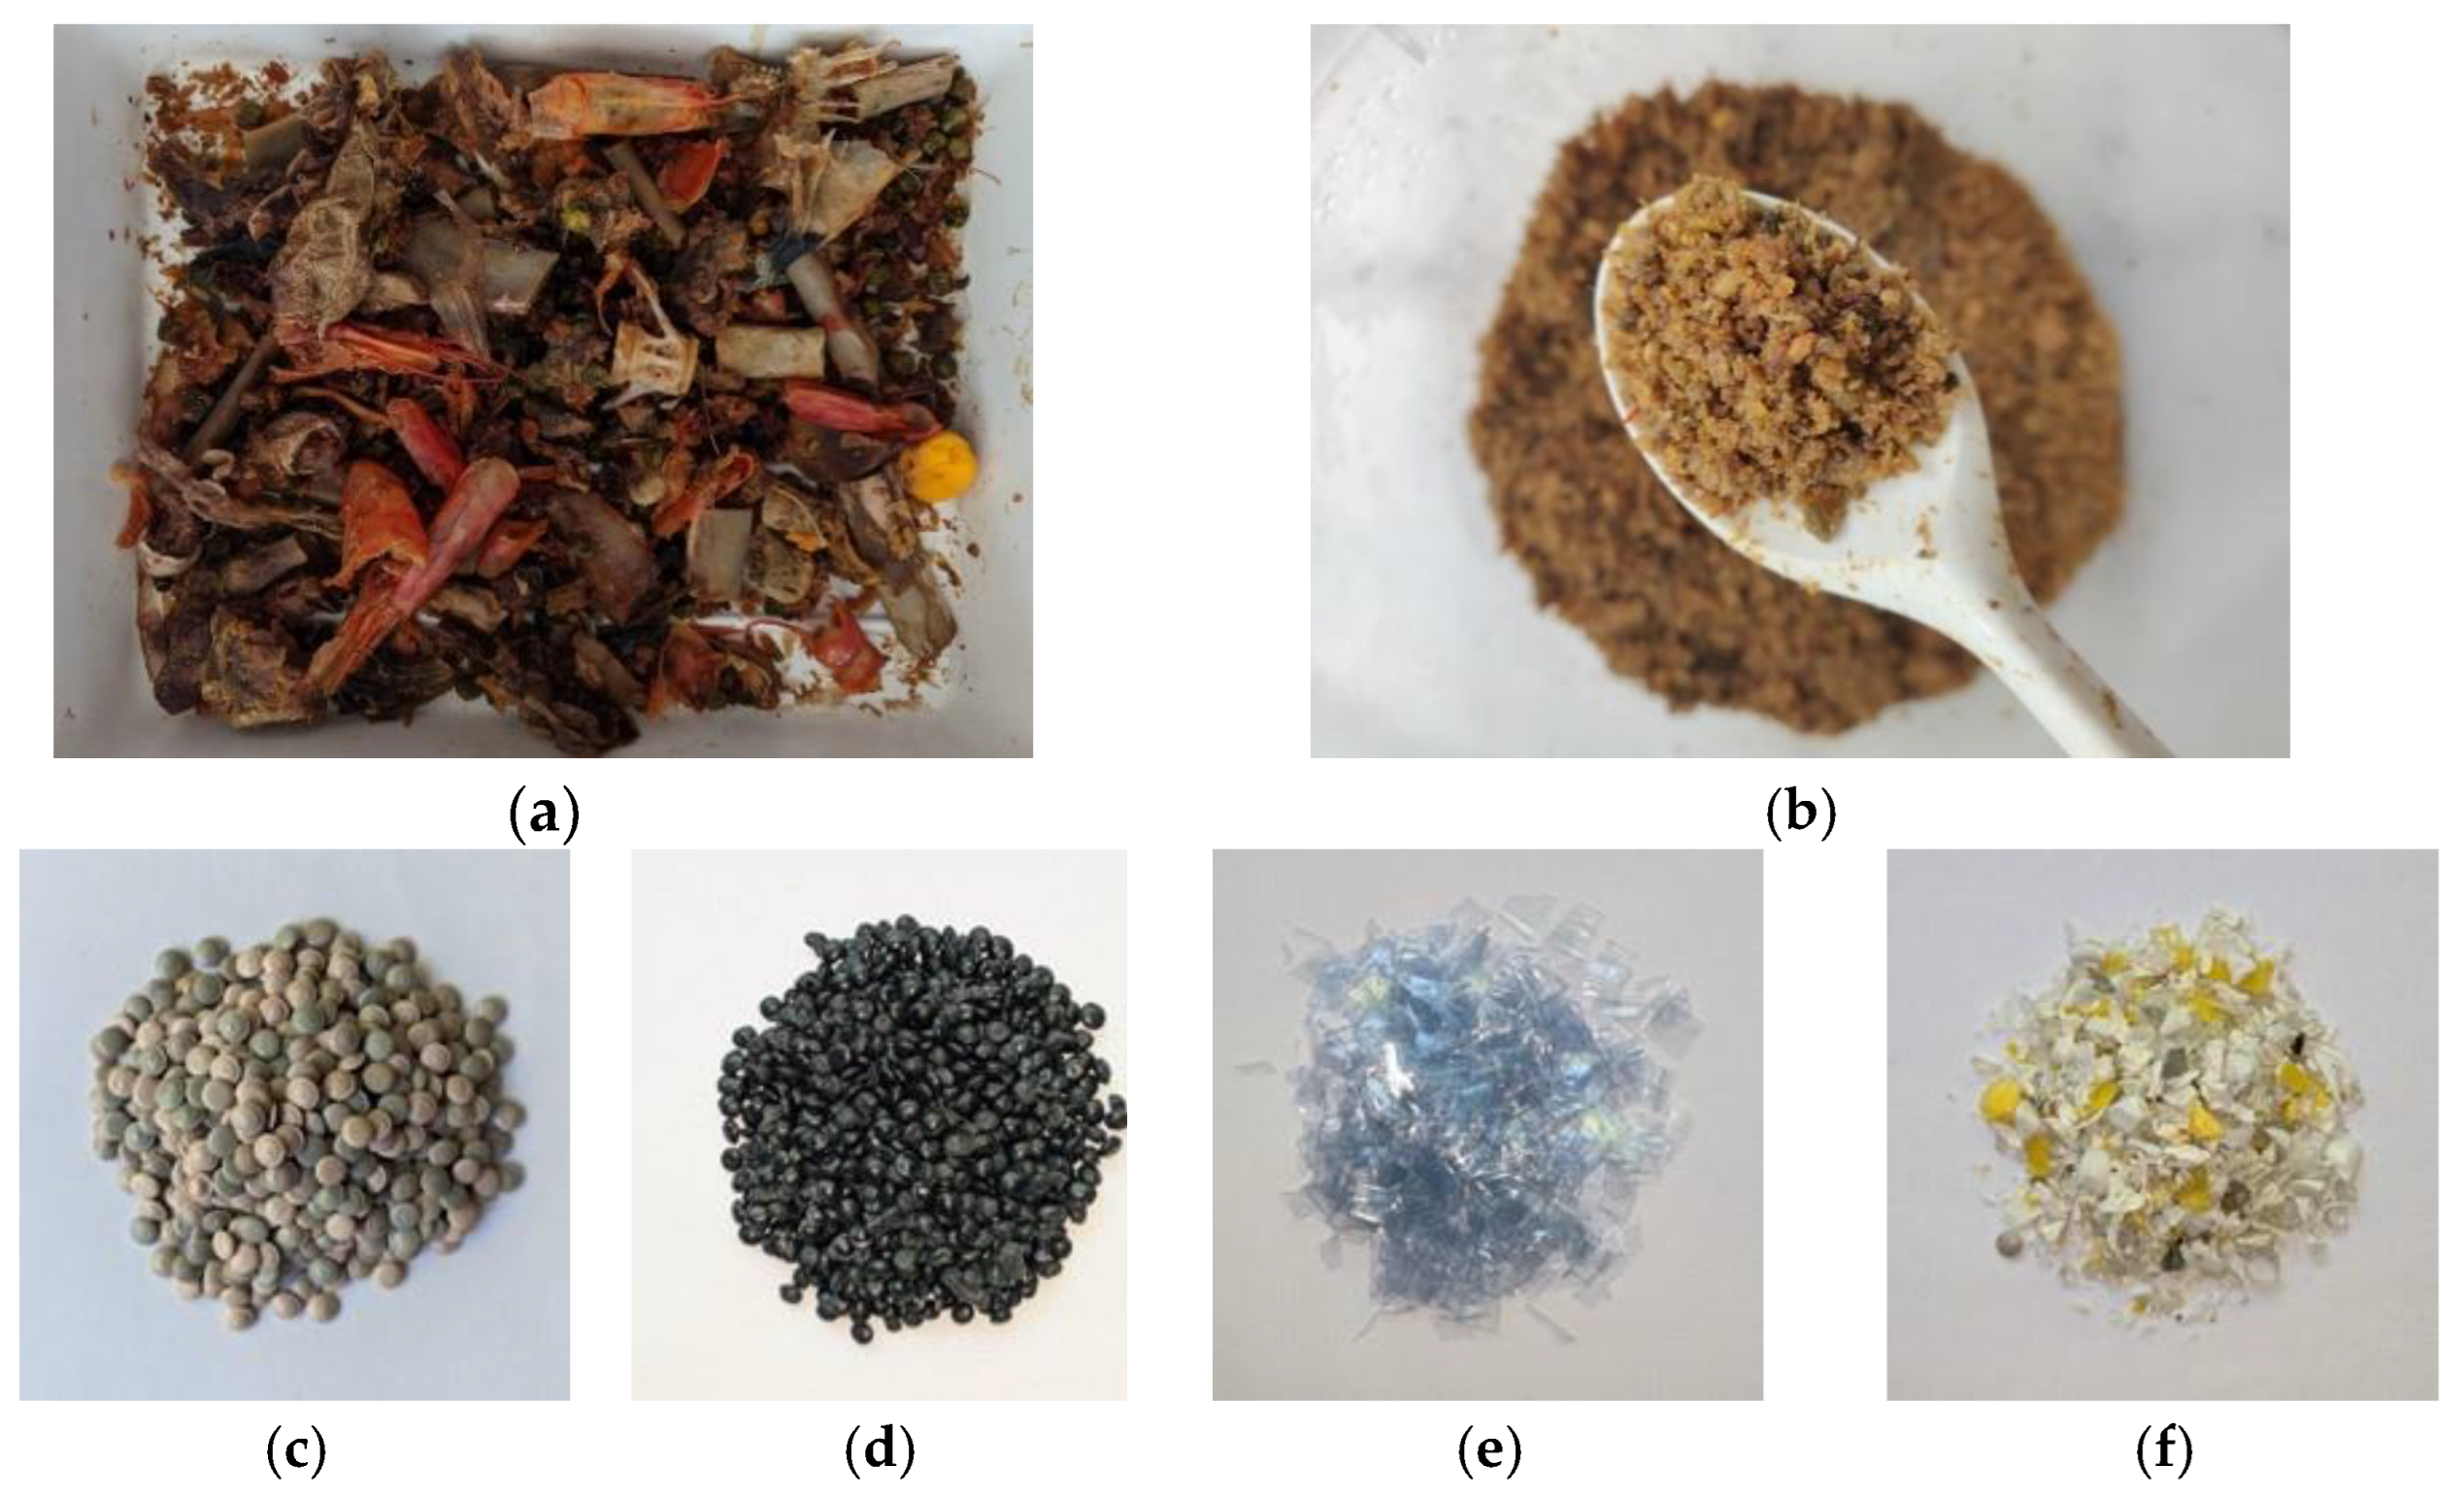
2.1. Feedstock Characterization

The used biomass in this study was provided as the organic waste fraction of a local restaurant in Lisbon. The waste was dried for approx. one week at 40 °C to preserve its properties and then pre-treated to reduce the average particle size to around 0.8 mm using a consumer-grade blender. For the plastic fraction, low density polyethylene (LDPE), polypropylene (PP), and polystyrene (PS) were acquired from Merck (Darmstadt, Germany) and Urbaser (Madrid, Spain). Polyethylene terephthalate (PET) was cut from a commercial water bottle into squares of roughly 1 cm edge length. The plastic fraction contains each plastic in the following ratios: LDPE (53.1 wt%), PP (22.2 wt%), PET (15.1 wt%), PS (9.6 wt%), as reported by Dahlbo et al. [15] for MSW. Samples of food waste and plastics are shown in Figure 1. The elemental and proximate composition of the feedstock materials and used measurement methods are given in Table 1. To measure the moisture content (MC), a moisture analyzer (Heraeus, Hanau, Germany) was used at 105 °C. Ash content and volatile matter (VM) were analyzed in a muffle furnace (Heraeus, Hanau, Germany) at 550 °C and 900 °C, respectively. Fixed carbon (FC) was calculated as F C = 100 ( M o i s t u r e + A s h + V M ). The higher heating value (HHV) was measured by bomb calorimeter (Parr Instruments, Moline, IL, USA).

2.2. Hydrothermal Liquefaction Experiments

The liquefaction experiments in this study were conducted in a 160 mL stainless steel batch reactor (Parr Instruments, USA) connected to temperature and pressure sensors. The experiment of the design center point was conducted three times to allow for an estimation of the experimental variance. For each experiment, the reactor was loaded with 7 g of feedstock and 70 g of distilled water, roughly corresponding to a 6.5% dry matter slurry. The reactor was sealed with a graphite gasket and purged twice with nitrogen gas to remove the residual air/oxygen. The reactor was placed in a pre-heated oven (Termolab, Águeda, Portugal) and heated to the desired temperature. Depending on reaction temperatures, the system needed around 15–30 min to heat up to 290–370 °C. Corresponding pressures were 150–230 bars. The reactor was kept at the experimental temperature for the required amount of time and then removed from the oven and placed into a water bath to cool down. After the completion of the reaction process, the volume of gas phase was measured using a gas volume meter (Elster, Bad Laer, Germany) and the gas was collected for further analysis.

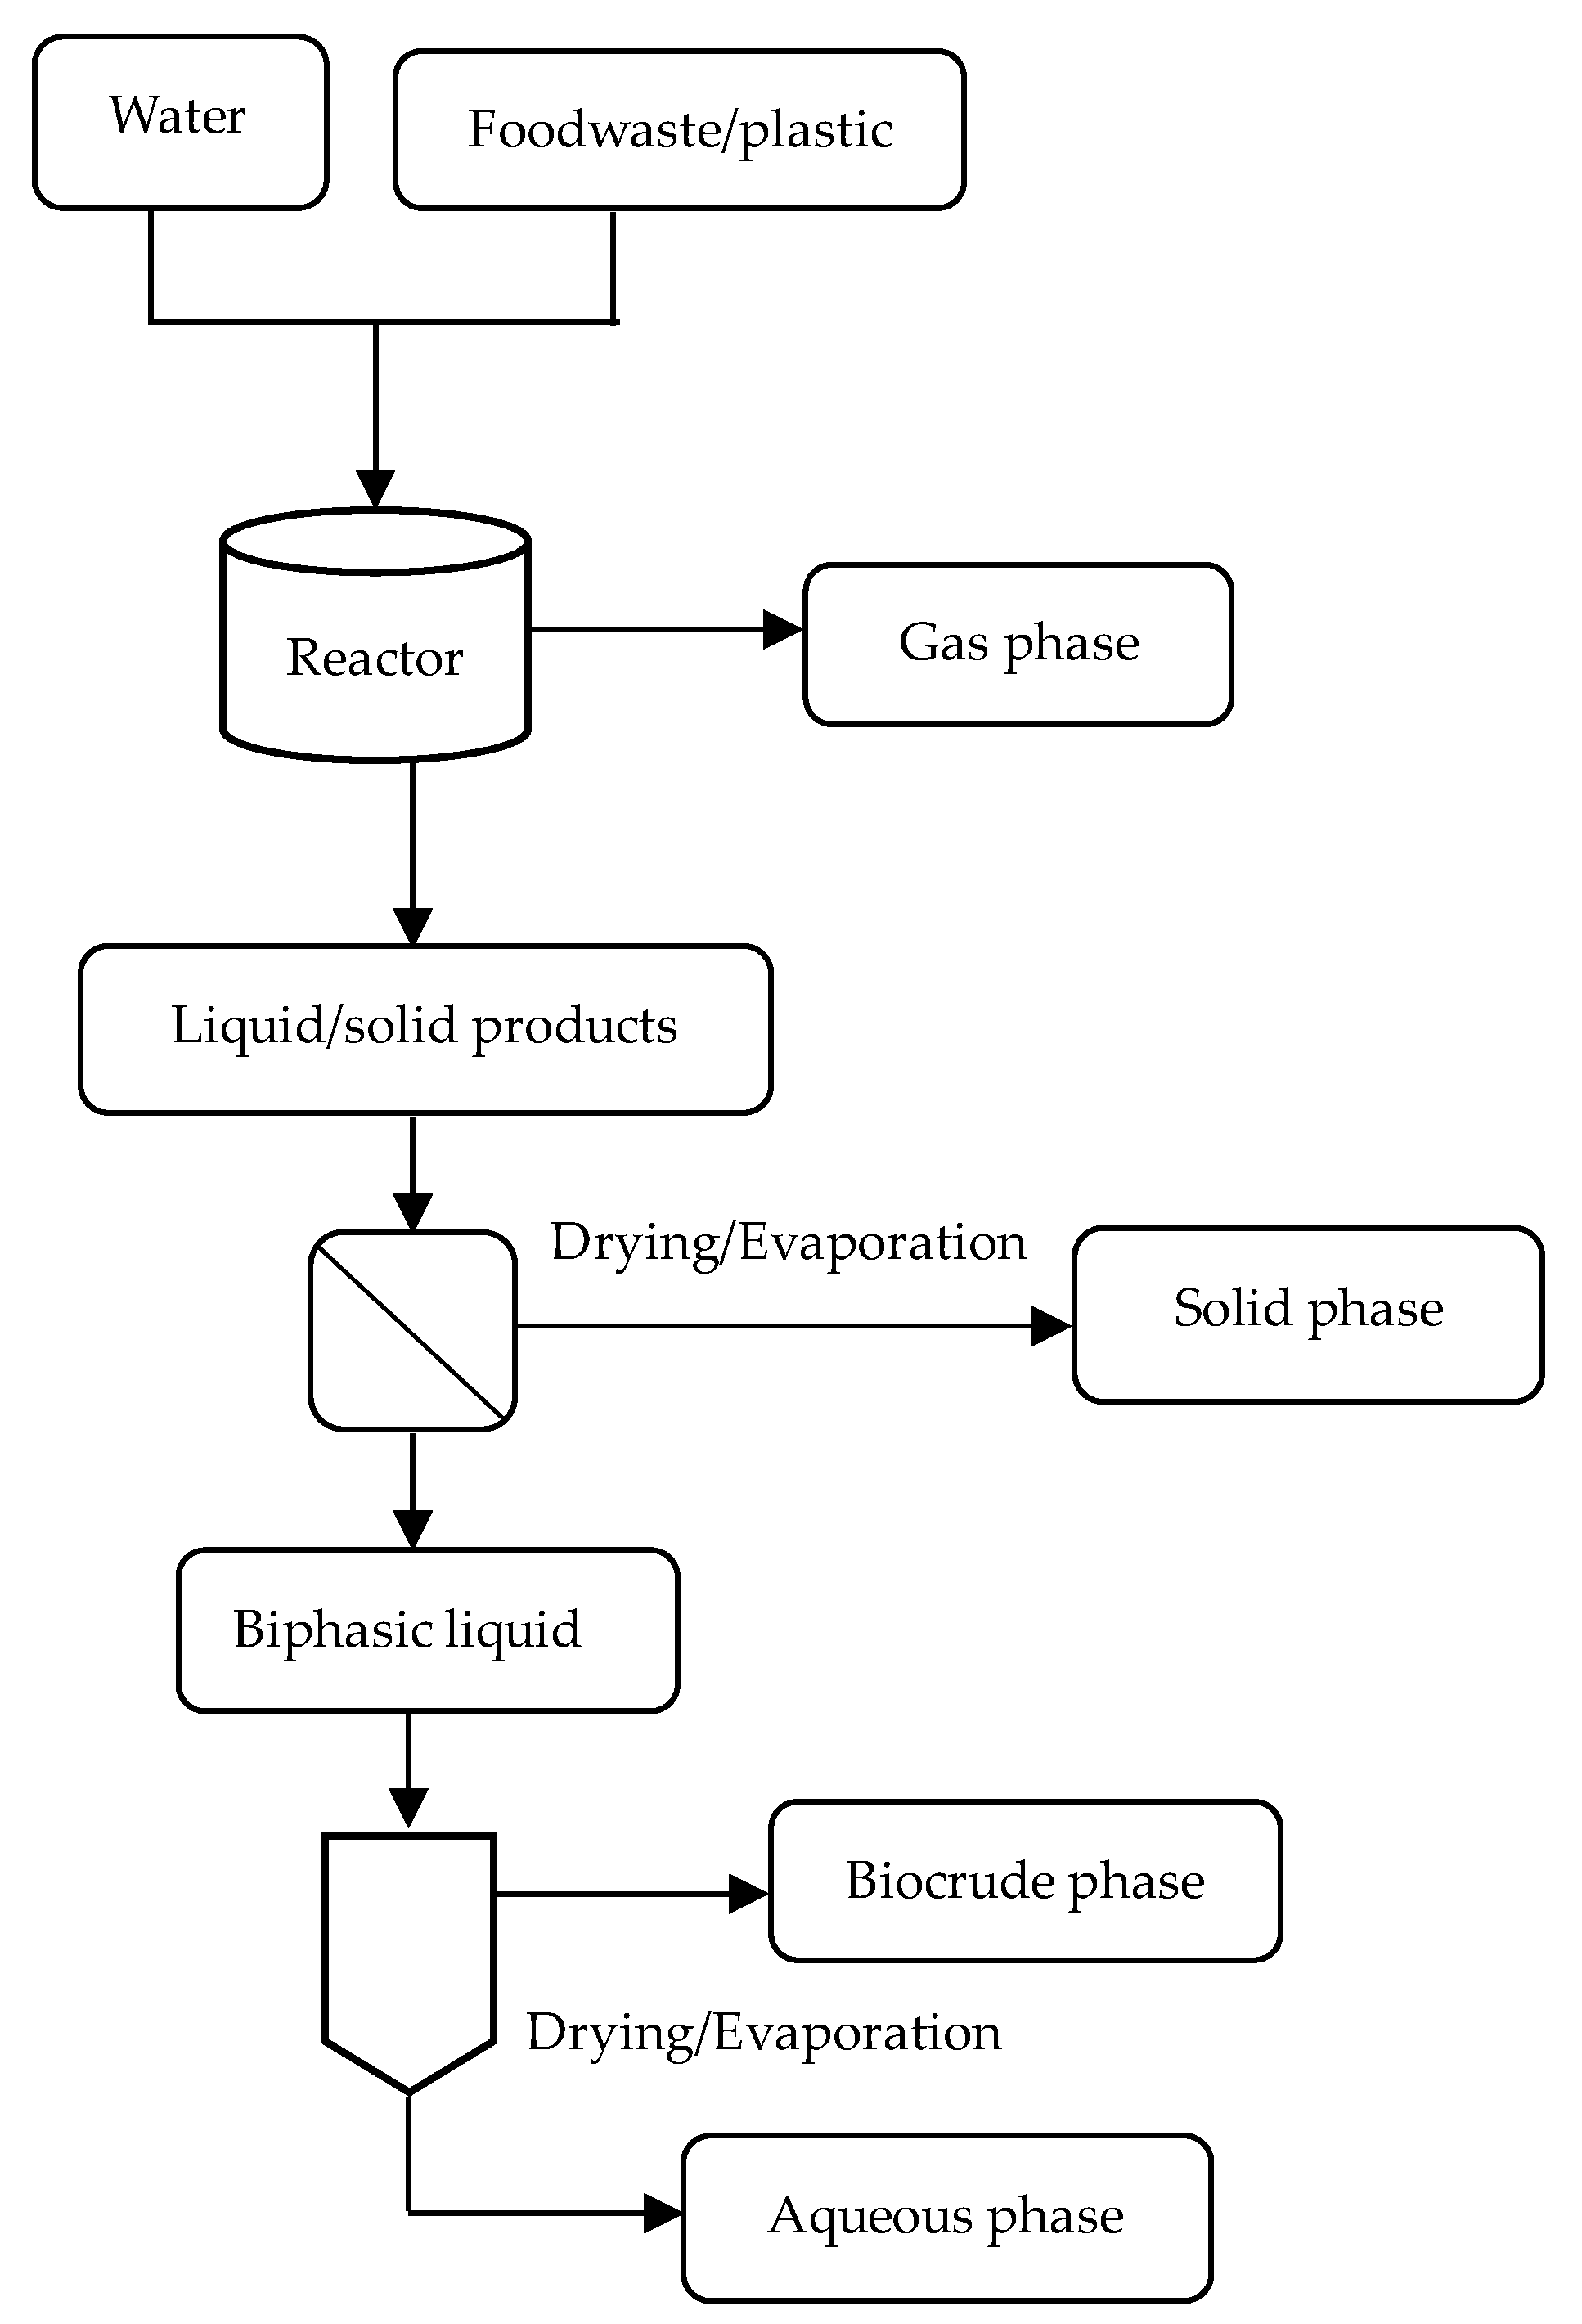
2.3. Product Separation and Characterization

After completion of the HTL experiments, the gas phase was collected and its volume measured (Elster, Bad Laer, Germany). A sample was collected for gas chromatography (GC) using an HP 6890 series gas chromatograph with two columns and argon as carrier gas, calibrated using mixtures of standard gases. After removal of the gas phase, firstly, only cyclohexane was brought into contact with the aqueous phase, as it is immiscible with water. Acetone was only used after removal of the aqueous phase for further cleaning of the reactor and filter to avoid aqueous phase compounds dissolving in acetone. The separation procedure is shown in Figure 2.
The contents were filtered under vacuum using a glass fiber microfilter (Whatman, Buckinghamshire, UK, diameter of 90 mm, pores of 1.6 μm). The reactor was cleaned with about 2 mL of cyclohexane for every gram of feedstock. The biphasic liquid was separated into biocrude + cyclohexane and aqueous phase by decantation using a separatory funnel. To find the aqueous phase mass, it was dried using a rotavapor. Contained water was evaporated by reduction of the boiling point under vacuum. The dried aqueous phase was weighed and then dissolved in 10 mL of ultra purified water and analyzed by HPLC (high precision liquid chromatography).
The reactor was rinsed and the filter washed repeatedly with acetone until the acetone passing the filter was clear. The mixture of biocrude, cyclohexane, and acetone were poured into a flask and dried using nitrogen to avoid loss of volatiles. After removing the solvents, the mass of collected biocrude was determined by weight. The solid fraction was defined as what remains in the filter paper after filtration. A sample of the solid fraction was taken and dried together with the remaining solid fraction in the oven at 105 °C for approx. 1 h. The mass of the solid fraction was determined by difference. The elemental analysis of the biocrude and solid samples were performed using an elemental analyzer (Elementar, Langenselbold, Germany). For biocrude analysis using gas chromatography-mass spectrometry (GCMS), first the biocrude sample was dissolved in 10 mL of isopropanol. For the GC analysis, 1 vol% of 2,3,4 trimethylpentane was added as internal standard. The diluted sample was injected in an Agilent 8890 GC (Agilent Technologies, Santa Clara, CA, USA), equipped with an Agilent DB-5 ms column, and coupled with a 5977B GC/MSD. Column flow was 1 mL/min, with helium as the carrier gas. Oven temperature started at 60 °C, with a heating ramp of 15 °C/min up to 100 °C, 25 °C/min up to 260 °C, with a hold time of 15 min, and 25 °C/min up to 300 °C with a hold time of 5 min. To protect the detector, it was turned off during the passage of the solvent isopropanol. The HHV of the biocrude was determined using a bomb calorimeter, according to standard ASTM D 240 [30]. In experiments T2/16, T9, and T10, produced biocrude quantities were too small for analysis. In this case, HHVs were calculated using a modified Dulong formula [31] (see Equation (3)). Due to lack of ash measurements, O+A were calculated by difference and assumed to be present in the same amounts. Product yields and energy recoveries were calculated as follows:
P r o d u c t   y i e l d % = w e i g h t   o f   p r o d u c t w e i g h t   o f   f e e d s t o c k m o i s t u r e × 100
E n e r g y   r e c o v e r y   i n   b i o c r u d e   % = H H V   o f   b i o c r u d e H H V   o f   f e e d s t o c k × b i o c r u d e   y i e l d
HHV(MJ/kg) = (0.3419) C + (1.1783) H + (0.1005) S − (0.1034) O − (0.0151) N − (0.0211) A
where C, H, S, O, N, A are the sample compositions of carbon, hydrogen, sulfur, oxygen, nitrogen, and ash, respectively, and given in mass percent on dry base.
For aqueous phase analysis, HPLC (high performance liquid chromatography) was conducted. For analysis, 10 mL of purified water was added to every sample after drying the aqueous phase according to the separation procedure. Aqueous phase samples were then filtered (Whatman, Buckinghamshire, UK, diameter of 25 mm, pores of 0.45 µm) and diluted with purified water depending on the expected concentration of present compounds. The used HPLC consisted of an Agilent 1200 system (Agilent Technologies, Santa Clara, CA, USA), equipped with two columns, autosampler, and a refraction index detector. The eluent consisted of a filtered solution of 5 mM of sulfuric acid (0.5 mL/min). For calibration, standard solutions were used.

2.4. Design of Experiments

To avoid high numbers of experiments, a face-centered central composite design was used, where the number of required experiments compared to a full factorial design was reduced from 27 to 15. The center point was repeated three times to allow for an estimation of the experimental variance, leading to 17 required experiments.
Factor levels were chosen as displayed in Table 2. Temperatures were chosen based on promising results in the literature, e.g., by [12,14] for similar biomass/plastics feedstocks where highest biocrude yields were observed in the range of 300–380 °C. The maximum temperature had to be reduced to 370 °C due to limitations of the used autoclave.
Where Seshasayee et al. [14] only investigated residence times of 30 min, Yuan et al. [12] showed that optimum yields in co-liquefaction of sawdust and high-density PE might be expected at lower residence times. As in this study a different feedstock was used, optimum residence times might differ and a wide interval of residence times (0 min, 30 min, 60 min) was tested. To assess the impact of the biomass weight fraction, initial experiments were conducted (see top of Table 3). A limited decomposition of plastics was observed. Therefore, it was decided to only test a maximum plastic fraction of 0.5 as part of the experimental design.

3. Results and Discussion

3.1. Statistical Evaluation & Response Surface Methodology

After conducting the experimental campaign, the results, as displayed in Table 3, were obtained. The table contains results of conducted initial experiments (top) and the main experimental design. Product composition, higher heating value (HHV), and energy recovery (ER) are reported for each test. The data show a correlation between lower biomass fraction and lower biocrude yields. Likely, most plastic in the feedstock transferred to the solid phase. At higher temperatures, more plastic likely decomposed, leading to higher bio-oil and lower solid phase yields. More analyses are found in the next sections.
The experimental results were evaluated statistically. Using response surface methodology (RSM) and analysis of variance (AnoVa), models were fit to the data following the approach presented by Lenth et al. [32].
Table 3. All performed experiments: product yields of experimental design. Runs marked with “*” were already performed in the initial experiments and were not conducted twice.
Nr.
-
Temp.
°C
Time
min
Biomass Frac
wt.-frac
Gas a
wt%
Aqu. b
wt%
Biocrude
wt%
Solids c
wt%
Diff d
wt%
HHVBiooil
MJ/kg
ER e
%
Initial ExperimentsT2330300.53.319.28.357.911.334.9 f8.0
T7370300.57.515.813.851.411.534.915.1
T83303016.619.738.211.024.535.760.3
T93303005.56.50101.3−13.422.9 f0
T103703001.64.56.187.9−0.141.9 f6.2
T11330300.95.120.736.720.517.135.553.1
T123703018.118.449.98.814.932.371.2
T13370300.910.61638.319.315.935.755.8
Cube design1370600.512.220.516.048.42.837.318.7
2290600.56.815.713.852.910.835.215.2
337000.51.016.415.255.611.936.117.1
4330300.754.818.631.531.913.236.041.5
529000.57.122.25.656.78.435.86.2
62906017.724.748.611.37.836.578.4
7290017.425.750.117.7−0.936.380.3
8370013.519.542.27.827.136.668.2
93706018.124.251.97.48.437.686.2
10330300.754.923.230.733.28.036.841.3
Face centers11290300.751.024.325.536.712.635.633.2
12330600.755.220.328.932.513.136.838.9
13370300.752.217.131.330.119.237.242.7
14330300.755.124.328.333.88.636.638.0
1533000.755.825.228.934.06.034.536.5
16 *330300.53.319.28.357.911.334.9 f8.0
17 *3303016.619.738.211.024.535.760.3
a Gas phase yield. b Aqueous phase yield. c Solid phase yield. d Mass balance closure. e Energy recovery. f Calculated by Dulong formula.

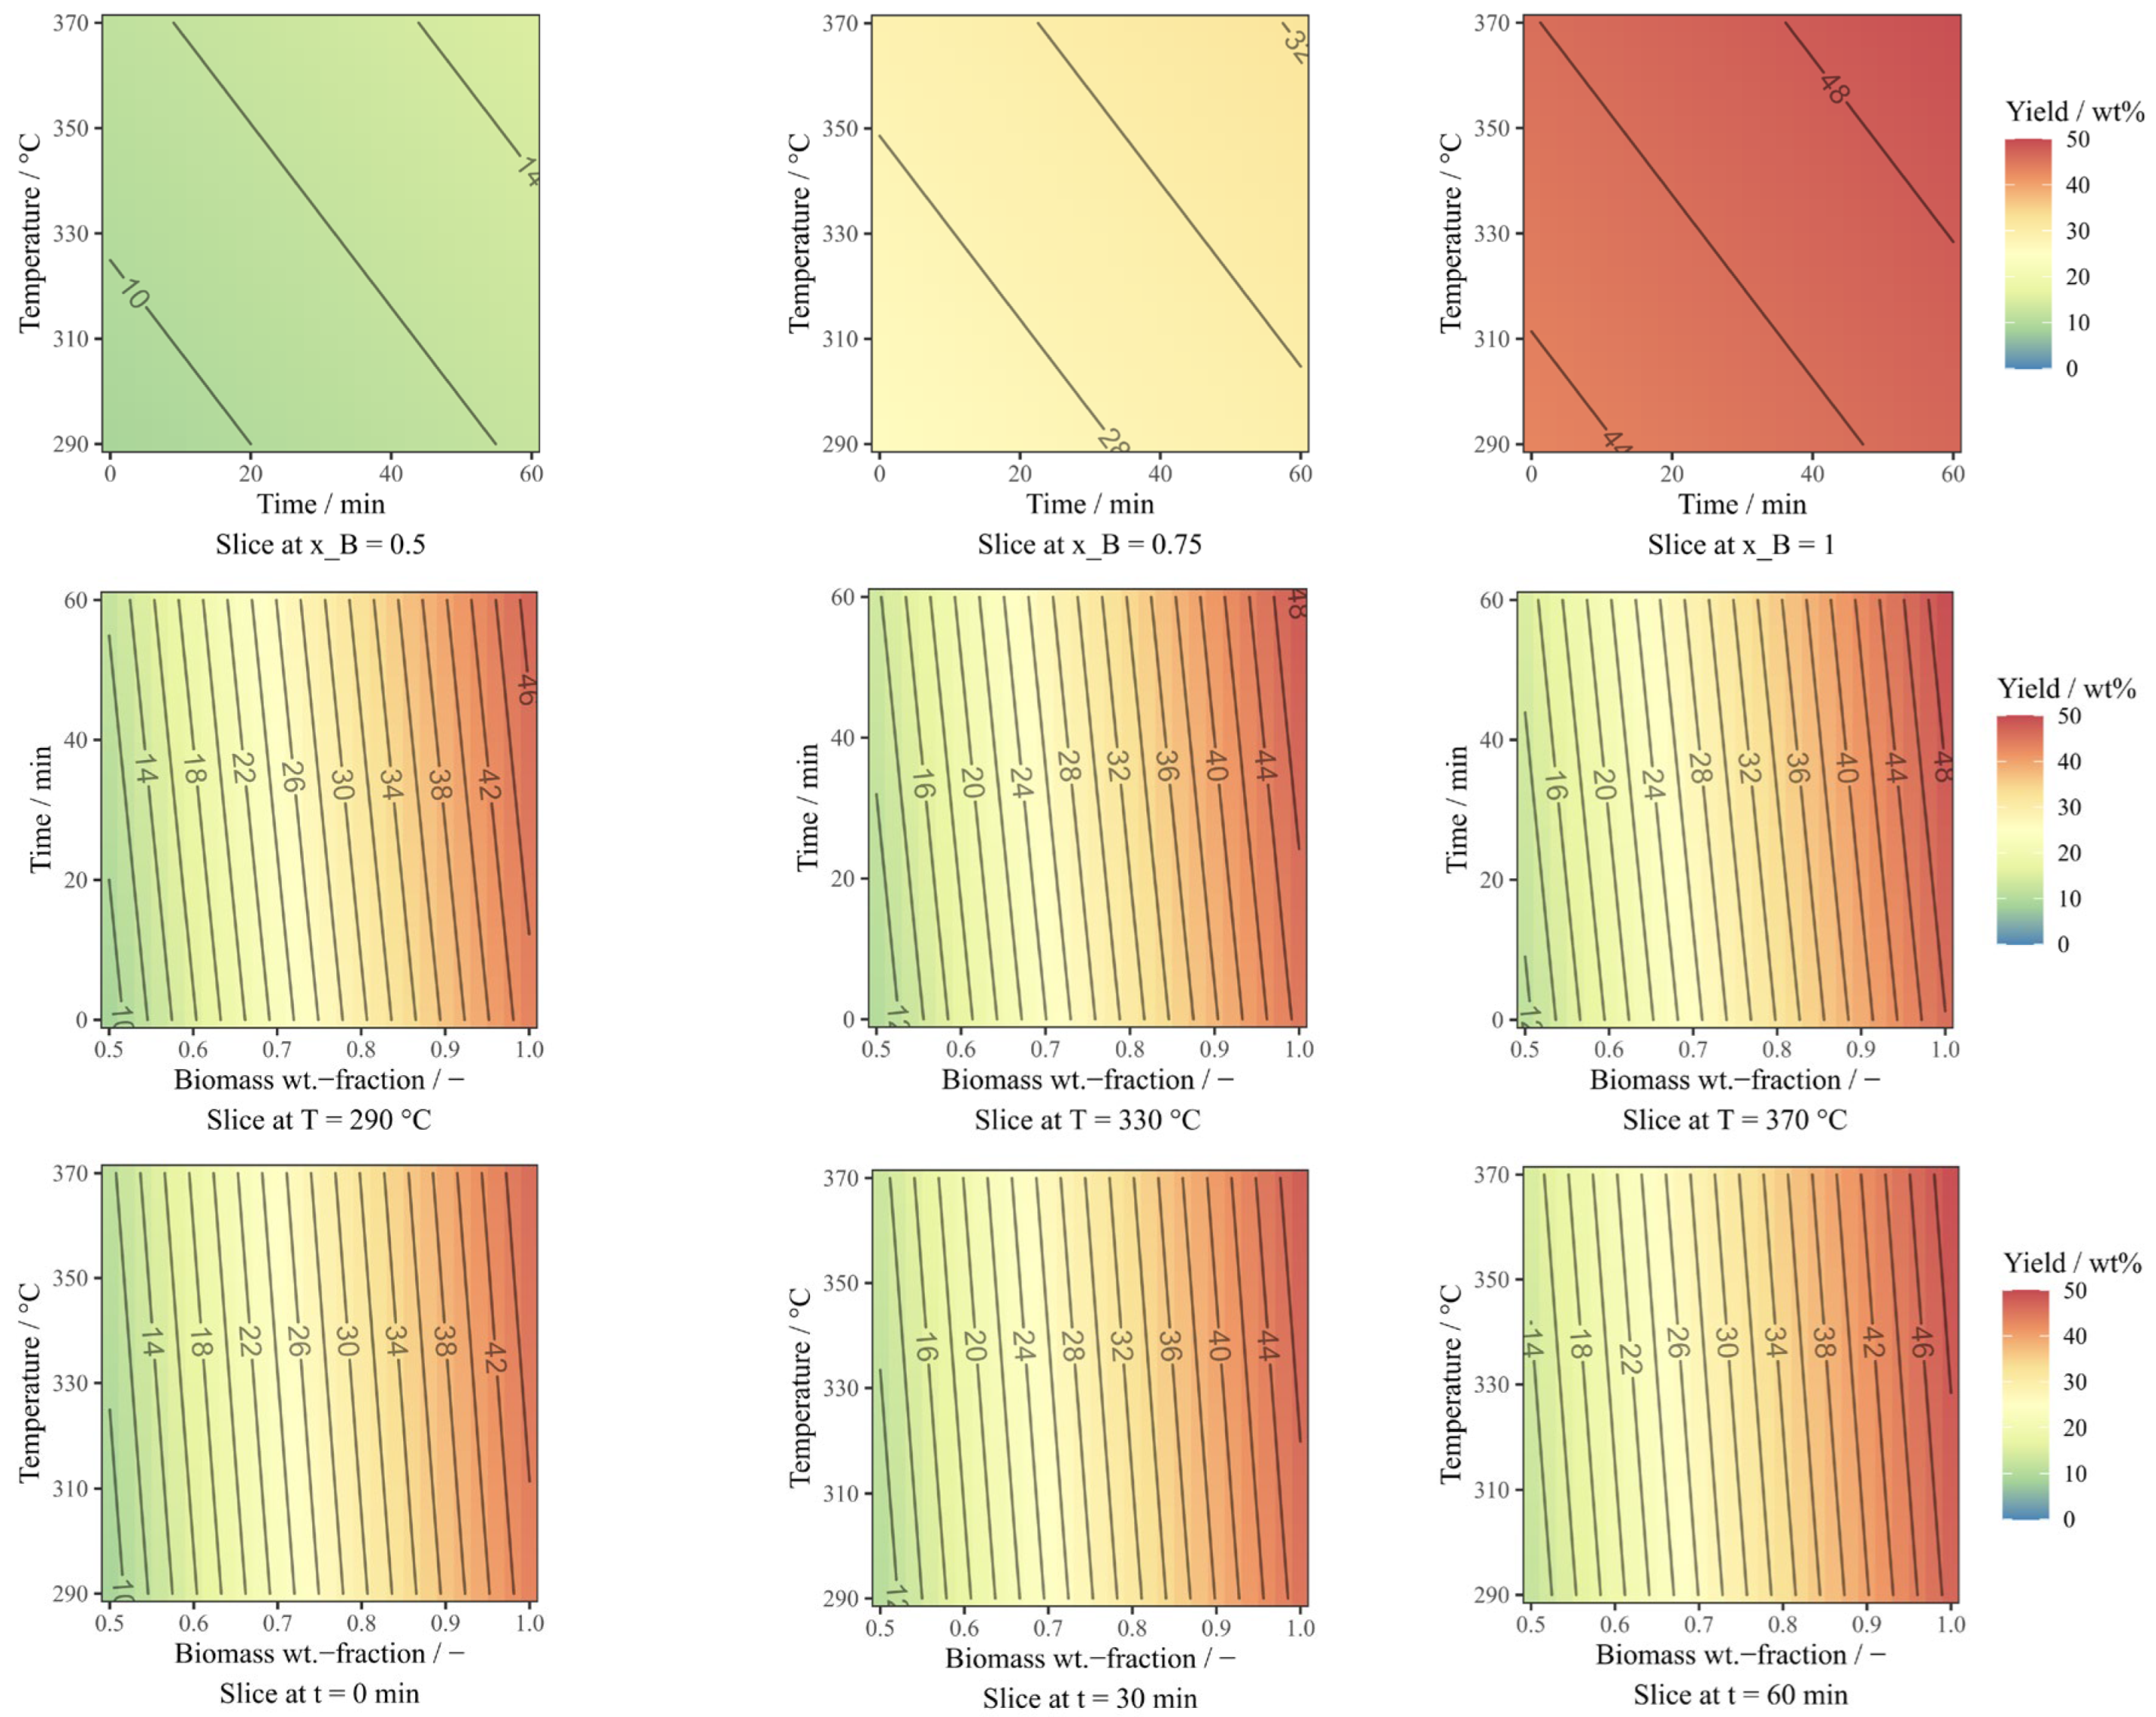
3.1.1. Bio-oil Yield Model

The biocrude mass yield is well described by a linear RSM model with R-squared of 94%, highly significant predictors, and no significant lack of fit. The following correlation function for biocrude mass yield was found:
Y i e l d / w t % = 29.11 + 1.315   x 1 + 1.72   x 2 + 17.222   x 3
where Y is the biocrude mass yield, x 1 , x 2 , and x 3 correspond to the predictors temperature, time, and biomass weight fraction, respectively, and take values from −1 to 1, corresponding to the factor settings defined in Table 2. While a second-order model increases R-squared, it adds more complexity to the model with little additional information and, therefore, was not considered. Analysis of variance for the biocrude yield model can be found in the Supplementary Information.
The model shows the biomass weight fraction to be the sole, highly significant predictor for biocrude mass yield. The influence of both temperature and time are small. The system response is visualized as contour plots (see Figure 3), with the respective factor settings on x and y axes. In the figures, the design space is cut in the three directions of space, leaving one variable constant and showing biocrude yield as contours. The same behavior as described above can be observed, where the influence of temperature and time are only faint and the biocrude mass yield dominates the response.

3.1.2. Energy Yield and Energy Recovery Model

A similar investigation of the system was performed for energy yield and energy recovery. Energy yield models show little dependence on the used predictors. In the context of biocrude mass yield results, this seems logical. With the amount of biocrude mostly varying with biomass weight fraction, most produced biocrude seems to originate from the biomass in the feedstock. As the biomass fraction heating value is constant and exhibits little apparent interaction with plastics, a roughly constant biocrude heating value is expected.
On the other hand, energy recovery can be well described by a linear RSM model such as the mass yield model shown above:
E R / % = 41.8 + 1.95   x 1 + 2.91   x 2 + 30.82   x 3
where ER is energy recovery and x 1 , x 2 , and x 3 again correspond to the factors temperature, time, and biomass weight fraction. As before for biocrude yield, the ER responds strongly to the used biomass weight fraction. Given the definition of energy recovery (Equation (2)) as a function of mass yield, this observation makes sense.

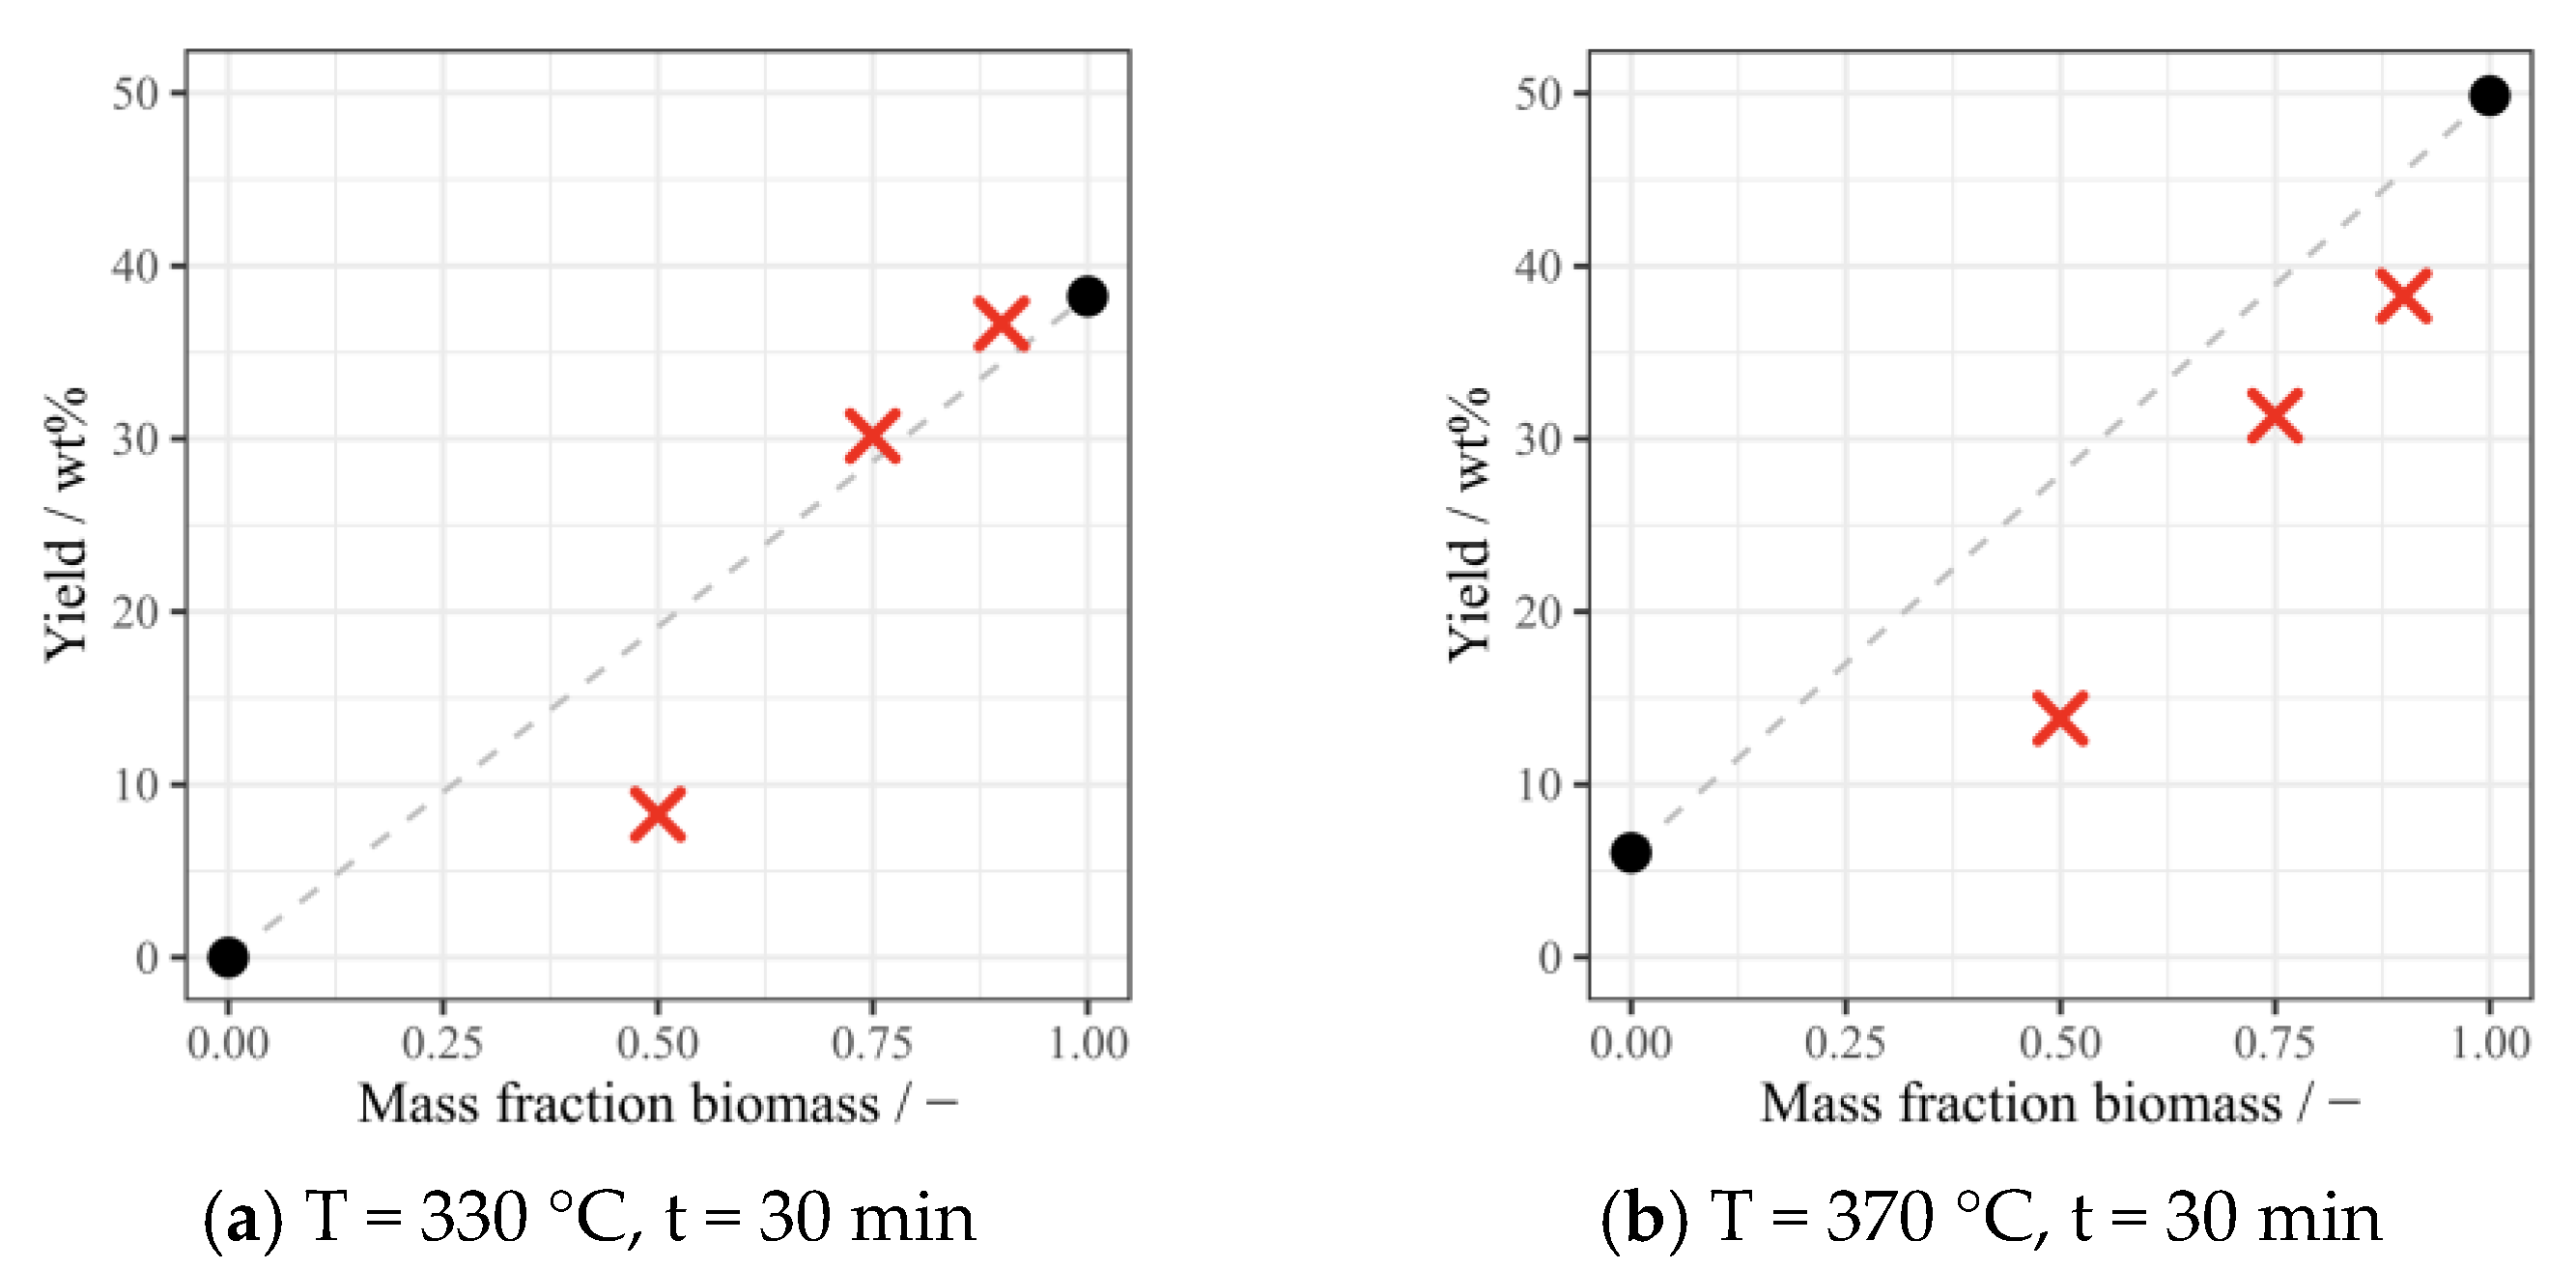
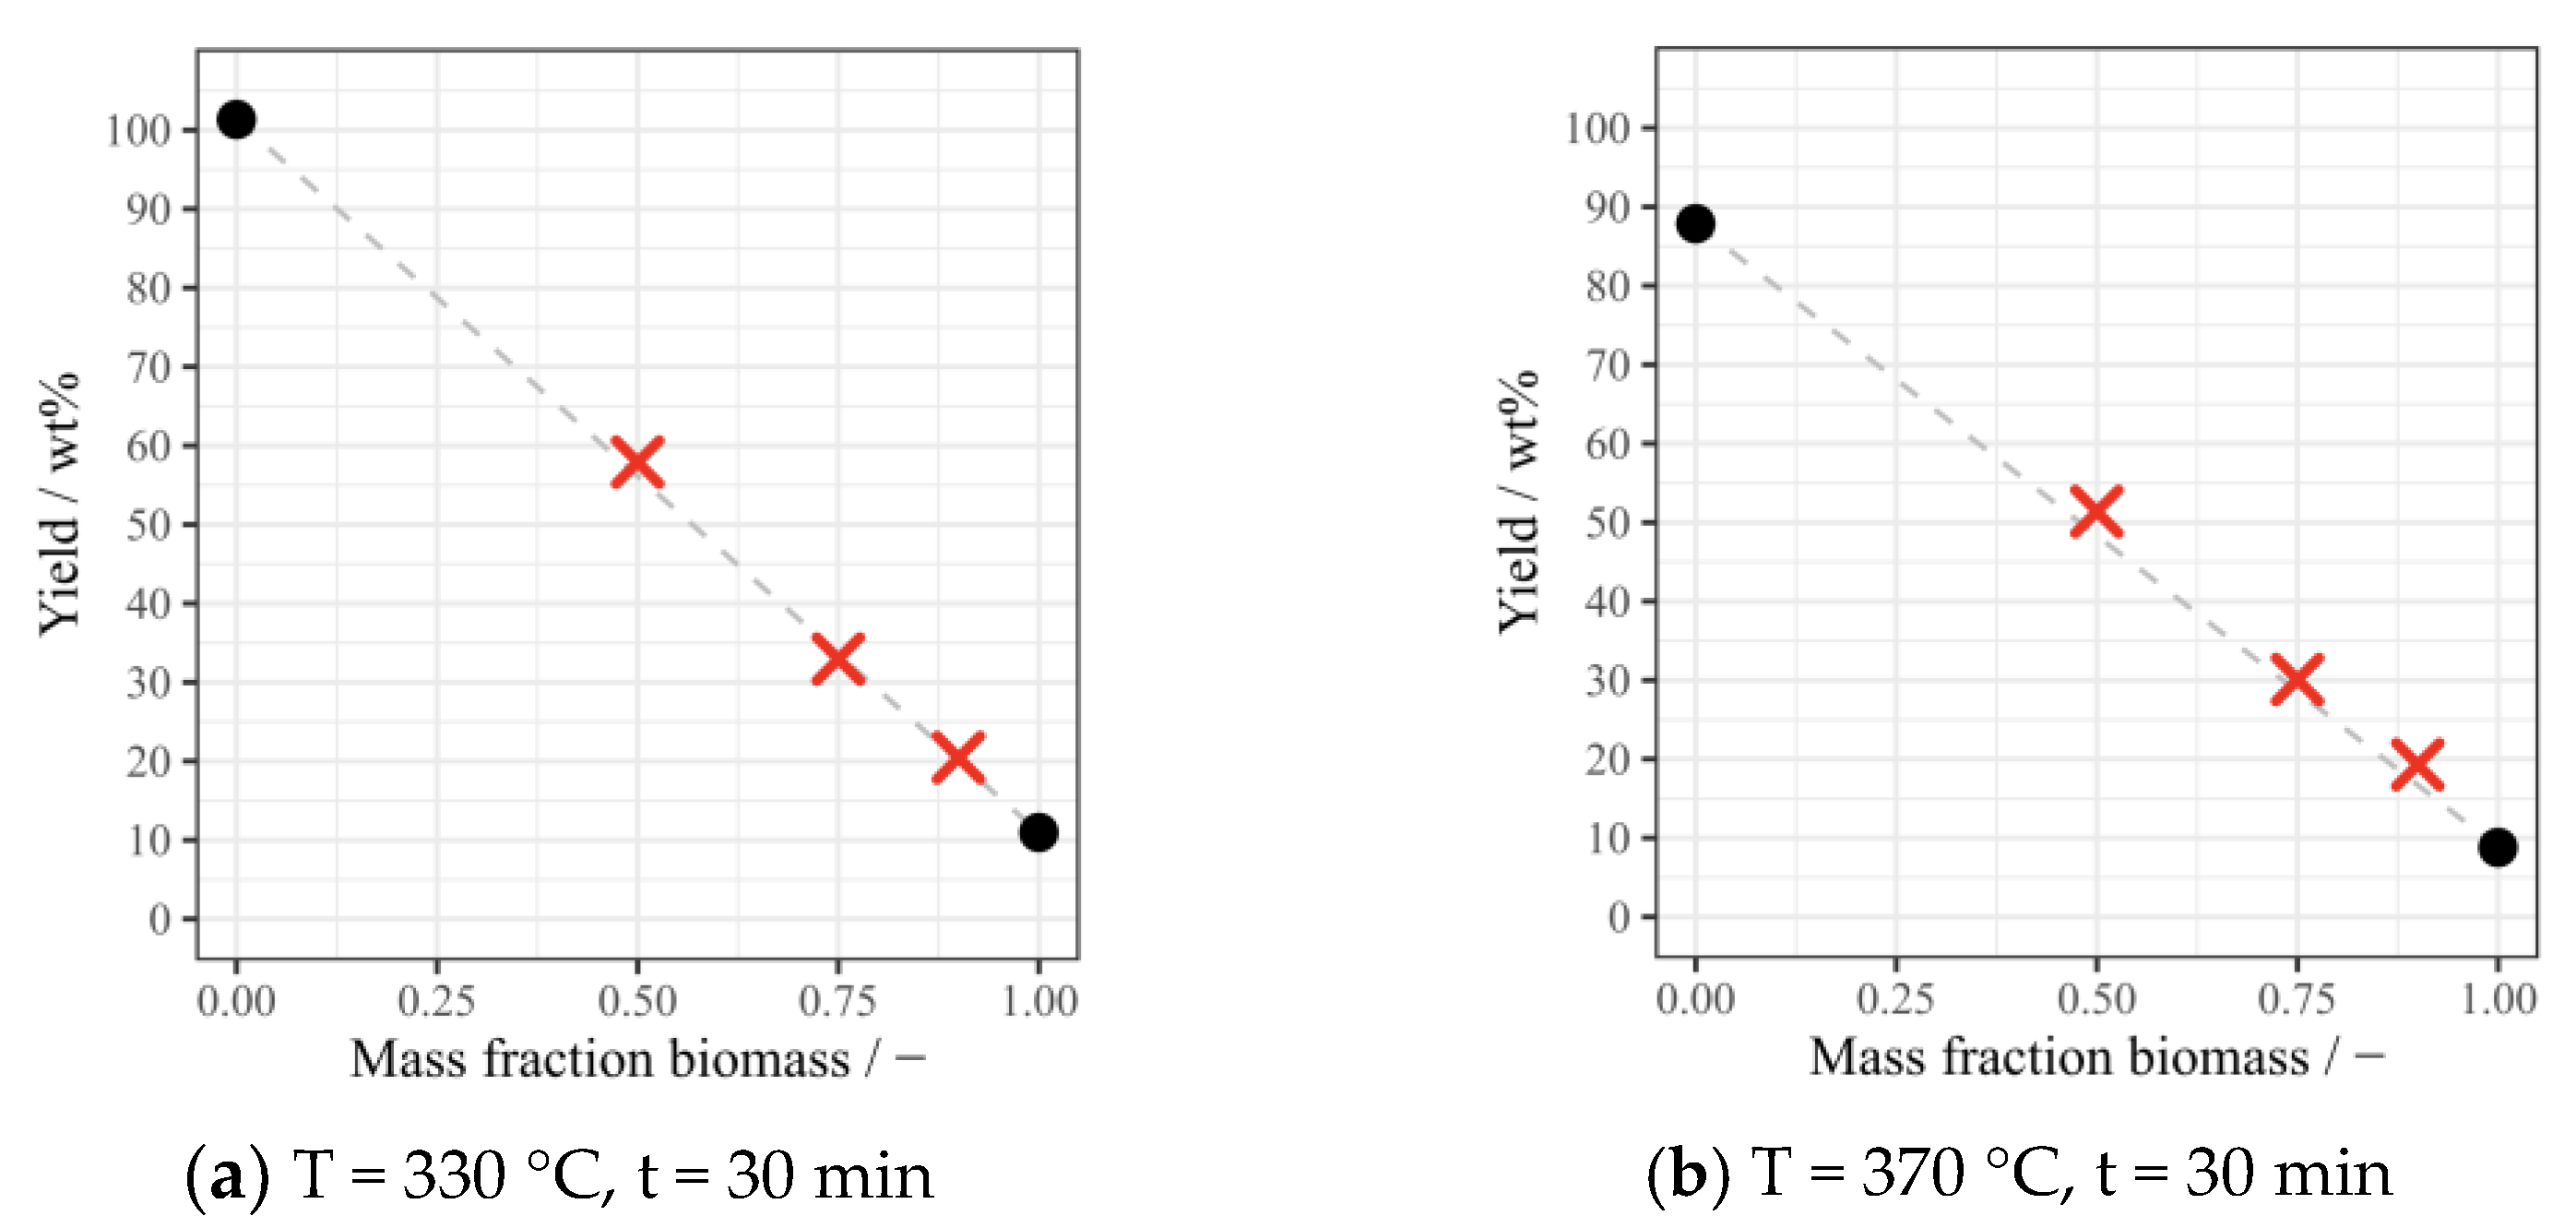
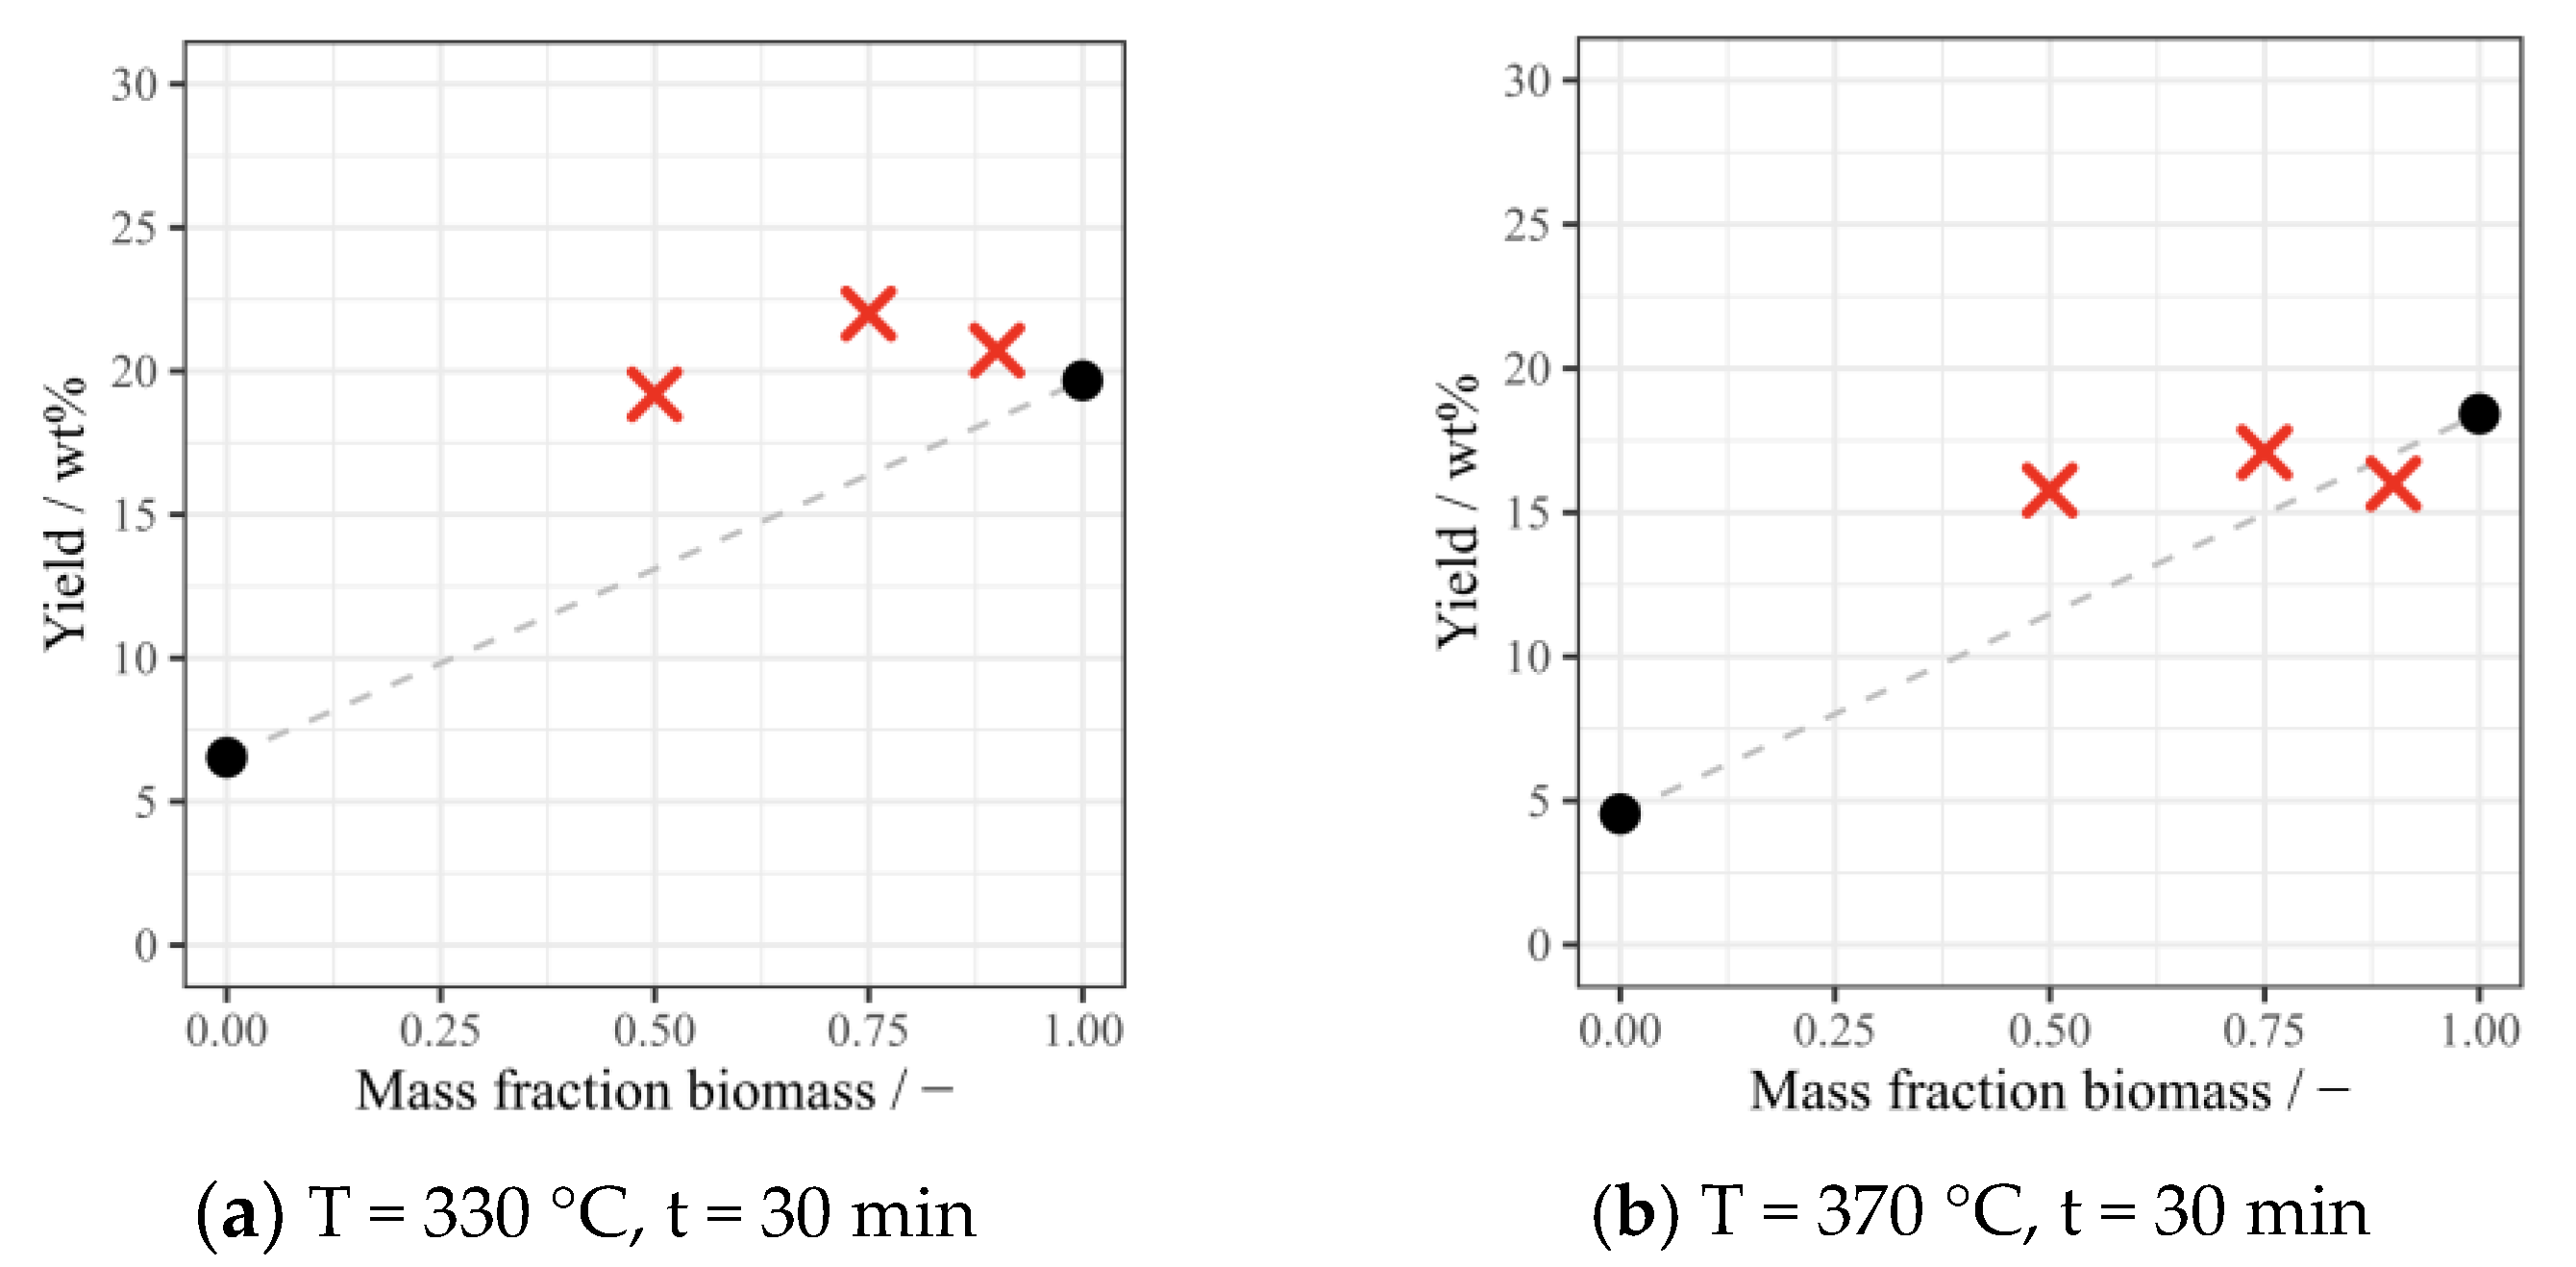
3.2. Yields of Bio-Oil and Solid Residue under Different Conditions

With experimental data available (see Table 3), the dependence of biocrude yields can be discussed. The largest biocrude yield of 51.9 wt% and the highest energy recovery of ER = 86.2 % were observed in run 9 at T = 370   ° C , t = 60   m i n , and a biomass weight fraction of x B = 1 . As showcased above, the studied system showed an overwhelming response to the used plastic fraction/biomass weight fraction where every addition of plastic reduced the produced biocrude. As such, in run 7 at x B = 1 , high biocrude yields of 50.1 wt% were also observed at T = 290   ° C , t = 0   m i n . At x B = 0.75 , however, biocrude yields decreased significantly to around 35 wt% (e.g., runs 10–15).
Initial experiments separate from the conducted experimental design showed that addition of plastic can in fact result in disproportionately reduced biocrude yields. The solid product phase showed the opposite response. Likely, most used plastics transferred into the solid phase with limited interaction with other feedstock components and thus little decomposition. In the studied temperature interval, the effect of temperature on the system was limited. A slight dependence of temperature was visible, where higher temperatures favored larger biocrude yields. This influence was, however, overshadowed by the strong response of the system to the feedstock biomass fraction. The same is true for the studied reaction time. Although a slight influence of reaction time was observed, where longer reaction times led to increased biocrude yields, the effect was small compared to the impact of feedstock composition.

3.3. Chemical Characterization of Selected Results

All four product phases were collected and analyzed. Analyses of selected results are presented in this section.

3.3.1. Biocrude Phase
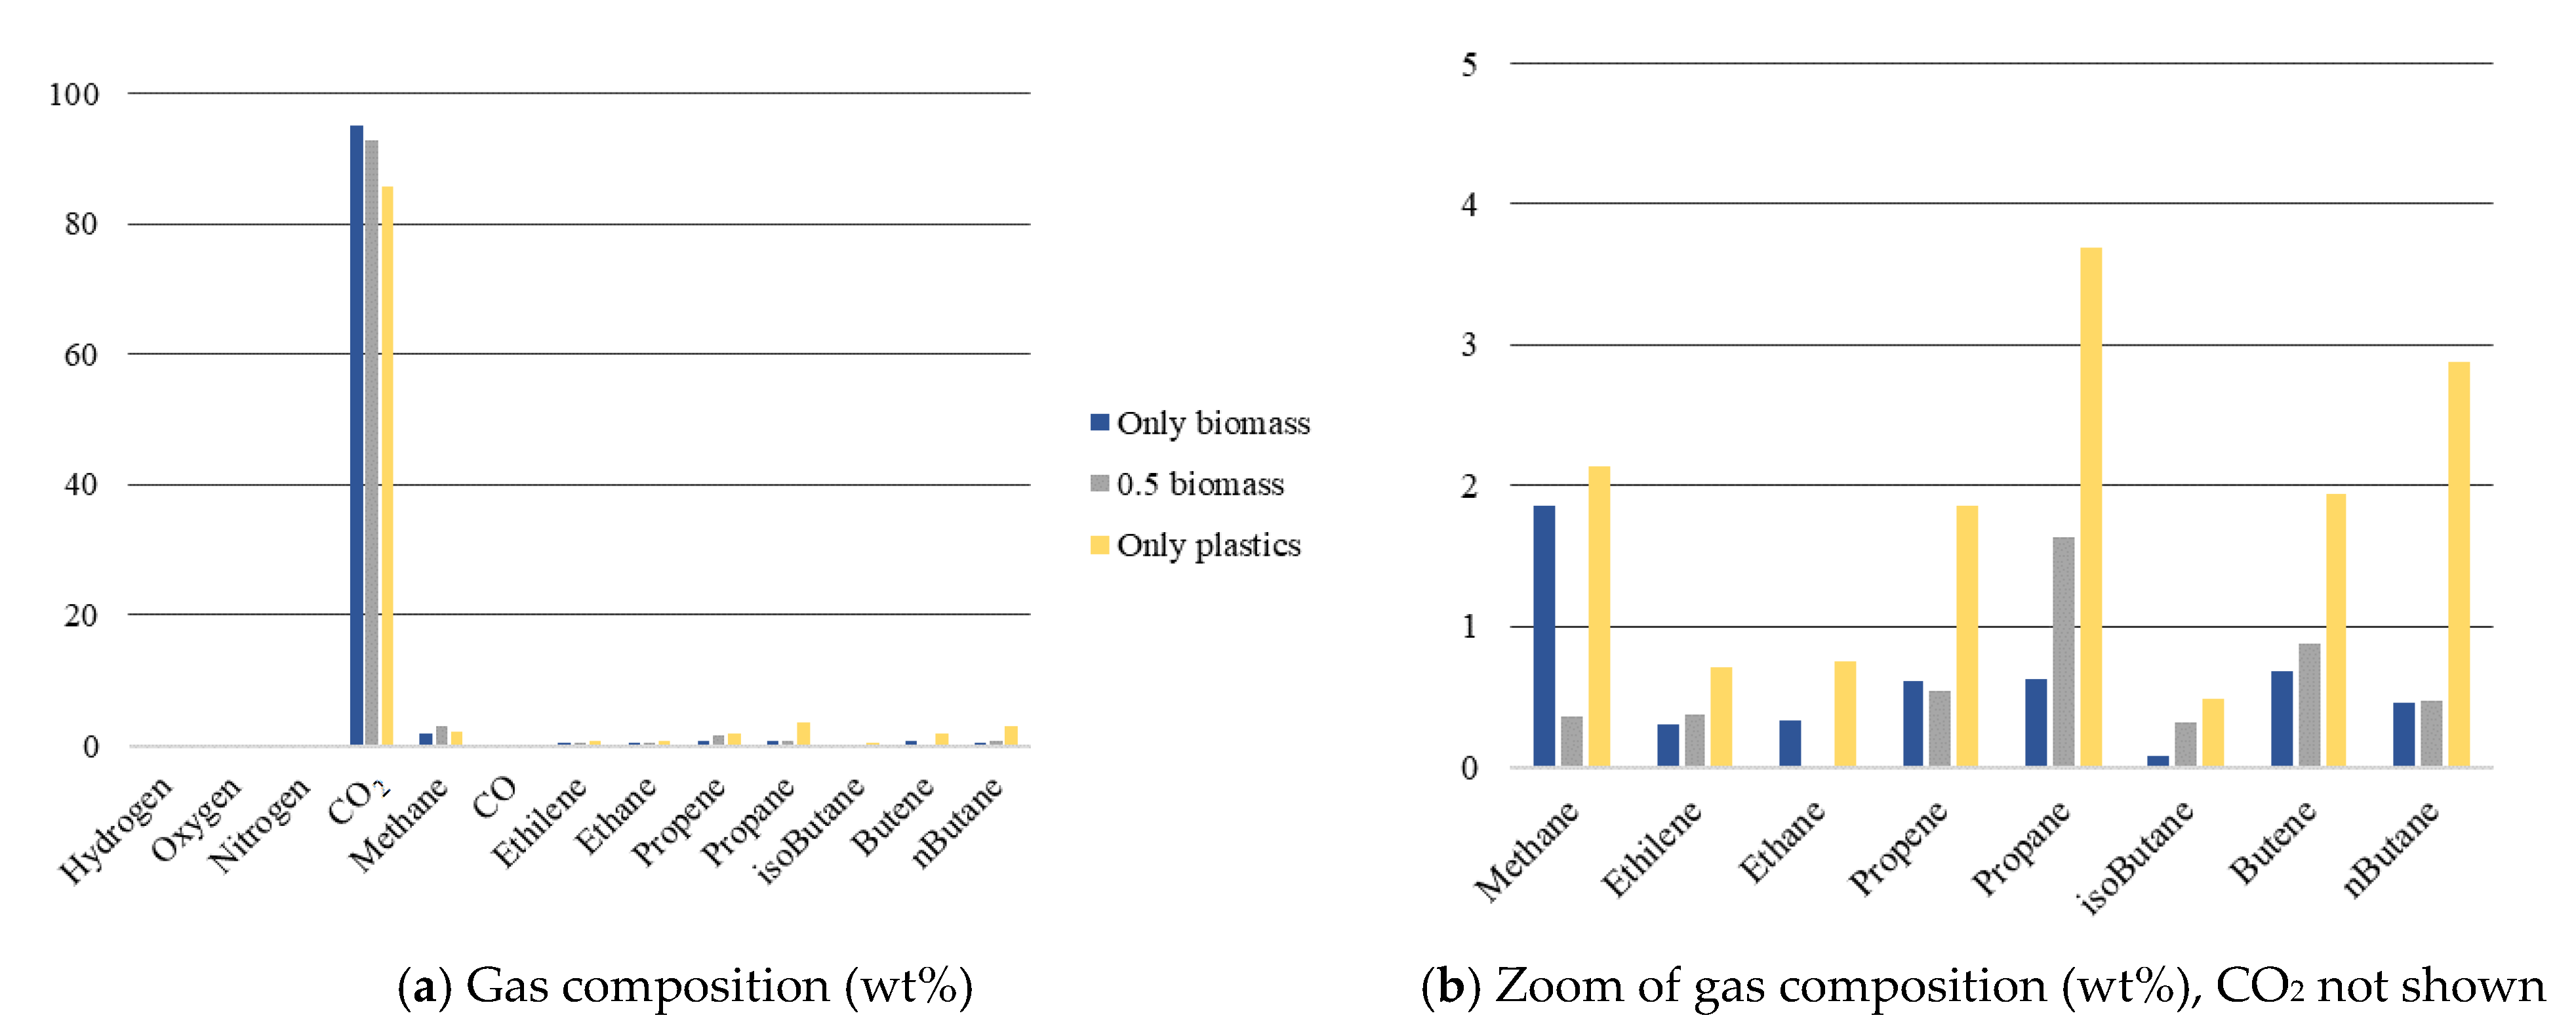
The biocrude compositions resulting from the analysis were similar for all performed experiments containing biomass. This was likely caused by the observed limited decomposition of plastics. As such, the biocrude mostly originated from feedstock biomass. To still visualize possible effects of feedstock composition, runs with opposite feedstock composition are discussed. Table 4 shows the most abundant compounds in liquefaction of biomass only, whereas Table 5 shows compounds from liquefaction of plastics alone. Please note that, for plastics liquefaction, the maximum possible temperature of 370 °C was used, as otherwise too little product would be created for analysis. The reported percentages in the shown tables are not absolute, but correspond to the chromatogram area of the peak of each substance relative to the chromatogram area of all identified species. Therefore, they are only an approximation of the fraction actually present.
As it can be seen from Table 4, the most frequently occurring substance groups in HTL from biomass only were fatty acids and amides. By far, the most prevalent compounds were linoleic, oleic, and palmitic acid, likely originating from lipids in the feedstock that contain triglycerides [33]. Therefore, the cracking of triglyceride was likely the most dominant biocrude formation mechanism. In this way, fatty acids found in GCMS analysis might have already been present in the feedstock as triglyceride. As amides contain nitrogen, they cannot be formed only from the cracking of triglyceride. Instead, one reaction path can be the cracking of triglyceride and the reaction of a fatty acid with an amino acid from the protein present in the feedstock. The amino group of the amino acid would transfer to the end of e.g., oleic acid, replacing its OH-group and forming 9-octadecenamide. This reaction pathway is described in the literature, e.g., by Savage [34].
To determine biocrude compounds created from HTL of plastics, one trial was performed only using plastics. The most frequently occurring substances are listed in Table 5. Interestingly, the product spectrum is much wider than for the biocrude sample originating from biomass only. As it can be seen in the table, now mostly alkanes and polycyclic aromatic hydrocarbons are present. The most abundant compound was diphenylpropane, but it made up only around 5% of the total detected substances. Zhao et al. [35] found this compound to be the main product from HTL of high-impact PS, a copolymer of butadiene and styrene monomers.
Styrene monomers contain a benzene ring with a vinyl group (-CH=CH2). Zhao et al. [35] proposed a mixture of zip depolymerization and random chain braking as decomposition mechanism for PS. The latter can explain the observed large biocrude product spectrum. Also observed by Zhao et al. [35], 2-phenylnaphtalene could be caused by a similar reaction mechanism to the above: the cracking of polystyrene polymer into diphenylpropane and the fusion of a phenyl radical that emerges from styrene monomer with cracked C–C bond. Similar reactions pathways might lead to the formation of dihydro-cyclo-penta-phenanthrene and 1,3-diphenyl-1-butene.
The straight-chain hydrocarbons present could originate from PP. Su et al. [36] found straight-chain alkanes among straight-chain alkenes and cycloparaffins as main decomposition products from HTL of PP. Of the two samples with opposing feedstock compositions, additionally, elemental and heating value analyses were conducted and are displayed in Table 6.
As it can be seen in the table, there are noticeable differences between the two samples. The sample from biomass only contained a large fraction of ash and oxygen. Exact oxygen amounts were not tested, but deoxygenation will certainly be required as observed fatty acids contained significant amounts of oxygen (see Table 4). With 3 wt% nitrogen, denitrogenation is required as well. Biocrude from plastics only, on the other hand, contained higher amounts of carbon and possessed a correspondingly higher HHV.

3.3.2. Gas Phase

The gas phase composition showed little effect of changing feedstock composition and operating conditions. GC analyses of three different runs, using only biomass in the feedstock, using 50 wt% of biomass, and using only plastics, are shown in Figure 4. As it can be seen, the found gas phase results show roughly similar compositions, consisting mostly of CO2 (85–95 wt% depending on feedstock composition). Differences based on the feedstock become visible when zooming in on all compounds. Generally, liquefaction of plastic seems to lead to increased quantity of alkanes in the gas phase compared to liquefaction of pure biomass. All measured gas phase data can be found in the Supplementary Information.

3.3.3. Aqueous Phase

To show the maximum effect of the feedstock composition on the aqueous phase, two opposing runs are shown, using only biomass as feedstock, and using only plastics. The found results are displayed in Table 7. As it can be seen in the table, the composition of the two shown samples varied largely. The sample from only plastics showed fewer organic compounds; however, formic acid was present at a higher concentration than in the sample from only biomass.
For only biomass, mostly glycerol, likely from decomposition of triglyceride, and acetic acid were present. Also, sugars were present that could have originated from random cracking of cellulose. All performed HPLC results can be found in the Supplementary Information.

3.3.4. Solid Phase

As it has been shown, the solid phase yield is a strong function of the feedstock composition, as large parts of the plastic fraction were seemingly unaffected by the process and retained some of their initial properties. Feedstock plastic fraction and solid phase are therefore directly correlated. Seemingly unaffected material was analyzed separately from the remaining solid phase by using elemental analysis compliant with ISO 16948. Heating values were estimated using the Dulong formula (Equation (3)). Again, due to a lack of ash measurements, oxygen and ash were assumed to be present in equal amounts. One experimental trial (T2) is shown in Table 8, where a large piece of plastic remained in the reactor after the trial. For this sample, separate analysis from the rest of the produced solid phase was conducted. In the table, the results are compared with an experimental trial using only biomass (T8).
As it can be seen, the composition and heating value of sample “T2-unconverted” differ highly from those of other shown samples, supporting the observation that the solid phase is not one uniform fraction. The HHV of the material labeled as “unconverted” is in good agreement with the single plastic original HHVs presented in Table 1.

3.4. Discussion

In this study, HTL experiments were conducted on a mixture of biomass and different plastics. The highest biocrude yields were observed at the edge of the studied factor space, using only biomass as feedstock. No synergistic effects between biomass and plastics were observed, opposing the results found in the literature: authors such as Seshasayee and Savage [14] reported significant synergies between different biomolecules, different single plastics, and mixtures of both. The strongest synergies for biomass–multi-plastic combinations were observed for the biomolecule cellulose, starch, and lignin. For protein–multi-plastic mixtures, synergistic effects were less strong and turned into slightly antagonistic interactions when stearic acid was involved. As reported by Seshasayee and Savage [14], a reason for decreasing synergy is the high temperature stability of fatty acids.
At 30.6 wt% (dry base), the biomass used in this work contains a significant fraction of lipids that result in the high fraction of fatty acids in the produced biocrude. As fatty acids are not broken down further under the studied reaction conditions, there is little room for interactions with plastics in the feedstock, causing little decomposition and low yields. Therefore, low oil yields may not only be a result of the high temperature stability of the chosen plastics, but also a result of the high temperature stability of used biomass compounds: using a different biomass composition, Seshasayee and Savage [14] observed the largest biomass/plastic co-liquefaction biocrude yield and highest synergy at 300 °C already, a temperature at which, in separate HTL of the reactants, only low amounts of biocrude are produced. Apart from this, the plastic fraction used by Seshasayee and Savage [14] is more prone to breakdown by itself: polycarbonate and polystyrene make up half of the used polymers and show large conversion to biocrude at 300 °C already. In the present work, likely products from polystyrene decomposition such as the polycyclic aromatic diphenylpropane were found in the biocrude. However, instead of polycarbonate, polyethylene was present in the used plastic fraction, a polymer that is highly resistant to breakdown [37].
While the above leads to low biocrude yields, it does not yet explain the observed negative synergies, i.e., that less biocrude resulted from co-liquefaction experiments than expected from separate HTL. This behavior was easily observable in experiments prior to conducting the presented experimental design. Bio-oil yields from co-liquefaction showed synergies of up to −57%, i.e., biocrude yields of the mixture were less than half of what would be anticipated if no interactions between the components occurred (see Figure 5). In the figures, the black dots present biocrude yields at 0/1 mass fraction biomass while biocrude yields of co-liquefaction are presented by red crosses.
A hypothesis to explain this behavior could be that, in the reactive environment, interactions between biomass and plastics do occur. However, due to extensive reaction time and/or heating periods, secondary reactions and repolymerization of intermediates might take place, leading to the formation of products in solid or aqueous phase, at the expense of lower biocrude yields. The dependence of occurrence of secondary reactions on heating rates is discussed, for example, by Akhtar and Amin [38].
Transfer of compounds to the solid phase would be visible in the solid phase mass yield. Figure 6 shows expected and observed yields for the solid phase at different biomass weight fractions. As it can be seen, expected and observed yields correlate well, showing no extra production of solids as a result of biomass–plastic interactions. The addition of plastics must have, therefore, contributed to higher yields in other phases, namely gas or aqueous phase. Due to the used measurement methods, these phases likely show larger error margins. This can also be deduced by the poor fits of RSM models to both the gas and the aqueous phase. Transfer of plastic compounds to these phases could therefore be overlooked when only considering the product’s mass yields.
Figure 7 shows expected and observed yields in the aqueous phase. Here, observed yields are mostly larger than expected yields. The data suggest that increased feedstock plastic fractions could lead to disproportionate transfer of matter to the aqueous phase, correlating with the disproportionate decrease in bio-oil yields.
The conducted HPLC results should reflect this observation. Looking at all HPLC samples (see Supplementary Information), however, it is difficult to confirm the trend, as analysis was hindered by the limited number of detected compounds. Additionally, the impact of experimental error due to the aqueous phase measurement method is unclear. Therefore, to further explore the phenomena, more analyses are required.
Based on the presented results, however, it becomes clear that the shown process for biocrude production from restaurant waste does not lead to envisioned high yields and synergistic interactions. As the highest yields were found using only the organic restaurant waste fraction, this would require extensive sorting, nullifying one main advantage of HTL co-liquefaction.
Still, the presented process could be of use for some specific scenarios. E.g., mixed restaurant waste streams could be treated, converting contained biomass into biocrude and, at the same time, using the process as an effective means of separating contained plastic. The aqueous phase could be recycled in a continuous process or valorized, e.g., to recover platform chemicals [9].
Lower temperatures could possibly be used to still lead to a high conversion of the used biomass, with even more of the plastics acting inert. These plastics could then be treated using another chemical-recycling approach such as pyrolysis as the second step. Seshasayee and Savage [14] suggest another two-step approach where subcritical HTL is used in a first step to recover monomers from plastics that are susceptible to hydrolysis (here: polystyrene) and then use a second, supercritical step to treat other polymers. Of course, both approaches need more investigation and analyses, especially regarding the energy penalty of heating and cooling the contained inert plastics.

4. Conclusions

In the present work, HTL was performed on feedstock resembling restaurant waste. The waste was made up from biomass containing food waste and paper, and four different plastics. Authors in the literature found synergistic interactions between biomolecules and plastics in HTL that increased biocrude yields. To assess the existence of interactions, experiments with varying composition (xB = 0.5–1), temperature (T = 290–370 °C,) and time (t = 30–60 min) were prepared and conducted using design of experiment. The biocrude yield was found to depend mostly on the feedstock biomass fraction where maximum yields of around 50 wt% and energy recoveries of ~86% were observed. However, no synergistic interactions were found for the studied system, but rather antagonistic interactions.
Analyses of the created product phases by GC (gas phase), GCMS (biocrude phase), and HPLC (aqueous phase) and, where applicable, proximate and ultimate analysis were performed on most products. GCMS analysis of the biocrude from only biomass shows it consists mostly of fatty acids such linoleic, oleic, and palmitic acid, likely originating from triglycerides in the feedstock. The high thermal stability of fatty acids below 400 °C offers little points for interaction with plastics, leading to the low observed decomposition. Negative synergies, i.e., biocrude yields in co-liquefaction being lower than in separate HTL are expected to be caused by transfer of mass to the solid phase. The hypothesis, however, is refuted, as expected and observed solid phase yields coincide. While observed aqueous phase yields are larger than expected, HPLC results only partly support the finding. Additionally, the experimental accuracy of aqueous phase mass yields is questionable.
Nevertheless, ways were presented in which the presented HTL process could be used as a first step for waste valorization in combination with a second thermochemical conversion process.
Further research could include an intensified search for antagonistic effects, e.g., by conducting relevant experiments in triplicates to determine the experimental error. Biocrude compounds that are not volatilized until 300 °C for GCMS could be detected by conducting thermogravimetric analysis. Furthermore, additional solid phase analysis such as inductively coupled plasma mass spectrometry could be conducted to assess plastic residue and possible applications.

Supplementary Materials

The following supporting information can be downloaded at: https://www.mdpi.com/article/10.3390/en17092098/s1, Table S1: Comparison of measured and calculated heating values; Table S2: Analysis of Variance for biooil yield model; Table S3: GC results of experimental trials; Table S4: HPLC results of experimental trials.

Author Contributions

S.F.—Conceptualization, methodology, investigation, formal analysis, writing—original draft. S.S.T.—Conceptualization, methodology, supervision, writing—review & editing. P.A.C.—Investigation, supervision, writing—review & editing). Filipe Paradela (Methodology, investigation. P.A.A.S.M.—Investigation. D.C.—Conceptualization, methodology, supervision, writing—review & editing. All authors have read and agreed to the published version of the manuscript.

Funding

This research received no external funding.

Data Availability Statement

The original contributions presented in the study are included in the article, further inquiries can be directed to the corresponding author.

Acknowledgments

We thank LNEG—Laboratório Nacional de Energia e Geologia Estrada do Paço do Lumiar 22, 1649-038 Lisboa, Portugal for providing laboratory facilities for conducting experiments and analyses.

Conflicts of Interest

The authors declare no conflict of interest.

References

  1. UNFCCC. Paris Agreement; United Nations Framework Convention on Climate Change: Paris, France, 2015. [Google Scholar]
  2. WMO. State of the Global Climate 2023; World Meteorological Organization: Geneva, Switzerland, 2024; p. 53. [Google Scholar]
  3. IEA. World Energy Outlook 2023; International Energy Agency: Paris, France, 2023. [Google Scholar]
  4. Kaza, S.; Yao, L.; Bhada-Tata, P.; Van Woerden, F.; lonkova, K.; Morton, J.; Poveda, R.A.; Sarraf, M.; Malkawi, F.; Harinath, A.S.; et al. What a Waste 2.0: A Global Snapshot of Solid Waste Management to 2050; Urban Development Series; World Bank Group: Washington, DC, USA, 2018; ISBN 978-1-4648-1347-4. [Google Scholar]
  5. Agência Portuguesa do Ambiente. Relatório Anual Resíduos Urbanos 2021; Agência Portuguesa do Ambiente: Amadora, Portugal, 2022. [Google Scholar]
  6. Woidasky, J. Plastics Recycling. In Ullmann’s Encyclopedia of Industrial Chemistry; John Wiley & Sons, Ltd.: London, UK, 2020; pp. 1–29. ISBN 978-3-527-30673-2. [Google Scholar]
  7. Kruse, A.; Dahmen, N. Water—A Magic Solvent for Biomass Conversion. J. Supercrit. Fluids 2015, 96, 36–45. [Google Scholar] [CrossRef]
  8. Castello, D.; Pedersen, T.H.; Rosendahl, L.A. Continuous Hydrothermal Liquefaction of Biomass: A Critical Review. Energies 2018, 11, 3165. [Google Scholar] [CrossRef]
  9. Swetha, A.; ShriVigneshwar, S.; Gopinath, K.P.; Sivaramakrishnan, R.; Shanmuganathan, R.; Arun, J. Review on Hydrothermal Liquefaction Aqueous Phase as a Valuable Resource for Biofuels, Bio-Hydrogen and Valuable Bio-Chemicals Recovery. Chemosphere 2021, 283, 131248. [Google Scholar] [CrossRef] [PubMed]
  10. Khosravi, A.; Zheng, H.; Liu, Q.; Hashemi, M.; Tang, Y.; Xing, B. Production and Characterization of Hydrochars and Their Application in Soil Improvement and Environmental Remediation. Chem. Eng. J. 2022, 430, 133142. [Google Scholar] [CrossRef]
  11. Sharypov, V.I.; Marin, N.; Beregovtsova, N.G.; Baryshnikov, S.V.; Kuznetsov, B.N.; Cebolla, V.L.; Weber, J.V. Co-Pyrolysis of Wood Biomass and Synthetic Polymer Mixtures. Part I: Influence of Experimental Conditions on the Evolution of Solids, Liquids and Gases. J. Anal. Appl. Pyrolysis 2002, 64, 15–28. [Google Scholar] [CrossRef]
  12. Yuan, X.; Cao, H.; Li, H.; Zeng, G.; Tong, J.; Wang, L. Quantitative and Qualitative Analysis of Products Formed during Co-Liquefaction of Biomass and Synthetic Polymer Mixtures in Sub- and Supercritical Water. Fuel Process. Technol. 2009, 90, 428–434. [Google Scholar] [CrossRef]
  13. Seshasayee, M.S.; Savage, P.E. Oil from Plastic via Hydrothermal Liquefaction: Production and Characterization. Appl. Energy 2020, 278, 115673. [Google Scholar] [CrossRef]
  14. Seshasayee, M.S.; Savage, P.E. Synergistic Interactions during Hydrothermal Liquefaction of Plastics and Biomolecules. Chem. Eng. J. 2021, 417, 129268. [Google Scholar] [CrossRef]
  15. Dahlbo, H.; Poliakova, V.; Mylläri, V.; Sahimaa, O.; Anderson, R. Recycling Potential of Post-Consumer Plastic Packaging Waste in Finland. Waste Manag. 2018, 71, 52–61. [Google Scholar] [CrossRef] [PubMed]
  16. Calero, M.; Martín-Lara, M.; Godoy, V.; Quesada, L.; Martínez, D.; Peula, F.; Soto, J. Characterization of Plastic Materials Present in Municipal Solid Waste: Preliminary Study for Their Mechanical Recycling. Detritus 2018, 4, 104–112. [Google Scholar] [CrossRef]
  17. ISO 18134-3:2015; Solid Biofuels—Determination of Moisture Content—Oven Dry Method—Part 3: Moisture in General Analysis Sample. International Organization for Standardization: Geneva, Switzerland, 2015.
  18. ISO 18122:2015; Solid Biofuels: Determination of Ash Content. International Organization for Standardization: Geneva, Switzerland, 2015.
  19. ISO 18123:2023; Solid Biofuels: Determination of Volatile Matter. International Organization for Standardization: Geneva, Switzerland, 2023.
  20. ISO 16948:2015; Solid Biofuels: Determination of Total Content of Carbon, Hydrogen and Nitrogen. International Organization for Standardization: Geneva, Switzerland, 2015.
  21. SO 18125:2017; Solid Biofuels: Determination of Calorific Value. International Organization for Standardization: Geneva, Switzerland, 2017.
  22. ISO 18134-1:2022; Solid Biofuels, Determination of Moisture Content, Part 1: Reference Method. International Organization for Standardization: Geneva, Switzerland, 2022.
  23. ISO 18122:2022; Solid Biofuels: Determination of Ash Content. International Organization for Standardization: Geneva, Switzerland, 2022.
  24. DIN EN 15414-3:2011; Solid Recovered Fuels—Determination of Moisture Content Using the oven Dry Method—Part 3: Moisture in General Analysis Sample. Deutsches Institut für Normung e.V.: Berlin, Germany, 2011.
  25. ISO 1171: 2010; Solid Mineral Fuels: Determination of Ash. International Organization for Standardization: Geneva, Switzerland, 2010.
  26. DIN EN 15402:2011; Solid Recovered Fuels—Determination of the Content of Volatile Matter. Deutsches Institut für Normung e.V.: Berlin, Germany, 2011.
  27. DIN EN15407:2011; Solid Recovered Fuels—Methods for the Determination of Carbon (C), Hydrogen (H) and Nitrogen (N) Content. Deutsches Institut für Normung e.V.: Berlin, Germany, 2011.
  28. DIN EN 15408:2011; Solid Recovered Fuels—Methods for the Determination of Sulphur (S), Chlorine (Cl), Fluorine (F) and Bromine (Br) Content. Deutsches Institut für Normung e.V.: Berlin, Germany, 2011.
  29. DIN EN 15400:2011; Solid biofuels Determination of Calorific Value. Deutsches Institut für Normung e.V.: Berlin, Germany, 2011.
  30. ASTM D 240; Standard Test Method for Heat of Combustion of Liquid Hydrocarbon Fuels by Bomb Calorimeter. ASTM International: West Conshohocken, PA, USA, 2019.
  31. Channiwala, S.A.; Parikh, P.P. A Unified Correlation for Estimating HHV of Solid, Liquid and Gaseous Fuels. Fuel 2002, 81, 1051–1063. [Google Scholar] [CrossRef]
  32. Lenth, R.V. Response-Surface Methods in R, Using Rsm. J. Stat. Soft. 2009, 32, 1–17. [Google Scholar] [CrossRef]
  33. Lehninger, A.L.; Nelson, D.L.; Cox, M.M. Lehninger Principles of Biochemistry, 3rd ed.; Worth Publishers: New York, NY, USA, 2000; ISBN 978-1-57259-153-0. [Google Scholar]
  34. Savage, P.E. Organic Chemical Reactions in Supercritical Water. Chem. Rev. 1999, 99, 603–622. [Google Scholar] [CrossRef] [PubMed]
  35. Zhao, X.; Xia, Y.; Zhan, L.; Xie, B.; Gao, B.; Wang, J. Hydrothermal Treatment of E-Waste Plastics for Tertiary Recycling: Product Slate and Decomposition Mechanisms. ACS Sustain. Chem. Eng. 2019, 7, 1464–1473. [Google Scholar] [CrossRef]
  36. Su, L.; Wu, X.; Liu, X.; Chen, L.; Chen, K.; Hong, S. Effect of Increasing Course of Temperature and Pressure on Polypropylene Degradation in Supercritical Water. Chin. J. Chem. Eng. 2007, 15, 738–741. [Google Scholar] [CrossRef]
  37. Huang, J.B.; Zeng, G.S.; Li, X.S.; Cheng, X.C.; Tong, H. Theoretical Studies on Bond Dissociation Enthalpies for Model Compounds of Typical Plastic Polymers. IOP Conf. Ser. Earth Environ. Sci. 2018, 167, 012029. [Google Scholar] [CrossRef]
  38. Akhtar, J.; Amin, N.A.S. A Review on Process Conditions for Optimum Bio-Oil Yield in Hydrothermal Liquefaction of Biomass. Renew. Sustain. Energy Rev. 2011, 15, 1615–1624. [Google Scholar] [CrossRef]
Figure 1. (a) Dried food waste, (b) shredded food waste, (c) PE, (d) PP, (e) PET, (f) PS.
Energies 17 02098 g001
Figure 2. Scheme of separation procedure.
Energies 17 02098 g002
Figure 3. Contour plots of system response for biocrude mass yield. Each row in the plots represents one factor combination where the response is shown as contour; the third, constant factor takes its respective setting [−1, 0, 1] from left to right.
Energies 17 02098 g003
Figure 4. Gas phase GC result for the run with only biomass (T8), the run with 0.5 biomass (T2), and the run with only plastics (T10).
Energies 17 02098 g004
Figure 5. Observed and expected biocrude yields at T = 330 °C (left) and T = 370 °C (right).
Energies 17 02098 g005
Figure 6. Observed and expected solid phase yields at T = 330 °C (left) and T = 370 °C (right).
Energies 17 02098 g006
Figure 7. Observed and expected aqueous phase yields at T = 330 °C (left) and T = 370 °C (right).
Energies 17 02098 g007
Table 1. Characterization of the feedstocks. * PET data from Calero et al. [16].
FeedstocksMCAsh aVM aFC bC cH cN cO cSClHHV
wt%wt%wt%wt%wt%wt%wt%wt%wt%wt%MJ/kg
Food Waste7.411.574.46.754.48.75.516.840.361.824.11
Paper 8.41.677.812.246.55.00.445.980.120.218.24
LDPE0.20.699.10.185.213.60.300.3n/a45.68
PP 0.11.698.4078.812.20.470.1n/a44.32
PS0.3099.50.286.07.51.64.80.1n/a38.95
PET *0.00.286.013.861.765.620.0132.61n/an/a23.16
Method:
Food waste
ISO 18134-3:
2015 [17]
ISO 18122:
2015 [18]
ISO 18123:
2023 [19]
By differenceISO 16948 [20]By differenceBurning + ion
chromatography
ISO 18125 [21]
Method:
Paper
ISO 18134-1:
2022 [22]
ISO 18122:
2022 [23]
Method: PlasticDIN EN
15414-3:2011 [24]
ISO 1171:
2010 [25]
DIN EN
15402:2011 [26]
DIN EN
15407:2011 [27]
DIN EN
15408:2011 [28]
DIN EN
15400:2011 [29]
a Dry basis (db). b Fixed carbon (FC) = 100 − (MC + Ash + VM). c Dried ash-free basis (daf).
Table 2. Evaluated factors and corresponding levels.
FactorUnitLevels
Temperature°C[290, 330, 370]
Timemin[0 a, 30, 60]
Biomass weight fractionwt.%[0.5, 0.75, 1]
a Time = 0 corresponds to heating up the autoclave to reaction conditions and immediately cooling down again.
Table 4. Main chemical compounds detected in the biocrude from biomass only (T8).
S.No.RTCompoundsRel. Area
110Linoleic acid20.3
210.1Oleic acid20.3
39.2Hexadecanoic/palmitic acid14.6
410.2Octadecanoic/stearic acid6.8
59.1Palmitoleic acid3.3
610.3Hexadecanamide3.2
710.4Heptadecanamide3.0
811.49-Octadecenamide3.0
911.2cis-13-Eicosenoic acid2.3
1010.7Octadecanamide1.8
Total area detected
Table 5. The main chemical compounds detected in the biocrude from plastics (T10).
S.No.RTCompoundsRel. Area
17.9Diphenylpropane5.2
29.3C203.3
38.5C183.3
48.9C193.2
59.42-Phenylnaphtalene3.0
610.0Dihydro-cyclo-pentaphenanthrene2.8
78.0C172.8
88.3Cyclopropane2.7
99.8C212.5
108.61,3-Diphenyl-1-butene2.5
Total area detected
Table 6. Ultimate analysis of biocrude phase (dry basis).
FeedstocksC (%)H (%)N (%)Ash + O (%) bSHHV (MJ/kg) a
Only biomass (T8)72.8610.103.013.74˂0.335.71
Only plastics (T10) 85.0511.54˂0.32.71˂0.441.9
a Calculated by Dulong formula. b By difference.
Table 7. Composition of aqueous phase produced from only biomass and only plastics.
CompoundOnly Biomass (T8), g/LOnly Plastics (T10), g/L
Cellobiose--
Glucose0.4490.133
Xylose0.346-
Arabinose0.756-
Succinic acid0.555-
Lactic acid--
Glycerol7.552-
Formic acid0.4777.185
Acetic acid3.6610.07
Propanoic acid0.286-
Isobutyric acid--
Butyric acid--
Table 8. Ultimate analysis of solid phase of run T2 and T8 (dry basis).
FeedstocksC (%)H (%)N (%)S (%)O + Ash (%)HHV (MJ/kg) aYield (wt%)
T2-unconverted83.3112.530.30.43.4643.751.2
T2-converted49.552.981.920.644.9518.56.7
T8-converted40.134.071.880.453.521611
a Calculated by Dulong formula.
Disclaimer/Publisher’s Note: The statements, opinions and data contained in all publications are solely those of the individual author(s) and contributor(s) and not of MDPI and/or the editor(s). MDPI and/or the editor(s) disclaim responsibility for any injury to people or property resulting from any ideas, methods, instructions or products referred to in the content.

