Abstract
This article aims to demonstrate the technical capabilities and effectiveness of an energy production and management system for school facilities using a modular solution. The system is assumed to generate electricity from renewable sources, such as wind or sun. The potential of renewable energy sources in Cracow, Poland, was assessed, with a focus on solar energy (photovoltaic panels, PV). Taking into account the installation of heating and other equipment, an analysis of the facility’s electricity demand was carried out. The study recommended the use of a heat pump system to heat and cool the facility. Renewable energy sources will meet 81% of the facility’s projected annual demand, according to the study. An analysis of the energy consumption and production profiles shows that almost 69% of the energy produced by the PV panels is consumed on site. Of the remaining energy, 31% is fed back into the grid and sold to the grid operator or used by other facilities within the shared settlement. The overall balance results in a small electricity deficit that must be covered by the grid. If suitable sites are available, the facilities under study could consider installing a wind turbine as a potential supplement to the energy deficit.
1. Introduction
Modern buildings account for a significant portion of primary energy usage, approximately 41%, and contribute to nearly 40% of greenhouse gas emissions in Poland [1]. Efforts are being made to significantly reduce energy consumption [2,3]. One possible solution is to increase the use of renewable energy sources in construction [4,5,6]. Interest in energy-efficient and passive construction is growing gradually, partly due to rising energy prices [7,8]. Publications in this area cover a range of topics, from case studies [9,10,11,12,13] to analyses of different scenarios of conduct [14,15]. They also include reports that provide guidance for implementing EU policies [16]. Most European Union countries are gradually changing the legal conditions for new buildings and those undergoing renovation and modernization [17,18,19,20]. In the European Union, several directives have been implemented to enhance the energy efficiency of buildings [21,22].
The purpose of this article is to present an analysis of the efficiency of the generation system, which is based on the use of renewable energy sources and installed in “Green Classroom” facilities. This analysis is part of the tasks related to improving energy resilience. The “Green Classroom” is a modular facility intended to expand the usable space of existing schools [23]. An interdisciplinary team developed the project as part of the Ministry of Education and Science’s “Science for Society” program. The team aimed to create a concept for a facility that could support existing school facilities. The need for this type of solution has become increasingly apparent due to events such as the pandemic and the war in Ukraine. Due to the COVID-19 pandemic and the need to conduct classes in accordance with the hygiene regulations, students had to be placed in larger rooms than before the pandemic, with greater distances between them. It was therefore necessary to increase the teaching space quickly and temporarily. The war in Ukraine and the wave of refugees (mainly women and children) made it necessary to provide a place to study for a large group of students in a short period of time. The facility could expand the space used for classes or even make it possible to hold classes. These facilities could also provide temporary support for specific units during renovation or modernization work. Analyses were conducted at over one hundred facilities in Cracow to support the proposed modular facilities.
Temporary increased educational space is important in emergencies [24,25] and when enrollments increase in a given location. Given the high cost of building traditional facilities and demographic problems, the need to organize additional school space quickly does not make economic sense. The proposal for a “Green Classroom” system appears to be a viable solution for economic and mobility reasons. The facility can be easily arranged and moved to another location to meet temporary needs for increased classroom space. Additionally, the “Green Classroom” facilities must meet the required energy standards, and their operation should involve minimal costs.
This article aims to introduce the concept of energy support for facilities using “Green Class” solar energy modules. This is due to the limitations of the current electrical infrastructure, which cannot always meet the required energy demand. The analyses aimed to identify the potential for installing photovoltaic panels on the “Green Class” modules, develop a concept for the power supply system (using renewable and traditional energy sources), and estimate the system’s efficiency.
2. Materials and Methods
2.1. Research Method
This research aimed to identify the most suitable renewable energy source to supplement the energy demand of a modular “Green Classroom” facility. The Photovoltaic Geographical Information System was used to calculate the energy demand https://re.jrc.ec.europa.eu/pvg_tools/en/tools.html (accessed on 1 March 2024).
2.2. Research Assumptions
The facilities developed as part of the modular and mobile “Green Classrooms” system can be implemented in any location. The optimization of the choice of renewable energy source presented in this article covers the conditions of the Malopolska Voivodeship (Poland), with a special focus on Cracow (up to 15 km from the city). An existing school building is assumed to operate for 12 h per day. Under normal conditions, power is supplied from the grid with a photovoltaic system. The system is designed to maximize the use of renewable energy sources for its own needs. During emergency conditions to maintain the operation of priority equipment (e.g., lighting, ventilation, wastewater pumping station), the power system will switch to island operation. During island operation, the primary energy source will be a battery bank together with renewable energy sources. The conditions for island operation were adopted according to the co-operation manual [26] agreed upon with the system operator. The reliability of the power supply allows the continuity of services to be maintained at a constant level.
The following assumptions were made in this study:
- maximum use of the potential of renewable energy sources,
- connection to 0.4 kV grid,
- power supply autonomy time—island operation up to 2 h,
- method of power supply (from the grid and/or from its own equipment, i.e., photovoltaic cells), cooperation of renewable energy sources with the grid,
- island operation and associated energy storage.
2.3. Potential of Renewable Energy Sources
According to the assumptions of the study, the power supply of the school facility is to be implemented with maximum use of available renewable energy sources. Solar radiation energy—photovoltaic (PV) panels—was selected as the most favorable possible source of such energy for the developed facility.
The average power of the wind turbine can be determined based on the following well-known relationship:
where Cp represents the aerodynamic efficiency of the wind turbine rotor, ρ represents air density, A represents the active area of the wind turbine, V represents wind speed, and η represents the efficiency of the electrical generator.
An analysis was conducted to assess the feasibility of wind energy in the Cracow area, using data from the Global Atlas for Renewable Energy database (https://globalatlas.irena.org/ (accessed on 1 March 2024)) for wind turbine locations. The average wind speed was assumed to be 6.25 m/s, and a speed correction (WSP) was applied to calculate the average wind speed for each month of the year. The wind turbine’s installation capacity was assumed to be 1 kW, obtained at an average wind speed of approximately 10 m/s. The approximate relationship can be determined as follows:
Using Formula (2), it is possible to calculate the average power output of the wind turbine and the energy produced during each month. The results of the analysis are presented in Table 1.

Table 1.
The estimated electricity production from a 1 kW wind turbine for a location near Cracow.
The data show that a wind turbine with a rated capacity of 1.0 kW can generate about 2 MWh of electricity per year. The proposed “Green Class” modular solutions have a relatively low height, leading to the assumption that wind energy will not be utilized. However, it could be beneficial to use wind energy during periods of low energy production from PV panels, such as late autumn to early spring, to improve the overall energy balance of the facility. It should be noted that wind turbines require a considerable amount of space to operate effectively, which precludes the use of such a solution in the conditions of the sites studied.
To determine the maximum potential of solar radiation, we identified the area suitable for photovoltaic panel installation and their optimal location. We used conceptual “Green Class” modules (Figure 1a–d) and assumed the use of monocrystalline panels. The installation was planned for both the roof and side surfaces.
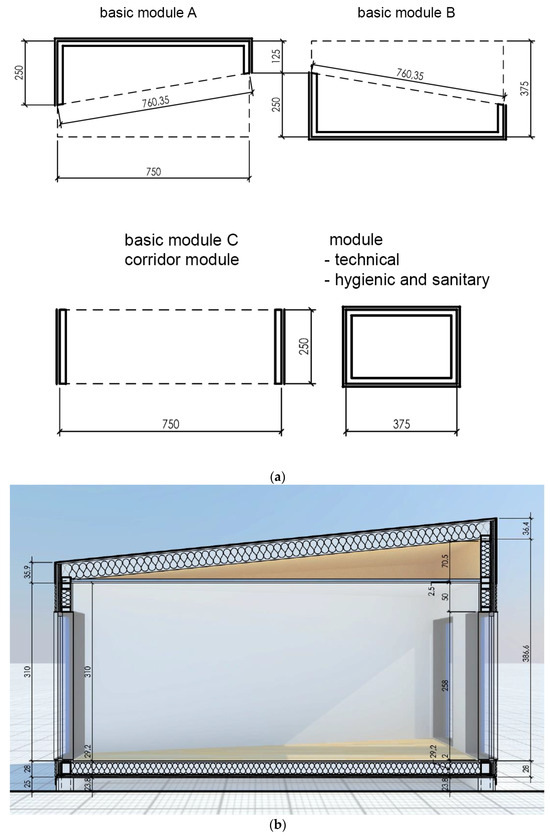
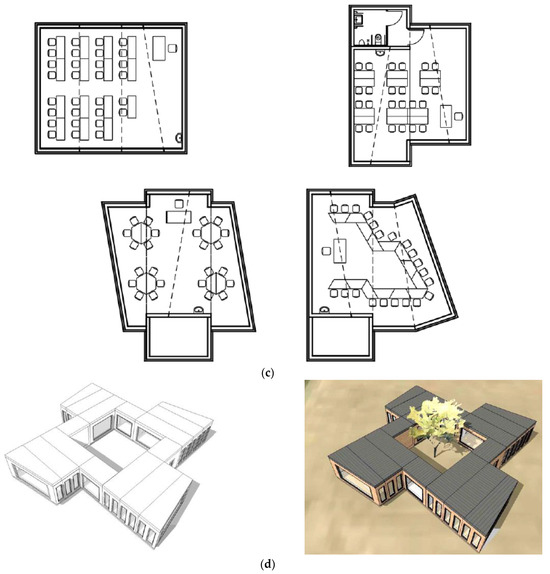
Figure 1.
(a) Top view of the basic modules. (b) Side sections of basic modules A, B. (c) Examples of room arrangements for classrooms. (d) Visualization of a sample set-up of three modular rooms including sanitary facilities and technical rooms.
A unit consisting of two single modules, which constitute the minimum volume of the educational facility, was adopted for the analysis (Table 2). The following areas were assumed to be used:
- -
- 75% of the roof area (approx. 14.1 m2) to be covered with PV panels allows for the installation of 2 kWp;
- -
- 70% of the wall area with dimensions of 7.5 × 3 m (approx. 22.5 m2) allows for the installation of PV with a power of 3 kWp.
The analysis of the optimal arrangement of 2 kWp PV panels (made using the PVGIS database [27] for the Cracow location) are presented in Table 2.
Table 2.
The optimal arrangement of 2 kWp PV panels for the Cracow location.
Table 2.
The optimal arrangement of 2 kWp PV panels for the Cracow location.
| Slope Angle [°]: | 39 (opt) |
| Azimuth angle [°]: | 180 (opt) |
| Yearly PV energy production [kWh]: | 2079.19 |
| Yearly in-plane irradiation [kWh/m2]: | 1348.66 |
| Year-to-year variability [kWh]: | 104.34 |
| Changes in output due to the following: | |
| Angle of incidence [%]: | −2.89 |
| Spectral effects [%]: | 1.74 |
| Temperature and low irradiance [%]: | −9.28 |
| Total loss [%]: | −22.92 |
A summary of the monthly energy production from PV panels for the proposed optimal panel arrangement (Table 2) is shown in Figure 2.
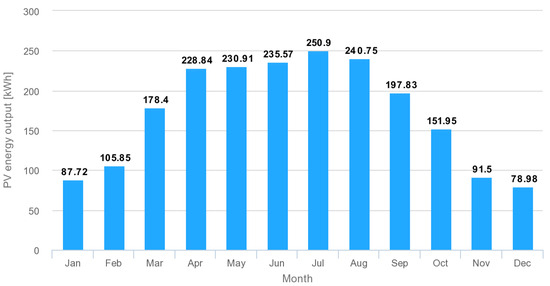
Figure 2.
Monthly production for the optimal panel arrangement with an azimuth of 180 and an inclination of 39°.
The authors consciously used the PVGIS database [27], which approximates the data to some extent and averages the efficiency. In addition to the position and orientation of the panels, the overall PV energy production will be influenced by factors such as cooling, depending on the arrangement method. The most advantageous variant of arrangement on walls or roof was assumed here, and the energy production was estimated by the PVGIS application using satellite data regarding solar radiation. It is obvious that the efficiency of PV modules depends on both temperature and solar radiation intensity. It is possible [28,29] to precisely determine the losses and efficiency of PV systems, taking into account the characteristics of modules, converter systems, and the MPPT algorithms used; however, for design purposes, the PVGIS database [27] allows for an effective estimation of energy production efficiency. The PVGIS database assumes an estimated power loss of 8% due to temperature effects (a general value that has been found to be reasonable for a temperate climate). In addition, it is necessary to estimate system losses that cause the power actually delivered to the power grid to be lower than the power produced by PV modules. There are several reasons for these losses, such as losses in cables, inverters, or additional losses in PV modules resulting from, for example, dirt. Modules also lose some of their power over the years, so the average annual power output over the life of the system will be several percent lower than the power output in the early years. For general estimates, we adopted the loss value of 14% proposed by the PVGIS database for the average monthly energy production by the PV system.
2.4. Optimization of the Panel Arrangement on the Roof
Due to the limited possibilities of tilt and orientation with respect to the world (azimuth), analyses of the optimal positioning of the panels were carried out. A preliminary assessment of the energy production depending on the influence of the tilt and azimuth of the panels can be made from Table 3.
Table 3.
Analysis of energy production in relation to the influence of the tilt and azimuth of PV panels.
Based on the coefficients presented in Table 1, we initially selected the following panel layouts:
- Horizontal arrangement
Technically, the simplest solution is to arrange the panels horizontally. This ensures complete independence of production from the orientation of the segment relative to the azimuth. The production value obtained, which is 90% of the optimal alignment, is a good result (refer to Figure 3). However, this solution has the disadvantage of large variations in production depending on the month of the year. From a perspective of uniform energy production, this solution is disadvantageous because there will be a shortage of energy during winter months and an excess of electricity during summer months (see Figure 3).
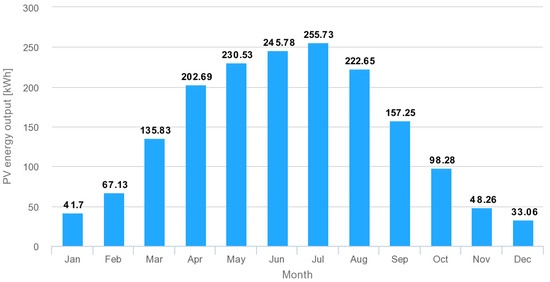
Figure 3.
Monthly production for 0° inclination.
- Slope of the entire roof surface
When tilting the panels, it is important to position them relative to the azimuth. The best results are obtained for an azimuth of 180°. It is worth noting that even a slight inclination of 10 or 20° gives results close to the optimum (Figure 4). The variability in production is less than in the horizontal alignment; however, it is still significant.
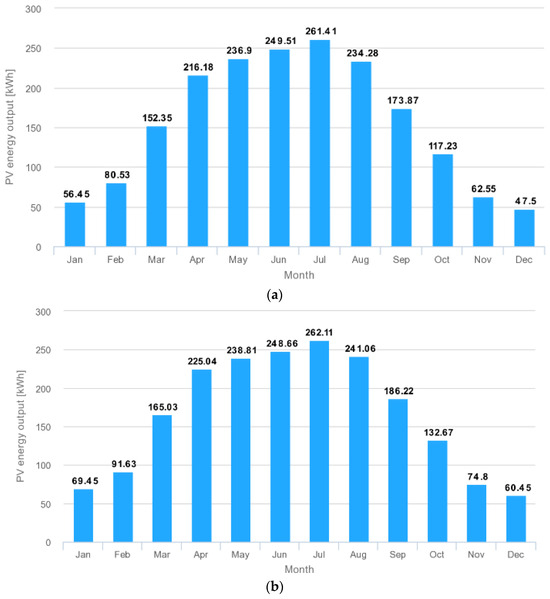
Figure 4.
(a) Monthly production for an azimuth of 180 and an inclination of 10°. (b) Monthly production for an azimuth of 180 and an inclination of 20°.
- Split pitch (gable)
A possible alternative is to use a gabled setting for the panels. The results presented below demonstrate the case of a symmetrical roof with slopes of 20°, oriented to the east and west (refer to Figure 5). The results obtained are comparable to those of the entire roof surface sloping at 10°.
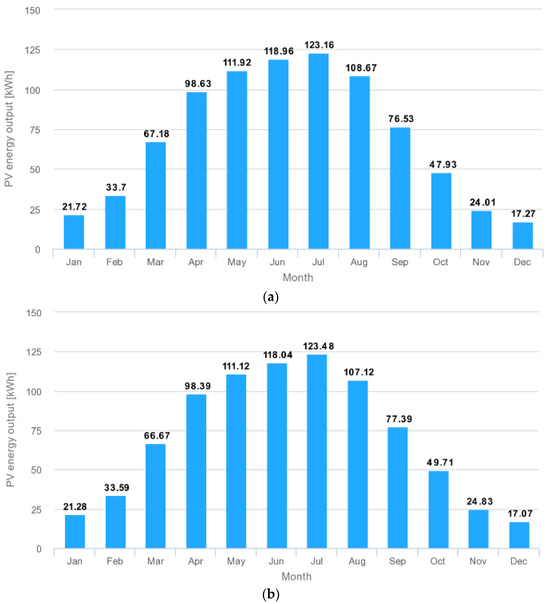
Figure 5.
(a) Monthly production for a 20° slope and west-facing fall azimuth. (b) Monthly production for a slope of 20° and an azimuth of fall to the east.
2.5. Optimization of the Panel Arrangement on the Wall
In the previous section, the optimization of the panel placement on the roof was presented. It was shown that the energy production varies significantly with the season. Another solution is to utilize the wall surface for PV panel installation.
Assuming a 7.5 × 3 m wall with 70% coverage, panels capable of generating 3 kWp can be installed. The performance analysis of wall-mounted panels, depending on the azimuth, is shown in Figure 6a–c.
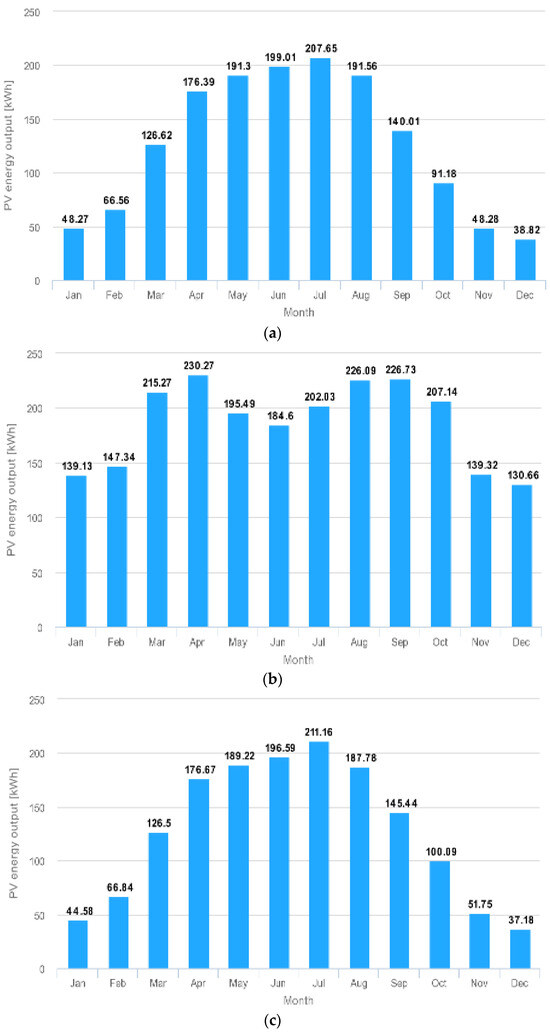
Figure 6.
(a) Monthly production for 90° inclination and west-facing slope azimuth. (b) Monthly production for a 90° slope and south-facing fall azimuth. (c) Monthly production for a 90° slope and east-facing fall azimuth.
The optimal solution for production efficiency is to use a south-facing wall. This applies to both the amount of energy produced and the low variability of production throughout the seasons. It should be emphasized that moving away from the standard optimal positioning of PV panels (inclination and azimuth) in favor of placing them on walls (especially southern ones) is an acceptable solution from the point of view of the generated energy.
3. Analysis of Solutions
Given the high seasonal variability of energy production, which has a significant impact on the energy balance, a south-facing segment wall should be used. Such an alignment of the PV panels will reduce the average annual production to a level of 70% of that for the optimal alignment.
Depending on the intended use of the energy obtained from the PV panels, three cases should be considered:
- self-sufficient module—all the energy is used to meet the needs of the module or set of modules;
- energy storage—the energy harvested is used by an adjacent building (e.g., a school);
- hybrid—the energy is used primarily for the energy needs of the module, while the surplus energy covers the needs of the adjacent building (school).
Table 4 shows the recommended use of the façade and roof area depending on the purpose of the PV energy.
Table 4.
Recommended use of façade and roof area.
3.1. Daily PV Energy Production Profiles
The choice of where to position the PV panels (horizontally on the roof or vertically on a south-facing wall) affects not only the amount and variability of monthly energy production throughout the year, but also the daily energy production profile. In order to compare the two solutions, the results presented are for an equal PV capacity of 1 kWp. The data for the analysis is from the year 2020 and was taken from the PVGIS database. The graphical representation of the statistical features of the daily production profiles is presented in the form of box plots (Figure 7 and Figure 8).
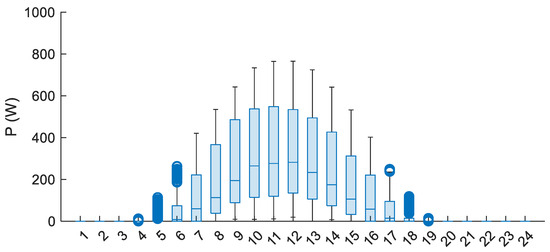
Figure 7.
The box plot displays the daily average annual production of PV (1 kWp) arranged horizontally on the roof, based on the year 2020, according to PVGIS.
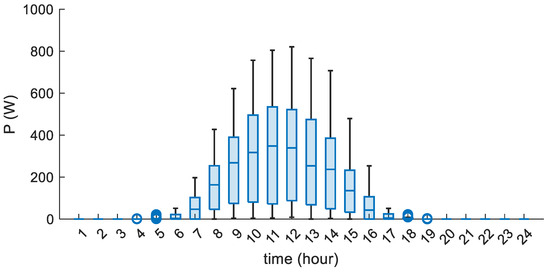
Figure 8.
A box plot displaying the daily annual production of PV (1 kWp) arranged vertically on the south wall in the year 2020, based on PVGIS data.
The daily graphs on an annual basis, after taking into account the main characteristics (median, box length, and minimum and maximum values) are similar, taking into account the difference in energy production values of 0.9:0.72 in favor of the panels arranged on the roof. The significant difference is in the values obtained in the morning and afternoon for roof-mounted panels.
Monthly average daily profiles for both cases are presented in Figure 9. It can be seen that for wall-mounted panels, the hourly range of significant energy production (above 5% of installed capacity) is smaller (7–17) than for roof-mounted panels (5–18). There is clearly less variation in energy production for individual months in the case of wall-mounted versus roof-mounted panels. The minimum average monthly production (December) is more than twice as high for wall-mounted panels as for roof-mounted panels (Table 5), which is a significant advantage for this type of arrangement.
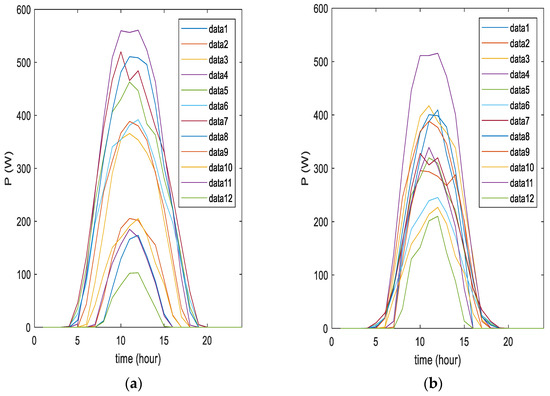
Figure 9.
Daily graph of average monthly production of PV (1 kWp) arranged as follows: (a) horizontally on the roof, (b) vertically on the south wall, based on the year 2020 (PVGIS).
Table 5.
Daily values of minimum and maximum energy from PV depending on the location of the panels (averaged over the month).
The profiles presented were averaged over a month. To analyze module self-sufficiency, it is necessary to consider the least favorable case, which is the period with the lowest energy production. For the range of data analyzed in 2020, this was December. Figure 10 below shows the energy production course in December 2020.
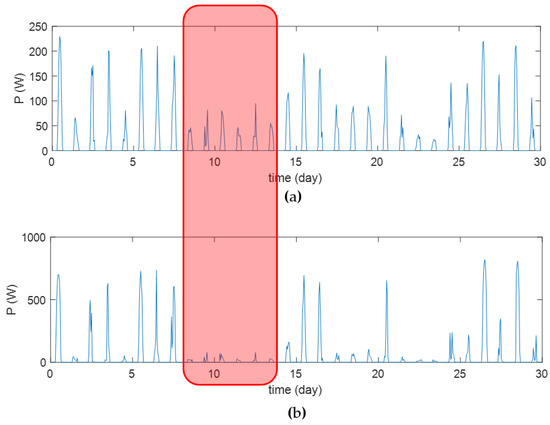
Figure 10.
The course of energy production in December 2020 for 1 kWp PV: (a) horizontally on the roof, (b) vertically on the south wall.
In both cases of panel placement variants, there are days when production does not exceed 5% of the assumed capacity. This can occur for several consecutive days under certain conditions, as seen in the presented data where it lasted for 6 days. This situation is highly unfavorable for the facility’s self-sufficiency, especially during a month with high electricity demand. Considering the high cost of energy storage, it appears that a fully self-sufficient module may not be feasible and an external power supply will likely be required.
3.2. Selection of Electricity Storage Capacity
According to the analyses presented in the previous chapter, it is recommended to manage the energy obtained from PV panels in a hybrid way (see Table 3). In this case, the PV energy should primarily cover the current demand of the module, while the surplus should be stored [30,31]. To achieve this mode of operation, an energy storage system is required. The use of lithium-ion storage is assumed. The storage capacity should be chosen based on the module’s daily energy balance, taking into account the average electricity consumption and PV production. To account for location and season, the average PV panel production depends on the panel’s azimuth, tilt, solar radiation, and temperature.
The primary criterion for selecting storage capacity is to minimize the number of days with insufficient energy from PV and batteries, based on average energy consumption. The analyses were conducted for a unit installed PV capacity of 1 kWp according to PVGIS database [27], considering two panel locations resulting from the aforementioned studies: horizontal on the roof and vertical on the south wall. The results are presented in Table 6 and Table 7.
Table 6.
Percentage of the number of days per year with an energy deficit for 1 kWp PV as a function of battery capacity and average daily electricity consumption for the vertical arrangement of PV panels on the south wall.
Table 7.
Percentage of days per year with an energy deficit for 1 kWp of PV as a function of battery capacity and average daily electricity consumption for the horizontal arrangement of PV panels on the roof.
Table 6 and Table 7 show that arranging panels on the roof results in a higher number of days with an energy deficit for high energy consumption relative to battery capacity, with the number of days with a deficit exceeding 50%. The vertical arrangement of panels on the south wall yields better results in other cases. In self-sufficiency mode, it is important to minimize the number of days with an energy deficit. A few percent improvement can be considered satisfactory. Arranging PV panels on the wall, rather than the roof, can achieve this result with a 40% smaller storage capacity.
Any surplus energy generated by the module can be used by other energy consumers. In this case, the wall arrangement is more favorable due to the better distribution of energy by month, despite the smaller total amount compared to the roof arrangement. Figure 11 and Figure 12 show the excess energy for the two cases of alignment and equal average values of energy consumption (500 Wh/day) and storage capacity (3000 Wh). It should be added that the energy storage only secures and balances the daily demand and does not affect the monthly balance.
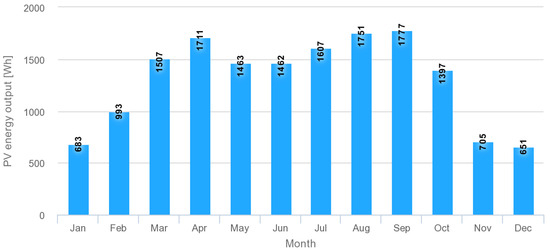
Figure 11.
Energy balance for laying 1 kWp PV on a vertical wall and average energy consumption of 500 Wh/day and storage capacity of 3000 Wh.
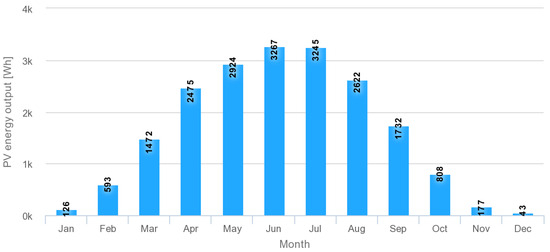
Figure 12.
Energy balance for laying 1 kWp PV on a horizontal roof and average energy consumption of 500 Wh/day and storage capacity of 3000 Wh.
4. Analysis of Facility’s Electricity Demand
In order to estimate the demand for electricity, a single classroom with a sanitary node or technical room was selected for analysis, for which a balance sheet should be carried out, taking into account the heating and cooling system, ventilation, hot water preparation needs and the operation of electrical equipment necessary for the operation of the facility. It was assumed that the classroom will be constructed with four basic modules (Figure 1a) with a technical or sanitary room according to the “Green Classroom” system (Figure 1c), which will be equipped with 4 kWp PV panels on the roof and 3 kWp on the walls. The entire PV system is to cooperate with an energy storage unit with parameters that were defined earlier in the article.
The choice of a heat pump as a source of heating and cooling is dictated by economic and environmental considerations. A heat pump using renewable energy is an environmentally friendly device and generates significantly lower operating costs, compared to other competing energy sources [32,33]. The operation of a single pump operating reversibly in heating and cooling mode was envisaged for one classroom. Due to the relatively low demand for domestic hot water, instantaneous water heaters were provided for its preparation. Cubic volumes were used as input data for the analyses. A summary of the relevant data needed for the analyses is presented in Table 8.
Table 8.
Dimensions, area, and volume of the analyzed object.
The heat pump was selected based on the average climate data for Cracow from https://pl.climate-data.org/ (accessed on 1 March 2024). Determining the maximum heating power required for a building is challenging without considering detailed insulation parameters. For instance, the maximum heating power for insulation standards, determined based on standard normative data for objects of a certain cubic capacity (refer to Table 6), varies between 7.5 kW and 3.3 kW according to the regulations in force from 2002 to 2021 (estimated conversions according to the calculator on https://ekodom.eko.org.pl/ (accessed on 1 March 2024)). Based on the current normative regulations (for example in Poland [34,35,36,37]), the wooden structure of the modules and insulation of the walls with 15 cm thick mineral wool, and 20 cm thick insulation for the roof, along with ventilation using a recuperation system, will result in a maximum heating device power of 3.3 kW (for a system with a cross or rotary recuperator) or 3.4 kW (for a system with a counterflow recuperator). The maximum power of the heating device increases to 4.2 kW in the absence of recuperation and with the use of mechanical ventilation. Table 9 summarizes the estimated power and thermal energy requirements according to current standards. The tool available at https://cieplo.app/ (accessed on 1 March 2024) was used for this purpose. The maximum power of the heating device was calculated for an outdoor temperature of −20 °C and an average indoor temperature of 20.0 °C. The heating season’s average heating power was determined based on an outdoor temperature of 1.4 °C and an average indoor temperature of 20.0 °C. Additionally, an estimated 100 dm3/day of DHW was required.
Table 9.
Estimated power and thermal energy demand.
As a source of thermal energy, it is proposed to choose a reversible air-to-air heat pump with a heating capacity calculated at an outdoor temperature of 2 °C of a min. of 4–5 kW (monovalent operation of the heat pump is assumed, that is, without an additional parallel energy source). The demand for thermal energy and cooling for the analyzed object must take into account the monthly average temperatures for Cracow (Table 10). The balance of thermal energy consumption in individual months of the year is presented in Figure 13 and was prepared using the application https://dimplex24.pl/ (accessed on 1 March 2024).
Table 10.
Summary of average monthly temperatures for Cracow.
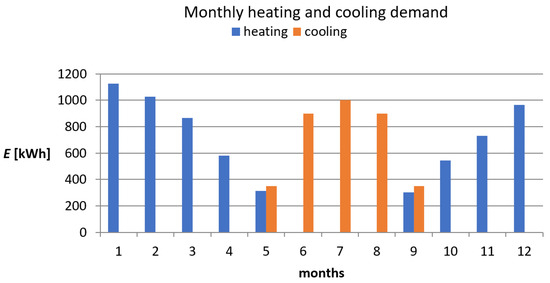
Figure 13.
Energy balance of heating and cooling energy consumed.
Figure 13 shows the balance between heating and cooling energy demands throughout the year. The heating energy demand for the year is 6497 kWh, while the cooling energy demand is 3500 kWh. The energy demand is primarily influenced by temperature and weather conditions. During the colder months, heating energy consumption is highest, while cooling energy consumption is lowest. Conversely, heating energy consumption is non-existent during the summer months, while cooling energy consumption increases. The heat pump requires approximately 26,210 kWh/year of electricity at an average COP of 3.8 (Figure 14). Other components of energy consumption, such as preparing domestic hot water (DHW), operating the ventilation system with heat recovery (recuperation), lighting, and powering other electrical equipment (e.g., computer, projector, etc.), must supplement the demand for electricity required to maintain thermal comfort in the rooms [38,39,40]. Table 11 shows the estimated power and energy requirements for other equipment.
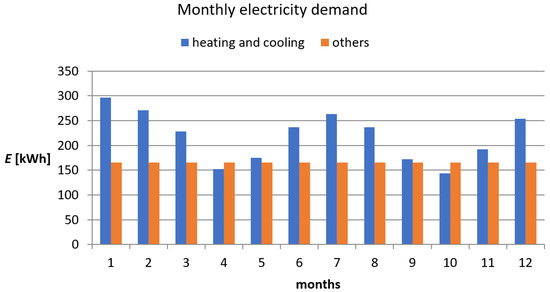
Figure 14.
Summary of monthly electricity demand.
Table 11.
Estimated remaining power and electricity requirements of other equipment.
Figure 14 presents a summary of the monthly electricity demand. The assumption is that the facility operates for 10 h a day, 5 days a week (22 days a month). The annual energy demand is significantly overestimated as the interruption during holiday months was not considered.
According to the data in Figure 14, the energy consumption of other equipment (Table 10) is 1980 kWh/year. Balancing the facility’s electricity demand with PV energy production (Figure 15), a summary of electricity shortages and surpluses was obtained for each month (Figure 16).
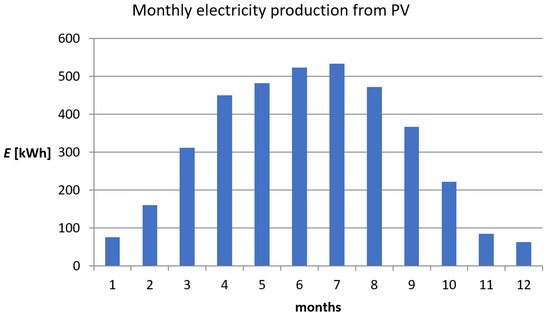
Figure 15.
Summary of monthly electricity production from PV panels (4 kWp PV panels on the roof and 3 kWp on the walls).
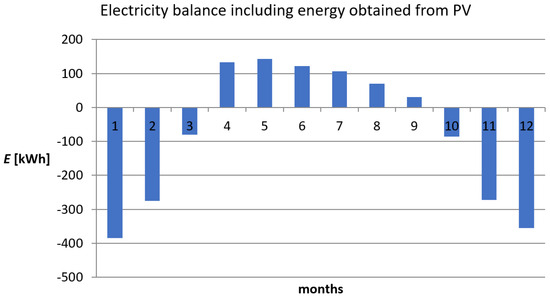
Figure 16.
Overall summary of the shortage and surplus of electricity for the analyzed object of “Green Class”.
The presented energy demand balance is influenced by seasonal changes in weather conditions. There is a significant energy shortage during autumn and winter months. The facility’s projected annual demand is 4600 kWh per year, while the electricity produced from renewable sources is 3752 kWh/year.
5. Summary and Conclusions
The authors proposed a modular solution called the “Green Classroom” enabling the configuration of school space. Energy analyses were carried out for an example configuration of a facility consisting of four basic modules with a technical room or a toilet. An unconventional proposal presented in this article is the additional use of side walls for installing PV modules, which allows for the flattening of energy production characteristics in months with less favorable sunlight and better use of energy storage.
The analysis above demonstrates the technical feasibility and efficiency of an electricity generation and management system for an educational facility, using the latest technology to obtain electricity from solar energy. The potential of renewable energy sources, specifically photovoltaic panels, at the indicated location was estimated to be 3.75 MWh/year. Subsequently, an analysis of the site’s electricity demand was carried out, taking into account the installation of heating and other equipment. To achieve this goal, a heat pump system was proposed for heating and cooling the facility. The facility’s estimated annual electricity consumption is 4.6 MWh/year. According to the analysis, renewable sources will provide 81% of the facility’s projected annual demand. The use of renewable energy to directly power the “Green Classroom” facility is not feasible due to the daily and annual variation in electricity production from PV panels. An analysis of the energy consumption and production profiles reveals that approximately 69% of the energy produced by the PV panels will be consumed on-site (known as self-consumption), amounting to 3.15 MWh/year. The remaining 31% of energy will be fed back into the electricity grid and either sold to the utility or used by other school facilities within the joint settlement. Regrettably, there is a shortage of 1.45 MWh/year of electricity that must be obtained from the grid.
Despite their simplicity, the presented analyses allow us to answer whether and to what extent a PV installation can meet the needs of unusual architectural solutions, which include the “Green Class”. In particular, does it make sense to use an unusual arrangement of PV panels on the walls? We argue that these solutions should also be considered, and this is supported by the significant drop in purchase prices of PV panels in recent years.
The installation of a small wind turbine could supplement the energy shortage in the “Green Classroom” complex (Figure 1d), provided suitable locations are available. This could significantly improve the energy balance of the entire premise.
Author Contributions
Conceptualization, T.W., D.B., A.C., M.Ł., J.D. and A.H.-N.; Methodology, D.B., R.B., A.C., M.Ł., J.D., J.B., H.H.-G. and A.H.-N.; Formal analysis, T.W., D.B. and H.H.-G.; Resources, J.B.; Writing—original draft, T.W.; Writing—review & editing, D.B.; Supervision, R.B.; Project administration, R.B. All authors have read and agreed to the published version of the manuscript.
Funding
Scientific work subsidized from the state budget under the program of the Ministry of Education and Science called “Science for Society” project number NdS/544609/2021/2022 grant amount 1,637,268.00 PLN, total project value 1,647,268.00 PLN.
Data Availability Statement
The original contributions presented in the study are included in the article, further inquiries can be directed to the corresponding authors.
Conflicts of Interest
The authors declare no conflict of interest.
References
- GUS. Budownictwo. 2019. Available online: https://stat.gov.pl/obszary-tematyczne/przemysl-budownictwo-srodki-trwale/budownictwo/budownictwo-w-2019-roku,13,5.html (accessed on 1 March 2024).
- Dragan, W.; Zdyrko, A. The spatial dimension of coal phase-out: Exploring economic transformation and city pathways in Poland. Energy Res. Soc. Sci. 2023, 99, 103058. [Google Scholar] [CrossRef]
- Blazy, R.; Błachut, J.; Ciepiela, A.; Łabuz, R.; Papież, R. Thermal Modernization Cost and the Potential Ecological Effect—Scenario Analysis for Thermal Modernization in Southern Poland. Energies 2021, 14, 2033. [Google Scholar] [CrossRef]
- Grantham, A.; Pudney, P.; Ward, L.; Whaley, D.; Boland, J. The viability of electrical energy storage for low-energy households. Sol. Energy 2017, 155, 1216–1224. [Google Scholar] [CrossRef]
- Rana, M.M.; Uddin, M.; Sarkar, M.R.; Shafiullah, G.M.; Mo, H.; Atef, M. A review on hybrid photovoltaic—Battery energy storage system: Current status, challenges, and future directions. J. Energy Storage 2022, 51, 104597. [Google Scholar] [CrossRef]
- Blazy, R.; Błachut, J.; Ciepiela, A.; Łabuz, R.; Papież, R. Renewable energy sources vs. an air quality improvement in urbanized areas-the metropolitan area of Kraków case. Front. Energy Res. 2021, 9, 767418. [Google Scholar] [CrossRef]
- Mousavi, S.; Gijón-Rivera, M.; Rivera-Solorio, C.I.; Rangel, C.G. Energy, comfort, and environmental assessment of passive techniques integrated into low-energy residential buildings in semi-arid climate. Energy Build. 2022, 263, 112053. [Google Scholar] [CrossRef]
- Kozłowski, J. Difficult road to decarbonize economy. Nauka 2022, 7–35. Available online: https://www.dnibetonu.com/wp-content/pdfs/2023/Witkowski_Moczko_Schabowicz.pdf (accessed on 1 March 2024). [CrossRef]
- Romano, G.; Baiani, S.; Mancini, F.; Tucci, F. Reducing CO2 Emissions and Improving Water Resource Circularity by Optimizing Energy Efficiency in Buildings. Sustainability 2023, 15, 13050. [Google Scholar] [CrossRef]
- Mujeebu, M.A.; Bano, F. Energy-saving potential and cost-effectiveness of active energy-efficiency measures for residential building in warm-humid climate. Energy Sustain. Dev. 2022, 67, 163–176. [Google Scholar] [CrossRef]
- Bughio, M.; Khan, M.S.; Mahar, W.A.; Schuetze, T. Impact of Passive Energy Efficiency Measures on Cooling Energy Demand in an Architectural Campus Building in Karachi, Pakistan. Sustainability 2021, 13, 7251. [Google Scholar] [CrossRef]
- Albayyaa, H.; Hagare, D.; Saha, S. Energy conservation in residential buildings by incorporating Passive Solar and Energy Efficiency Design Strategies and higher thermal mass. Energy Build. 2019, 182, 205–213. [Google Scholar] [CrossRef]
- Papadakis, N.; Katsaprakakis, D.A. A Review of Energy Efficiency Interventions in Public Buildings. Energies 2023, 16, 6329. [Google Scholar] [CrossRef]
- Koronen, C.; Åhman, M.; Nilsson, L.J. Data centres in future European energy systems—Energy efficiency, integration and policy. Energy Effic. 2020, 13, 129–144. [Google Scholar] [CrossRef]
- Desvallées, L. Low-carbon retrofits in social housing: Energy efficiency, multidimensional energy poverty, and domestic comfort strategies in southern Europe. Energy Res. Soc. Sci. 2022, 85, 102413. [Google Scholar] [CrossRef]
- Shnapp, S.; Paci, D.; Bertoldi, P. Enabling Positive Energy Districts across Europe: Energy Efficiency Couples Renewable Energy; Publication Office of the European Union: Luxembourg, 2020. [Google Scholar]
- Malinauskaite, J.; Jouhara, H.; Ahmad, L.; Milani, M.; Montorsi, L.; Venturelli, M. Energy efficiency in industry: EU and national policies in Italy and the UK. Energy 2019, 172, 255–269. [Google Scholar] [CrossRef]
- Snape, J.R.; Boait, P.J.; Rylatt, R.M. Will domestic consumers take up the renewable heat incentive? An analysis of the barriers to heat pump adoption using agent-based modelling. Energy Policy 2015, 85, 32–38. [Google Scholar] [CrossRef]
- Czarnecka, M.; Ogłódek, T. Prawo Energetyczne. Efektywność Energetyczna Tom I. 2023. Available online: https://son.uni.lodz.pl/info/book/UL5b839e67ddf544739ab79ab27b9158e4/Publication%2B%25E2%2580%2593%2BPrawo%2Benergetyczne.%2BEfektywno%25C5%259B%25C4%2587%2Benergetyczna%2BTom%2BI.%2BKomentarz%2B%25E2%2580%2593%2BUniwersytet%2B%25C5%2581%25C3%25B3dzki+title?ps=20&lang=en&pn=1 (accessed on 1 March 2024).
- Barwińska Małajowicz, A.; Knapková, M.; Szczotka, K.; Martinkovičová, M.; Pyrek, R. Energy Efficiency Policies in Poland and Slovakia in the Context of Individual Well-Being. Energies 2023, 16, 116. [Google Scholar] [CrossRef]
- Economidou, M.; Todeschi, V.; Bertoldi, P.; D’Agostino, D.; Zangheri, P.; Castellazzi, L. Review of 50 years of EU energy efficiency policies for buildings. Energy Build. 2020, 225, 110322. [Google Scholar] [CrossRef]
- Wrona, A.; Czyżak, P. A Missed Opportunity. Neglects in Polish Climate Policy. Available online: https://instrat.pl/zaniedbania-klimatyczne/ (accessed on 1 March 2024).
- School of the Future—Modular and Mobile Green Classroom System. 2021. Available online: https://zielonaklasa.pk.edu.pl/ (accessed on 1 March 2024).
- Buonanno, G.; Ricolfi, L.; Morawska, L.; Stabile, L. Increasing ventilation reduces SARS-CoV-2 airborne transmission in schools: A retrospective cohort study in Italy’s Marche region. Front. Public Health 2022, 10, 1087087. [Google Scholar] [CrossRef]
- Lasser, J.; Sorger, J.; Richter, L.; Thurner, S.; Schmid, D.; Klimek, P. Assessing the impact of SARS-CoV-2 prevention measures in Austrian schools using agent-based simulations and cluster tracing data. Nat. Commun. 2022, 13, 554. [Google Scholar] [CrossRef]
- Polish Power Grids, Instruction for the Operation and Operation of the Transmission Network—Conditions of Use, Operation, Operation and Planning of Network Development Approved by the Decision of the President of the Energy Regulatory Office No. DPK-4320-1(4)/2011/LK of 15 December 2011 (In Polish). Available online: https://bip.ure.gov.pl/download/3/13035/IRESPPSE.pdf (accessed on 1 March 2024).
- Photovoltaic Geographical Information System. Available online: https://re.jrc.ec.europa.eu/pvg_tools/en/ (accessed on 1 March 2024).
- Hassaine, L.; Olias, E.; Quintero, J.; Salas, V. Overview of power inverter topologies and control structures for grid connected photovoltaic systems. Renew. Sustain. Energy Rev. 2014, 30, 796–807. [Google Scholar] [CrossRef]
- Kolantla, D.; Mikkili, S.; Pendem, S.R.; Desai, A. Critical review on various inverter topologies for PV system architectures. IET Renew. Power Gener. 2020, 14, 3418–3438. [Google Scholar] [CrossRef]
- Borkowski, D.; Oramus, P.; Brzezinka, M. Battery energy storage system for grid-connected photovoltaic farm—Energy management strategy and sizing optimization algorithm. J. Energy Storage 2023, 72 Pt A, 108201. [Google Scholar] [CrossRef]
- Oramus, P.; Borkowski, D.; Brzezinka, M. Optimization algorithm for selecting parameters of an electrical energy storage dedicated to cooperation with an existing photovoltaic power plant. Przegląd Elektrotechniczny 2023, 99, 200–204. (In Polish) [Google Scholar] [CrossRef]
- Yuan, M.; Thellufsen, J.Z.; Sorknæs, P.; Lund, H.; Liang, Y. District heating in 100% renewable energy systems: Combining industrial excess heat and heat pumps. Energy Convers. Manag. 2021, 244, 114527. [Google Scholar] [CrossRef]
- Grossi, I.; Dongellini, M.; Piazzi, A.; Morini, G.L. Dynamic modelling and energy performance analysis of an innovative dual-source heat pump system. Appl. Therm. Eng. 2018, 142, 745–759. [Google Scholar] [CrossRef]
- Mrzygłód, M.; Wojtalewicz, A. Analysis of Material Solutions for Building Envelopes in a Low-Energy Standard in Modern Design and Implementation of Building Structures; Wydawnictwo Politechniki Krakowskiej: Cracow, Poland, 2016. (In Polish) [Google Scholar]
- Pawłowski, K. Principles of Designing Energy-Efficient Buildings; Grupa MEDIUM: Warszawa, Poland, 2017. (In Polish) [Google Scholar]
- Pawłowski, K. Designing Horizontal Partitions in Energy-Saving Construction. Thermal and Humidity Calculations of Partitions in Contact with the Ground, Ceilings, Roofs and Flat Roofs in the Light of Applicable Legal Regulations; Grupa MEDIUM: Warszawa, Poland, 2018. (In Polish) [Google Scholar]
- Pawłowski, K. Design of Horizontal Partitions Taking into Account Thermal and Humidity Requirements from January 1, 2021; IZOLACJE 3/2020; 2020 (In Polish). Available online: https://www.izolacje.com.pl/artykul/sciany-stropy/194941,projektowanie-przegrod-poziomych-z-uwzglednieniem-wymagan-cieplno-wilgotnosciowych-od-1-stycznia-2021-roku (accessed on 1 March 2024).
- Rolando, D.; Mazzotti Pallard, W.; Molinari, M. Long-Term Evaluation of Comfort, Indoor Air Quality and Energy Performance in Buildings: The Case of the KTH Live-In Lab Testbeds. Energies 2022, 15, 4955. [Google Scholar] [CrossRef]
- Samadi, N.; Shahbakhti, M. Energy Efficiency and Optimization Strategies in a Building to Minimize Airborne Infection Risks. Energies 2023, 16, 4960. [Google Scholar] [CrossRef]
- Kuczyński, T.; Staszczuk, A. Experimental study of the influence of thermal mass on thermal comfort and cooling energy demand in residential buildings. Energy 2020, 195, 116984. [Google Scholar] [CrossRef]
Disclaimer/Publisher’s Note: The statements, opinions and data contained in all publications are solely those of the individual author(s) and contributor(s) and not of MDPI and/or the editor(s). MDPI and/or the editor(s) disclaim responsibility for any injury to people or property resulting from any ideas, methods, instructions or products referred to in the content. |
© 2024 by the authors. Licensee MDPI, Basel, Switzerland. This article is an open access article distributed under the terms and conditions of the Creative Commons Attribution (CC BY) license (https://creativecommons.org/licenses/by/4.0/).