Article

A Comparative Analysis of Measured and Simulated Data of PV Rooftop Installations Located in Poland

Department of Renewable Energy Engineering, Faculty of Environmental Engineering, Lublin University of Technology, Nadbystrzycka 40B, 20-618 Lublin, Poland
Energies 2023, 16(16), 5975; https://doi.org/10.3390/en16165975
Submission received: 28 June 2023 / Revised: 20 July 2023 / Accepted: 9 August 2023 / Published: 14 August 2023

Abstract

:
In recent years, photovoltaics (PVs) is the main driver of the renewable energy market growth in Poland. The number of photovoltaic installations, most of which are rooftop prosumer systems, is consistently growing. Therefore, the determination of the applicability and feasibility of photovoltaic systems under different climate conditions is of great significance. This study presents the performance analysis of four prosumer photovoltaic installations situated in the Eastern part of Poland, Lublin Voivodeship. The influence of various tilt angles, ranging from 19° to 40°, and azimuths (south, east, south–east, and east–west) on the final yield have been determined under one year of operation (2022). The average yearly final yield was found to be 1022 kWh·kW−1, with the highest value obtained for the installation oriented towards the south, equal 1079 kWh·kW−1. Then, the PV systems were simulated by the use of four specialized photovoltaic software: DDS-Cad 16, PVGIS 5.2, PVSOL premium 2022, and the PVWatts Calculator 8.2.1. A comparative analysis of the measured and simulated data in terms of the final yield was carried out. The data obtained from PVGIS and PVSOL demonstrated the highest degree of overall alignment of 92% and 91%, respectively. The most significant underestimation was noticed for the DDS-Cad software, which was equal to 77%. The most accurate predictions stand out for the system oriented to the south, while the weakest was found for the E–W installation.

1. Introduction

In recent years, technological development, population growth, improvements in the standards of living, and, thus, an enhanced demand for electricity have contributed to a significant increase in energy consumption. In addition, it is expected that this energy demand will increase by approximately 25% by 2050 [1]. However, fossil fuel combustion, which is still the most commonly used energy production process, has a negative impact on the environment. It is predicted that the fossil fuel share in the electricity mix will decrease from the present 59% to 12% by 2050 [1]. Nowadays, the coal share in gross energy production in Poland is approximately 70% [2,3]. All these factors have raised concerns about air pollution, the emission of greenhouse gases (GHGs), climate change, and the depletion of non-renewable resources. Nonetheless, the energy policy of the European Union (EU), and, thus, Poland, has recently been focused on the decarbonization process and energy transition. Climate neutrality by 2050 is a long-term worldwide strategy that assumes zero net emissions of GHGs into the atmosphere, counteracting climate change and its related negative effects. One of the main goals, which was claimed in the Paris Agreement [4], is to limit the increase of the average global temperature to 1.5 °C above pre-industrial levels. Poland’s National Energy and Climate Plan for the years 2021–2030 (NECP PL) [5] was developed in 2019 in accordance with Regulation (EU) 2018/1999 of the European Parliament and of the Council of 11 December 2018 on the Governance of the Energy Union and Climate Action [6]. The main objective of the NECP PL is to achieve a 7% reduction of GHG emissions compared to the level in 2005 and 21–23% of the renewable energy source (RES) share in gross final energy consumption by 2030, to decrease primary energy consumption by 23% compared to the PRIMES 2007 predictions, and to reduce the coal share in electricity generation by 56–60%. Nonetheless, the European Commission proposed, in 2021, a new GHG reduction target equal to 17.7% [7], and, in May 2022, new RES targets by 2030 that would increase them to 45%, as a part of the REPowerEU plan [8]. The use of renewable energy in gross energy generation in Poland reached the value of 27.8% in 2021, while the 10-year increase ratio was equal to 9.9% [2]. According to The Institute for Renewable Energy data, the increase in the capacity of PV systems in EU countries in 2022 compared to 2021 was equal to 22%, while, for Poland, it was 61%. It is important to mention that about 70% of photovoltaic systems installed in Poland belong to prosumers [9]. Taking into consideration all regulations and national renewable energy subsidy programs, such as “My Electricity” [10,11], further growth in the photovoltaic sector is predicted [12].
All these aforementioned factors force researchers to thoroughly scrutinize the potential of photovoltaics, and, thus, assess its suitability, in various locations. Numerous scientific papers are devoted to the performance of PV systems located in Europe under real outdoor conditions. Gaglia et al. [13] presented a detailed analysis of a photovoltaic system consisting of multicrystalline modules (mc-Si) located in Athens, Greece during the summer and winter periods. The system was oriented towards the south with a tilt angle equal to 20°. The efficiency of the system under real outdoor conditions was found to be lower than the value obtained for standard test conditions (STCs). The analysis of two rooftop systems located in Trieste, Italy is presented in the work of Micheli et al. [14]. The orientations of the analyzed installations were south with a tilt angle of 10°, and south–west with an inclination equal to 30°. Due to favorable irradiations in the selected location, the yearly final yields (Yf) were determined to be 1400 kWh·kW−1 and 1277 kWh·kW−1, respectively. Another performance measurement and analysis were conducted in south-eastern Italy by Congedo et al. [15]. The analyzed system is divided into two subfields, both of which consist of monocrystalline modules (mono-Si), and is installed on the parking shelter with the azimuth towards the south and tilt angles of 3° and 15°. The values of the average monthly yield ranged from 97.88 kWh·kW−1 in December to 184.73 kWh·kW−1 in June. Several studies were also carried out for the photovoltaic system located in Polish conditions. Sarniak [16] presented research about the prosumer photovoltaic installation for a single-family house located in Poland (52°48′ N, 19°67′ E). The installation, made of polycrystalline modules with a nominal power of 270 W, is oriented towards the south with a tilt angle of 22°. The yearly final yield was found to be 1072.9 kWh·kW−1. A comprehensive review of nine photovoltaic systems, all of which are located in south-eastern Poland, is presented in the work of Gulkowski [17]. The study of the azimuth’s and the tilt angle’s influence on the final yield ratios was carried out over nearly one year of systems operation, from November 2020 to October 2021. The average final yield was 990.2 kWh·kW−1 for all systems. Depending on the PV system, the highest Yf value was found to be 1102.9 kWh·kW−1, and the lowest one was equal to 868.8 kWh·kW−1. The analysis of one year of operation (2019) of a polycrystalline system located in the city of Lublin, Poland was performed in the work of Zdyb and Szalas [18]. The analyzed installation was a low-angle tilted flat-rooftop system with a power capacity of 15 kW. The obtained results indicated that the final yield was close to 1100 kWh·kW−1. An overview of the free-standing installation, located in Lublin Voivodeship (51°51′ N latitude), in which four types of photovoltaic modules were examined, including mc-Si, is presented in [19]. The installation is oriented towards the south with an inclination of 34°. The presented data pertain to four years of operation, from 2015 to 2018. The average value of the final yield was found to be 1038.89 kWh·kW−1, ranging from 936 kWh·kW−1 for 2017 to 1130.54 kWh·kW−1 for 2018. In addition, various studies have been published on energy potential analysis under different outdoor conditions and locations by the use of specialized computer software. Haffaf et al. [20] presented the analysis of a 2.4 kW photovoltaic system, situated in France (47°43′ N, 7°18′ E); this work has also been simulated by the use of PVGIS, PV Watts, and HOMER software. The performance simulations were also carried out via PVSOL, PVGIS, SolarGIS, and SISIFO in the work of Dondaryia et al. [21], in which performance prognosis was performed for a 6.4 kW on-grid installation made of monocrystalline modules facing south with a tilt angle of 23° placed in India. Akpolat et al. [22] presented an analysis of the feasibility and applicability of on-grid photovoltaic systems in Turkey by the use of PVSOL software. A comparative comparison of predictions obtained from PVGIS, PVSOL, and PVWatts for a 6.4 kW rooftop system, situated in Cyprus, is provided in the work of Kassem et al. [23]. The simulations (PVSOL and PVsyst) were also used by Mubarak et al. [24] to examine various azimuths and tilt angles to increase self-consumption for an installation placed in Hannover (Germany). The measured data was compared with the simulated one. Kurz and Nowak [25] used PVSOL software to determine the profitability of a 5.25 kW prosumer installation, taking into consideration self-consumption and the payback time, situated in Bydgoszcz in central Poland.
Due to the increasing interest in renewable energy sources, and, thus, photovoltaic energy sources, many PV systems are installed all over the world. Nonetheless, the efficiency of photovoltaic installations is influenced by numerous factors, including climatic conditions which are strongly correlated with their locations. The performance of the installation can be determined on the basis of experimental data and by predictions obtained from specialized software. However, to the author’s best knowledge, a limited number of publications provide a comparison between measured data and values obtained from simulations. An even smaller quantity of works present the simulation results obtained from more than one simulation software. Nonetheless, the highest degree of alignment is required in order to obtain the most realistic and reliable results under different experimental conditions. The objective of this work is to present the analysis of the final yield of four photovoltaic installations located in Lublin Voivodeship, Poland, for 2022. The systems are characterized by different orientations (south, east, south–east, and east–west) and tilt angles. In addition, four types of specialized photovoltaic software, namely, DDS-Cad 16, PVGIS 5.2, PVSOL premium 2022, and the PVWatts Calculator 8.2.1, were used to simulate the investigated PV installations. A thorough analysis of the measured data and simulations is provided, with an in-depth comparison of other authors’ results presented in the literature.

2. Materials and Methods

2.1. Study Size Characteristics

Four grid-connected installations were selected for this case study, located on the rooftops of various households in eastern Poland, specifically in the Lublin Voivodeship. According to the Köppen-Geiger classification, the Lubelskie region is characterized by a warm temperate climate, fully humid with warm summers (CfB) [26]. The region has good sun exposure, which equals 1123 kWh/m2/year. Furthermore, based on the Polish standard PN-EN 12831:2006 [27], the Lublin region is located in the third climate zone with an average outdoor temperature of 7.6 °C. The installations are situated near each other, as shown in Figure 1, and, therefore, operate in the same climatic conditions. The longitude and latitude of PV1–PV4 installations are 52.65° N 23.03° E, 51.77° N 22.63° E, 51.69° N 23.22° E, and 51.29° N 22.52° E, respectively.
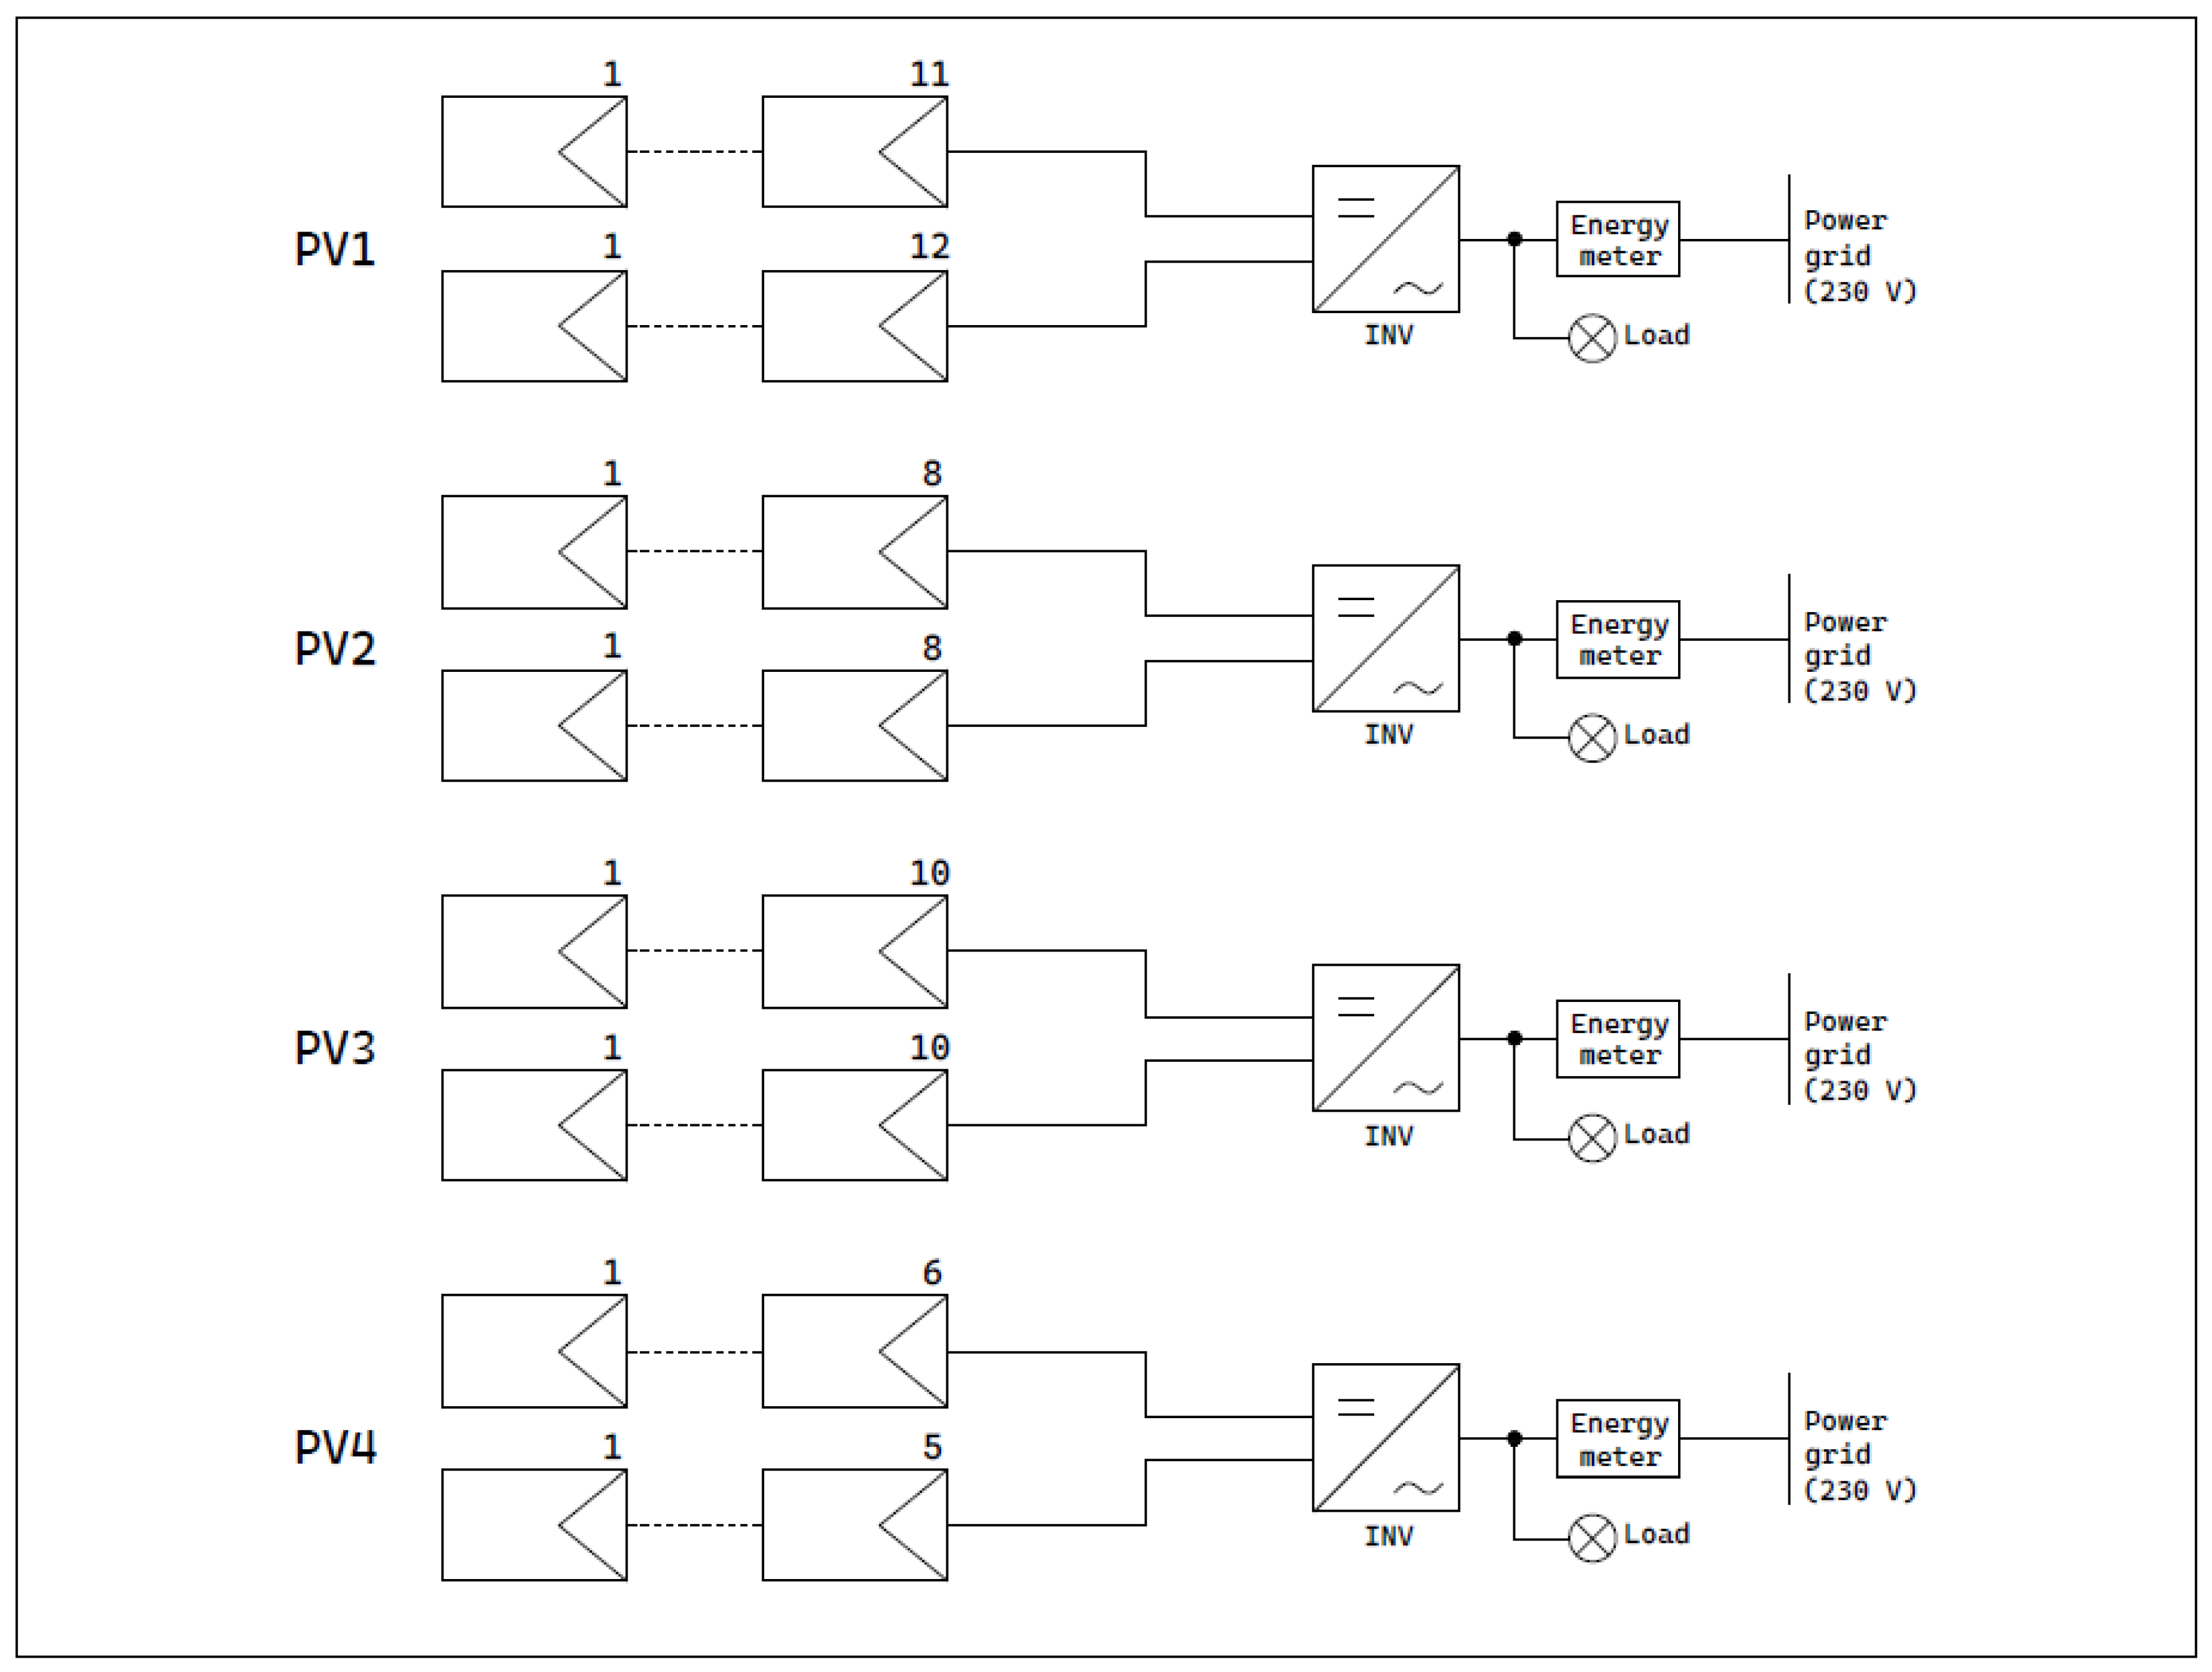
The analyzed installations were commissioned in recent years: PV1 in June 2020, PV2 in October 2020, PV3 in November 2019, and PV4 in March 2021. The PV1 is a flat-roof system with an inclination of 19° and azimuth of 145°. It is composed of 23 series-connected PV modules with a nominal power of 310 Wp. PV2, PV3, and PV4 are rooftop systems with PV modules mounted vertically, parallel to the rooftop. The nominal output of PV2 system is 5.28 kW, and it is composed of 16 modules, each with a nominal power of 330 Wp. The orientation is 102°, while the tilt angle is 35°. The PV installation of the 3rd case study consists of 22 series-connected modules, each with a nominal power of 285 Wp, facing south (175°) at an inclination of 40°. The last PV system (PV4) faces east–west and is composed of 12 PV generators, each with a power of 325 Wp, tilted at an angle of 32°. The setup is divided into 2 maximum power point trackers (MPPts), with 6 and 5 series-connected modules on each tracker, facing east and west, respectively. It is important to mention that the tilt angles of PV installation are close to the optimal tilt angle for Poland, which is about 35°. This tilt angle allows photovoltaic modules to capture the optimal amount of solar irradiation. Since the installations are mounted on the roofs of real households, they are cleaned naturally with rainfall, and no additional cleaning methods are implemented. The detailed data about analyzed systems can be found in Table 1. Information about modules and inverters in standard test conditions (STC; T = 25 °C, G = 1000 W/m2, AM 1.5) is presented in Table 2 and Table 3, respectively. Monocrystalline modules were used in each installation, with efficiency ranging from 18.90% to 19.60%. All of the installations were made of 2 strings, each connected to a different MPP tracker. The inverters, which main role is to convert the DC (direct current) to AC (alternating current), have an efficiency no smaller than 98%. The schematic diagrams of analyzed PV1–PV4 systems is presented in Figure A1, Appendix A.

2.2. Calculation of Final Yield

To evaluate the performance of the photovoltaic system, several important parameters must be calculated using data obtained during operation. This allows for a comparison of PV installation in a specific geographic area. The output power data were collected by inverters’ monitoring software, Solarman Smart 1.7.1, in a time interval of 5 min. The final yield (Yf,m) value can be defined as daily, monthly, or annual energy output (EAC) divided by the rated peak power (PPV,rated) of the photovoltaic system measured at standard test conditions according to Equation (1) [28,29]. Thus, the value of the monthly final yield ( E A C , m ) can be calculated as shown in Equation (2) where E A C , d is the daily final yield and N is a number of days of the month. The daily final yield can be determined according to Equation (3), where P A C , i is the i-th recorded value of the output AC power, and τ i is the i-th time interval.
Y f , m = E A C , m P P V , r a t e d   k W h · k W 1
E A C , m = d = 1 N E A C , d
E A C , d = i = 1 k P A C , i   · τ i

2.3. Performance Analysis Using Selected Photovoltaic Software

To compare the energy yields of the PV1–PV4 installations, specialized computer software was used to conduct thorough simulations. DDS-Cad, PVSOL, PVWatts Calculator, and PVGIS software were utilized to simulate all installations, allowing for monthly and yearly solar energy yield predictions based on input data. Detailed information about software is depicted in Table 4. All relevant information, including module working parameters, inverter specifications, number of modules, and photovoltaic system configurations, was carefully mapped. Additionally, the orientation and tilt angles of the modules were taken into consideration.

2.3.1. DDS-Cad

DDS-Cad is an advanced software for the comprehensive design of photovoltaic installations integrated with the building, as well as PV farms [30]. Additionally, this software enables the effective design of not only photovoltaic installations but also electrical, sanitary, heating, ventilation, and air-conditioning installations. However, in this case study, only the photovoltaic functions were used. With the use of this software, full design documentation can be created, including results of calculations, 2D and 3D drawings, and final reports with monthly and yearly energy yields. Firstly, it is necessary to create a building model based on DWG, PDF, or JPG file. This prototype can be easily transformed into a three-dimensional model, on which the photovoltaic installation is based. To create a model of the PV system, input data such as localization, azimuth, rooftop characteristics, and detailed information about module working parameters are required. The implemented Polysyn Inside software is used to carry out the solar system simulations based on the parameters of the inverters and the proposed configuration of the system. The important part of designing in DDS-Cad software is sizing the cables and planning the cables’ route. For simulations, climate data are taken from Meteonorm 8 software for the selected locations. The final report contains detailed information about the components and working parameters of the designed installation. The visualizations of four installations made by DDS-Cad software are shown in Figure 2.

2.3.2. PVSOL

PVSOL software is used for designing and simulating various types of photovoltaic systems, such as on-grid and off-grid systems, including rooftop installations, solar power plants, and electric vehicle charging stations [31]. To design a PV installation, detailed information about the installation type and localization must be provided. It is possible to use cadastral or satellite maps, as well as architectural plans. Then, based on the modules’ working parameters, the photovoltaic installation can be sized, taking into consideration the roof structure. The three-dimensional model assists in precisely determining shading areas to avoid a reduction in energy yield. The system configuration is selected based on detailed information about the inverter. The source of the climate data is Meteonorm software. All technical details and simulation results are compiled in the final project report.

2.3.3. PVGIS

PVGIS stands for Photovoltaic Geographical Information System [32], which provides information about solar radiation and estimates the energy generation potential of the designed photovoltaic installation. The tool has three main parts dedicated to solar radiation and temperature, the performance of the photovoltaic installation, and a typical meteorological year (TMY). The analysis is possible for locations in Europe, Africa, and, partially, in Asia and America. The software provides data of monthly, daily, and hourly average values of radiation and temperature. Additionally, the Typical Meteorological Year tool enables generation of a set of meteorological data (such as global horizontal irradiance, diffuse horizontal irradiance, air pressure, wind speed, and wind direction) for every hour of the year. Based on input data, including photovoltaic module technology, the nominal power of the PV system, system losses, tilt angle, and azimuth, the user can calculate the long-term average energy output from a grid-connected or off-grid system, as well as tracking PV systems. The results can be presented in the report or CSV format.

2.3.4. PVWatts Calculator

PVWatts Calculator is an online tool provided by NREL (US National Renewable Energy Laboratory, Golden, CO, USA) [33], used for predicting the performance of photovoltaic systems connected to the grid. Based on the location and the physical characteristics of the photovoltaic system, the simulation of the global annual energy production of PV systems is carried out. Despite the fact that PVWatts Calculator makes assumptions about detailed parameters of PV components, general information about the system is required, such as array type, system losses, tilt and the azimuth of the installation, inverter efficiency, ground coverage ratio, or albedo. It is important to highlight that the software only works for typical crystalline silicon or thin-film modules. The solar resource data are provided by the NREL National Solar Radiation Database (NSRDB) for locations that are covered by this database, while Solar and Wind Energy Resource Assessment Programme (SWERA) and The ASHRAE International Weather for Energy Calculations Version 1.1 (IWEC) are used for the rest of the world.

3. Results and Discussion

3.1. Weather Data Analysis

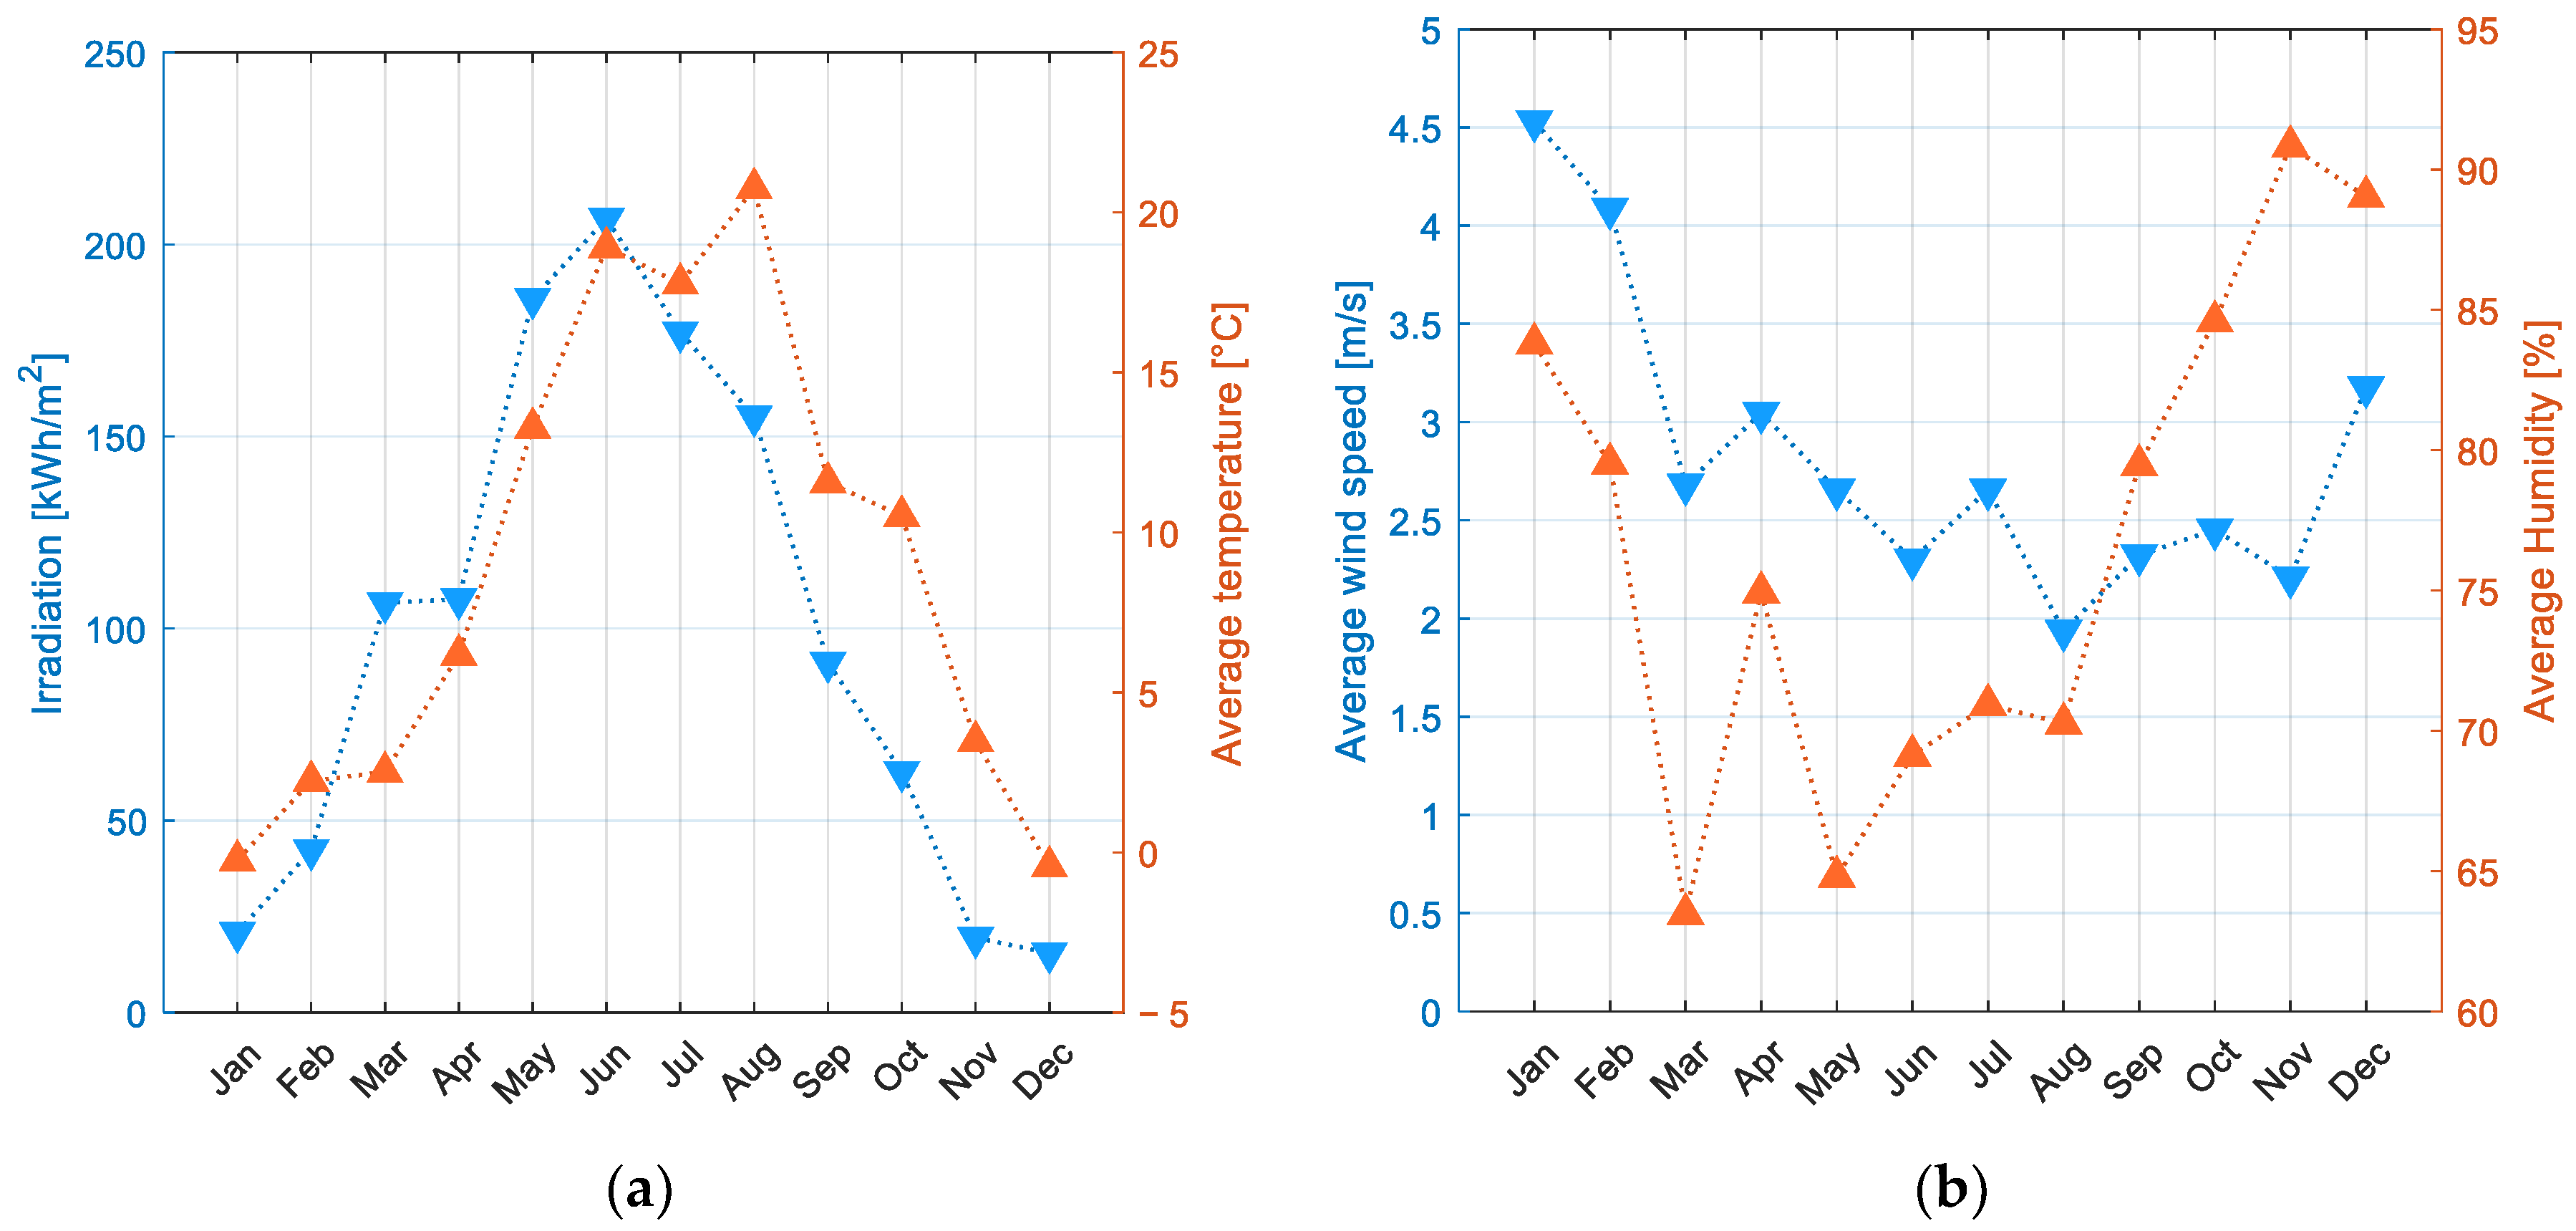
The climatic data were analyzed in terms of the outside temperature, irradiation, wind speed, and humidity for the year 2022. The minimum and maximum values of the temperature (T), wind speed (V), and humidity (HU) can be found in Table 5. The T, V, and HU data were acquired from the Institute of Meteorology and Water Management (IMGW) for the Lublin Radawiec weather station [34]. The data were collected every 10 min daily. The measurements of the global horizontal irradiance (GHI) were carried out with the use of a Kipp & Zonen pyranometer, CMP11 model, in the Wlodawa weather station [34]. The data were collected every minute. The locations of the weather stations are shown in Figure 1.
Figure 3a depicts the average outside temperature and global horizontal irradiation. The outside temperature gradually rose from January to August, with significant temperature drops in July, reaching an average value of 20.75 °C. In the second half of the year, average temperature values decreased, reaching the lowest value of −0.44 °C in December. The selected area in 2022 was characterized by favorable irradiance conditions with the highest irradiation observed in June with the value of 206.73 kWh/m2. The winter months received the lowest irradiation, reaching a minimum value which was equal to 15.49 kWh/m2 in December. It is important to highlight that March and April were characterized by remarkably similar irradiation. The registered value in March was 106.65 kWh/m2, while, in April, it was 107.64 kWh/m2. The average humidity and wind speed recorded at this weather station are depicted in Figure 3b. The highest average monthly wind speeds occurred during winter, particularly in January (4.53 m/s) and February (4.08 m/s), while the lowest appeared in August with a value of 1.93 m/s. In general, the selected location exhibits humidity levels exceeding 70%, peaking in November (90.83%) and dipping to its lowest value of 63.47% in March.

3.2. Analysis of Energy Output

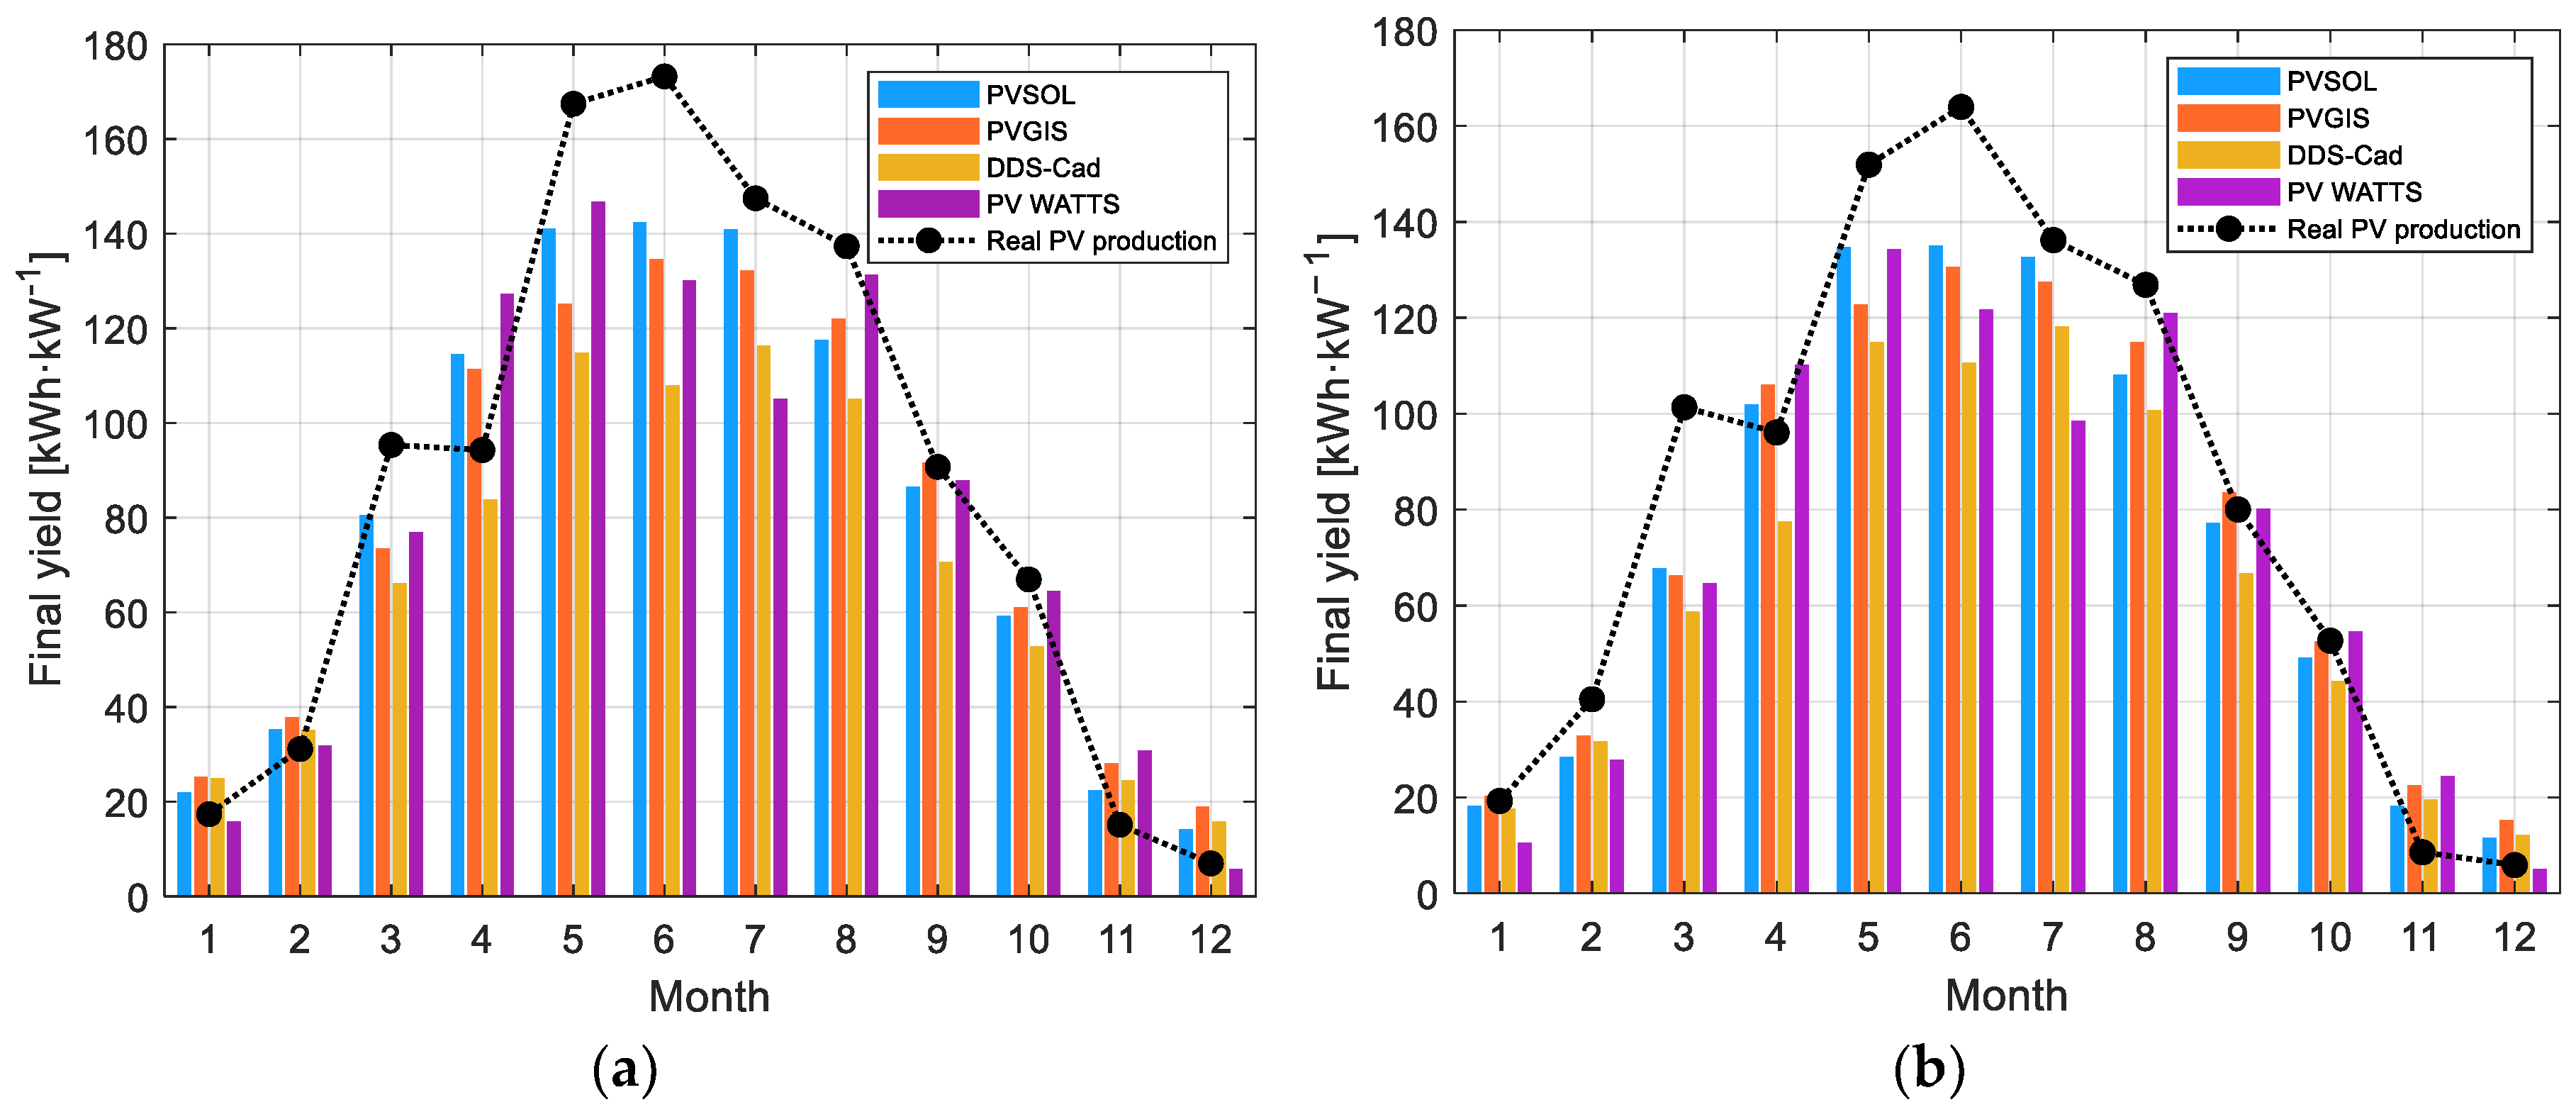
Figure 4a depicts the measured and simulated values of the monthly final yield (Yf) for the PV1 installation with an azimuth of 145°, and a tilt angle equal to 19°. The data were gathered over one year of operation (2022). PV system production ranges from 6.94 kWh·kW−1 in December to 173.21 kWh·kW−1 in June. The annual energy production was 1043.17 kWh·kW−1. Similar values were observed in the paper of Zdyb and Szalas [18] in which the photovoltaic installation operating in Lublin, Poland was analyzed. It is important to emphasize that both installations are situated in nearly the same location. The PV array with a tilt angle of 14° is oriented to the south. The annual final yield of the mc-Si installation was noticed to be 1098 kWh·kW−1, with the value of the final yield in June equal to 179.11 kWh·kW−1. In the work of Gulkowski [17], several photovoltaic installations, located in the Lublin area, were analyzed, one of which faced south–east with a tilt angle of 25°. The presented hybrid system was made of monocrystalline modules with an efficiency of 17.7%; however, every two modules were connected to SolarEdge power optimizers. The annual final yield was determined to be 978.1 kWh·kW−1. In the work of Sarniak [16], the 22°-tilted rooftop photovoltaic installation, oriented towards the south and located in central Poland, was analyzed. The value of the average annual yield was 1072.9 kWh·kW−1.
A bell-shaped curve can be observed, indicating a trend of lower energy production during winter and significantly higher production in the summer months. We can see that 77.68% of the annual yield was produced from April to September. Similar observations can also be found in papers [16,17,18]. The same trend can be seen in data gathered from the PVSOL and PVGIS simulations, while some deviations are observed in June for the DDS-Cad software, and, in June and July, for the PVWatts Calculator. During the winter time, the gathered Yf values from computer software closely approximate the measured data, with negligible differences observed specifically in January, February, November, and December. In sunny months, especially in June, the measured values are moderately higher than the simulated ones. Energy production values gathered from PVSOL and PVGIS software are highly accurate, whereas data determined by DDS-Cad and the PVWatts Calculator are underestimated. The least amount of accuracy was noticed in the DDS-Cad predictions. The average measured monthly final yield is 86.93 kWh·kW−1, while the values obtained by PVSOL, PVGIS, DDS-Cad, and the PVWatts Calculator are 81.34 kWh·kW−1, 80.10 kWh·kW−1, 68.16 kWh·kW−1, and 79.5 kWh·kW−1, respectively.
The results obtained for the PV2 installation, characterized by an azimuth of 102° and a tilt angle of 35°, are presented in Figure 4b. As was mentioned before, the tilt angle is optimal for Polish conditions; however, the azimuth significantly deviates from the optimal one. The energy production varied from 5.9 kWh·kW−1 to 163.97 kWh·kW−1 with the lowest value registered in December 2022 and the highest in June 2022. The energy yield values in March were higher than in April, which was also observed in PV1’s operation. This can be explained by the relatively high irradiation registered in March, closely comparable to April, while the average outside temperature in March was significantly lower than in April. The final yield factor was calculated to be 983.36 kWh·kW−1, with 77% of the energy produced in the summer period (from April to September). The significant decrease in the final yield value, compared to PV1, can be explained by the unfavorable azimuth orientation. Nonetheless, the trend demonstrating the final yield factor corresponds to both the PV1 and PV2 systems. In the paper [17], the system located in the Lublin region, consisting of 20 mono-Si PV modules tilted at 30° and oriented at 135°, obtained a value of the annual final yield equal to 895.7 kWh·kW−1. In the work of Olczak [35], the operation of photovoltaic installations located in the Mazowieckie Voivodeship in Poland (52°03′ N latitude) was examined. The installation’s azimuth is 140° with an inclination of 30°. The PV array consists of 10 monocrystalline modules (440 Wp), separated into three subfields, all of which are connected to microinverters. The final yield of the presented system was 995 kWh·kW−1, which is comparable in value to that obtained for PV2.
The PV2 system was also carefully mapped and then simulated using specialized software. The predicted values for the winter period closely approximate the measured ones, while, during the summer months, the real values surpass those obtained from simulations. The result with the highest accuracy is PVGIS software with the final yield value of 895.04 kWh·kW−1, followed closely by the PVSOL result, which is 883.19 kWh·kW−1. The predicted values of Yf presented from the PVWatts Calculator are slightly lower and are equal to 853.03 kWh·kW−1. The most significant deviation can be seen from DDS-Cad software with the prediction of 772.54 kWh·kW−1. The PVSOL software’s predictions are better in the summer period, while PVGIS demonstrates better alignment in the winter months. It is important to note that all predicted values were underestimated compared to the measured data.
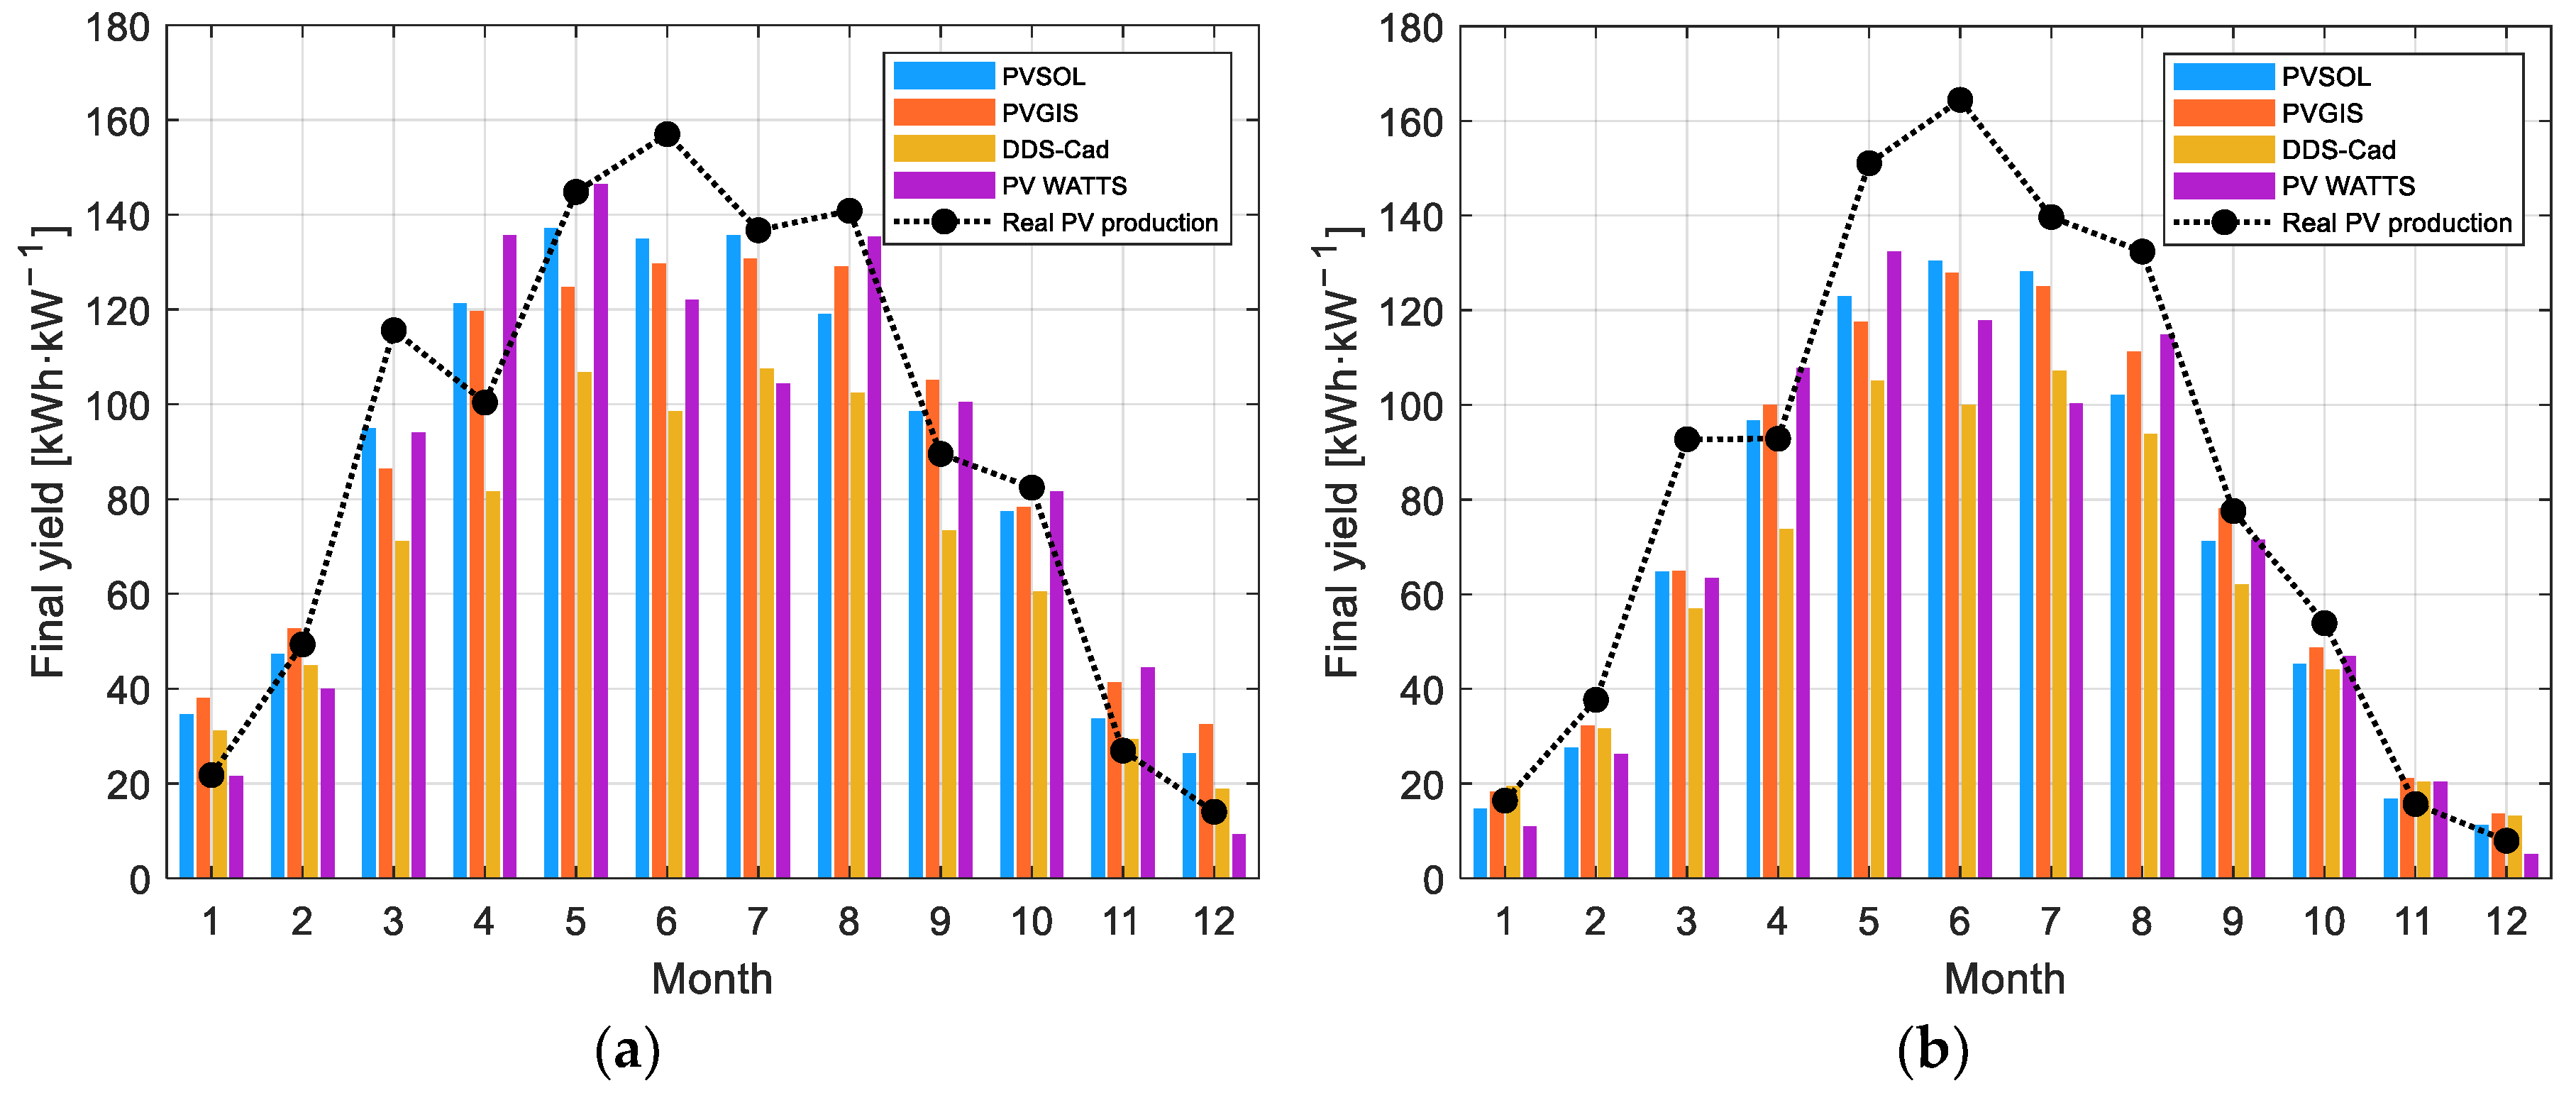
The PV3 system is oriented towards the south with an inclination of 40°. Those parameters are closely approximated to the optimal ones from Poland, which are a south azimuth and tilt angle of 35–36°. The highest results were obtained in June, equating to 157.01 kWh·kW−1, and the lowest ones were in December, with a value of 14.02 kWh·kW−1. The bell-shaped curve can be seen from the measured values, with a small deviation in April, which is shown in Figure 5a. However, this deviation was also present in the operation of PV1 and PV2. The annual final yield was found to be 1079.44 kWh·kW−1 with 71% of the energy produced in the sunnier half of the year. Similar values were revealed in the work of Zdyb and Gulkowski [19]. The subfield, consisting of polycrystalline modules, obtained the average annual final yield of 1038.89 kWh·kW−1. The efficiency of the pc-Si modules was 15.4%, while that of monocrystalline used in PV3 was 18.9%, which is likely why the obtained Yf value is slightly lower than for PV3. The results indicate that 75% of the energy is produced in sunny months. The predictions of Yf, obtained by selected software, indicate a slightly better fit compared to the PV1 and PV2 systems. The greatest conformity can be seen in May for the PVWatts Calculator and in July for PVSOL. Nonetheless, the best predictions were computed by PVGIS, followed closely by PVSOL, with average annual final yields of 89.03 kWh·kW−1 and 88.39 kWh·kW−1, respectively, while the value obtained from the measured data was 89.95 kWh·kW−1. The DDS-Cad software provided underestimated results by approximately 25%. The deviation in the trend of the bell-shaped curve can be seen in April when the measured values are lower than the predictions.
The last photovoltaic system (PV4) is oriented east–west with a tilt angle of 32°. Six series-connected modules face west, while the other five are oriented eastward. Figure 5b depicts the final energy yield obtained from both subfields. Low values of Yf were registered during the winter months, reaching a minimum in December with a value equal to 7.92 kWh·kW−1. The operation of the system in the summer months resulted in a 77% energy production with a peak observed in June with a value of 164.44 kWh·kW−1. The annual final yield was determined to be 982.29 kWh·kW−1. In a bell-shaped trend of energy production, the deviation is visible in April. However, the energy production values in March and April were remarkably similar and were equal to 92.73 kWh·kW−1 and 92.84 kWh·kW−1, respectively. In the work of Gulkowski [17], an east–west-oriented photovoltaic system was also analyzed. The presented PV array, located in the Lublin Voivodeship, is composed of 12 series-connected monocrystalline modules with half-cut technology, which were inclined at 30°. The efficiency of the modules was 18.7%. The author declared the final yield to be 868.8 kWh·kW−1. All simulations for the PV4 system were carefully made, taking into consideration the east–west configuration of the system. The predictions received from specialized software were significantly underestimated, particularly in the summer months and March. The worse conformity can be seen in May, June, and July. The simulated data obtained from PVGIS software were the closest to the measured values; nonetheless, the average difference was about 13% with the predicted final yield value of 858.63 kWh·kW−1. PVSOL indicates slightly worse alignment (Yf = 831.87 kWh·kW−1), closely followed by the PVWatts Calculator (Yf = 817.60 kWh·kW−1). The predictions presented by DDS-Cad were underestimated by approximately 25%.
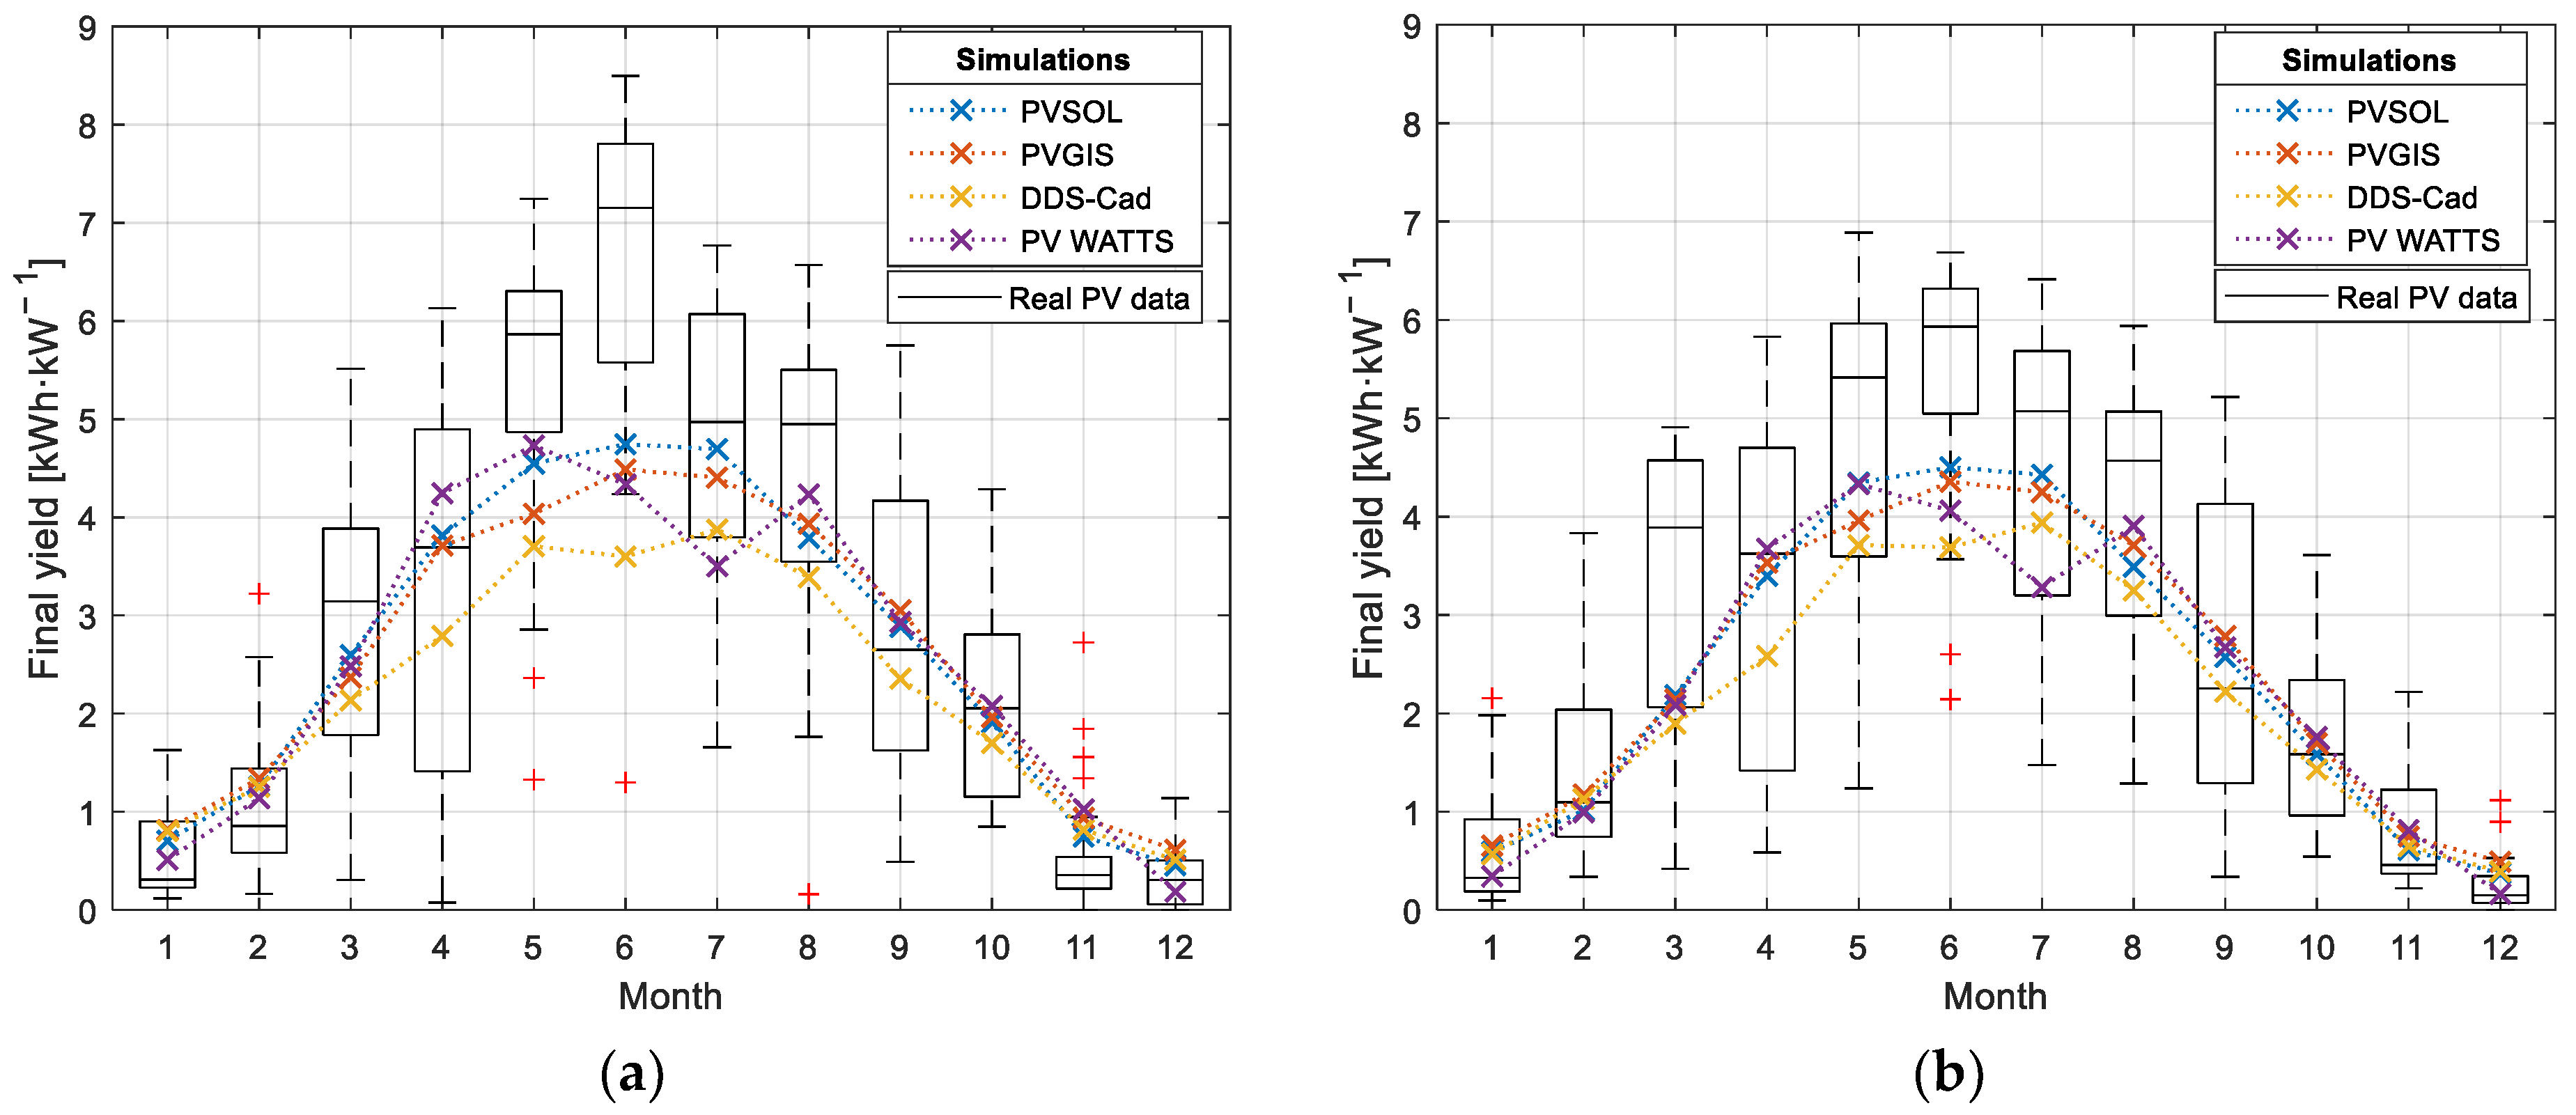
The boxplot of the measured daily final yield values in each month of 2022 with the average computed values is presented in Figure 6a for the PV1 system, and for the PV2 in Figure 6b. The interquartile ranges are considerably higher for the summer months, which is correlated with the variability in energy production. In the case of PV1, the wide interquartile ranges of daily yields were observed from March to September, with the widest distribution registered in April. Nonetheless, the daily highest values were obtained for June, while the daily final yield varied from 1.3 kWh·kW−1 to 8.50 kWh·kW−1 with a median equal to 7.16 kWh·kW−1. The narrowest interquartile range was registered in December with a median of 0.3 kWh·kW−1. The highest average energy output value was found in June, equal to 6.21 kWh·kW−1, while the lowest was for December (0.35 kWh·kW−1). The average daily energy production values obtained from simulations in most cases largely aligned with the middle 50% of the measured data. The underestimation is clearly visible, especially in May and June, while an opposite scenario can be observed in November and December.
The daily final yield values obtained for PV2 were lower compared to those registered for PV1. It can be explained by the nonoptimal azimuth of the photovoltaic system. The highest daily value of 6.88 kWh·kW−1 was registered in May; however, the interquartile range representing June is the highest. The values for June are characterized by a concentrated distribution represented by the value of the first quartile equal to 5.05 kWh·kW−1 and the third one of 6.32 kWh·kW−1. It is important to highlight that the median values for May, June, and July are close to each other, and equal to 5.41 kWh·kW−1, 5.93 kWh·kW−1, and 5.07 kWh·kW−1, respectively. However, taking into consideration the mean value, the highest one was in June (5.46 kWh·kW−1), while May and July obtained the lower values, 4.9 kWh·kW−1 and 4.39 kWh·kW−1, respectively. The average simulated daily energy production values exhibit the same trend observed for PV1 with a substantial drop in July for the PVWatts Calculator predictions. However, it is important to mention that the simulations are underestimated only for June, and slightly overestimated for December.
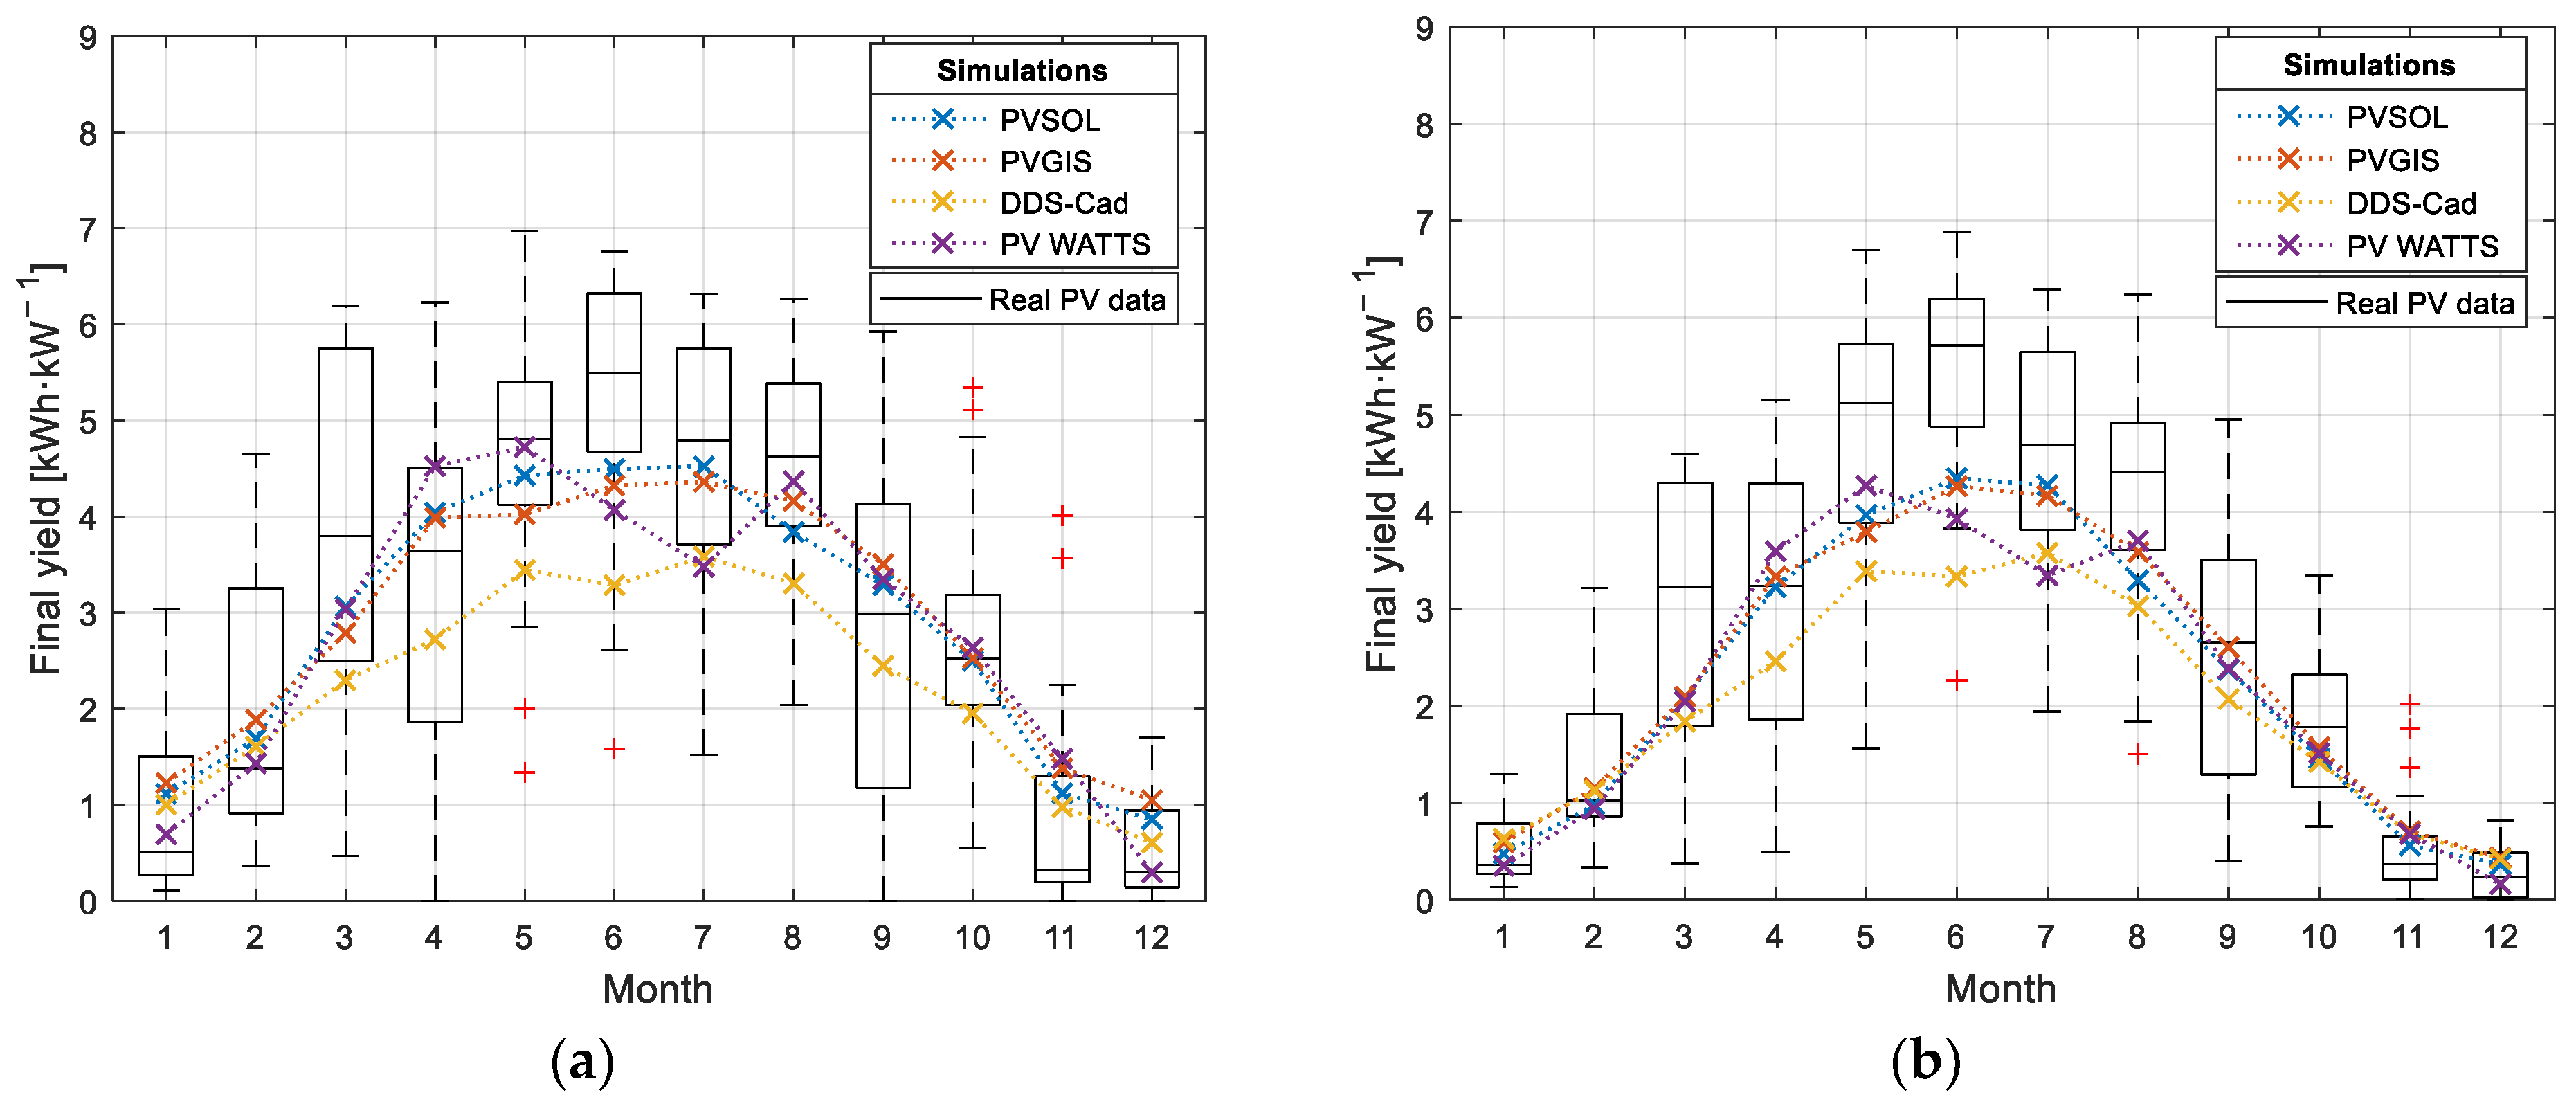
The daily final yield distributions for PV3 and PV4 are presented in Figure 7a,b, respectively. The PV3 system, which is characterized by an almost optimal azimuth and tilt angle, obtained wider interquartile ranges compared to the other installations. The values obtained for the winter months (January, February, November, and December, especially) are spread out over a larger range. The highest registered daily value of the final yield was 6.97 kWh·kW−1 in May, which is very close to the value obtained, also in May, for the PV2 system. The highest median and mean values were calculated in June, and they equal 5.49 kWh·kW−1 and 5.23 kWh·kW−1, respectively. The best correlation between the simulations and measured data can be seen in October, in which only the DDS-Cad predictions are underestimated and they are slightly below the interquartile range.
The same trends can be observed in the results obtained for the PV4 installation. The highest values of the daily final yield were obtained in May, which is characterized by the first quartile equal to 4.87 kWh·kW−1 and the third one of 6.19 kWh·kW−1. The median value was equal to 5.72 kWh·kW−1. The calculated mean values were in the range of 0.29 kWh·kW−1 for December to 5.48 kWh·kW−1 for June. The simulation made for the PV4 system is underestimated for four summer months, especially for June; however, the predictions for the winter months indicate the highest degree of alignment with the real data. The closest simulation values, within all predictions made for the PV2–PV4 systems, were obtained for October.
A comparison of the measured and simulated annual values of the final yield factors for the analyzed systems is presented in Table 6. As can be seen, all performed simulations are underestimated compared to the measured values. However, the best overall fit was obtained for the PV3 system, which has the closest approximated azimuth and tilt angle to the optimal ones from Poland. The degree of alignment was 99%, 98%, and 96% for PVGIS, PVSOL, and the PVWatts Calculator, respectively. The predictions carried out by DDS-Cad corresponded to the measured values in 77%. The data obtained for PV4 (east–west system) demonstrated the weakest alignment, since the degree of fit was 87%, 84%, 83%, and 74% for PVGIS, PVSOL, the PVWatts Calculator, and DDS-Cad, respectively.

4. Conclusions

A comparative analysis of the measured data and simulations for four photovoltaic systems was carried out. The photovoltaic installations, all of which are located in the Lublin Voivodeship, Poland, with various orientations (S, E, SE, and E–W) and tilt angles, were analyzed. The data were collected during one year of operation (2022). The prediction of the energy yield while designing the photovoltaic installation is crucial, and, nowadays, is required to complement the project. Four different commercially available software tools, namely, DDS-Cad, PVSOL, the PVWatts Calculator, and PVGIS, were used to execute the simulations, and, thus, obtain information about the monthly and yearly energy yield based on input data. A comparative comparison between various software energy outputs and real production data is essential to gain knowledge about the accuracy and reliability of the performed simulations.
The annual final yield of the PV1, PV2, PV3, and PV4 system was 1043.16 kWh·kW−1, 983.36 kWh·kW−1, 1079.45 kWh·kW−1, and 982.30 kWh·kW−1, respectively. Therefore, the average value for the photovoltaic system located in this area was 1022.07 kWh·kW−1 during the measurement period. The obtained results can be compared with the range of values reported for Poland, especially in the Lublin Voivodeship. The highest final yield ratio was obtained for PV3, which is oriented towards the south and the tilt angle was close to optimal for Poland, while the lowest one was for the east–west system (PV4). It is important to highlight that the results obtained for the PV2 system, which is oriented towards the east (102°), were very close to those for PV4. A wide range of daily yields, approximately 77% of the total energy yield, was registered in the sunny months, which is consistent with other authors’ results. The winter months demonstrated low values of energy generation, which is related to the relatively short day, and, thus, small number of sunshine hours, in the location under study. The summer half of the year is characterized by a wide range of daily final yields, e.g., values from 1.24 kWh·kW−1 to 6.89 kWh·kW−1 were registered in May for PV2.
The predictions computed by simulation software were compared with the measured data. The results indicated that simulations perform the highest degree of alignment in the winter months, while, for the summer months, they are significantly underestimated. The predictions for June demonstrated underestimation in all analyzed cases. However, it is worth mentioning that the results of the simulations are applicable not only to the Poland case study but also to other locations with similar latitudes, such as Germany, the Netherlands, and Belgium.
The data obtained from PVGIS simulations present the best fit, with an average of 92% compared to real values, despite the lack of the possibility to enter detailed information about PV modules or inverters. This is closely followed by the simulation made by PVSOL with an average 91% degree of alignment. Relatively close to the measured values were also predictions computed by the PVWatts Calculator, which demonstrate 89% of alignment. DDS-Cad is the software that underestimates the most and shows the least degree of matching, about 77%. In addition, DDS-Cad predictions do not indicate a bell-shaped curve trend of energy production, since a considerable drop can be seen in June for all analyzed installations.
Future work is going to include a comparative analysis of the higher number of PV real-system data located not only in the east–south but also in other sites of Poland, with the results obtained from prediction software.

Funding

This research was supported by the statutory funds granted to the Faculty of Environmental Engineering, Lublin University of Technology, Poland, grant number FD-20/IS-6/999.

Data Availability Statement

Not applicable.

Acknowledgments

The author would like to thank Tomasz Szczepaniuk for providing the data of photovoltaic installations for analysis, Anna Szewczykowska from IMGW for providing the irradiance data, and Slawomir Gulkowski for scientific support.

Conflicts of Interest

The author declares no conflict of interest.

Appendix A

Figure A1. Schematic diagram of analyzed PV1–PV4 systems.
Energies 16 05975 g0a1

References

  1. DNV. Energy Transition Outlook 2022. In A Global and Regional Forecast to 2050; DNV: Oslo, Norway, 2023. [Google Scholar]
  2. BP. Bp Statistical Review of World Energy 2022; BP: London, UK, 2022. [Google Scholar]
  3. EMBER. European Electricity Review 2022; EMBER: London, UK, 2022. [Google Scholar]
  4. United Nations Framework Convention on Climate Change. Paris Agreement. 2015. Available online: https://unfccc.int/sites/default/files/english_paris_agreement.pdf (accessed on 14 June 2023).
  5. Ministry of Climate and Environment. Poland’s National Energy and Climate Plan for the Years 2021–2030 (NECP PL); Ministry of Climate and Environment: Warsaw, Poland, 2021.
  6. Regulation (EU) 2018/1999 of European Parliament and of the Council of 11 December 2018 on the Governance of the Energy Union and Climate Action, Amending Regulations (EC) No 663/2009 and (EC) No 715/2009 of the European Parliament and of the Council, Directives 94/22/EC, 98/70/EC, 2009/31/EC, 2009/73/EC, 2010/31/EU, 2012/27/EU and 2013/30/EU of the European Parliament and of the Council, Council Directives 2009/119/EC and (EU) 2015/652 and Repealing Regulation (EU) No 525/2013 of the European Parliament and of the Council 2018. Available online: https://eur-lex.europa.eu/legal-content/EN/TXT/?uri=uriserv%3AOJ.L_.2018.328.01.0001.01.ENG (accessed on 14 June 2023).
  7. Proposal for a Regulation of the European Parliament and of the Council Amending Regulation (EU) 2018/842 on Binding Annual Greenhouse Gas Emission Reductions by Member States from 2021 to 2030 Contributing to Climate Action to Meet Commitments under the Paris Agreement 2021. Available online: https://eur-lex.europa.eu/legal-content/en/ALL/?uri=CELEX%3A52021PC0555 (accessed on 14 June 2023).
  8. European Parliament. Revision of the Renewable Energy Directive: Fit for 55 Package. In EU Legislation in Progress’ Briefings, 3rd ed.; European Parliament: Strasbourg, France, 2021. [Google Scholar]
  9. IEO. Photovoltaic Market in Poland 2022; IEO: Warsaw, Poland, 2023. [Google Scholar]
  10. Olczak, P.; Matuszewska, D.; Kryzia, D. ”Mój Prąd” as an Example of the Photovoltaic One off Grant Program in Poland. Polityka Energ. Energy Policy J. 2020, 23, 123–138. [Google Scholar] [CrossRef]
  11. Iskandarova, M.; Dembek, A.; Fraaije, M.; Matthews, W.; Stasik, A.; Wittmayer, J.M.; Sovacool, B.K. Who Finances Renewable Energy in Europe? Examining Temporality, Authority and Contestation in Solar and Wind Subsidies in Poland, the Netherlands and the United Kingdom. Energy Strategy Rev. 2021, 38, 100730. [Google Scholar] [CrossRef]
  12. Ministerstwo Klimatu i Srodowiska. Polityka Energetyczna Polski 2040, Zalacznik do Uchwaly nr 22/2021 Rady Ministrow z Dnia 2 Lutego 2021 r; Ministerstwo Klimatu i Srodowiska: Warsaw, Poland, 2021. (In Polish)
  13. Gaglia, A.G.; Lykoudis, S.; Argiriou, A.A.; Balaras, C.A.; Dialynas, E. Energy Efficiency of PV Panels under Real Outdoor Conditions–An Experimental Assessment in Athens, Greece. Renew. Energy 2017, 101, 236–243. [Google Scholar] [CrossRef]
  14. Micheli, D.; Alessandrini, S.; Radu, R.; Casula, I. Analysis of the Outdoor Performance and Efficiency of Two Grid Connected Photovoltaic Systems in Northern Italy. Energy Convers. Manag. 2014, 80, 436–445. [Google Scholar] [CrossRef]
  15. Congedo, P.M.; Malvoni, M.; Mele, M.; De Giorgi, M.G. Performance Measurements of Monocrystalline Silicon PV Modules in South-Eastern Italy. Energy Convers. Manag. 2013, 68, 1–10. [Google Scholar] [CrossRef]
  16. Sarniak, M.T. Researches of the Impact of the Nominal Power Ratio and Environmental Conditions on the Efficiency of the Photovoltaic System: A Case Study for Poland in Central Europe. Sustainability 2020, 12, 6162. [Google Scholar] [CrossRef]
  17. Gulkowski, S. Specific Yield Analysis of the Rooftop PV Systems Located in South-Eastern Poland. Energies 2022, 15, 3666. [Google Scholar] [CrossRef]
  18. Zdyb, A.; Szałas, G. Rooftop Low Angle Tilted Photovoltaic Installation under Polish Climatic Conditions. J. Ecol. Eng. 2021, 22, 223–233. [Google Scholar] [CrossRef] [PubMed]
  19. Zdyb, A.; Gulkowski, S. Performance Assessment of Four Different Photovoltaic Technologies in Poland. Energies 2020, 13, 196. [Google Scholar] [CrossRef] [Green Version]
  20. Haffaf, A.; Lakdja, F.; Ould Abdeslam, D.; Meziane, R. Monitoring, Measured and Simulated Performance Analysis of a 2.4 KWp Grid-Connected PV System Installed on the Mulhouse Campus, France. Energy Sustain. Dev. 2021, 62, 44–55. [Google Scholar] [CrossRef]
  21. Dondariya, C.; Porwal, D.; Awasthi, A.; Shukla, A.K.; Sudhakar, K.; Murali Manohar, S.R.; Bhimte, A. Performance Simulation of Grid-Connected Rooftop Solar PV System for Small Households: A Case Study of Ujjain, India. Energy Rep. 2018, 4, 546–553. [Google Scholar] [CrossRef]
  22. Akpolat, A.N.; Dursun, E.; Kuzucuoğlu, A.E.; Yang, Y.; Blaabjerg, F.; Baba, A.F. Performance Analysis of a Grid-Connected Rooftop Solar Photovoltaic System. Electronics 2019, 8, 905. [Google Scholar] [CrossRef] [Green Version]
  23. Kassem, Y.; Al Zoubi, R.; Gökçekuş, H. The Possibility of Generating Electricity Using Small-Scale Wind Turbines and Solar Photovoltaic Systems for Households in Northern Cyprus: A Comparative Study. Environments 2019, 6, 47. [Google Scholar] [CrossRef] [Green Version]
  24. Mubarak, R.; Weide Luiz, E.; Seckmeyer, G. Why PV Modules Should Preferably No Longer Be Oriented to the South in the Near Future. Energies 2019, 12, 4528. [Google Scholar] [CrossRef] [Green Version]
  25. Kurz, D.; Nowak, A. Analysis of the Impact of the Level of Self-Consumption of Electricity from a Prosumer Photovoltaic Installation on Its Profitability under Different Energy Billing Scenarios in Poland. Energies 2023, 16, 946. [Google Scholar] [CrossRef]
  26. Kottek, M.; Grieser, J.; Beck, C.; Rudolf, B.; Rubel, F. World Map of the Köppen-Geiger Climate Classification Updated. Meteorol. Z. 2006, 15, 259–263. [Google Scholar] [CrossRef] [PubMed]
  27. PN–EN 12831:2006; Instalacje Ogrzewcze w Budynkach. Metoda Obliczania Projektowego Obciążenia Cieplnego: Warsaw, Poland, 2006. (In Polish)
  28. Kymakis, E.; Kalykakis, S.; Papazoglou, T.M. Performance Analysis of a Grid Connected Photovoltaic Park on the Island of Crete. Energy Convers. Manag. 2009, 50, 433–438. [Google Scholar] [CrossRef]
  29. Ayompe, L.M.; Duffy, A.; McCormack, S.J.; Conlon, M. Measured Performance of a 1.72kW Rooftop Grid Connected Photovoltaic System in Ireland. Energy Convers. Manag. 2011, 52, 816–825. [Google Scholar] [CrossRef] [Green Version]
  30. DDScad, Graphisoft. Available online: https://graphisoft.com/solutions/ddscad (accessed on 14 June 2023).
  31. Design and Simulation Software for Renewable Energy|Valentin Software. Available online: https://valentin-software.com/en/ (accessed on 14 June 2023).
  32. JRC Photovoltaic Geographical Information System (PVGIS)-European Commission. Available online: https://re.jrc.ec.europa.eu/pvg_tools/en/ (accessed on 14 June 2023).
  33. PVWatts Calculator. Available online: https://pvwatts.nrel.gov/ (accessed on 14 June 2023).
  34. Instytut Meteorologii i Gospodarki Wodnej-Państwowy Instytut Badawczy. Available online: https://www.imgw.pl/ (accessed on 14 June 2023).
  35. Olczak, P. Energy Productivity of Microinverter Photovoltaic Microinstallation: Comparison of Simulation and Measured Results—Poland Case Study. Energies 2022, 15, 7582. [Google Scholar] [CrossRef]
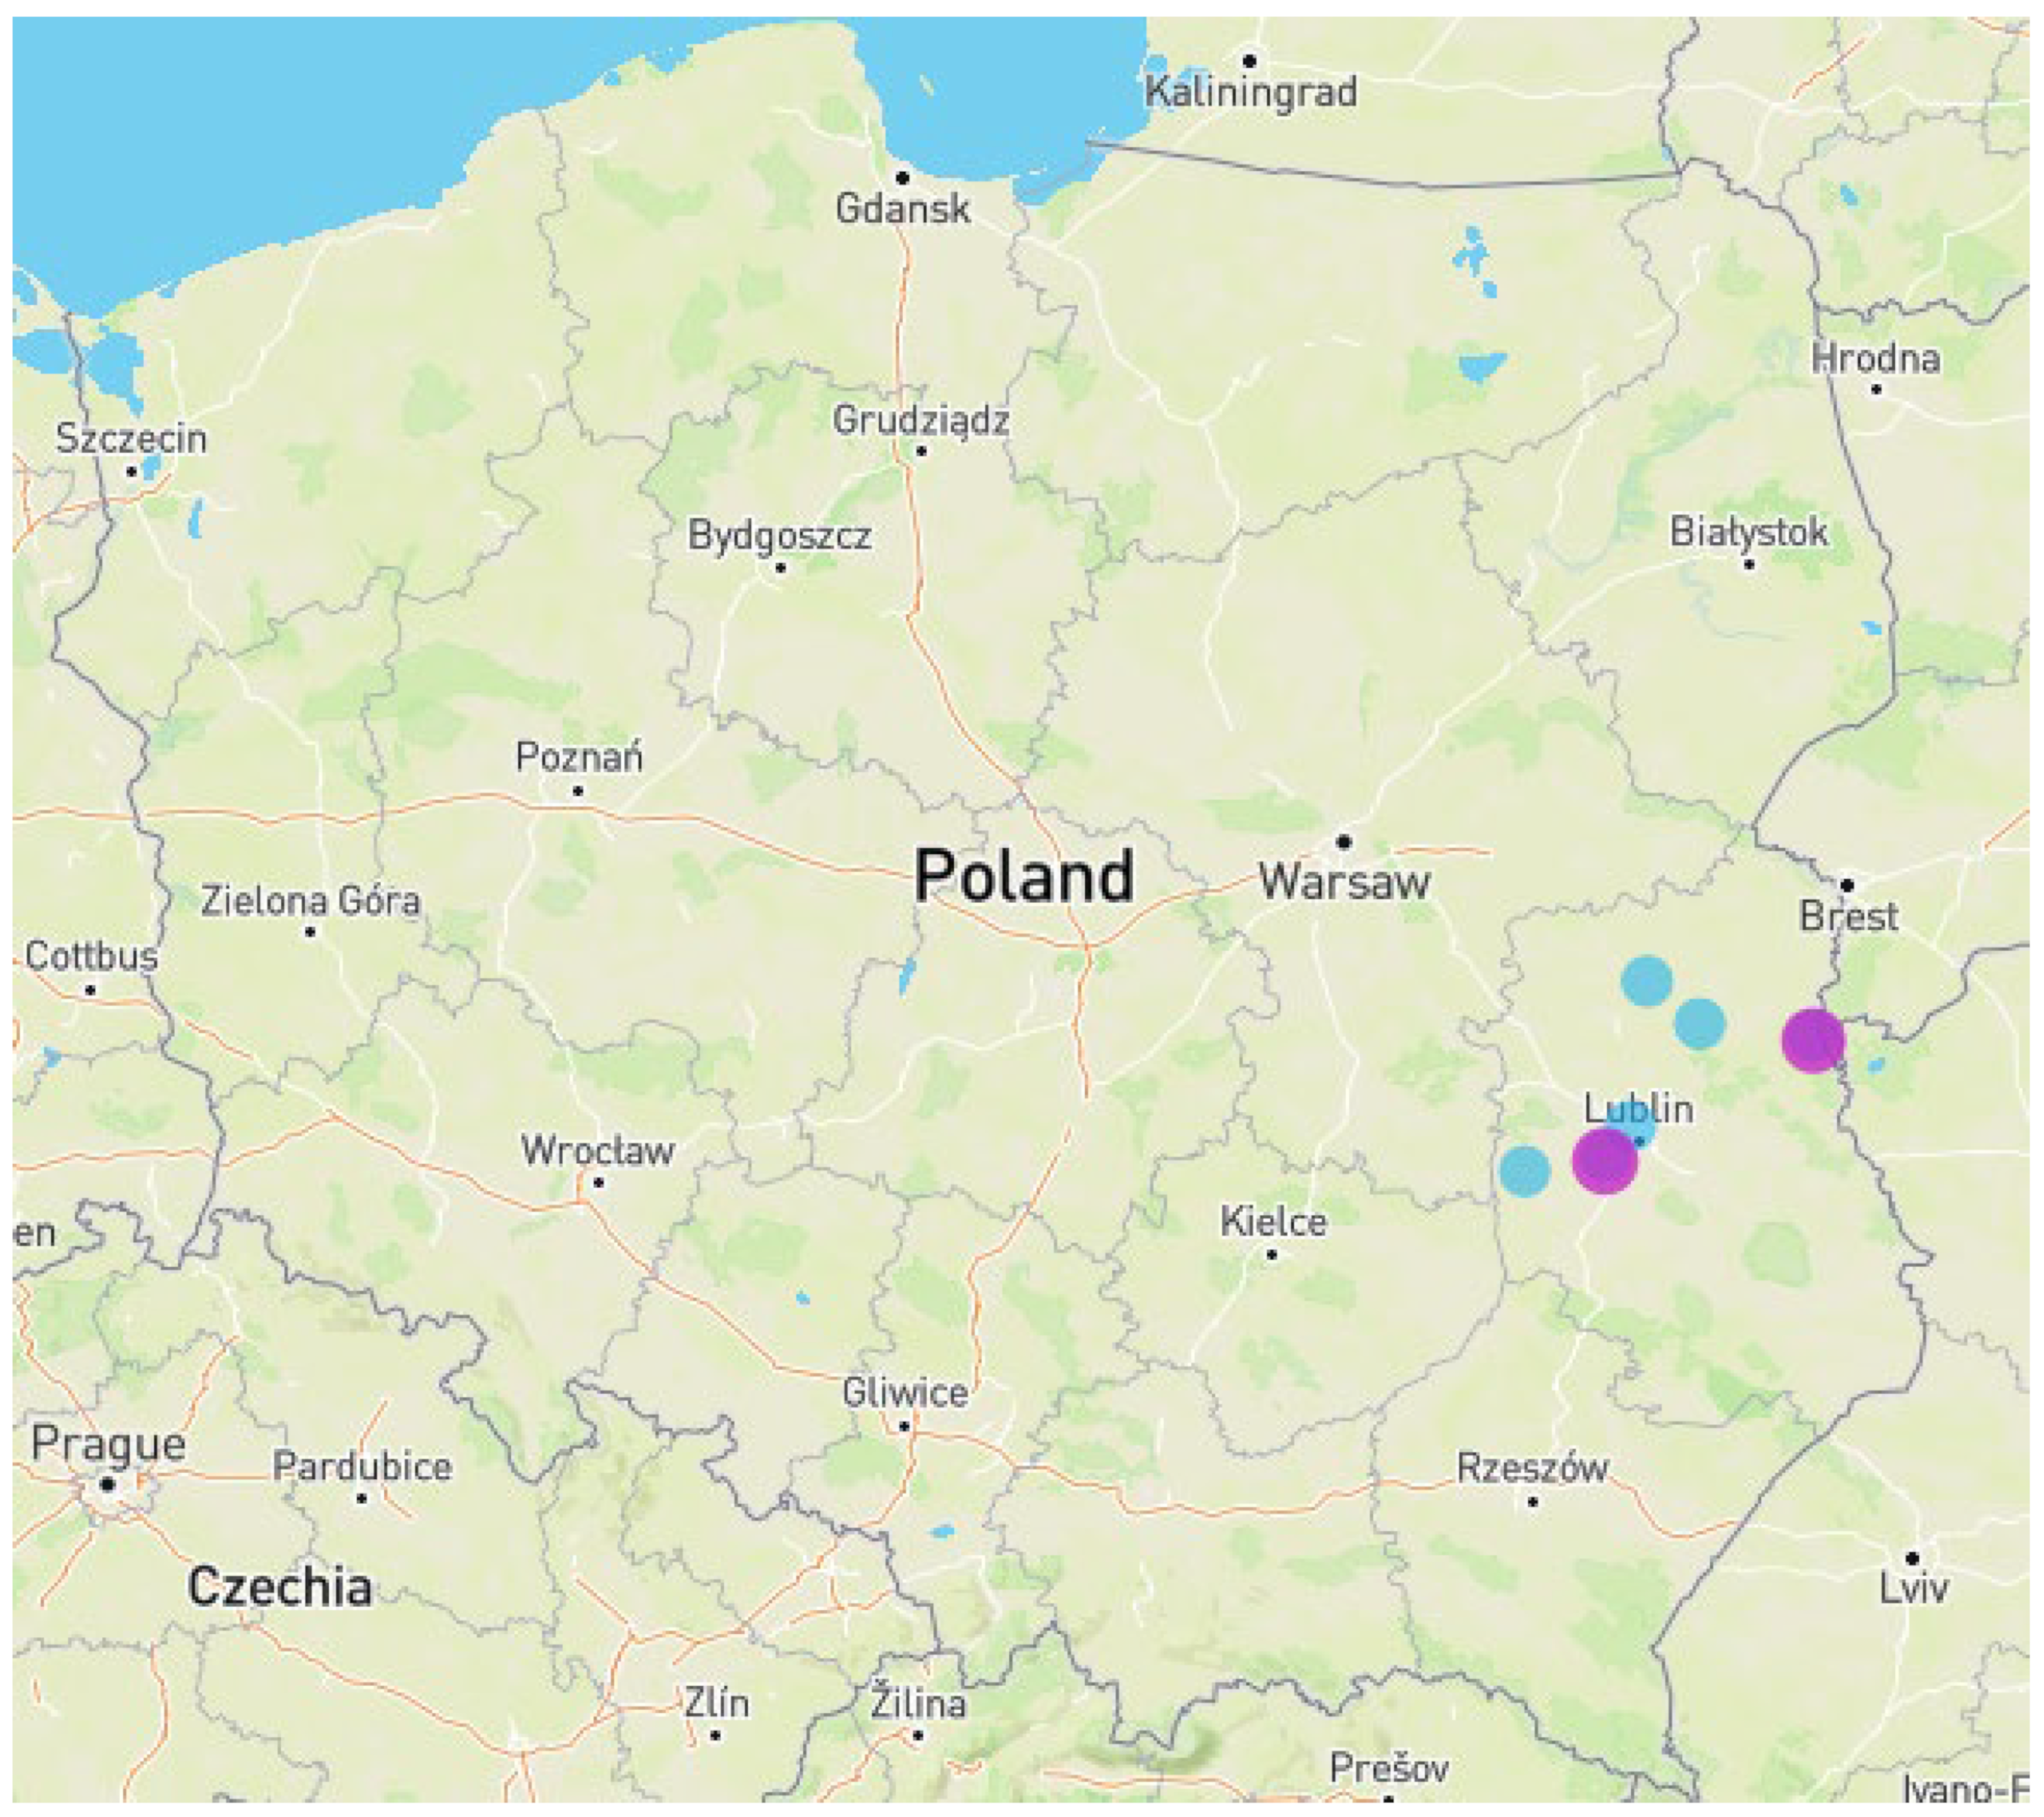
Figure 1. Localization of selected PV installations (blue dots) and weather stations (magenta dots) on Poland map.
Energies 16 05975 g001
Figure 2. Visualization made with the use of DDS-Cad software of (a) PV1 system; (b) PV2 system; (c) PV3 system; and (d) PV4 system.
Energies 16 05975 g002
Figure 3. (a) Global horizontal irradiation and outside temperature; and (b) average wind speed and humidity in 2022 in the selected site.
Energies 16 05975 g003
Figure 4. The measured and simulated values of the monthly final yield of the (a) PV1 system; and (b) PV2 system.
Energies 16 05975 g004
Figure 5. The measured and simulated values of monthly final yield of (a) PV3 system; and (b) PV4 system.
Energies 16 05975 g005
Figure 6. The measured and average simulated values of daily final yields of (a) PV1 system; and (b) PV2 system.
Energies 16 05975 g006
Figure 7. The measured and average simulated values of daily final yields of (a) PV3 system; and (b) PV4 system.
Energies 16 05975 g007
Table 1. Technical parameters of analyzed PV systems.
PV SystemAzimuth [°]Tilt Angle [°]PV ModuleNominal Power of System [kW]
ManufacturerTypePower [Wp]
PV114519Risen Energy (Ningbo, China)RSM-60-6-310M3107.13
PV210235Risen EnergyRSM-120-6-330M 3305.28
PV317540Sharp (Sakai City, Japan)NU-AC3103106.20
PV478/25832Q-Cells SE (Seoul, South Korea)Q.PEAK DUO-G5 3253253.58
Table 2. Configuration of analyzed PV systems.
PV SystemInverter’s ManufacturerInverter ModelNumber of Modules [pcs.]Configuration
PV1Shenzhen
SOFARSOLAR Co. (Shenzhen, China)
8.8KTL-X231 string/1st tracker11 pcs.
1 string/2nd tracker12 pcs.
PV2Shenzhen
SOFARSOLAR Co.
4.4KTL-X161 string/1st tracker8 pcs.
1 string/2nd tracker8 pcs.
PV3Shenzhen
SOFARSOLAR Co.
5.5KTL-X201 string/1st tracker10 pcs.
1 string/2nd tracker10 pcs.
PV4Shenzhen
SOFARSOLAR Co.
SOFAR 3KTLM-G2111 string/1st tracker6 pcs.
1 string/2nd tracker5 pcs.
Table 3. Modules’ and inverters’ detailed data.
PV SystemModule ParametersInverter Parameters
PMAX [Wp]VOC [V]VMPP [V]ISC [A]IMPP [A]η [%]β [%/°C]AC Power [kW]Max DC Voltage [V]MPP Voltage Range [V]η [%]
PV131040.6033.409.869.2818.90−0.298.801000300–84098.3
PV233040.3034.0510.309.7019.60−0.294.401000190–84098.0
PV331040.8233.189.899.3518.90−0.2735.501000240–84098.0
PV432540.4033.6510.149.6619.30−0.283.00600230–52098.0
Table 4. Detailed information about designing software.
FeatureDDS-CadPVSOLPVGISPVWatts
Calculator
Solar radiation databaseMeteonormMeteonormPVGIS-SARAH/PVGIS-SARAH2/PVGIS-ERA5NSRDB/SWERA/IWEC
PV product databaseVery complex with the possibility to expandVery complex with the possibility to expandNoNo
PV module input dataVery detailedVery detailedBasic Basic
Inverter input dataVery detailedVery detailedNoBasic
Design of PV systemYesYesNoNo
3D visualizationAdvancedBasicNoNo
Energy output simulationsYesYesYesYes
Shadows simulationsYesYesNoNo
Output data reportVery detailedVery detailedBasicBasic
AvailabilityLicensed30-days free version/licensedOnline toolOnline tool
FeeNot free of chargeFree/Not free of chargeFree of chargeFree of charge
Table 5. The minimum and maximum values of the temperature, wind speed, and humidity in 2022 at the selected site (Lublin Radawiec weather station).
MonthTmin [°C]Tmax [°C]Vmin [m/s]Vmax [m/s]HUmin [%]HUmax [%]
January−11.99.000.314.051100
February−6.39.500.312.042100
March−11.018.000.19.821100
April−3.918.000.19.628100
May0.526.300.111.824100
June6.034.000.19.04100
July8.533.300.121.3498
August9.831.2009.92598
September3.722.3008.22898
October−0.521.50010.24599
November−7.614.400.25.05799
December−16.07.1009.76499
Table 6. The measured and simulated values of yearly final yields.
PV System Y f r e a l Y f P V S O L Y f P V G I S Y f D D S C a d Y f P V W A T T S
[kWh·kW−1]
PV11043.16976.06961.23817.88954.01
PV2983.36879.85891.66772.58853.03
PV31079.451055.601068.37826.141035.41
PV4982.30829.45853.82728.74817.32
Disclaimer/Publisher’s Note: The statements, opinions and data contained in all publications are solely those of the individual author(s) and contributor(s) and not of MDPI and/or the editor(s). MDPI and/or the editor(s) disclaim responsibility for any injury to people or property resulting from any ideas, methods, instructions or products referred to in the content.