Article

Simulation of Underground Coal-Gasification Process Using Aspen Plus

1
School of Mechanical Engineering, Xi’an Shiyou University, Xi’an 710065, China
2
PetroChina Coalbed Methane Company Limited, Beijing 100028, China
*
Author to whom correspondence should be addressed.
Energies 2024, 17(7), 1619; https://doi.org/10.3390/en17071619
Submission received: 3 March 2024 / Revised: 19 March 2024 / Accepted: 26 March 2024 / Published: 28 March 2024
(This article belongs to the Section H: Geo-Energy)

Abstract

:
In order to study the underground coal-gasification process, Aspen Plus software was used to simulate the lignite underground gasification process, and a variety of unit operation modules were selected and combined with the kinetic equations of coal underground gasification. The model can reflect the complete gasification process of the coal underground gasifier well, and the simulation results are more in line with the experimental results of the lignite underground gasification model test. The changes in the temperature and pressure of oxygen, gasification water, spray water, and syngas in pipelines were studied, and the effects of pipe diameters on pipeline conveying performance were investigated as well. The effects of the oxygen/water ratio, processing capacity, and spray-water volume on the components of syngas and components in different reaction zones were studied. In addition, the change tendency of gasification products under different conditions was researched. The results indicate that: (1) The depth of injection and the formation pressure at that depth need to be taken into account to determine a reasonable injection pressure. (2) The liquid-water injection process should select a lower injection pressure. (3) Increasing the oxygen/water ratio favors H2 production and decreasing the oxygen/water ratio favors CH4 production. (4) The content of CO2 is the highest in the oxidation zone, the lowest in the reduction zone, and then increases a little in the methanation reaction zone for the transform reaction. The content of CO is the lowest in the oxidation zone and the highest in the reduction zone. In the methanation reaction zone, CO partially converts into H2 and CO2, and the content of CO is reduced. (5) The injection of spray water does not affect the components of the gas but will increase the water vapor content in the gas; thus, this changes the molar fraction of the wet gas.

1. Introduction

Coal is the world’s most abundant fossil fuel resource and has played a huge role in human development, serving as a crucial component of primary energy. Its importance in the energy mix is projected to endure in the future [1]. According to the BP World Energy Statistical Yearbook released on 26 June 2023 [2], in 2022, China’s primary energy consumption amounted to 159.39 × 10¹⁸ J, with coal representing 55.5% of the consumption, followed by oil at 17.7%, nuclear power, hydropower, and renewable energy at 18.4%, and natural gas only accounting for 8.5%, with over 40% of natural gas still relying on imports. While underground coal gasification has been experimented with and studied for nearly a century, only Australia’s Linc Energy has successfully established a commercial underground coal-gasification plant in Uzbekistan, with a daily production capacity of 1 × 10⁶ m3/d [3,4]. China currently has more than ten experimental projects, though they still have a long way to go before industrialization can be achieved. Underground coal gasification is an intricate technology that combines geology, hydrology, drilling, and ignition control techniques [5,6]. Injecting gasifying agents, the gasification reaction itself, and the production of synthetic gas are the core technologies of underground coal gasification. Due to its underground nature, it is challenging to measure and control these processes. Consequently, there are limited research findings in this area; in particular, there is a lack of mature models to describe gasification reactions [7,8].
A large number of experimental studies and numerical simulations have been carried out for the underground coal-gasification reaction process. Chen et al. [9] conducted an oxygen-enriched carbon dioxide gasification experiment, and the results of the study concluded that an increase in the oxygen content led to an increase in both gas products and calorific value and that the best gas production was achieved when the oxygen concentration was 50–60%. Wiatowski et al. [7] investigated the effect of oxygen content on the gasification process and showed that higher gas quality and process efficiency can be obtained, and the calorific value of the resulting gas is higher when oxygen-enriched air is used as a gasifier compared to pure oxygen. Zong et al. [10] used Aspen Plus to establish a kinetic simulation model for the underground gasification process of coal and investigated the effects of oxygen/coal mass ratio and steam/coal mass ratio on the gas components, and the results concluded that: with the increase in the oxygen/coal mass ratio, the carbon conversion rate gradually rises, and the content of CO and H2 increases; however, with the increase in the steam/coal mass ratio, the carbon conversion rate gradually decreases, and the content of CO and H2 gradually decreases. Krzysztof et al. [11] investigated the experimental activity of the CH4-oriented UCG process using a large-scale laboratory installation and concluded that CH4 production is highly dependent on coal rank and pressure and that the concentration of CH4 increases with increasing pressure. Krzysztof et al. [12] investigated the effect of temperature on the strength and structural parameters of rocks in the vicinity of the gasification channel, which was tested in the laboratory, and the results of the tests concluded that the strength and density of sandstones decreased at temperatures in the range of 900–1200 °C, that claystone began to decompose after 300 °C, and that the greater the humidity of the rock, the more dramatic the decrease. Marek et al. [13] described the equipment, physical modeling of coal seams, and coal analysis for the UCG process, and the experimental results showed that the maximum temperature in the gasification channel is around 1000 °C, the temperature in the oxidation zone must reach more than 900 °C, and the temperature in the reduction zone is in the range of 550 °C and 900 °C. Wang et al. [14] investigated the roof subsidence law and its related parameters for quantitative study during the gasification mining process, and the results showed that the modulus of elasticity of rock beams decreases with increasing temperature, and the position of the central axis of rock beams firstly rises and then decreases in the gasification process. In terms of studies using Aspen Plus (V12) software to simulate the underground gasification process of coal, Liu et al. [15] summarized the gasifier models based on Aspen Plus software development reported by domestic and foreign research institutes, analyzed the differences and connections between the various gasifier models, and proposed the development direction of coal-gasification process simulation. Cheng et al. [16] used Aspen Plus software to simulate the fixed-bed coal-gasification process, and the results showed that the model developed using Aspen Plus matched well with the reaction results of actual fixed-bed coal gasification.
Coal-gasification models include equilibrium models and kinetic models. Equilibrium models rely on the principle of minimizing Gibbs free energy to predict reaction outcomes and assume a constant, stable gasification process without considering specific gasification reaction mechanisms. On the other hand, kinetic models are based on chemical reaction kinetics, making them more akin to real-world scenarios. However, the accuracy of simulation results using kinetic models heavily depends on the precise knowledge of gasification reaction mechanisms, which can vary under different chemical reaction conditions. Therefore, substantial data on reaction mechanisms are required to support gasification simulation based on kinetic models, particularly in the field of underground coal gasification where data are scarce [17,18]. The underground coal-gasification process involves not only chemical reactions but also fluid flow and heat transfer. Previous coal-gasification studies have primarily focused on fluidized bed models to examine gasification processes within gasifiers. Nevertheless, the disparity between fluidized bed models and actual underground coal-gasification conditions is significant. Underground coal gasification is more analogous to pressurized fixed-bed gasification. Under atmospheric-pressure coal gasification, the gasification process is subcategorized into oxidation zones, reduction zones, methane reaction zones, and dry distillation and drying zones. Due to the above-ground gasifier process technology being mature and relatively easy to control, the current use of Aspen Plus simulation of the gasification process is aimed at above-ground gasifiers and is for the simulation of the gasification process of underground gasifiers nationally and abroad. However, while there are people engaged in research, there are very few published results, which is mainly because underground gasification does not only include fixed-bed gasification but also involves the complexity of the underground, which makes the whole gasification process more difficult to grasp. For this reason, this paper utilizes the Aspen Plus software to simulate the underground coal-gasification process. Various reactors are deployed to construct process simulation models applicable to each of the oxidation, reduction, methane reaction, and dry distillation and drying zones. Essential aspects like temperature, pressure, flow rate, and composition are simulated to capture the key process parameters of the chemical reactions. This study aims to provide a reference for the development of underground coal-gasification processes. In contrast to prior research, this paper addresses the underdeveloped aspect concerning pipeline considerations, exploring the injection of gasifying agents and water spraying within pipelines, as well as examining temperature and pressure fluctuations during syngas production. Additionally, the impact of different pipe diameters on pipeline transport performance is investigated. Furthermore, distinct reactor models are established for individual reaction zones, enhancing the approximation of the real conditions of underground coal gasification.

2. Principles of Underground Coal Gasification

The coal-gasification process is divided into an oxidation zone, a reduction zone, a methane reaction zone, and a dry distillation and drying zone based on the direction of gas flow. Since the whole process occurs underground and it is difficult for the surface to regulate it specifically, there is no strict actual interface between these four zones, and within the coal seam, the four zones are mixed and alternate [19]. The oxidation zone mainly occurs in the oxidative exothermic reaction such as frontal combustion of coal, and the temperature is 900~1200 °C; the reduction zone mainly occurs in the reduction reaction of C, and the temperature is 600~900 °C; at high pressure (≥9 MPa), the methanation reaction zone will be generated, and the temperature will be about 700 °C; and the dry distillation and drying zone is in the most peripheral area, where part of the coal seam has not been exposed in the contact range of the gasifier. Thus, the seam will undergo a dry distillation drying reaction under oxygen-deficient conditions, producing a large number of coal seams. The dry distillation and drying reaction occurs under the condition, and a large amount of gas is produced, with a temperature of 200~600 °C.

2.1. Oxidation Zone

The main reactions in the oxidation zone during underground coal gasification include:
C + O 2 CO 2 + 393.8 KJ / mol ;
2 C + O 2 2 CO + 221.1 KJ / mol ;
2 CO + O 2 2 CO 2 + 570.1 KJ / mol .
Injecting oxygen into the gasification channel and igniting it to react with the coal seam results in the generation of CO and CO2. This reaction continues until all the oxygen in the channel is completely consumed. In the process, a large amount of heat is released [10,20], causing the coal seam to become incandescent, with temperatures typically reaching 1200 °C.

2.2. Reduction Zone

The main reactions in the reduction zone during underground coal gasification include:
CO 2 + C 2 CO 162.4 KJ / mol
C + H 2 O H 2 + CO 131.5 KJ / mol .
C + 2 H 2 CH 4 + 74.9 KJ / mol .
As the oxidation reactions progress, the temperature inside the gasification channel increases, leading to an increase in the CO concentration in the reduction zone. Water is introduced into the underground coal seam through injection wells, and under high-temperature conditions, the reaction between H2O and C generates H2 and CO through the reduction process. Therefore, in the reduction zone, the CO concentration is relatively high, and the temperature inside the channel decreases. As underground coal gasification is a coupled process, when the temperature in the reduction zone drops to a certain level, the reaction between C and H2 occurs, producing CH4. At higher temperatures, this reaction occurs in the methane reaction zone.

2.3. Methanation Reaction Zone

The reactions in the methanation reaction zone during underground coal gasification are mainly:
CO + H 2 O CO 2 + H 2 + 41.0 KJ / mol ;
CO + 3 H 2 CH 4 + H 2 O + 250.3 KJ / mol ;
C + 2 H 2 CH 4 + 74.9 KJ / mol .
In the methanation reaction zone, CO and H2O react to form H2, and the resulting H2 reacts to form CH4 at a certain temperature [13,14], and when the temperature is higher, CH4 also reacts in reverse to form H2.

2.4. Dry Distillation and Drying Zone
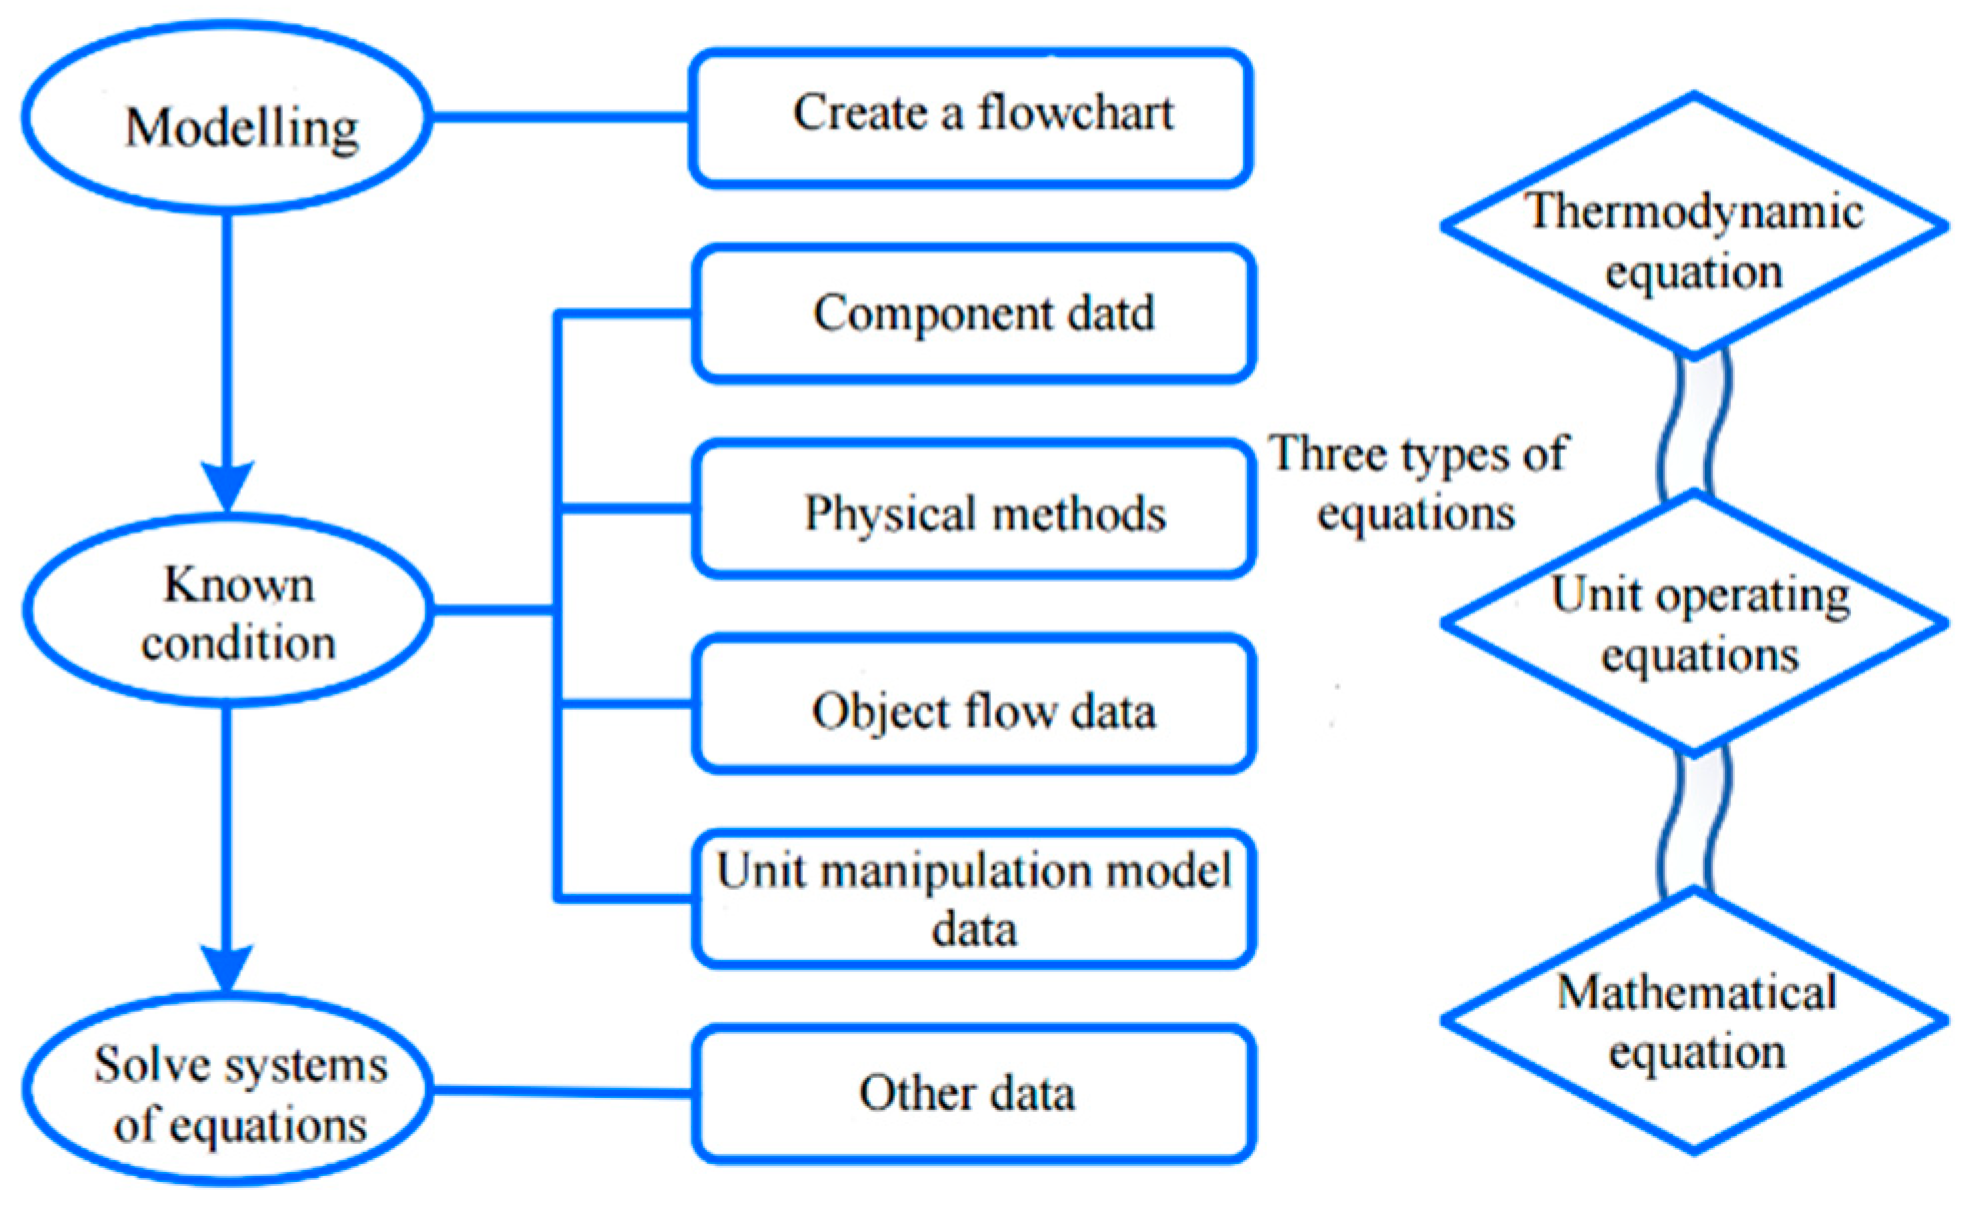
In the underground gasification of coal, the reaction in the dry distillation and drying zone is:
Coal CH 4 + C m H n + tar + CO 2 , CO , H 2 S , H 2 ) + H 2 O + coke   or   semi-coke  
During pyrolysis, coal undergoes complex chemical and physical changes, generating combustible gases, water vapor, and precipitating tars, and the structure of carbon may also change, leading to the formation of cracks and the spalling of small pieces of coal [21,22]. Coal is pyrolyzed under variable temperature and pressure conditions, and the gas yield from the pyrolysis reaction will increase with increasing pressure [23].
Based on the above process principles, the following assumptions are considered [24,25]: (1) The model is a steady-state model; (2) The model includes the following reaction processes: coal combustion, coal gasification (reduction reaction, methanation reaction), and coal pyrolysis; (3) The subsurface gasification characteristics are taken into account and the pressure variations in the furnace are ignored; (4) The gasifier and coal are completely mixed in the three reactors; and (5) No heat transfer occurs in the fluid in the pipe, as it is an adiabatic process.
The above assumptions make it possible to simulate the underground gasification of coal seams using Aspen Plus, and the constructed model of the underground gasification of coal seams can accurately reflect the real conditions of the underground gasification of coal seams, even if it is simplified.

3. Model Building

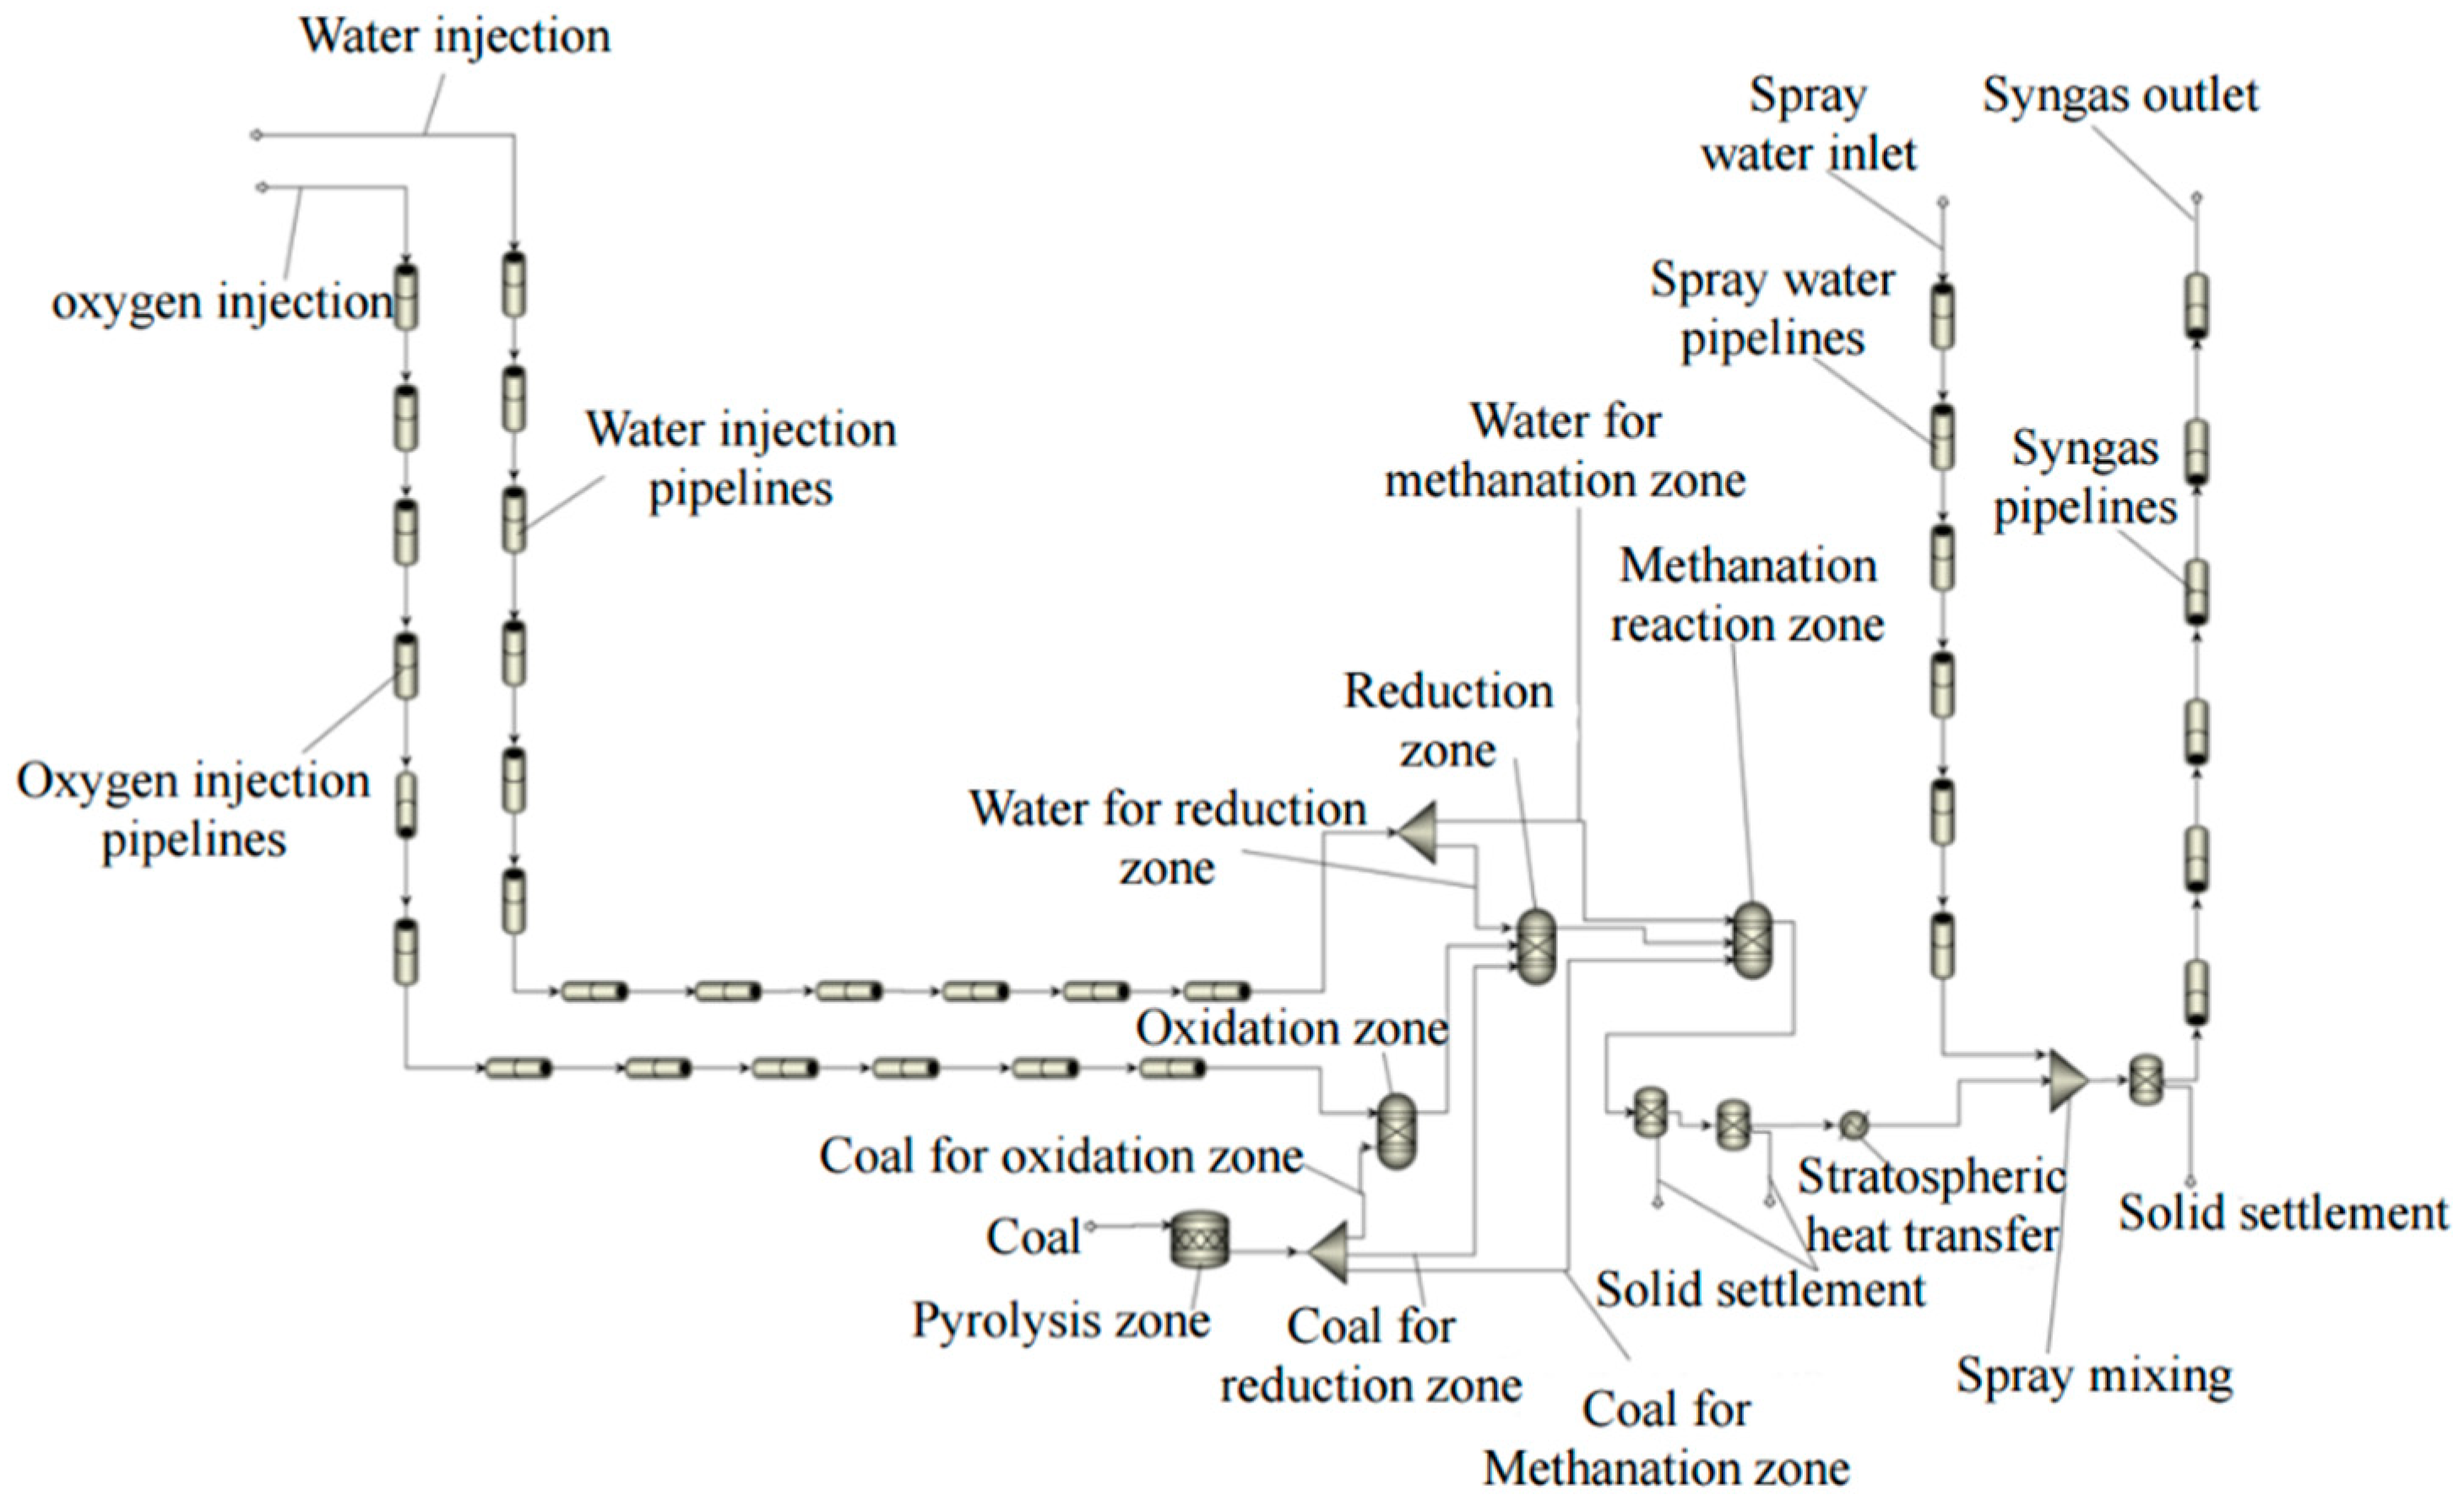
3.1. Process Simulation Models

The underground coal-gasification process simulated in this paper is targeted at a coal seam with a depth of 800–900 m and a thickness of 8–10 m. The process simulation model is established according to the underground coal-gasification process and chemical reaction mechanism, as shown in Figure 1. The underground coal-gasification process includes three main processes: gasifier injection (oxygen and gasifier-water injection through injection pipelines), gasification reaction, and syngas output (output through production pipelines) [26,27,28]. The pipeline model in Aspen Plus was used to simulate the temperature and pressure changes of the medium during gasifier injection and syngas production. In the model, the pipeline transportation process was assumed to be an adiabatic process. Three Gibbs reactors were built to simulate the chemical reactions occurring in the oxidation zone, reduction zone, and methanation reaction zone, respectively, and a Rstoic (stoichiometric) reactor was used to simulate the pyrolysis reaction. Due to the high temperature of syngas generated from the underground gasification of coal, if it is not controlled, it will lead to deformation or even collapse of production pipelines [29,30]. Therefore, the syngas was cooled down using a spray-cooling process in which the syngas was injected with room-temperature water through the production pipeline casing and sprayed at the bottom of the production pipelines to cool down the syngas.

3.2. Component Definition

Gasifiers and pyrolysis and gasification products in underground coal gasification are conventional components in Aspen Plus that can be selected in the system, and the main conventional components involved are O2, H2O, H2, CO, CH4, CO2, C, N2, AR, COS, NH3, H2S, SO2, SO3, CL2, HCL, S, and so on. The properties can be found in the property database that comes with Aspen Plus. The physical properties of unconventional solids cannot be obtained directly from the property database that comes with the software. Meanwhile, unconventional solids do not participate in phase equilibrium and chemical equilibrium calculations, and unconventional components need to be customized.
Lignite is rich in volatile matter, is easy to burn, and is the coal of choice for underground coal gasification. Dry-ash basis elemental analyses and industrial analysis data for selected coal types are shown in Table 1.

3.3. Definition of Physical Methods

Since light gases such as carbon monoxide, hydrogen, and methane are produced during coal gasification, RSK or RSK-BM, PR-BM equations are usually used, which are mostly used in the calculation of hydrocarbon processing, combustion, petrochemical, and other processes, and the applicable system is a non-polar or weakly polar mixture of components, such as hydrocarbons, CO, H2, and other light gases. In practical applications, the results of calculations using these two equations on the same model do not differ from each other.

3.4. Parameters and Boundary Conditions

Mathematical models in chemical simulation include equations for the conservation of mass, momentum, and energy; equations for phase equilibrium relationships and thermodynamic equilibrium; and kinetic rate equations for reactions, equipment sizing relationships, and some empirical formulas, as shown in Figure 2.
In the simulation process, it is assumed that the oxygen injection volume is 70 t/d, the initial temperature is 25 °C, and the initial pressure is 9 MPag. The water injection volume is 240 t/d, and the water participating in the reaction in the reduction zone and methanation reaction zone is 192 t/d and 48 t/d (4:1), respectively, with an initial temperature of 20 °C and an initial pressure of 2 MPag. In the actual UCG process, the amount of coal is sufficient, but in the Aspen Plus process simulation, coal must be used as an input quantity. Thus, in order to accurately simulate this condition, according to the literature [31,32] and after several trial calculations, the flow rate of coal in the oxidation zone was finally determined to be 0.625 times the mass flow rate of oxygen, the flow rate of coal involved in the reduction reaction was determined to be 2.2 times the mass flow rate of water, and the flow rate of coal involved in the methanation reaction was determined to be 0.03 times the total amount of coal. In the simulation process, the heat generated from the oxidation zone reaction was used as the reduction-zone heat load to satisfy the reduction reaction. By heat accounting, the injection volume of spray water was set to 68 t/d, the initial temperature was 20 °C, and the pressure was 0.5 MPag. The simulation was carried out by using the pipeline unit in Aspen Plus. In order to study the changes of system state parameters with pipelines, six sections of pipeline were set for each of the injection, horizontal, and production pipelines, and the relevant parameters of the oxygen injection pipeline, the water injection pipeline, the spray-water pipeline, and the syngas outlet pipeline are shown in Table 2. Considering the heat exchange of syngas in the stratum, a heat exchanger was added to the simulation process to simulate the heat exchange process in the stratum.

3.5. Model Validation

In order to verify the reliability of the numerical simulation method, the experimental data in the literature [33] were used to validate the model. We used the model established in this paper and the data from the experiments for simulation. The industrial and elemental analyses of the coal used in the experiments are shown in Table 3, with a coal volume of 75 kg/h, m(H2O)/m(coal) = 0.24, m(O2)/m(coal) = 0.87). For the atmospheric-pressure gasification, coal and oxygen, both at room temperature, were put into the furnace. The comparison between the experimental results in the literature and the simulation results under the same conditions of the model in this paper is shown in Table 4. As can be seen from Table 4, the error between the model simulation results and the experimental results is small, which indicates that the present model is able to simulate the coal-gasification process.

4. Analysis and Discussion of Results

4.1. Pipeline Conveyance Performance Study

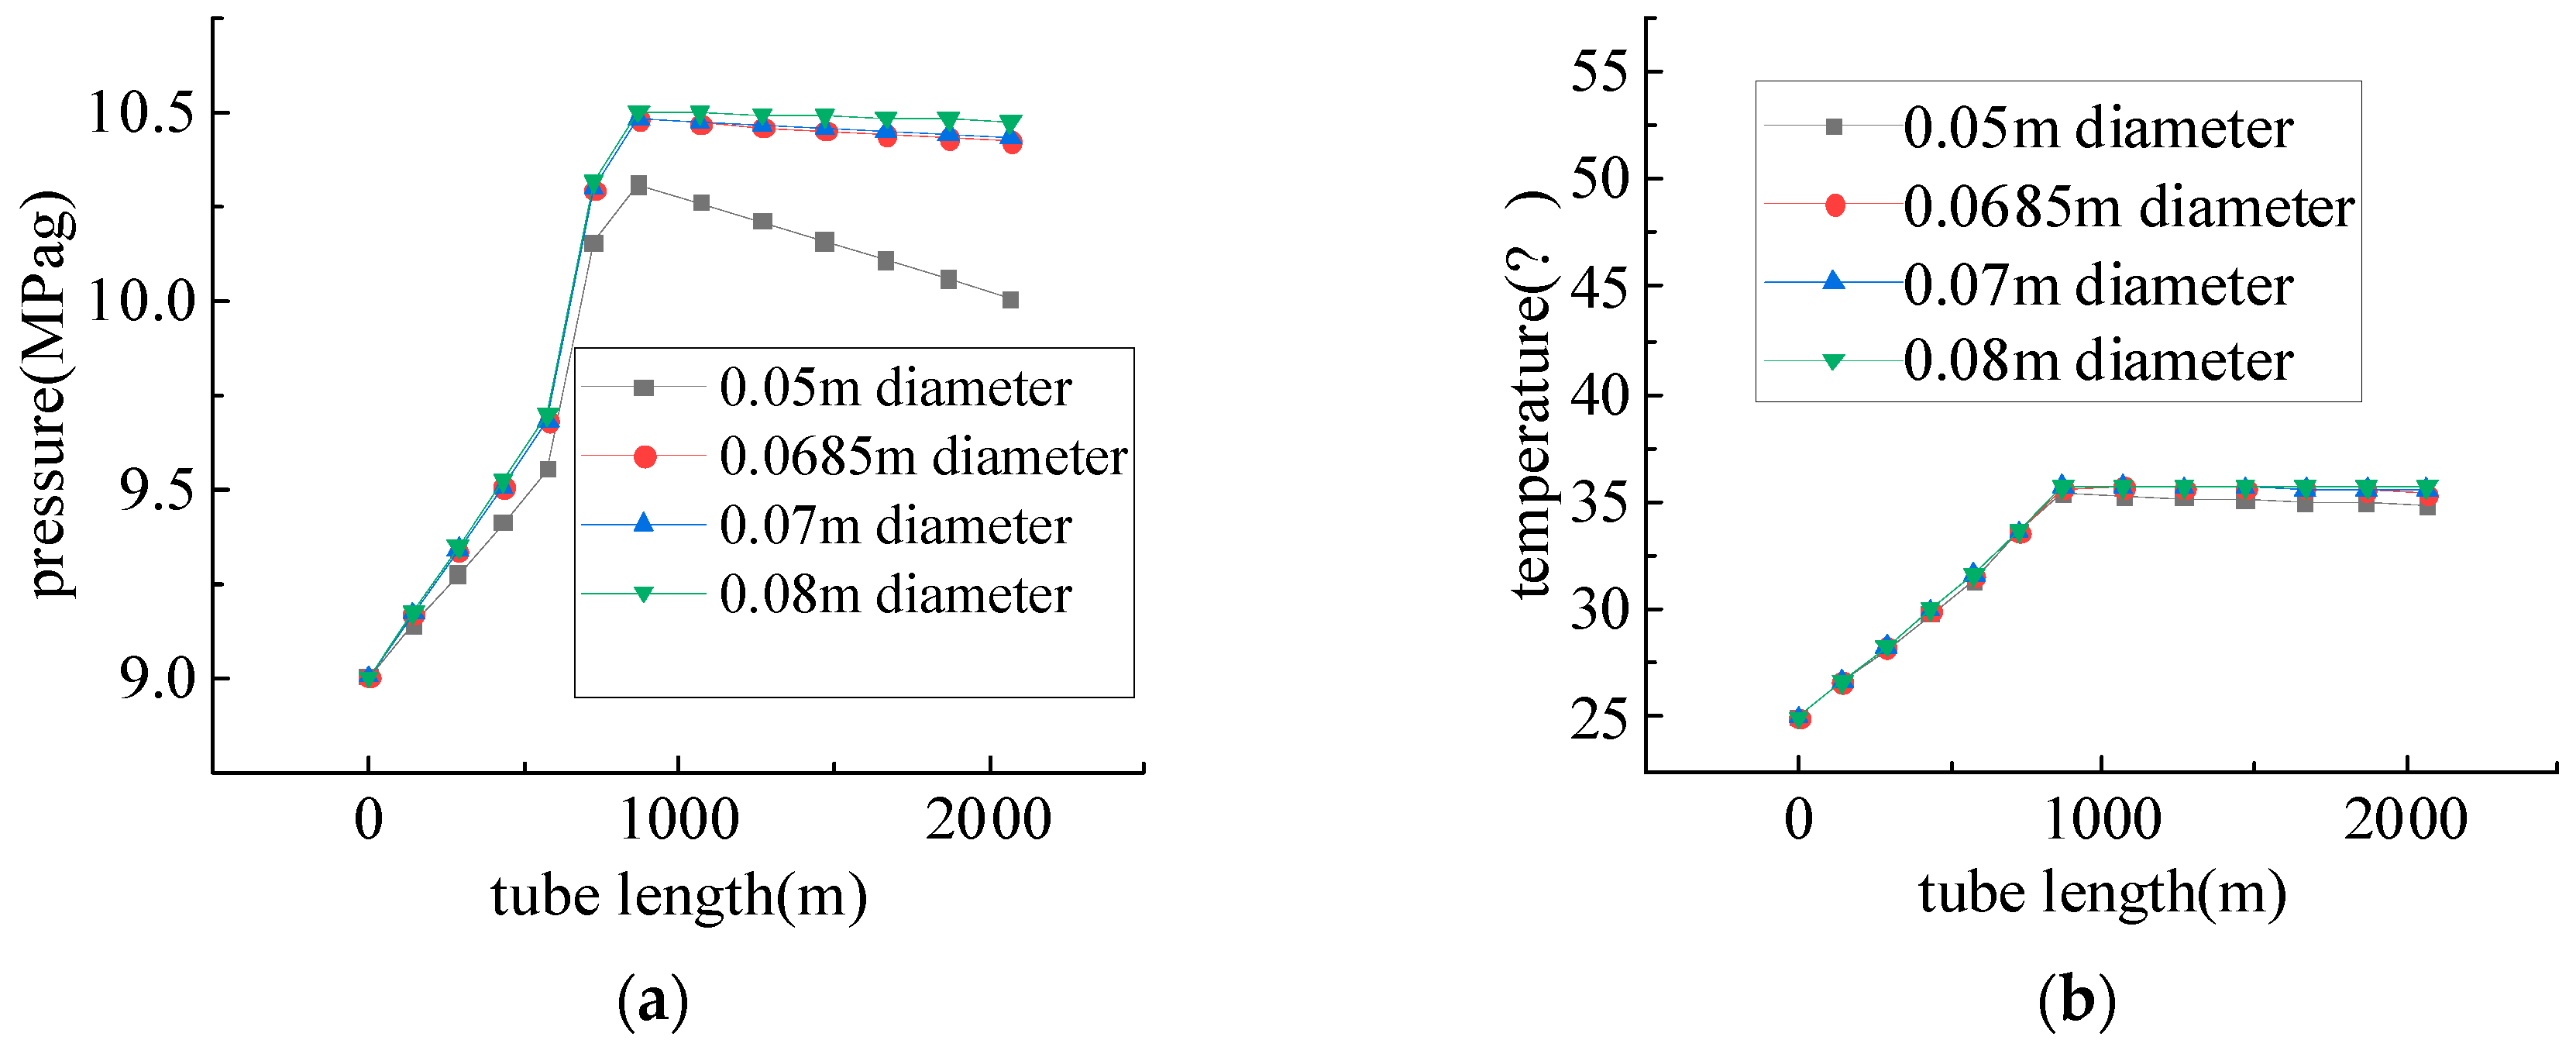
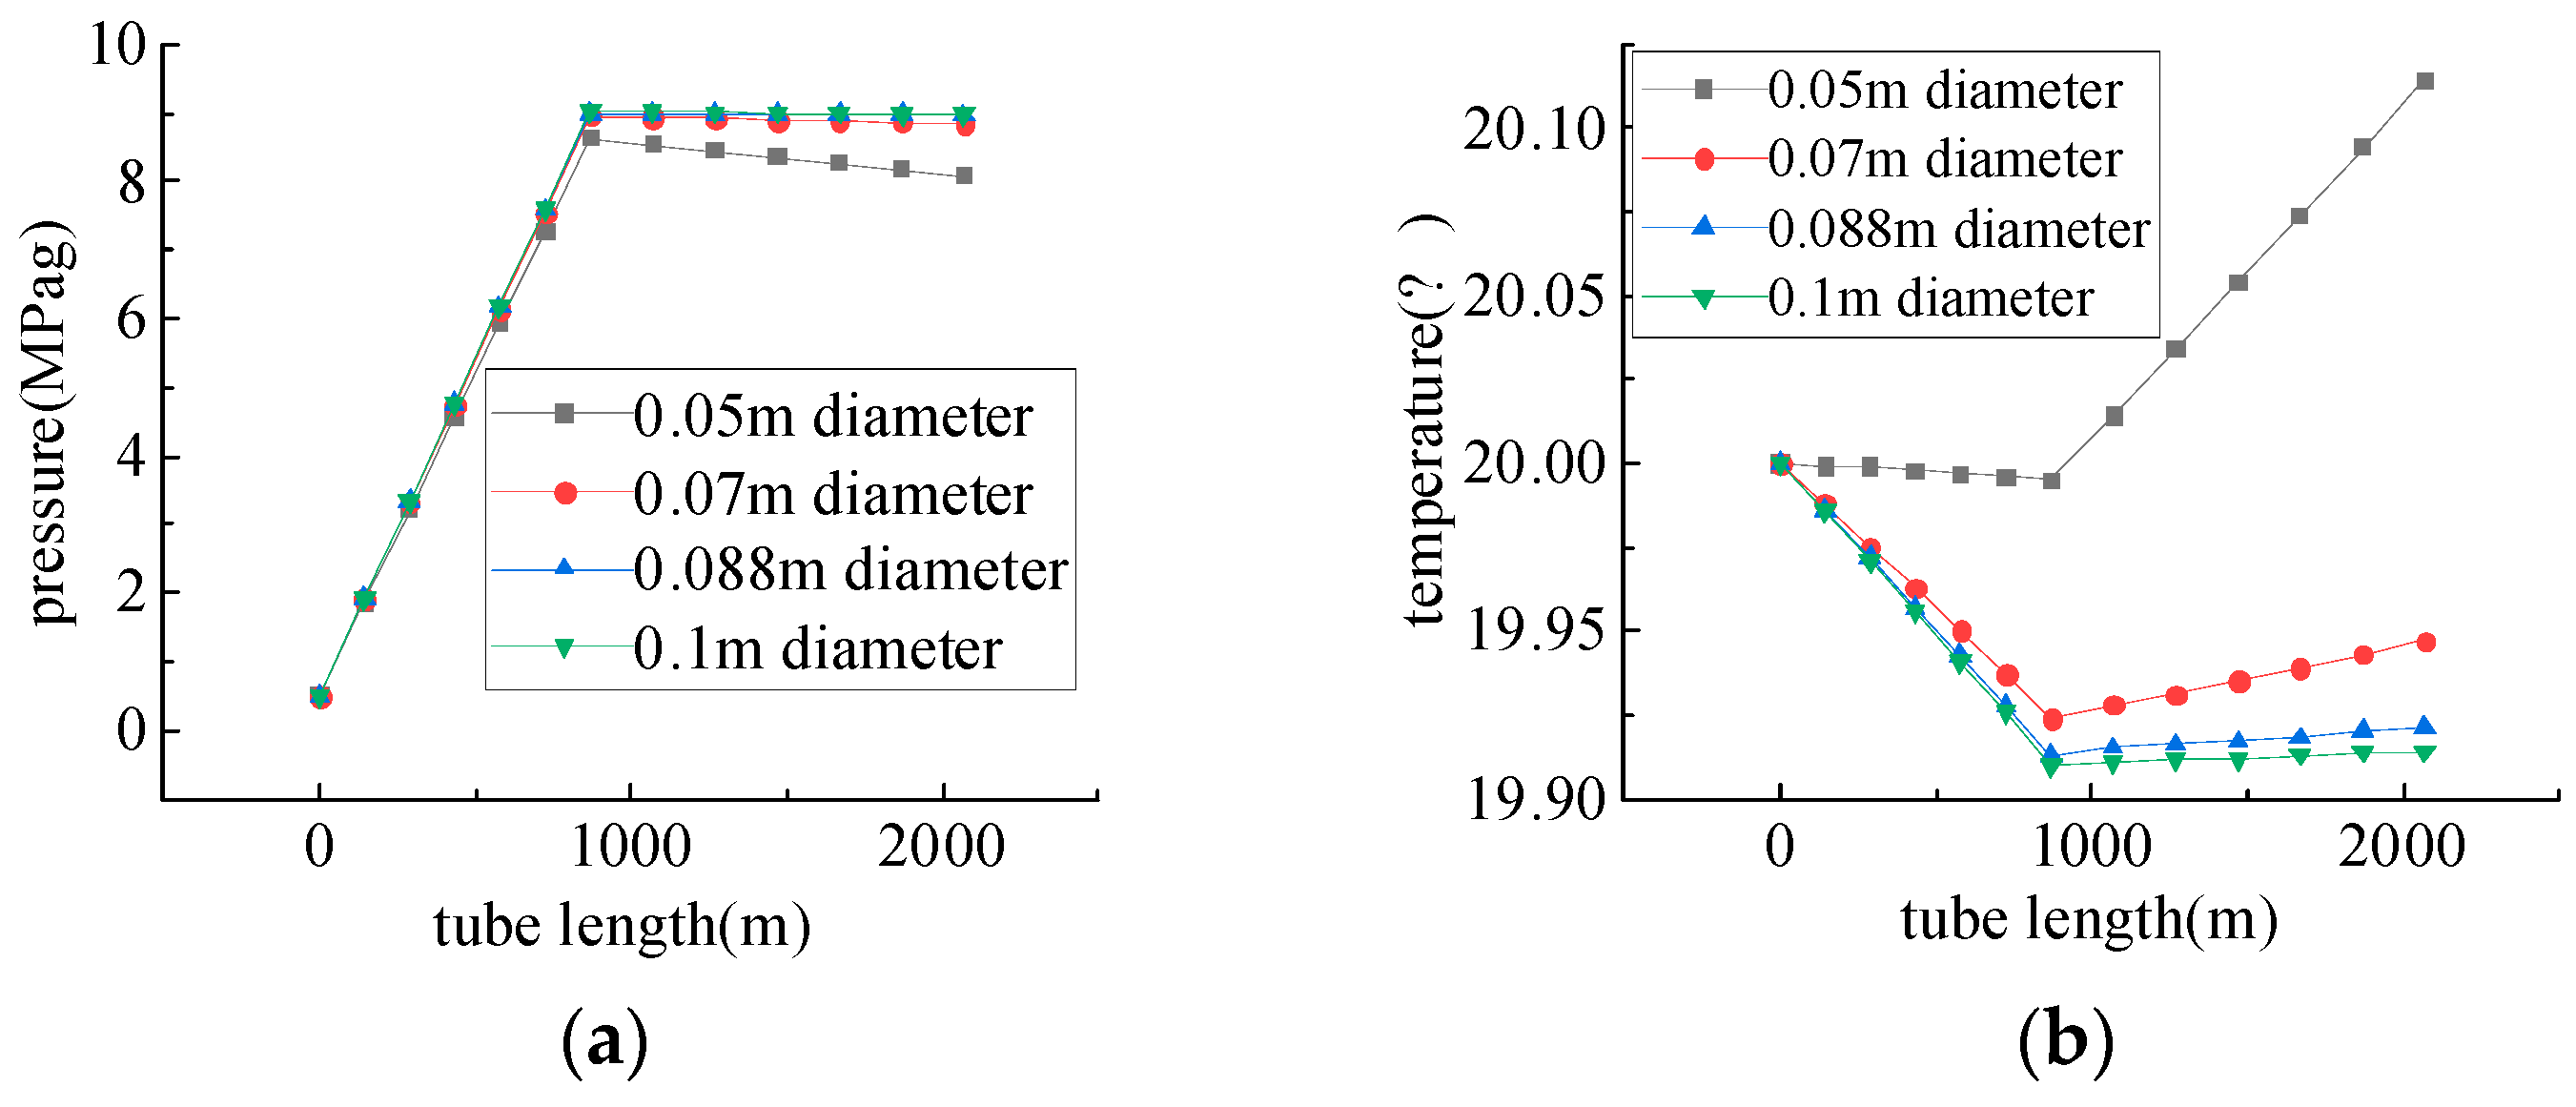
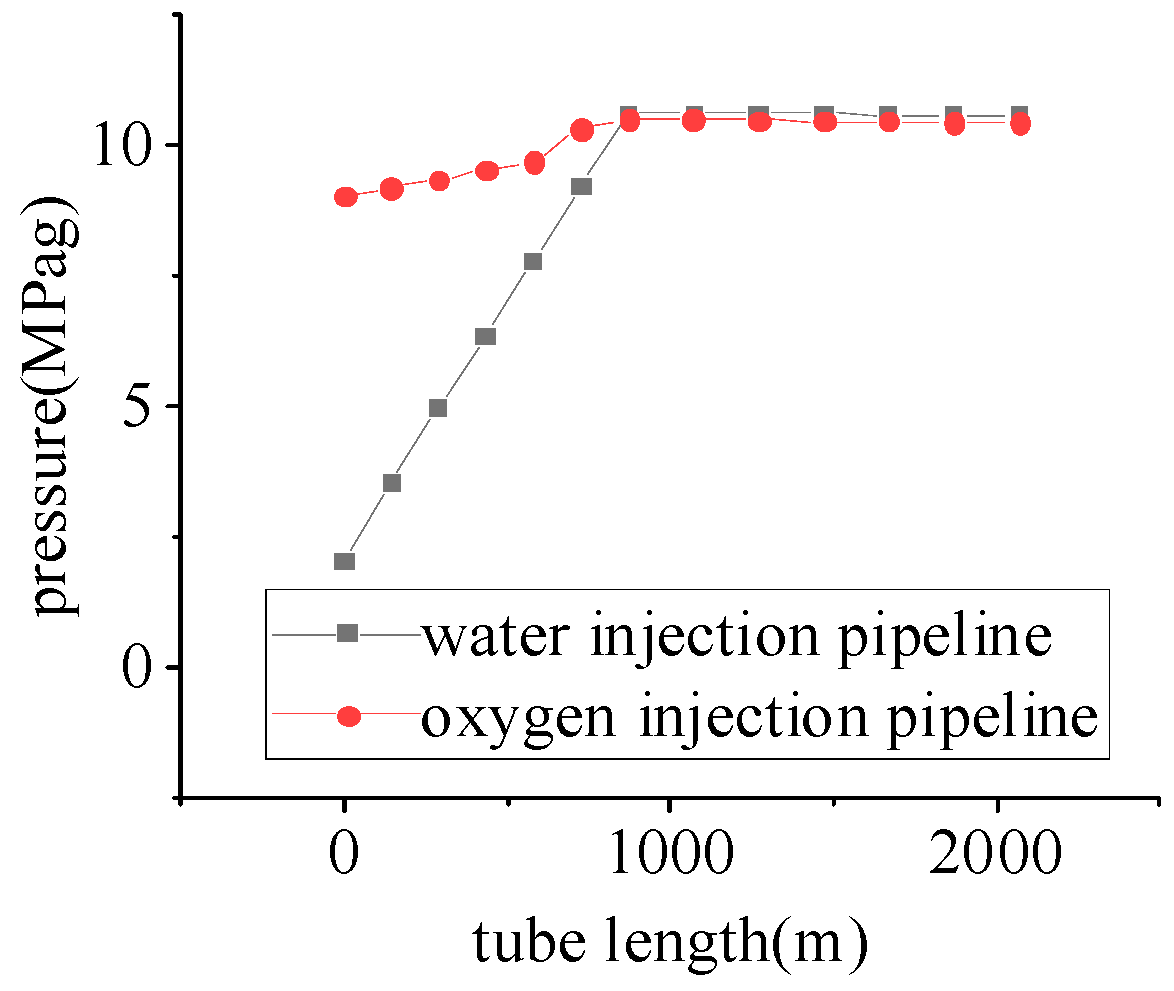
Study of Oxygen Injection Pipelines Conveyance Performance

Figure 3a,b shows the change curves of pressure and temperature during the flow of oxygen in pipes of different diameters, respectively. When the oxygen injection pressure is 9 MPag, the density of oxygen is 118 kg/m3, and the gas-column pressure is not negligible, so the pressure of oxygen in the injection pipeline increases from 9 MPag to 10 MPag. With the change in pressure, the temperature changes accordingly; this process is an isenthalpic process, and most of the isenthalpic curves of gases are shown in Figure 4. The rate of change in temperature with pressure (slope) is called the Joule–Thomson coefficient (see Equation (1)). As can be seen in Figure 4, the Joule–Thomson coefficient of most gases shows the change rule of positive and then negative, and it decreases with the increase in temperature and pressure. The Joule–Thomson coefficient will not become negative within the range of temperature and pressure studied in this paper. According to the Joule–Thomson effect shown in Figure 4, the temperature in Figure 3 increases correspondingly from 25 °C to 35 °C with the increase in injection pipeline pressure.
μ J T = T P H
As can be seen from Figure 3a, when the pipe diameter is 0.05 m, the calculated flow rate at the pipe outlet is 2 m/s, which will lead to a significant drop in pressure, so it is necessary to reasonably design the pipe diameter according to the pipeline conveying capacity. In addition, because oxygen is a gasification agent and a flammable agent, the continuous pipe may burn or even cause an explosion in oxygen under specific conditions, and the lower the flow rate of oxygen, the safer the oxygen pipeline. Combined with the simulation results, choosing a larger pipe diameter can not only satisfy that the oxygen outlet pressure is greater than the formation pressure in the middle and deep coal seams but also reduce the flow rate of oxygen to ensure the safety of oxygen delivery.

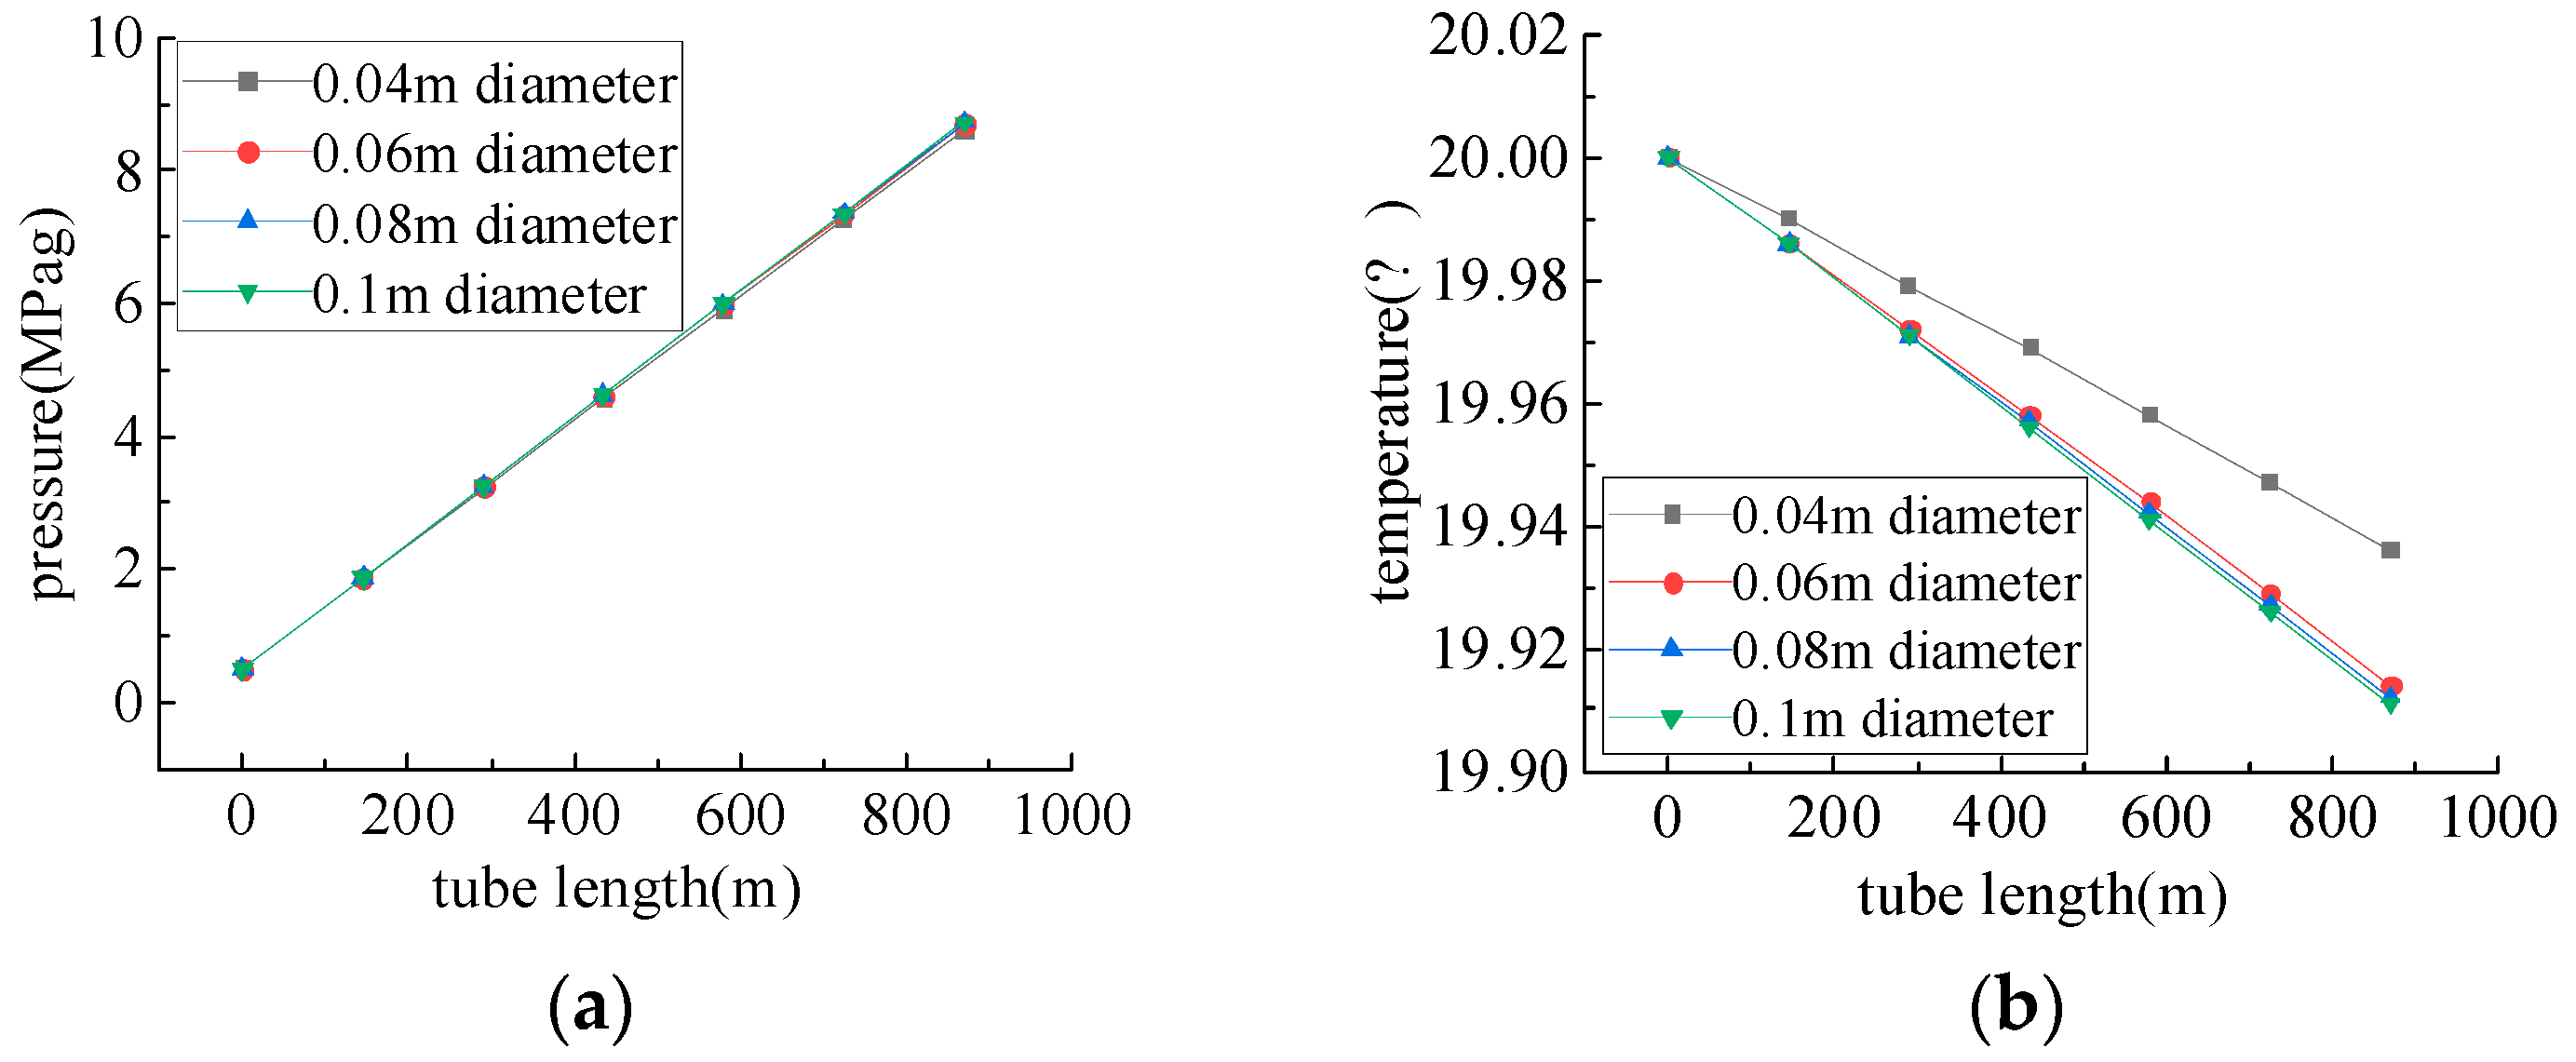
4.2. Study of Gasification Water Injection Pipelines Conveyance Performance

Figure 5a,b shows the change curves of pressure and temperature during the flow of water in pipes of different diameters, respectively. From Figure 5a, it can be seen that the pressure of the gasification water increases by 8 MPag on average in the vertical pipeline, the pressure remains basically unchanged in the horizontal pipeline, and the temperature of the gasification water basically does not change during the injection process. Through numerical simulation, the appropriate injection pressure can be determined according to the formation pressure and injection depth. It is known from the literature [17] that the formation pressure is 8.36 MPag and 9.18 MPag at depths of 800 m and 900 m, respectively, so the pressure of injected water needs to be controlled in the process of medium-depth UCG; if the injection pressure is too high, the pressure of water in the injection pipe will rise sharply, leading to flooding of the pipeline, and if the injection pressure is too small, the water will still be lower than the formation pressure after boosting the pressure of the injection pipe and it will not be able to flow out of the horizontal pipe. In addition, compared with oxygen, the pressurization of water in the injection tube is greater than that of oxygen in the injection tube, so when water and oxygen are injected, the same injection pressure should not be used, and the injection pressure of water should be smaller than that of oxygen.
In addition, it should be noted that in the actual injection well, the oxygen injection channel, and the gasification water injection channel for the casing structure, at this time, the outer pipe pressure needs to be less than or equal to the pressure of the inner pipe; otherwise, it is easy to cause pipeline instability, which seriously affects the safety of pipeline transport. If we consider that the oxygen injection pipeline is for the inner pipe and the gasification water injection pipeline is for the outer pipe, the simulation selection of the oxygen injection pipe diameter is 0.0685 m and the water injection pipe diameter is 0.088 m. The pressure comparison of the two is shown in Figure 6. Therefore, to inject water, oxygen should be injected into the outer pipe.

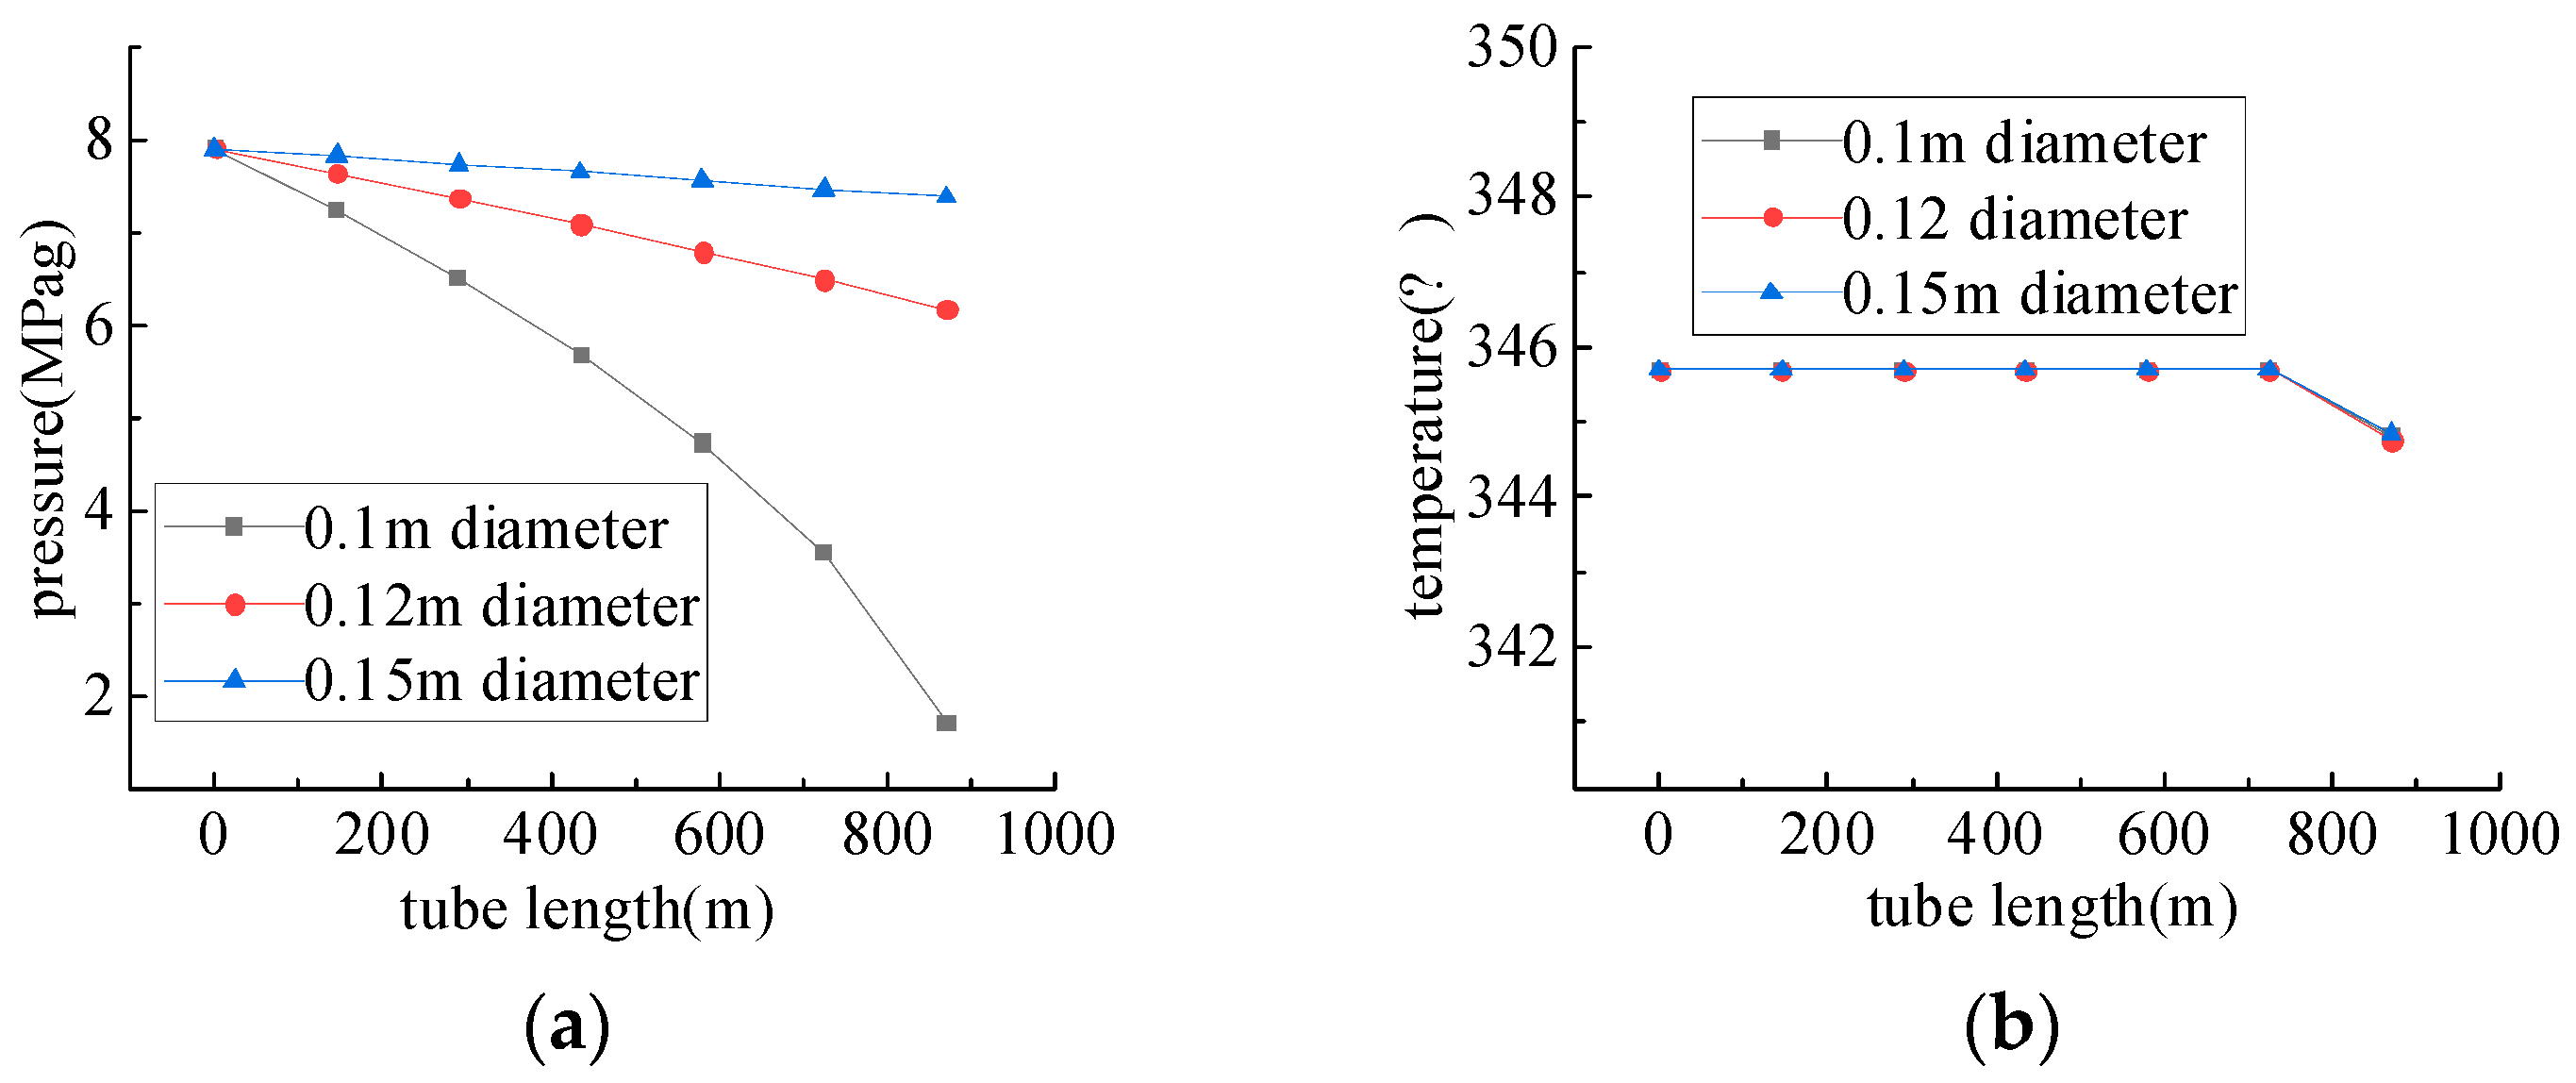
4.3. Study of Spray-Water Pipelines Conveyance Performance

The amount of spray water needs to be determined according to the amount of oxygen and water injected and the nature of the products generated by different gasification reaction conditions, and a trial algorithm can be used in the numerical simulation process by adjusting different amounts of spray water until the syngas reaches the desired temperature. Figure 7a,b refers to the spray water in different pipe diameters in the flow process of the pressure- and temperature-change curves and the trend is similar to that of the gasification water. When designing the amount of spray water, it is necessary to consider that the temperature after spraying should not be lower than the dew point temperature of syngas; otherwise, it may cause pipeline corrosion.

4.4. Study of Syngas Pipeline Conveyance Performance

The syngas pipeline gas flow direction is opposite to the injection pipeline: from the bottom of the pipeline to the surface. Since the solid particles in syngas cannot be completely settled in the formation, only solid transport can be used in the simulation, which also leads to a basically unchanged temperature during the transport process; this is inconsistent with reality. In order to reflect the change in temperature, fluid conveying is used when analyzing the effect of temperature, and solid conveying is used when analyzing the effect of pressure. Figure 8a,b shows the pressure- and temperature-change curves of syngas in the flow process of pipelines with different pipe diameters, respectively.
From Figure 8, it can be seen that the syngas pipeline diameter has a large impact on the pipeline pressure, and the pressure drop is 6.3 MPag when the pipeline diameter is 0.1 m. When the pipeline diameter is 0.12 m, the pressure drop is 1.9 MPag, and when the pipeline diameter is 0.15 m, the pressure drop is 0.7 MPag. In view of the design conditions of this paper, the syngas pipeline diameter is smaller than 0.1 m, and the syngas pipeline will be blocked because of an excessive amount of generated gas, resulting in the generation of gas that cannot flow in the pipeline. Therefore, it is necessary to reasonably design the pipe diameter according to the syngas production.
As can be seen in Figure 8, the syngas pipeline temperature is basically unchanged at higher pressures and only a small change in temperature occurs at the outlet—from 346 °C to 344 °C. The reason for this is explained in Figure 4. The isoenthalpy curves in Figure 4 are more flattened with the increase in pressure, which implies that the Joule–Thomson coefficient decreases and that the pressure change has a smaller effect on the temperature.

4.5. Study of Gasification Products under Different Conditions

Effect of Oxygen/Water Ratio on Syngas Composition

Under the condition that the amount of O2 was the initial condition and remained constant, six simulation scenarios were designed to investigate the effects of different oxygen/water ratios on CO2, CO, H2, and CH4 with oxygen/water ratios of 1:6, 1:5, 1:4, 1:3, 1:2 and 1:1, where the oxygen/water ratio is the mole ratio. In the simulation process, only the component changes in the reduction zone and methanation reaction zone were analyzed because water was directly injected into the reduction zone and methanation reaction zone. The total amount of coal involved in the reaction changes with the change in oxygen/water ratio, which is calculated as described in 3.4, and the change in the gas molar fraction in the reduction zone and methanation reaction zone with the oxygen/water ratio is shown in Figure 9a,b.
As can be seen from the figure, the change in the oxygen/water ratio has a greater effect on H2 and CH4 and a smaller effect on CO2 and CO. When the oxygen/water ratio increases from 1:6 to 1:1, the molar fraction of H2 increases from 0.003 to 0.355 and the molar fraction of methane decreases from 0.341 to 0.003 in the reduction zone. From this result, it can be determined that the smaller the amount of water injected, the better the reaction between H2O and C can be promoted to produce more H2. The reason for this may be because the more the water injection is reduced, the more it can ensure the high-temperature conditions of the coal seam, and H2O + C→H2 + CO is a heat-absorbing reaction. The higher the temperature is, the more favorable the reaction is to proceed positively, and the more hydrogen will be generated. Moreover, C + 2H2→CH4 is an exothermic reaction, so the high temperature is not conducive to the reaction proceeding positively, which leads to a decrease in CH4 content. An increase in the oxygen/water ratio leads to higher H2 content and lower CH4 content. Therefore, the oxygen/water ratio can be increased appropriately to increase the H2 yield, and the oxygen/water ratio can be decreased appropriately to increase the CH4 yield. In the methanation reaction zone, the changes in H2 and CH4 content are similar to those in the reduction zone, but the effect on CO and CO2 is more obvious. With the increase in the oxygen/water ratio, the molar fraction of CO increases from 0.533 to 0.577, and the molar fraction of CO2 decreases from 0.08 to 0.039. This result illustrates that the decrease in the water injection volume affects one of the main reactions in the water–coal gas reaction CO + H2O→CO2 + H2 (a typical reversible reaction), so the decrease in water injection is unfavorable for the reaction to proceed in the positive direction, resulting in an increase in CO content and a decrease in CO2 and H2 content. The CO + 3H2→CH4 + H2O reaction will proceed in the reverse direction at higher temperatures, resulting in a decrease in CH4 content and an increase in H2 content.

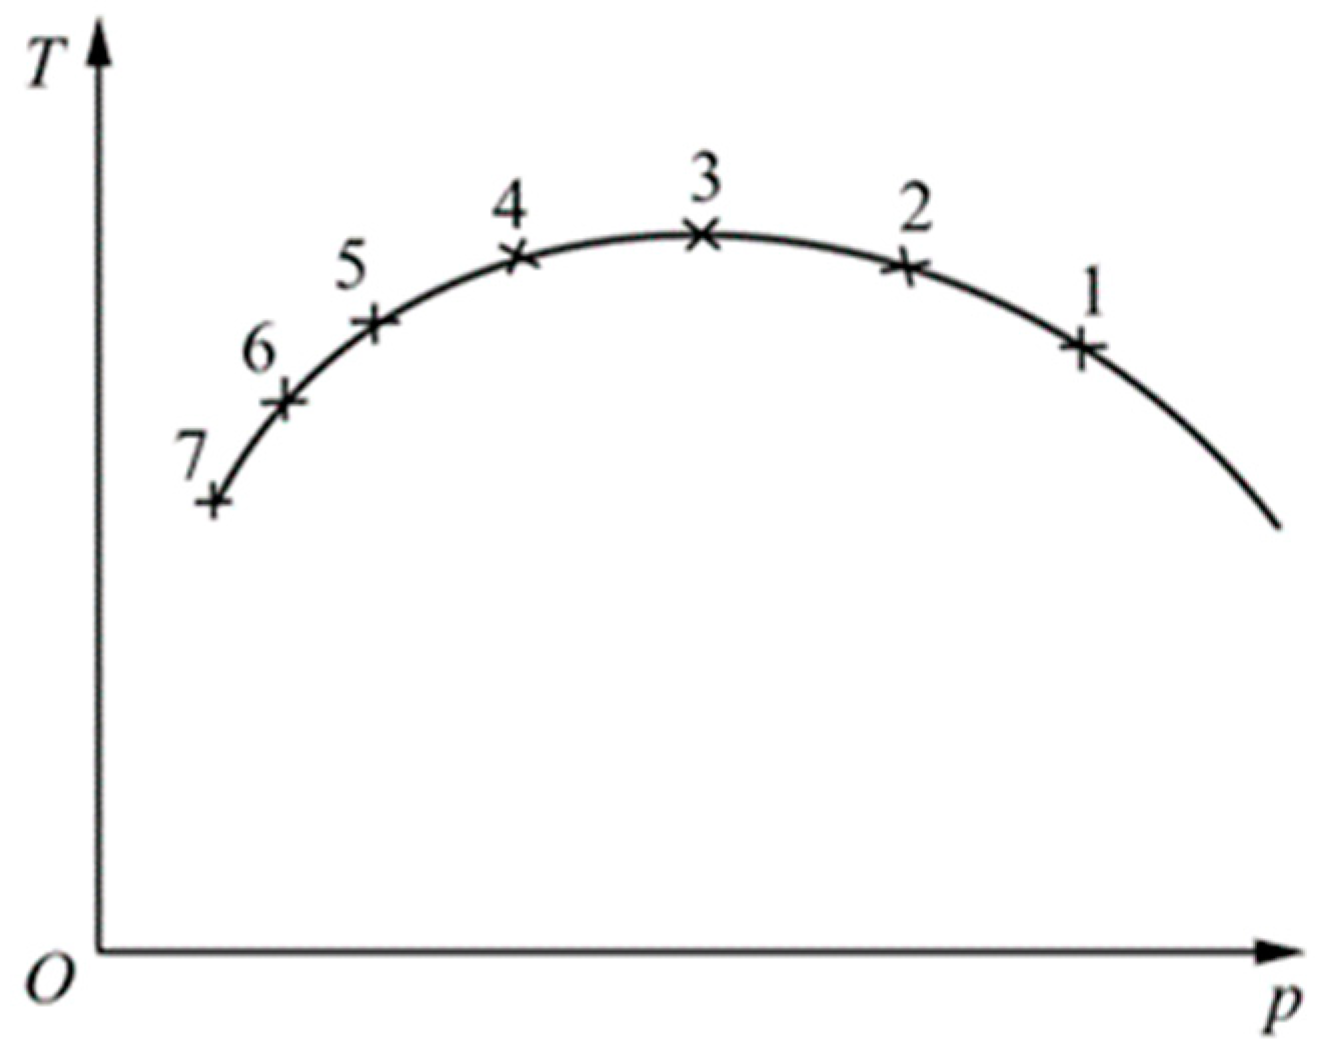
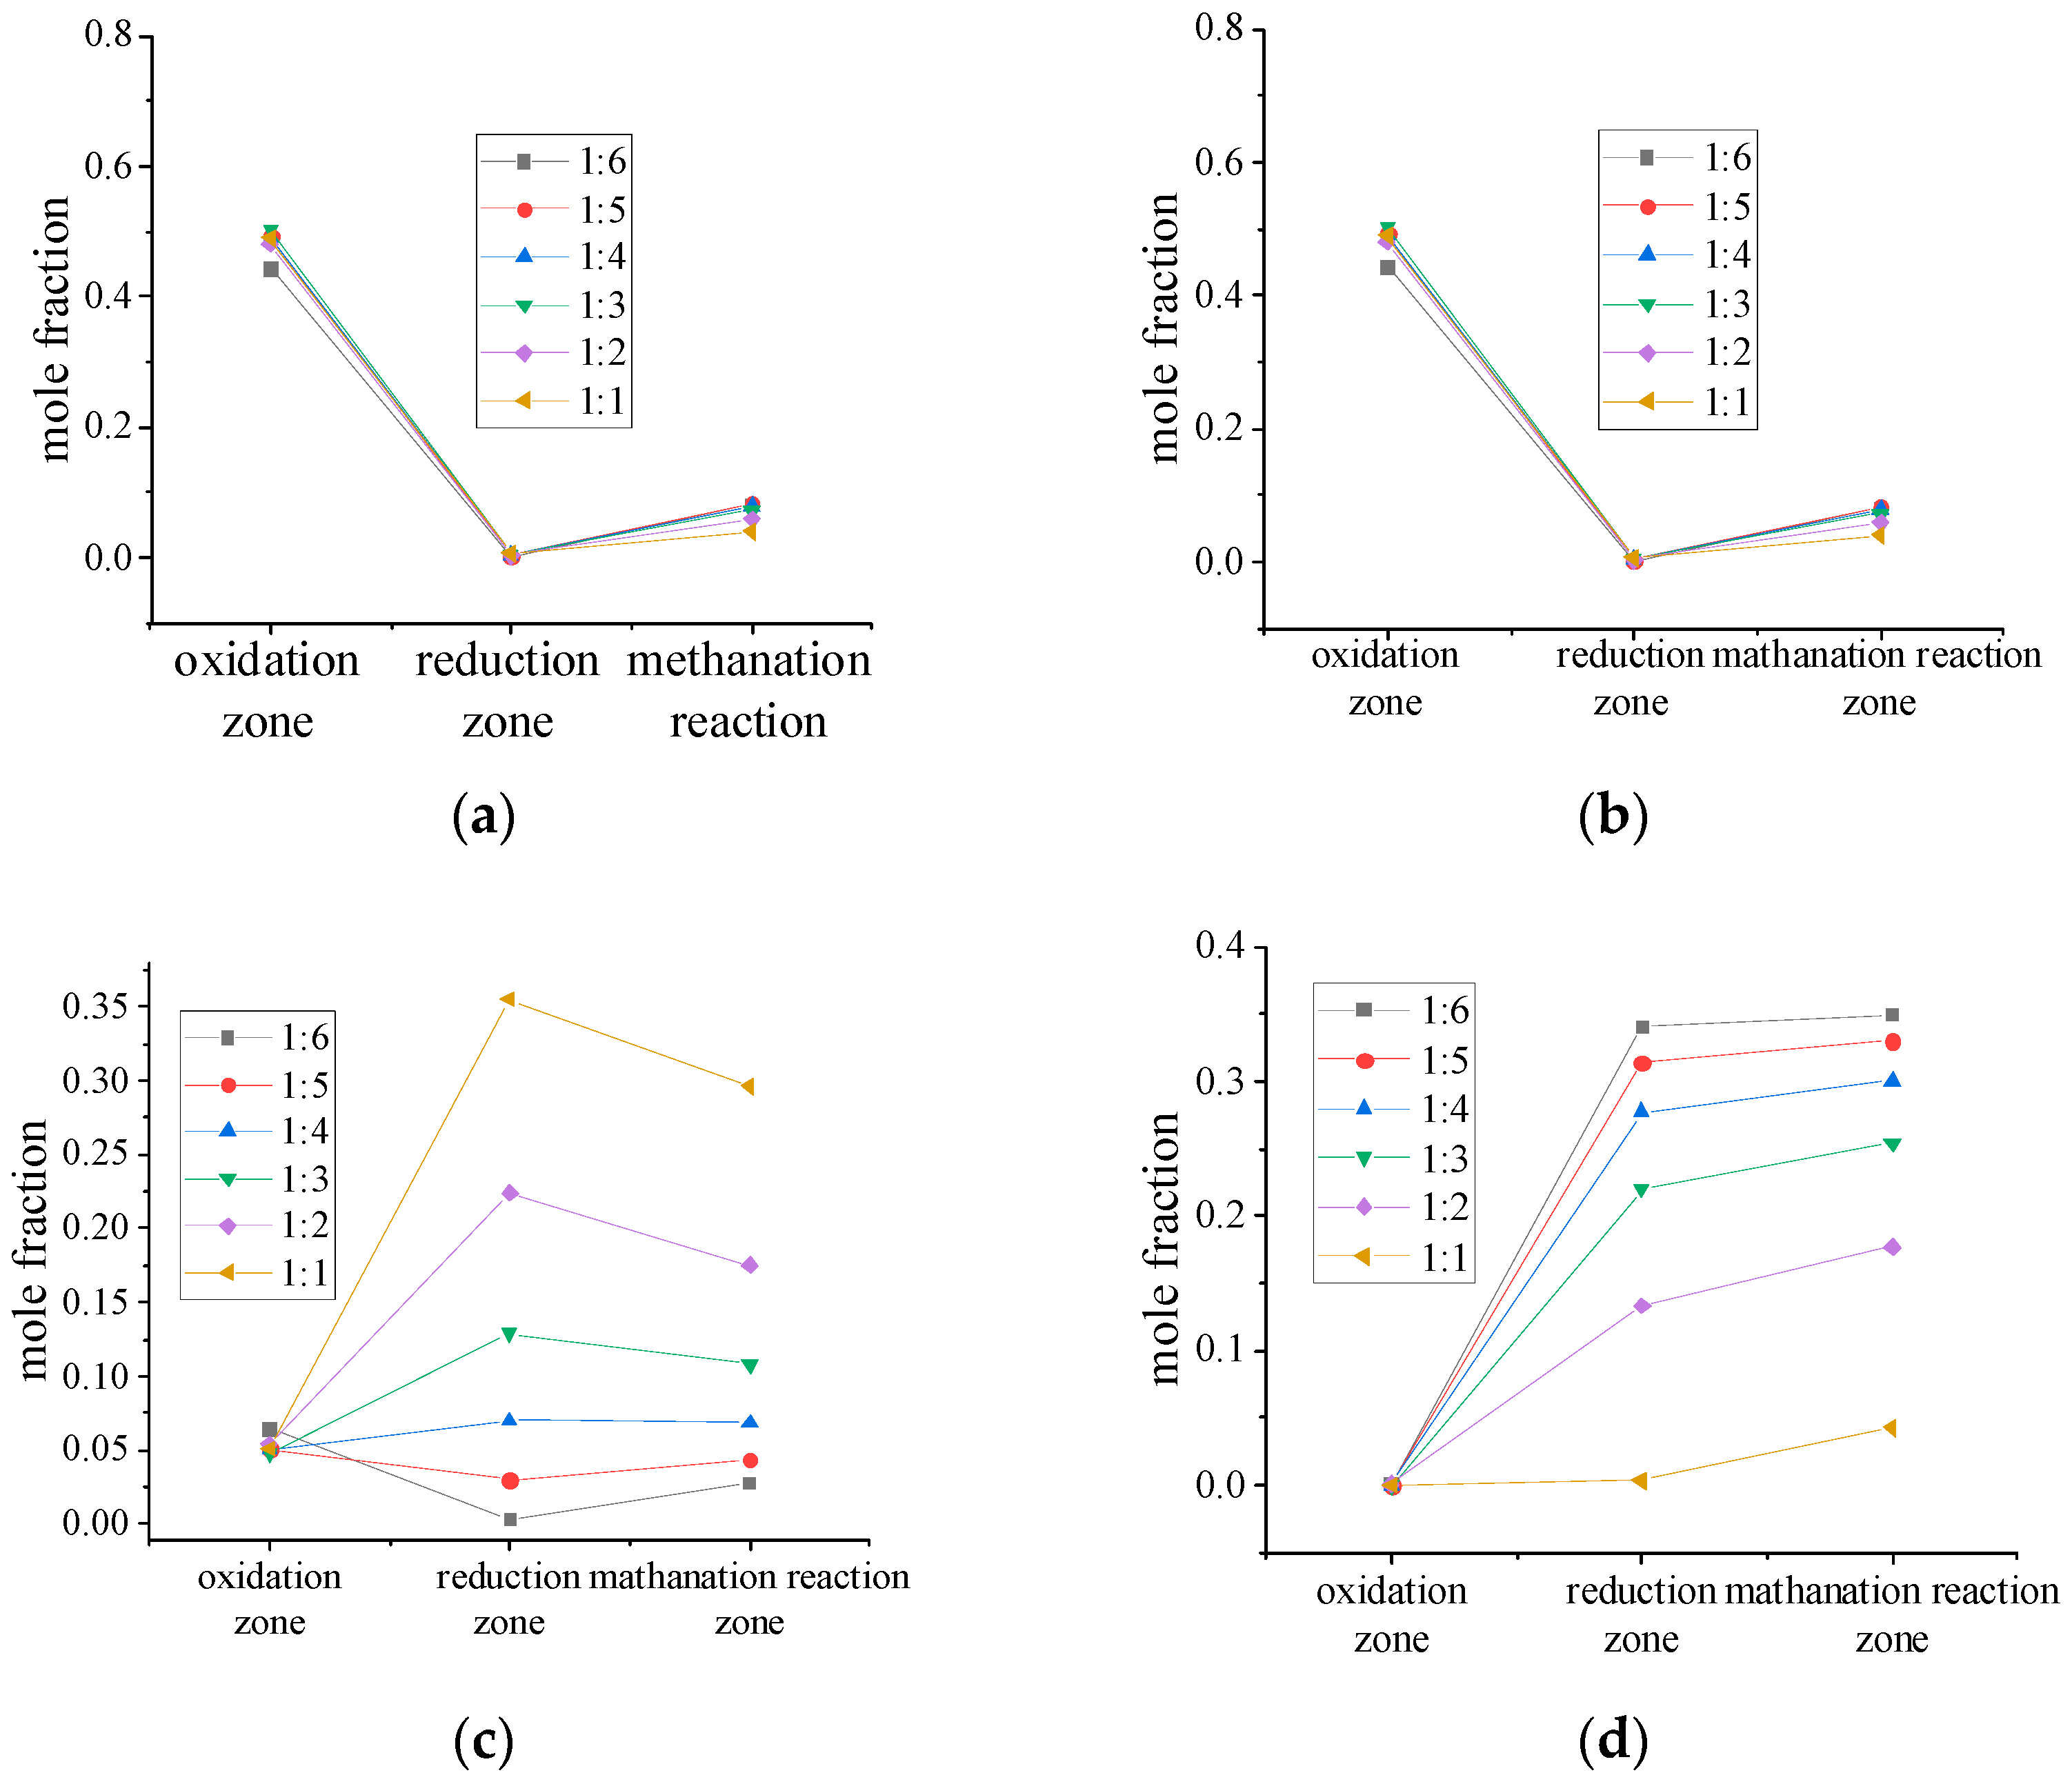
4.6. Analysis of Gas Components in Different Reaction Zones

In the established model, the changing rules of CO2, CO, H2, and CH4 in the oxidation zone, reduction zone, and methanation reaction zone were investigated under different oxygen/water ratios. The results of the influence of the oxygen/water ratio on the gas components in different reaction zones are shown in Figure 10a–d.
From Figure 10a,b, it can be seen that the CO2 content is the largest in the oxidation zone, decreases sharply in the reduction zone, and rises slowly in the methanation reaction zone, and has a contrasting change rule to CO. This shows that in the oxidation zone, there is a large amount of oxygen, mainly in the oxidation reaction dominated by the combustion of C, and a large amount of CO2 or part of the CO2 generated by the reduction reaction to generate CO is further oxidized to CO2. After arriving at the reduction zone, because O2 has been consumed, driven by the large amount of heat generated by the combustion, the CO2 is reduced to CO, which results in a decrease in CO2 in the reduction zone and a sharp increase in CO content. In the methanation reaction zone, due to the transformation reaction of CO, the reaction of CO and H2O produces CO2 and H2. As can be seen from the figure, different oxygen/water ratios have a small effect on the change in CO2 and CO content.
From Figure 10c,d, it can be seen that the changes in H2 and CH4 content in each reaction zone are greatly affected by the oxygen/water ratio, and in the initial stage of the gasification reaction, the generation of H2 and CH4 mainly comes from coal pyrolysis with lower content. In the reduction zone, the incandescent C reacts with H2O to generate H2, especially when the oxygen/water ratio is high, the reactor temperature is higher, the H2 content is higher, and the CH4 generation is lower. As the oxygen/water ratio decreases, the reaction temperature decreases, and C or CO will undergo a methanation reaction with H2. Both reactions are exothermic, so the temperature is reduced in favor of the reaction, and at this time, the distinction between the reduction zone and methanation reaction zone is not strict. In the methanation reaction zone, H2 will be further converted into CH4, which is reflected in the decrease in H2 content and the increase in CH4 content shown in Figure 10c,d.

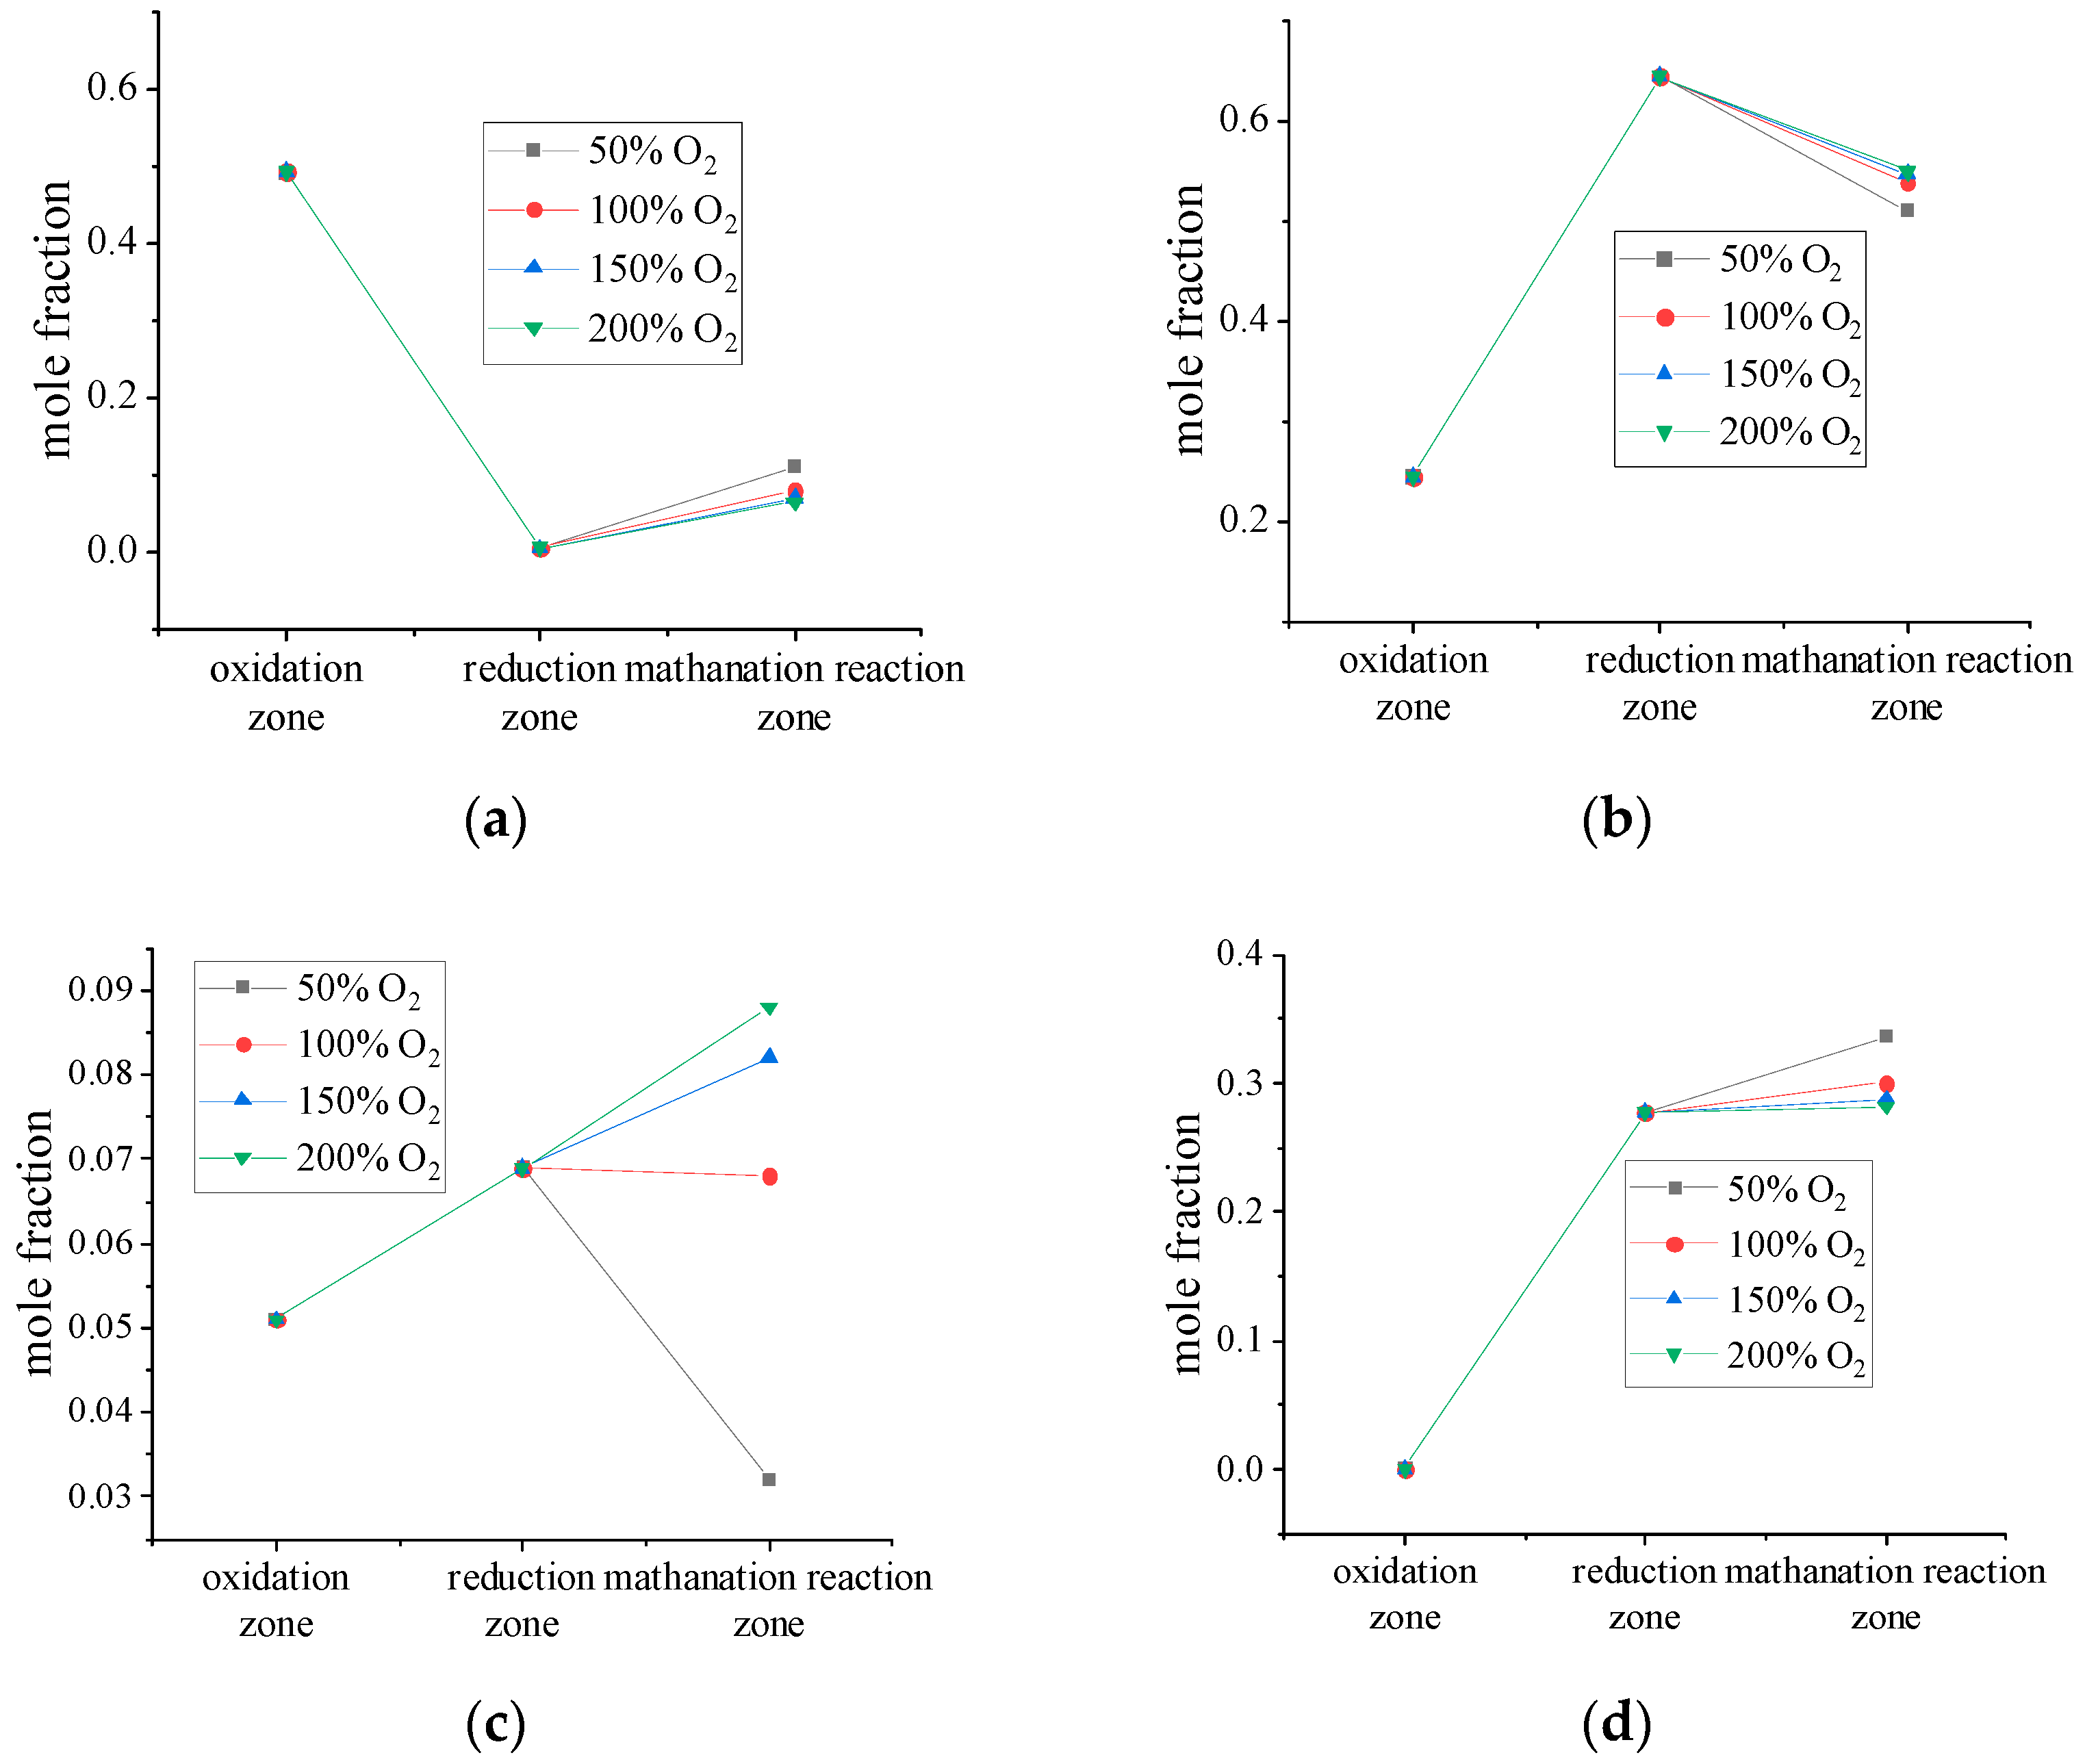
4.7. Effect of Processing Capacity on Syngas Composition

Since this paper studies the ideal reaction, it does not involve the expansion of the gasification chamber; it only considers the effect of the treatment volume on the product components. Under the condition of an oxygen/water ratio of 1:4, the working conditions of 50%, 100%, 150%, and 200% were studied to analyze the effect of treatment volume on the gas components, and the effects of different treatment volumes on the gas components in different reaction zones are shown in Figure 11a–d.
It can be seen from Figure 11a–d that for the ideal reaction, the molar fractions of gas components in the oxidation and reduction zones are not affected by the amount of treatment due to the proportional change in injected O2, H2O and coal, and the amount of treatment mainly affects the gas fractions in the methanation reaction zone. The reaction temperature increased with the increase in the treatment volume, resulting in an increase in the H2 molar fraction and a decrease in the CH4 molar fraction.

4.8. Effect of Spray Water on Syngas Composition

In order to analyze the effect of spray-water mass flow rate on the cooling effect of spraying, the syngas flow rate obtained was 794,461 kg/d under the working condition of an oxygen injection amount of 70,000 kg/d and a gasification water injection amount of 240,000 kg/d. Next, the spray-water mass flow rate was set to 68,000 kg/d, 70,000 kg/d, 75,000 kg/d, and 80,000 kg/d, and a simulation of the syngas components and temperature field was carried out. The effects of the different flow rates on the composition of the generation of the gas and the temperature are presented in Figure 12a,b.
As can be seen from Figure 12, with the increase in the amount of spray water, the content of water vapor in the syngas increases, so the other components of the molar fraction are consequently decreased. However, overall, the rate of change in the syngas components due to the spray water is small, The syngas temperature needs to be controlled within a certain range: if the temperature is too high, this will lead to a decline in the mechanical properties of the pipelines in the production wells or even damage, and if the temperature is lower than the dew-point temperature, this will lead to liquid water. The temperature is lower than the dew-point temperature, resulting in liquid-water precipitation, due to the syngas containing CO2, H2S, SO2, and other acidic gases. These gases in the liquid water cause pipeline corrosion. When the spray-water mass flow rate increases from 68,000 kg/d to 80,000 kg/d, the syngas temperature decreases from 346 °C to 320 °C. In order to verify the reasonableness of the simulation results, the authors referred to the specific heat capacities of H2O, CO, CO2, H2, and CH4, and the latent heat of vaporization of water in the chemical handbook; calculated the heat absorption of the spray water and the exothermic heat of the syngas according to the formula Q = cm Δ t ; and used the formula Q latent   heat   of   vaporisation   of   water = m r to figure out the latent heat of vaporization of the spray water. The calculations show that the temperature of the syngas decreases by about 28 °C, which is approximately the same as the simulated value of 26 °C when the mass of the spray water was increased from 68,000 kg/d to 80,000 kg/d. The method of this paper can be used to determine the amount of spray water due to the changes in the amount of coal, gasification agent, etc., in the actual project.

5. Conclude

Aspen Plus was used to simulate the underground coal-gasification process, and the process simulation models of the oxidation zone, reduction zone, and methanation reaction zone of underground coal gasification were established. Moreover, the changes in the temperature and pressure of oxygen, gasification water, spray water, and syngas in the pipeline, as well as the effects of different pipe diameters on the temperature and pressure, the changes in the gasification products in different conditions, and the effects of the spray water on the syngas components and temperature, were investigated. The following conclusions were obtained.
(1)
Due to the influence of gravitational potential energy, the flow of medium in the injection pipeline is a pressurizing process. In horizontal wells, the pressure drop decreases with the increase in wellbore diameter, which is similar to the result obtained by Zhang et al. [34]: the hydraulic molar resistance decreases with the increase in wellbore diameter, and when injecting the gasifier, it is necessary to determine a reasonable injection pressure according to the formation pressure and the change in pressure during the injection process.
(2)
The liquid-water injection process generates a high water-column pressure, and a lower injection pressure should be selected, ensuring that the pressure in the inner pipeline of the injection well is higher than that in the outer pipeline. The initial injection pressure of the liquid is lower than that of the gas, which should be injected into the inner pipeline of the injection well and the outer pipeline, and should be injected with the gas and into the liquid.
(3)
Changes in the oxygen/water ratio have a greater effect on the molar fractions of H2 and CH4 and a smaller effect on CO2 and CO. Under high-pressure conditions, increasing the oxygen/water ratio is beneficial to H2 generation because H2 mainly comes from the decomposition reaction of water vapor [35]. Lowering the oxygen/water ratio results in a lower gasification temperature, which is favorable for CH4 generation, so the syngas composition can be controlled by changing the oxygen/water ratio.
(4)
CO2 is the highest in the oxidation zone and the lowest in the reduction zone, and the methanation zone increases with the transformation reaction. CO is the lowest in the oxidation zone and the highest in the reduction zone. This indicates that the combustion reaction of C mainly occurs in the early stage of gasification, and the CO2 produced has not yet participated in the reduction reaction in large quantities, leading to an increase in the concentration of CO2. As the gasification process proceeds, the heat generated by the combustion reduces the CO2 to CO, resulting in a decrease in the content of CO2. As the gasification temperature decreases, some CO is converted to H2 and CO2 and the CO content decreases. A high content of CO2 means a higher temperature in the zone, while a high content of CO means a lower temperature.
(5)
The syngas temperature decreases with the increase in the injection volume of spray water, and the syngas temperature has a great influence on the stress of the production wellbore, so the spray-cooling of the syngas can effectively reduce the internal stress of the wellbore [36] and ensure that the wellbore will not be destabilized. The spray-cooling process does not affect the original components of the gas but will increase the water vapor content of the gas, which indirectly leads to changes in the fraction of wet gas components.
(6)
During gasification reactions with O2/H2O as gasification agents under high pressure, the proportion of H2O in the gasification agent should be increased if it is oriented towards the generation of CH4 and decreased if it is oriented towards the generation of H2.

Author Contributions

Conceptualization, S.Y.; methodology, S.Y.; software, W.J.; validation, W.J.; investigation, C.W. and S.W.; data-curation, Q.J.; writing-original draft preparation, W.J.; writing-review and editing, S.Y. All authors have read and agreed to the published version of the manuscript.

Funding

This work was funded by the Xi’an Shiyou University Graduate Student Innovation and Practical Ability Cultivation Program (YCS22213129); Major scientific and technological projects of China National Petroleum Corporation (Grant Number: 2019E-25); and the Natural Science Basic Research Program of Shaanxi Province (Grant Number: 2023-JC-QN-0609).

Data Availability Statement

Dataset available on request from the authors.

Acknowledgments

This work was supported by the Xi’an Shiyou University and the company “Coalbed Methane Company Limited”. Many thanks to them for their contributions to this article.

Conflicts of Interest

Author Chuangye Wang was employed by the company “Coalbed Methane Company Limited”. The remaining authors declare that the research was conducted in the absence of any commercial or financial relationships that could be construed as a potential conflict of interest.

References

  1. Zhao, Z.; Yang, Z.; Yi, T.; Qin, Y.; Yang, Y.; Jin, J. Research Status of Underground Coal Gasification Abroad. Coal Geol. China 2023, 4, 1–10. [Google Scholar]
  2. British Petroleum. BP Statistical Yearbook of World Energy; British Petroleum: London, UK, 2023. [Google Scholar]
  3. Hamanaka, A.; Ishii, Y.; Itakura, K.I.; Sasaoka, T.; Shimada, H.; Widodo, N.P.; Deguchi, G. Monitoring the gasification area and its behavior in underground coal gasification by acoustic emission technique instead of temperature measurement. Sci. Rep. 2023, 13, 9757. [Google Scholar] [CrossRef]
  4. Mandapati, R.N.A.; Ghodke, P.B. Modeling of gasification process of Indian coal in perspective of underground coal gasification (UCG). Environ. Dev. Sustain. 2020, 22, 6171–6186. [Google Scholar] [CrossRef]
  5. Sadovenko, I.A.; Inkin, A.V. Method for Stimulating Underground Coal Gasification. J. Min. Sci. 2018, 3, 514–521. [Google Scholar] [CrossRef]
  6. Yang, L. Characteristics of “Three Zones” in Underground Coal gasification and Its Study influence Variables. J. Nanjing Univ. Sci. Technol. 2001, 25, 533–537. [Google Scholar]
  7. Wiatowski, M.; Kapusta, K.; Strugała-Wilczek, A.; Stańczyk, K.; Castro-Muñiz, A.; Suárez-García, F.; Paredes, J.I. Large-Scale Experimental Simulations of In Situ Coal Gasification in Terms of Process Efficiency and Physicochemical Properties of Process By-Products. Energies 2023, 16, 4455. [Google Scholar] [CrossRef]
  8. Liu, J.; Wu, M.; Wang, S.; Qin, Y.; Zhu, S.; Sun, Q.; Yang, L.; Sun, P. Progress in Research on Coal Underground Gasification Impacting Factors. Coal Geol. China 2020, 32, 155–158. [Google Scholar]
  9. Chen, H.; Qin, Y.; Chen, Y.; Dong, Z.; Xue, J.; Chen, S.; Zhao, Y. Quantitative Evaluation of Underground Coal Gasification Based on a CO2 Gasification Agent. Energies 2023, 16, 6993. [Google Scholar] [CrossRef]
  10. Zong, K.; Chai, X.; Zhang, H.; Yang, X.; Zhai, C. Analysis and Optimization of Hydrogen Extraction Process from Underground Coal Gasification. Chem. Prod. Technol. 2022, 28, 20–25+9. [Google Scholar]
  11. Kapusta, K.; Wiatowski, M.; Stańczyk, K.; Zagorščak, R.; Thomas, H.R. Large-scale Experimental Investigations to Evaluate the Feasibility of Producing Methane-Rich Gas (SNG) through Underground Coal Gasification Process. Effect of Coal Rank and Gasification Pressure. Energies 2020, 13, 1334. [Google Scholar] [CrossRef]
  12. Krzysztof, S.; Krzysztof, Z.; Anna, Z. Determination of the Extent of the Rock Destruction Zones around a Gasification Channel on the Basis of Strength Tests of Sandstone and Claystone Samples Heated at High Temperatures up to 1200 °C and Exposed to Water. Energies 2021, 14, 6464. [Google Scholar] [CrossRef]
  13. Laciak, M.; Durdán, M.; Kačur, J.; Flegner, P. The Underground Coal Gasification Process in Laboratory Conditions: An Experimental Study. Energies 2023, 16, 3266. [Google Scholar] [CrossRef]
  14. Wang, J.; Meng, Z.; Shi, F.; Guan, J. Study on roof subsidence law and related parameters of gasifier under thermodynamic coupling action. J. China Coal Soc. 2022. Available online: https://kns.cnki.net/kcms2/article/abstract?v=b4E8SuETvlK5M1N-T65--G-WxLUeSjFGdLy8T4EwowFDK6u9MGDDmUk3QfX1xHEBCRyd4Th0e0Hnk7GK0Y2_6beOlnabhaPvpE6BO4h2iu1dQNCLwfSy_6AN6ykWRm9ihSwaVSO52bA=&uniplatform=NZKPT&language=CHS (accessed on 15 March 2024).
  15. Liu, Y.; Jiang, Y.; Deng, S.; Xiong, Z.; Wang, M. A Review of Coal Gasification Process Simulation Based on Aspen Plus Software. Henan Chem. Ind. 2017, 49, 5–8. [Google Scholar]
  16. Cheng, S.; Cao, Z.; Shi, J.; Jiang, Q.; Zhou, H. Steady-state simulation of fixed bed foe coal gasification using ASPEN PLUS. J. China Coal Soc. 2012; 37, (Suppl. S1), 167–172+6. [Google Scholar]
  17. Hao, P.; Wang, C.; Liu, M.; Cao, W.; Li, X.; Yuan, S.; Wu, S.; Qi, W. Analysis of Recovery Rate for Underground Coal Gasification Based on Strength and Permeability. J. China Coal Soc. 2023, 48, 3562–3572. [Google Scholar]
  18. Wu, M.; Qin, Y.; Li, G.; Shen, J.; Song, X.; Zhu, S.; Han, L. Research progress on influencing factors and evaluation methods of underground coal gasification. Coal Sci. Technol. 2022, 50, 259–269. [Google Scholar]
  19. Wu, C.; Jiang, X. Research progress of temperature field and heat transfer characteristics in process of underground coal gasification. Coal Sci. Technol. 2022, 50, 275–285. [Google Scholar]
  20. Xin, L.; Wu, J.; Wang, B.; Niu, M.; Li, J.; Xu, W.; Wang, X.; Shang, Z.; Li, H.; Ma, Y. Pyrolysis yield of typical organics in underground coal gasification. Coal Eng. 2023, 55, 170–174. [Google Scholar]
  21. Zhou, H.; Huang, G.; Chen, Y.; Wang, S.; Wang, Y.; Wang, W. Research on phase change model and characteristics of crude coal gas in underground coal gasification. Coal Chem. Ind. 2023, 51, 19–23. [Google Scholar]
  22. Xu, Y.; Wu, Y.; Wei, S. Simulation of the Performance Based on ASPEN PLUS for Dry Feed Entrained Flow Coal Gasification of Entrained-Bed Gasifier. J. Xi’an Jiaotong Univ. 2003, 7, 692–694+706. [Google Scholar]
  23. Fu, X.; Li, K.; Xin, L.; Feng, M.; Wu, J.; Li, J.; Wang, Z. Analysis of the Physical and Chemical Properties of Fat Coal at Different Pyrolysis Temperatures in UCG Environment. Solid Fuel Chem. 2022, 56, 384–409. [Google Scholar] [CrossRef]
  24. Zhao, H.; Wang, J.; Zhou, S.; Zhang, C.; Ren, X.; Yang, C. Analysis of Spray Cooling of High-temperature Gas Produce by Underground Coal Gasification Based on DMP Model and Realizable k-ε Turbulence Model. Mech. Electr. Eng. Technol. 2023, 52, 98–101. [Google Scholar]
  25. Shi, L.; Liang, J.; Wang, Y.; Wang, L.; Zhao, X.; Li, Y.; Zhang, Y. Simulation of lignite underground gasification using Aspen Plus. Coal Eng. 2017, 49, 5–8. [Google Scholar]
  26. Zhou, Y.; He, X.; Lin, K.; Qin, S.; Zhang, C.; Liu, Z. Formation Pressure Estimation Method Based on Dyna -mic Effective Stress Coefficient. Xinjiang Pet. Geol. 2023, 44, 245–251. [Google Scholar]
  27. Sun, L.; Wang, J.; Qi, P. Simulation Analysis with Aspen Plus for a Chemical System Process. Anhui Chem. Ind. 2015, 41, 48–50+52. [Google Scholar]
  28. Lin, L. Aspen Plus Software Application for Coal Gasification Simulation. Shanghai Chem. Ind. 2006, 5, 10–13. [Google Scholar]
  29. Pan, Z.; Wang, J.; Liu, R.; Hua, Z.; Zhang, C.; Han, L.; Zhang, Y.; Xu, X.; Ren, X. Structural Design of Multi-channel Coiled Tubing for Underground Coal Gasification. Pet. Tubul. Goods Instrum. 2023, 9, 44–47. [Google Scholar]
  30. Liu, Y.; Huang, S.; Yuan, G.; Tang, Y. Study on Temperature Field of High Temperature Wellbore of Underground Coal Gasification. Coal Convers. 2022, 45, 58–64. [Google Scholar]
  31. Wang, C.; Wang, J.; Jing, X.; Qiao, L.; He, A.; Liu, Y.; Tang, Y. Simulation Study on Erosion Law of Wellhead Equipment in Underground Coal Gasification Production Well. Surf. Technol. 2023, 5, 101–110, 130. [Google Scholar]
  32. Xin, L.; An, M.; Feng, M.; Li, K.; Cheng, W.; Liu, W.; Han, L. Study on pyrolysis characteristics of lump coal in the context of underground coal gasification. Energy 2021, 237, 121626. [Google Scholar] [CrossRef]
  33. Li, Q. Research on High Temperature Pyrolysis Characteristics of Pulverized Coal, Design and Experiment of Pilot-Scale Pyrolysis-Gasification System. Ph.D. Thesis, Zhejiang University, Hangzhou, China, 2018. [Google Scholar]
  34. Zhang, Y.; Yang, P.; Liu, J.; Mao, L.; Yuan, J.; Fu, D. Pressure Control of Underground Coal Gasification Injection Well. Sci. Technol. Eng. 2023, 23, 15036–15043. [Google Scholar]
  35. Liang, J.; Ling, Y.; Cheng, S.; Yang, Y.; Zhao, Z.; Yuan, H.; Li, Z. Evolution law of the characteristic field of channel-type underground coal gasification process. J. China Coal Soc. 2022, 47, 2218–2227. [Google Scholar]
  36. Tang, Y.; Xie, N.; Xiong, H.; He, Y.; Huang, S. Stress field of high-temperature wellbore under spray cooling for underground coal gasification. Coal Geol. Explor. 2023, 51, 13–23. [Google Scholar]
Figure 1. Flow sheet for simulation of underground coal gasification process.
Energies 17 01619 g001
Figure 2. Aspen Plus Simulation Process.
Energies 17 01619 g002
Figure 3. Pressure- and temperature-evolution curves of oxygen injection pipeline. (a) Pressure-evolution curve (b) Temperature-evolution curve.
Energies 17 01619 g003
Figure 4. Isoenthalpy curves for general gases. The numbers 1–7 in the graph indicate the order in which the pressure changes from greater to lesser, indicating that the temperature of the gas will first increase and then decrease as the pressure becomes lesser.
Energies 17 01619 g004
Figure 5. Pressure- and temperature-evolution curves of gasification water injection pipeline. (a) Pressure-evolution curve (b) Temperature-evolution curve.
Energies 17 01619 g005
Figure 6. Comparison of pressures in water and oxygen injection pipelines.
Energies 17 01619 g006
Figure 7. Pressure- and temperature-evolution curves of spray pipeline. (a) Pressure-evolution curve (b) Temperature-evolution curve.
Energies 17 01619 g007
Figure 8. Pressure- and temperature-evolution curves of syngas pipeline. (a) Pressure-evolution curve (b) Temperature-evolution curve.
Energies 17 01619 g008
Figure 9. Effect of oxygen/water ratio on syngas components. (a) Changes in syngas components in the reduction zone (b) Changes in syngas components in the methanation reaction zone.
Energies 17 01619 g009
Figure 10. Variation of syngas components in different reaction zones. (a) Effect of oxygen/water ratio on CO2 (b) Effect of oxygen/water ratio on CO (c) Effect of oxygen/water ratio on H2 (d) Effect of oxygen/water ratio on CH4.
Energies 17 01619 g010
Figure 11. Effect of processing capacity on fractions of syngas components. (a) Effect of processing capacity on CO2 fractions (b) Effect of processing capacity on CO fractions (c) Effect of processing capacity on H2 fractions (d) Effect of processing capacity on CH4 fractions.
Energies 17 01619 g011
Figure 12. Effect of spray water on gas components and temperature. (a) Effect of spray water on gas components (b) Effect of spray water on gas temperature.
Energies 17 01619 g012
Table 1. Ultimate and proximate analysis of coal for gasification of dry-ash basis (%).
Elemental AnalysisIndustrial Analysis
CadHadOadNadSadMadAadFCadVad
70.823.9515.340.260.772.566.3061.6829.46
Table 2. Piping parameters.
Oxygen Injection PipelineWater Injection PipelineSpray-Water PipelineSyngas Pipeline
Tube length (vertically)/m870870870870
Tube length (level)/m12001200//
Tube diameter (vertically)/m0.06850.0880.080.1
Tube diameter (level)/m0.06850.088//
Roughness/×10−5 m4.574.574.574.57
Table 3. Ultimate and proximate analysis of coal for experimental analysis.
Elemental AnalysisIndustrial Analysis
CadHadOadNadSadMadAadFCadVad
58.273.0118.380.700.3210.368.9651.2829.40
Table 4. Comparison of experimental results with simulation results.
Value Typeψ/%Syngas Temperature/°C
N2H2COCO2CH4
Experimental results030.2059.3111.240.291198
Simulation results0.3328.3760.810.320.211100
Disclaimer/Publisher’s Note: The statements, opinions and data contained in all publications are solely those of the individual author(s) and contributor(s) and not of MDPI and/or the editor(s). MDPI and/or the editor(s) disclaim responsibility for any injury to people or property resulting from any ideas, methods, instructions or products referred to in the content.

