Article

Mechanisms of Waterflood Inefficiency: Analysis of Geological, Petrophysical and Reservoir History, a Field Case Study of FWU (East Section)

1
Petroleum Recovery and Research Center, New Mexico Tech, Socorro, NM 87801, USA
2
Petroleum and Natural Gas Department, University of Energy and Natural Resources, Sunyani P.O. Box 214, Ghana
*
Author to whom correspondence should be addressed.
Energies 2024, 17(7), 1565; https://doi.org/10.3390/en17071565
Submission received: 12 February 2024 / Revised: 13 March 2024 / Accepted: 14 March 2024 / Published: 25 March 2024
(This article belongs to the Special Issue Forecasting CO2 Sequestration with Enhanced Oil Recovery II)

Abstract

:
The petroleum reservoir represents a complex heterogeneous system that requires thorough characterization prior to the implementation of any incremental recovery technique. One of the most commonly utilized and successful secondary recovery techniques is waterflooding. However, a lack of sufficient investigation into the inherent behavior and characteristics of the reservoir formation in situ can result in failure or suboptimal performance of waterflood operations. Therefore, a comprehensive understanding of the geological history, static and dynamic reservoir characteristics, and petrophysical data is essential for analyzing the mechanisms and causes of waterflood inefficiency and failure. In this study, waterflood inefficiency was observed in the Morrow B reservoir located in the Farnsworth Unit, situated in the northwestern shelf of the Anadarko Basin, Texas. To assess the potential mechanisms behind the inefficiency of waterflooding in the east half, geological, petrophysical, and reservoir engineering data, along with historical information, were integrated, reviewed, and analyzed. The integration and analysis of these datasets revealed that several factors contributed to the waterflood inefficiency. Firstly, the presence of abundant dispersed authigenic clays within the reservoir, worsened by low reservoir quality and high heterogeneity, led to unfavorable conditions for waterflood operations. The use of freshwater for flooding exacerbated the adverse effects of sensitive and migratory clays, further hampering the effectiveness of the waterflood. In addition to these factors, several reservoir engineering issues played a significant role in the inefficiency of waterflooding. These issues included inadequate perforation strategies due to the absence of detailed hydraulic flow units (HFUs) and rock typing, random placement of injectors, and uncontrolled injected fresh water. These external controlling parameters further contributed to the overall inefficiencies observed during waterflood operations in the east half of the reservoir. A detailed understanding of the mechanistic factors of inefficient waterflood operation will provide adequate insights into the development of the improved recovery technique for the field.

1. Introduction

Waterflooding is dominant amongst fluid injection methods and responsible for high levels of oil production (over fifty percent of recovery worldwide) [1,2,3]. This technique is employed to increase hydrocarbon recovery when there is a significant decline in primary production resulting from the depletion of the reservoir pressure [4,5]. Waterflooding over decades has been employed to maintain reservoir pressure and displacement of hydrocarbons (improved sweep efficiency) to production wells increasing well productivity [6,7]. This popularity hails from the general availability of water, relative ease of injectivity due to the possession of hydraulic head in injection wells, ability to spread within reservoirs, and its efficiency in oil displacement. The performance or success of waterflooding varies from one reservoir to another with factors such as reservoir stratigraphy and geology, as well as fluid and in situ static and dynamic properties, accounting for most of this variation [2,8]. The North Finn in 1989 recorded a number of waterflooding failures in its North Carson Muddy oilfield, accounting for more than half of its cash flow. It was investigated that fluvial deposited lower Muddy sandstones reservoirs (‘lenticular, heterogeneous sand bodies containing abundant clays’) of the early cretaceous age have never been flooded successfully [9]. The stag field on North-West Shelf Australia encountered a flooding failure in 2000, which appeared to be a wormhole like failure [10]. An assertion from the study on the Ekofisk field in the North sea also indicated that waterflood-induced fractures which ‘increased fracture density and surface area and reduced matrix block dimensions in reservoir chalk’ are the probable cause of flooding failure in the field [11]. In the case of El Morgan oil field in the Gulf of Suez, a disparity between the efficiency of two waterflooding injection wells was encountered. Integrating and analyzing core and reservoir engineering data indicated heterogeneity was the cause of inefficient injectivity of one well to the other [12]. Planning of waterflooding thus requires an extensive delineation of reservoir properties. This includes but is not limited to the depositional environment, reservoir diagenetic history, pore structure and interconnections and reservoir fluid and rock properties [12]. A key issue that arises during waterflooding is formation damage [13]. This could be due to reservoir fluid or property incompatibility with injected water. Mechanical damages induced by solid injection or fine migrations are also common known causes [14].
This study intends to decipher the inefficiency/failure of waterflooding on the eastern section of Farnworth Unit (FWU) in Ochiltree county, Texas. Primary production on the eastern section was quite prolific as compared to the western section of FWU (Figure 1a). Hydrocarbons initially in place (HIIP) were also estimated to be higher on the eastern section. The west section, however, has been quite successful on waterflood and has been the major contributor to the total recovery of the field beyond primary recovery. Due to its success, CO2-EOR, which aims at maximizing oil recovery and CO2 storage, was initiated on the west section. Maximizing oil recovery is a major objective of FWU and, as such, understanding the underlying factors of waterflood inefficiency would pave a much clearer understanding of the east section and what recovery techniques to employ. A detailed review of geology, analysis of petrophysical properties, and reservoir engineering data on both sections of FWU will be conducted. Thus, the mechanisms of flow can be understood by an attempt by this study to unravel the causes of inefficiency.

2. The Farnsworth Unit—Lithostratigraphic and Geological Settings

The field is a hydrocarbon-producing reservoir from the Pennsylvanian sequence and positioned in the north-western shelf of Anadarko basin (Figure 2), which is located in Ochiltree county, Texas panhandle. The Pennsylvanian sequence is characterized by sandstones and mudstones (Figure 3). The FWU reservoir is the Morrow B (Buckhaults) sandstone of the Morrowan-age bio-stratigraphic and lithostratigraphy of overlain layers. Morrow B is overlain by an upper Morrowan-age shale and an Atokan-age Thirteen Finger Limestone (thirteen limestones intercalated by coal and mudstone). Other recent research [15] through a UPb detrital-zircon depositional age suggests that Morrow B is nearer to Atokan Des Moine’s boundary, thus the age of Thirteen Finger Limestone and upper Morrowan shale can also be implicated [16,17]. Deposition of the Morrowan and Atokan series occurred somewhere beginning to halfway the Pennsylvanian. Pennsylvanian and Permian stratigraphy are characterized by rapid changes in facies due to the rise and fall of sea levels [18,19]. These occurred due to the formation of Gondwanan land mass from the coalescence of cratons, leading to orbital Milankovitch cycles [20,21]. This period resulted in an upliftment caused by a deformation arising from North America colliding with Gondwanan [17,18,22]. The uplifts caused basins to lose sediments. Fill up of the basins accounts for much of the overlain layers (shale, limestone, dolomite, sandstone, and evaporites) of Farnsworth Unit.
Tectonic activities including the creation of folds and faults of the Ouachita-fold belt, Cimarron arch, Apishapa, Nemaha and Amarillo Wichita upliftment, and Arkoma basin subsidence [23,24] are of the Wichita orogeny (caused by the North-American plate colliding with the South-American plate through the Morrowan to Des Moinesian period). Others interpret it to be caused by the generation of stress through the southwestern Laurentia margin [23,24]. Past studies interpret Morrow sands in north-west Anadarko deposit to be fluvial [19,25,26,27,28]. Concurrent sand and mud deposits of the same deltaic and fluvial system were proposed by [26]. However, the authors of [29,30] suggested incised valley infill through regression and further transgression. The depositional environment for the Atokan Thirteen Finger Limestone, in contrast to Morrowan sands and shales, was estuarine to marginal marine with coals, and mudstones intercalated with limestones forming the major lithology [23,30].
Figure 2. Features of Morrowan era and Anadarko basement structure map indicating basins and tectonic provinces, modified from [17,29,31]. The arrow points to FWU with boundary indicating east and west sections of the field. #13-10A and #32-08 are wells on west and east respectively.
Energies 17 01565 g002
Figure 3. Stratigraphic columns of the Des Moines, Morrow and Atokan formations at Farnsworth.
Energies 17 01565 g003

2.1. Diagenesis

According to extensive geological studies conducted in previous years [17,23,24,32], there have been a series of diagenetic events that impacted the physical and chemical characteristics of the Anadarko basin. The chronological series of diagenesis is researched to be in the order: cementation of siderite, over-growth of quartz and feldspar, calcite and ankerite cementation, feldspar replaced by ankerite and calcite, compaction, dissolution of feldspar, precipitation of authigenic clays and emplacement of hydrocarbons.
Siderites on quartz grain surfaces and surrounded by quartz and feldspar overgrowths as well as calcite and ankerite cements are evidence of its pre-existence [17,24]. Euhedral quartz overgrowth in the presence of high primary porosity, Polikolotopic calcite surrounding quartz overgrowth and kaolinite in pores around quartz overgrowth indicates quartz overgrowth formed earlier [24]. The boundary between feldspar and quartz growth with no encroachment suggests the same precipitation period for both. Ankerites are only present in samples from the west. Compaction (both chemical and mechanical) is variable, hence grain contact types form with respect to the degree of compaction (floating, point, long, concavo convex and sutured contacts). Dissolution of feldspar led to intragranular micro- and macroporosities after calcite cementation and compaction. Relicts of feldspar in kaolinite ghost-grains are evidence. Occurring late in digenetic history is the precipitation of authigenic clays, with kaolinite being the most predominant. Chlorite, smectite, and illites are examples of other identified clays [24]. Kaolinite (precipitated after dissolution of feldspar) in the form of ghost-grains (detrital feldspar pseudo-morphs) and pore-filling clay is abundant in Morrow B. However, kaolinite is thought to be non-pervasive [24]. Figure 4 shows photomicrographs and BSEs indicating the results of some diagenetic occurrences on FWU.

2.2. General Description of FWU—Morrow B

The Farnsworth Unit (FWU), discovered in 1955, also has a long history of waterflooding, which begun in 1964 on the east section and 1966 on the west. This field is located in Ochiltree County in north Texas (Figure 2). The formation of interest in this field is Morrow B (Figure 3). It is within a depth of approximately 7550 ft to 7950 ft. Morrow B generally consists of sandstone (subarkosic with a diagenetic process introducing other minerals such as calcite, dolomite, siderite, kaolinites, illites, smectites, and chlorites). It has a maximum pay thickness of 54 feet and an average thickness of 24 feet with a stratigraphic and mineral trapping mechanism. Incised valley fluvial sandstones through a transgressive and regressive cycle form the depositional model for Morrow B [33]. Morrow shale and Thirteen Finger Limestone are identified as the primary seal and the secondary are of limestone and evaporates. Fine-grained sandstone, coarse-grained sandstone, conglomerate, and mudstone make up the principal lithofacies analyzed by Gallagher 2014 [17] from core samples. Lithological and sedimentary structure study subdivided lithofacies into seven subfacies. Microporous clays and grained-sized pores are the predominant porosity facies. Average porosity and permeability are 14% and 48 md, respectively. A proven study of the geological features of the cap rock indicates a strong seal integrity for the sequestration of CO2 [33].

3. Data and Methods

Geological, petrophysical, reservoir and field history datasets collected from FWU were analyzed in this study (Figure 5). Core data, mineralogical and chemical compositions of fluids, geological, petrophysical data, production and injection history from FWU were included in the assessment of waterflood operations on the field. Well data from both the east and west sections of FWU were selected. Two major characterization wells (one each from the east and west) were the key focus in the analysis. Well_32-08 represents the east section with inefficient waterflood and well_13-10A denotes the opposite. The two wells have similar geological properties and are from the same reservoir. XRD, SEM and ELAN analysis provided detailed data on mineralogical composition. Statistical methods such as univariate and bivariate analysis for property distribution analysis, K-Nearest Neighbor (KNN) and Silhouette for heterogeneity analysis were employed as preliminary data analysis and control.
The thickness and sedimentary characteristics of wells 13-10A, 13-14 and 32-08 of the reservoir interval are presented in Figure 6. Representing the west section, 13-10A has a reservoir interval of 35 ft, top shale of 58 ft and limestone of 132 ft. For the east section, 32-08 has two reservoirs (Morrow B and Morrow B1) with 21 ft of mudstone between them. Morrow B has an interval thickness of 66 ft sandstone and B1, 14 ft sandstone and 13 ft shale below [23]. Calcite cemented conglomerate (1–3 ft) forms the base Morrow sandstones in all wells with a thin layer of coal (1 in) above. B and B1 in 32-08 have relatively similar characteristics, with rounded mudstone (2 in) across the base of 32-08. 13-10A has rounded mudstone clasts in parts and finer-grains in other sections. Above this is a brown–dark brown coarse sand, making up the rest of Morrow B. B1 is much darker compared to B in 32-08. The depositional texture and structure are similar in 13-10A and 32-08. By dividing lithofacies, the size of grains and bedding, Morrow sandstones are classified as gravels and sands and bedding types as massive, laminated and irregular [23]. This follows classification categories in [34].
A total number of 128 datasets from the west and 107 datasets from the east were utilized in this study. Grain size and density, porosity, permeability, and fluid saturations were considered as part of the core analysis. Critical reviews on thin sections and petrography analysis were undertaken to differentiate the mineralogical compositions, pore structure and cementation of the two sides of the field. An effort to further characterize controls on storage capacity and fluid flow as well as heterogeneity to further elucidate the mechanisms of waterflood and its failure was made. In the absence of core vertical and horizontal permeability, Winland’s pore throat aperture imperial correlation (Equation (1)) was employed to estimate the pore throats for well data before and after flooding. This correlation is dubbed Winland R35 and estimates the aperture radius of pore throats (which are interconnected creating continuous flow path) when cores are saturated at 35% when mercury porosimetry tests are conducted [35]. This serves as a means to correlate petrophysical reservoir properties as porosity and permeability [36]. Estimated pore throat sizes were further categorized into different pore types based on their sizes. The category definitions were based on pore size distinctions by Hartmann et al., 1990 [37]. A further analysis on how heterogeneity influences waterflood or fluid flow was undertaken by defining hydraulic flow units (HFUs) for both sides of the field employing the pore throat estimates together with porosity and permeability.
L o g R 35 = 0.732 + 0.588 l o g K a i r 0.864 l o g c o r e
Further analysis was conducted to determine the performance of waterflood and the distribution and direction of injected water within the reservoir. This was based on production and injection rate history, as well as reservoir and fluid properties. The analysis included a field, sector/pattern, and well evaluation. Multiple figures were generated using reservoir engineering data and bubble maps to estimate parameters for this analysis.

Properties of FWU Crude Oil

The dead crude oil from FWU field has a density of 0.8447 g/cc @ 60 °F, API of 37.3, and viscosity of 4.002 cp @ 168 oF. The analyzed oil composition contains a weight percent of 3.98% methane, 0.75% ethane, 0.7% propane, 0.11% iso-butane, 0.62% N-butane, 0.25% iso-pentane, 0.59% N-pentane, 1.57% hexanes and 91.43% C7+ (with a density of 0.8477 g/cc, 35.3 API at 60 oF and 291 molecular weight).

4. Results and Discussion

4.1. Reservoir Rock Description and Mineralogical Composition

Mineralogy and reservoir rock characteristics are properties that need to be prioritized during waterflood performance evaluation, especially on fields with different flooding efficiencies. Fractures, the degree of permeability and anisotropy, porosity, and variation in the quality of rocks are contributing factors to how homogeneous or heterogeneous a reservoir can be. This section presents a review and analysis of key FWU reservoir characteristics on both sections which are paramount to this study. FWU is classified into four major lithofacies [24]. Figure 7 summarizes these lithofacies and their respective subfacies, which are predominant on each section (east or west) of the field with general descriptions.
Analysis of fine-grained sandstone facies from 300-point count thin sections for modal composition indicated that porosity is mostly negligible due to a high (45%) intergranular volume of fine-grained sandstones. These facies are classified as lithic arkose (using Folk 1968). The primary grain framework is monocrystalline quartz with some smaller amount of cherts, micas, feldspars, traces of glauconites and authigenic pyrite. A 300-point count for modal composition (rock and clay composition), and a 100-point count for porosities was used to classify coarse-grained sandstones as subarkose sandstone. However, the presence of higher contents of feldspar and lithic classify some samples at certain depths as sublitharentite and lithic arkose. The primary grain framework is monocrystalline quartz (approximately 64% to 86% sandstone) with some amount of poly-crystalline quartz, fragment of granite and volcanic rocks, chert and feldspar (plagioclase). Calcite is the commonest cement, with small overgrowth of ankerite, feldspar, siderite and silica in quartz form (Figure 4). Carbonate cement in 13-10A (west) comprises siderite (with high Fe value), calcite, and ankerite (prominent in all 13-10A samples). There is a significant amount of authigenic clays in thin sections, with kaolinite being the most predominant. Chlorite, illite, smectite are other clay minerals that were detected by XRD. Clays in some samples from the west are partly due to large mudstone clasts, hence having a less adverse effect on reservoir quality. These facies consist of approximately 4% to 23% porosity, which are mostly microporosity and inter-granular macroporosity. Dissolution contributes less to porosity, while fracture porosity is insignificant. Intergranular volume averages 22%, with a minimum and maximum ranging from 10% to 35%. Though some samples have high intergranular volume, they have low point count porosity as a result of high amounts of matrix. Bioturbated mudstones samples contain 33% clay (mixed-layer smectite-illite clays are most common) and 68% non-clay mineral (calcite-32%, quartz-20%, k-feldspar-7%, pyrite-3%, plagioclase-2%, dolomite-2%, ankerite-1%, and fluorapatite-1%).
A further review of geological work through thin-section analysis indicated 9-pore structures from both sections of the field [24]. These are (a) inter-granular macro-pores: Primary pores or dissolution of inter-granular cement but mainly due to depositional events because of non-existent evidence of cement dissolution; well interconnected and contribute to permeability but poor with the presence of authigenic clay. (b) Intragranular macro-pores: Connected to the dissolution of feldspar. Usually, kaolinite partly or completely fills these pores. If connected to inter-granular pores, it may highly contribute to permeability but no effectiveness if isolated. (c) Grain-sized macro-pores: Caused by shrinking, fracturing, sedimentary and authigenic cement dissolution. Few samples from the west are abundant in grain-sized pores and have high permeability. Thus, a link between high permeability and grain-sized pores as compared to inter-granular porosity-filled authigenic clays. (d) Macro-pores and micro-pores in carbonate cement: characterized by dissolution of grains surrounded by poikilotopic calcite or partial cementation of sederite (Figure 4). (e) Micro-pores in grains: Caused by dissolution of silica or feldspar or kaolinite filled intragranular macroporosity. Micro-pores at the edge of grains effectively contribute to permeability. (f) Micro-pores in dissolved grains: these are microporous kaolinite ghost-grains which fill voids previously accumulated by feldspar and mostly surrounded by microporous clay, which contribute less to permeability. These were present in all samples. (g) Micro-pores in clay: these pores are present in authigenic clays as well as other clay matrix. They are abundant in Morrow B and their small size makes them less effective as compared to inter-granular macro-pores. (h) Fracture pores: Not a major part of permeability in Morrow B since they are small and insignificant. Differential compaction is a possible cause of fractures.
Figure 8 presents related porosity subfacies to the pore types and their degree of impact/influence on porosity and permeability. It also indicates which section of FWU is dominated by the facies. Samples with mostly grain-size pore (only from the west samples) have the highest permeability. Dissolution porosity in poikilotopic calcite (with highest number of samples from the east) has the lowest estimated permeability. The east section of FWU has a higher percent (75%) if grain size is higher than 1 mm, and 62% for the west section. Relatively east has better sorting (well sorted = 9%, moderate = 35%, poor = 56%) as compared to the west section (well sorted = 0%, moderate = 31%, poor = 69%) [24]. However, that does not reflect in the reservoir quality from the east as indicated in Figure 8. The study in [17] showed a good relation between reservoir quality and sorting but permeability on the west appears to be much higher.

4.2. Clay Composition/Content

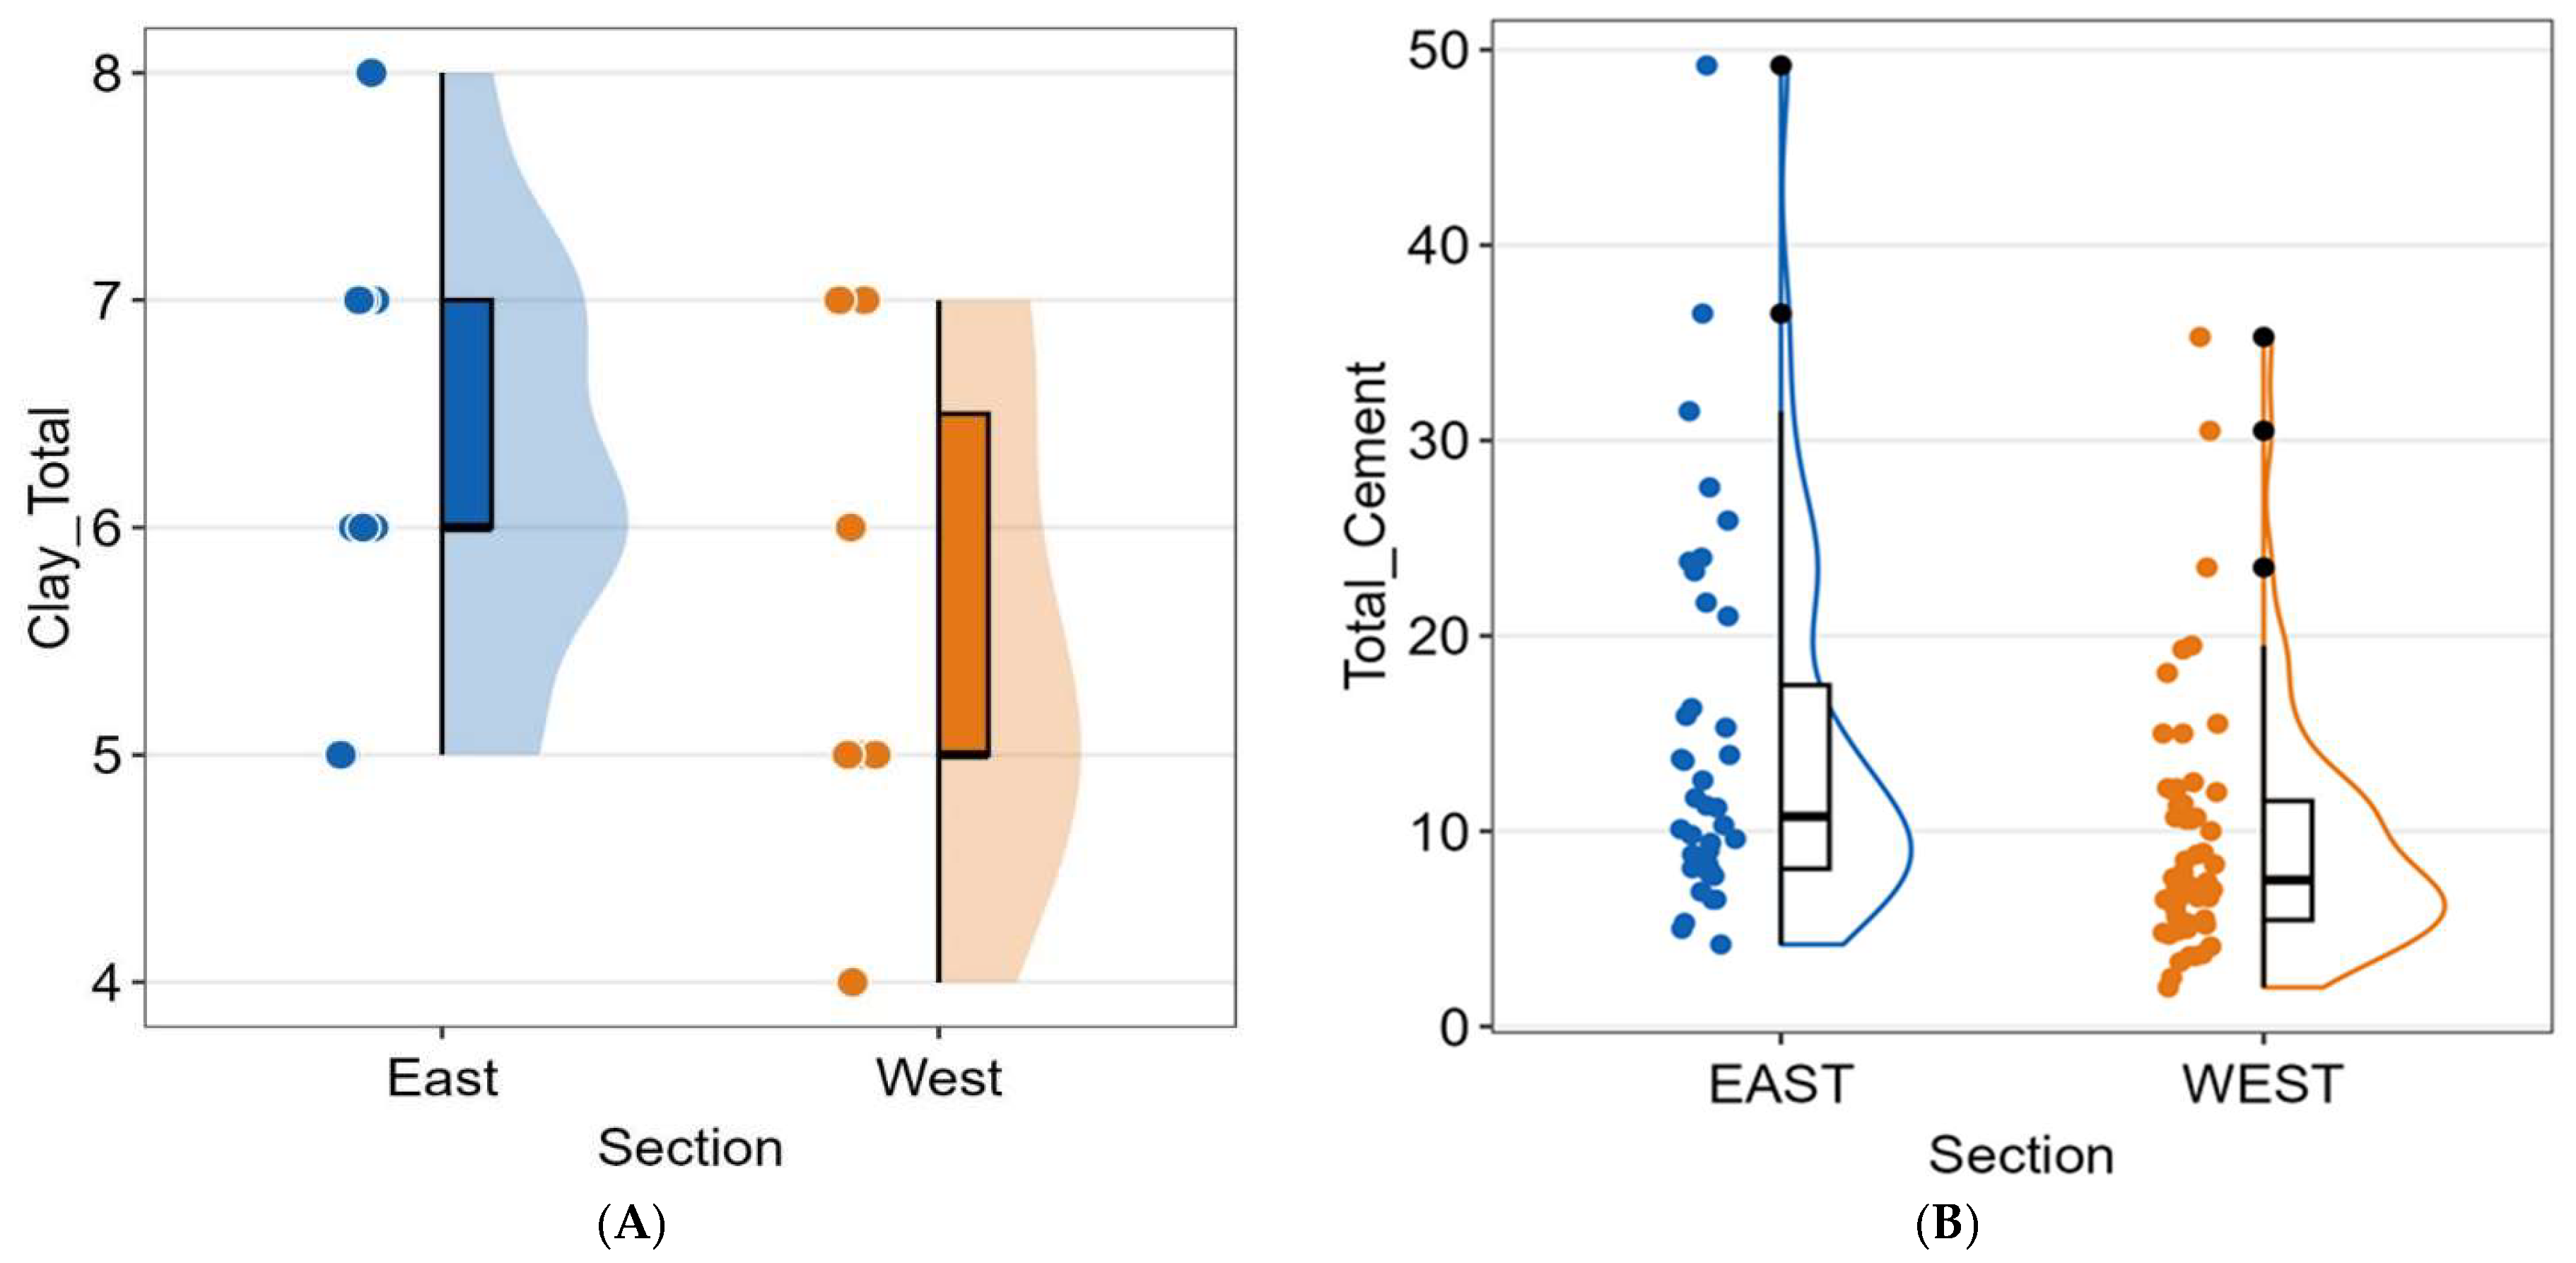
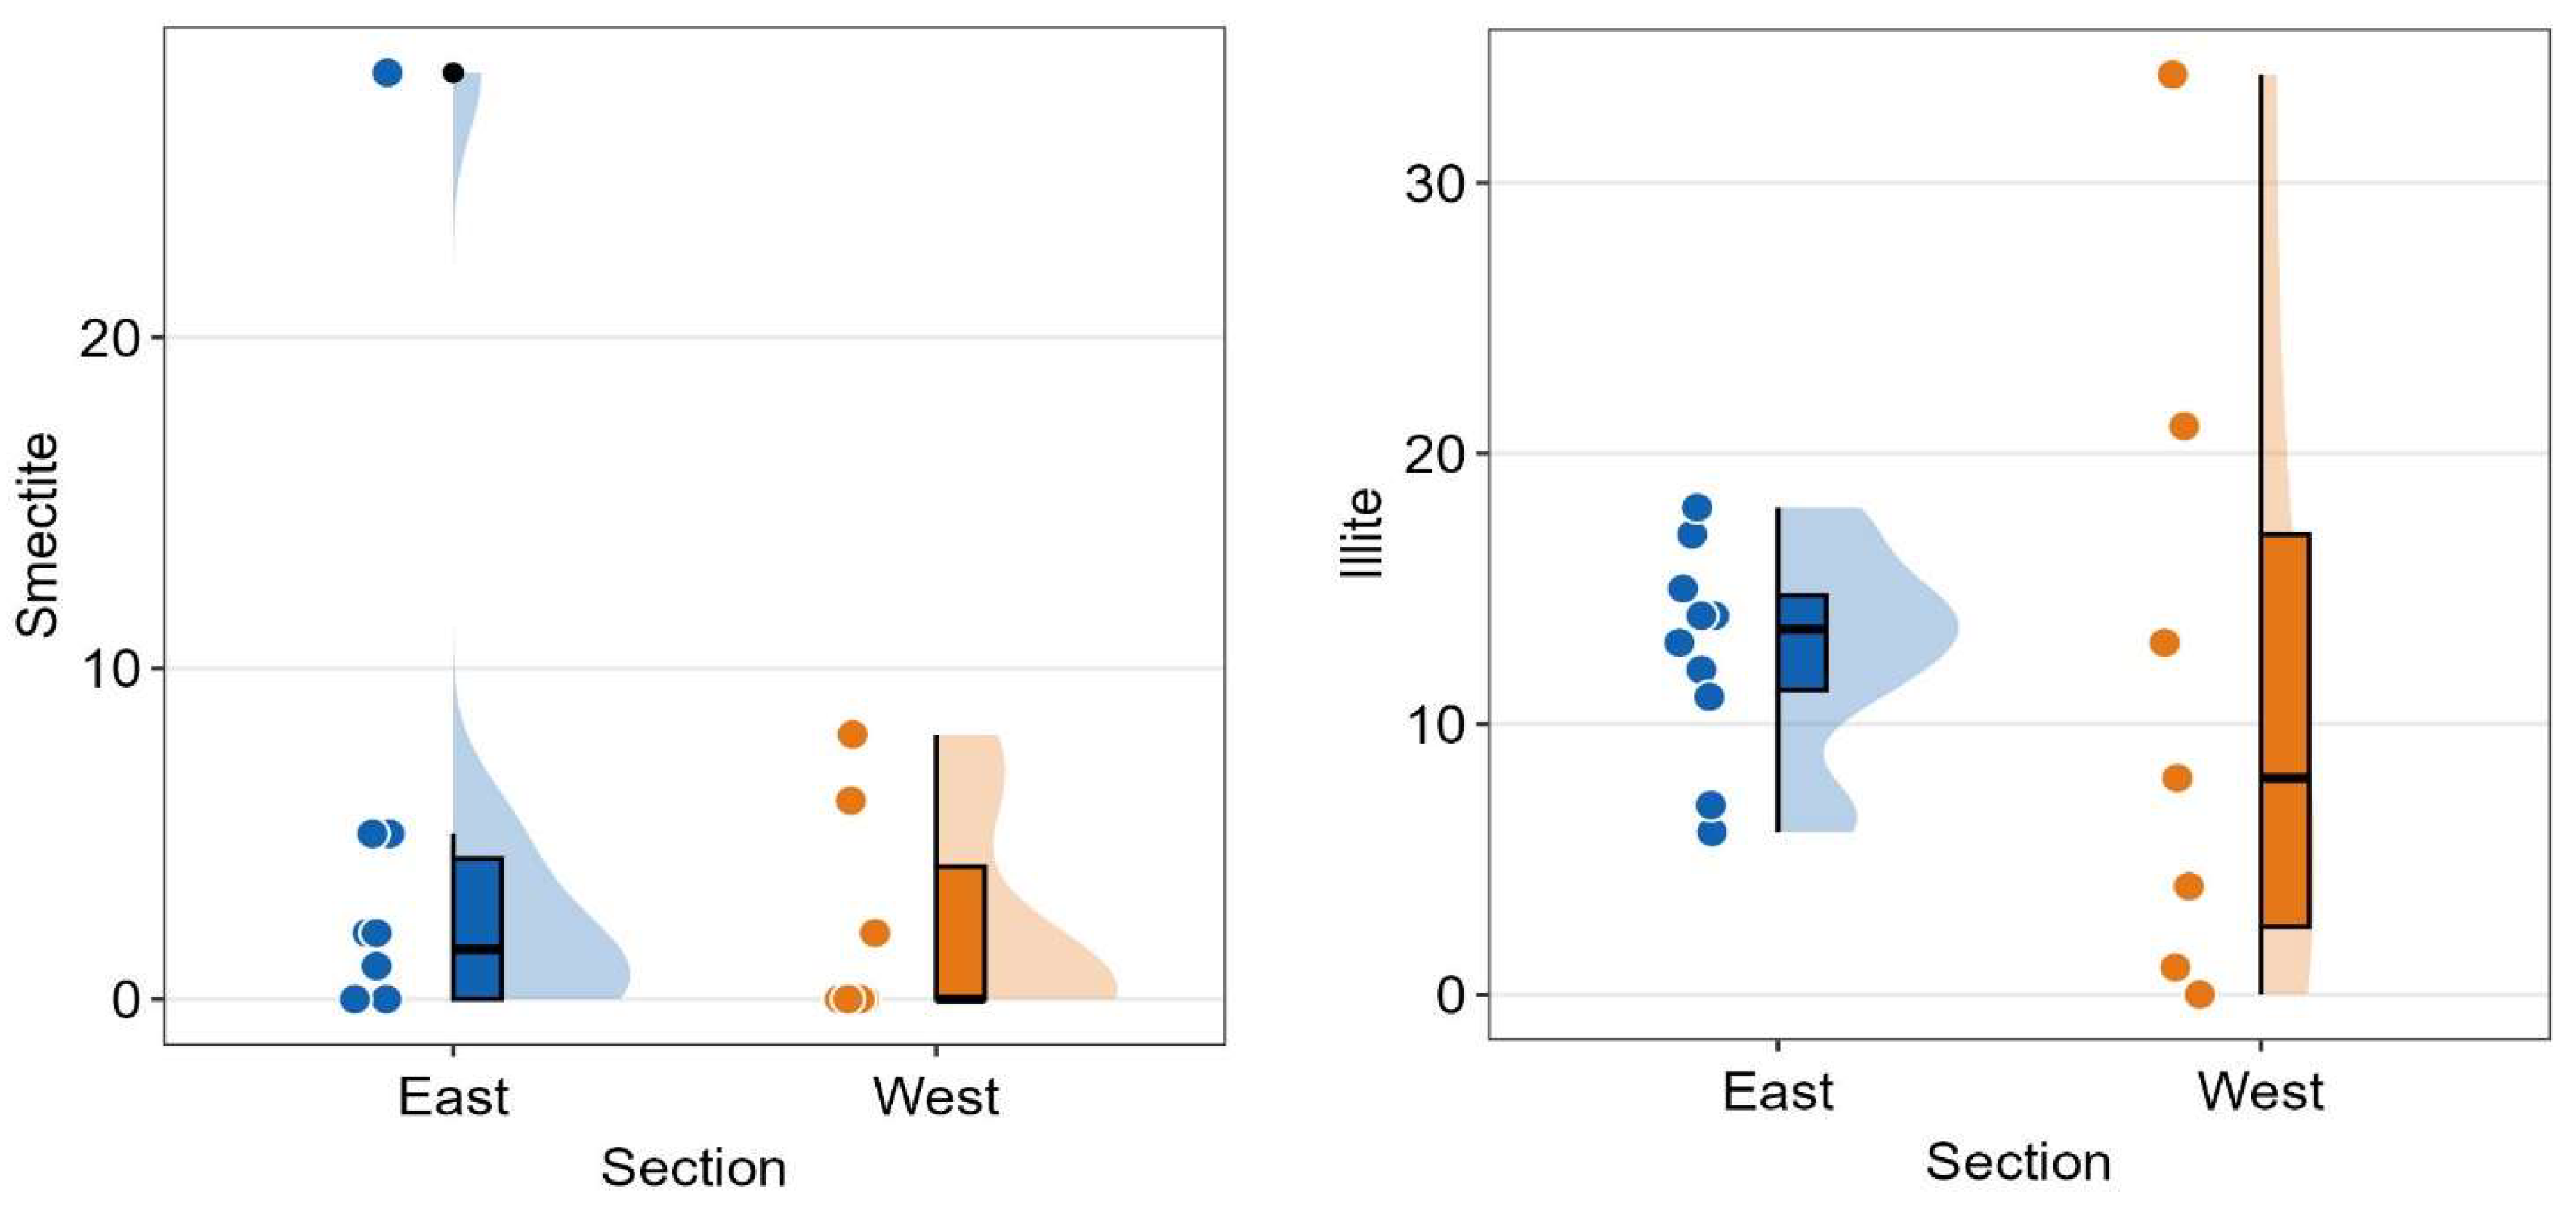
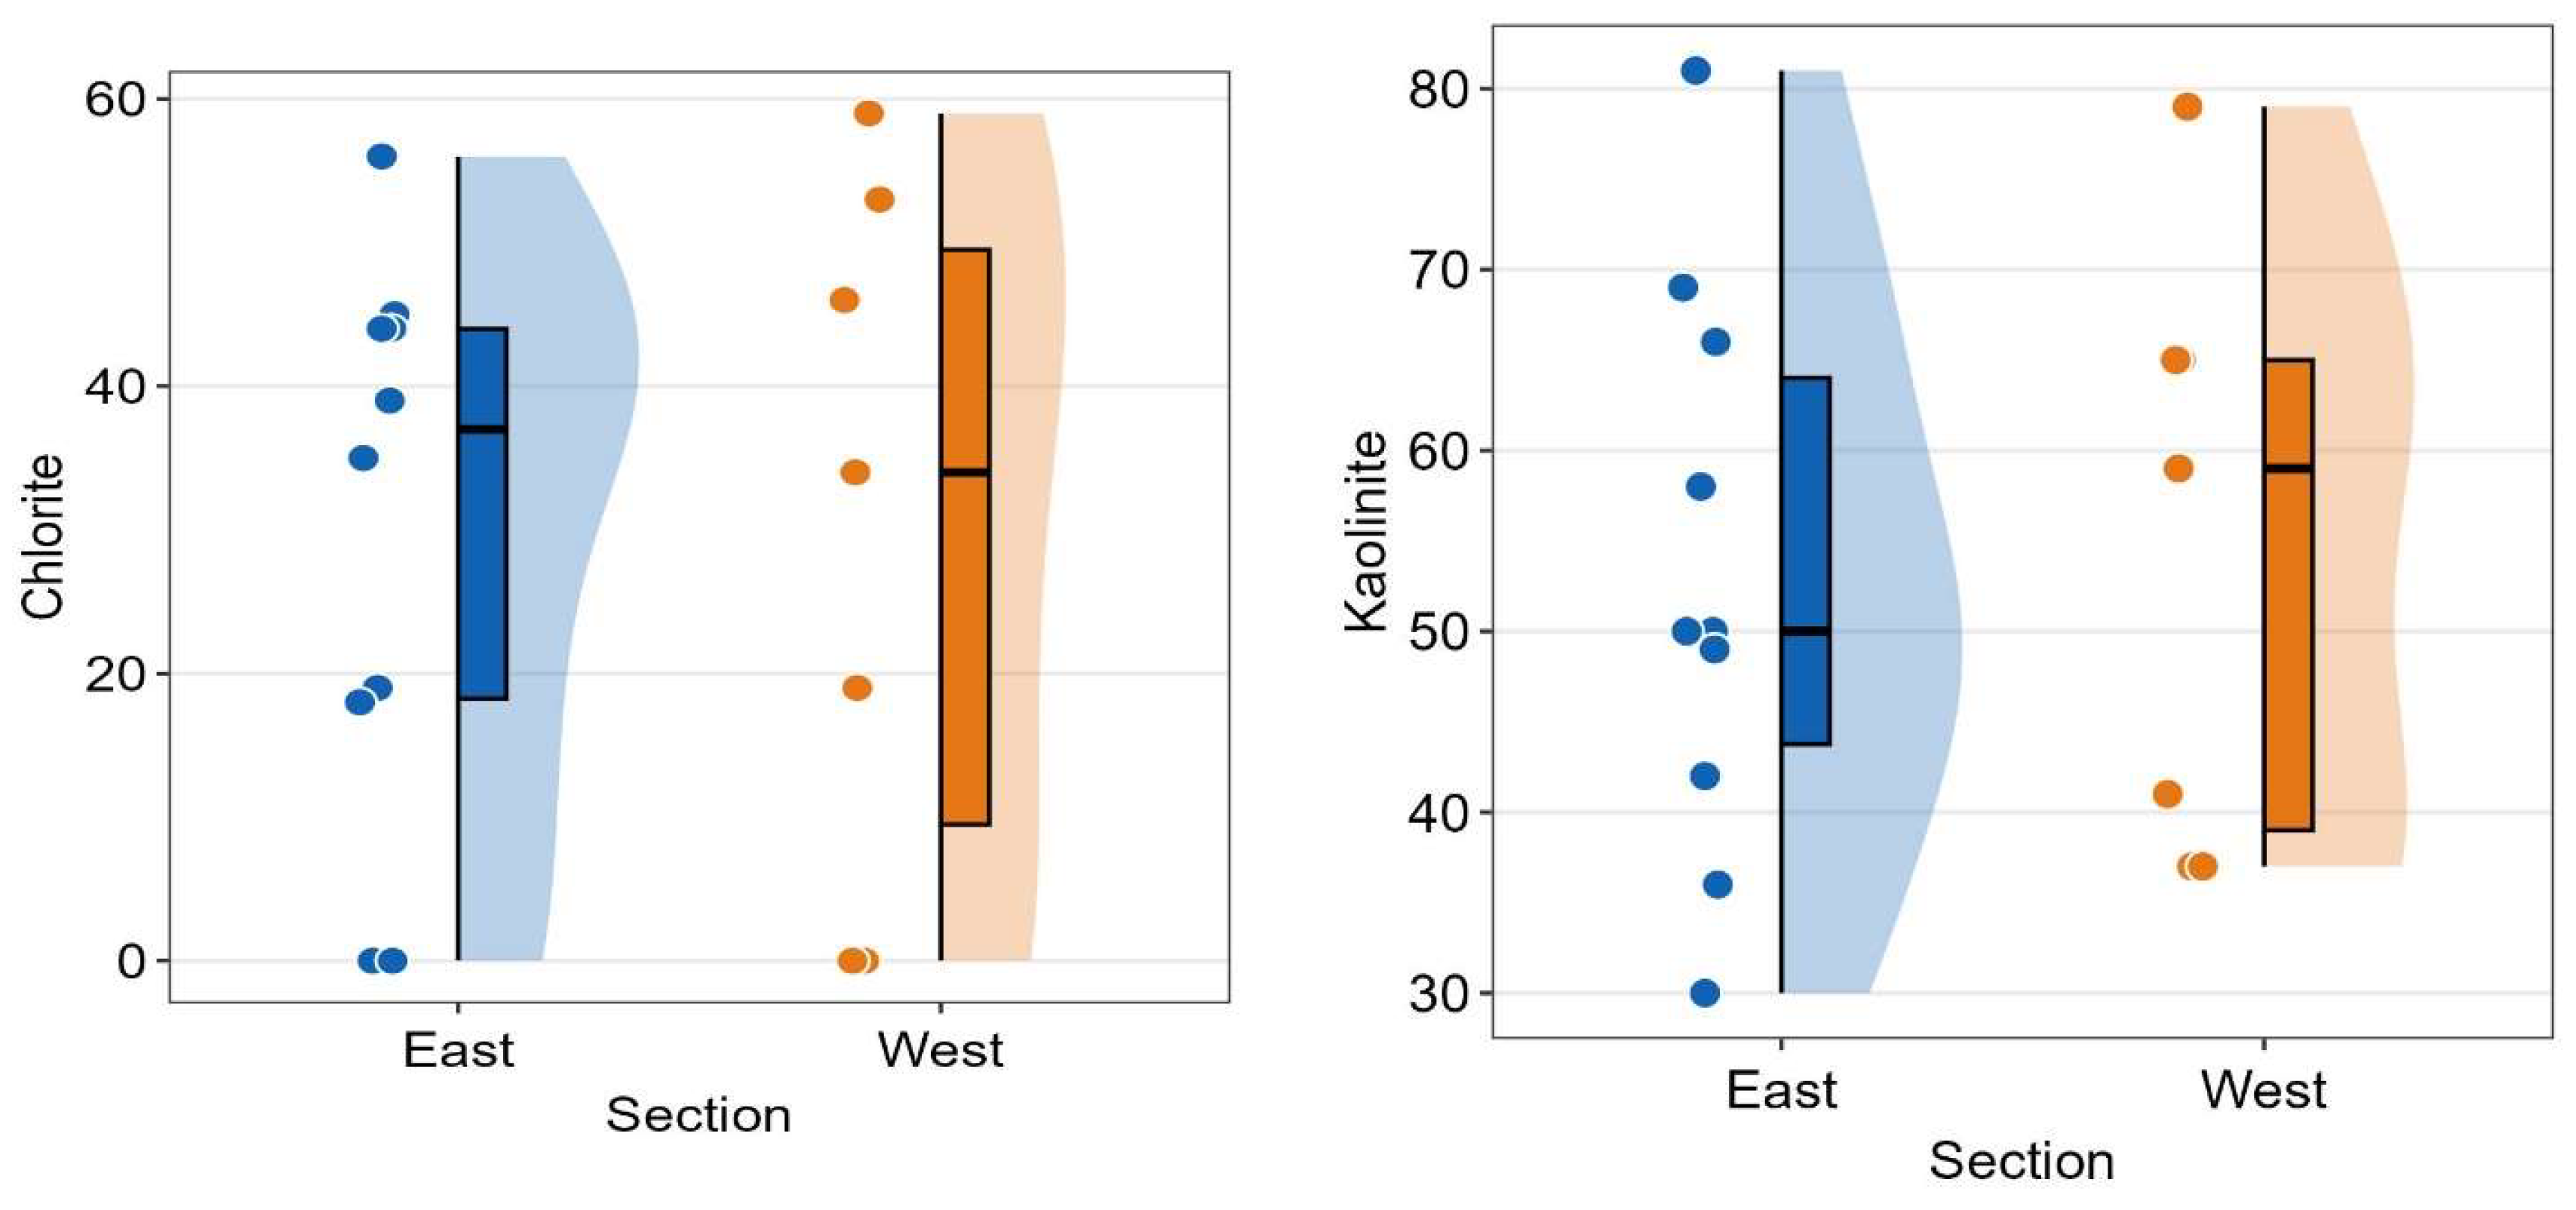
As discussed in previous sections, FWU has significant clay mineralogy, which has been determined through XRD, SEM and ELAN analysis for a number of core samples from both sections of the field. Clay mineral total percent of whole-rock volume is in the range of 4–8% (Figure 9). Principal clays present in FWU are stated in Table 1, with a summary of their species and issues caused in the reservoir. The distribution of clays in FWU are mainly in dispersed authigenic form, with some laminar and structural shales as clay laminar and clast of shales. Table 2 and Table 3 present average values of the clay mineralogy of samples obtained from wells from each section of FWU. These are presented as a percentage of whole rock and also as a fraction of clay weight percent. Figure 9 and Figure 10 present a rainforest diagram that indicates the 25th, 50th (median) and 75th percentiles of clay minerals from all samples. These figures also indicate the highest and lowest values of mineral compositions. The frequency of occurrence is also indicated by the size of the violin shape. These are to discern any variations in mineralogical clay contents on both sides of the field to determine the impact on the fluid flow capacity of the reservoir.
The percentages of smectite and illite (water-sensitive clays) are relatively higher on the east with the exception of chlorite (Table 2, Figure 10). The east section recorded 28% of smectite as compared to the west (8%) as the highest percentage. The 50th percentile of samples was approximately 4% for the east and 0% for the west. Similarly, illite has a higher frequency of dataset from 10% to 20% in the east as compared to the west. The east has a higher average over the west estimated values even, though a few samples (outliers) in the west recorded higher percentages. Chlorite, however, estimates a higher average on the west, 31% as against 28% on the east. The 50th percentile (38%) on the east, which has a higher frequency of samples, is higher than that of the west (36%). The average kaolinite from these samples is relatively equal on both sections. However, the highest estimate (81%) from all samples is on the east section. The east section also has a higher frequency of sample distribution around the 50th percentile of approximately 50% by weight of clays.
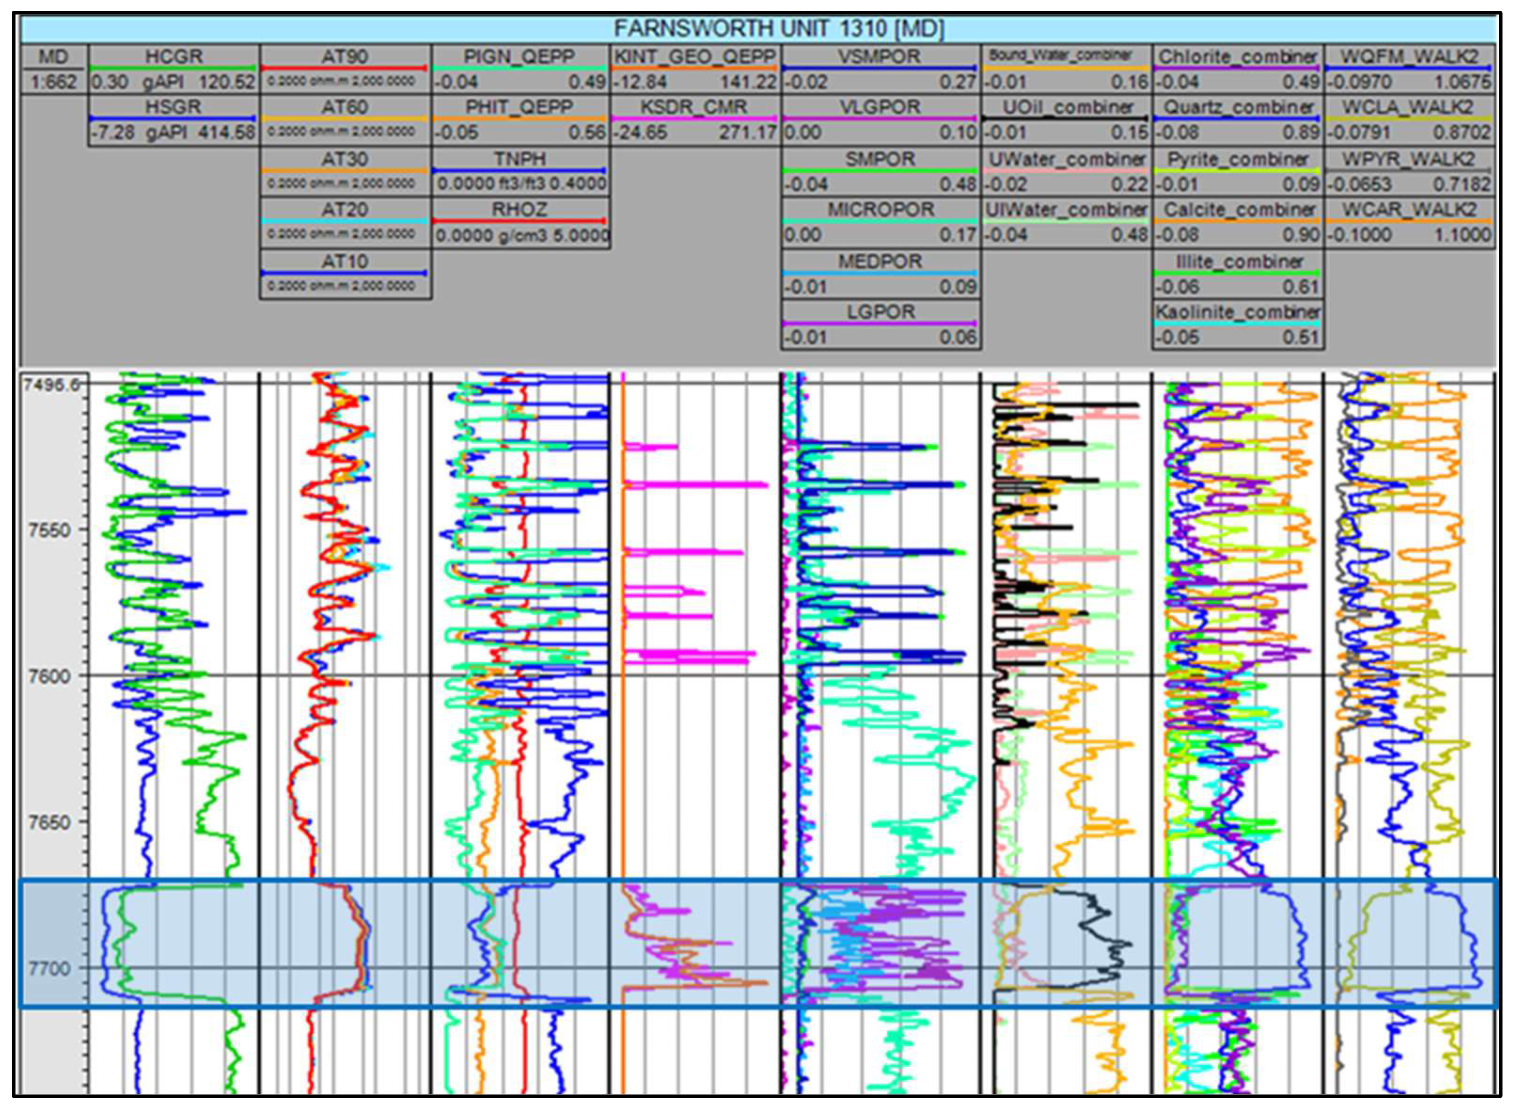
Figure 11 and Figure 12 are elemental analysis (ELAN) of wells 13-10A (west) and 32-08 (east). ELAN utilizes a multi-mineral log program to compute likely mineralogical composition and pore fluids present in the formation in relation to log measurement response to minerals and fluid types [23,38,39]. Important petrophysical properties such as porosity, bulk density, permeability, pore fluids in the system, and the volume of common minerals in Morrow formation are analyzed. From left to right (column 1 to column 6) are (1) depth, (2) GR, (3) resistivity measurements, (4) effective porosity and bulk density, (5) permeability, (6) NMR-estimated porosities with differentiated pore sizes, (7) different types of fluids present, (8) minerals in the formation, and (9) mineral categories. Thickness on the east (well 32-8, Morrow B interval; 7940–8000 ft) is approximately 15 ft higher than on the west (well 13-10A, 7670–7710 ft). Porosity from both logs (column 4) is of relatively the same magnitude.

4.3. Heterogeneity Analysis and Review of the Morrow B Reservoir

4.3.1. Preliminary Analysis/Data Control

(a) Univariate and Bivariate Analysis
Univariate statistical analysis was employed to investigate the distribution of properties obtained from the core samples extracted from the western section of FWU. The analysis revealed that the permeability values were positively skewed and contained outliers at each well location. Figure A1 (Appendix A) displays the distribution of permeability from the core data. Specifically, Figure A1(i) indicates that the permeability values follow a lognormal distribution, which is consistent with the expected behavior of permeability. Figure A1(ii) presents the results obtained by concatenating the permeability values from the different wells. The resulting distribution exhibits a positive skewness, indicating that the mean permeability value is higher than the median. This suggests that a few large permeability values are present. Figure A1(iii) depicts the natural logarithm of the permeability values at the different well locations, which approximates a normal distribution, as anticipated. Figure A1(iv) illustrates the concatenation of the permeability values from Figure A1(iii). The results show a normal distribution with one dominant peak and a smaller peak, indicating that most sections of the western side have similar permeability properties. The east side of FWU underwent comparable analyses, the outcomes of which are presented in Figure A2 (Appendix A). The outcomes expose that the permeability values of the east side are significantly lower when compared to those of the west side, as evidenced by Figure A2(i). Additionally, the permeability values of the east side demonstrate a bimodal distribution, indicating that the data can be traced to two distinct sources, as demonstrated in Figure A2(iv).
Bivariate analysis of the core samples was conducted to determine the relationship between one property and another [40]. Figure A3 (Appendix A) shows the core data scatter plot between porosity and permeability. From Figure A3(ii), it can be observed that the core data from well 32-6 shows 2 peaks and this could signify the existence of two distinct layers or higher variations in properties within the interval of well 32-6 location.
(b) Heterogeneity Analysis Using K-Nearest Neighbor
To further investigate the heterogeneity of the reservoir resulting from varying permeabilities, advanced analyses were conducted using the K-Nearest Neighbor (KNN) algorithm to determine the maximum possible clusters within each reservoir. The KNN clustering method is a powerful tool in identifying similar patterns in large and complex datasets. The primary goal of clustering is to group similar properties together, with the assumption that the more clusters formed, the more heterogeneous the reservoir.
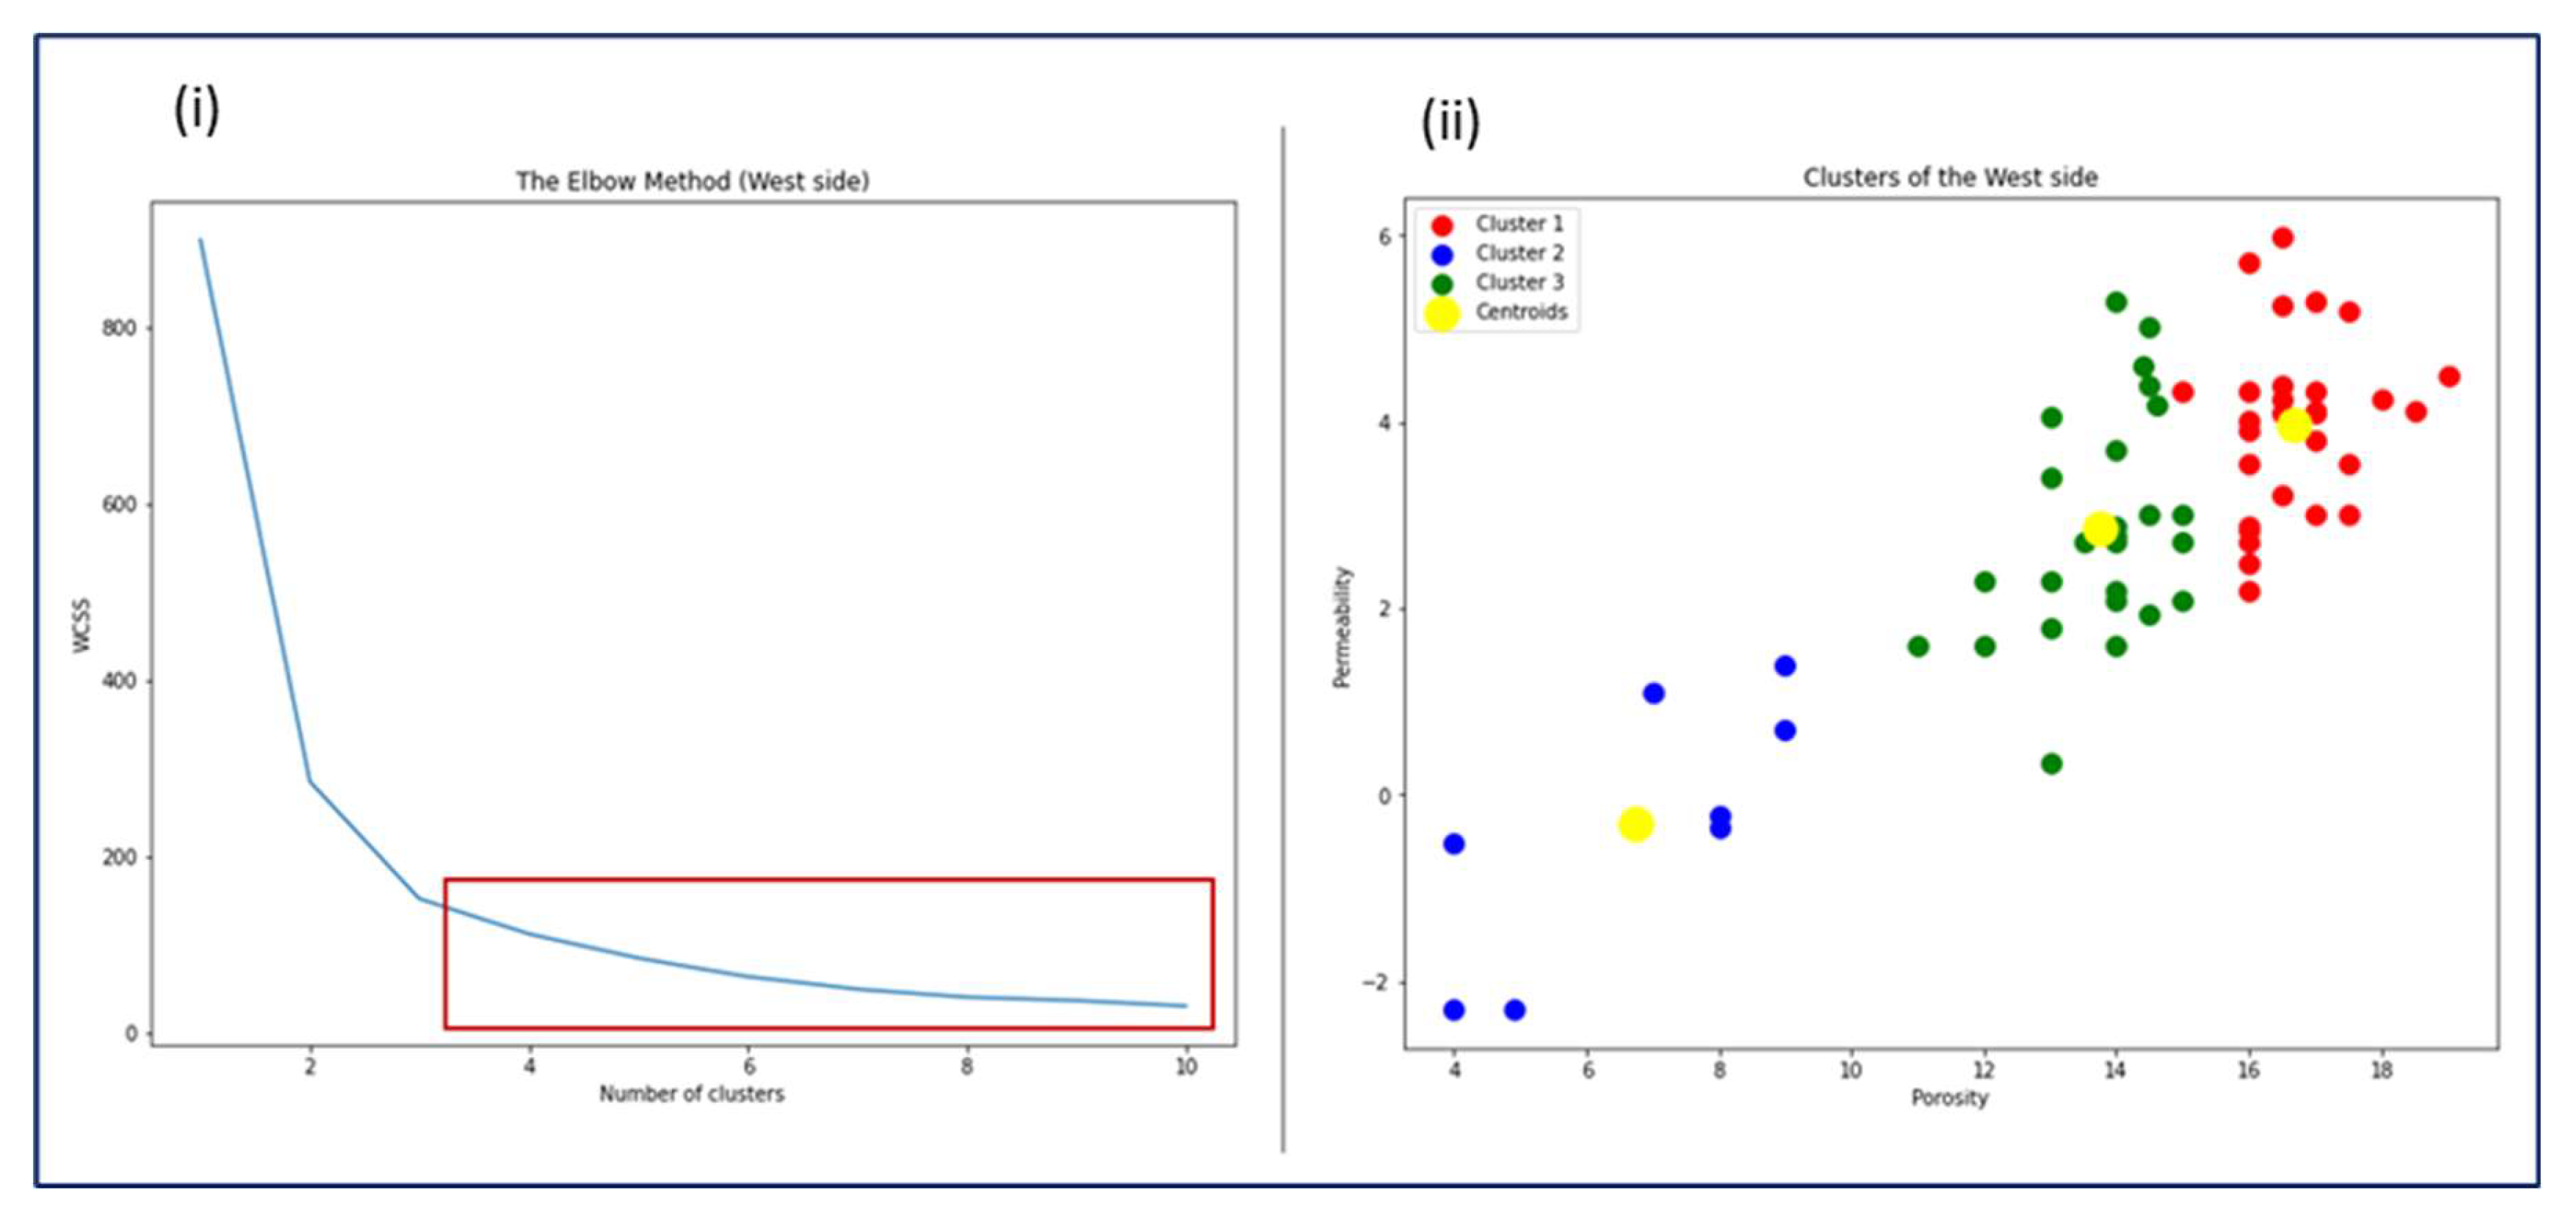
Figure A4(i) and Figure A5(i) (Appendix A) depict the elbow techniques utilized to identify the optimal number of clusters for the west and east reservoirs, respectively. The elbow technique computes the Within-Cluster Sum of Squares (WCSS) by calculating the sum of the square distance among points within a cluster and its centroid. It is observed that there are three and four sharp bends (elbows) in Figure A4(i) and Figure A5(i), respectively. These sharp bends are presented as clusters in Figure A4(ii) and Figure A5(ii), respectively. Based on the aforementioned assumption, it can be deduced that the east side of the reservoir is more heterogeneous than the west side. The elbow technique, however, is not always effective in determining the number of clusters in a dataset, as sometimes it becomes challenging to locate the elbow when the curve is smooth. In this case, Silhouette analysis, another clustering technique, was utilized to address this setback.
(c) Silhouette Analysis
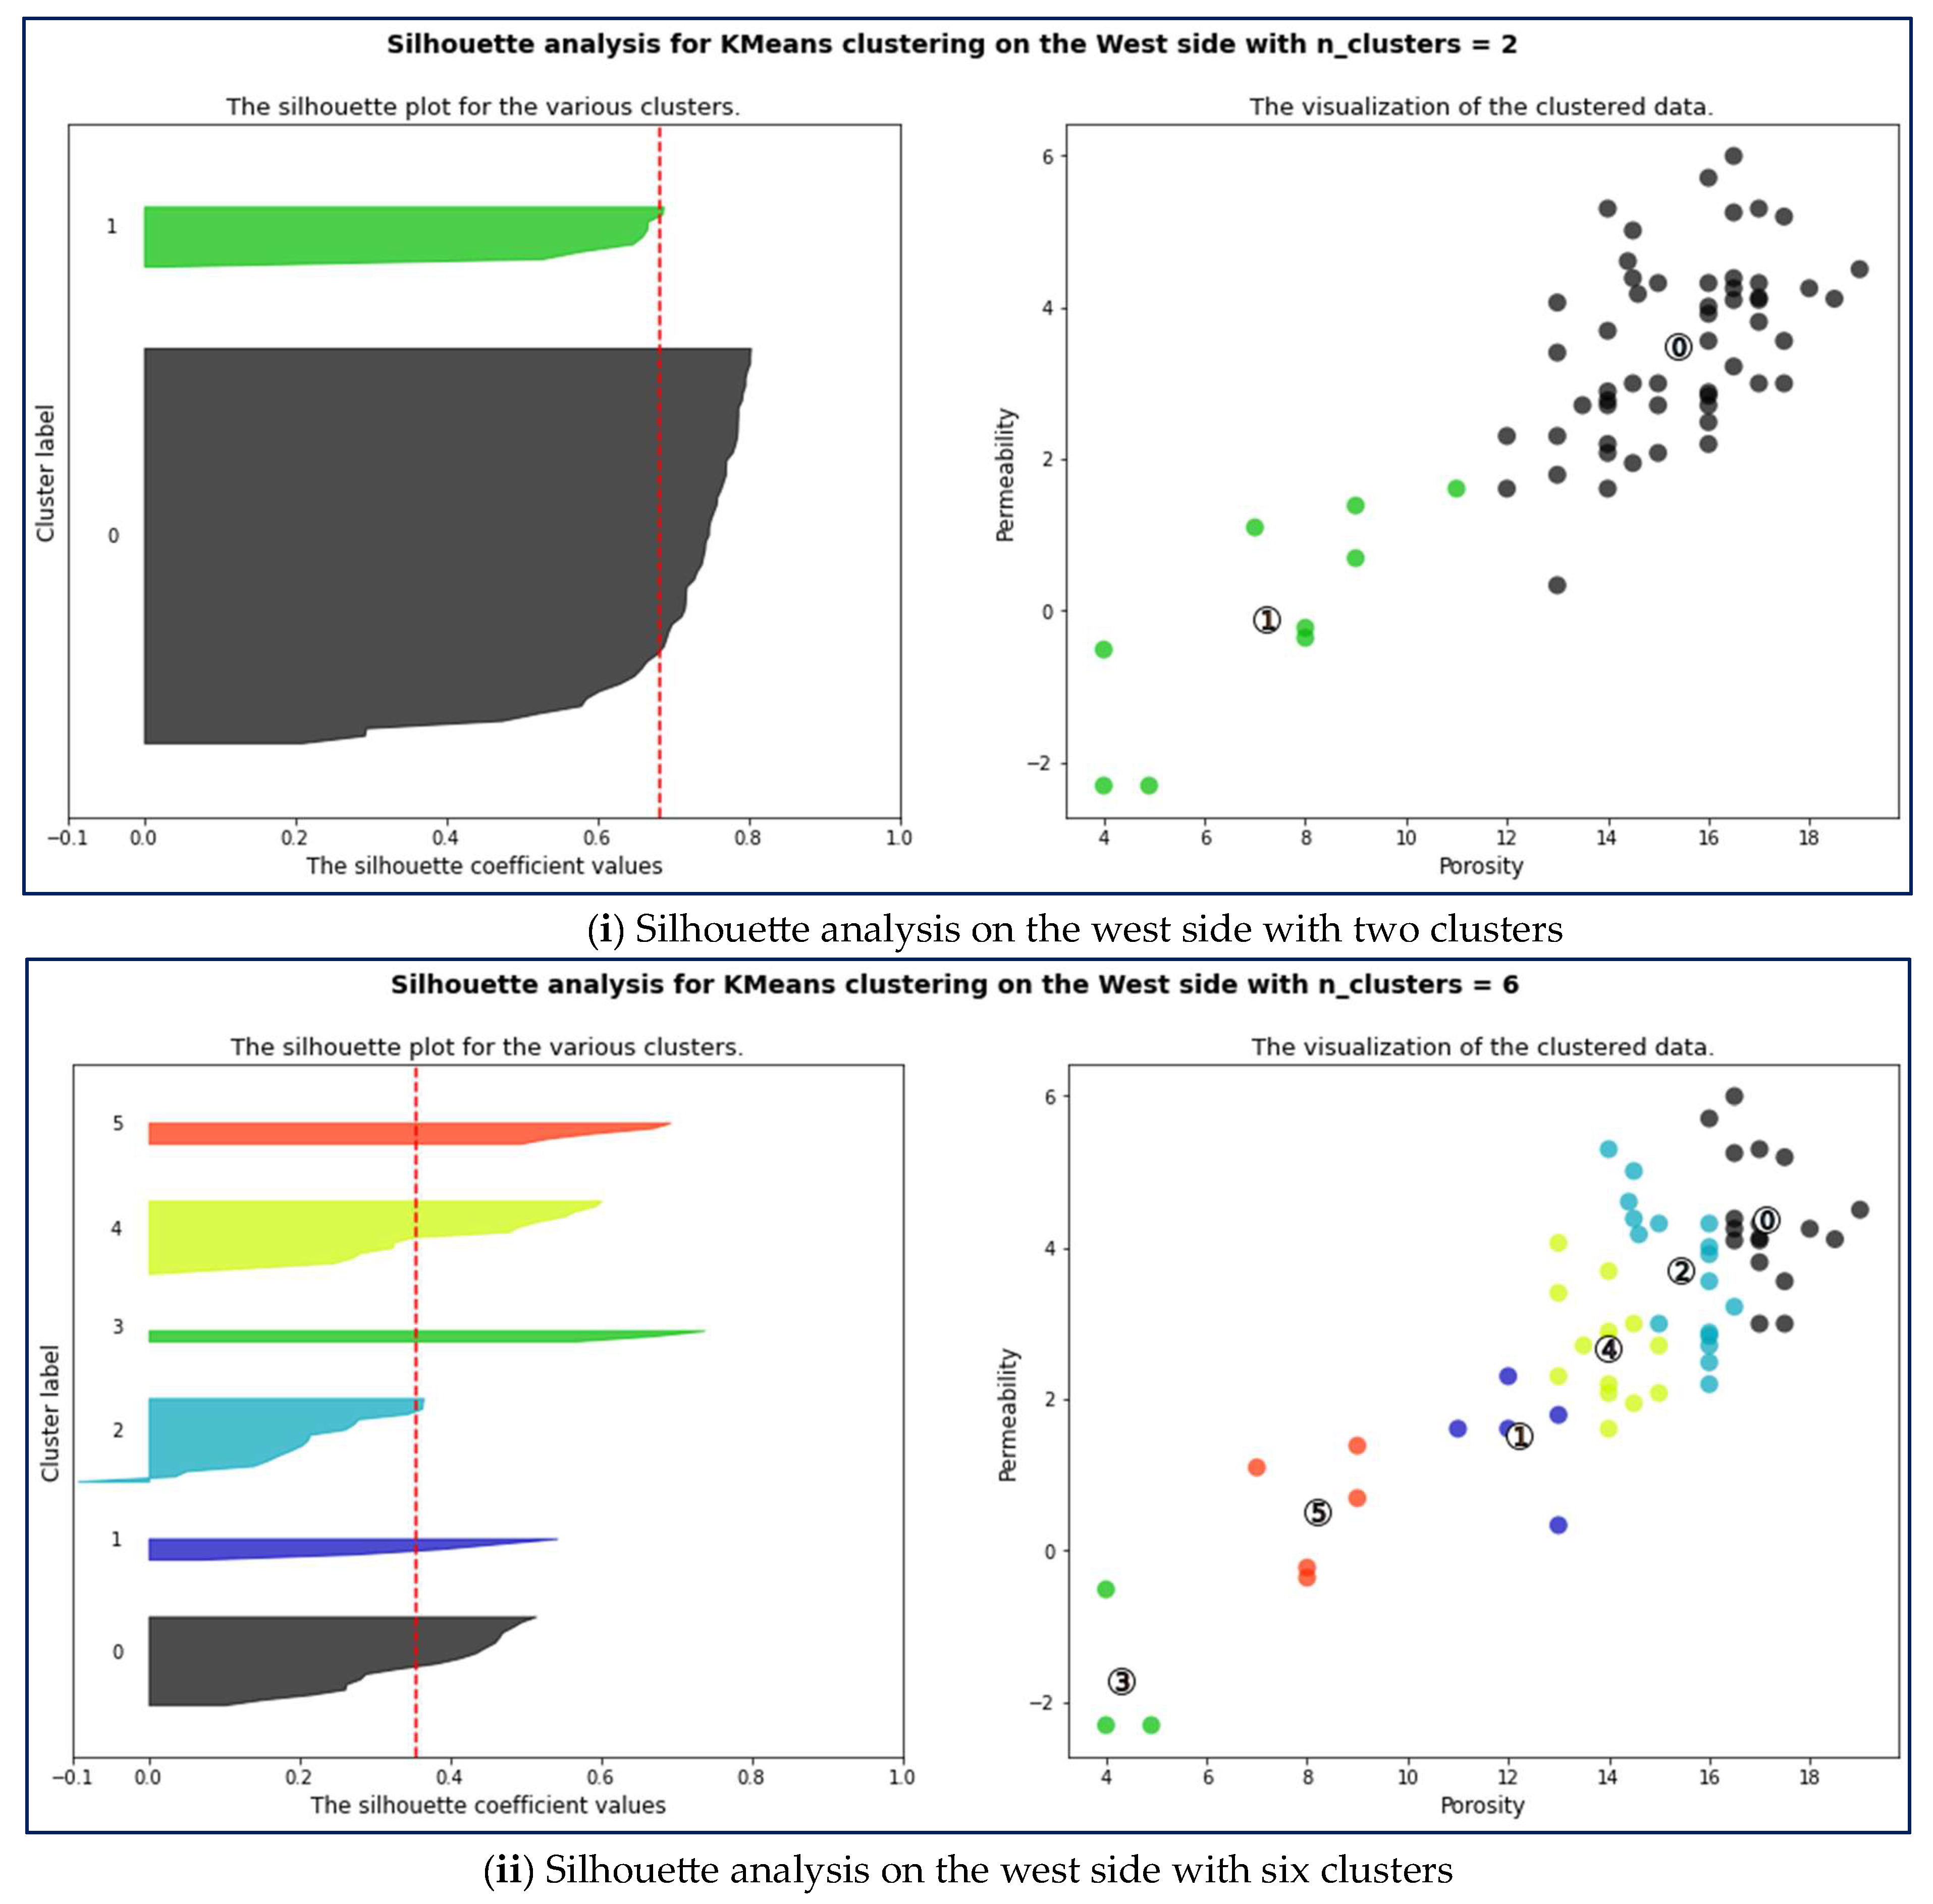
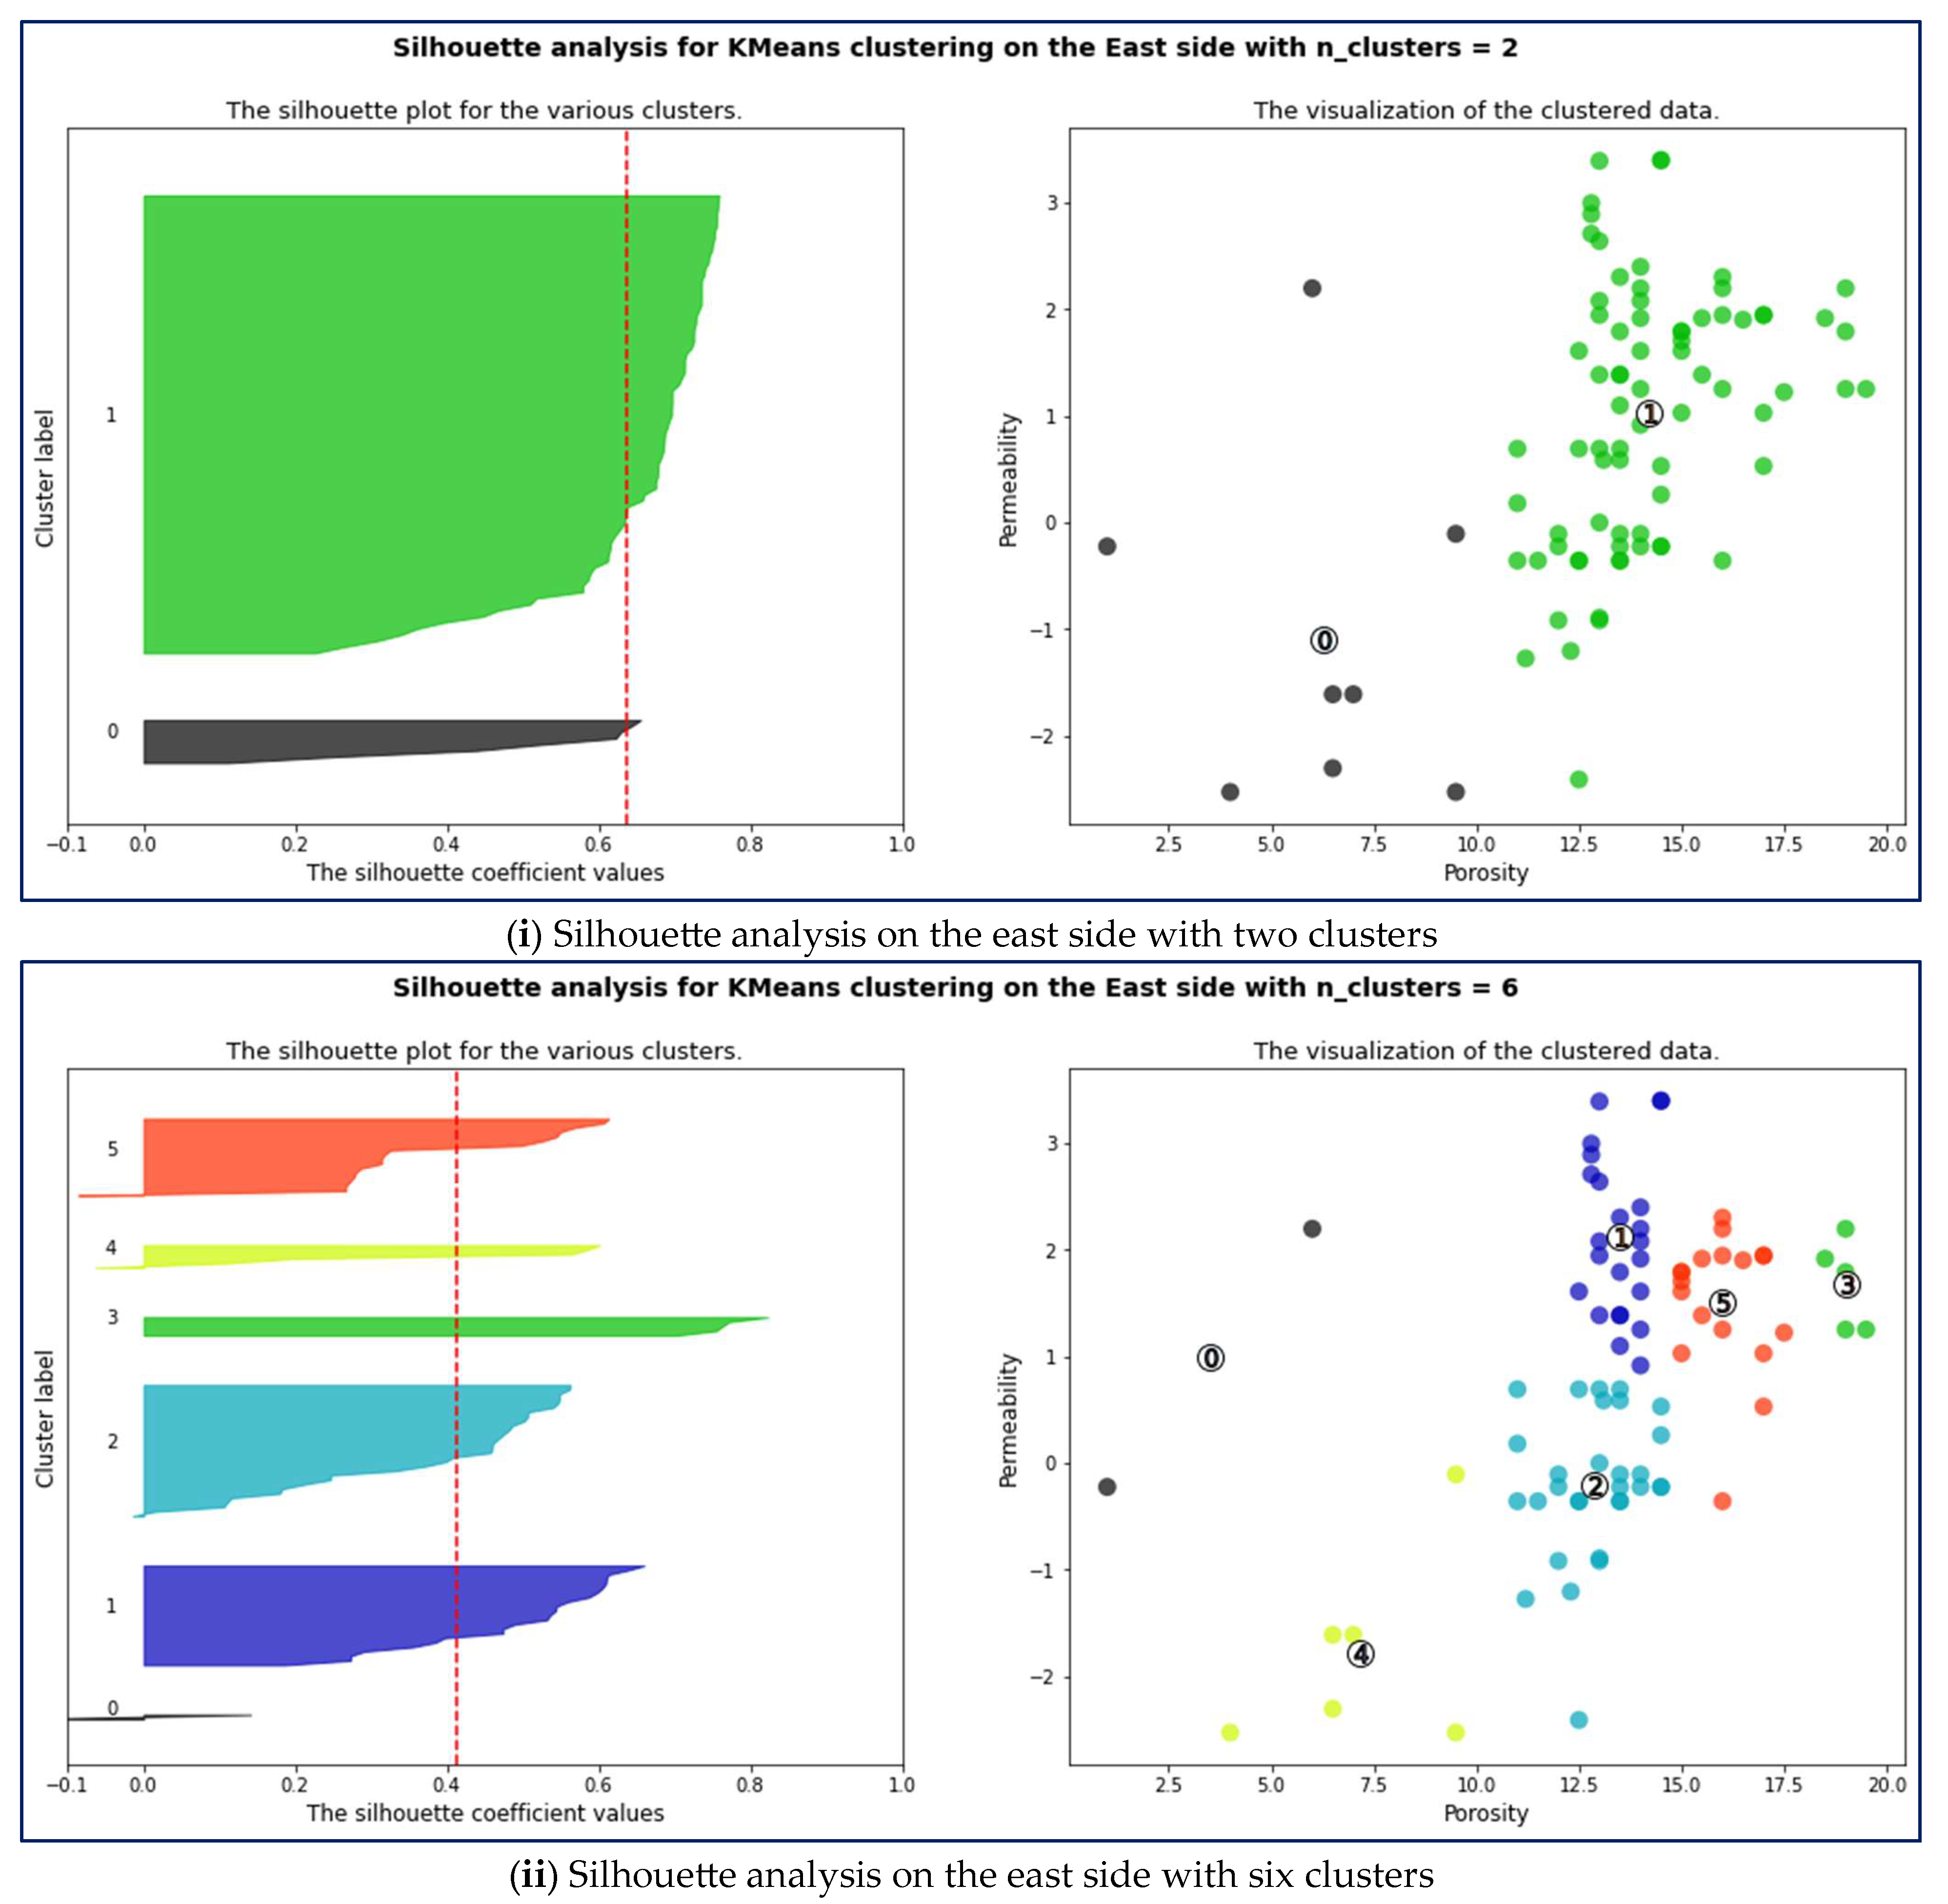
Silhouette analysis measures the cohesion among points and their centroid and the separation between one cluster and another. It provides a score ranging from −1 to 1. A score of 1 indicates perfect assignment of points to a cluster, while a score of −1 indicates wrong assignment. A score of 0 indicates overlapping clusters. Figure A6(i) displays Silhouette analysis on the west side with two clusters. It can be observed that the thickness of the clusters differs, with cluster zero (0) being the dominant one. This could be due to the aggregation of different clusters. The thickness of a cluster is defined as the size of a layer within the reservoir with similar properties. The red dash-line represents the average Silhouette score. A plot is considered as a cluster if its score is greater than the average score and can be ignored if its score is less than the average score. Figure A6(ii) shows Silhouette analysis on the west side with six clusters. Although all the plots have a score equal to or greater than the average score, they are of different thicknesses. A similar analysis was conducted for the east side of the reservoir, and similar results were generated. Figure A7(i,ii) have the same number of clusters but different thicknesses. From the elbow analysis, the west and east have three and four clusters, respectively. The thickness of a plot to be considered a significant cluster is subjective. It can be concluded from Silhouette analysis that there are three and four significant clusters in the west and east reservoirs, respectively. This conclusion is consistent with the elbow analysis. Nonetheless, there are some interlining thin sheets with varying permeabilities among the thick layers of the Farnsworth Unit.

4.3.2. Controls on Flow and Storage Capacity

Fluid movements through porous media or pore spaces of reservoirs is a representation of permeability. A highly porous reservoir presents more pore space to accumulate more fluids. However, high porosity alone is insufficient for an effective waterflood. That is, well-interconnected pores are necessary to allow injected water to penetrate various sections of the reservoir to efficiently displace oil. Thus, permeability is a function of pore connectivity, pore volume and pore distributions. For injected water to flow more easily through reservoirs to displace oil, a high permeability is desirable. Conversely, low permeability of a reservoir can hinder waterflood effectiveness. Therefore, it is highly significant to consider the interplay between permeability and porosity. A highly porous reservoir with poor permeability may have a poor waterflood performance as compared to one with low porosity but good permeability [41,42,43,44,45].
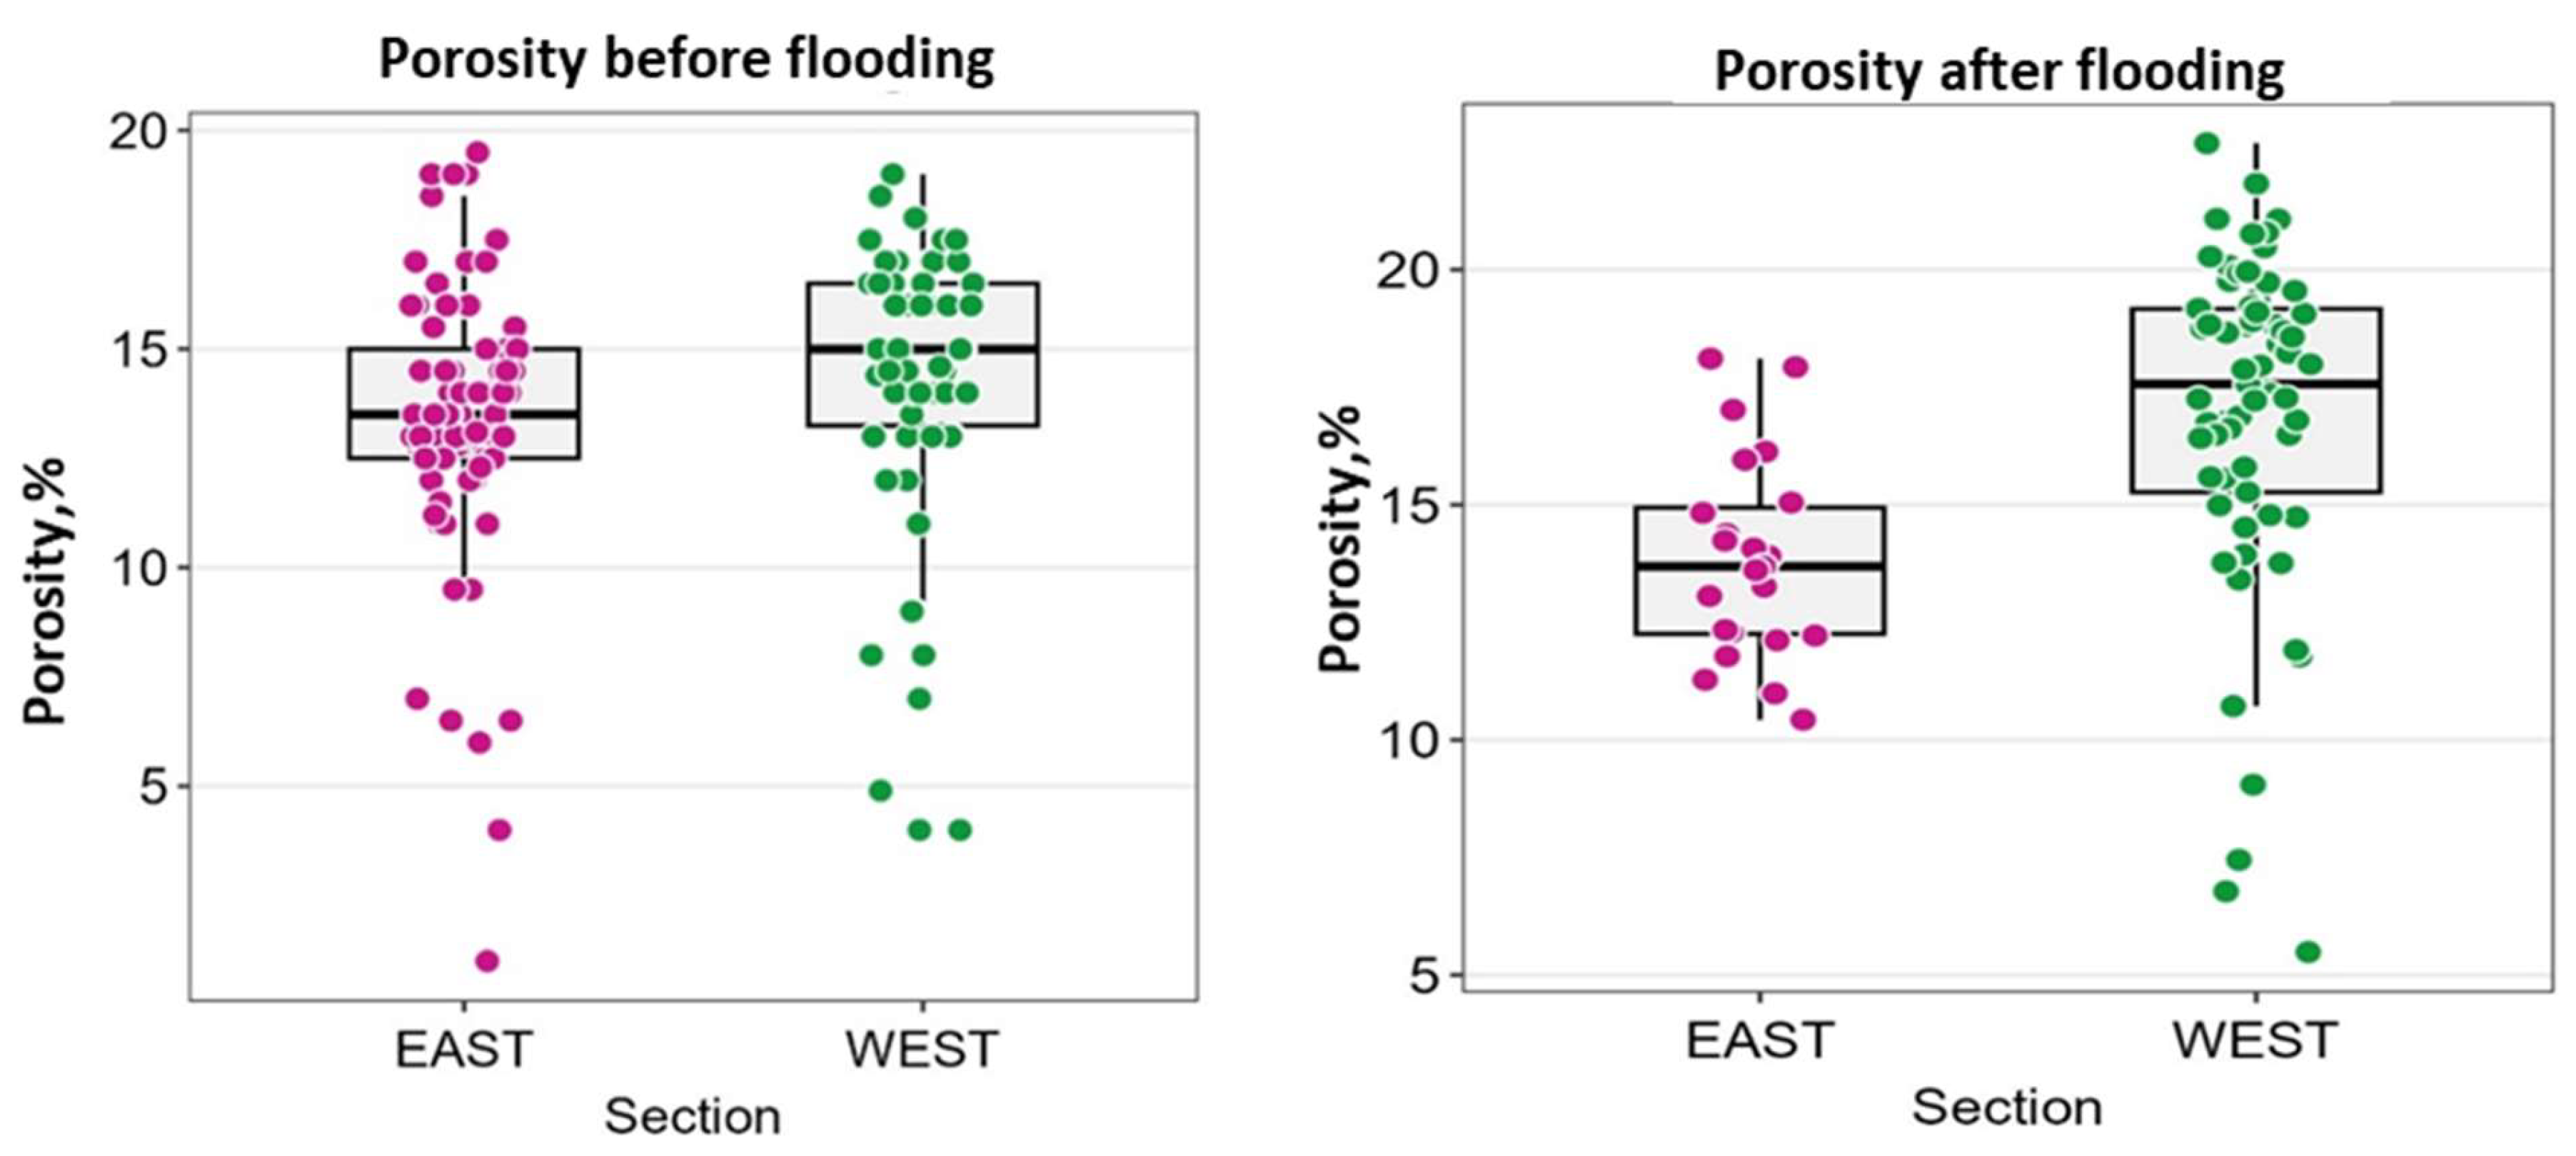
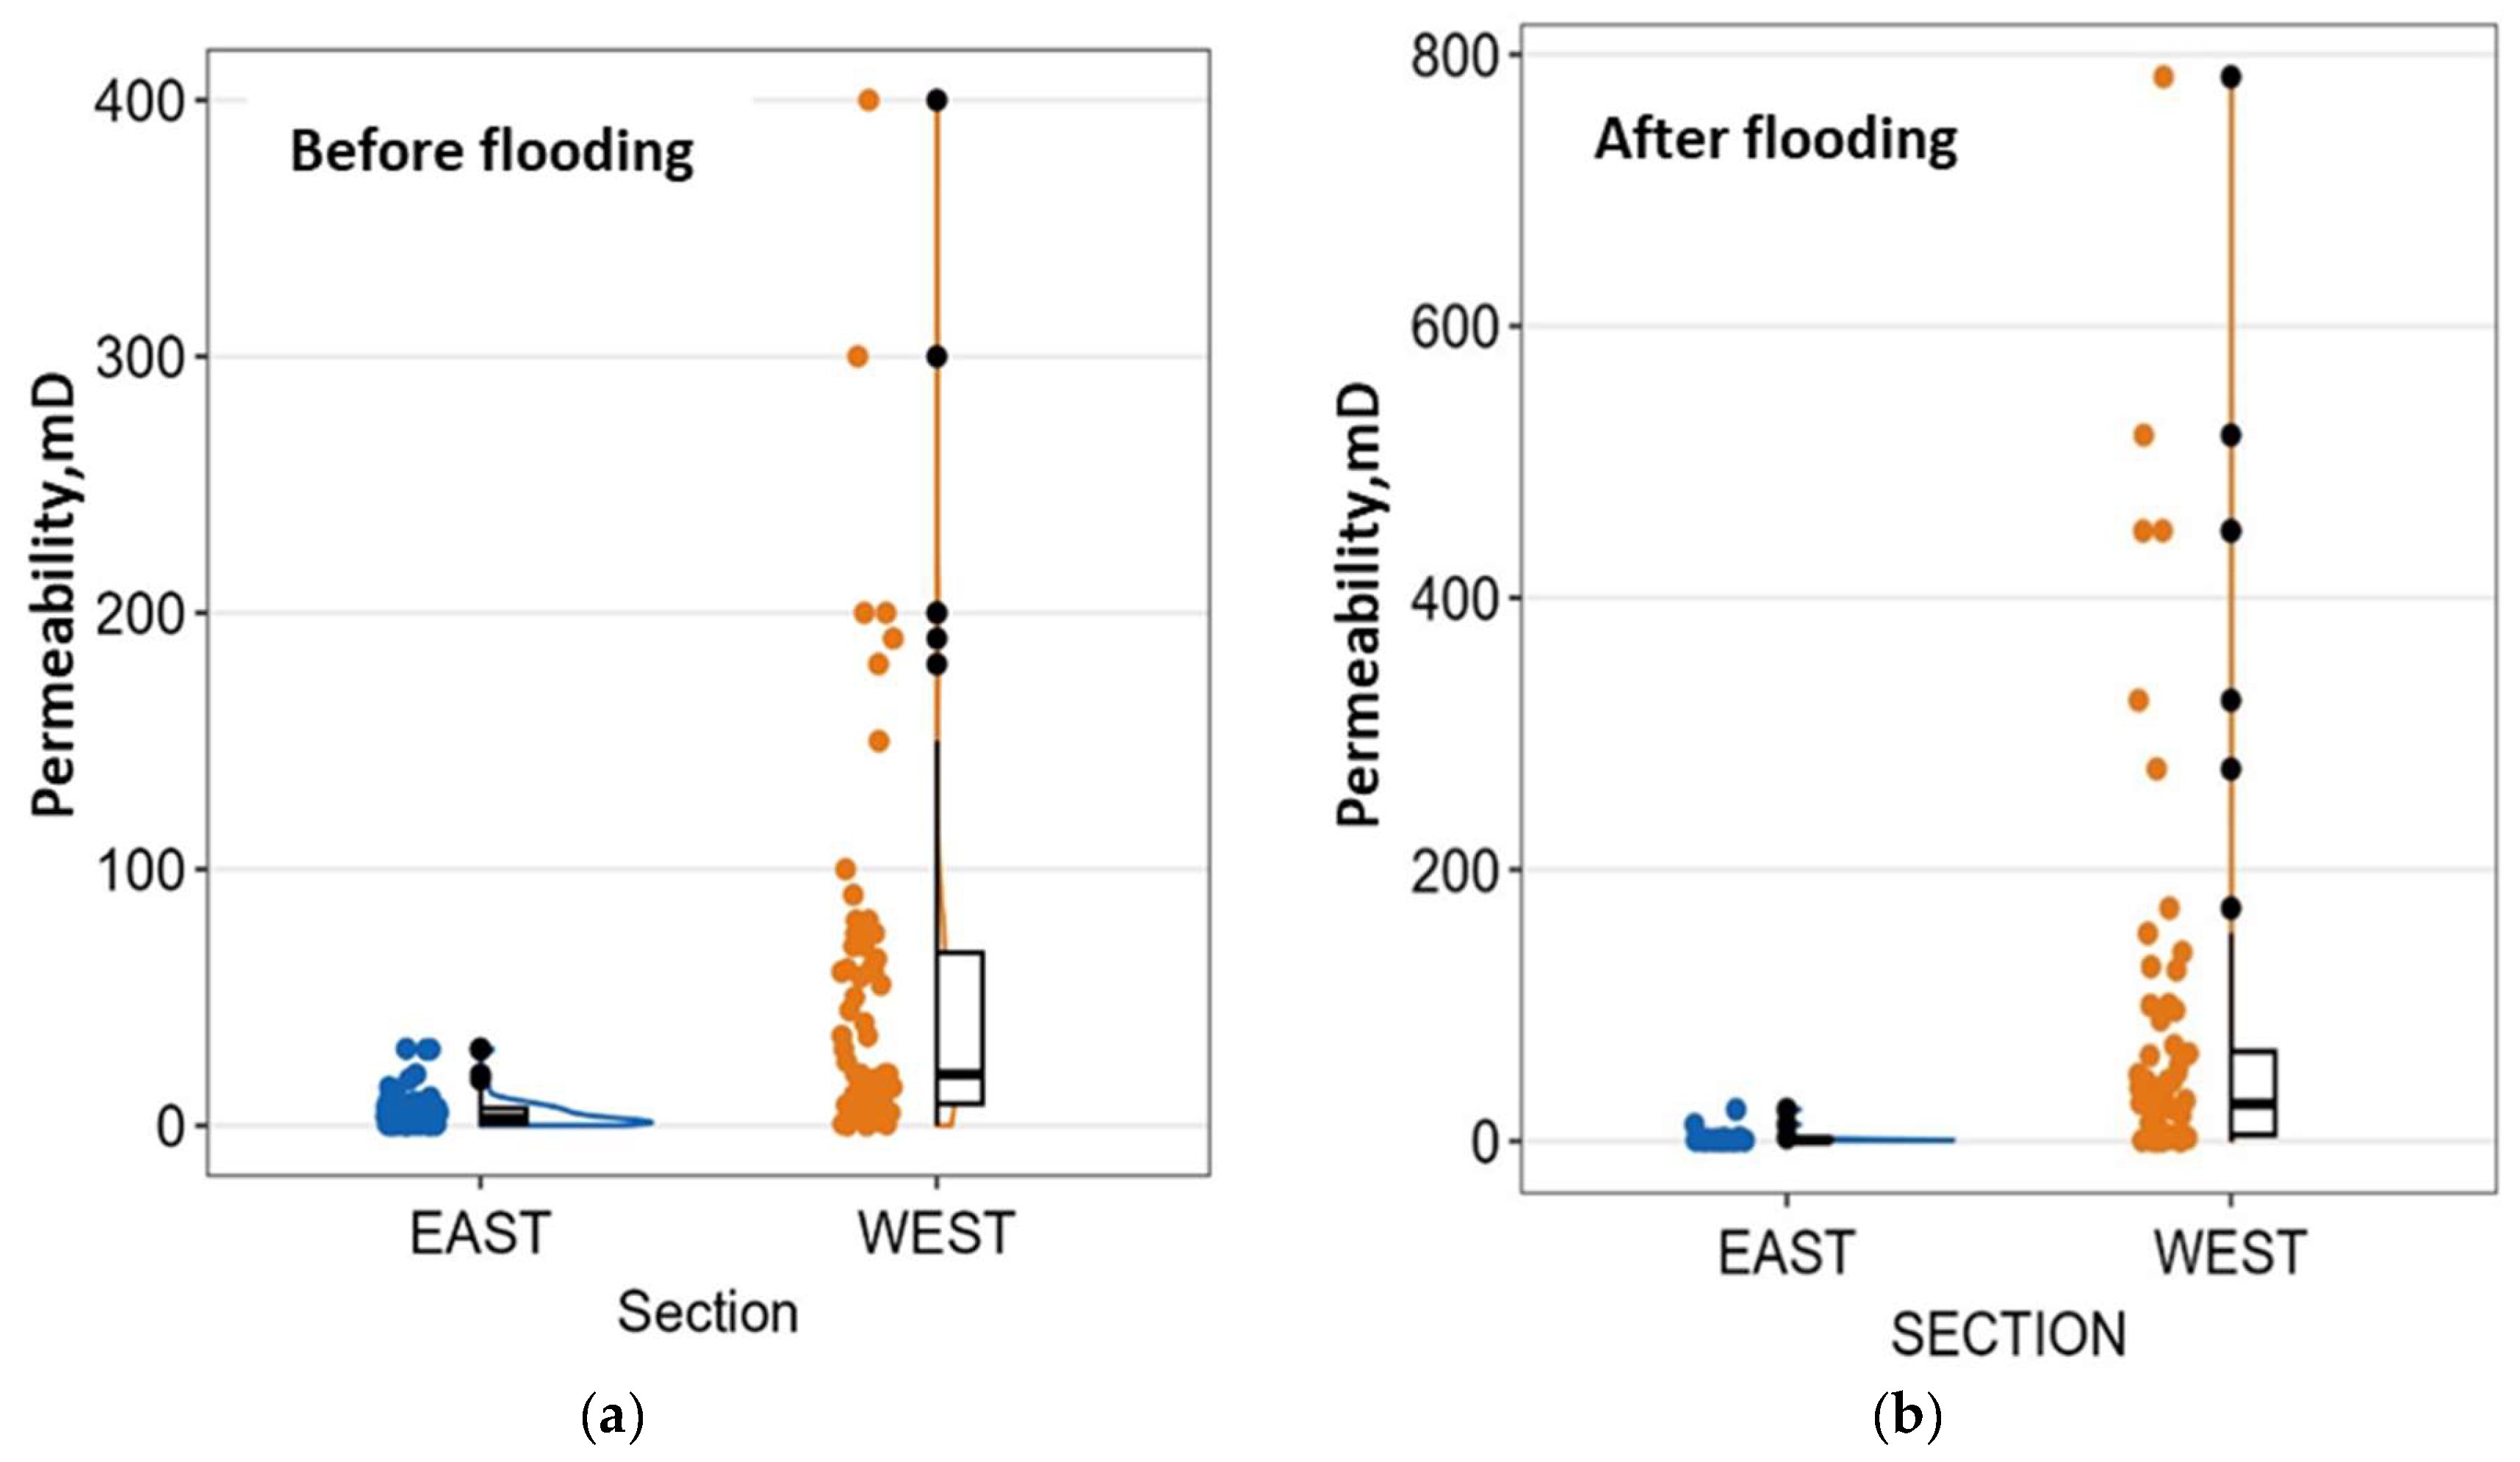
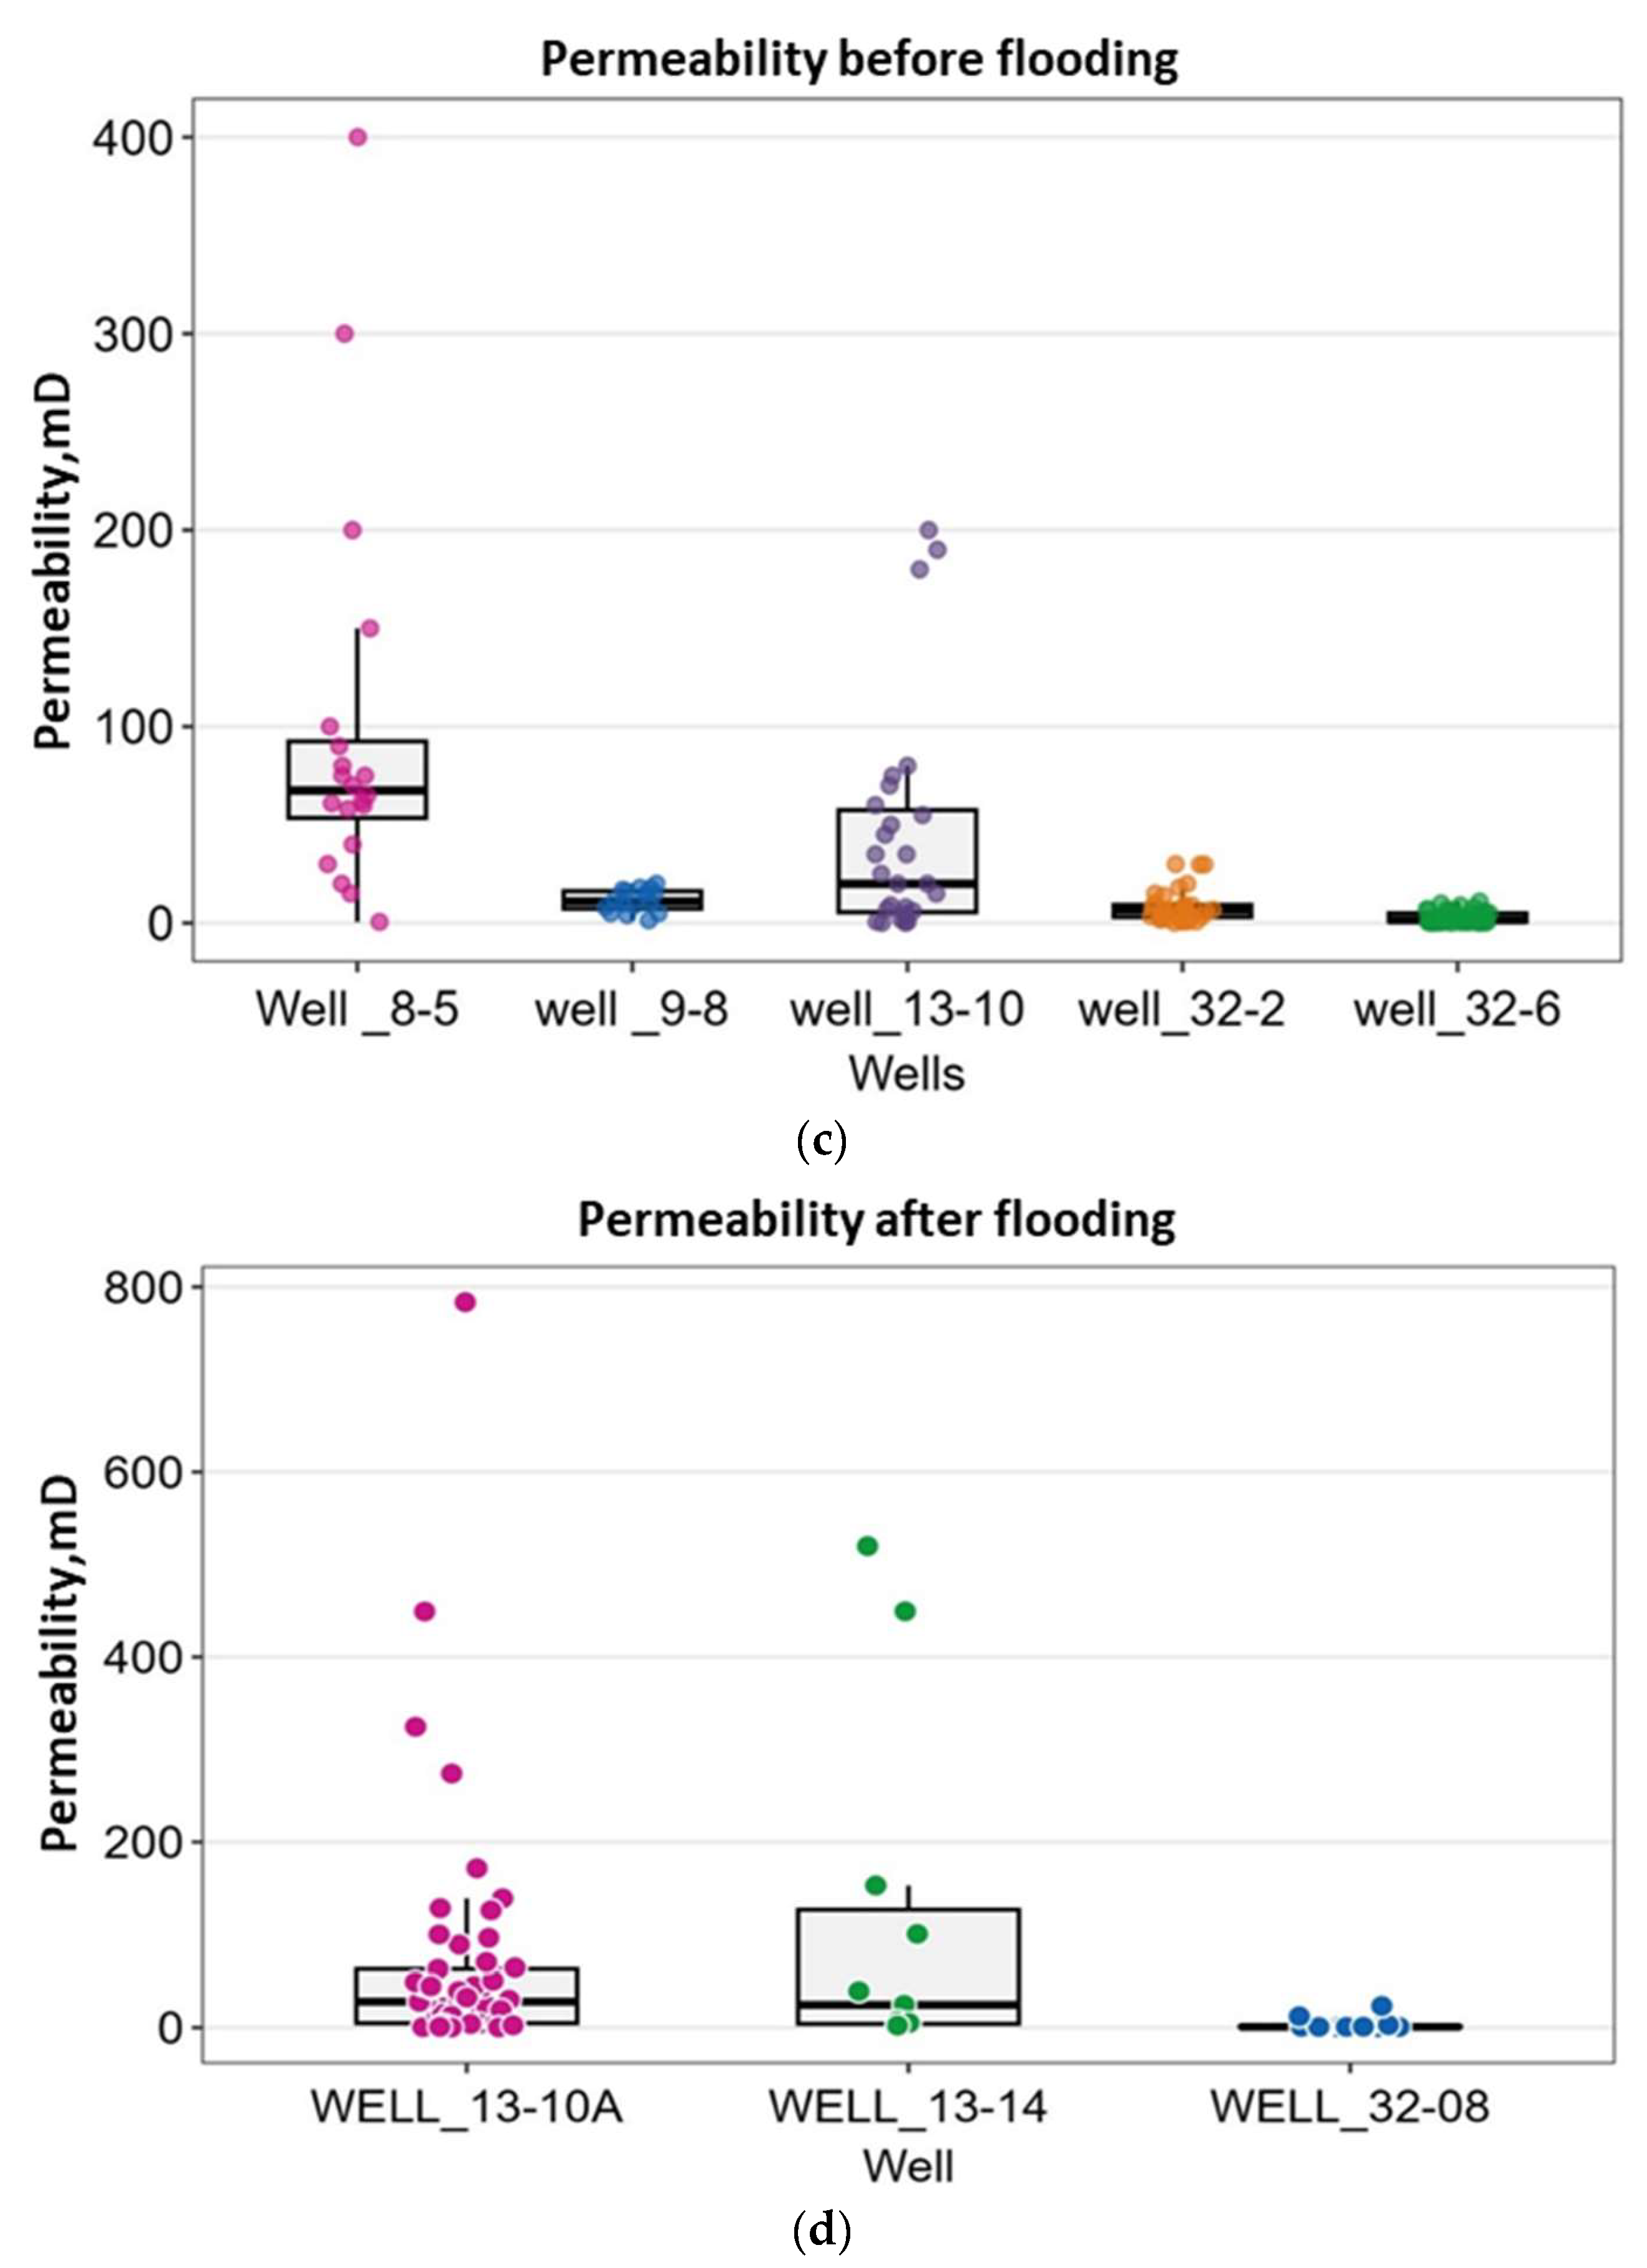
Figure 13 and Figure 14 are core permeability and porosity datasets from wells 8-5, 9-8, 13-10 (west) and 32-2, 32-6 (east) before waterflood. Wells 13-10A, 13-14 (west), and 32-08 (east) represent core data from wells after flooding. From the boxplots, porosity values for both west and east sections before flooding are relatively similar (Table 4) than wells after flooding. There is an approximately doubled difference between the various percentiles after flooding. That is, porosity estimates after flooding are relatively higher in the west than in the east. Core estimates of porosity generally correspond to elemental analysis in Figure 11 and Figure 12. Core permeability estimates (Figure 14) on the west section are much higher than in the east section. Maximum permeability on the west is approximately 400 md and 780 md before and after flooding samples, respectively. Maximum permeability on the east is approximately 30 md and 23.4 md from Morrow B1 but much lower in Morrow B (the target reservoir). Generally, after flooding, samples on the west show an increment in permeability values, while those on the east show a reduction from the percentile values (Table 4 and Table 5 and Figure 13 and Figure 14). The overall averages before and after flooding for the west are 52.88 md and 76.5 md, and 4.97 md and 2.52 md for the east, respectively, depicting the same trend as percentiles values. This can also be observed considering estimates from individual wells before and after flooding (Figure 14c,d). These changes can be attributed to the initial states of the samples in the reservoir. However, it can be inferred that, once there has been a foreign flow of material (low saline water) into the reservoir at a certain rate and duration, the possibility of chemical and physical alterations of reservoir properties can occur (example dissolution, precipitation, movement of fines, fracturing, etc.), which could increase or decrease certain reservoir properties.
From ELAN (Figure 11 and Figure 12), and as estimated in core analysis, permeability recorded in the west is much higher as compared to the east section (Morrow B). Permeability relation in the west (13-10A) is such that the values increase from top to bottom of the reservoir, a significant observation that can be applied to HFU delineations. Thus, ELAN results are closely related to geological studies on reservoir characterization.

4.3.3. Implementation of Porosity and Permeability on Storage and Flow Capacity

Previous discussions on lithology, grain facies, pore facies, mineralogical composition, etc., with their high degree of variability, support the differences in reservoir properties in the west and east sections of FWU. Considering the heterogeneity with respect to flow capacity to better clarify the mechanism of waterflood inefficiency is essential. Based on Winland R35 approach, pore aperture of FWU samples were estimated for samples before and after flooding. These values were group based on [37], and categorized from smallest (micro) to largest (mega) pore aperture radius as summarized with their respective characteristics in Figure 15.
Flow capacity (permeability) is directly related to the size and interconnections of pores and pore throat. Prior to flooding, samples from the east are predominantly in the micro-lower macro-pore category (i.e., approximately 82% of samples) (Figure 16a). The remaining 12% are spread out in the low- to mid-macro range. No sample from the east had pore throat sizes estimated beyond mid-macro. The west section is characterized by a wide distribution from micro to mega (Figure 16a). However, over 57% of samples from the west are in the range from mid-macro to mega. Approximately 31% fall between lower to low-mid macro. Only 11% of samples are classified as micro. A total of 23 and 64 rock samples from the east (1 well) and west (2 wells), respectively, were utilized in estimating the pore throat sizes for post-flooding conditions (Figure 16b). As in pre-flooding, the west estimates spread out in the range of micro- to mega-pore types. Approximately 40% of samples fall between mid-macro and mega, 43% in range lower-macro to low-mid macro and 15% making up micro- and meso- pore aperture category. The east section showed similar results as in pre-flooding except that more samples (approximately 91%) are micro- to meso-pore types, an indication of a much greater reduction in pore throat aperture radius after flooding.
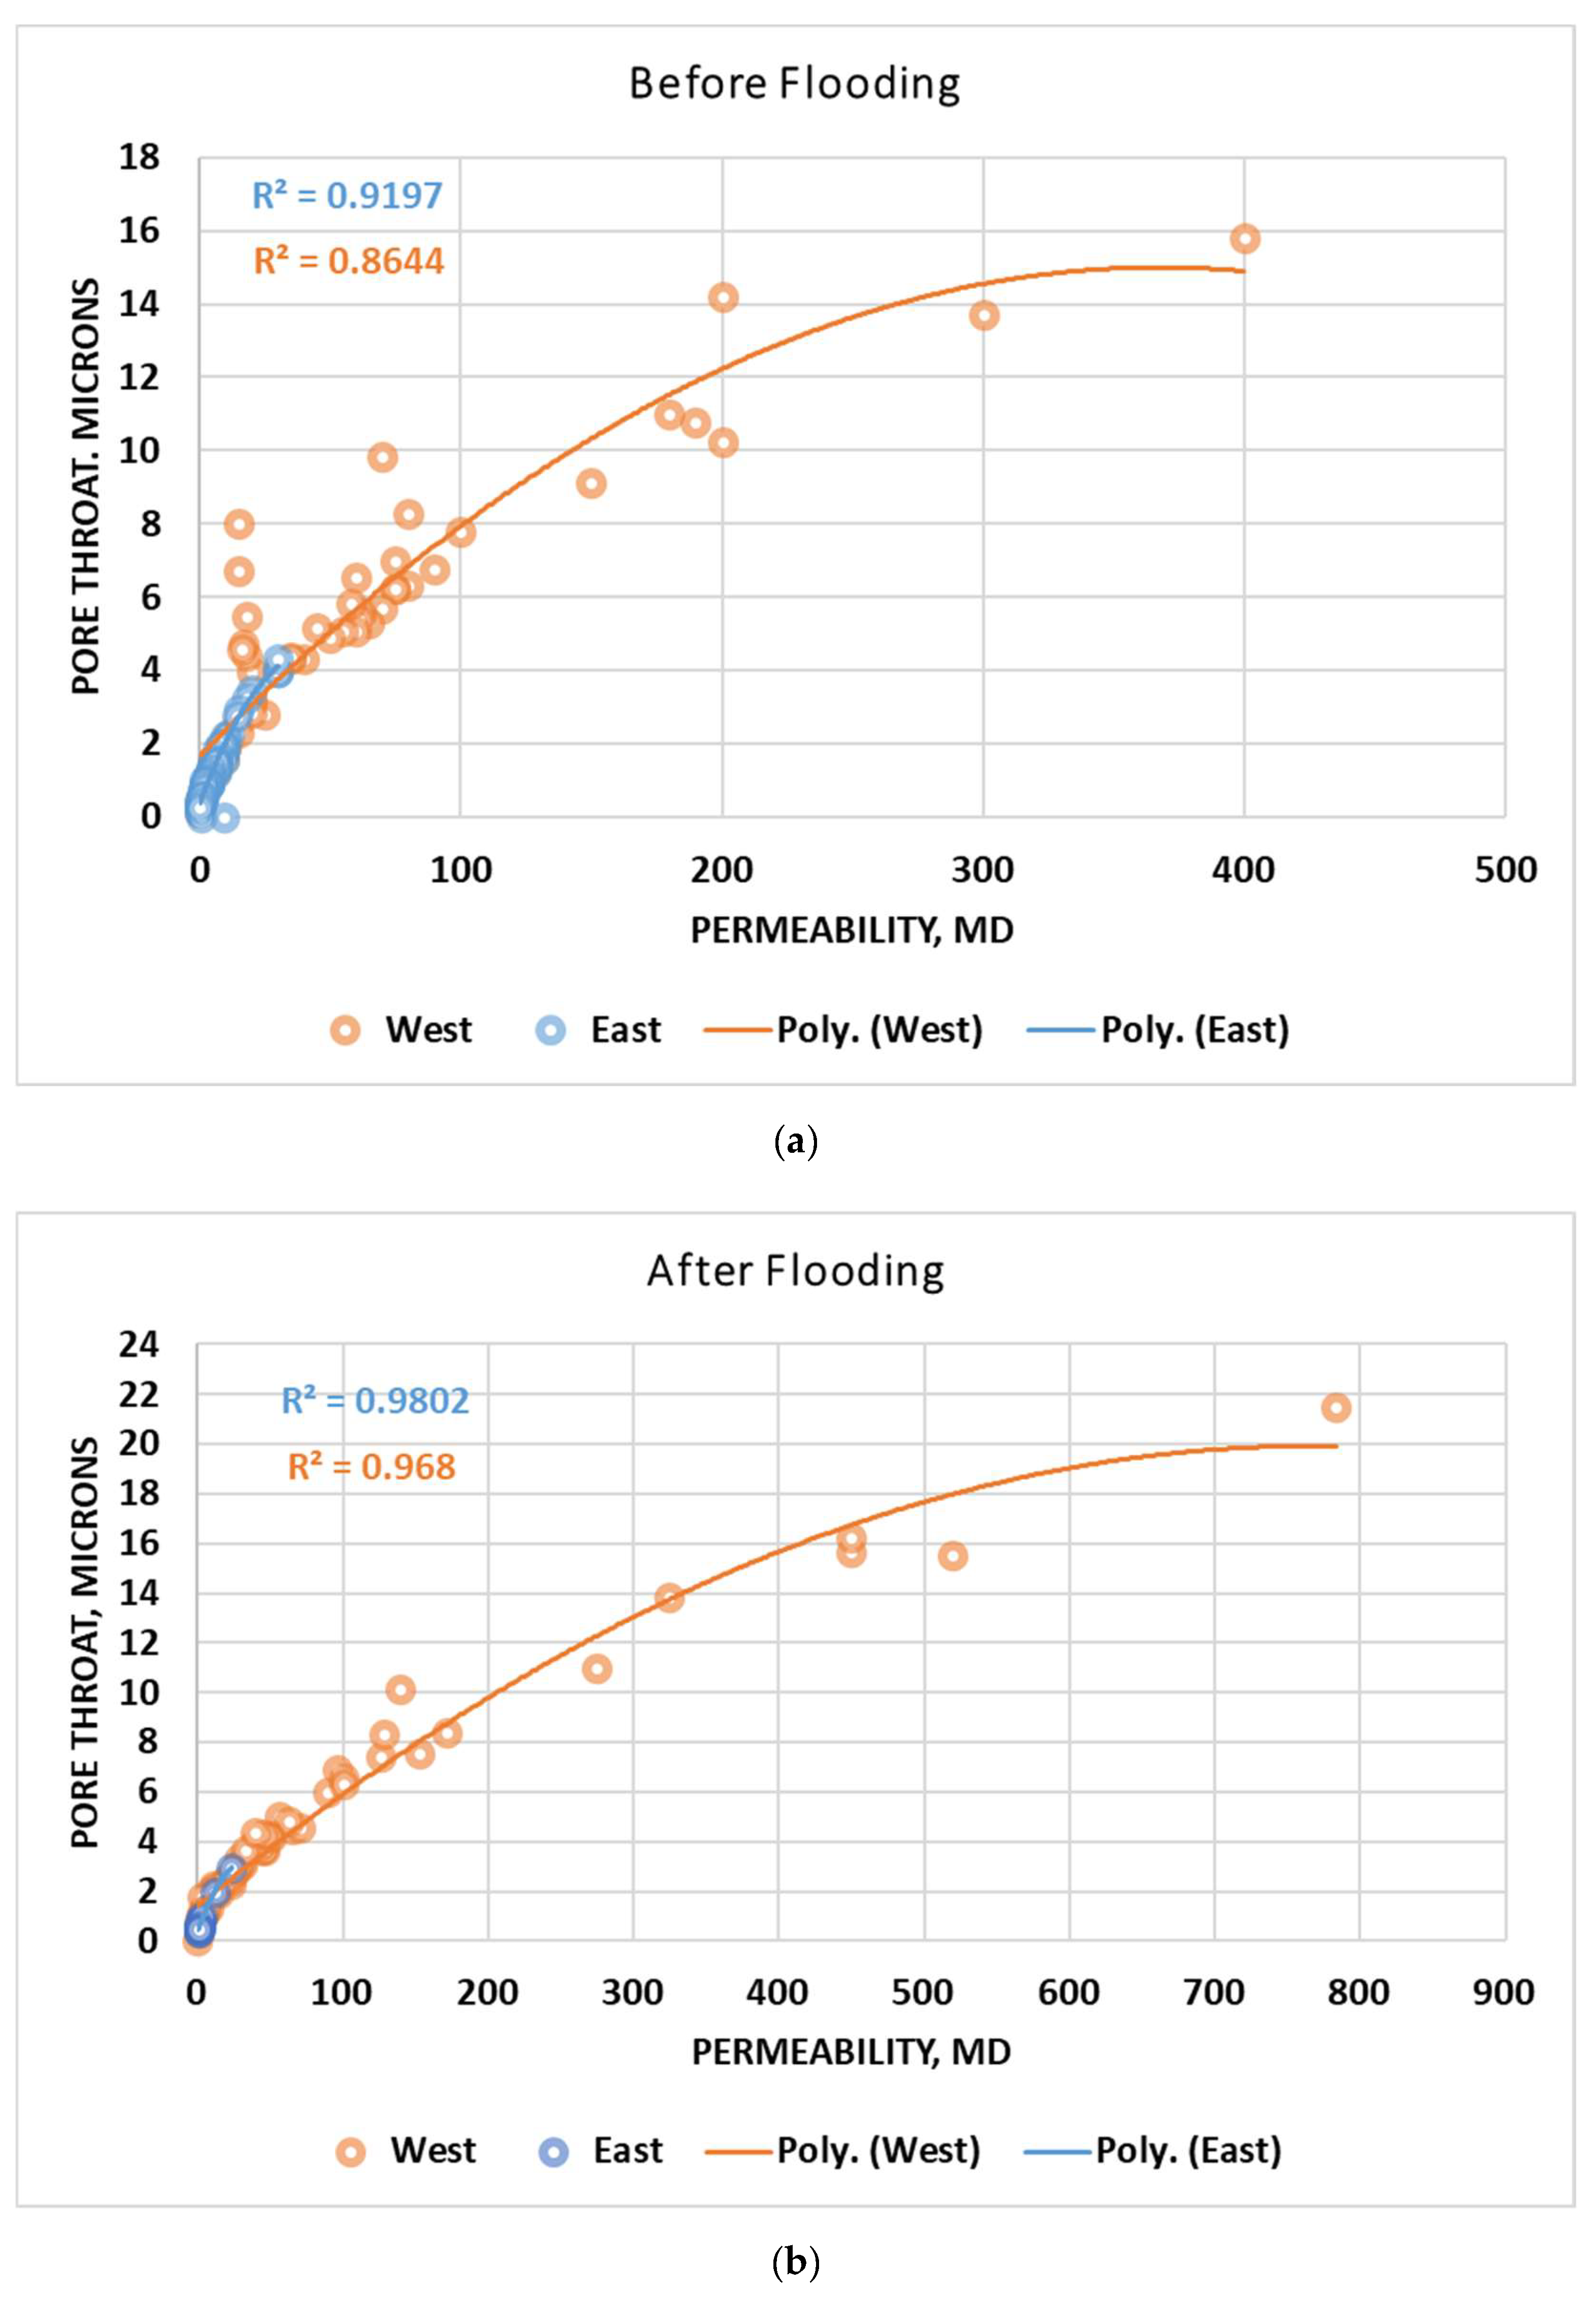
In Figure 17a,b, there is a strong correlation between pore throat size and permeability (R2 values approximately 0.9) in all scenarios. The reduction in pore throat size and corresponding permeability values from the east section can also be deduced from the figures. The maximum pore throat size pre-flooding is 4.4 microns and an average of 1.2 microns but post-flooding records show a reduced average of 2.97 microns, with an estimated average of 0.74 microns (Figure 16a,b). In comparison to the west, maximum pre- and post-flooding show a pore throat size of 15.8 microns and 21.5 microns, with an average of 4.6 microns and 4.3 microns, respectively. Both maximum values are of the mega-pore types, with averages in the mid-macro range, which are relatively above the maximum values in the east.

4.3.4. Controls on Flow Units (Zonation into HFUs)

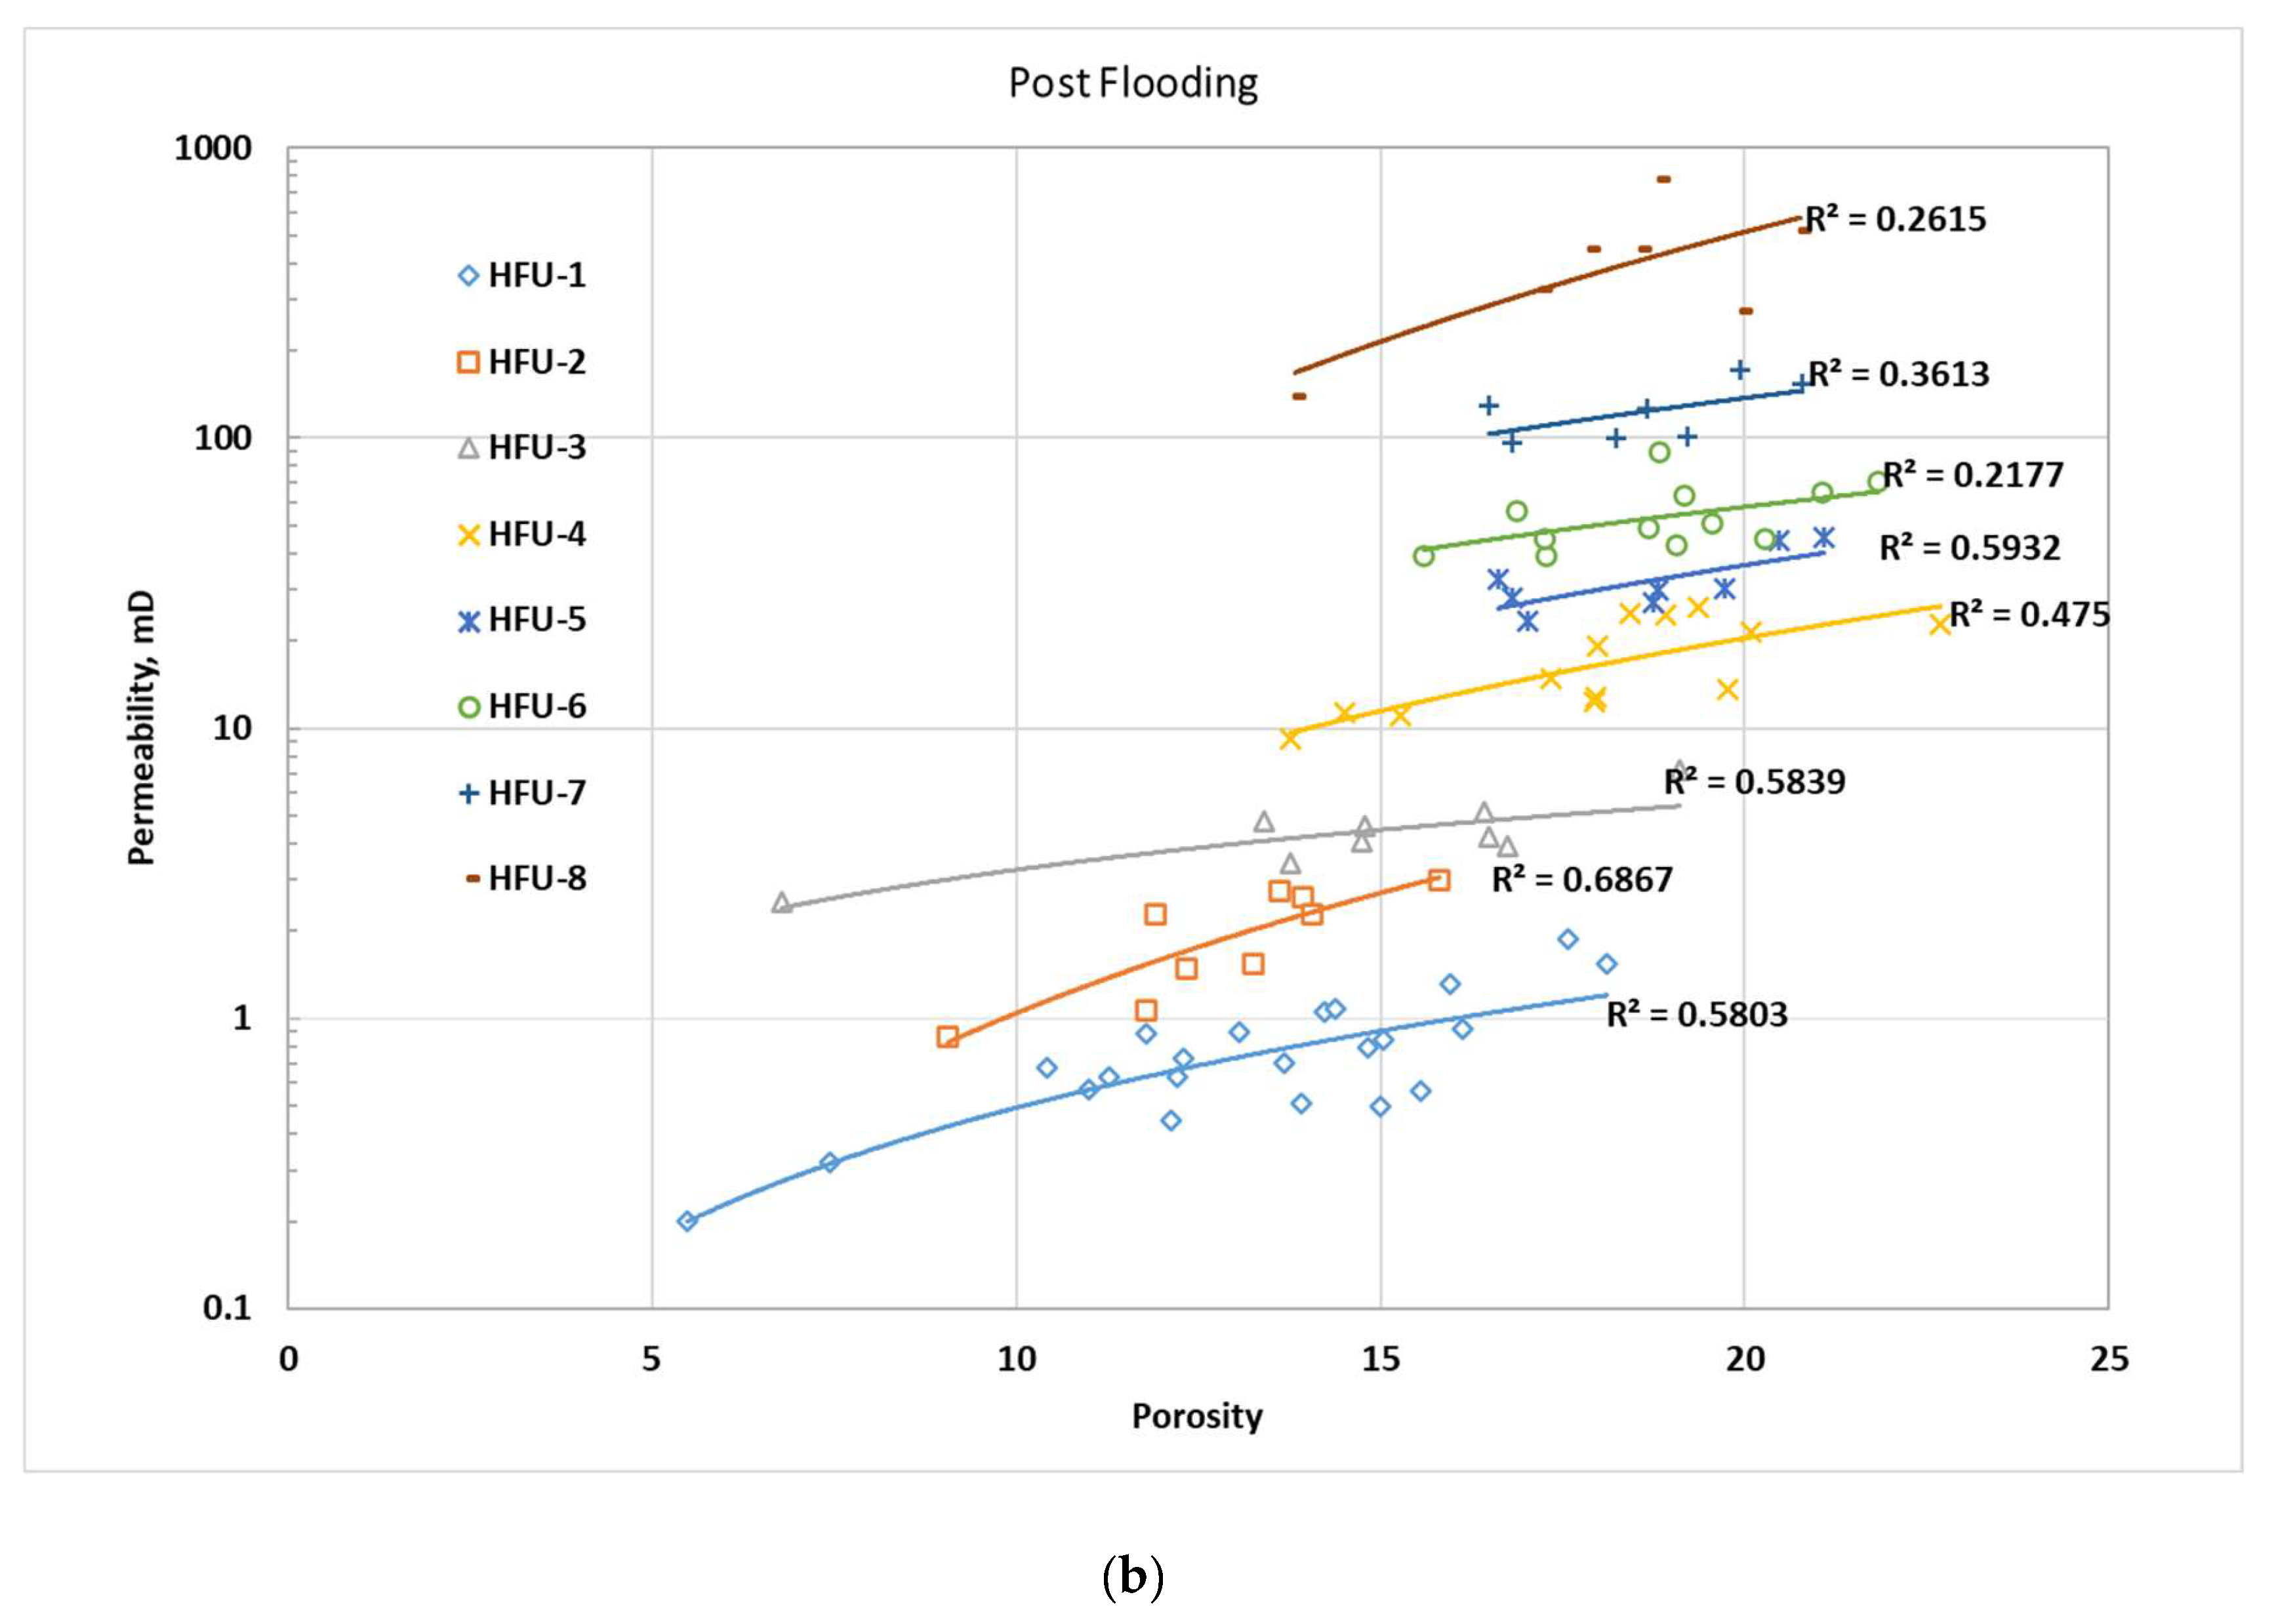
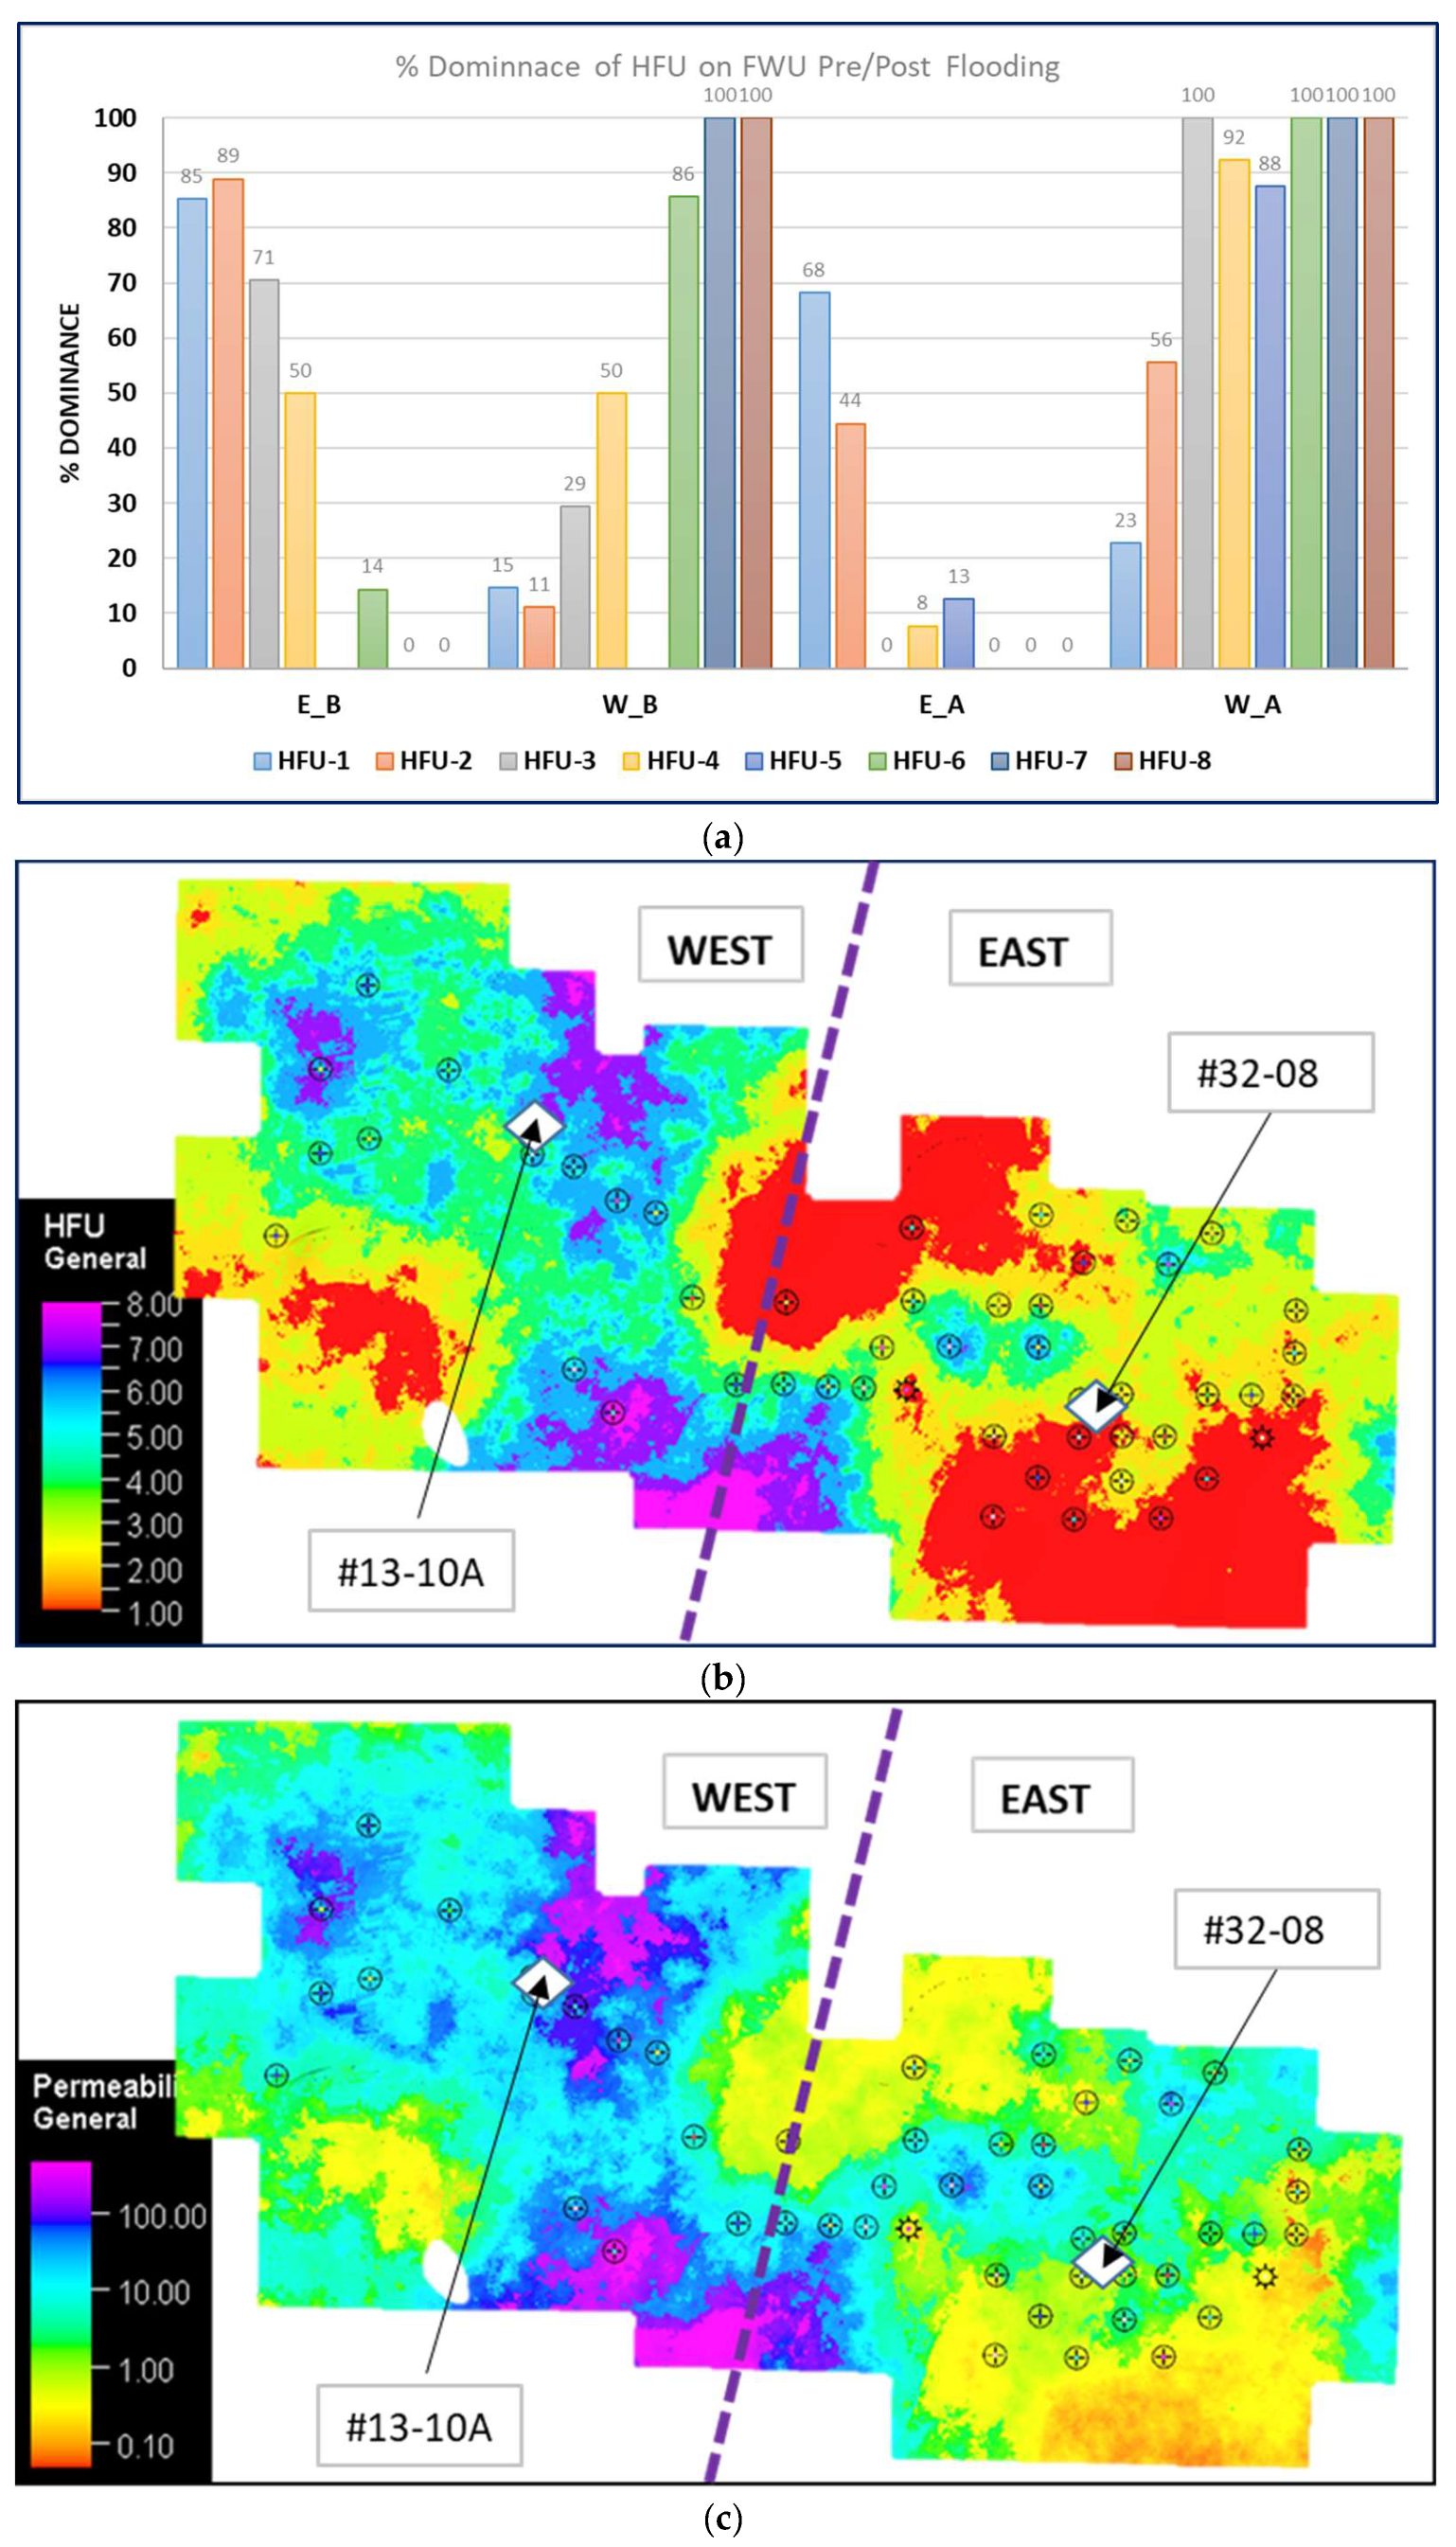
A further analysis on the implication of different pore throat apertures is established by utilizing the Winland R35 approach to define hydraulic flow units (HFUs) to explicate a further understanding into water injection and flow in the Morrow B reservoir. Plots of permeability and porosity relating to each range of pore category with good correlations are created and assigned as HFU-1 to HFU-8 based on the type of pore size. This was performed for pre- and post-injection wells. In total, seven distinct controlling HFUs are presented in samples from pre-flooding (Figure 18a) and increased to eight HFUs in post-flooding analysis (Figure 18b). This in effect is another demonstration of variability in fluid flow controlling factors in FWU. Effectiveness and efficiency in flow conductivity are in ascending order from HFU-1 to HFU-8. FWU east and west however, have predominant HFUs characterizing flow behavior. This is presented in Figure 19, indicating the percentages of dominating HFUs in each section of FWU before and after flooding. HFU-8 (100%), HFU-7 (100%), and HFU-6 (86%) were the most dominant in the west prior to flooding (W_B in Figure 19). While in the east section (E_B), HFU-1 (85%), HFU-2 (89%), and HFU-3 (79%) are the most predominant, completely opposite scenarios in both cases. Post-flooding recorded a much wider range of dominating HFUs in the west (From HFU-3 to HFU-8), with east reducing to mostly HFU-1 and HFU-2, a much greater decrease in most effective HFUs.
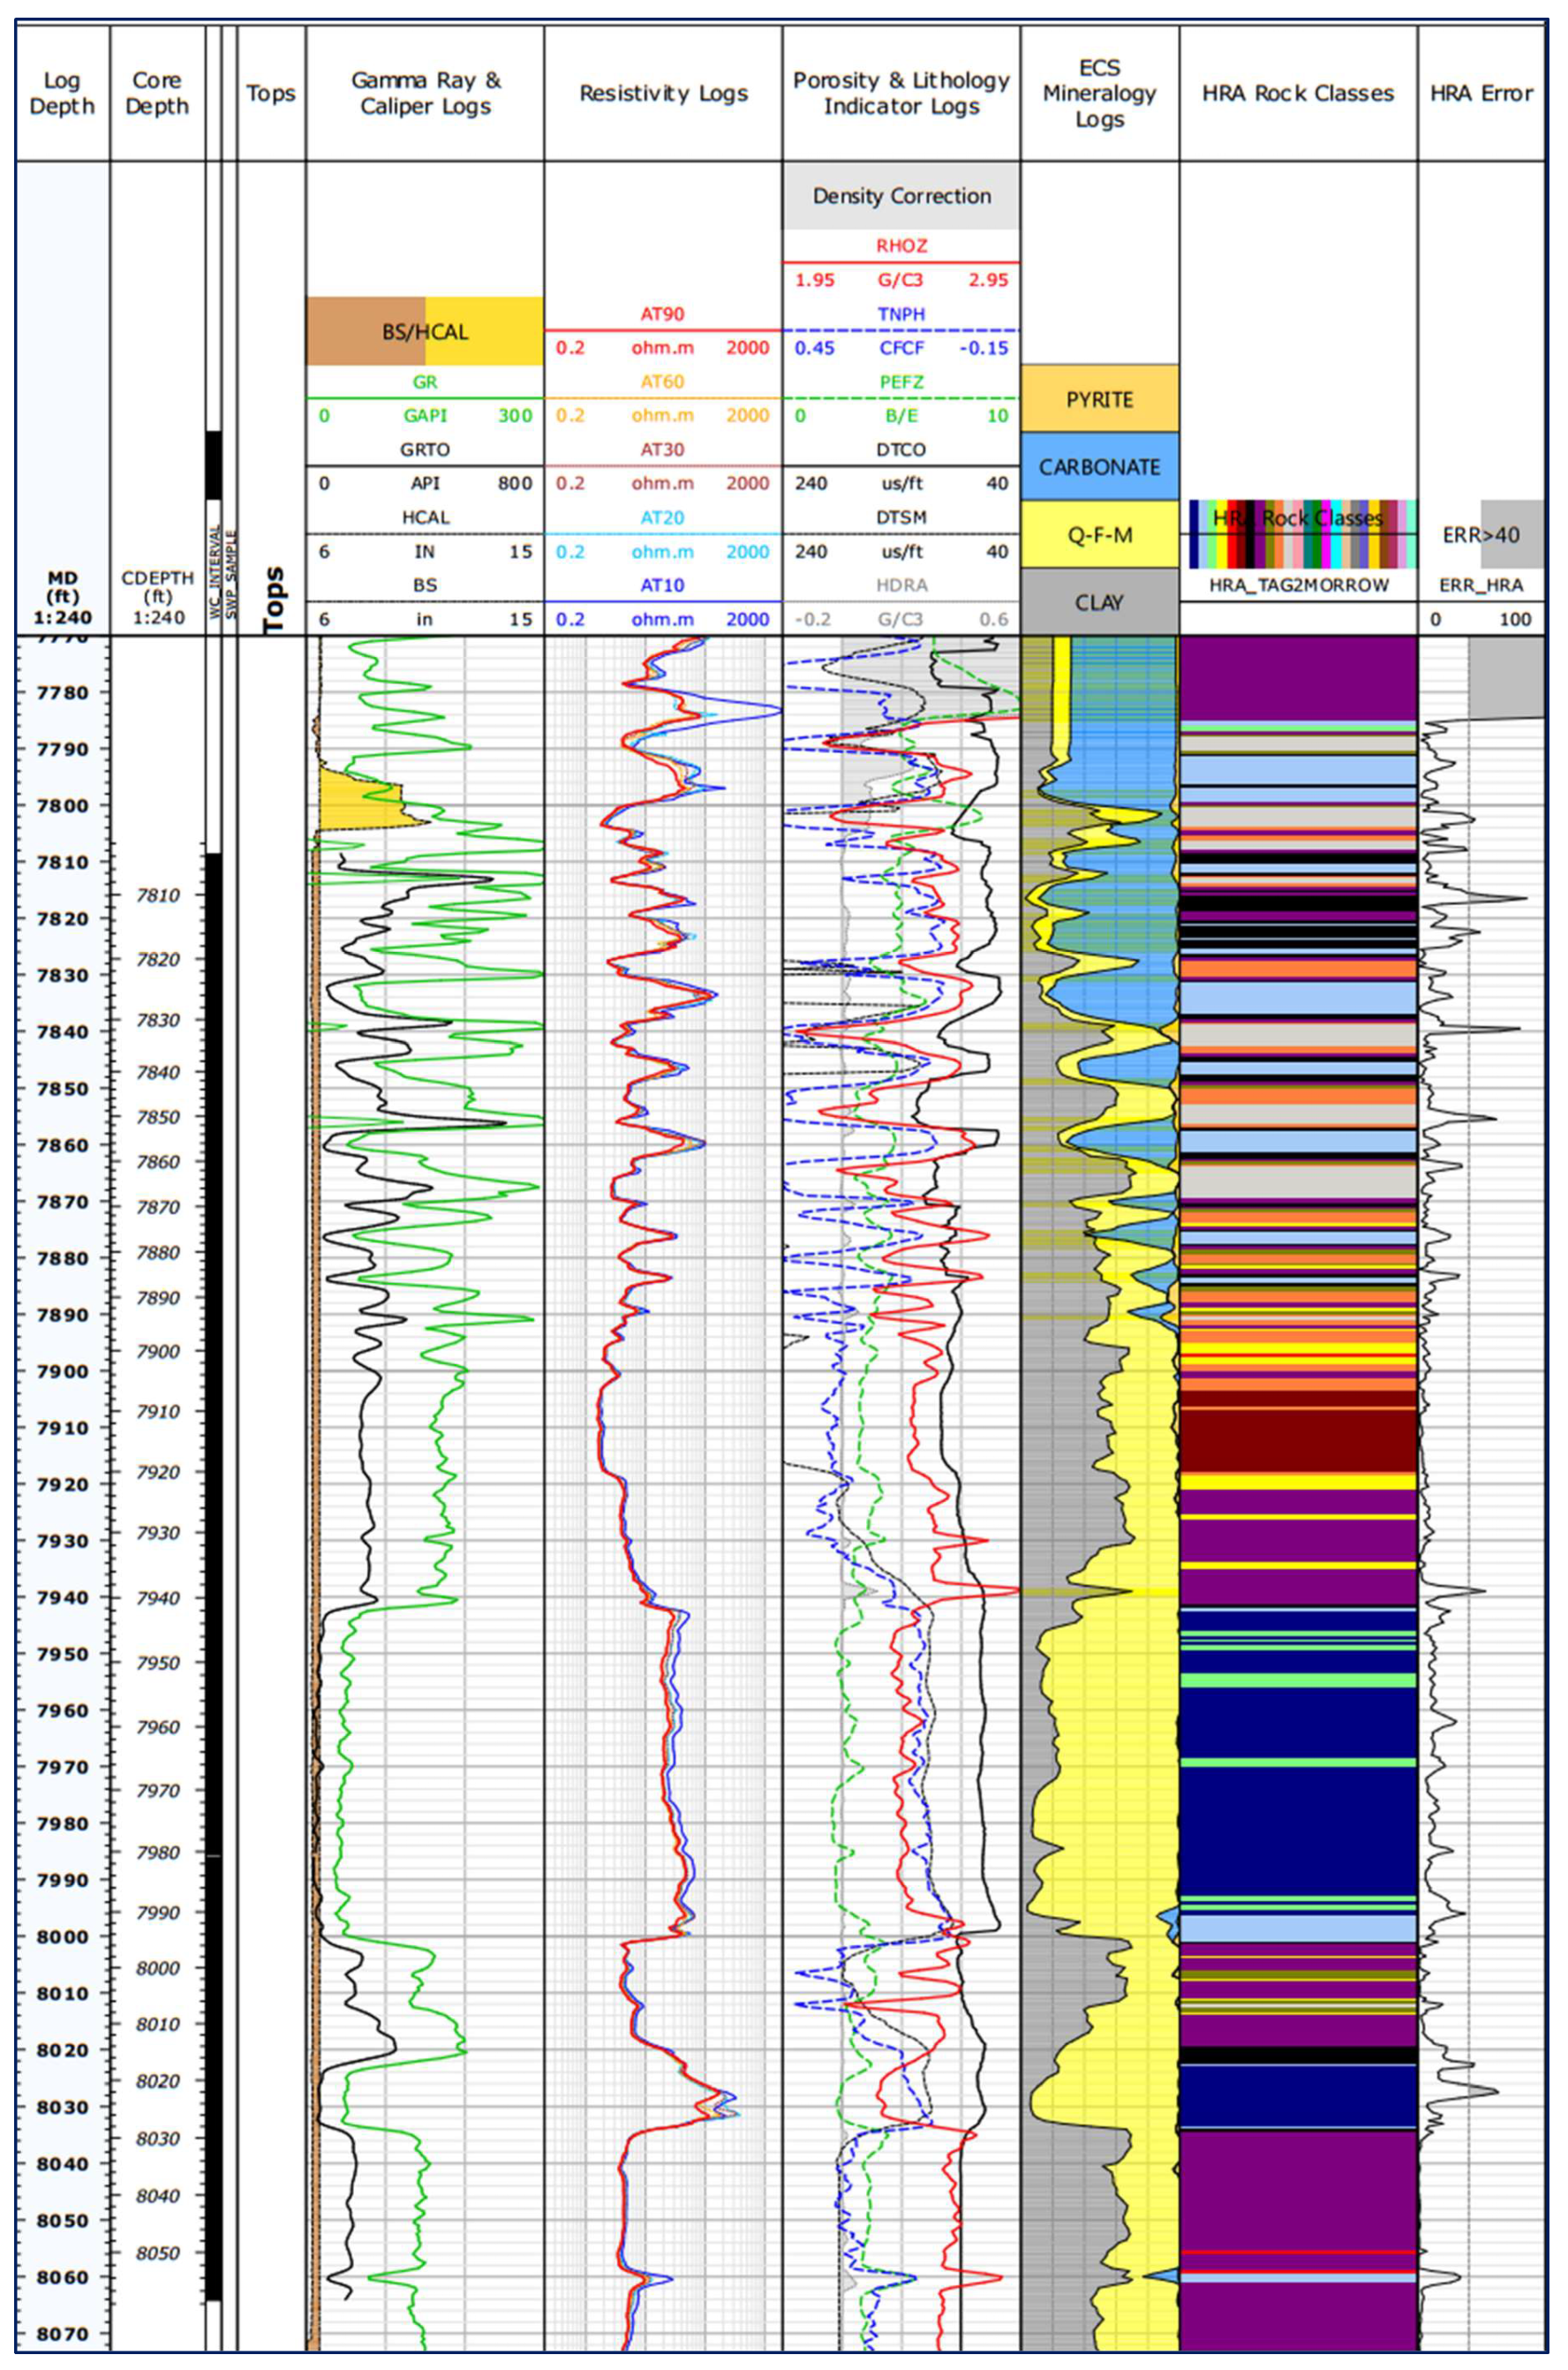
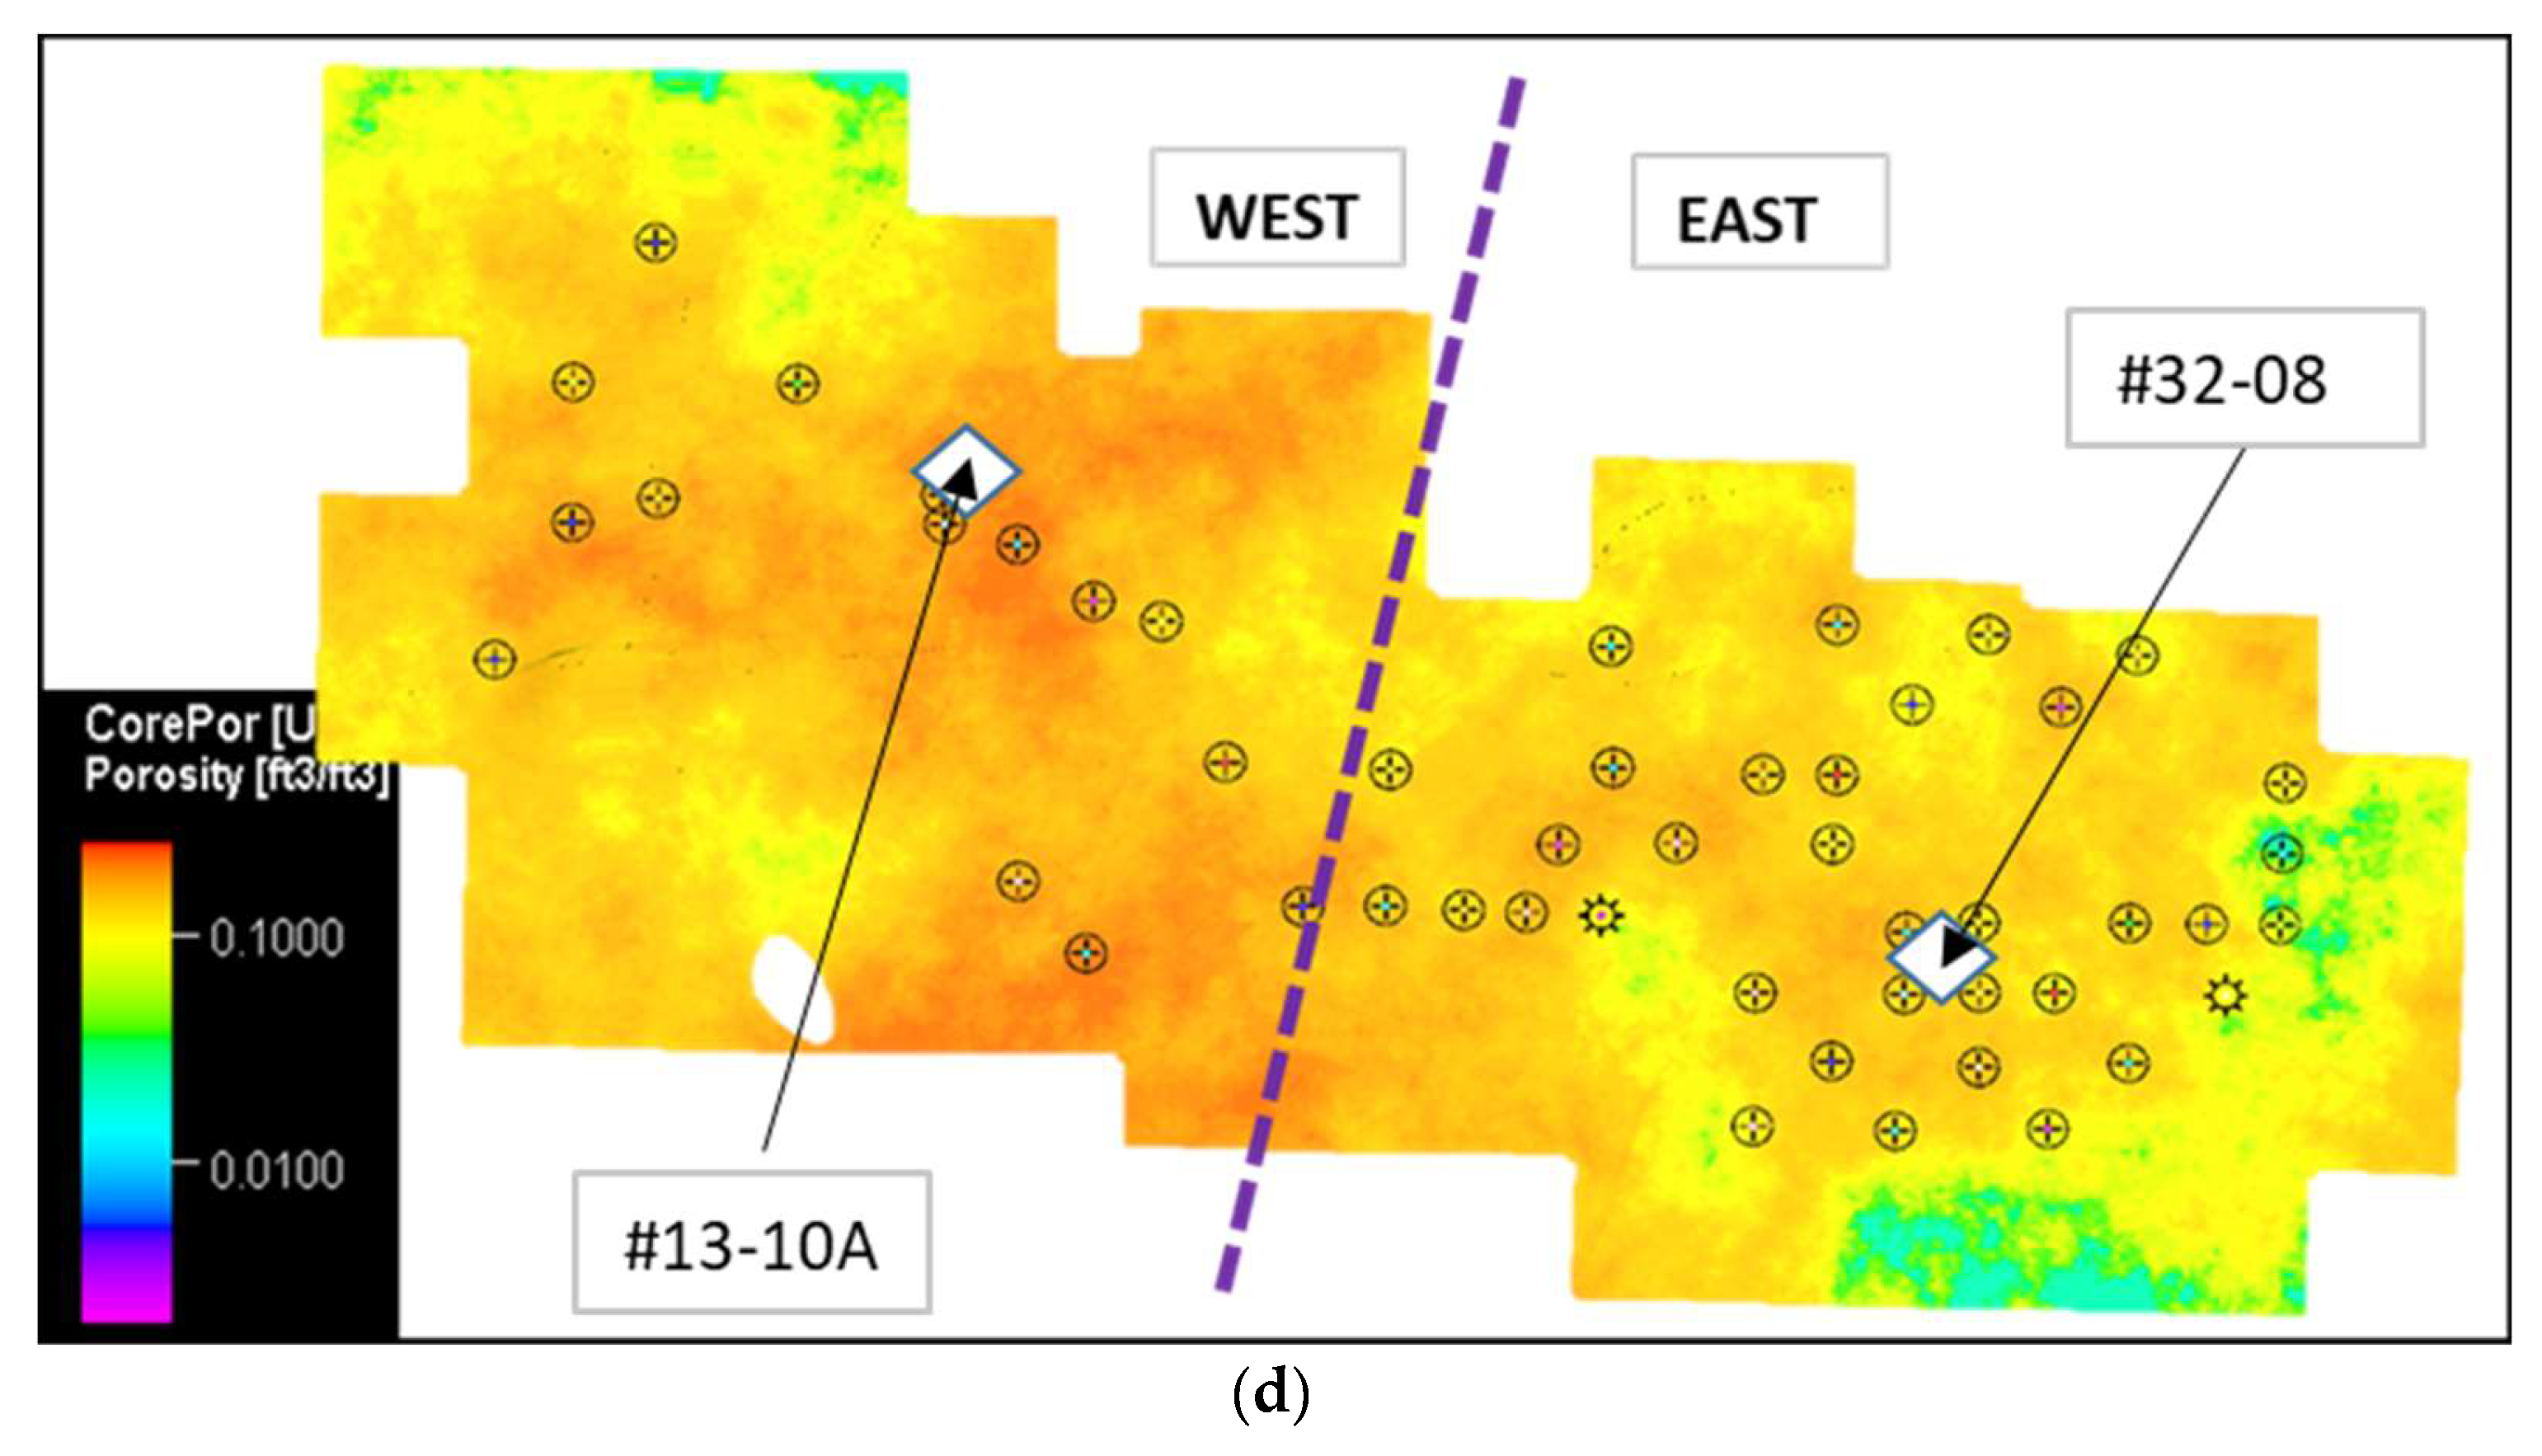
In terms of consistency and stability in HFUs, the west section shows much of these characteristics though it has a wide range of variability. The uniformity or consistency in rock characteristics was observed in an analysis through a heterogeneous rock analysis (HRA) concept (Figure A10 in Appendix C). In HRA, the inconsistencies in properties of logs in relation to depth is evaluated by categorizing rocks on the basis of recurring patterns of response [46]. Thus, zones of unvarying mechanical characteristics within rocks are discriminated. Color coding representing zones of consistent properties are assigned to logs (Figure A10 and Figure A11 Appendix C). The east’s Morrow B has more variability as compared to the west based on HRA analysis. Figure 19b–d clearly shows the distinct quality disparities in the distribution of various properties on the east and west.

4.4. Reservoir Engineering Data

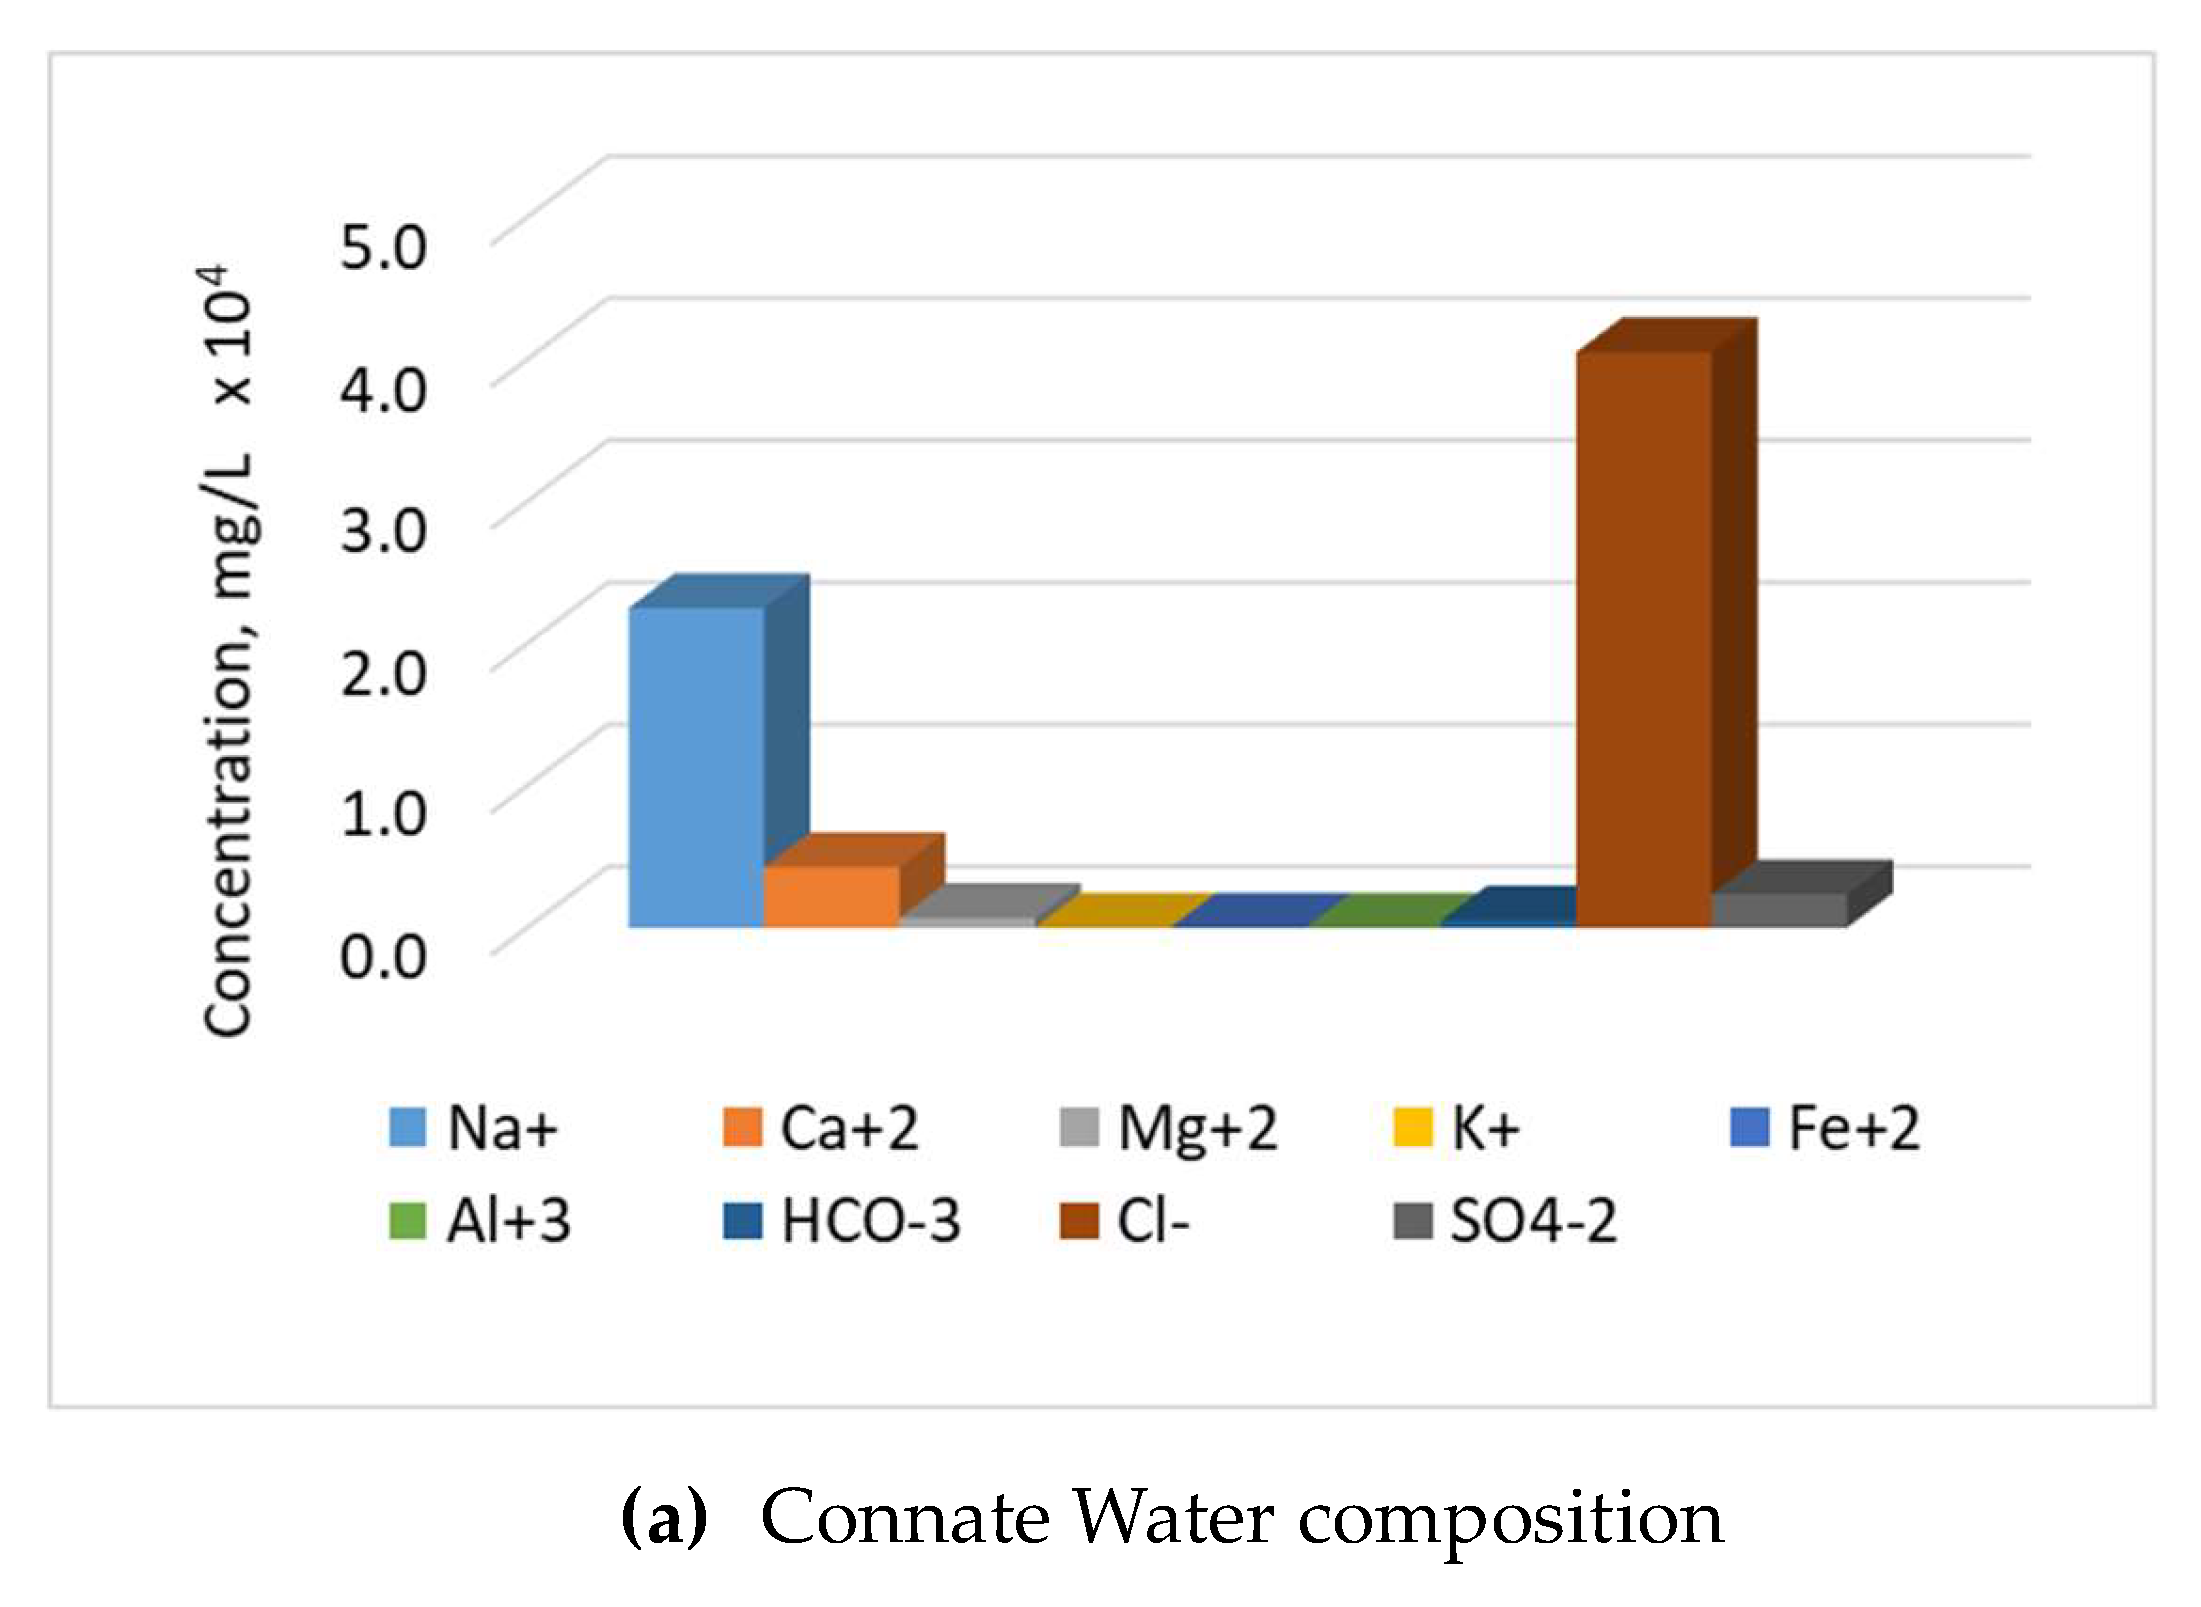
A detailed insight into the history of occurrences on FWU is discussed in this section with much emphasis on the east. Production and injection history data, well placement and patterns are generally discussed to establish a further understanding of reservoir history. FWU estimated an HIIP of 120 MM stb, and initial gas in place of 41.48 BSCF. Initial reservoir pressure and bubble point pressure as well as minimum miscible pressure (MMP) of carbon dioxide and the crude oil were estimated to be 2217.7 psia, 2073.7 psia and 4200 psia, respectively [47]. At an initial reservoir temperature of 168 oF, the formation volume factor was 1.192 rb/stb, with a solution gas drive as the primary drive mechanism since there was no associated aquifer. The composition and concentrations of formation connate, injected, and produced water are summarized in Figure 20.

Production and Injection History

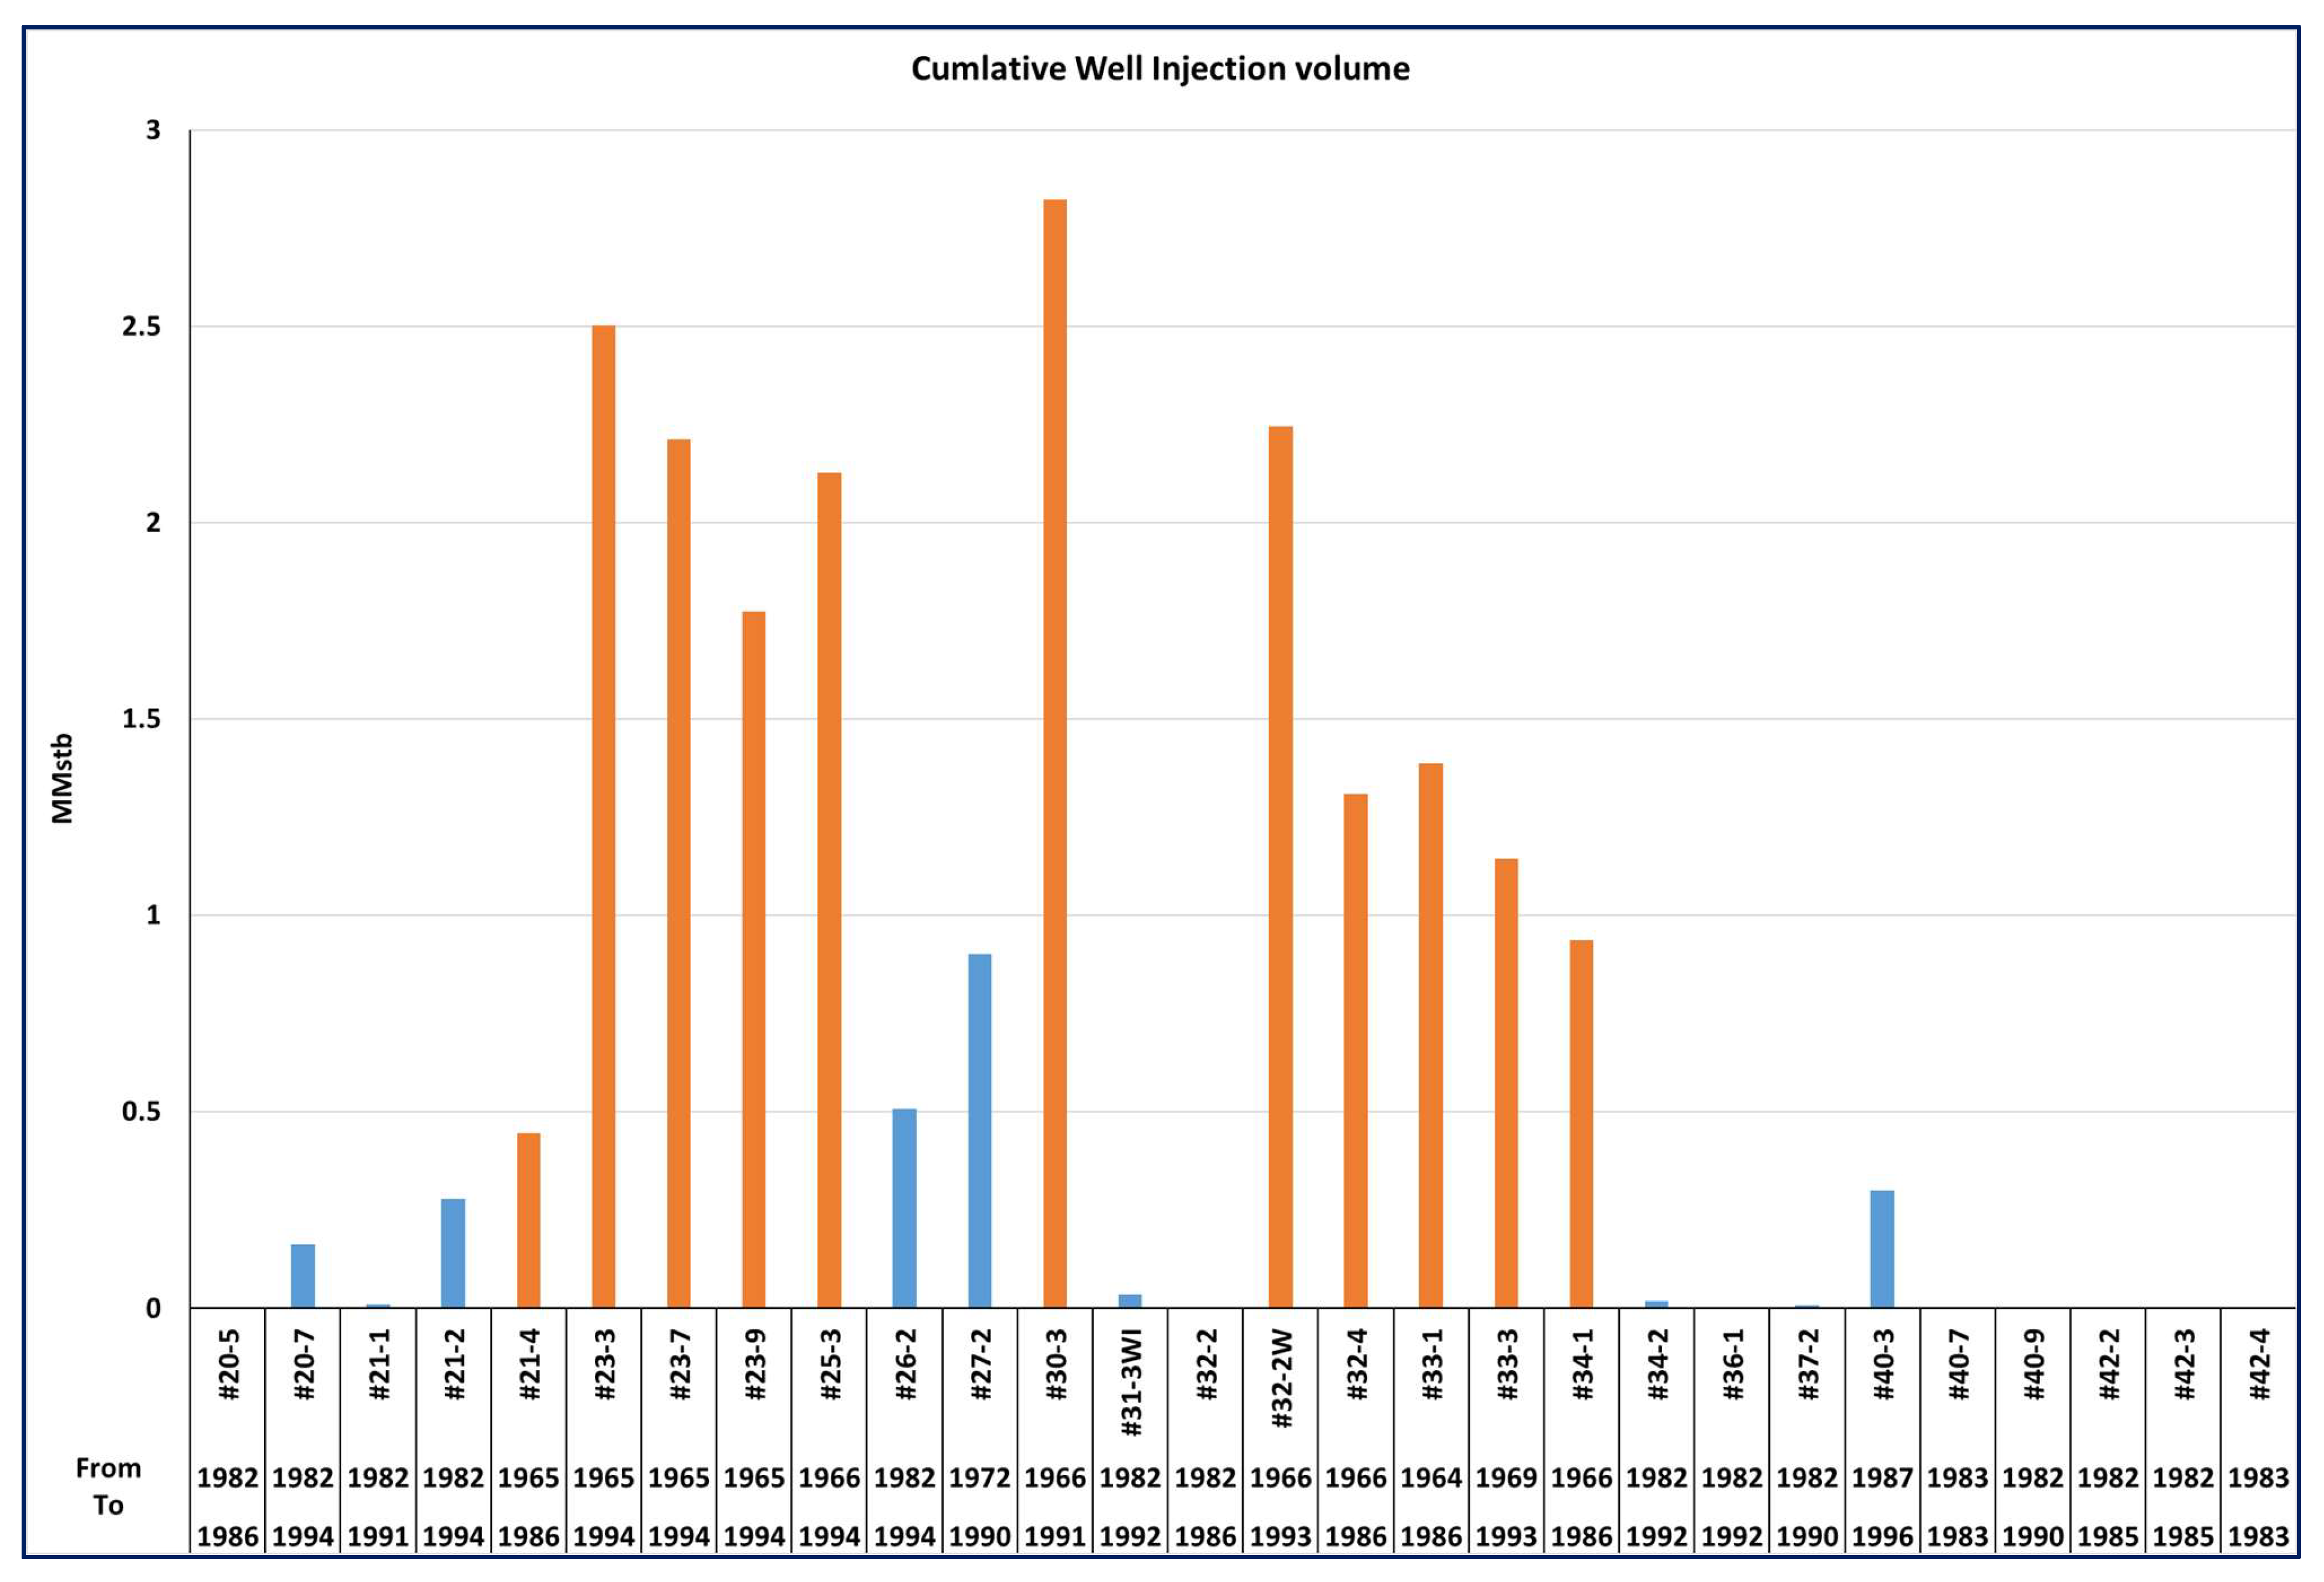
Primary production peaked at approximately 5000 stb/d in 1959; and by 1964, a recovery of approximately 9.7 MMSTB. There was a recovery of 8.2% HIIP, of which 5.2 MMSTB was from the east section and 4.5 MMSTB from west. The oil flow rate declined to approximately 2300 stb/d with 944 BOPD average and 8003 MCFD average gas production. At this period, reservoir pressure depleted to 1000 psig on the east side of the field. Water injection commenced in 1964 on the eastern section and 1966 on the western section. Prior to waterflood, flow rates had declined to 1000 stb/d from both fields. Though primary recovery experience was quite similar on both fields but much prolific on the eastern section, waterflooding was the opposite. Inefficient waterflood on the east section led to a total ultimate recovery of approximately 19% of HIIP in 1986, with a water cut of 92%. The west side recorded approximately 43% of HIIP (23.6 MMSTB) in the same year (Figure 1). The success of waterflood on the west section has since made it a better candidate for tertiary recovery. Currently, the west section is under CO2-EOR. Approximately sixty (60) wells in total were developed on the east side of the field. Approximately 50 were production wells through 1963. Conversion of wells into injectors commenced actively in 1964 through 1982. In total, 28 wells were converted to injectors. Twelve (12) of these were at the early stages between 1964 and 1972, with later injectors actively from 1982 (totaling 16 wells, Figure A10 and Figure A11, Appendix C). Figure A11 details the year and total injected volumes at any particular time for both early and later injectors. An observation made from this figure shows higher volumes of injection from early wells and insignificant to almost zero volumes for later wells. Variations in injected volumes or injection rates per well are expected for a heterogeneous reservoir such as FWU, as analyzed in previous sections or based on constraints imposed by operators. However, the performance of later injectors indicated worse conditions beyond the issue of heterogeneity as has been explored. A couple of observations on some individual wells indicate some later wells (after oil production declined during flooding) were converted to injectors to support the already declining injectivity rate of adjacent injector wells (early injectors). Examples are wells #23-3 and #27-2 and #23-7 and #26-2. Conversion of #27-2 was the only later well that had quite close to good injectivity as compared to all others (Figure A11, Appendix C). The closest producer #23-2 at this period had a water cut of approximately 100% at the time of conversion. Hence, it is quite unexplainable why that conversion was performed. Conversion of #26-2 in a similar situation did not produce any results (no injectivity). The pattern scheme reported in the literature was a 5 spot for the east section and a line spot for the west. However, most injectors look quite randomly placed. This could have influenced the distribution of injected water, hence the sweep inefficiency and high water cut in certain zones of the field.
Further analysis was conducted on history data utilizing bubble maps and plots. Bubble maps give a good visualization for field, pattern and well analysis of production and injection data. Bubble maps gives an indication of areas of good or poor performances and a sense of flow direction. From the bubble map analysis of FWU-east, water injection started (1964) with wells circled in Figure 21a. These injectors in the middle of the field had quite a good performance from the beginning (larger bubbles, representing mostly early injectors). Moving up to 1970–1975, the increasing area of the circles slowed significantly, an indication of low water injection. A new number of wells were further converted to injectors but performances were poor. These are the red circles indicating low injection volumes (later injectors). The decline in injection volumes together with the poor to no performances of new injectors could somewhat be linked to injectivity issues, especially at the extreme ends of the field (east section). Production wells (Figure 21b) surrounding middle injectors were quite responsive and with high water cut as injection volumes increased. However, most extreme end producers had a minimal increase in radius, a direct implication of low impact of waterflooding as noticed in injection performance.
For an ideal water injection operation, the material balance should be a barrel in and a barrel out (1bbl injection:1bbl fluid) [1,48]. However, that is impossible in a heterogeneous system or a real field case. Also in flooding, the more barrels injected, the more oil is expected to be recovered. A large volume injected will have a wide distribution within the reservoir and hence displace or sweep a higher quantity of existing fluids (except situations where channeling or loss of fluids behind casings occurs). Generally, there were more barrels injected on the west as compared to the east of the field mainly due to the success of flooding (Figure 22a,b).
For a reservoir with no aquifer and produced for a period of time, a waterflooding injection will take some time before its response is felt at producing wells (normal scenarios). An amount of water will have to be injected to replace the voidage as a result of primary recovery before displacement of subsequent existing liquids. Hence, at the early years of flooding, a ratio of cumulative injected volumes to produced liquids is most likely to be above one (1) (Figure 21a). The east section of the field begun flattening out (constant performance ratio) as in 1971 (Figure 21a). This can be interpreted as a point of constant cumulative injected volume with a corresponding constant effect on production (i.e., a condition of insignificant or poor performance attributed to less or no volumes of injection). This is an indication of low injectivity with a corresponding low production and vice versa for the east of the field. The west follows a similar trend but after the maximum cumulative production (which draws the peak ratio down), a rise in ratio is seen. Cumulative injected volumes increase in this case with respect to low oil production. Thus, the adverse effect leading to inefficient injection of water on the east section may be minimal or absent on the west section.

5. Summary

5.1. Key Findings

Morrow B was deposited as fluvial low-stand to transgressive clastic fill within an incised valley. From this, primary deposition fabrics were seen to have less effect as compared to diagenetic features on reservoir performance, though variation in deposition may have an effect on later diagenetic pathways. Most notable diagenetics were feldspar alteration and formation of authigenic clays, which altered porosity. There was dissolution of silica, quartz, calcite and siderite cementation as well as minor pyrite formation.
From an Xray diffraction analysis, Clays are present on both sides of the reservoir with percentages of whole rock ranging from 4% to 8%, with the highest coming from the east. Smectite, illite, and chlorites are relatively higher on the east. Kaolinite is relatively equal in all samples. The majority of these clays are seen in the form of dispersed authigenic clays. Five distinct porosity facies are observed in the reservoir section: dominantly intergranular microporosity and grain-sized intragranular porosity to porosity dominated by microporous authigenic clay, calcite cement or intragranular microporosity. Little correlation was determined between primary depositional characteristics and porosity and permeability trends, which further suggests diagenetic effects on reservoir performance than depositional processes. Other studies also indicated predominant pore types through hydraulic flow units to be intragranular micro-pores and microporosity was associated with dissolution of feldspar and precipitation of authigenic kaolinites and other clays, which are types of porosities less likely to form connected networks, thus low permeability.
Grain dissolution increased porosity in some places, and authigenic clay and compaction reduced the reservoir quality of the Morrow B sandstone. Dissolution of feldspar increased porosity and permeability by creating intragranular micro- and macroporosity. Some grains, possibly feldspar, dissolved completely, leaving grain-sized pores. This suggests that complete dissolution of grains contributes greatly to permeability. However, the dissolution of feldspar may have provided the aluminum for kaolinite to precipitate, which decreased reservoir quality.
Nine pore structures were studied on both sections of the field. The west is abundant in grain-sized pores which are high contributors to permeability. Clays in some samples from the west are partly due to large mudstone clast which do not have great adverse effect on reservoir quality. The abundance of micro-pores in dissolved grains present in all samples are micro-pore kaolinite ghost-grains filling voids previously accumulated by feldspar and mostly surrounded by microporous clay which contribute less to permeability (micro-pore in clays also has similar effect). Samples with mostly grain-sized pores (only from the west samples) have the highest permeability. Dissolution porosity in poikilotopic calcite (with the highest number of samples from the east) has the lowest estimated permeability.
Smectites, illites and chlorites are sensitive and swelling clays, especially in the presence of fresh water, thus reducing permeability. The degree of its swelling tendency is based on which crystal lattice cation is exchanged. For example, when a calcium ion (Ca2+) is exchanged, a little molecule of thickness of a well-ordered layer of water is adsorbed by the clay. In the case of sodium ion (Na+), disordered layers of water are adsorbed, leading to an indefinite swelling of the clay [2,25,49]. Fragmentation of smectite or mixed-layer smectite and illite occurs when the clays swell. This may lead to further migration of minute particles within the reservoir, leading to further damage. Kaolinites are loose and relatively large particles (twelve microns in length and seven in width) [25]. Kaolinites are susceptible to detachment from pore walls at higher turbulence or flow rates. kaolinites plates gain freely migrating tendencies towards pore throats, lodging and acting as check valves. This may lead to impairment of flow capacity, leading to poor reservoir performance.
Authigenic clays significantly impact fluid flow. Authigenic clays dominantly occur in sandstones as pore-filling discrete clay particles, pore-lining clay (non-grain contact bridging) and pore-bridging clays. These clay occurrences are all present in FWU. Pore-bridging clays, as studied by [50], have greater adverse effects by reducing the flow capacity of reservoirs. Kaolinites are mostly identified as discrete particles. Chlorite and smectite are pore-lining clays. Illite, smectite and mixed layers of illites-smectites are described as the most common pore-bridging clay due to their hair-like fibrous projection which bridges pore-space and hence reduces permeability. Clays have large surface area to volume ratios as a result of small particle sizes and crystal structures. Also, they have an efficient cation-exchange capacity (C2+, Mg2+, H+, NH4+, Na+), hence they are chemically very reactive. Prevalent clay issues in reservoirs are: fines migration (kaolinite and illite), mixed-layer clay and smectite sensitivity to water, occurrence of microporosity (smectite, illite and mixed clays) and chlorite and mixed-layer clay sensitivity to acid.
Pre/post-flooding estimated porosities are similar on the east, but there is a 2% increment in percentile values in post-flooded samples on the west. However, there is a wide range of differences between permeability values on the two sides pre/post-flooding. Maximum permeability on the west is approximately 400 md and 780 md before and after flooding, respectively. On the east, maximum permeability is approximately 30 md and 23.4 md (from Morrow B1 samples). A general trend noticed is the increment in permeability in post-flooding samples on the west; and in reverse, a decrease in samples from the east.
Migration of dislocated fines as a result of flow—or in worse cases, high flow rates—which are not able to move through pore throats leads to plugging. The presence of abundant water-sensitive clays exposed to low-saline water may lead to swelling, causing reduction in reservoir quality. These, together with other factors, are possible causes of the pre/post-permeability and porosity differences on both sides. High permeability has the ability to allow fines to easily move through the reservoir and to production wells without plugging pore throats, hence leading to a relative increase in storage and flow capacities. ELAN analysis clearly confirms the distinct differences in reservoir quality.
Analysis of pore throats and its implementation on the storage and flow capacity of FWU was also conducted for pre/post-flooding samples. Pore throats are described based on sizes ranging from lowest (micro) to largest (mega) (Figure 15). The east recorded approximately 82% of samples in the lowest rank, with the remaining estimated around the low macro range for samples prior to flooding. With approximately 57% of the west samples around the mega range, this further confirms the high permeability and better reservoir quality. Post-flooded samples further saw an increment in samples recorded in the micro range for the east (91% of samples), indicating further deterioration/reduction in pore throat aperture radius. The maximum pore aperture radius reduced from 4.4 microns to 2.97 microns, with average values from 1.2 microns to 0.74 micron. This may reduce permeability and impede flow considering the average size of a clay particle (e.g., kaolinite is twelve microns in length and seven in width).
Zonation of FWU into HFUs based on permeability and porosity relations with respect to pore distribution elucidated more insight into the types of flow units most dominant in each section of the field: HFU-1 (poor flow characteristics) to HFU-8 (excellent flow characteristics). HFU-8 to HFU-6 (pre-flooding) are the most dominant on the west, representing excellent storage and flow characteristics in contrast to the east, where HFU-1 to HFU-3 represent the most predominant flow units. Post-flooding analysis saw a greater decrease in flow capacity as much of the samples from the east were categorized into HFU-1 and HFU-2. FWU is, thus, a very heterogeneous reservoir.
The variability of reservoir properties was further assessed to verify the uniformity in the distribution of these properties, especially storage and flow properties. Heterogeneous rock analysis indicated a much more uniform distribution on the west wells as compared to the wide range of variability in the east. This, coupled with poor reservoir quality, may lead to poor flow performances and worse in cases where there is further chemical or physical alteration when an injected fluid (freshwater) is flooded as in the case of FWU.
Porosity for both sections is relatively similar across FWU. The east has an average pay thickness of approximately 54 ft and west 24 ft. Thus, it is not surprising that the east had a higher HIIP estimate of 53% and higher primary recovery as against the west’s 47% of the total field HIIP. However, waterflooding performance was poor on the east section, which should not be surprising at this point based on the discussions so far.
Injected water was from a nearby river (freshwater which has the susceptibility to cause incompatibility issues). There is a huge disparity between injector wells brought on at the start of flooding and wells brought on after some years of flooding. Earlier wells had very good injectivity, while later wells had poor to no volumes injected. A drastic reduction in injectivity is also seen in best-performing injectors after some years of injection. Bubble map analysis of the field and injection data confirmed this series of events. It also revealed areas (Figure 20, circles with smallest radius) of the field where flooding performance and injectivity were poor.
The east wells are reported to have a wider interval of perforations as compared to those in the west. This is not surprising due to the higher average reservoir thickness in the east. This allows for production through a wider face and at high rates. Analysis shows the east has higher water-sensitive clays, particularly montmorillonite-contained clays, e.g., chlorites. In addition, both sides of the field have abundant kaolinite and this is a very problematic clay in production wells due to its susceptibility to migration within the reservoir, especially during turbulence induced by high flow rates. This may lead to the plugging of pore throats. Loose fine migrations from other minerals such as muscovites, quartz and feldspars might also impair permeability. A mobile water phase may cause fines (mostly water wet and entrapped by film of connate water) to move. Inability of fines to move through the reservoir leads to fines accumulating at pore throats, plugging and impairing permeability.

5.2. Inefficiency of Waterflooding (East of FWU)

Waterflooding failure or inefficiency has been observed globally in several fields [12,51,52,53,54,55]. The causes are mostly unique to each reservoir due to variable reservoir characteristics. Generally, injection inefficiency (injectivity issues) tied mostly to the quality of water injected is reported as one of the major causes of decline in water injection performance. However, there are various factors from water quality to inherent reservoir properties that can lead to failure as explored in this study.
Waterflood inefficiency on the east of FWU from this study can be concluded to have been mainly caused by the presence of abundant dispersed authigenic clays and by poor reservoir engineering, exacerbated by the poor reservoir quality, high heterogeneity and flooding with freshwater in the reservoir. Figure 23 breaks down both internal and external mechanisms leading to the various causes of failure and inefficiency in waterflooding on the east.
One major factor that led to the inefficiency of FWU-east is injectivity issues. This occurred over a period of time based on the analysis conducted so far. This was in part caused by incompatibility between injected water (freshwater) and reservoir formation (high saline connate water and relatively higher troublesome clay content) coupled with poor reservoir quality. Though FWU is a heterogeneous reservoir, the east side is relatively highly heterogeneous and poor reservoir quality, thus escalating the failure mechanisms of waterflood.
As is well established, the east is characterized by poor reservoir qualities, consisting of very low permeabilities, a high percentage of micro-pore throat aperture, and poor HFUs (HFU_1-HFU_3). This put together creates a great resistance to flow (reduces flow capacity) in its original state. This is a possible reason for high injection pressures/flow rates. With abundant sensitive and migratory clays, as well as other dislocated fines from non-clay minerals, the reservoir was highly susceptible to a lot of impairments, especially flooding with very low saline water (freshwater). This was the case for FWU-east.
As explained in earlier sections, clays such as smectite, illites, and chlorites are sensitive swelling clays. Kaolinite, which is the most abundant clay by weight fraction of whole rock, is a migratory clay. These clays swell and migrate when in contact with fresh water. Swelling clays at pore throats constrict or completely block east pore aperture-restricting fluid flow. Migratory fines which are not able to move from one pore to the other end up plugging pore throats. And from the analysis, the east consists of most of the micro-pores (approximately 0.65 microns) and kaolinites have a particle size up to approximately twelve microns in length and seven in width microns. This made it easy for pores to be plugged, serving as ‘check valves’ and decreasing permeability and hence injectivity issues, leading to inefficiency/failure in flooding on the east section. This happened over a period of time and can be deduced from the post-analysis of pore aperture, permeability, and HFUs. Injectivity issues surfaced immensely from 1972 onwards. These are the wells categorized as later injectors. Injectivity was so poor (especially from 1982) that injection volumes estimated were nearly zero.
FWU-east is characterized by low-quality HFUs and the high heterogeneity caused inefficiency in water injection. The east well investigated through HRA shows non-uniformity in the distribution of already low-quality reservoir properties. This may have caused more disturbance at the injection phase as well as in the reservoir, leading to injectivity and sweep deficiencies in contrast to the west. HFUs and HRA analysis are current analyses conducted for FWU and, from integrating previous data, indicate injection perforation strategies were undertaken regardless of HFUs and HRA (which factors in reservoir rock types). For a very non-uniform layered reservoir/wellbore interval, high injection performance will be attributed to sequences with selectively good quality. From HRA and HFU analysis, the bottom part of the reservoir has relatively good quality, and will thus contribute more to injection than upper part. This may force oil to move up creating disturbance and causing poor sweep of the oil to move horizontally to production wells, hence, a major contributory factor to the unsuccessful waterflood on the east section. Quality HFUs with much uniform distribution in contrast to the east are present on the west, which contributes to the high water injection performance. Though there are no data on the perforation strategy for this study, and with the absence of detailed HFUs and HRA studies, this indicates imperfect injection and production perforation might have been performed. However, the good-quality reservoir parameters in the west limited the adverse impact on waterflooding.
The decrease in reservoir quality can further be inferred from [56]. Approximately five crude-brine relative permeability curves were generated from a coreflood experiment for five cores from FWU representing 5 HFUs (HFU_1 to HFU_5). For 2-phase crude-brine flow, an increment in brine saturation in pore leads to a greater force of resistance to oil flow. HFU_5 is characterized by a connection of macro-pores with minimal clay. The experiment records HFU_5 as having the highest water saturation, with an irreducible oil saturation (Sor) of 0.169 and an irreducible water saturation (Sw,irr) of 0.201. However, HFU_4, which has less connected macro-pores with high clay, recorded a decrease in saturation with a high Sor (0.241) and Sw,irr (0.334). This was basically due to the high clay content, less connectivity and higher heterogeneous capillary system in HFU_4. Comparing higher HFUs to lower HFUs depicted a similar trend.
Wettability plays a pivotal role in the efficiency of waterflooding, where non-water wetting (hydro-phobic) reservoirs have less efficiency as compared to high-wetting (hydrophilic) reservoirs. However, FWU cores exhibit a transient wettability [56]. FWU wettability changes with respect to which fluid it has prolong exposure to. Contact angle measurements conducted on FWU rock samples exhibited strong water-wet wettability after flooding with brine. The core wettability shifted to mildly oil-wet when flooded with oil. After displacing the oil with brine, the wettability changed to mildly water-wet, which indicates that the extensive waterflood activity on the field altered the wettability of FWU to water wet, which is advantageous to efficient flooding. Thus, wettability issues can be ruled out as a factor for flooding failure/inefficiency.
The key players in FWU-east’s waterflood inefficiency are poor reservoir quality, flooding with freshwater and high injection rates/transient pressure, which escalated the adverse effect of sensitive and migratory clays. Reservoir engineering issues ranging from inadequate perforation strategy due to the absence of detailed HFUs and rock typing, random placement of injectors and poor quality of injected water constitute other external factors/mechanisms that contributed to inefficiencies. Had well reservoir characterization and fluid–fluid and fluid–rock interaction studies been conducted, much of these challenges could have been prevented or minimized.

5.3. Conclusions

Two sections (east and west) of the same reservoir (FWU) had generally similar lithostratigraphic and geological settings but were quite different in many reservoir properties. Primary production was quite prolific on the east section of the reservoir as compared to the west. The east unit also estimated a higher percentage of HIIP. However, secondary recovery (waterflooding) took a different turn. The east section suffered from poor to low recovery to injectivity issues, rendering waterflood inefficient. The mechanism at play leading to the unsuccessfulness of secondary recovery on the east section sets the main aim of this study. Unravelling these factors can lay the foundation for understanding the field and what improved recovery techniques can be administered for incremental recovery. The west, due to its secondary recovery success, is currently under CO2-EOR tertiary recovery.
Geological, petrophysical and reservoir engineering data and history were integrated, reviewed and analyzed to assess the possible mechanisms of flooding inefficiency. The disparity in the properties is attributed to diagenetic processes. The most prevailing processes were the formation of authigenic clays (dispersed), cementation, and dissolutions. Kaolinites (migratory) are the most abundant clay in FWU and relatively equal on both sides. Smectite, chlorite, illite (mostly water sensitive and swelling) are quite higher on the east section. FWU is noted to be highly heterogeneous, with multiple rock typing, pore network, capillarity and HFUs. The east section records the poorest reservoir quality on all counts. And being flooded with freshwater (low saline with minimal cations) and poor engineering strategies, impairment of reservoir quality as a result of clay swelling and migration escalated. The results from pre/post-flooding analysis are linked to the increased deteriorating reservoir properties after flooding. Maximum permeability reduced from 30 md to 23.7 md from the Morrow B1 section of east and the results were worse in Morrow B. The percentage of micro-pore aperture radius increased as well as HFU_1 and HU_2, which are the poorest flow capacities. Injection performance declined, leading to insignificant volumes of water injected. This is attributed to injectivity issues as a result of the aforementioned mechanisms as well as inadequate perforation strategy, which did not factor in full understanding of HFUs and rock typing analysis as reviewed in this study. Hence, the inefficient waterflood on the east is caused by injectivity issues and an increased impairment of reservoir quality mechanized by much poorer reservoir quality, heterogeneity, high clay content and poor engineering decisions and strategies.
A detailed understanding of the reservoir through accurate characterization and engineering planning is very necessary for the execution of a successful and efficient waterflood, especially in a heterogeneous reservoir. Reservoir rock typing, formation’s mineralogical compositions, HFUs, injection water quality and composition (salinity), injection pattern/well placement are critical considerations to an efficient waterflood implementation. Effective measures for treating or preventing migration of clays include the use of clay stabilizers (acidizing with fluoroboric acid in the early history of the reservoir) [14,57,58]. Perforating slightly with an under-balance strategy and subsequently maximizing perforation slowly, rates must be slowly maximized and must be below critical velocity [59,60]. Swelling/clay sensitive issues associated with chlorite-smectite, smectite, illite-smectite, etc., can also be avoided/minimized by the use of potassium chlorite, potassium ammonium chloride and calcium chloride.

5.4. Recommendations

The east side, since its inefficient waterflood, has not been explored much further, as compared to the west, which has a ton of research and publications due to its success and high potential for tertiary recovery success. This work based on limited data has tried to unravel the possible causes of failure in the east. However, a much greater experimental analysis (core flood, SEM, thin-section analysis, etc.) strictly geared towards waterflood processes can provide more detailed information. Understanding the performance of waterflood at a field scale through advanced numerical simulation models and machine learning applications should also be a priority. Experimental and numerical simulation can provide a detailed and broader perspective of the FWU-east section, hence providing the basis on which an improved recovery technique can be employed. The performance of these new techniques can also be predicted using these tools. In very low permeable and tight formations, vertical single wells usually have a very low productivity index. It is, therefore, recommended that horizontal wells and hydraulic fracturing technologies are explored since they are widely employed to increase the productivity index.

Author Contributions

Conceptualization, W.A. and R.G.; methodology, A.M., R.C. and S.W.; software, A.M. and W.A.; validation, A.M., R.G., W.A., R.C. and S.W.; formal analysis, A.M. and W.A.; resources, W.A. and R.G.; writing—original draft preparation, A.M. and W.A.; writing—review and editing, R.G., W.A., R.C. and S.W.; visualization, A.M.; supervision, W.A. and R.G.; project administration, W.A.; funding acquisition, W.A. All authors have read and agreed to the published version of the manuscript.

Funding

Funding for this project is provided by the U.S. Department of Energy’s (DOE) National Energy Technology Laboratory (NETL) through the Southwest Regional Partnership on Carbon Sequestration (SWP) under Award No. DE-FC26-05NT42591.

Data Availability Statement

The data presented in this study are available on request from the Petroleum Recovery and Research Center, New Mexico Tech.

Conflicts of Interest

The authors declare no conflict of interest.

Appendix A. Preliminary Analysis and Data Control
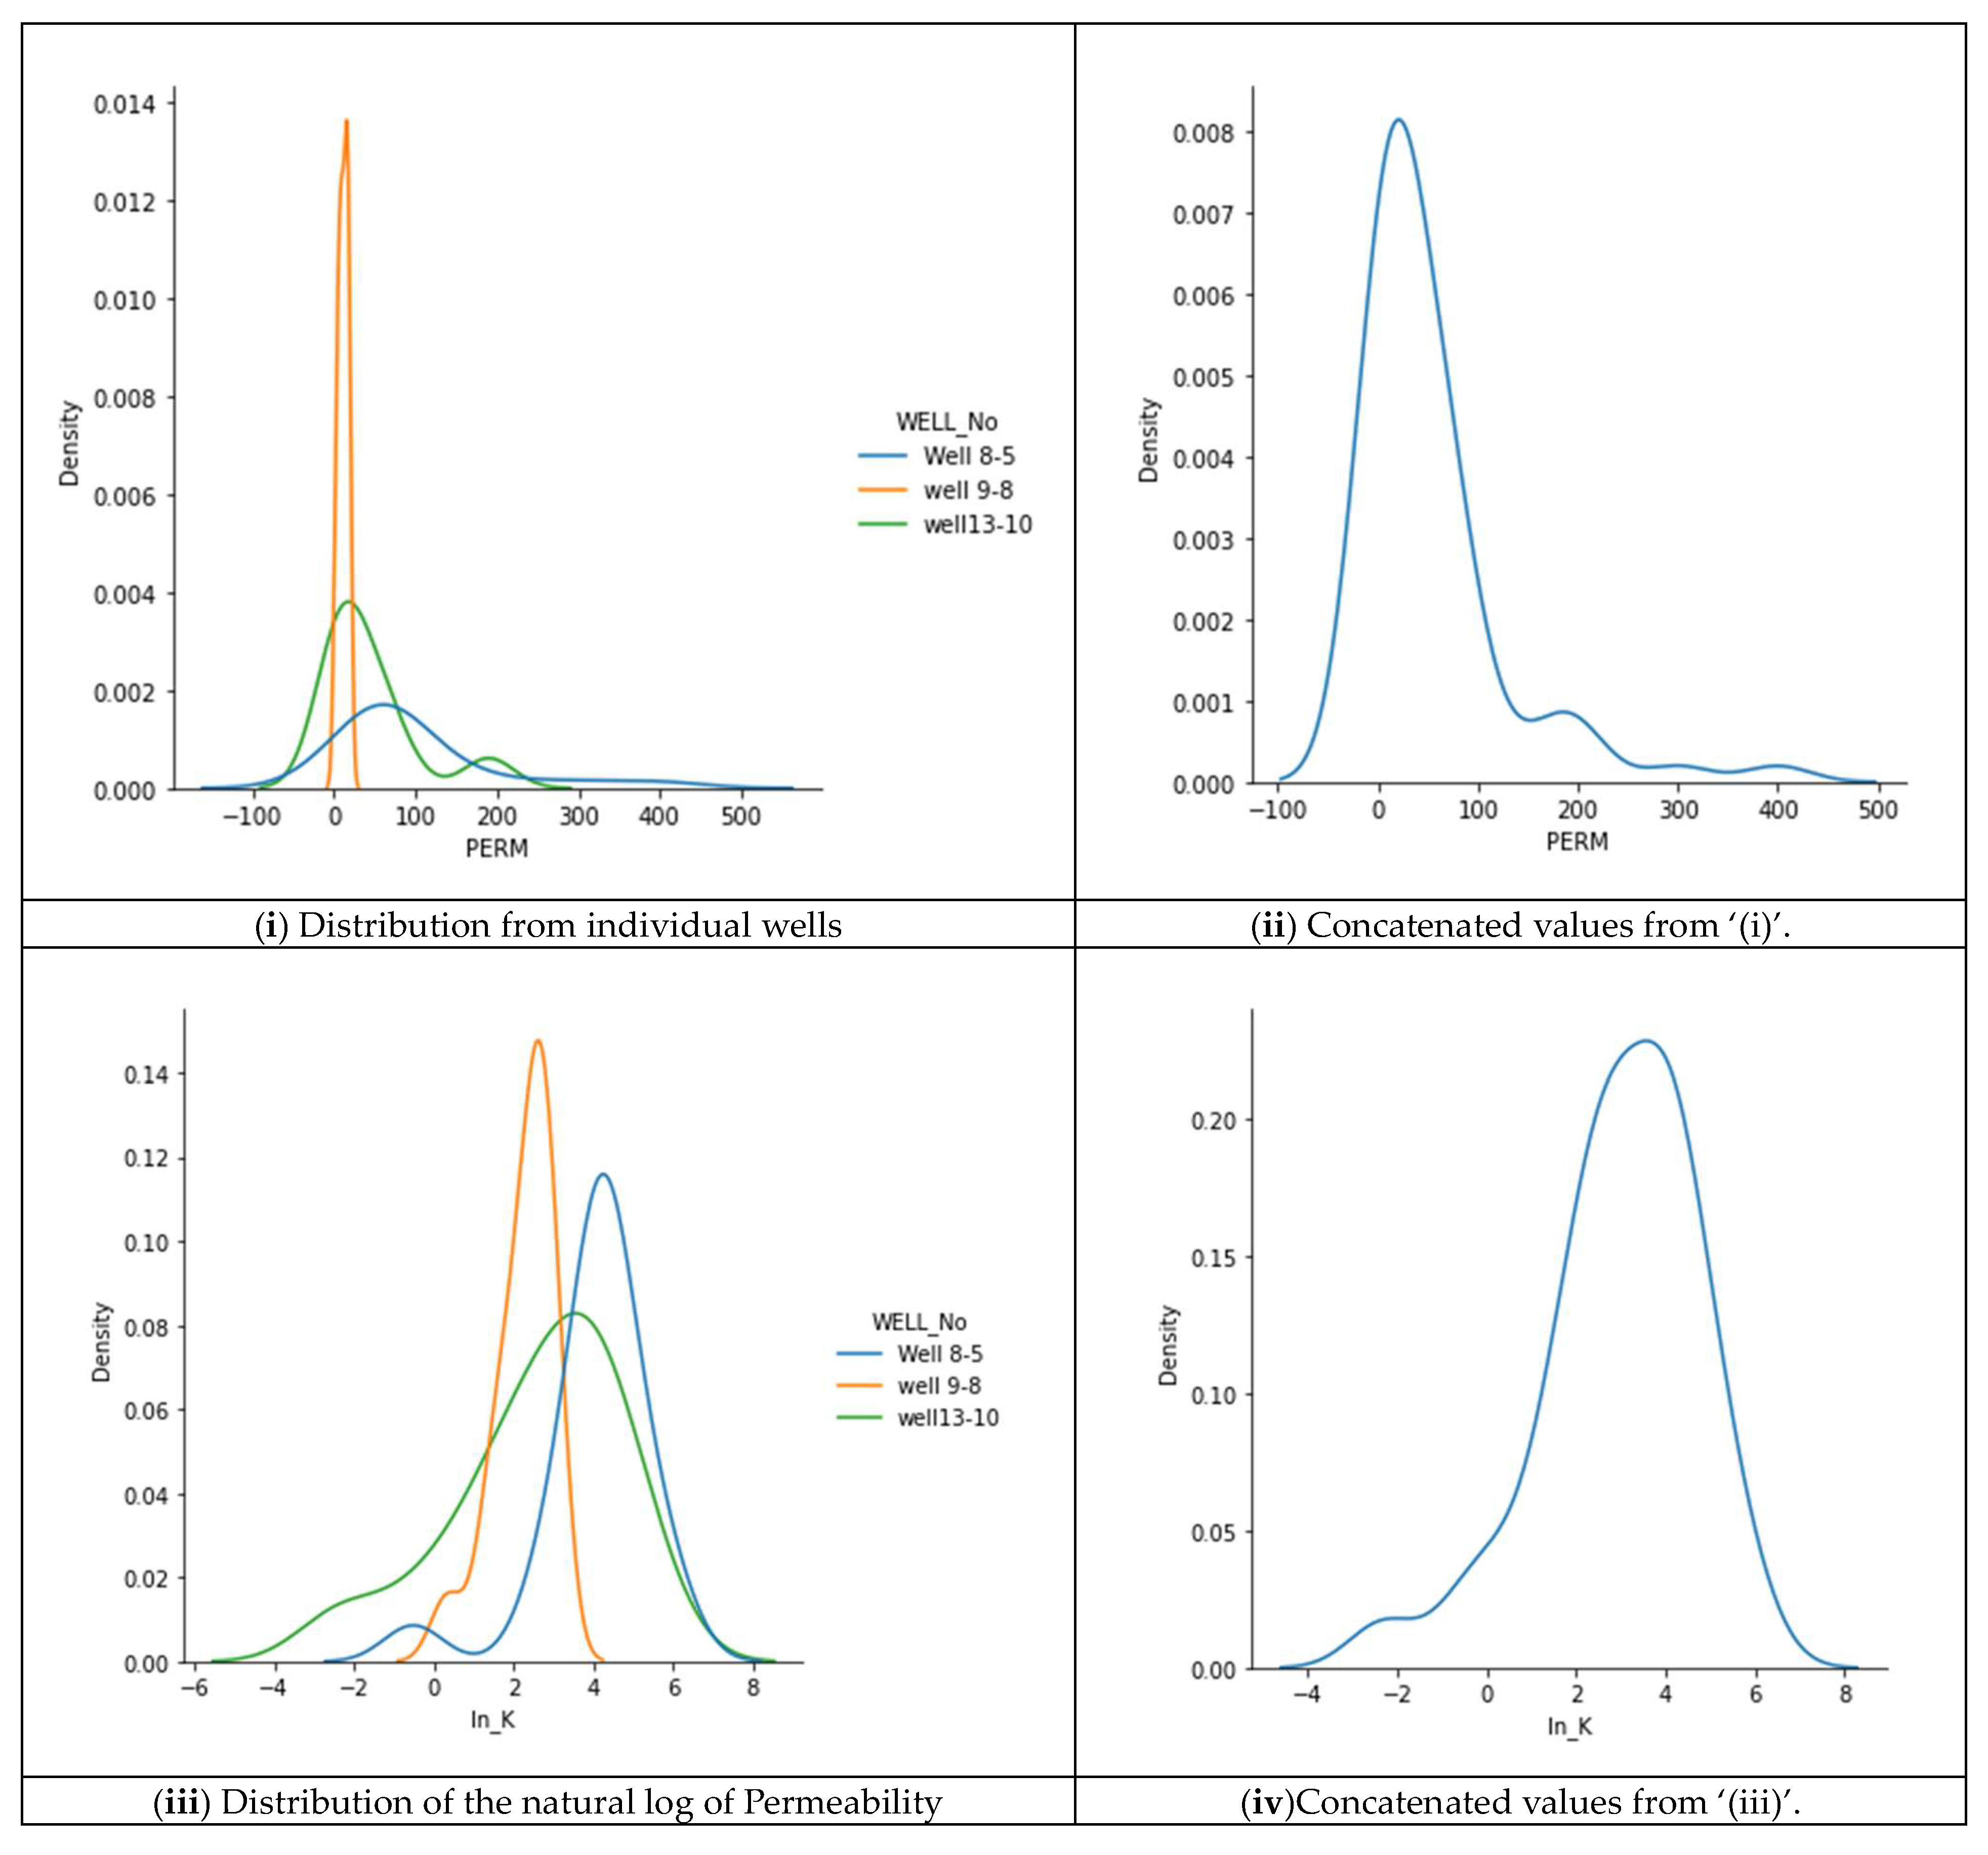
Figure A1. The distribution of the permeability from the core data on the west side of FWU: (i) Indicates lognormal distribution (ii) Concatenated values from ‘(i)’ shows a positive skewness (iii) Natural logarithm of values which approximates a normal distribution (iv) Concatenated values from ‘(iii)’ also shows a normal distribution.
Energies 17 01565 g0a1
Figure A2. The distribution of the permeability from the core data on the east side of FWU: (i) Individual distribution (ii) Concatenated values from ‘(i)’ (iii) Natural logarithm of values demonstrate bimodal distribution (iv) Concatenated values from ‘(iii)’ also shows bimodal distribution, an indication of two distinct data sources (or layers).
Energies 17 01565 g0a2
Figure A3. A joint plot showing the relationship between the natural log of permeability and porosity from the core samples: (i) Bivariate analysis on the west side with approximately normal distribution. (ii) Bivariate analysis on east side, with data from well 32-6 showing two peaks. An indication of two distinct layers or higher variation in porosity and permeability within the well intervals. (iii) and (iv) are summary of the bivariate analysis for west and east sides respectively, showing the scatter and nature of distributions for porosity and permeability.
Energies 17 01565 g0a3
Figure A4. The elbow method for west section. ‘(i)’ shows the maximum clusters within the west reservoir as indicated by the sharp bends, and ‘(ii)’ displaces the different clusters within the west reservoir as indicated by the sharp bends.
Energies 17 01565 g0a4
Figure A5. The elbow method for east section. ‘(i)’ shows the maximum clusters within the east reservoir as indicated by the sharp bends, and ‘(ii)’ displaces the different clusters within the east reservoir as indicated by the sharp bends.
Energies 17 01565 g0a5
Figure A6. Silhouette property analysis for west side: (i) Silhouette analysis for K-Means clustering with two clusters and its visualization in data points. (ii) Silhouette analysis for K-Means clustering with six clusters and its visualization in data points.
Energies 17 01565 g0a6
Figure A7. Silhouette property analysis for east side. (i) Silhouette analysis for K-Means clustering with two clusters and its visualization in data points. (ii) Silhouette analysis for K-Means clustering with six clusters and its visualization in data points.
Energies 17 01565 g0a7

Appendix B. Elemental and Heterogenous Reservoir Analysis
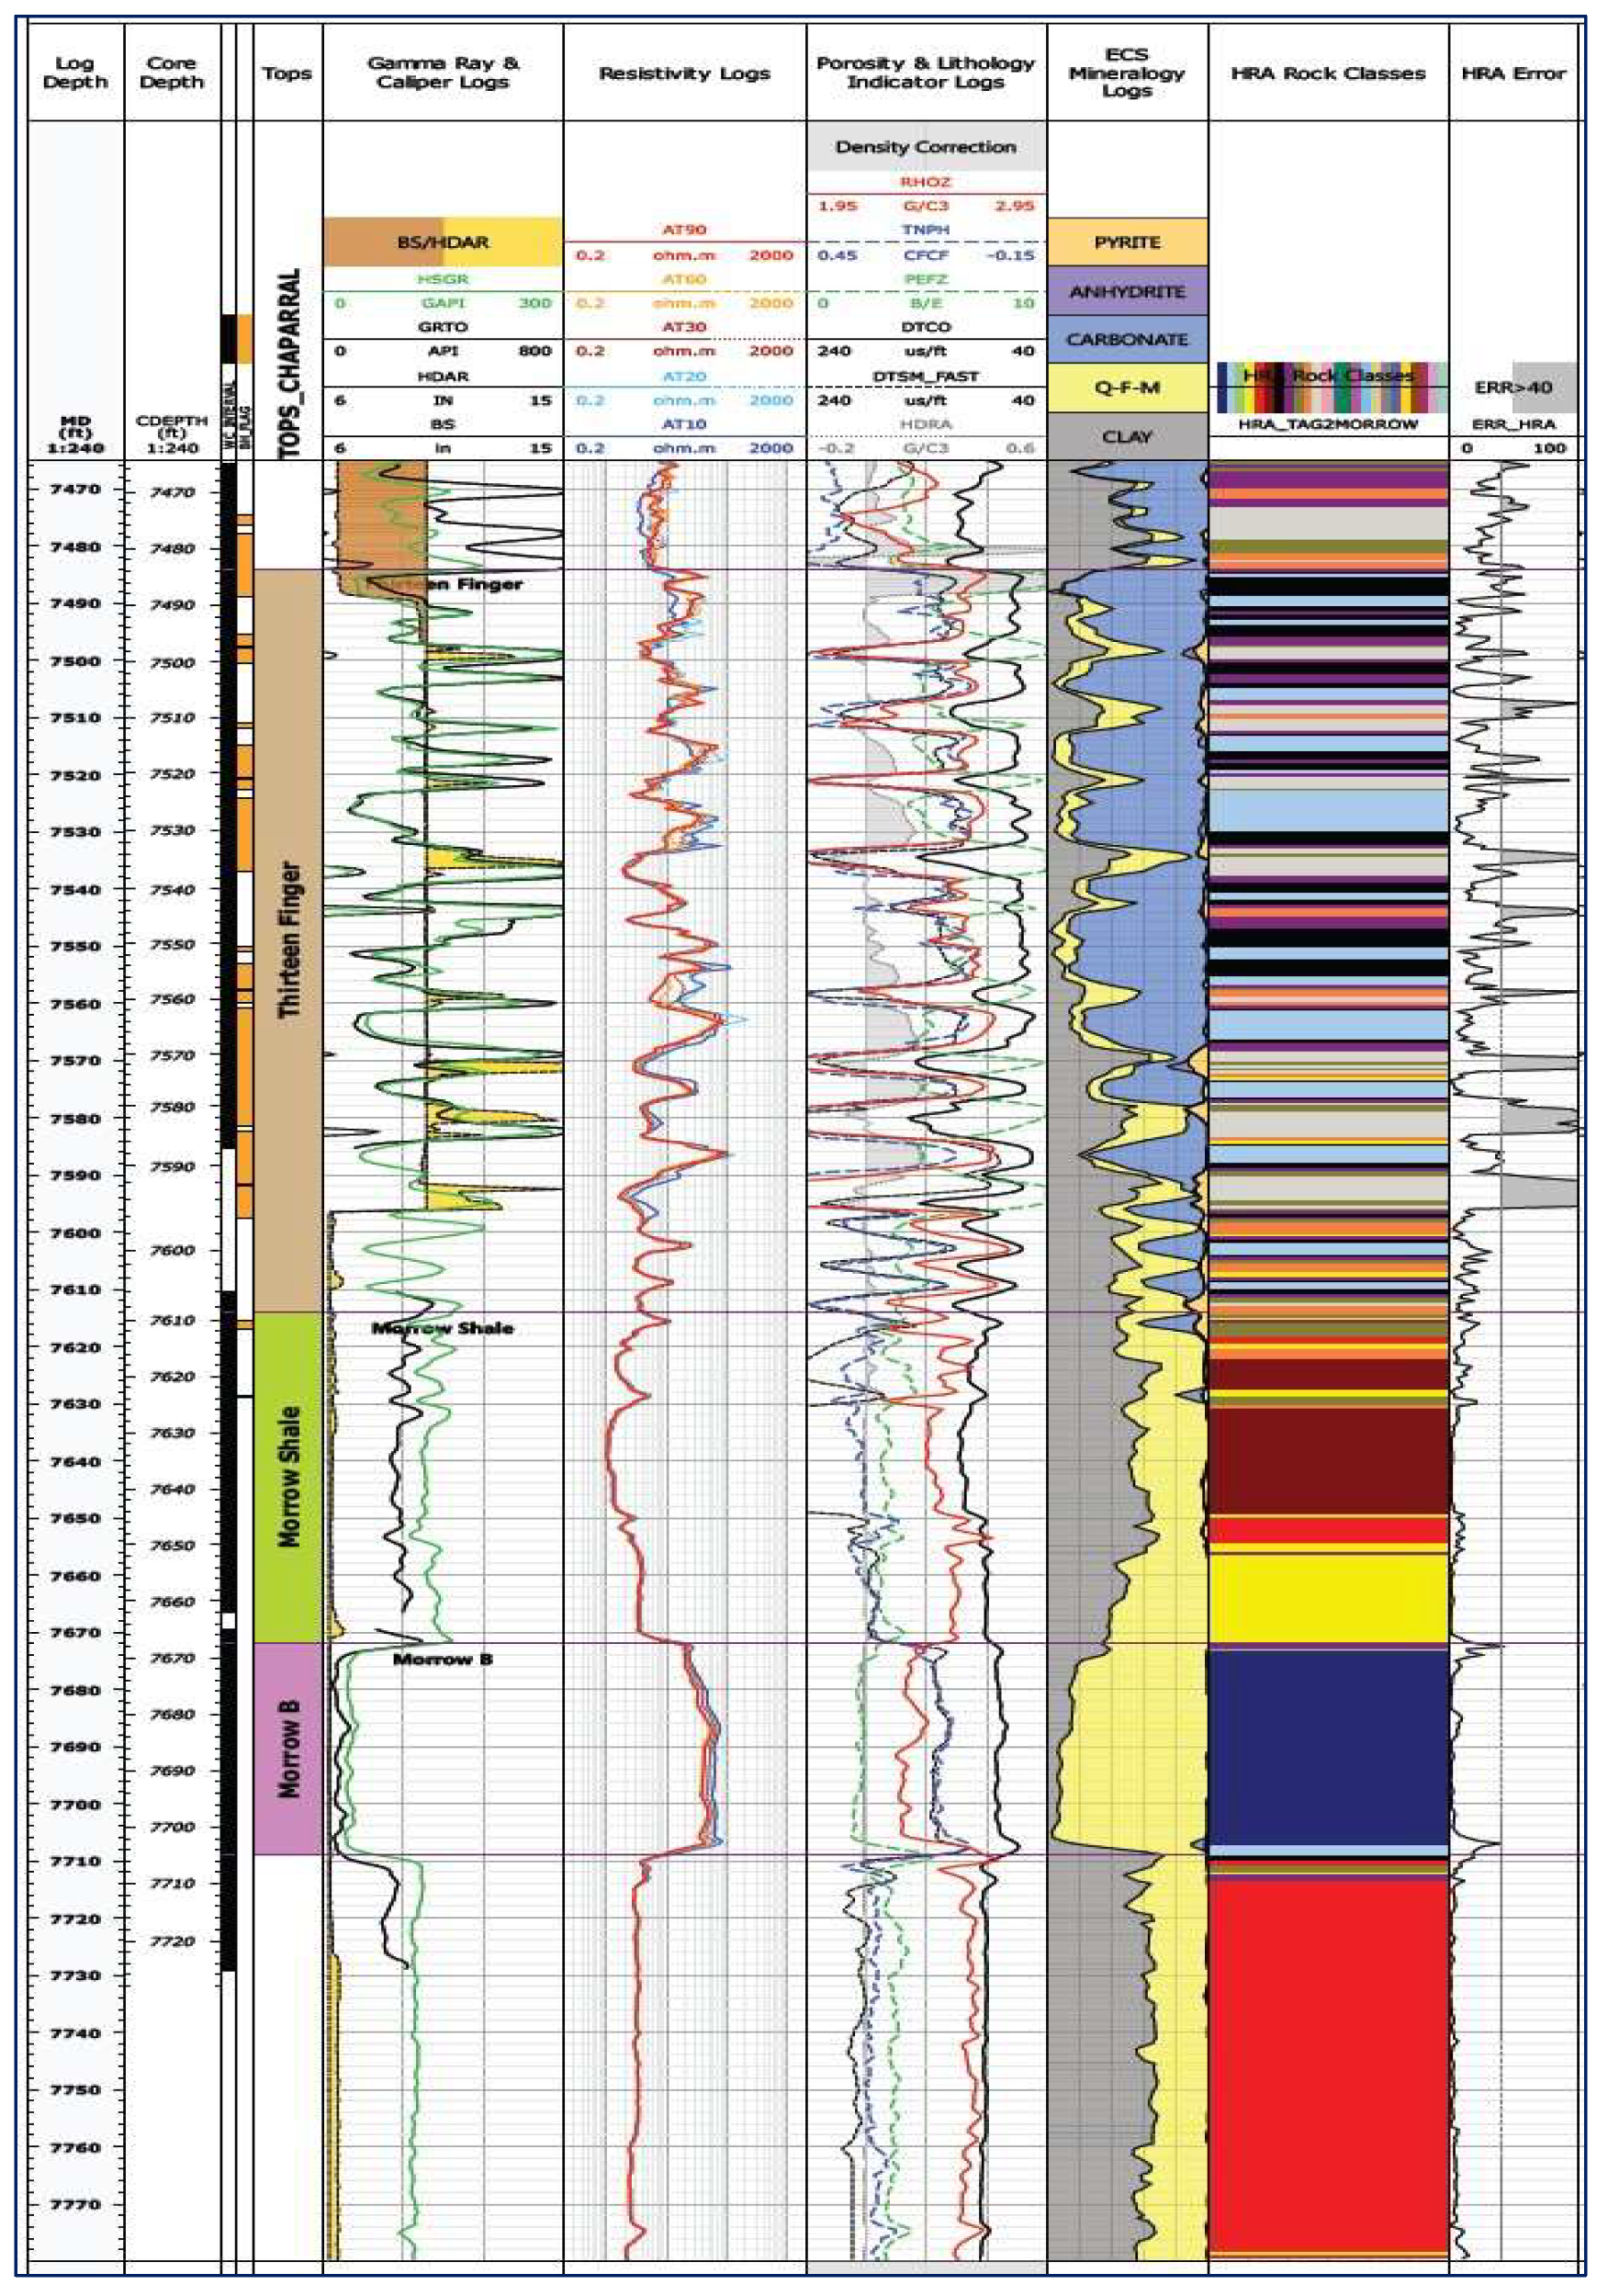
Figure A8. West elemental and HRA analysis. Color codes in HRA track indicates variability in reservoir rock property. For a single continuous color within a layer the less heterogenous and vice versa.
Energies 17 01565 g0a8
Figure A9. East elemental and HRA analysis.
Energies 17 01565 g0a9

Appendix C. Wells and Injection Data Information

Figure A10. Number of production and injection wells per time.
Energies 17 01565 g0a10
Figure A11. Cumulative estimates of injected water volume per well. Orange bars represent early injectors and Blue bars represent late injectors.
Energies 17 01565 g0a11

References

  1. Ahmed, T. Reservoir Engineering Handbook, 5th ed.; Gulf Professional Publishing: Oxford, UK, 2019. [Google Scholar]
  2. Morgan, A.; Akanji, L.; Udoh, T.; Mohammed, S.; Anumah, P.; Kyeremeh, S.J. Fractional Flow Behaviour and Transport Mechanisms During Low salinity and Protein Enzyme Bio-surfactant EOR Flooding. In Proceedings of the SPE Nigeria Annual International Conference and Exhibition, Virtual, 11–13 August 2020; p. D013S009R002. [Google Scholar] [CrossRef]
  3. Baker, R.; Dieva, R.; Jobling, R.; Lok, C. The myths of waterfloods, eor floods and how to optimize real injection schemes. In Proceedings of the SPE Improved Oil Recovery Conference, Tulsa, OK, USA, 11–13 April 2016. [Google Scholar] [CrossRef]
  4. Skauge, A. Low Salinity Flooding—A Critical Review. In Proceedings of the IOR 2013—17th European Symposium on Improved Oil Recovery, Saint Petersburg, Russia, 16–18 April 2013; pp. 16–18. [Google Scholar]
  5. Mwangi, P. An Experimental Study of Surfactant Enhanced Waterflooding. Master’s Thesis, Louisiana State University and Agricultural & Mechanical College, Baton Rouge, LA, USA, 2010; p. 77. [Google Scholar]
  6. Romero, M.I.; Gamage, P.; Jiang, H.; Chopping, C.; Thyne, G. Study of low-salinity waterflooding for single- and two-phase experiments in Berea sandstone cores. J. Pet. Sci. Eng. 2013, 110, 149–154. [Google Scholar] [CrossRef]
  7. Sheng, J.J. Critical review of low-salinity waterflooding. J. Pet. Sci. Eng. 2014, 120, 216–224. [Google Scholar] [CrossRef]
  8. Skauge, A.; Shiran, B.S. Low salinity polymer flooding. In Proceedings of the IOR 2013-17th European Symposium on Improved Oil Recovery, Saint Petersburg, Russia, 16–18 April 2013. [Google Scholar]
  9. Goolsby, J.E.; Neumiller, W.P. Enhanced Recovery from Lower Muddy Fluvial Sandstone Reservoirs of the Northern Powder River Basin, Wyoming. In Proceedings of the SPE/DOE Enhanced Oil Recovery Symposium, Tulsa, OK, USA, 22–24 April 1992; p. SPE-24123-MS. [Google Scholar] [CrossRef]
  10. McDiarmid, A.; Ivor, A.; Ion, A.; Thompson, J. Experience of a Reservoir Waterflood Failure and Remediation Treatment in the Stag Reservoir, Australia. In Proceedings of the SPE Asia Pacific Improved Oil Recovery Conference, Kuala Lumpur, Malaysia, 8–9 October 2001; p. SPE-72117-MS. [Google Scholar] [CrossRef]
  11. Teufel, L.W.; Rhett, D.W. Failure of Chalk During Waterflooding of the Ekofisk Field. In Proceedings of the SPE Annual Technical Conference and Exhibition, Washington, DC, USA, 4–7 October 1992; p. SPE-24911-MS. [Google Scholar] [CrossRef]
  12. Radwan, A.E.; Nabawy, B.S.; Kassem, A.A.; Hussein, W.S. Implementation of Rock Typing on Waterflooding Process During Secondary Recovery in Oil Reservoirs: A Case Study, El Morgan Oil Field, Gulf of Suez, Egypt. Nat. Resour. Res. 2021, 30, 1667–1696. [Google Scholar] [CrossRef]
  13. Tang, G.-Q.; Morrow, N.R. Influence of brine composition and fines migration on crude oil/brine/rock interactions and oil recovery. J. Pet. Sci. Eng. 1999, 24, 99–111. [Google Scholar] [CrossRef]
  14. Yuan, B.; Wood, D.A. Overview of Formation Damage during Improved and Enhanced Oil Recovery; Gulf Professional Publishing: Oxford, UK, 2018. [Google Scholar] [CrossRef]
  15. Hollingworth, R.S.; Leary, R.J.; Heizler, M.T. Detrital U-Pb zircon and 40Ar/39Ar muscovite geochronology from Middle Pennsylvanian strata in the Anadarko Basin, Texas Panhandle, USA. Palaeogeogr. Palaeoclimatol. Palaeoecol. 2021, 579, 110573. [Google Scholar] [CrossRef]
  16. Rascoe, B., Jr.; Adler, F.J. Permo-Carboniferous Hydrocarbon Accumulations, Mid-Continent, U.S.A. Am. Assoc. Pet. Geol. Bull. 1983, 67, 979–1001. [Google Scholar] [CrossRef]
  17. Cather, M.; Rose-Coss, D.; Gallagher, S.; Trujillo, N.; Cather, S.; Hollingworth, R.S.; Mozley, P.; Leary, R.J. Deposition, Diagenesis, and Sequence Stratigraphy of the Pennsylvanian Morrowan and Atokan Intervals at Farnsworth Unit. Energies 2021, 14, 1057. [Google Scholar] [CrossRef]
  18. Ross, C.A.; Ross, J.R.P. Late Paleozoic Transgressive-Regressive Deposition. No. 42, 2012. Available online: https://archives.datapages.com/data/sepm_sp/SP42/Late_Paleozoic_Transgressive-Regressive_Deposition.htm (accessed on 15 March 2023).
  19. Bowen, D.; Weimer, P. Reservoir geology of Nicholas and Liverpool cemetery fields (lower Pennsylvanian), Stanton county, Kansas, and their significance to the regional interpretation of the Morrow Formation incised-valley- fill systems in eastern Colorado and western Kansas. Am. Assoc. Pet. Geol. Bull. 2004, 88, 47–70. [Google Scholar] [CrossRef]
  20. Scotese, C.R.; Boucot, A.J.; McKerrow, W.S. Gondwanan palaeogeography and paloclimatology. J. Afr. Earth Sci. 1999, 28, 99–114. [Google Scholar] [CrossRef]
  21. Domeier, M.; Torsvik, T.H. Plate tectonics in the late Paleozoic. Geosci. Front. 2014, 5, 303–350. [Google Scholar] [CrossRef]
  22. Wengerd, J.W.S.S.A. Pennsylvanian Stratigraphy of Paradox Salt Basin, Four Corners Region, Colorado and Utah. Am. Assoc. Pet. Geol. Bull. 1954, 38, 2157–2199. [Google Scholar] [CrossRef]
  23. Rose-Coss, D. A Refined Depositional Sequence Stratigraphic and Structural Model for the Reservoir and Caprock Intervals at the Farnsworth Unit, Ochiltree County TX. Ph.D. Thesis, New Mexico Institute of Mining and Technology, Socorro, NM, USA, 2017. [Google Scholar]
  24. Gallagher, S.R. Depositional and Diagenetic Controls on Reservoir Heterogeneity: Upper Morrow Sandstone, Farnsworth Unit, Ochiltree County, Texas. Ph.D. Thesis, New Mexico Institute of Mining and Technology, Socorro, NM, USA, 2014. [Google Scholar]
  25. Munson, T.W. Depositional, diagenetic, and production history of the Upper Morrowan Buckhaults Sandstone, Farnsworth Field, Ochiltree County Texas. In Shale Shaker Digest XIII; Oklahoma City Geological Society: Oklahoma City, OK, USA, 1989; Volume 40, pp. 1–19. [Google Scholar]
  26. Swanson, D. Deltaic Deposits in the Pennsylvanian upper Morrow Formation in the Anadarko Basin, in Pennsylvanian sandstones of the mid-continent. Tulsa Geol. Soc. Spec. Publ. 1979, 1, 115–168. [Google Scholar]
  27. Puckette, J.; Al-Shaieb, Z.; Van Evera, E.; Andrews, R.D. Sequence stratigraphy, lithofacies, and reservoir quality, Upper Morrow sandstones, northwestern shelf, Anadarko Basin. In Morrow Springer in the Southern Midcontinent, 2005 Symposium; Circular 111; Oklahoma Geological Survey: Norman, OK, USA, 2008; pp. 81–97. [Google Scholar]
  28. DeVries, A.A. Sequence Stratigraphy and Micro-Image Analysis of the Upper Morrow Sandstone in the Mustang East Field, Morton County, Kansas. Master’s Thesis, Oklahoma State University, Stillwater, OK, USA, 2005. [Google Scholar]
  29. Sonnenberg, S.A. Tectonic and Sedimentation Model for Morrow Sandstone Deposition, Sorrento Field Area, Denver Basin, Colorado. Mt. Geol. 1985, 22, 180–191. [Google Scholar] [CrossRef]
  30. Sonnenberg, S.A.; Shannon, L.T.; Rader, K.; von Drehle, W.F. Regional Structure and Stratigraphy of the Morrowan Series, Southeast Colorado and Adjacent Areas; Rocky Mountain Association of Geologists: Denver, CO, USA, 1990. [Google Scholar]
  31. Davis, H.G.; Northcutt, R.A.; Johnson, K.S. The greater Anadarko basin: An overview of petroleum exploration and development. In Anadarko Basin Symposium; University of Oklahoma: Norman, OK, USA, 1988; pp. 13–24. [Google Scholar]
  32. Krystinik, L.F.; Blakeney, B.A. Sedimentology of the upper Morrow Formation in eastern Colorado and western Kansas, in Sonnenberg; Rocky Mountain Association of Geologists: Denver, CO, USA, 1990; pp. 37–50. [Google Scholar]
  33. Ampomah, W.; Balch, R.S.; Grigg, R.B.; Will, R.; Dai, Z.; White, M.D. Farnsworth Field CO2-EOR Project: Performance Case History. In Proceedings of the SPE Improved Oil Recovery Conference, Society of Petroleum Engineers, Tulsa, OK, USA, 11–13 April 2016; p. 18. [Google Scholar] [CrossRef]
  34. Miall, A.D. Architectural-Element Analysis: A New Method of Facies Analysis Applied to Fluvial Deposits. In Recognition of Fluvial Depositional Systems and Their Resource Potential; SEPM Society for Sedimentary Geology: Tulsa, OK, USA, 1985. [Google Scholar] [CrossRef]
  35. Kolodzie, S. Analysis of Pore Throat Size and Use of the Waxman-Smits Equation to Determine Ooip in Spindle Field, Colorado. In Proceedings of the SPE Annual Technical Conference and Exhibition, Dallas, TX, USA, 21–24 September 1980. [Google Scholar] [CrossRef]
  36. Shahvar, M.B.; Kharrat, R.; Matin, M. Applying flow zone index approach and artificial neural networks modeling technique for characterizing a heterogeneous carbonate reservoir using dynamic data: Case Study of an Iranian reservoir. In Proceedings of the Trinidad and Tobago Energy Resources Conference, Port of Spain, Trinidad, 27–30 June 2010; Volume 2, pp. 677–690. [Google Scholar] [CrossRef]
  37. Porras, J.C.; Campos, O. Rock Typing: A Key Approach for Petrophysical Characterization and Definition of Flow Units, Santa Barbara Field, Eastern Venezuela Basin. In Proceedings of the SPE Latin American and Caribbean Petroleum Engineering Conference, Buenos Aires, Argentina, 25–28 March 2001. [Google Scholar] [CrossRef]
  38. You, J.; Ampomah, W.; Tu, J.; Morgan, A.; Sun, Q.; Wei, B.; Wang, D. Optimization of Water-Alternating-CO2 Injection Field Operations Using a Machine-Learning-Assisted Workflow. SPE Reserv. Eval. Eng. 2022, 25, 214–231. [Google Scholar] [CrossRef]
  39. Ampomah, W.; Balch, R.S.; Grigg, R.B.; McPherson, B.; Will, R.A.; Lee, S.; Dai, Z.; Pan, F. Co-optimization of CO2-EOR and storage processes in mature oil reservoirs. Greenh. Gases Sci. Technol. 2016, 7, 128–142. [Google Scholar] [CrossRef]
  40. Koray, A.-M.; Bui, D.; Ampomah, W.; Kubi, E.A.; Klumpenhower, J. Application of Machine Learning Optimization Workflow to Improve Oil Recovery. In Proceedings of the SPE Oklahoma City Oil and Gas Symposium, Oklahoma City, OK, USA, 17–19 April 2023; p. D021S003R001. [Google Scholar] [CrossRef]
  41. Takahashi, S.; Kovscek, A.R. Wettability estimation of low-permeability, siliceous shale using surface forces. J. Pet. Sci. Eng. 2010, 75, 33–43. [Google Scholar] [CrossRef]
  42. Soltanian, M.R.; Hajirezaie, S.; Hosseini, S.A.; Dashtian, H.; Amooie, M.A.; Meyal, A.; Ershadnia, R.; Ampomah, W.; Islam, A.; Zhang, X. Multicomponent reactive transport of carbon dioxide in fluvial heterogeneous aquifers. J. Nat. Gas Sci. Eng. 2019, 65, 212–223. [Google Scholar] [CrossRef]
  43. Esfahani, M.R.; Haghighi, M. Wettability evaluation of Iranian carbonate formations. J. Pet. Sci. Eng. 2004, 42, 257–265. [Google Scholar] [CrossRef]
  44. Ampomah, W.; Balch, R.; Cather, M.; Will, R.; Gunda, D.; Dai, Z.; Soltanian, M. Optimum design of CO2 storage and oil recovery under geological uncertainty. Appl. Energy 2017, 195, 80–92. [Google Scholar] [CrossRef]
  45. León-Pabón, J.A.; Mejía-Pilonieta, T.J.; Carrillo-Moreno, L.F.; Buendía-Lombana, H.; Zapata, J.F.; Díaz-Prada, C.A. Experimental comparison for the calculation of rock wettability using the Amott-Harvey method and a new visual method. CTyF Ciencia Tecnol. Future 2014, 5, 5–22. [Google Scholar] [CrossRef]
  46. Trujillo, N.A. Influence of Lithology and Diagenesis on Mechanical and Sealing Properties of the Thirteen Finger Limestone and Upper Morrow Shale, Farnsworth Unit, Ochiltree County, Texas; New Mexico Institute of Mining and Technology: Ann Arbor, MI, USA, 2018. [Google Scholar]
  47. Acheampong, W.A.S.; McMillan, M.; El-Kaseeh, G. Development of a Machine Learning Assisted Framework in Calibrating In-situ Stress Changes Through Time-lapse Vertical Seismic Profiling. In Proceedings of the 16th Greenhouse Gas Control Technologies Conference, Paris, France, 23–24 October 2022. [Google Scholar] [CrossRef]
  48. Ahmed, T. Advanced Reservoir Engineering; Gulf Professional Publishing: Houston, TX, USA, 2005; ISBN 978-0-7506-7733-2. [Google Scholar]
  49. Lee, S.Y.; Webb, K.J.; Collins, I.R.; Lager, A.; Clarke, S.; O’Sullivan, M.; Routh, A.F.; Wang, X. Low Salinity Oil Recovery—Increasing Understanding of the Underlying Mechanisms. In Proceedings of the SPE Improved Oil Recovery Symposium, Tulsa, OK, USA, 24–28 April 2010; Volume 129722, pp. 1–11. [Google Scholar] [CrossRef]
  50. Neasham, J.W. The morphology of dispersed clay in sandstone reservoirs and its effect on sandstone shaliness, pore space and fluid flow properties. In Proceedings of the SPE Annual Fall Technical Conference and Exhibition, Denver, CO, USA, 9–12 October 1977. [Google Scholar] [CrossRef]
  51. Sharma, M.M.; Pang, S.H.; Wennberg, K.E.; Morgenthaler, L.N. Injectivity decline in water-injection wells: An offshore Gulf of Mexico case study. SPE Prod. Facil. 2000, 15, 6–13. [Google Scholar] [CrossRef]
  52. Shutong, P.; Sharma, M.M. A model for predicting injectivity decline in water-injection wells. SPE Form. Eval. 1997, 12, 194–201. [Google Scholar]
  53. Bedrikovetsky, P.G.; Silva, M.J.; Fonseca, R.D.; Silva, M.F.; Siqueira, A.G.; Souza, A.L. Well-history-based prediction of injectivity decline during seawater flooding. In Proceedings of the SPE European Formation Damage Conference, Sheveningen, The Netherlands, 25–27 May 2005. [Google Scholar] [CrossRef]
  54. Nunes, M.; Bedrikovetsky, P.; Newbery, B.; Paiva, R.; Furtado, C.; de Souza, A.L. Theoretical Definition of Formation Damage Zone With Applications to Well Stimulation. J. Energy Resour. Technol. 2010, 132, 033101. [Google Scholar] [CrossRef]
  55. Dambani, S.L.; Blunt, M.J.; Tendo, F.; Lawal, K.A. Analysis of injectivity decline in some offshore water injectors. In Proceedings of the SPE Nigeria Annual International Conference and Exhibition, Lagos, Nigeria, 5–7 August 2014; p. SPE-172469-MS. [Google Scholar]
  56. Rasmussen, L.; Fan, T.; Rinehart, A.; Luhmann, A.; Ampomah, W.; Dewers, T.; Heath, J.; Cather, M.; Grigg, R. Carbon Storage and Enhanced Oil Recovery in Pennsylvanian Morrow Formation Clastic Reservoirs: Controls on Oil–Brine and Oil–CO2 Relative Permeability from Diagenetic Heterogeneity and Evolving Wettability. Energies 2019, 12, 3663. [Google Scholar] [CrossRef]
  57. Yuan, B.; Moghanloo, R.G.; Zheng, D. Enhanced oil recovery by combined nanofluid and low salinity water flooding in multi-layer heterogeneous reservoirs. In Proceedings of the SPE Annual Technical Conference and Exhibition; Society of Petroleum Engineers (SPE), Dubai, United Arab Emirates, 26–28 September 2016. [Google Scholar] [CrossRef]
  58. Wei, P.; Pu, W.; Sun, L.; Pu, Y.; Wang, S.; Fang, Z. Oil recovery enhancement in low permeable and severe heterogeneous oil reservoirs via gas and foam flooding. J. Pet. Sci. Eng. 2018, 163, 340–348. [Google Scholar] [CrossRef]
  59. Kalam, S. An empirical Correlation for Water Flooding Performance in a Layered Reservoir. Master’s Thesis, King Fahd University of Petroleum and Minerals, Dhahran, Saudi Arabia, 2016. [Google Scholar]
  60. Kalam, S.; Abu-Khamsin, S.A.; Al-Yousef, H.Y.; Gajbhiye, R. A novel empirical correlation for waterflooding performance prediction in stratified reservoirs using artificial intelligence. Neural Comput. Appl. 2020, 33, 2497–2514. [Google Scholar] [CrossRef]
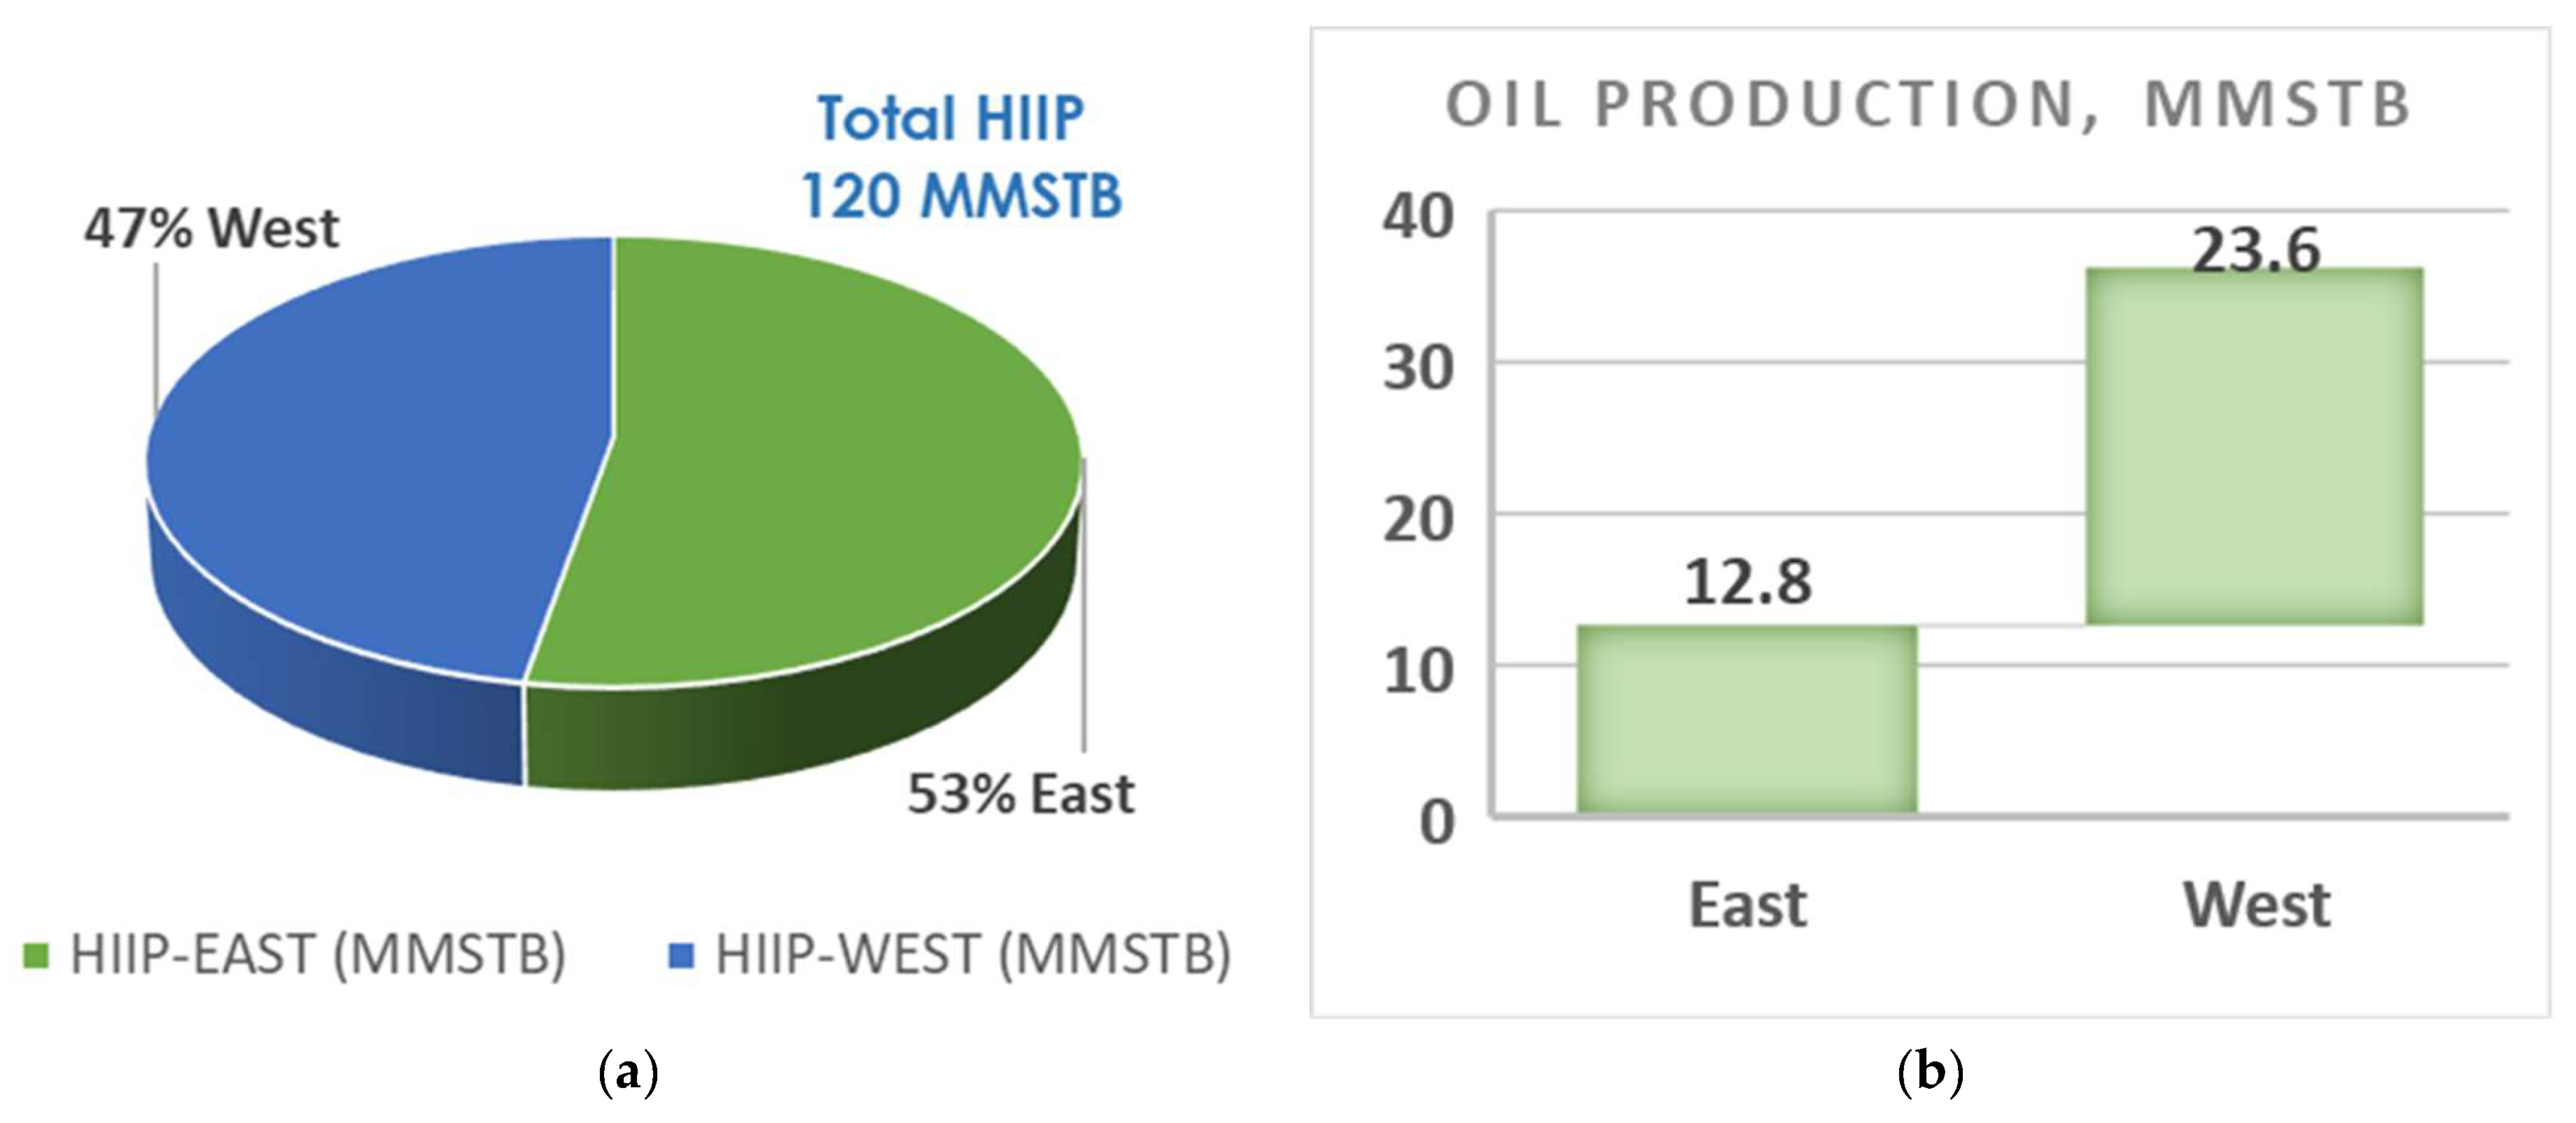
Figure 1. Production history: (a) HIIP and (b) cumulative production after waterflooding in 1985.
Energies 17 01565 g001
Figure 4. SEM/EDS indicating diagenetic features and pore-filling authigenic clays. (A) Pore filled by authigenic clays, as a result of dissolution with later overgrowth of quartz. (B) Pore-filling clays. (C) Authigenic clays typically from the dissolution of feldspar resulting in kaolinites filling intragranular pores. (D) Element mineral identifying pore-filling clays.
Energies 17 01565 g004
Figure 5. Summary of integrated data utilized.
Energies 17 01565 g005
Figure 6. Stratigraphic columns of the three characterization wells.
Energies 17 01565 g006
Figure 7. Predominant lithofacies on the east and west sections of FWU.
Energies 17 01565 g007
Figure 8. Dominance or impact of porosity facies on the west and east of FWU.
Energies 17 01565 g008
Figure 9. Raincloud plots of (A) total clay, percentage of total rock; (B) select point counts data of total cement plus bitumen.
Energies 17 01565 g009
Figure 10. Raincloud plots of XRD data of clay fractions, weight percent.
Energies 17 01565 g010aEnergies 17 01565 g010b
Figure 11. Elemental analysis (west).
Energies 17 01565 g011
Figure 12. Elemental analysis (east).
Energies 17 01565 g012
Figure 13. Porosity before and after waterflood.
Energies 17 01565 g013
Figure 14. Analysis of permeability values on east and west of FWU: (a,b) Permeability before and after waterflood. (c,d) Boxplots of permeabilities of individual wells before and after waterflood.
Energies 17 01565 g014aEnergies 17 01565 g014b
Figure 15. Pore throat aperture radius category for FWU.
Energies 17 01565 g015
Figure 16. Dominance of pore aperture radius distribution with FWU samples: (a) pre–flooding and (b) post–flooding.
Energies 17 01565 g016
Figure 17. Correlation between pore aperture radius and permeability: (a) pre-flooding and (b) post-flooding.
Energies 17 01565 g017
Figure 18. Delineation of FWU into HFUs in relations to pore aperture as a function of permeability and porosity: (a) pre-flooding has seven HFUs with no HFU-5; (b) post-flooding has eight HFUs.
Energies 17 01565 g018aEnergies 17 01565 g018b
Figure 19. Field distribution of reservoir properties: (a) Percentage dominance of HFUs present in Morrow B samples; E, W, A and B, represent the east, west, before and after flooding, respectively. (b) Field HFU distribution map for the east and west sections of FWU. (c) Field permeability distribution map for the east and west sections of FWU. (d) Field porosity distribution map for the east and west sections of FWU. Broken line represents the boundary between west and east sections of FWU.
Energies 17 01565 g019aEnergies 17 01565 g019b
Figure 20. Ionic compositions of (a) formation water, (b) injected water, and (c) produced water.
Energies 17 01565 g020aEnergies 17 01565 g020b
Figure 21. Bubble maps of injection and production history on the FWU-east section indicating (a) performance in injectivity and (b) response through production as in 1982, where the size of the circle (bubble) indicates the volume of (a) water injection or (b) fluid production.
Energies 17 01565 g021
Figure 22. Injection and production history analysis. (a) Injection performance estimated as a ratio of volumes injected to fluids produced. (b) Cumulative production versus cumulative injection.
Energies 17 01565 g022
Figure 23. Summary of mechanisms/causes of flooding failure in FWU-east.
Energies 17 01565 g023
Table 1. Groups of principal clays, species and problems caused in the reservoir [25].
Clay MineralsSpecieProblems
Illite
KAl2(AlSiO)O(OH)2
illitemigratory,
microporosity
Smectite
(0.5Ca, Na)0.7(Al, Mg, Fe)4
[(Si,Al)8O20](OH)4x nH2O
Montmorillonite, sapionite, montronite, hectoritesensitive,
macroporosity
Kaolinite
Al4[Si4O10](OH)8
Kaolinite, nacrite,
hallosite
migratory
Chlorite
(Mg,Fe,Al)6 (Si,Al)4O10(OH)8
Chamosite, greenalite, clinochloresensitive
Mixed-layer claysSmectite-chlorite,
smectite-illite
Sensitive,
microporosity
Table 2. Mineral and clay whole-rock average percentages.
% of Whole Rock
QuartzFeldsparCalciteDolomiteClay
West84.678.441.2205.67
East83.0880.9206.08
Differences1.530.440.3100.42
Table 3. Average clay fraction weight percentages.
Clay Fraction Weight %
SmectiteIlliteChloriteKaolinite
West3.569.223155.67
East4.812.752855.75
Differences0.473.5330.08
Table 4. Porosity boxplot percentiles.
Percentiles BeforePercentiles After
25th50th75th25th50th75th
East12.513.51512.51415
West13.5151715.517.519
Table 5. Permeability boxplot percentiles.
Percentiles BeforePercentiles After
25th50th75th25th50th75th
East0.82.96.80.60.81.5
West820704.427.167.5
Disclaimer/Publisher’s Note: The statements, opinions and data contained in all publications are solely those of the individual author(s) and contributor(s) and not of MDPI and/or the editor(s). MDPI and/or the editor(s) disclaim responsibility for any injury to people or property resulting from any ideas, methods, instructions or products referred to in the content.