Article

Control of Cement Timing, Mineralogy, and Texture on Hydro-chemo-mechanical Coupling from CO2 Injection into Sandstone: A Synthesis

1
Department of Civil & Environmental Engineering, University of Utah, Salt Lake City, UT 84112, USA
2
Energy & Geoscience Institute, University of Utah, Salt Lake City, UT 84108, USA
3
Petroleum Recovery Research Center, New Mexico Tech, Socorro, NM 87801, USA
4
Department of Earth and Environmental Science, New Mexico Tech, Socorro, NM 87801, USA
5
Department of Earth and Environmental Science, Wheaton College, Wheaton, IL 60187, USA
6
Geomechanics, Sandia National Laboratories, Albuquerque, NM 87123, USA
7
Department of Materials Engineering, New Mexico Tech, Socorro, NM 87801, USA
*
Author to whom correspondence should be addressed.
Energies 2023, 16(24), 7949; https://doi.org/10.3390/en16247949
Submission received: 24 October 2023 / Revised: 28 November 2023 / Accepted: 28 November 2023 / Published: 7 December 2023
(This article belongs to the Special Issue Forecasting CO2 Sequestration with Enhanced Oil Recovery II)

Abstract

:
Carbon capture, utilization, and storage (CCUS) has been widely applied to enhance oil recovery (CO2-EOR). A thorough investigation of the impact of injecting CO2 into a heterogeneous reservoir is critical to understanding the overall reservoir robustness and storage performance. We conducted fifteen flow-through tests on Morrow B sandstone that allowed for chemical reactions between a CO2-rich brackish solution and the sandstones, and four creep/flow-through tests that simultaneously allowed for chemical reactions and stress monitoring. From fluid chemistry and X-ray computed tomography, we found that the dissolution of disseminated cements and the precipitation of iron-rich clays did not significantly affect the permeability and geomechanical properties. Minor changes in mechanical properties from Brazilian and creep tests indicated that the matrix structure was well-supported by early diagenetic quartz overgrowth cement and the reservoir’s compaction history at deep burial depths. However, one sample experienced a dissolution of poikilotopic calcite, leading to a permeability increase and significant tensile strength degradation due to pore opening, which overcame the effect of the early diagenetic cements. We concluded that the Morrow B sandstone reservoir is robust for CO2 injection. Most importantly, cement timing, the abundance and texture of reactive minerals, and the reservoir’s burial history are critical in predicting reservoir robustness and storage capacity for CO2 injection.

1. Introduction

Injecting CO2 into the deep subsurface has been extensively studied because it is not only a key technique in CO2-enhanced oil recovery (CO2-EOR) [1,2,3,4] but also an essential element in carbon capture, utilization, and storage (CCUS) to reduce the carbon footprint during renewable and clean energy production (e.g., blue hydrogen production) [5,6,7]. The hydro-chemo-mechanical (HCM) coupling process is a multiphysic phenomenon that involves multiple phases and scales. The HCM process can significantly affect the CO2 storage capacity and the reservoir quality [8,9,10,11,12,13]. Understanding the robustness of CO2 storage sites is critical for research scientists and industry regulators when selecting injection formations. The Morrow B sandstone in the Farnsworth Unit, TX, was actively utilized for petroleum production and is currently a CO2-EOR demonstration site with the Southwest Partnership project and is supported by the Department of Energy [3,4,14,15,16,17,18]. Specifically, HCM experiments associated with the SWP project were focused on the multiphysics within carbonate-cemented sandstone in a single fluid phase at the core scale.
The HCM coupling process in porous media is complex because it causes two simultaneous, competing effects: pore opening and pore closure [13]. Previous studies revealed different mechanisms behind these competing effects. Pore opening can be caused by mineral dissolution, cement degradation, and crack propagation, while pore closure can be caused by secondary precipitation, pressure solution, and stress compaction [19,20,21,22]. Previous works have examined the influence of numerous characteristics in controlling pore space evolution, including the abundance of carbonate, clay, and quartz; mineral surface area; migration of fines; injection rate; injection fluid concentrations, injection fluid temperature, and stress conditions. For example, Rathnaweera et al., (2017) found that carbonate-cemented sandstone experiences more dissolution and pore opening than silicate-cemented sandstone [23]. Carrol et al. (2013) identified the critical role of iron-rich clay minerals in a CO2 storage environment, and the dissolution of iron-rich clay minerals can modify fracture and pore networks by clogging pores via secondary precipitation of Fe carbonates, clays, hydroxides, and amorphous silica [24]. Research found that medium to high reactive surface area minerals in CO2-EOR fields reduce the porosity and enhance the CO2 trapping mechanism [25]. Tutolo et al. (2015) found that the precipitation of aluminum-rich secondary minerals in feldspar-rich sandstone can significantly affect the chemical kinetics and reduce permeability [26]. Pore throat blockage may be introduced by fine migration to significantly decrease permeability, although it causes limited change in porosity [22,27]. A slower injection rate (i.e., high Damköhler number) allows for a longer reaction time and enhances wormhole-type dissolution [13]. Numerical models indicate that the reaction rates are determined by the relevant abundance of elements in the fluid and solid phase [28]. Furthermore, the temperature also controls the competing mechanisms between dissolution and precipitation by affecting the solubility of the minerals [29,30]. As a result, the interplay of timing and rate of different mechanisms yields changes in porosity, permeability, and strength. Tian et al. (2023) found that porosity and permeability initially increase due to the chemical corrosion-dominant stage and then decrease due to the stress-compaction-dominant stage [31]. Rinehart et al. (2016) concluded that cement degradation is the primary mechanism of strength weakening of sandstone [21]. More studies on assessing the reservoir integrity found a reduction in stiffness, strength, and brittleness in carbonate-cemented sandstones and negligible changes or an increase in strength of silica-cemented sandstones and shales [23,32,33].
Among sedimentary rocks, carbonate-cemented sandstone experiences significant impact/alteration from the HCM coupling process, but with a broad range of alterations [22,34]. Many studies in recent years have experimentally investigated the effect of HCM on carbonate-cemented sedimentary rocks. Some studies indicate that the HCM coupling process degrades the strength of carbonate-rich reservoirs [21,32,33,35]. However, Hangx et al. (2013) found no risk of mechanical degradation in calcite-cemented sandstone during the HCM coupling process [36]. It is unclear what caused the broad range of strength alterations in carbonate-rich sandstone from the HCM coupling process, and the degree of the alterations remains ambiguous in carbonate-cemented sandstone. These opposing results imply that the current investigated factors are insufficient to infer the strength sensitivity to CO2 injection, and hidden factors might be overlooked in the HCM coupling process. We hypothesize that cement timing, mineralogy, and texture are controlling factors in the mechanical responses that result from fluid–rock interactions. The effect of diagenesis on HCM coupling requires clarification, and this highly interdisciplinary area lacks a comprehensive assessment of a heterogenous geological formation. To fill this gap, we characterized a series of lithofacies within one reservoir formation and focused on reservoir-scale heterogeneity. Our work is the first to assess the heterogeneous HCM coupling process in multiple rock facies within one geological formation.
To determine if the Morrow B sandstone formation is resistant to HCM coupling process and to examine if diagenesis is one of the primary controllers of the HCM coupling process during CO2 injection, we studied the impact of cement timing, mineralogy, and texture on the robustness and the quality of the heterogeneous sandstone reservoir in geological CO2 storage. Note that the reservoir robustness can be indicated by the strength, and the reservoir quality is reflected by porosity and permeability. Specifically, we quantified the change in porosity, permeability, and mechanical properties of carbonate-cemented sandstones subjected to the HCM coupling process. Our goal was to assess the robustness of the Morrow B sandstone reservoir and understand the resilience level in sedimentary formations under various CO2 injection scenarios.
This paper synthesizes the experimental results for multiple rock facies in Morrow B sandstone described in [37,38,39,40]. The HCM coupling experiments in the SWP project were designed and performed in two stages. Stage I involved flow-through experiments with CO2 under constant in situ stress and temperature. Stage II involved flow-through experiments with CO2 under an elevated constant temperature and time-dependent and increased creep stress to accelerate the HCM coupling dynamics. We used a consistent method and equipment in the laboratory to study the hydraulic and mechanical responses from CO2 injection. This synthesized study benefits field-scale reservoir model development, providing sufficient and detailed input parameters to increase the fidelity of model outputs by including critical and often missing physical processes.

2. Geology Background of Morrow B Sandstone

The Morrow B sandstone is the reservoir interval in the Farnsworth Unit (FWU), located on the northwest shelf of the Anadarko Basin, Ochiltree County, Texas [41]. The FWU is an oil and gas production field and an active geological CO2 storage site for enhanced oil recovery (CO2-EOR). Oil and gas production has occurred at the FWU since 1955, with freshwater injection starting in 1964 for secondary oil recovery. Tertiary CO2-EOR with injecting water alternating gas (WAG) cycles began in 2010 [15]. Since 2013, the Southwest Regional Partnership (SWP) for Carbon Sequestration has injected over one million metric tons of 100% anthropogenic CO2 into the reservoir to increase secondary oil production and demonstrated the long-term effect of CO2 injection [42]. This diverse operational history has caused a unique impact on the reservoir rock’s composition, structure, and strength.
Geologists use the regional incised valley model to explain the depositional history of the Morrow B reservoir [43], which starts with marine mudstone and channel log conglomerates followed by fluvial coarse-grained sandstone and estuarine fine-grained sandstone and eventually back to marine mudstone [42]. This depositional sequence results in fluvial coarse-grained and poorly sorted sandstone becoming the reservoir layer (Morrow B sandstone) with an average thickness of 12.5 m [3], and marine mudstone becoming the caprock layer (lower Morrow shale below, upper Morrow shale and Atokan Thirteen Finger Limestone above) [42]. In addition, the Morrow B reservoir experienced multiple tectonic events, resulting in a complex burial history. The maximum burial of the Morrow B reservoir (approximately 3260 m depth) occurred in the Pennsylvanian [44]. At this time, the reservoir reached its maximum lithostatic stress and the mean effective stress. Later, hydrocarbon maturation increased the pore fluid pressure and thus decreased the reservoir’s mean effective stress [45]. An uplift event during the Laramide Orogeny lifted the Morrow B reservoir by 910 m and caused a release of lithostatic stress [46]. The uplift also decreased the pore fluid pressure by 3–5 fold, attributed to groundwater discharge along a new surface contact [44,45]. Therefore, the burial history, including overpressure and compaction at maximum burial depth, may positively impact the mechanical properties of the Morrow B sandstone.

3. Methods

A variety of core samples collected from the Morrow B sandstone were characterized in detail before and after flow-through and creep/flow-through experiments in order to quantify the changes in microstructure, petrophysics (lithology, porosity, permeability), fluid chemistry, and mechanical properties resulting from CO2-induced fluid–rock interactions under reservoir conditions.

3.1. Core Sample Selection and Preparation

Five rock facies within the Morrow B sandstone were selected from two wells, 13-10A (UTM 14 N, 319,387 m E, 4,015,233 m N) and 13-14 (UTM 14 N, 319,794.05 m E, 4,014,951.93 m N), based on the petrographic analysis [41], petrophysical measurements [42], mercury porosimetry measurements [47], and visual inspection of the borehole core. A previous work divided the Morrow B sandstone into eight hydraulic flow units (HFUs), indicating a porosity–permeability correlation based on the Winland R35 Method, which accounts for the pore throat radius at 35% saturation in a mercury porosimetry test [42]. Among these eight HFUs, five HFUs were implemented in the current reservoir model. Each HFU is dominated by a porosity–permeability correlation and a lithology facies. However, large variations in pore type and lithology still exist within each HFU due to the heterogeneity, causing the overlapping of petrophysical properties between adjacent HFUs [38,41]. The reservoir storage capacity for geological CO2 storage increases with porosity and permeability. Thus, we selected five facies with various HFUs from high to low, indicating the CO2 storage capacity from high to low (Table 1). These five rock facies are cementation-lacking sandstone (MP and Unc), siderite-chlorite-cemented sandstone (Chl), ankerite-siderite-cemented sandstone (ASCS), kaolinite-cemented sandstone (Kao and Cal/Kao), and calcite-cemented sandstone (CCS). The pore type of these five rock facies ranges from intergranular macroporosity-dominated (HFU5) to intergranular microporosity-dominated (HFU3 and 4) to intragranular microporosity-dominated (HFU1).
Three to four core samples from each facies were drilled parallel-to-bedding from the most homogeneous sections of the borehole core and were taken as close to each other as possible. Then, nineteen core samples were trimmed and ground into cylinders with a length-to-diameter ratio of 2:1 (Table 1).

3.2. Sample Characterizations

The rock samples were characterized using petrographic analysis to obtain the diagenetic history and volumetric primary mineral phases and porosity; microprobe analysis to accurately identify the carbonate mineral compositions; volumetric porosity tests to measure porosity; and micro X-ray computed tomography (µCT) scanning to obtain the three-dimensional microstructure, pore connectivity, and dissolution patterns. All characterizations were performed before and after flow-through or creep/flow-through experiments to detect and quantify the changes in petrophysical properties from chemo-mechanical alterations.

3.2.1. Petrography

Petrographic analyses were performed on pre- and post-test thin sections using an Olympus CX31 (Tokyo, Japan) petrographic microscope with photomicrographs captured with a Canon EOS Rebel T2i camera (Oita, Japan). From the photomicrographs, we identified the paragenetic sequence of diagenetic events using cross-cutting relationships and the changes in porosity and mineral compositions (in vol.%) using 500-point count analysis. Pre-test thin sections were cut either from core ends or the rock material adjacent to experimental cores. Post-test thin sections were cut from the post-experimental cores’ upstream and downstream ends. We performed a 500-point count analysis on each thin section using a Pelcon (Ballerup, Denmark) automatic point counter to estimate volumetric percentages of primary phases, such as framework minerals, cement, and porosity, at 1% significance [48]. Each constituent is reported with an estimated proportion and 95% confidence limits. The uncertainty of the 500-point count analysis was statistically quantified to a 95% confidence level [49].

3.2.2. Microprobe Analysis

Qualitative and quantitative microprobe analyses were conducted using carbonate standards on a Cameca SX100 (Madison, WI, USA) electron microprobe. Backscatter electron images and elemental composition of carbonate cements were captured and analyzed under the conditions described previously [38,40]. We used microprobe analysis to accurately differentiate the species of carbonate minerals (calcite, ankerite, and siderite), and to confirm that any chlorite present was iron-rich and thus more reactive. The textures observed in carbonate minerals in the microprobe analysis were then translated to visual petrography point counts.

3.2.3. Porosity

Pre- and post-porosity were measured on all nineteen samples from the saturation test according to the method described in [38]. Core samples were oven-dried at 45 °C and then saturated with water using a Gast 1HAB-25-M100X (Benton Harbor, MI, USA) vacuum pump. The pore volume was converted from the weight difference between water-saturated and dry conditions (mw − md). Porosity, ϕ, was calculated according to
ϕ = m w m d V T · ρ w ,
where VT is the total volume of the core sample, and the ρw is the water density under atmospheric conditions. The standard deviation associated with porosity measurements was ±0.14%.

3.2.4. X-ray Micro-computed Tomography (X-ray μCT)

X-ray μCT imaging was conducted on seven samples (CCS2, CCS3, Chl1, Cal/Kao2, Unc1, Unc2, and Unc3) before and after the CO2 flow-through experiment. The equipment and image post-processing software applied in our study are described in [38,39,40]. Samples CCS2 and CCS3 were scanned along their entire length and diameter at 15 μm voxel resolution. Samples Chl1, Cal/Kao2, Unc1, Unc2, and Unc3 were scanned over their entire length at a 27 μm voxel resolution, with an 11 μm voxel subvolume scans at the upstream end of these samples. Three-dimensional visualizations of the CCS2 and CCS3 core plugs were reconstructed from image stacks using the median filter algorithm to improve the delineation of phase boundaries; the segmentation algorithm to determine porosity; and comparisons of the pre- and post-scans to quantify the change in pore space due to dissolution, precipitation, or clay particle migration. Major image processing steps for Ch1, Cal/Kao2, Unc1, Unc2, and Unc3 included co-registering pre and post datasets for the two imaging resolutions, masking to plug sample or scan boundaries, histogram matching of the pre and post datasets, and comparing pre- and post-test processed images to identify changes in pore structure.

3.3. Hydro-chemo-mechanical (HCM) Coupling Experiments

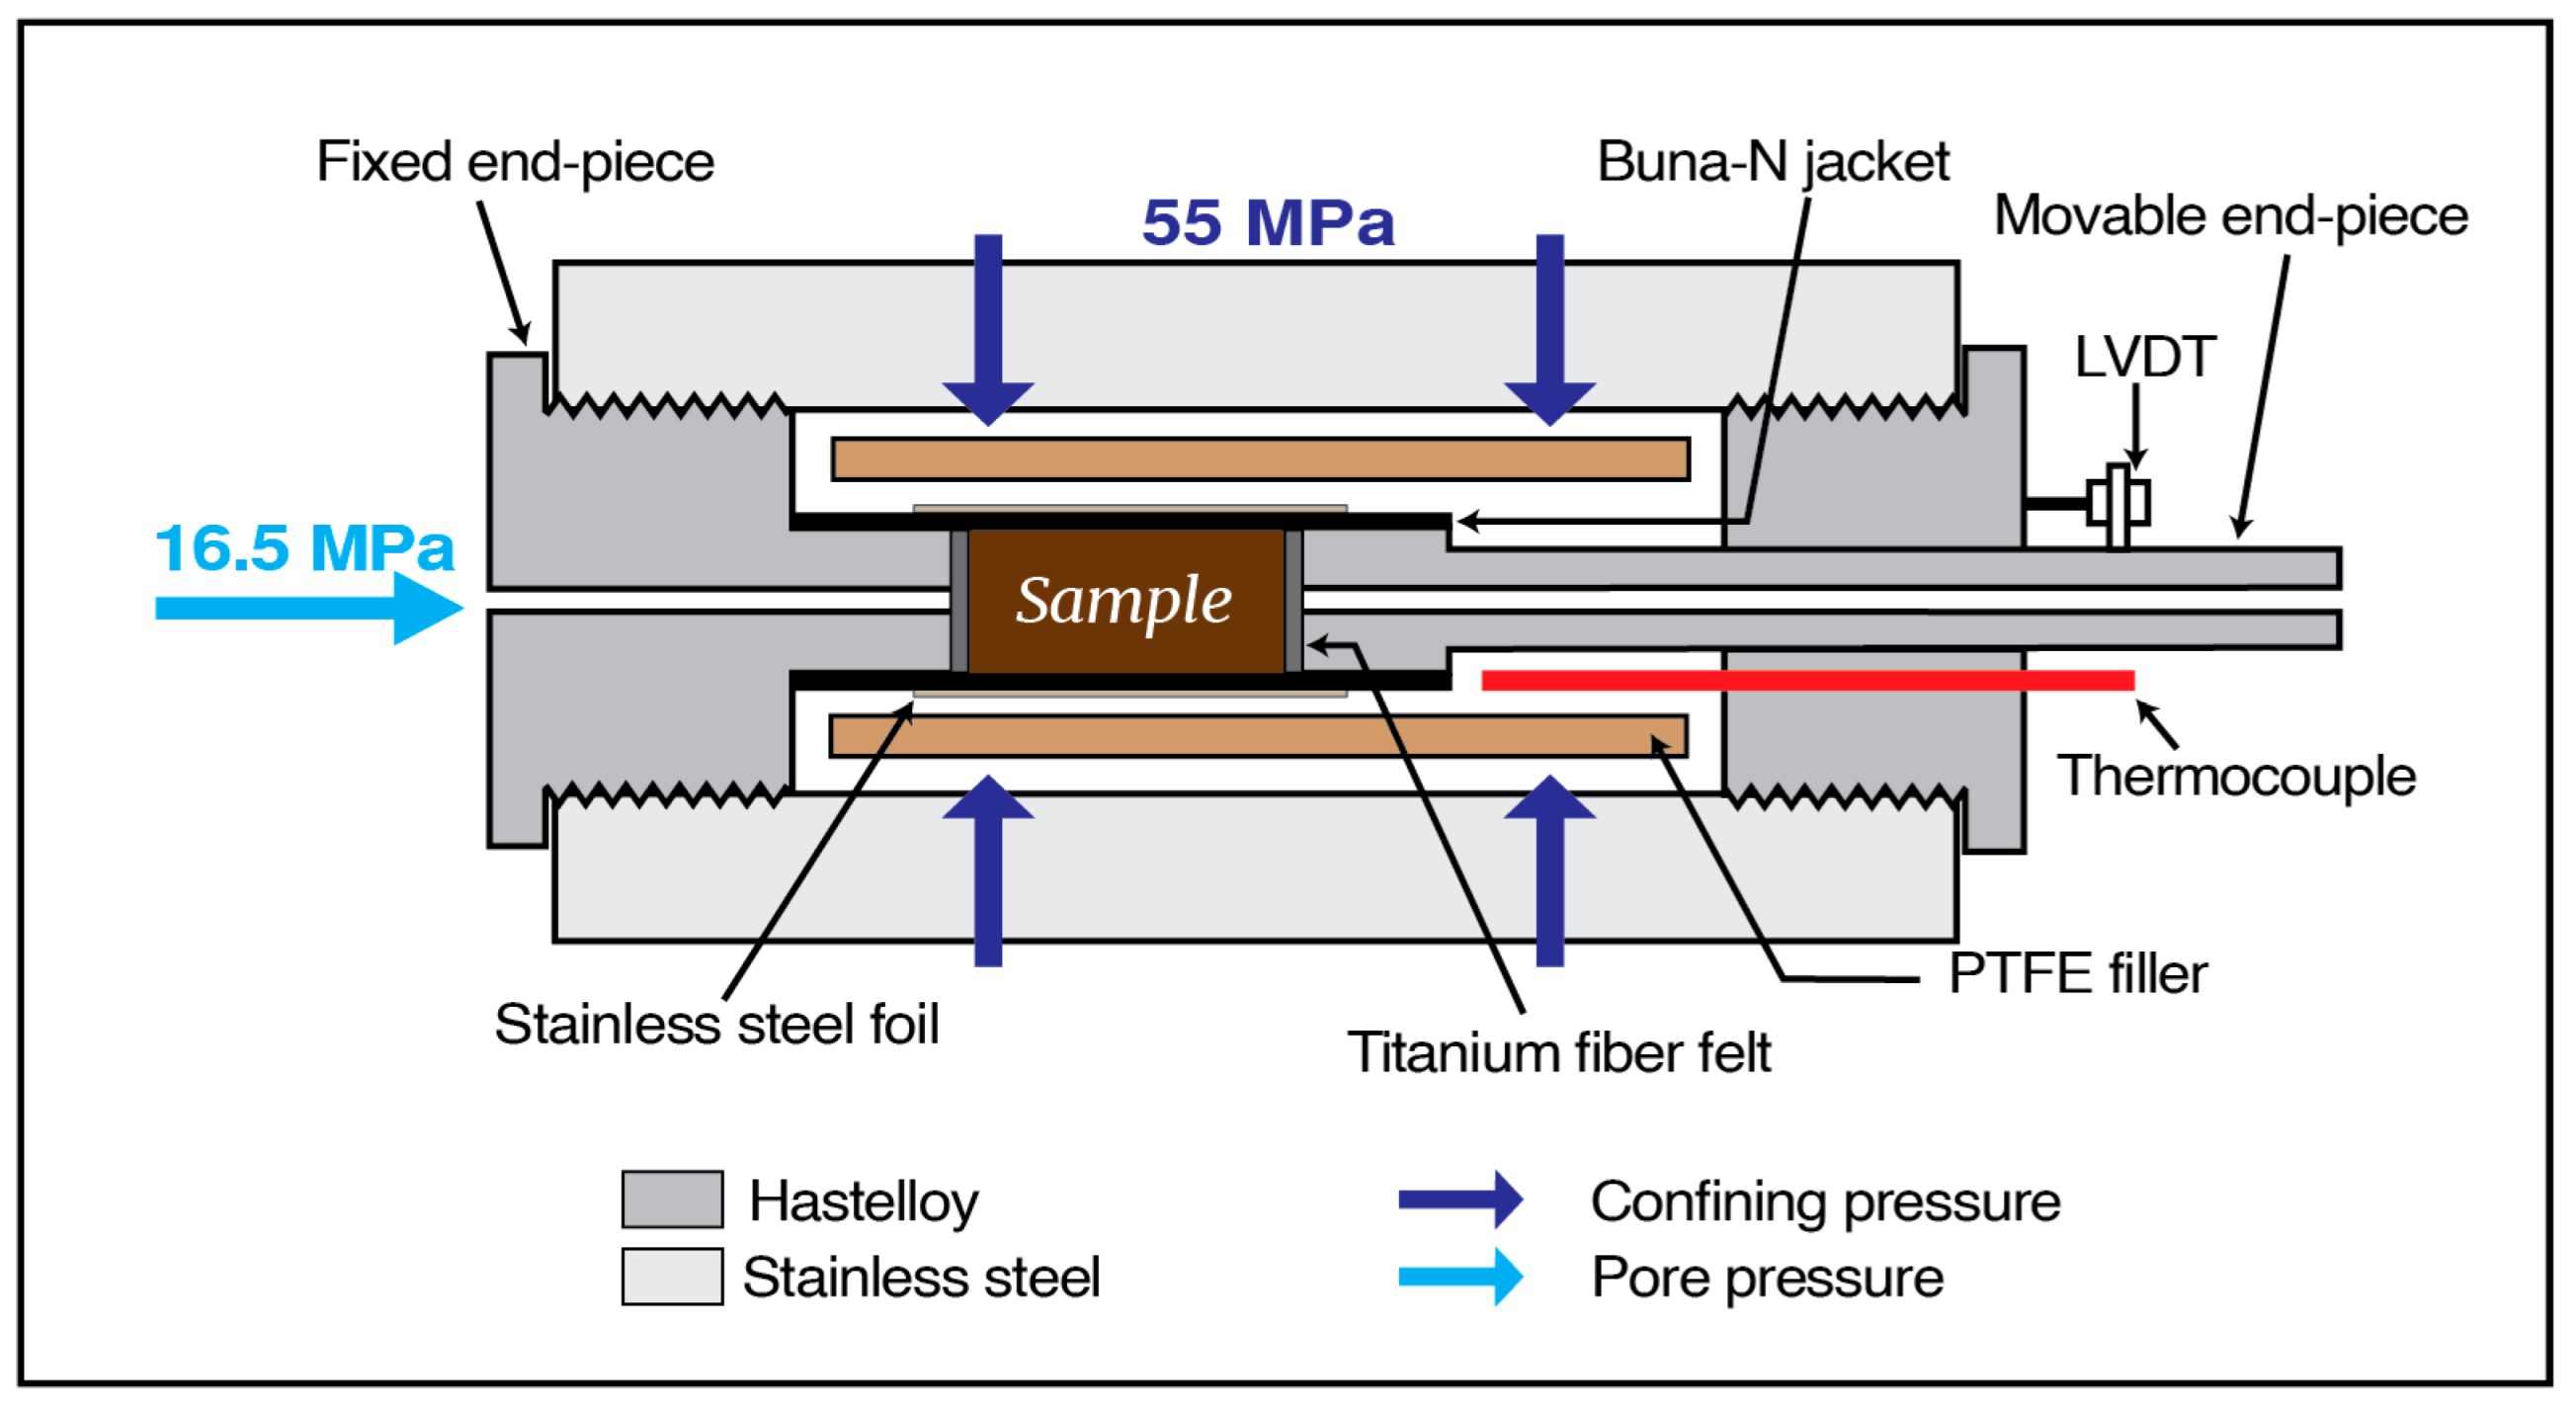
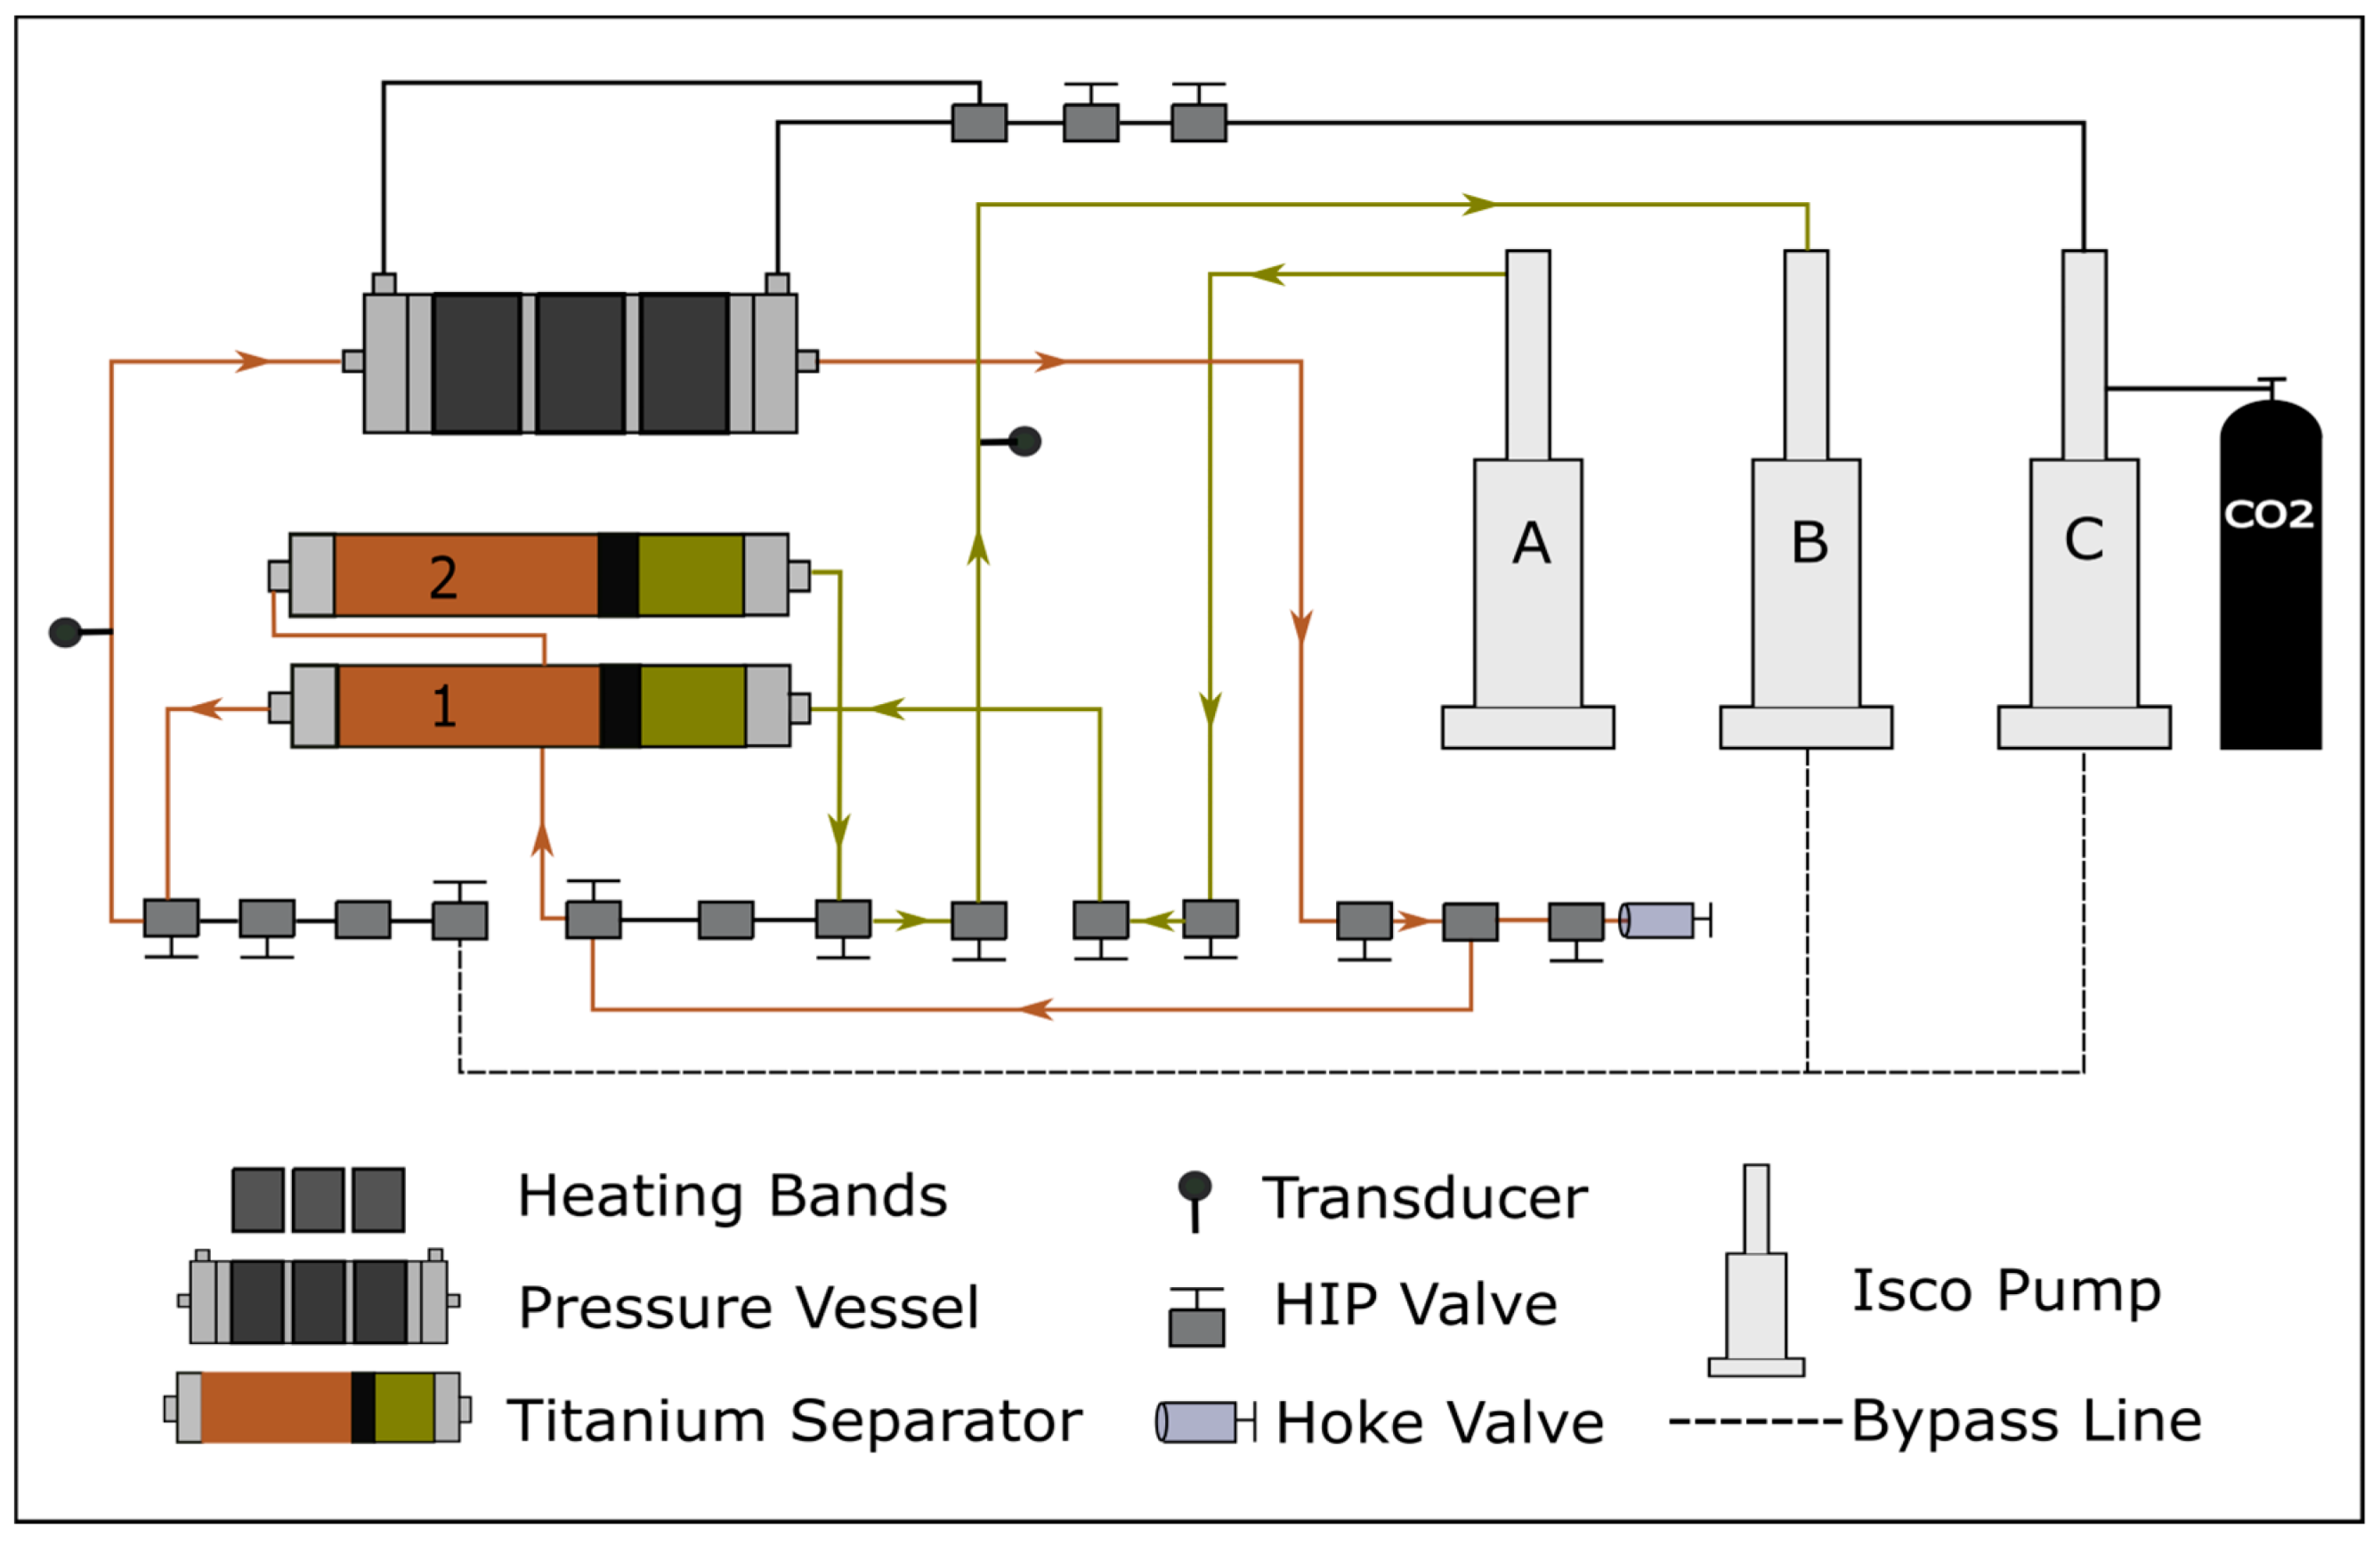
3.3.1. Flow-through Experiment

CO2 flow-through experiments at in situ reservoir conditions were conducted using a flow-through experimental system (Figure 1) in the Petroleum Recovery Research Center at New Mexico Tech, and the detailed testing procedures are outlined in [38,39,40]. The physical conditions of all flow-through experiments were maintained at 71 °C by ceramic heating bands, with a confining pressure of 35 MPa, pore pressure of 29 Mpa, and constant fluid injection rate by three Teledyne ISCO syringe pumps. The core sample was jacketed with a Buna-N sleeve, wrapped in stainless steel foil to prevent CO2 diffusion, and assembled into a pressure vessel. The injection fluid was a CO2-rich brackish solution (pH = 4.3–4.5). The brackish solution was filtered with 0.45 μm filters, except in experiments of all ASCS samples and two CCS samples (CCS1 and CCS2). The CO2-rich brackish solution was maintained as a single phase by keeping the CO2 concentration below the saturation concentration of 1.279 mol/kg [50]. It was 73–77% saturated with CO2 in experiments with the ASCS and CCS samples and 66–75% saturated with CO2 in experiments with the Chl, Kao, and Unc samples. The confining fluid was silicone oil due to its non-reactive property. To simulate an oxygen-free environment in the deep subsurface, we purged oxygen in all fluids and the experimental system with ultra-pure nitrogen. To study the effect of flow rate on the HCM coupling process, we included a variety of flow rates (0.01–0.1 mL/min) in the design of the experiments (Table 2). Each rock facies was separated into two groups: CO2-treated and control. The CO2-treated group contained two flow-through tests that used the CO2-rich brackish solution and varied flow rates, while the control group used the brackish solution without CO2 as the injection fluid.
Permeability was measured before and after the CO2-rich brackish solution injection. Permeability tests were performed as described by [38,39,40]. A series of flow rates (higher than experimental flow rates in Table 2) was designed for each sample to obtain more accurate permeability measurements. High-precision pressure transducers were installed upstream and downstream of the flow-through system, and differential pressure was recorded to calculate permeability using Darcy’s law [51]:
k = Q v μ L A · P ,
where Qv is the volumetric flow rate (m3/s), μ is the fluid dynamic viscosity (Pa · s), L is the core length (m), A is the cross-sectional area (m2) of the core sample, and ΔP is the differential pressure between the upstream and downstream portions of the flow-through system.
Fluid chemistry was collected and analyzed throughout the CO2 flow-through experiment according to the methods in [38,39,40]. A Hoke metering valve was used to collect fluid samples from the downstream line of the system. Major element concentrations of the injection fluid and outlet fluid were analyzed using inductively coupled plasma-optical emission spectrometry (ICP-EOS). The aqueous CO2 concentration was measured using the manometric method. Eventually, the saturation index (SI) was calculated using a customized thermodynamic database (https://doi.org/10.18141/2221813) and Geochemist’s Workbench (GWB; [52]):
S I = l o g Q K ,
where Q is the ion activity product, and K is the equilibrium constant.

3.3.2. Geomechanical Tests

Pre- and post-ultrasonic velocity (UV) tests were conducted on fifteen core samples that experienced the flow-through experiment under ambient conditions using the method described initially in [21]. This test design aimed to detect changes in dynamic mechanical properties from the HCM coupling process. Specifically, P-wave and S-wave time-of-arrival (TOA) were manually picked and combined with core dimensions to calculate P-wave and S-wave velocities [53]. According to the data analysis in [38,40], some S-wave TOAs were picked incorrectly, and thus we focused on presenting and discussing the changes in P-wave velocity. The uncertainty associated with TOA was obtained by performing a UV test twice on one pristine Morrow B sandstone sample.
The indirect tensile strength test (i.e., Brazilian test) was conducted after the flow-through test on fifteen core samples using the detailed method described in [38,40], where a justification of test choice can also be found. To detect the spatial changes within the core samples during the HCM coupling process, we cut each core sample into four to five specimens along the sample length, where two ends were saved for post-test thin sections. The others were prepared for testing for the American Society for Testing and Materials (ASTM D3967-95a) [54] requirement. Indirect tensile strength tests were conducted following the specification in [54] using an MTS 858 Mini Bionix II Tabletop Test System with a displacement rate of 0.001 mm/s using an MTS TestStar IIs controller and MTS SimpleWare software. After the test, the displacement, the peak force (F, N), and the sample dimensions were used to calculate the indirect tensile strength, σT (mPa), according to [54]:
σ T = 2 F π d D ,
where d is the thickness of the specimen (mm) and D is the diameter of the specimen (m). By doing this, the spatial effect of the HCM coupling process to the injection point can be detected and quantified.

3.3.3. Creep/Flow-through Experiment

The creep/flow-through experiment is a flow-through experiment with simultaneous deformation monitoring (Figure 2). Otu et al. (2023) described the detailed apparatus and testing procedures [37]. The physical conditions of all creep/flow-through experiments were maintained at a temperature of 100 °C by ceramic heating bands, hydrostatically loaded to a confining pressure of 55 MPa, with an average pore pressure of 16.5 MPa, and subjected to a constant fluid injection rate. Therefore, an effective stress of 38.5 MPa was applied from all directions. The creep/flow-through system is very similar to the flow-through system described in Section 3.3.1, except two modifications were made. The first was adding a TE MHR100 (Schaffhausen, Switzerland) linear variable differential transformer (LVDT) to monitor the axial displacement. The second was that the entire apparatus was enclosed in an insulated box to reduce the effect of ambient temperature fluctuations on measurement noise. In this elevated temperature and pressure environment, we maintained the CO2-rich brackish solution as a single phase by using a CO2 concentration of 80% of the saturation concentration of 1.003 mol/kg [50]. The experimental design of the creep/flow-through tests is demonstrated in Table 3.
The net effect of CO2 can be detected by comparing the experiments on samples MP1 and MP2, where the same flow rate of 0.01 mL/min was injected with (MP1) and without (MP2) dissolved CO2. Samples MP3 and MP4 were subjected to different flow rates (0.02 vs. 0.1 mL/min), and each experiment had two stages, with the initial phase being the control and the second containing dissolved CO2. These two experiments were compared to detect the net effect of flow rate, while the two stages in a single experiment were compared to detect the net effect of CO2.
During MP1 and MP2 testing, quasistatic elastic moduli were measured with an unload–reload loop 13 and 15 times throughout the experiments, respectively. For MP3 and MP4, the quasistatic elastic moduli were measured three times: once before the control experiment, once after the control or the beginning of the CO2-treated experiment, and the last time after the CO2 treatment experiment. This operation was to control for small steps in strain observed during MP1 and MP2. Unload–reload loops were performed by hydrostatically unloading the sample confining pressure from 55 MPa to 30 MPa, cycling the effective stress from 38.5 MPa to 13.5 MPa and back to 38.5 MPa. In addition, the permeability and outlet fluid chemistry were periodically monitored throughout each creep/flow-through test, following the same procedures described in the flow-through test [37].

4. Results

We first present the paragenetic sequence of the Morrow B sandstone based on the diagenetic analysis of thin sections from the five most representative lithofacies in the formation. Then, we present the changes in hydraulic properties and geomechanical properties from the HCM coupling process by analyzing the fluid chemistry, microprobe data, and petrography data. In addition, we tied the X-ray μCT observations to changes in porosity, permeability, dynamic mechanical properties, and strength. Finally, we represent new petrographical analysis results.

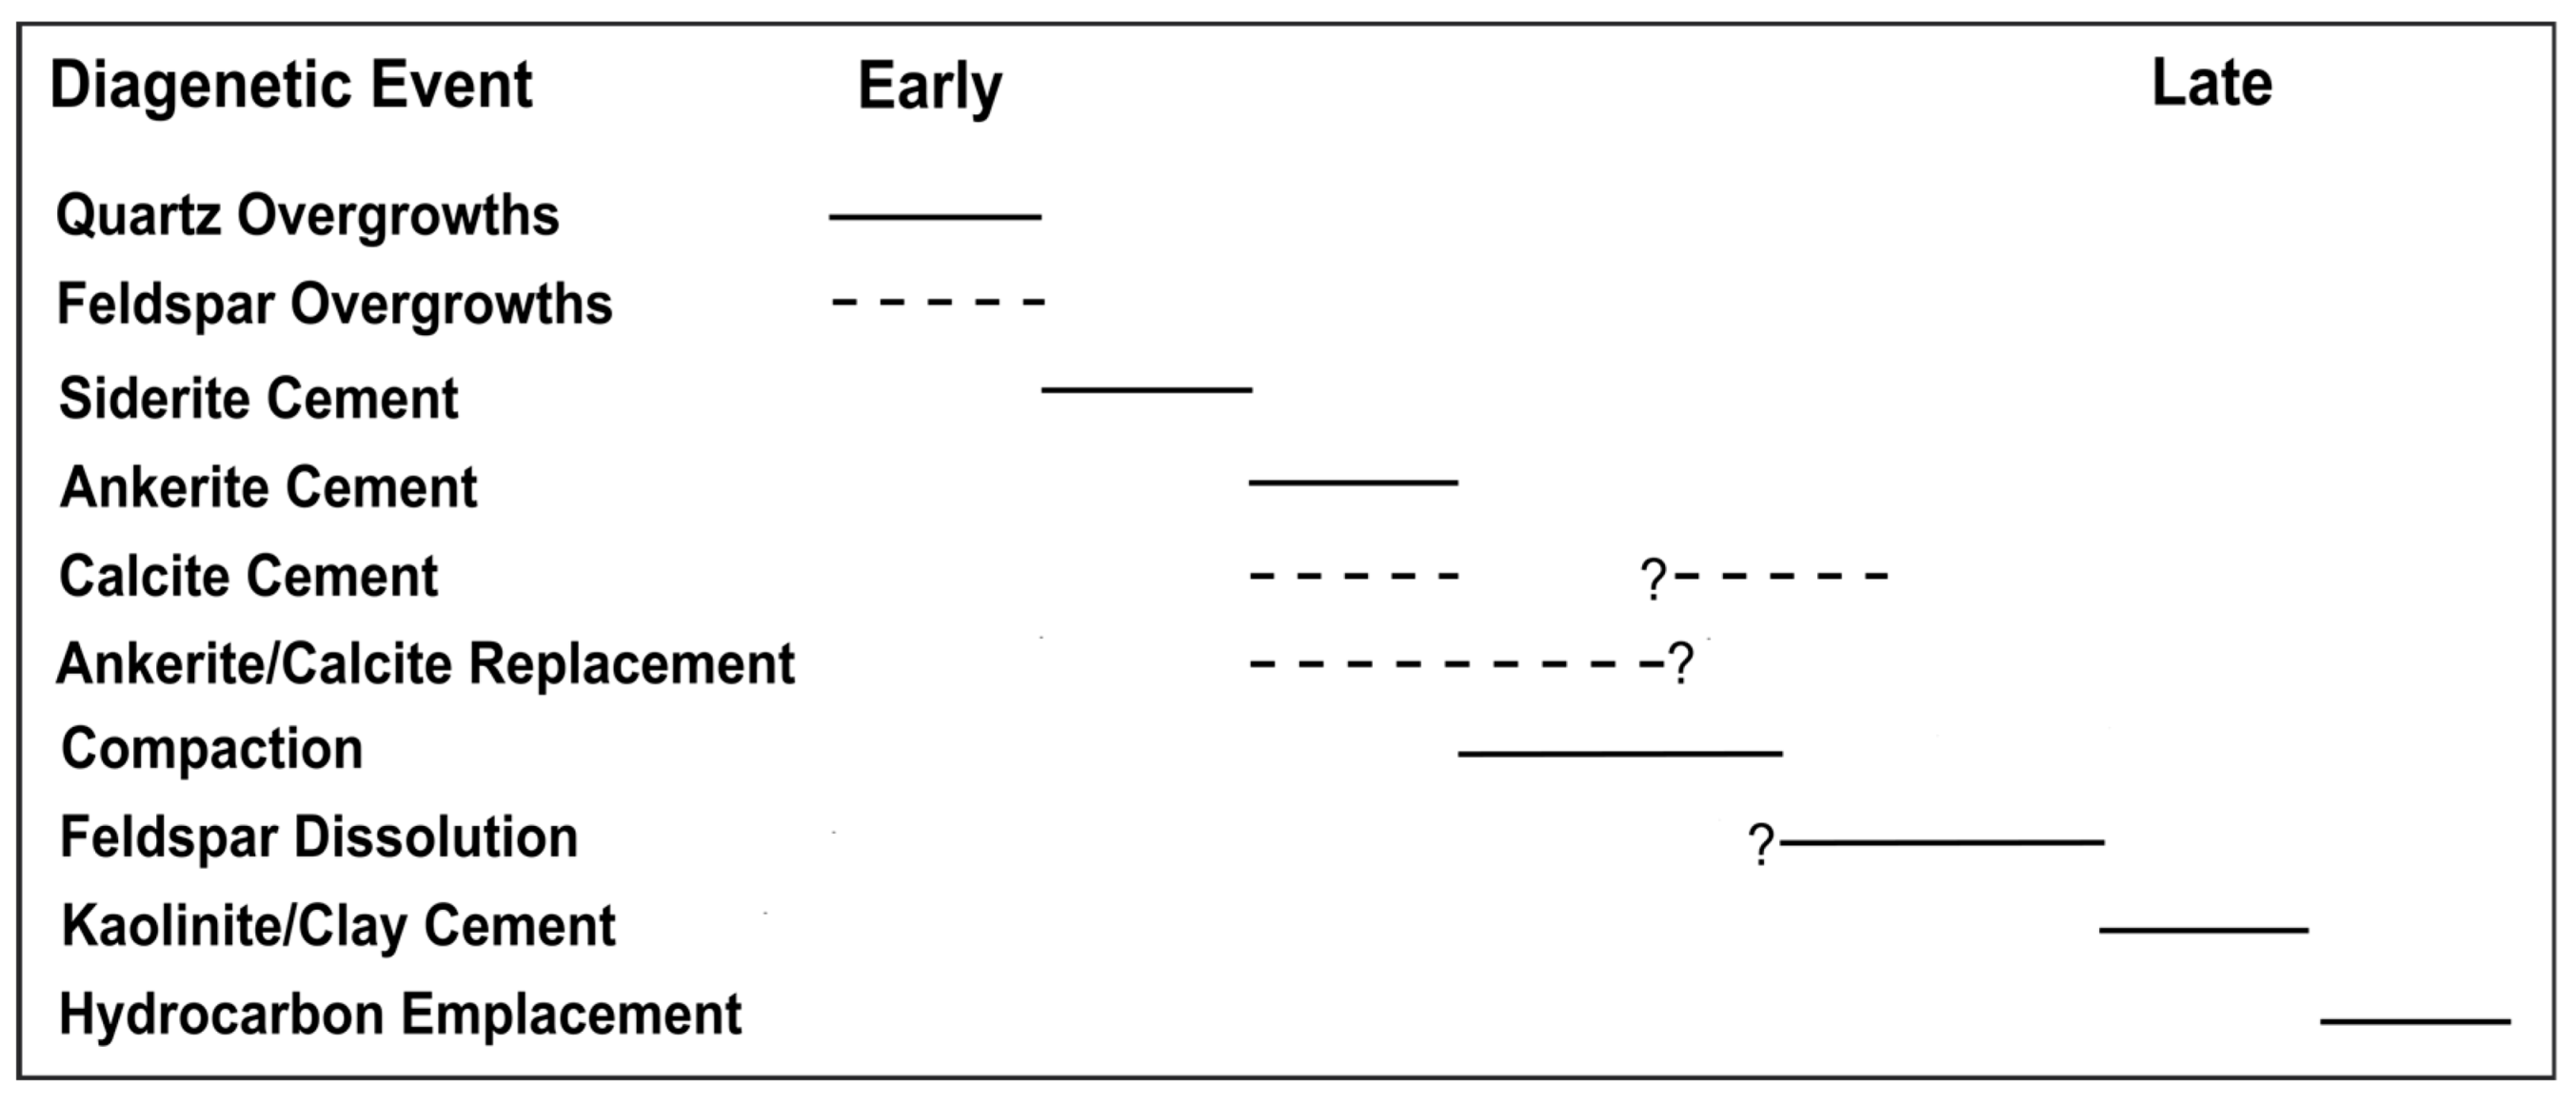
4.1. Paragenetic Sequence

For the Morrow B sandstone, the events from early to late diagenesis include quartz overgrowths, feldspar overgrowths, siderite cementation, ankerite and calcite cementation/replacement, compaction, some calcite cementation, feldspar dissolution, clay cementation, and hydrocarbon emplacement (Figure 3). The paragenetic sequence was determined by observing the micrograph evidence of mineral textures (Table 4). Note that the timings of feldspar overgrowth with quartz overgrowth and ankerite and calcite cement are ambiguous. Ankerite and calcite replacement and compaction events can be overlapped in some locations within the formation.
The impact of paragenesis on geomechanics could be reflected by the observations that early digenetic minerals (quartz overgrowths, feldspar overgrowths, and carbonate cementation) are likely to provide intergranular support whereas late diagenetic minerals (clays and post-compaction calcite cement) are not. Although a mostly early diagenetic event, carbonate replacement of feldspar provides negligible structural support due to its occurrence only within detrital feldspar and/or rock fragments. Additionally, poikilotopic calcite provides more structural support than carbonate cements that are disseminated or sparsely present across all lithofacies. In general, quartz overgrowths provide the most stable structural support, especially in unstable conditions that involve chemical reactions.

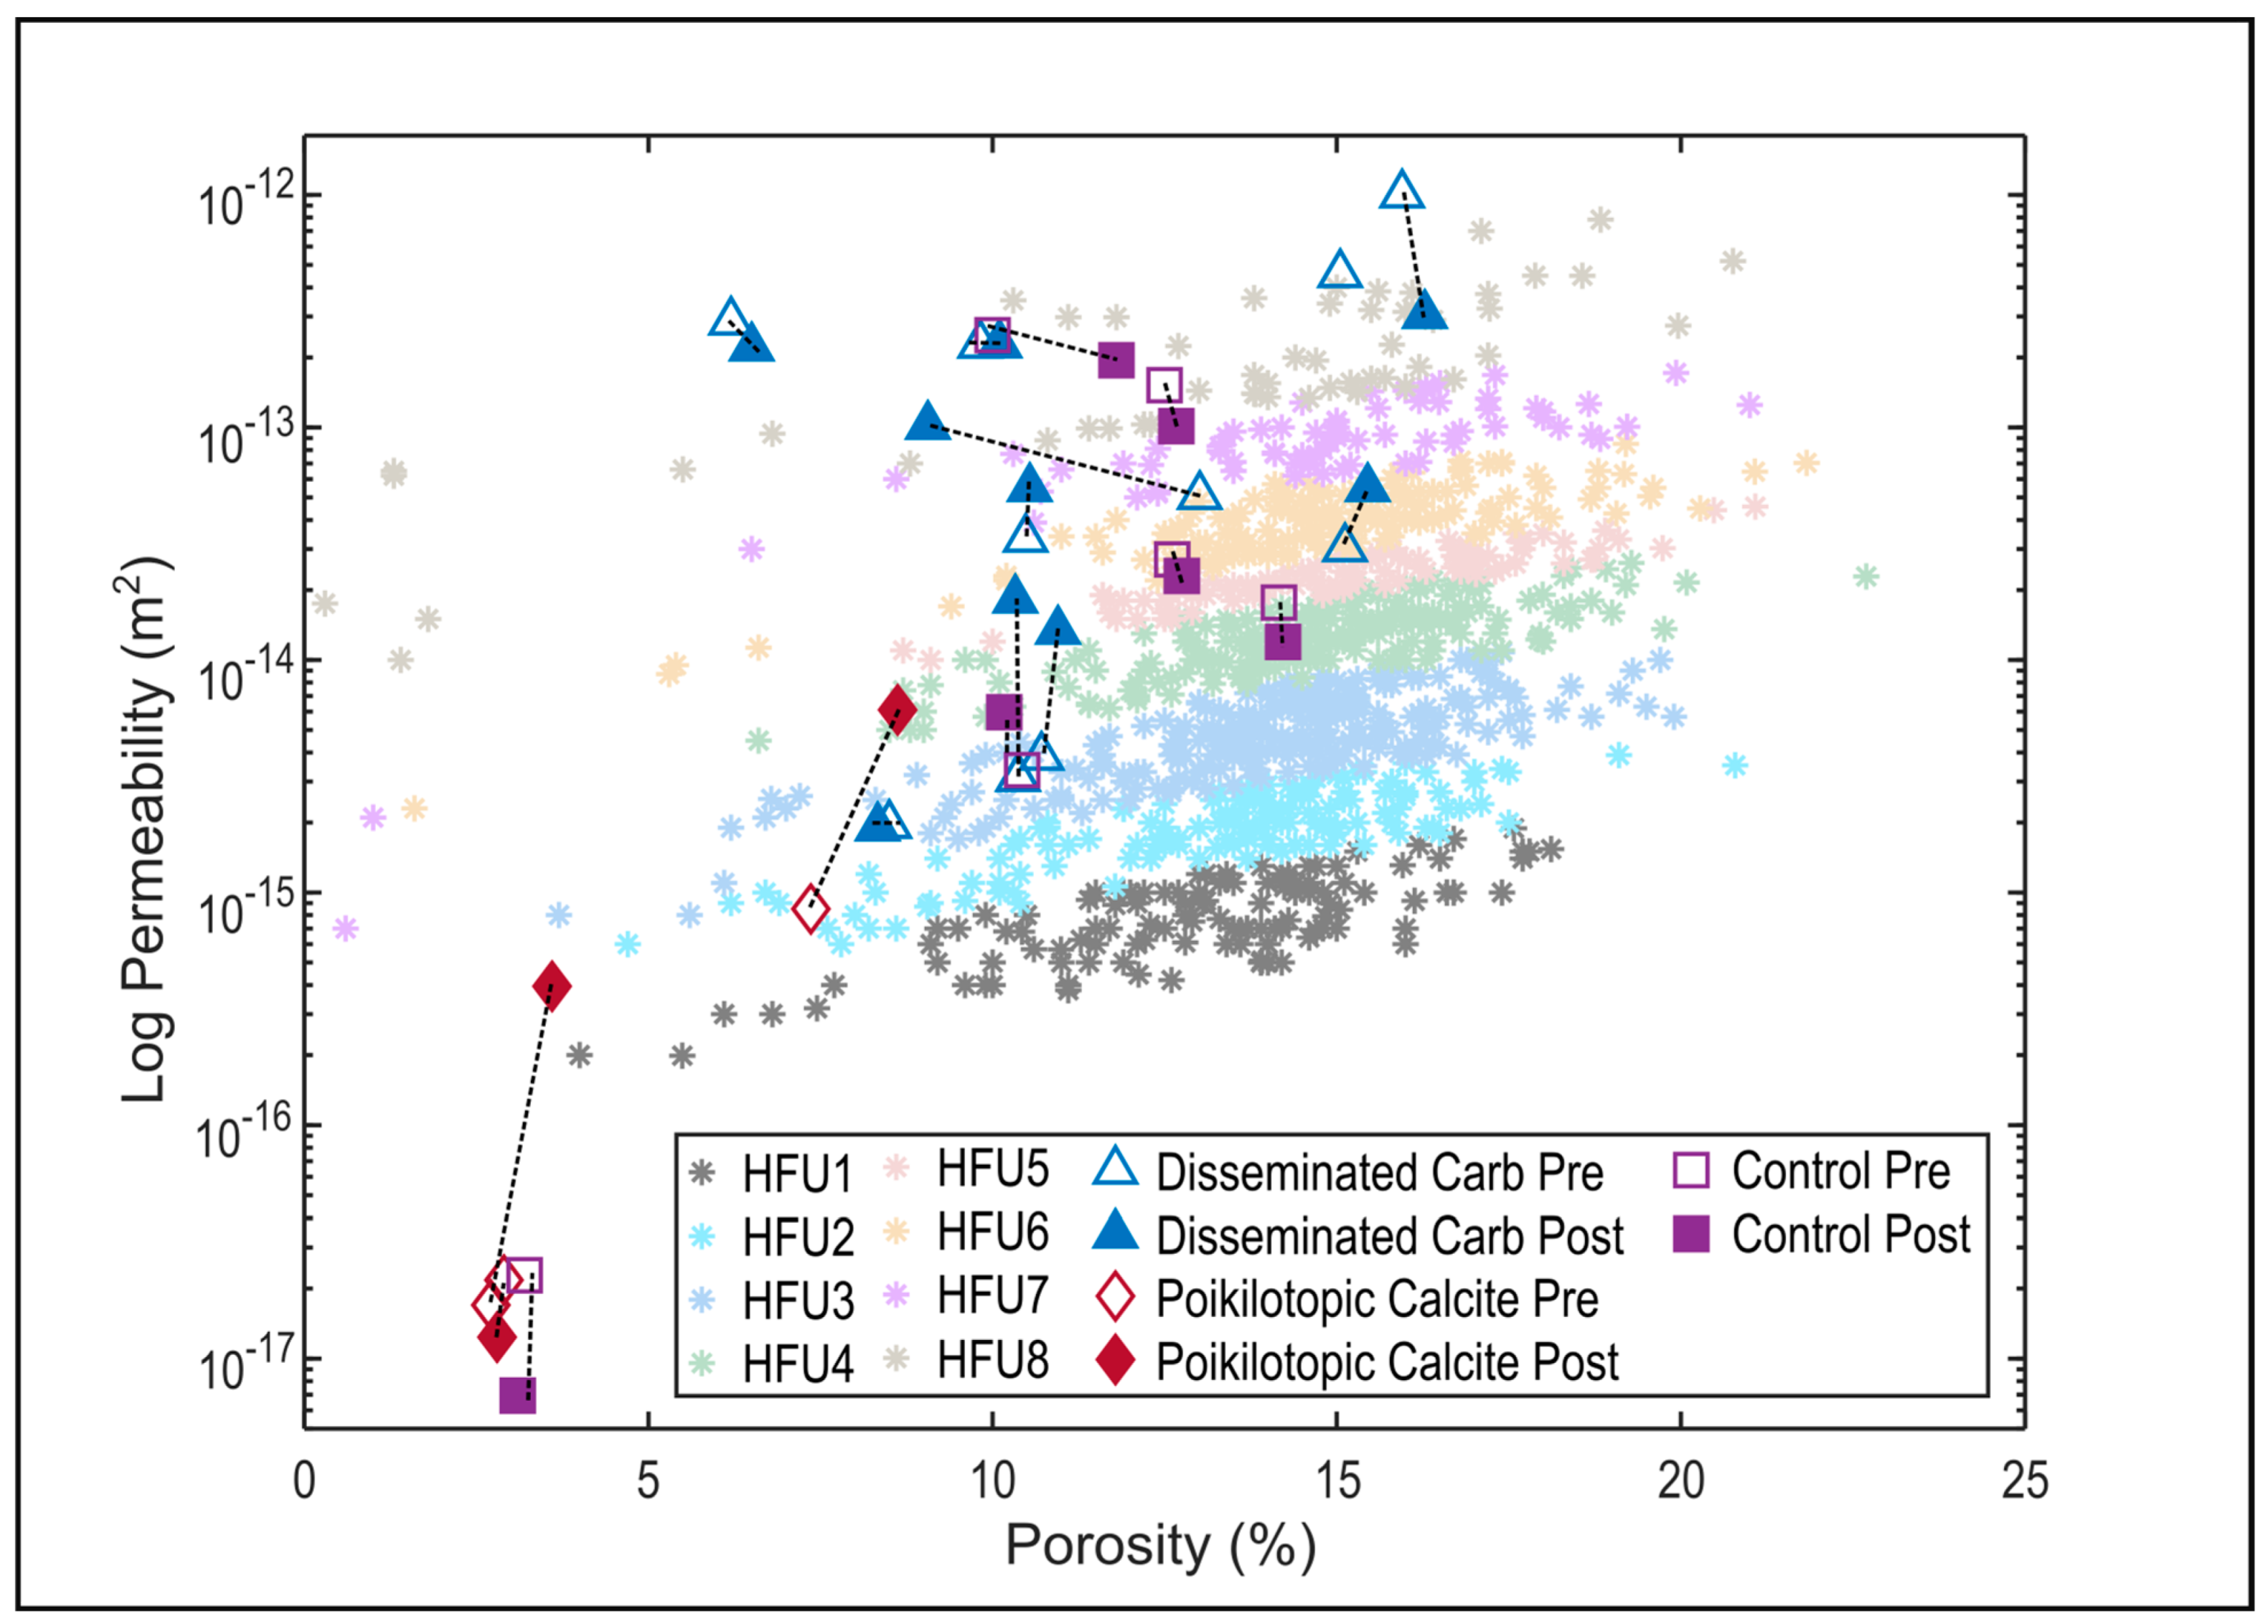
4.2. Changes in Hydraulic Properties

Table 5 summarizes the pre- and post-test changes in porosity and permeability for all experiments. Overall, the presence of CO2 in the brackish solution increased porosity and permeability during the reservoir condition flow-through experiments. The porosity changes were mostly small with a < 1% absolute change. Permeability mostly increased with exposure to CO2. In some cases, permeability decreased; this seems to happen in samples where iron oxide-rich films or other secondary phases precipitated, clogging pore throats. Increases in permeability were generally on the order of one order of magnitude, while decreases were within the same order of magnitude as the pre-test measurement.
During the higher temperature and higher effective stress consolidation experiments that mimic the long-term reservoir response to injection (MP1–MP4), the porosity and permeability varied in opposite directions. In MP1 through 3, modest increases in porosity were met with decreases in permeability. In MP4, a short-term experiment with little variation in static moduli, the porosity decreased while permeability increased. Decreases in permeability appeared to be related to the formation of iron oxide and other precipitates.

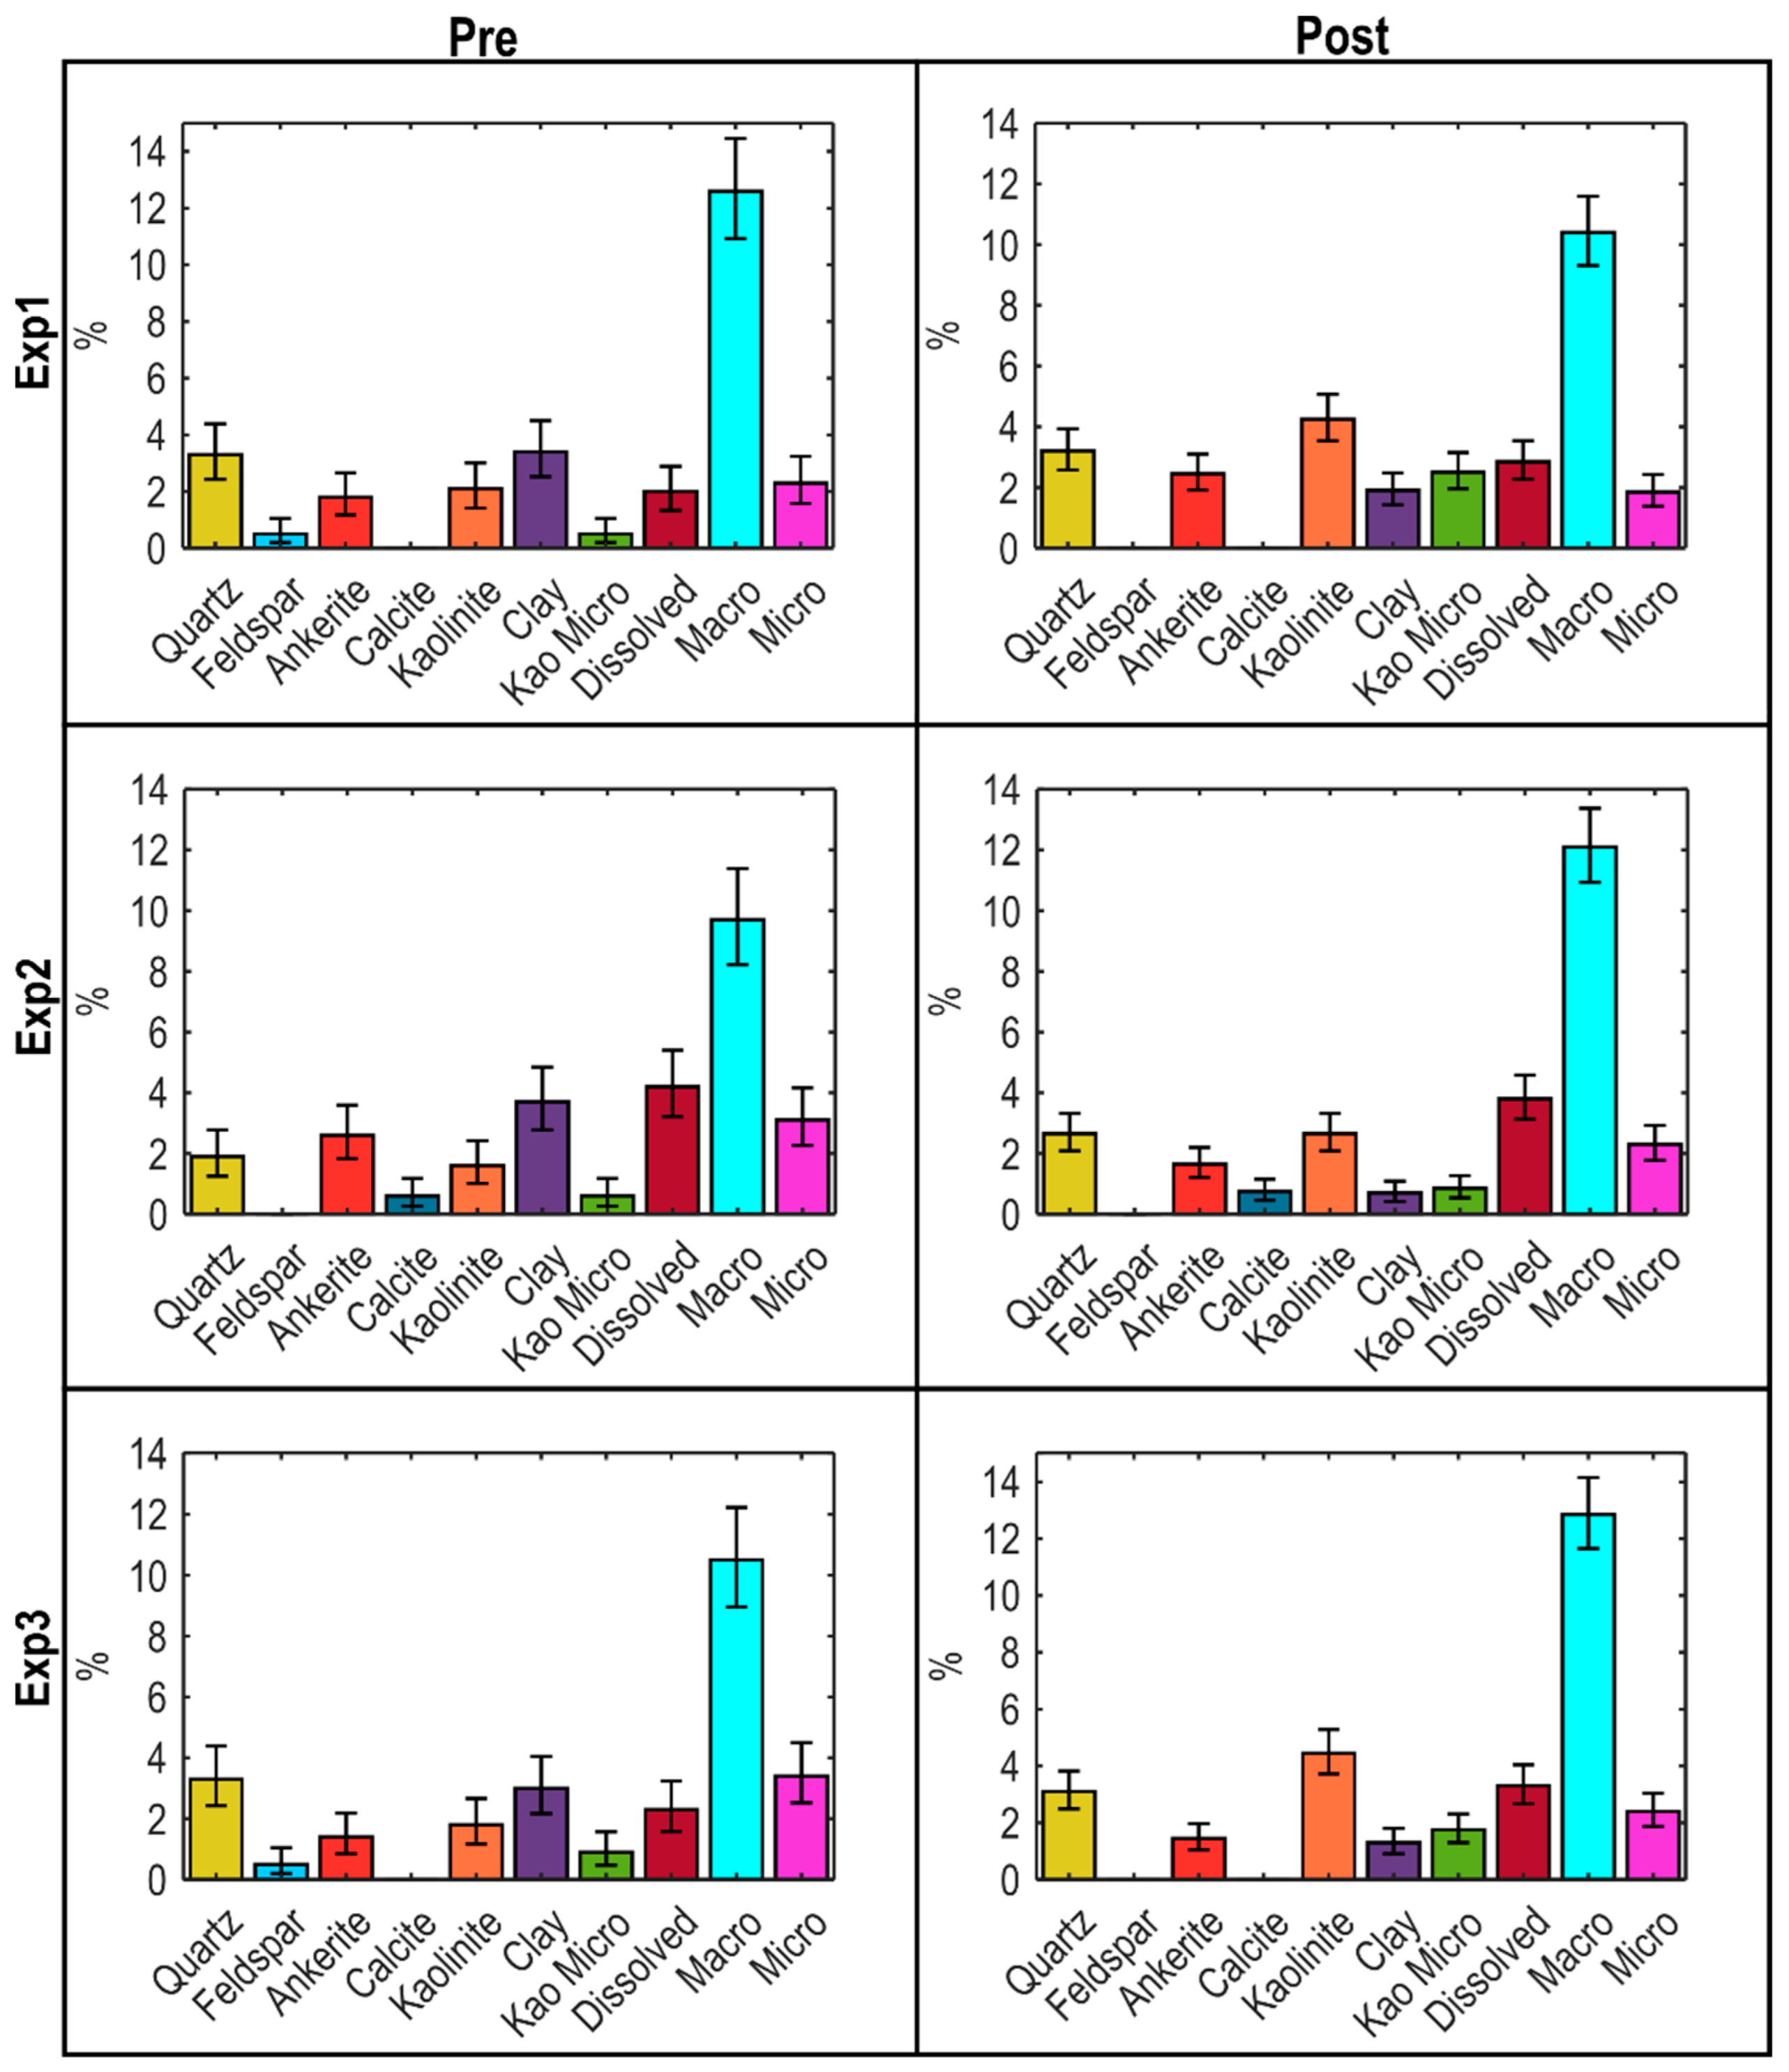
4.3. Changes in Mineralogy and Fluid Composition

A series of petrographic analyses of pre- and post-test thin sections show alterations in the Morrow B sandstone for the five rock facies in terms of cement abundance and texture [38,39,40]. For all experiments, early diagenetic quartz and K-feldspar overgrowths had an unchanged abundance and texture compared to pre-test samples. In samples cemented with calcite, we found a decrease in abundance and a heterogeneous dissolution pattern of complete dissolution in the upstream section and partial dissolution in the downstream section of the core samples (Table 6; CCS2 and Cal/Kao2). This result indicates that variable dissolution degrees can occur along the core length—from high dissolved volumes upstream to low dissolved volumes downstream. In samples cemented with ankerite, we found a lower abundance of ankerite (Table 6; Chl1, Chl2, ASCS1, and ASCS2) and dissolved edges (Unc1 and Unc2). In siderite-cemented samples, there was a greater abundance of siderite and new iron oxide coatings in the post-test thin sections of Chl1, Chl2, Cal/Kao2, Unc1, and Unc2 (Table 6). In samples cemented with chlorite, we found little difference in the abundance of chlorite and new iron oxide precipitation (Table 6; Chl1 and Chl2). In kaolinite-cemented samples, the textures were unchanged (Kao1, Unc1, and Unc2); we believe that the variable kaolinite abundance in pre- and post-test samples can only be due to heterogeneity because the saturation index of kaolinite (https://doi.org/10.18141/2221813) indicates favorable precipitation rather than dissolution for the full length of all experiments [38,39,40].
The above petrographic observations are consistent with the changes in fluid chemistry, but not necessarily irrefutably proven stoichiometrically because the reacting phases contain the same cations. Compared to the control experiments, the fluid chemistry in the experiments reacted with dissolved CO2 showed significant increases in Ca2+, Mg2+, and Fe2+ concentrations, which gradually stabilized at lower concentrations over time. This phenomenon indicates that significant dissolution occurred at the beginning of the experiment, followed by a decrease in concentrations while remaining above the background levels. We believe that the decrease in concentrations indicates the loss of reactive surface area along flow paths and secondary precipitation. Three potential chemical reactions that contributed to the increase in Ca2+, Mg2+, and Fe2+ concentrations are listed below, where the ankerite composition is based on the microprobe analysis [40].
C a l c i t e + H + = C a 2 + + H C O 3 , A n k e r i t e + H + = 0.57 C a 2 + + 0.20 F e 2 + + 0.23 M g 2 + + H C O 3 ,
S i d e r i t e + H + = F e 2 + + H C O 3 .
Furthermore, the saturation indices (SIs) of carbonates and clays (https://doi.org/10.18141/2221813) calculated with GWB [52] suggest that the dissolution of calcite, ankerite, siderite, and chlorite, and precipitation of iron oxide, illite, and smectite are dominant chemical reactions in the Morrow B sandstone under CO2-enriched conditions. Episodes of dissolution and precipitation of these mineral phases resulted in porosity and permeability changes (Table 4). Detailed petrographic analyses are included in the Supplementary Materials of published literature [38,39,40].

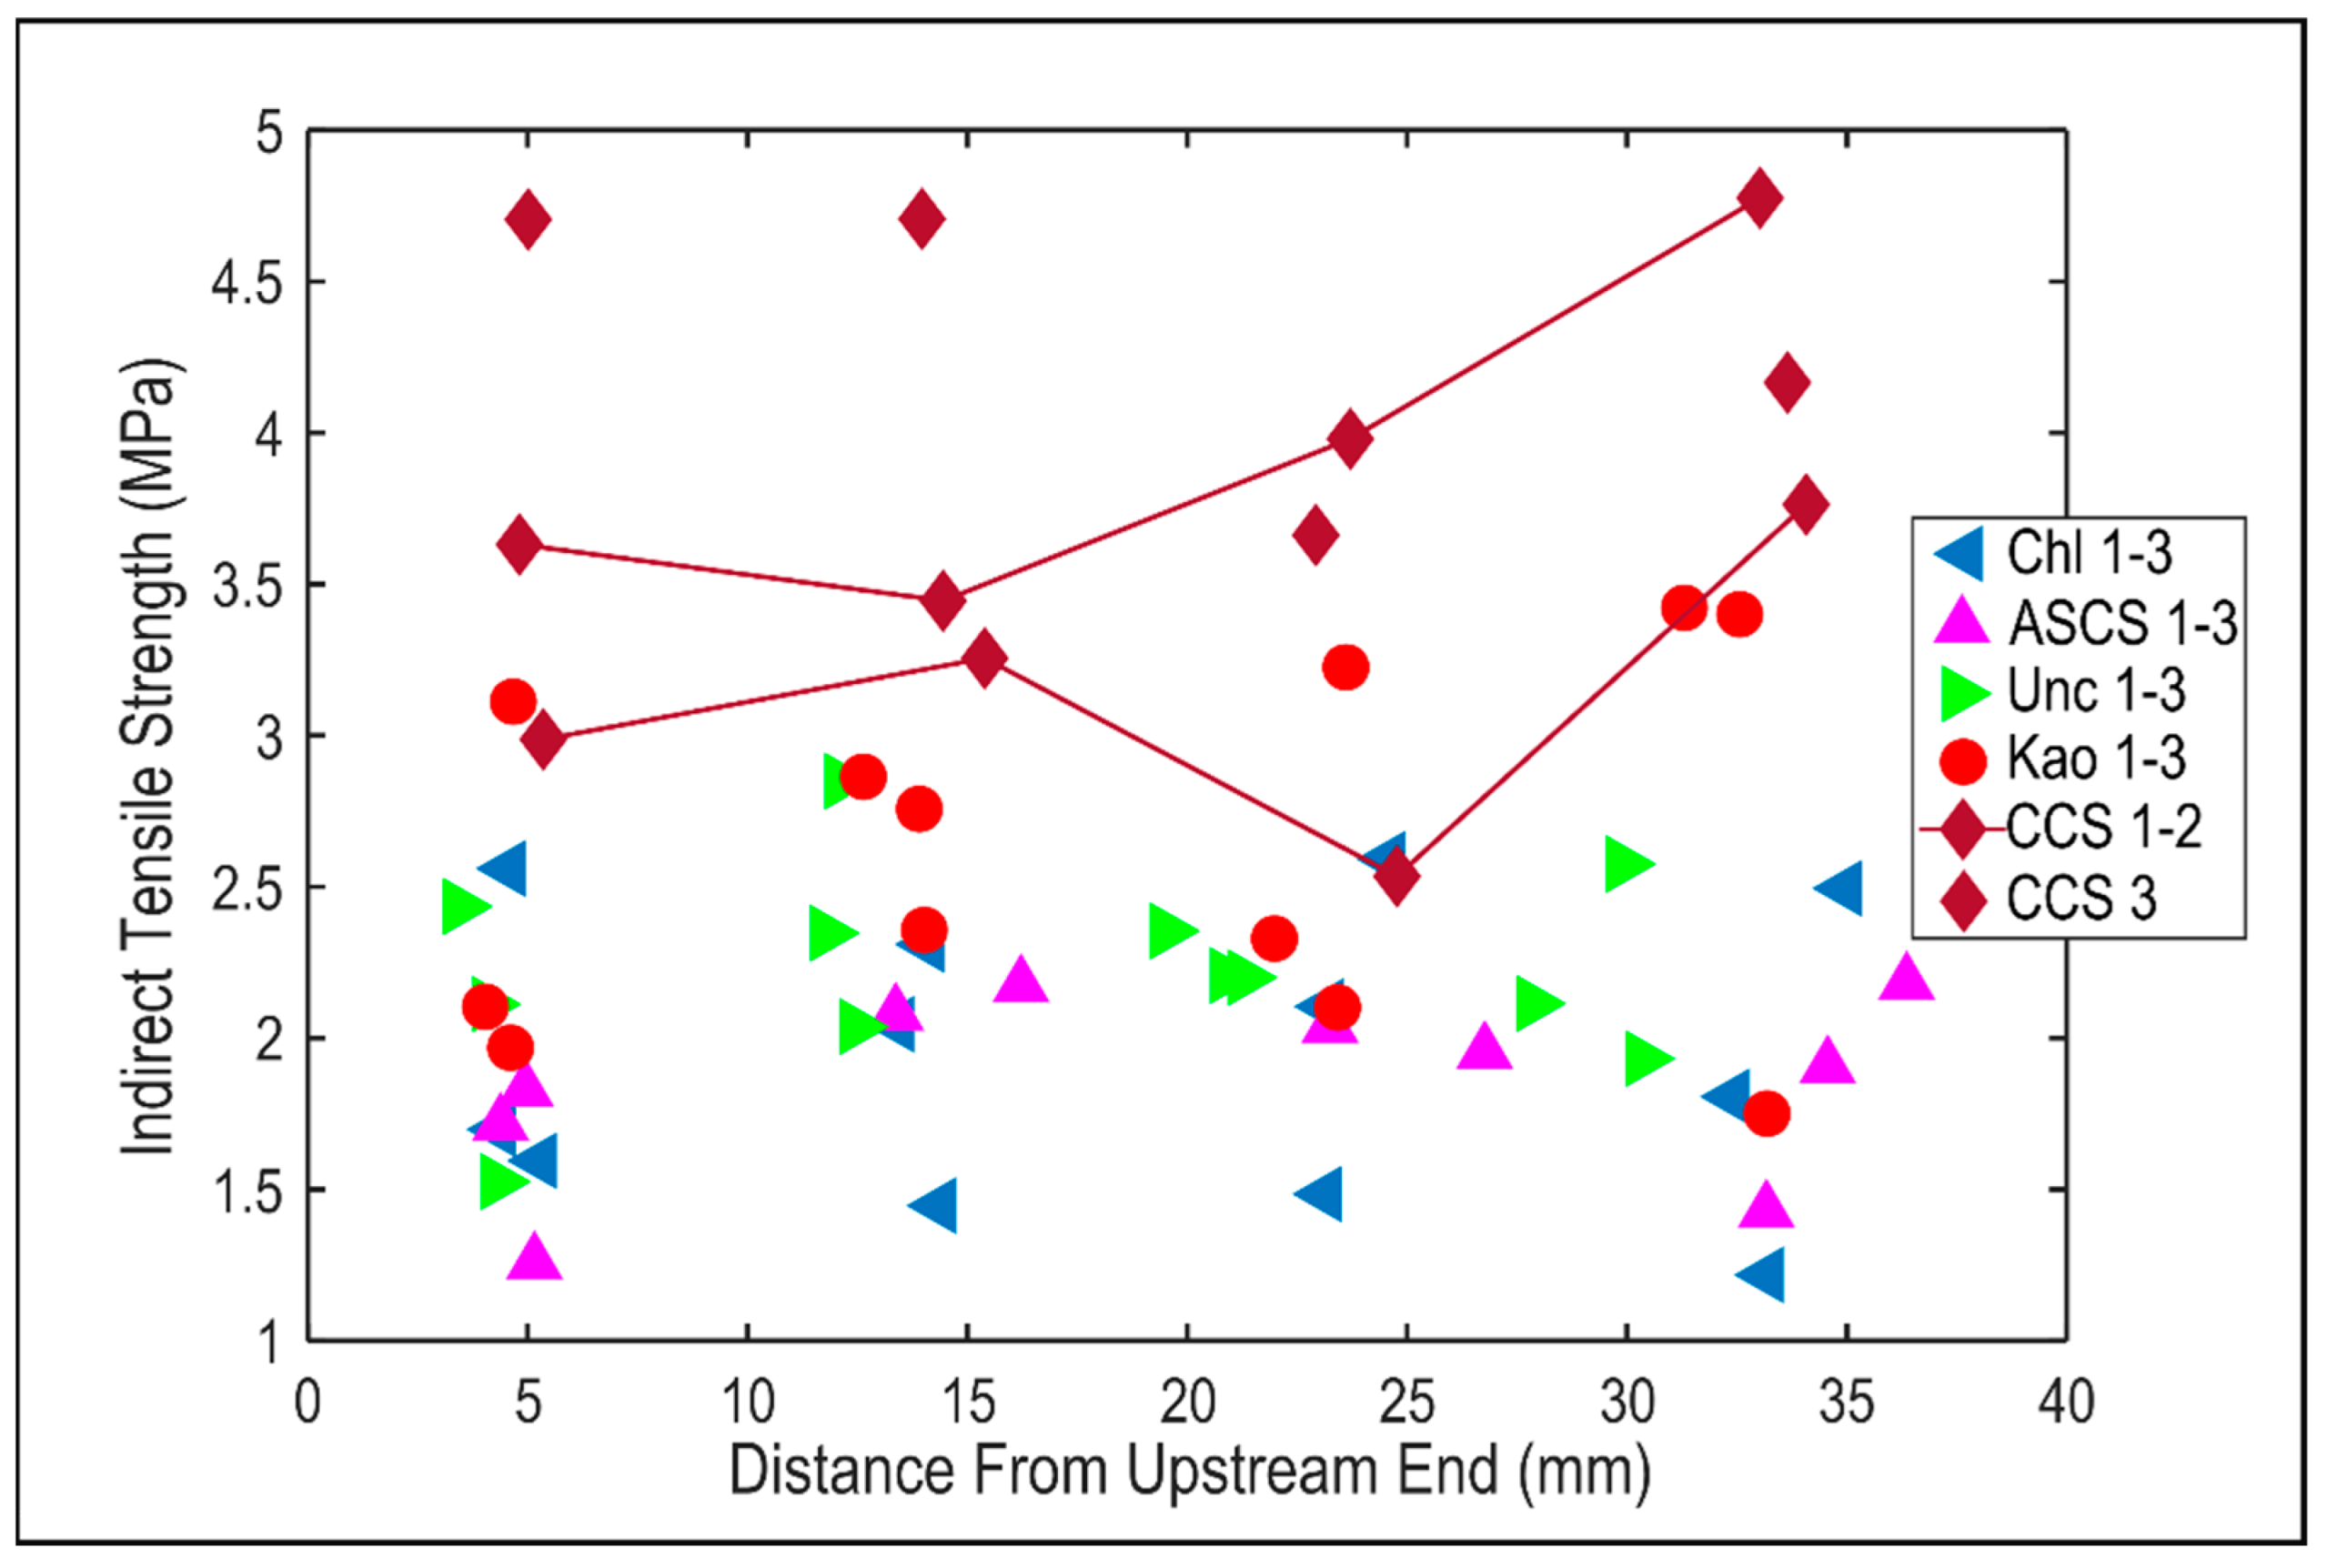
4.4. Changes in Geomechanical Properties

The geochemical changes summarized in Section 4.3 led to a range of mechanical alterations, from negligible to significant, with most samples showing minor mechanical alterations. CO2-enriched chemical conditions introduced two alteration mechanisms: mineral dissolution and precipitation. Specifically, localized and disseminated dissolution were two common dissolution patterns observed in these experiments. Localized dissolution was often observed in poikilotopic calcite, where a large continuous pore space was created after reaction with the experimental solution (e.g., CCS2) and was more likely to cause strength degradation. Disseminated dissolution tended to occur in siderite, ankerite, and chlorite (disseminated carbonates and clay), where the dissolution occurred in individual sparse mineral crystals (e.g., ASCS, Chl, and Unc) and did not significantly affect the pore structure by creating large continuous segments as observed in concentratively dissolved calcite cement. Although calcite dissolution was associated with strength degradation in samples CCS1 and CCS2, an exception can occur when the diagenetic heterogeneity is locally complex and overshadows the dissolution of the most reactive grain supporting cement as occurred in sample Cal/Kao2. As for mineral precipitation, iron oxide/hydroxide and iron-rich clay precipitates (illite and smectite) were two common secondary products in Morrow B sandstone. Iron-rich precipitates surrounding siderite strengthened the grain contacts and thus provide structural support. In contrast, clay precipitation did not affect the matrix structure support, and forming illite and smectite could decrease permeability. This evidence is supported by previous studies [22,27].
Negligible tensile strength weakening was observed in the samples that experienced the minimal and disseminated dissolution of chlorite, ankerite, or siderite (i.e., ASCS, Chl, Kao, and Unc) (Figure 4). The depositional and diagenetic history are the primary factors regulating the geomechanical alterations in these samples, where framework grains and early diagenetic cement, such as quartz and K-feldspar overgrowths, maintained the matrix structure. Significant tensile strength weakening was observed in sample CCS2 [40], while a negligible change in tensile strength was detected in sample Cal/Kao2 [38] (Figure 4). Both samples experienced excessive calcite dissolution. Therefore, we summarize three factors that control the degree of strength degradation for calcite-cemented samples: (1) the presence of additional, less reactive, early diagenetic cement (siderite), which forms new iron precipitates and is a key component of rock stability; (2) the dissolved calcite which precipitated after compaction since it is not fully supportive; and (3) the formation of quartz overgrowths (3–4%), which are consistently stable and unaffected where calcite cement is removed.
Changes in ultrasonic wave velocities were also observed during the HCM coupling process. The decrease in wave velocities reflects the creation of new dissolution-driven macropores, while the increase in wave velocities reflects the precipitation of crystalline iron-rich phases. In the Chl and Kao samples, slight increases in wave velocities occurred in samples that experienced a slower flow rate (0.01 mL/min) due to secondary mineralization of grain coating crystalline iron oxides (Figure 5). In contrast, a slight decrease in wave velocities occurred in samples that experienced a faster flow rate (0.1 mL/min) due to more penetrative dissolution of grain-bridging minerals, less precipitation of crystalline iron oxide coatings, and precipitation of new amorphous clay minerals (Figure 5). Thus, the flow rate could control the HCM coupling process by affecting the dissolution/precipitation mechanisms through chemical kinetics.
The experiments presented in [37] used a classic geochemical and geomechanical strategy of replacing time with temperature and stress in order to mimic the deformation in HFU5 of the Morrow B sandstone over operational (decades) time spans rather than laboratory time spans (days to months). Identical to the experiments on HFU5 in [37,39], we found an approximately 10% decrease in P-wave and S-wave velocities after the flow-through tests were completed. This is consistent with increasing porosity and permeability in samples MP1 through MP3. Sample MP4 show the lowest decrease (non-significant) in velocities.
Overall, little net inelastic time-dependent (i.e., creep) strain was accrued beyond the initial, largely elastic deformation during loading. During the experiments on MP1 and MP2, where the samples were unloaded and reloaded to estimate static bulk modulus changes while continuing flow-through, a small (~10−4 strain) step-like deformation was observed, which was thought to be related to the movement of fines. During the experiments on MP3 and MP4, almost no creep strain was accumulated beyond the initial deformation related to loading.
The evolution of the bulk modulus for the experiments in [37,39] revealed that the samples show the largest variation in bulk modulus during the brackish solution-only experiments, with variations of up to 35%, while the CO2-enhanced brackish solution experiments had little variation (~5%). To understand the mechanism of variation, the bulk modulus was measured before testing, at the end of brackish solution-only testing, and at the end of the whole experiment in the two-stage tests at the same flow-through volumes but at different absolute times (1 month and 2 months, vs. 2 and 4 days). The longer-term tests reveal more variation over time, with an increase in bulk modulus after 1 month that nearly returned to the initial bulk modulus after CO2-enhanced brackish solution flow in the MP3 experiment. The bulk modulus was nearly constant throughout the MP4 experiment.
The lack of variation in static moduli during the short-term experiment (MP4) contrasted with the variation in the brackish solution-only long-term experiment (MP2), which argues for a time-dependent mechanism driving the evolution of bulk modulus independent of dissolution-driven changes in velocity.

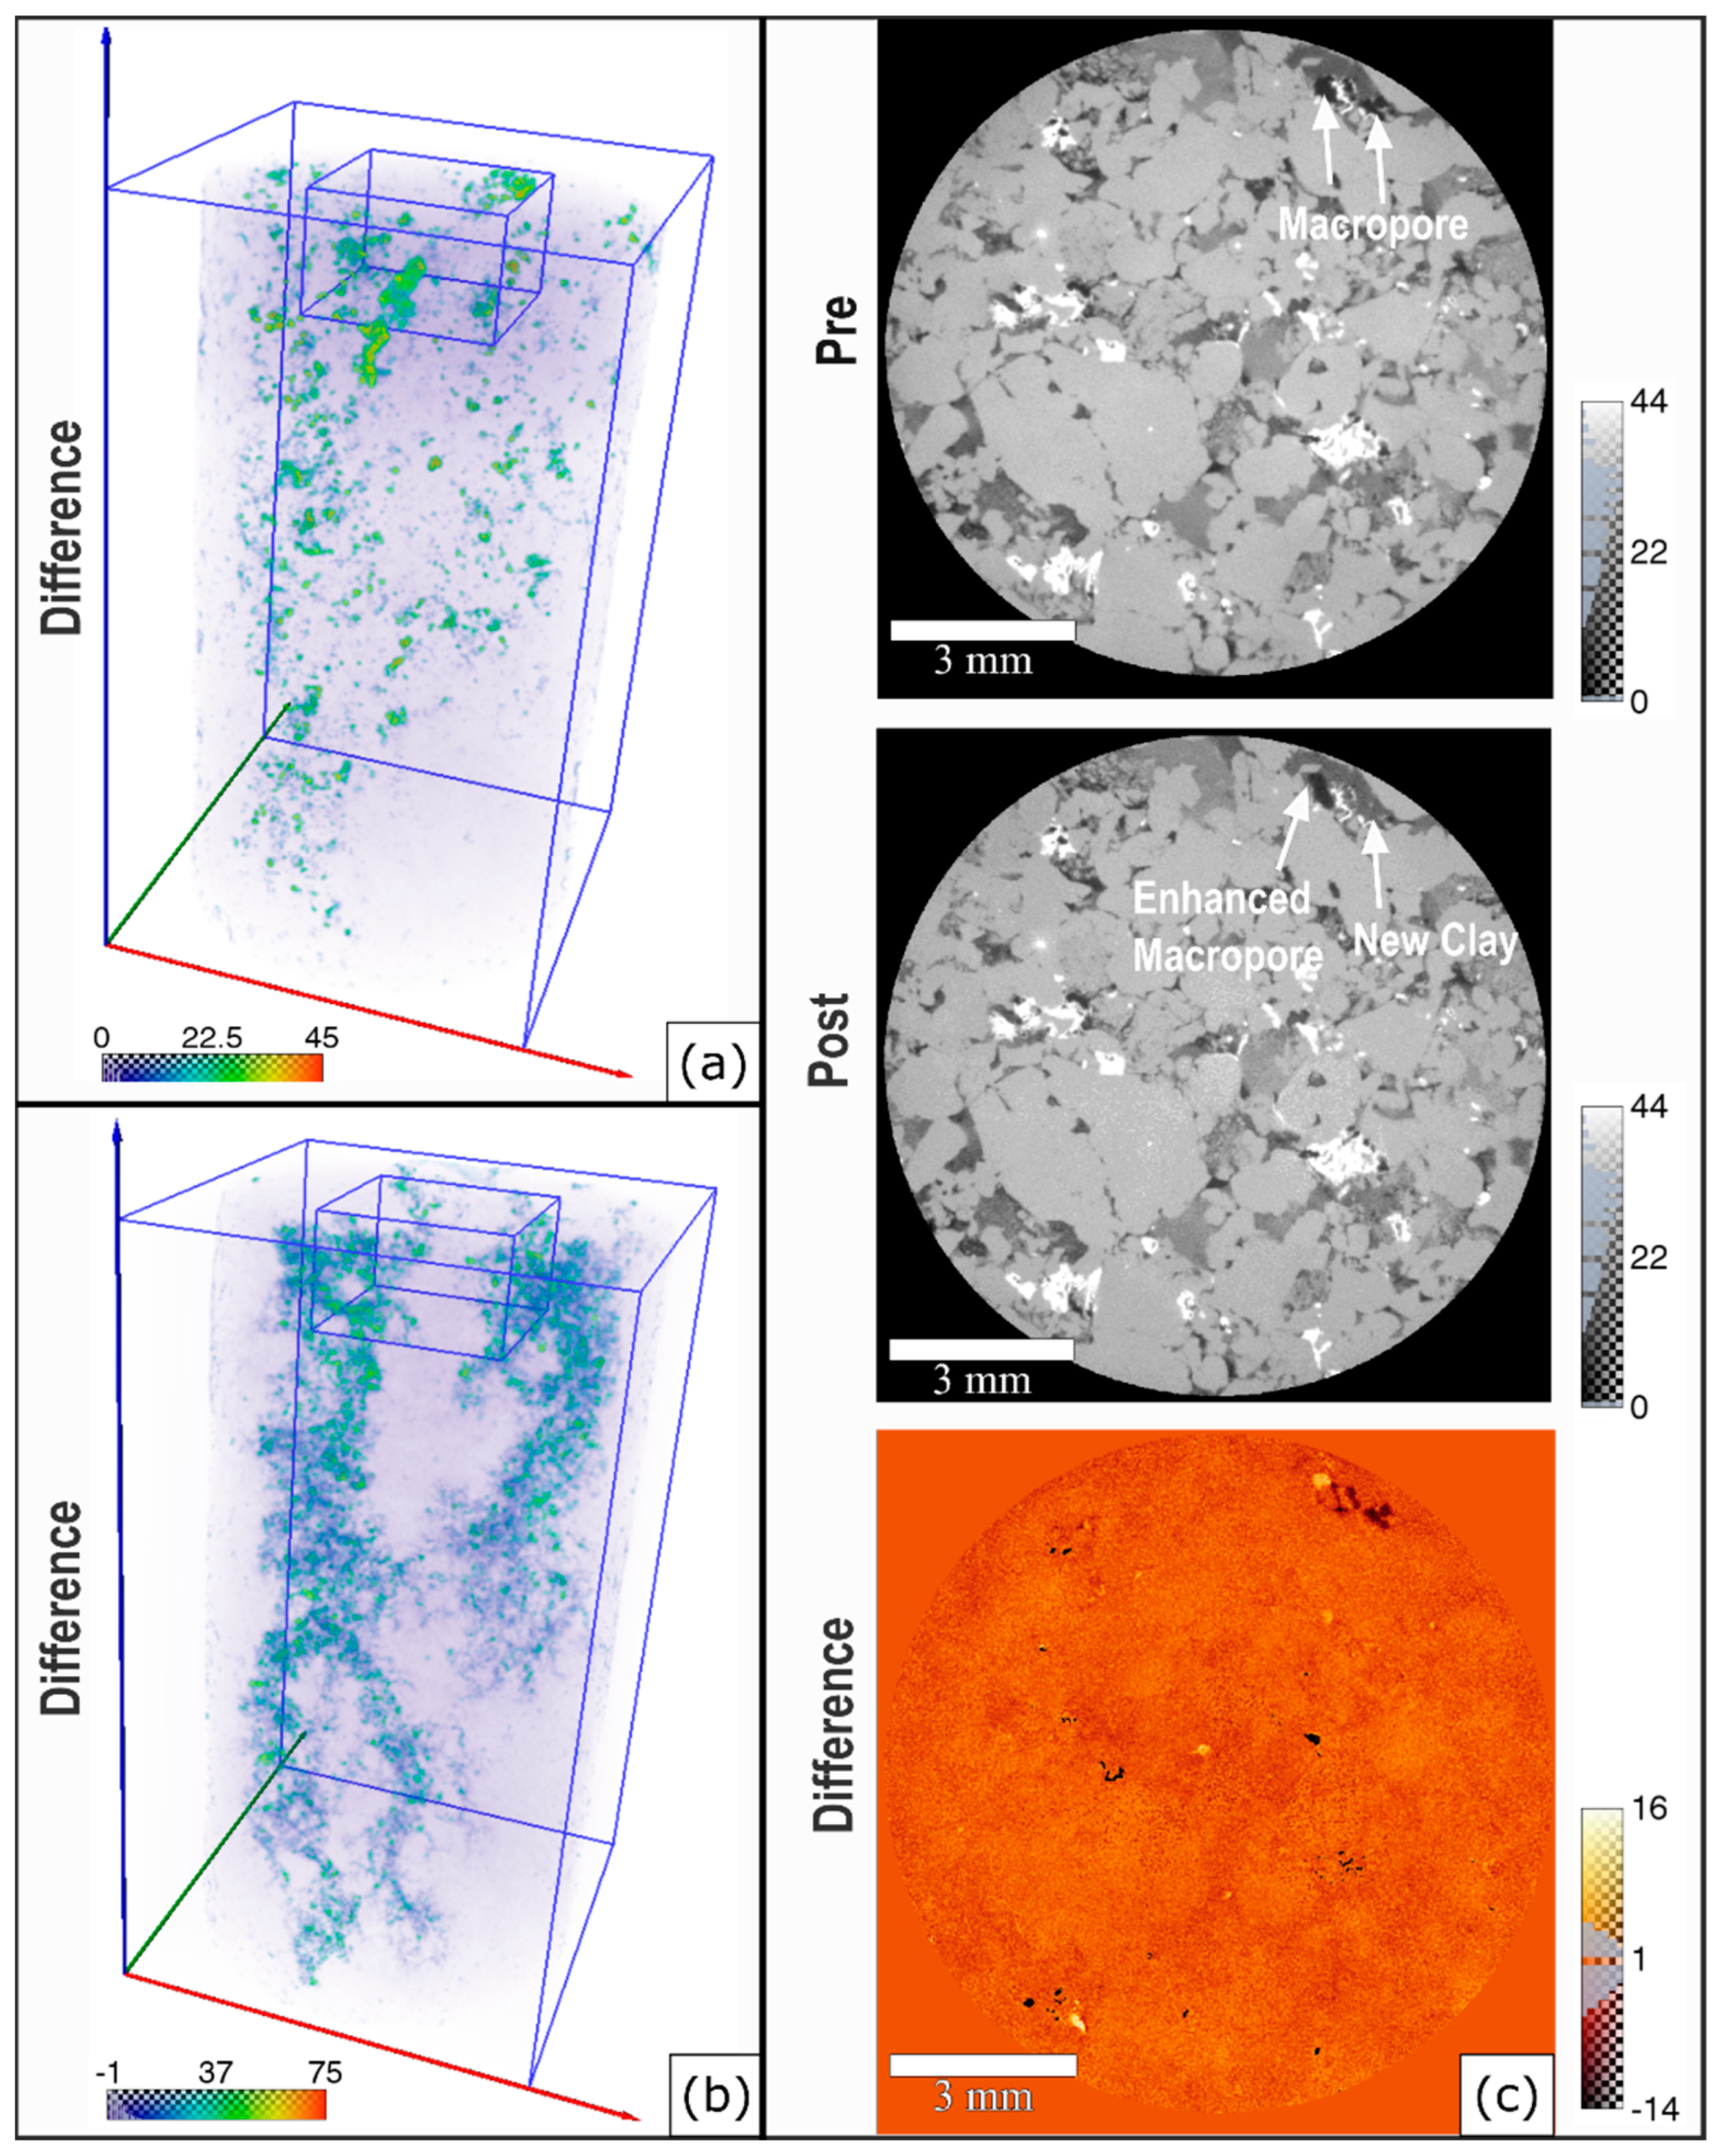
4.5. Changes in X-ray μCT Images

The X-ray μCT images show two types of dissolution patterns: disseminated ankerite/siderite dissolution (Figure 6a) and poikilotopic calcite dissolution (Figure 6b). The first dissolution type forms unconnected open pores and results in a smaller increase in porosity (Figure 6a). The secondary dissolution type forms significant wormholing and a concomitant increase in porosity. Higher resolution CT images revealed fine clay particle migration or potentially clay precipitation as the third mechanism that can affect the pore structure/space evolution (Figure 6c).

4.6. Additional Analyses

A thorough petrographic analysis including 1000 (pre) and 2000 (post) point counts was performed on samples MP1-4 of the macroporous-dominated lithofacies studied in [37] to verify the volumetric estimates of framework grains, cement, and porosity and to document changes in the mineralogical textures and formation damage (microfracturing) from fluid–rock interactions during testing. The point count analysis indicated that, on average, these samples from the macroporous-dominated lithofacies of the Morrow B sandstone had 70% framework minerals, 10% cement, and 17% porosity. The cement minerals were composed of 3% quartz overgrowths, 1% ankerite, 2% kaolinite, and 3% undifferentiated clay. The porosity consisted of 11% macroporosity, 3% dissolution porosity, 3% undifferentiated clay and kaolinite microporosity, and 1% other microporosity. The samples also contained 1% ankerite replacement and 2% matrix (Figure 7). All samples contained trace quantities of calcite in the pre-test thin sections; however, only MP2 had enough to constitute 1% volumetrically (Figure 7). The uncertainty ranged from ±0.10 to ±1.9% for all phases (Figure 7).
Pre-test thin sections were taken from the same interval as samples MP1-3, but not from the plugs themselves. No pre-test thin section exists for MP4. Post-test thin sections were cut as a plane lying along the long axis of all plugs.
In the post-test thin sections of samples MP1-3, there were no volumetric differences from pre-test observations in quartz overgrowths, but there was 2–3% less undifferentiated clays and 1–3% more kaolinite. The volumetric quantity of ankerite was similar in pre- and post-test thin sections of all samples; however, there was extensive evidence of alteration in MP1 and MP3, which interacted with the CO2-rich brackish solution, and some evidence in the brackish solution-only control experiment MP2 which was noted due to crystal deterioration and iron oxide precipitate coatings (Figure 8a). Although below 1% in the pre-test thin sections, calcite did not exist in the post-test thin sections of MP1 and MP3, but remained volumetrically unchanged in MP2. For MP4, no pre-test thin section exists, and the post-test thin section has only one crystal of ankerite (Figure 8b), no calcite, about 1% less quartz overgrowths, 1% more kaolinite, and similar percentages of clays compared to post-test thin sections for MP1-3.
For porosity, there was no measurable change in MP1, and 1% and 3% increases in porosity in MP2 and MP3, respectively. The 3% increase in MP3 occurred as roughly 2% more macroporosity and 1% more each of kaolinite microporosity and dissolution porosity in feldspar grains and rock fragments (Figure 7). The 1% increase in control experiment (MP2) occurred as roughly 2% and 1% more macroporosity and microporosity, respectively, and 2% less clay microporosity. The post-test thin section of MP4 had approximately 1% (MP1) and 3% (MP2 and MP3) less total porosity than the other post-test thin sections. The lower abundance typically occurred due to lower macroporosity or microporosity compared to samples in other experiments.
The pre-test thin sections indicated that all samples of the macroporous-dominated lithofacies studied in [37] were fractured to some extent during burial. Deformation was the most extensive in the sample MP3 and was less apparent in samples MP1-2. The microfractures were typically intragranular, with a low intensity and thin aperture and porosity can be visualized within them (Figure 9a). Macroporosity was common around low intergranular volume (IGV) areas where grains were fractured (Figure 9a). Damage was the most abundant in the thin section from MP2, which was performed only with reservoir brackish solution. The deformed zones had a high fracture intensity with numerous events occurring within individual framework grains (Figure 9b–d). The offset of fractured pieces of individual grains often occurred (Figure 9d). Intergranular fracturing was sometimes apparent (Figure 9c), and grain consolidation seemed to have occurred in severely damaged zones indicated by a loss of macroporosity (Figure 9b,c). The other experiments typically had scattered instances of microfractures, which likely occurred during testing. However, because no large zones of deformation existed in those thin sections, this attribution remains uncertain.
We do not recommend comparing the volumetric mineral changes from sample to sample because of heterogeneity. Instead, we summarized the general changes in volumetric mineral phases.

5. Discussion

In general, the porosity and permeability increase after the HCM coupling process (Figure 10). Two exceptions are Chl3 and Kao3 (control samples), whose permeability decreased after the HCM coupling process. This observation might be solely impacted by compaction processes, since no CO2 was present in the flow-through environment in these two control samples. Although the core sample was too small compared to the reservoir heterogeneity, the shifting of core samples to a new HFU still indicates the possibility of the same shifting behavior of portions throughout the entire geological formation as CO2 migrates into new areas and CO2-saturated solutions with dissolved salts convect downward into the formation, exposing fresh waters to the CO2.
The complete results indicate that the interaction of the texture and reactivity of diagenetic minerals with CO2-induced chemical reactions determines the hydro-chemo-mechanical degradation of the different HFUs of the Morrow B sandstone. In particular, the degree of pore-filling carbonate or chlorite cements vs. interconnected open pores control the sensitivity of hydraulic properties to exposure to CO2, while the location and degree of grain-supporting textures of carbonate vs. quartz cements controls the impacts on strength. The samples of HFU1-2 (CCS1-3; Cal/Kao2) are dominated by intragranular microporosity within calcite and carbonate cements and some clay cements that filled the primary porosities, and feldspars and rock fragments. Calcite cement filled most porosities around quartz and other disseminated carbonates, occurring before significant consolidation could occur. In the CO2-exposed samples, we observed more than an order of magnitude increases in permeability with mild increases in porosity. The XRCT imaging reveal the formation of ‘wormhole’-like textures, with the greatest dissolution near the upstream end of the sample. Mild (<10%) velocity changes were observed, consistent with an increase in porosity. These samples were also the only samples to show significant tensile strength degradation. We believe that these hydraulic and mechanical changes are almost entirely due to the early and extensive cementation of the samples. Reactive cements (calcite) are in a primary load-bearing texture and also controlled the permeability, so the dissolution of these cements will have a major effect on the properties of the formation.
The HFU3-4 samples were dominated by intergranular microporosity with a broad range of dispersed pore-filling cements including siderite, ankerite, kaolinite and chlorite. Most importantly, quartz overgrowths formed early during the formation burial history and continued to grow throughout burial. These samples experienced complex patterns of dissolution and precipitation. Iron-rich minerals (chlorite, siderite, and ankerite) dissolved, opening new pathways through the now open macropores and opening microporosity, but the dissolved iron then rapidly precipitated. Overall, the primarily carbonate-cemented samples experienced greater increases in permeability than chlorite-cemented samples, and neither set experienced a large increase or decrease in porosity. The XRCT imaging and visual petrography revealed that dissolution is disseminated, consistent with the original cementation texture, but appears to visually create new fast paths through the samples. This indicates that the position and relative abundance of reactive minerals control—and may improve—reservoir performance.
Mechanically, no significant change in tensile strength was observed and the velocities were found to increase and decrease by between 2 and 14%, with the largest decreases observed in the carbonate-cemented facies of HFU3-4. The lack of change in tensile strength is allowed by the early, non-reactive, and load-bearing quartz overgrowth textures combined with more extensive long to sutured grain contacts. Reactive cements mostly filled large primary pores and are not volumetrically substantial to be load bearing. This means that volumetrically minor but early—and thus load-bearing—non-reactive cements play an outsized role in controlling the strength of these sandstones. Decreases in P- and S-wave velocities did not correspond to a decrease in strength. Rather, velocity decreases reflected modest increases in porosity and, possibly longer, well-connected open pores along the axis of velocity measurements. They may also be a good indicator of fine migration or new clay precipitation in the samples that are not reacted with CO2.
We studied HFU5 extensively. It is the primary injection and storage unit of the Morrow B sandstone reservoir [47]. We conducted both flow-through experiments under reservoir conditions to understand the immediate changes and creep deformation experiments with flow-through at a higher temperature and effective stress to understand the changes during long-term CO2 injection. The unit has a well-connected intergranular porosity with limited pore-filling, reactive cements, but does have early quartz cementation and long to sutured grain contacts. Modest (factor of 2) increases in permeability and little change in porosity were observed after both the flow-through and creep experiments. Prior and the new petrographic observations of flow-through samples revealed minor, disseminated dissolution of reactive cements for both sets of samples. Local fractured zones were newly observed in one of the creep experiments. Additionally, XRCT imaging of the flow-through experiments confirmed the minor and disseminated dissolution pattern. Thus, again, the diagenetically controlled location of carbonate cements appears to control changes in permeability and porosity in HFU5.
No significant strength degradation and little to no long-term creep deformation was observed in these samples. The velocities decreased, with the greatest decreases observed in samples with newly formed cracks. The static bulk modulus varied more through the control (brackish solution-only period) experiments and there was less (3% or less) variation in bulk modulus during the CO2-exposed periods. This behavior of the bulk modulus could be explained by the stress corrosion in quartz and calcite that was dominated by hydrolysis, i.e., surface reactions where OH from dissociated water break bonds between Ca and CO3 or Si and O preferentially at stress concentrations [55,56,57]. This process causes the propagation of fractures at subcritical stresses—below the yield, or ‘first-cracking’ stress in quasistatic tests. Relatively little work has been performed to systematically evaluate what competing effects control the rate of stress corrosion cracking. However, the authors of [58,59] conducted a series of experiments focused on chemical controls of the strain accumulation of relatively pure quartz sand at high (10 to 30 MPa), mean, and differential stresses. Cumulatively, their work showed that stress corrosion increases with stress and temperature but also, vitally, happens even when the solution is saturated with quartz. Ref. [59] documented a decrease in micro-cracking and strain accumulation in solutions with CO2. The mechanism proposed is a reduction in available OH given the acidification of the solution; however, the authors of [58] showed that large increases in pH had some but not a major effect. We believe the mechanism is more likely due to CO2′s tendency to replace or disrupt OH and structured water on silicate and carbonate surfaces. However, this is not explicitly documented for quartz or feldspar minerals [60]. Just as in the other HFUs, the velocity decreases appear to be controlled primarily by increases in porosity, but also possibly by the addition of zones of cracking. The early quartz-overgrowth cements—which, again, are non-reactive—limit strength degradation.
We believe that the variability of the static bulk modulus reflects episodic fracturing and subsequent ‘healing’ of subcritical fractures. Direct evidence of localized fracturing was observed in thin sections. Importantly, this variability and fracturing was observed in brackish solution-only samples. It appears that CO2 inhibits the formation of subcritical fractures and other surface-chemistry-driven deformation mechanisms, consistent with the observations in [59].
There have been extensive studies on the impact of the acidification of formation waters by CO2 on the geochemistry and hydraulic and mechanical properties of formation rocks [23,33,35,36]. However, very few have examined intra-formation heterogeneity [21]. Moreover, intra-formation heterogeneity is common in many sandstones, particularly fluvial sandstones and sandstones that have undergone extensive diagenesis [61]; poor or complex reservoir behavior is often attributed to this heterogeneity, but without careful analysis.

6. Conclusions

We concluded that most of the Morrow B sandstone (HFU3-5) was tested to be a highly robust reservoir with a low risk of mechanical degradation. CO2 injection improves the reservoir storage capacity by increasing the porosity and permeability without significantly damaging the geomechanical properties. However, CO2 injection to the basal layer of the Morrow B sandstone formation should be avoided since the dissolution of poikilotopic calcite might overcome the effect of diagenesis and lead to problematic outcomes in the reservoir’s geomechanical properties. When considering reservoir selection and monitoring, our results suggest that the following heuristics should be considered:
  • Primary mineralogy of sandstones should be dominated by felsic minerals to limit reactivity.
  • Preference should be given to early-stage, non-reactive cements such as quartz overgrowths. Given its limited solubility in CO2-enriched saline waters, anhydrite may also be a reasonable early cement.
  • If reactive cements (i.e., carbonate and Fe-rich chlorite cements) are present, it is best if they formed late in the diagenetic sequence and are not load-bearing.
  • If non-reactive, load-bearing cements and late-stage, reactive cements are present, reservoir performance (injectivity) may significantly improve without losing reservoir mechanical integrity.
  • For long-term injection programs, it appears that CO2 will inhibit subcritical fractures and, thus, mechanical weakening of the reservoir.
  • Minor dissolution of cements decreases ultrasonic velocities by up to 300 m/s, which may create ambiguity in monitoring the plume of supercritical CO2.
  • Degradation of seismic velocities during injection may suggest a loss of strength but is not a strong indicator; local rock texture controls whether changes in velocities will correspond to changes in strength.
These suggestions appear common sense—sedimentologists have been recommending heuristics like these for decades without extensive quantitative data. By carefully studying the performance of a well-characterized and heterogeneous reservoir, integrating petrography, geochemistry, hydraulic properties, and mechanical properties, we have been able to reveal an integrated understanding of where a reservoir will be sensitive and, perhaps more importantly, where a reservoir will not be sensitive to CO2 injection.

Author Contributions

Conceptualization, A.R., A.L. and Z.W.; methodology, Z.W., J.D.S., S.O., A.L. and A.R.; investigation, Z.W., J.D.S., S.O. and J.H.; resources: B.S.M.; writing—original draft preparation, Z.W., J.D.S. and A.R.; writing—review and editing, all authors; visualization, Z.W., J.D.S., S.O. and J.H.; supervision, A.R., A.L. and P.M. All authors have read and agreed to the published version of the manuscript.

Funding

Funding for this project is provided by the U.S. Department of Energy’s (DOE) National Energy Technology Laboratory (NETL) through the Southwest Regional Partnership on Carbon Sequestration (SWP) under Award No. DE-FC26-05NT42591.

Data Availability Statement

The supporting data can be downloaded at NETL’s Energy Data eXchange data repository (https://doi.org/10.18141/2221813).

Acknowledgments

We thank Brian McPherson, Martha Cather, and Robert Balch for administering the broader project; Bonnie Frey and Dustin Baca for performing the fluid chemistry analyses; Nels Iverson and Lynn Heizler for help with the microprobe analyses; Benjamin Tutolo for providing the database used in the geochemical modeling; Chunyang Tan for providing the pressure logging program; Jim McLemore and Kate Wavrik for help in the lab; and Ryan Leary for access to his petrographic microscope. We also thank James Griego, Priya Pathare, and Philip Noell for performing the X-ray CT scans, and Perry Barrow and Scott Broome for the ultrasonic measurements and specimen preparation at Sandia National Laboratories. Additional support has been provided by former and current site operators and SLB. Sandia National Laboratories is a multi-mission laboratory managed and operated by National Technology & Engineering Solutions of Sandia, LLC (NTESS), a wholly owned subsidiary of Honeywell International Inc., for the U.S. Department of Energy’s National Nuclear Security Administration (DOE/NNSA) under contract DE-NA0003525. This written work is authored by an employee of NTESS. The employee, not NTESS, owns the rights, title, and interest in and to the written work and is responsible for its contents. Any subjective views or opinions that might be expressed in the written work do not necessarily represent the views of the U.S. Government. The publisher acknowledges that the U.S. Government retains a non-exclusive, paid-up, irrevocable, world-wide license to publish or reproduce the published form of this written work or allow others to do so, for U.S. Government purposes. The DOE will provide public access to the results of federally sponsored research in accordance with the DOE Public Access Plan.

Conflicts of Interest

The authors declare no conflict of interest.

References

  1. Rezk, M.G.; Foroozesh, J.; Zivar, D.; Mumtaz, M. CO2 storage potential during CO2 enhanced oil recovery in sandstone reservoirs. J. Nat. Gas Sci. Eng. 2019, 66, 233–243. [Google Scholar] [CrossRef]
  2. Celia, M.A. Geological storage of captured carbon dioxide as a large-scale carbon mitigation option. Water Resour. Res. 2017, 53, 3527–3533. [Google Scholar] [CrossRef]
  3. Dai, Z.; Viswanathan, H.; Xiao, T.; Middleton, R.; Pan, F.; Ampomah, W.; Yang, C.; Zhou, Y.; Jia, W.; Lee, S.-Y.; et al. CO2 Sequestration and Enhanced Oil Recovery at Depleted Oil/Gas Reservoirs. Energy Procedia 2017, 114, 6957–6967. [Google Scholar] [CrossRef]
  4. Dai, Z.; Middleton, R.; Viswanathan, H.; Fessenden-Rahn, J.; Bauman, J.; Pawar, R.; Lee, S.-Y.; McPherson, B. An Integrated Framework for Optimizing CO2 Sequestration and Enhanced Oil Recovery. Environ. Sci. Technol. Lett. 2014, 1, 49–54. [Google Scholar] [CrossRef]
  5. Dash, S.K.; Chakraborty, S.; Elangovan, D. A Brief Review of Hydrogen Production Methods and Their Challenges. Energies 2023, 16, 1141. [Google Scholar] [CrossRef]
  6. Godin, J.; Liu, W.; Ren, S.; Xu, C.C. Advances in recovery and utilization of carbon dioxide: A brief review. J. Environ. Chem. Eng. 2021, 9, 105644. [Google Scholar] [CrossRef]
  7. Zhang, Z.; Pan, S.-Y.; Li, H.; Cai, J.; Olabi, A.G.; Anthony, E.J.; Manovic, V. Recent advances in carbon dioxide utilization. Renew. Sustain. Energy Rev. 2020, 125, 109799. [Google Scholar] [CrossRef]
  8. Wellman, T.P.; Grigg, R.B.; McPherson, B.J.; Svec, R.K.; Lichtner, P.C. Evaluation of CO2-brine-reservoir rock interaction with laboratory flow tests and reactive transport modeling. In Proceedings of the International Symposium on Oilfield Chemistry, Houston, TX, USA, 5–7 February 2003. [Google Scholar]
  9. Dai, Z.; Xu, L.; Xiao, T.; McPherson, B.; Zhang, X.; Zheng, L.; Dong, S.; Yang, Z.; Soltanian, M.R.; Yang, C.; et al. Reactive chemical transport simulations of geologic carbon sequestration: Methods and applications. Earth-Sci. Rev. 2020, 208, 103265. [Google Scholar] [CrossRef]
  10. Raza, A.; Gholami, R.; Rabiei, M.; Rasouli, V.; Rezaee, R.; Fakhari, N. Impact of geochemical and geomechanical changes on CO2 sequestration potential in sandstone and limestone aquifers. Greenh. Gases Sci. Technol. 2019, 9, 905–923. [Google Scholar] [CrossRef]
  11. Zheng, H.; Feng, X.-T.; Li, S.; Qiu, S.; Wang, B. Coupled chemo-mechanical behavior of CO2 mineral trapping in the reservoir sandstones during CO2–EWR. Environ. Earth Sci. 2019, 78, 481. [Google Scholar] [CrossRef]
  12. Gaus, I.; Audigane, P.; André, L.; Lions, J.; Jacquemet, N.; Durst, P.; Czernichowski-Lauriol, I.; Azaroual, M. Geochemical and solute transport modelling for CO2 storage, what to expect from it? Int. J. Greenh. Gas Control. 2008, 2, 605–625. [Google Scholar] [CrossRef]
  13. Roded, R.; Paredes, X.; Holtzman, R. Reactive transport under stress: Permeability evolution in deformable porous media. Earth Planet. Sci. Lett. 2018, 493, 198–207. [Google Scholar] [CrossRef]
  14. Ampomah, W.; Balch, R.; Grigg, R.B.; Cather, M.; Gragg, E.; Will, R.A.; White, M.; Moodie, N.; Dai, Z. Performance assessment of CO2-enhanced oil recovery and storage in the Morrow reservoir. Géoméch. Geophys. Geo-Energy Geo-Resour. 2017, 3, 245–263. [Google Scholar] [CrossRef]
  15. Ampomah, W.; Balch, R.S.; Cathar, M.; Will, R.; Lee, S.Y.; Dai, Z. Performance of CO2-EOR and Storage Processes Under Uncertainty. In Proceedings of the SPE Europec featured at 78th EAGE Conference and Exhibition, Vienna, Austria, 30 May–2 June 2016. [Google Scholar]
  16. Pan, F.; McPherson, B.J.; Dai, Z.; Jia, W.; Lee, S.-Y.; Ampomah, W.; Viswanathan, H.; Esser, R. Uncertainty analysis of carbon sequestration in an active CO2-EOR field. Int. J. Greenh. Gas Control 2016, 51, 18–28. [Google Scholar] [CrossRef]
  17. William Ampomah, R.S.B.; Grigg, R.B.; McPherson, B.; Will, R.A.; Lee, S.-Y.; Dai, Z.; Pan, F. Co-optimization of CO2-EOR and storage processes in mature oil reservoirs. Greenh. Gases Sci. Technol. 2017, 7, 128–142. [Google Scholar] [CrossRef]
  18. Dai, Z.; Viswanathan, H.; Middleton, R.; Pan, F.; Ampomah, W.; Yang, C.; Jia, W.; Xiao, T.; Lee, S.-Y.; McPherson, B.; et al. CO2 Accounting and Risk Analysis for CO2 Sequestration at Enhanced Oil Recovery Sites. Environ. Sci. Technol. 2016, 50, 7546–7554. [Google Scholar] [CrossRef]
  19. Khosravi, M.H.; Kheirollahi, M.; Liu, B.; Gentzis, T.; Liu, K.; Morta, H.B.; Ostadhassan, M. Physico-chemo-mechanical impact of sc-CO2 on shale formations: The Bakken. Gas Sci. Eng. 2023, 112, 204945. [Google Scholar] [CrossRef]
  20. Luquot, L.; Gouze, P. Experimental determination of porosity and permeability changes induced by injection of CO2 into carbonate rocks. Chem. Geol. 2009, 265, 148–159. [Google Scholar] [CrossRef]
  21. Rinehart, A.J.; Dewers, T.A.; Broome, S.T.; Eichhubl, P. Effects of CO2 on mechanical variability and constitutive behavior of the Lower Tuscaloosa Formation, Cranfield Injection Site, USA. Int. J. Greenh. Gas Control 2016, 53, 305–318. [Google Scholar] [CrossRef]
  22. Wang, K.; Ma, L.; Taylor, K.G. Microstructure changes as a response to CO2 storage in sedimentary rocks: Recent developments and future challenges. Fuel 2023, 333, 126403. [Google Scholar] [CrossRef]
  23. Rathnaweera, T.D.; Ranjith, P.G.; Perera, M.S.A.; Ranathunga, A.S.; Wanniarachchi, W.A.M.; Yang, S.Q.; Lashin, A.; Arifi, N.A. An experimental investigation of coupled chemico-mineralogical and mechanical changes in varyingly-cemented sandstones upon CO2 injection in deep saline aquifer environments. Energy 2017, 133, 404–414. [Google Scholar] [CrossRef]
  24. Carroll, S.A.; McNab, W.W.; Dai, Z.; Torres, S.C. Reactivity of Mount Simon Sandstone and the Eau Claire Shale Under CO2 Storage Conditions. Environ. Sci. Technol. 2013, 47, 252–261. [Google Scholar] [CrossRef] [PubMed]
  25. Jia, W.; Xiao, T.; Wu, Z.; Dai, Z.; McPherson, B. Impact of Mineral Reactive Surface Area on Forecasting Geological Carbon Sequestration in a CO2-EOR Field. Energies 2021, 14, 1608. [Google Scholar] [CrossRef]
  26. Tutolo, B.M.; Luhmann, A.J.; Kong, X.-Z.; Saar, M.O.; Seyfried, W.E. CO2 sequestration in feldspar-rich sandstone: Coupled evolution of fluid chemistry, mineral reaction rates, and hydrogeochemical properties. Geochim. Cosmochim. Acta 2015, 160, 132–154. [Google Scholar] [CrossRef]
  27. Pearce, J.K.; Dawson, G.K.W.; Sommacal, S.; Golding, S.D. Micro CT and Experimental Study of Carbonate Precipitation from CO2 and Produced Water Co-Injection into Sandstone. Energies 2021, 14, 6998. [Google Scholar] [CrossRef]
  28. Kaufmann, G.; Dreybrodt, W. Calcite dissolution kinetics in the system CaCO3–H2O–CO2 at high undersaturation. Geochim. Cosmochim. Acta 2007, 71, 1398–1410. [Google Scholar] [CrossRef]
  29. Pandey, S.N.; Chaudhuri, A.; Kelkar, S.; Sandeep, V.R.; Rajaram, H. Investigation of permeability alteration of fractured limestone reservoir due to geothermal heat extraction using three-dimensional thermo-hydro-chemical (THC) model. Geothermics 2014, 51, 46–62. [Google Scholar] [CrossRef]
  30. Zhou, X.P.; Du, E.B.; Wang, Y.T. Thermo-hydro-chemo-mechanical coupling peridynamic model of fractured rock mass and its application in geothermal extraction. Comput. Geotech. 2022, 148, 104837. [Google Scholar] [CrossRef]
  31. Tian, S.; Zhou, J.; Xian, X.; Gan, Q.; Yang, K.; Zheng, Y.; Deng, G.; Zhang, F. Impact of supercritical CO2 exposure time on the porosity and permeability of dry and wet shale: The influence of chemo-mechanical coupling effects. Energy 2023, 270, 126905. [Google Scholar] [CrossRef]
  32. Espinoza, D.N.; Jung, H.; Major, J.R.; Sun, Z.; Ramos, M.J.; Eichhubl, P.; Balhoff, M.T.; Choens, R.C.; Dewers, T.A. CO2 charged brines changed rock strength and stiffness at Crystal Geyser, Utah: Implications for leaking subsurface CO2 storage reservoirs. Int. J. Greenh. Gas Control 2018, 73, 16–28. [Google Scholar] [CrossRef]
  33. Rathnaweera, T.; Ranjith, P.; Perera, M.; Haque, A.; Lashin, A.; Al Arifi, N.; Chandrasekharam, D.; Yang, S.; Xu, T.; Wang, S.; et al. CO2-induced mechanical behaviour of Hawkesbury sandstone in the Gosford basin: An experimental study. Mater. Sci. Eng. A 2015, 641, 123–137. [Google Scholar] [CrossRef]
  34. Rohmer, J.; Pluymakers, A.; Renard, F. Mechano-chemical interactions in sedimentary rocks in the context of CO2 storage: Weak acid, weak effects? Earth-Sci. Rev. 2016, 157, 86–110. [Google Scholar] [CrossRef]
  35. Lamy-Chappuis, B.; Angus, D.; Fisher, Q.J.; Yardley, B.W. The effect of CO2-enriched brine injection on the mechanical properties of calcite-bearing sandstone. Int. J. Greenh. Gas Control. 2016, 52, 84–95. [Google Scholar] [CrossRef]
  36. Hangx, S.; van der Linden, A.; Marcelis, F.; Bauer, A. The effect of CO2 on the mechanical properties of the Captain Sandstone: Geological storage of CO2 at the Goldeneye field (UK). Int. J. Greenh. Gas Control 2013, 19, 609–619. [Google Scholar] [CrossRef]
  37. Otu, S.; Rinehart, A.J.; Luhmann, A.J.; Simmons, J.; Mozley, P. Effects of CO2 on creep deformation in sandstones at carbon sequestration reservoir conditions: An experimental study. Int. J. Greenh. Gas Control. 2023, 129, 103970. [Google Scholar] [CrossRef]
  38. Simmons, J.; Rinehart, A.; Luhmann, A.; Mozley, P.; Heath, J.; Majumdar, B. Using petrographically observable microstructure to predict hydromechanical changes in a complex siliciclastic storage site during CO2 injection. Int. J. Greenh. Gas Control. 2022, 119, 103724. [Google Scholar] [CrossRef]
  39. Simmons, J.D.; Wang, S.; Luhmann, A.J.; Rinehart, A.J.; Heath, J.E.; Majumdar, B.S. Paragenetic controls on CO2-fluid-rock interaction and weakening in a macroporous-dominated sandstone. Appl. Geochem. 2023, 156, 105744. [Google Scholar] [CrossRef]
  40. Wu, Z.; Luhmann, A.J.; Rinehart, A.J.; Mozley, P.S.; Dewers, T.A.; Heath, J.E.; Majumdar, B.S. Chemo-mechanical Alterations Induced from CO2 Injection in Carbonate-Cemented Sandstone: An Experimental Study at 71 degrees C and 29 MPa. J. Geophys. Res. Solid Earth 2020, 125, e2019JB019096. [Google Scholar] [CrossRef]
  41. Gallagher, S. Depositional and Diagenetic Controls on Reservoir Heterogeneity: Upper Morrow Sandstone, Farnsworth Unit, Ochiltree County, Texas. Master’s Thesis, New Mexico Institute of Mining and Technology, Socorro, NM, USA, 2014. [Google Scholar]
  42. Rose-Coss, D. A refined depositional sequence stratographic and structural model for the reservoir and caprok intervals at the Farnsworth Unit, Ochilltree County, TX. Master’s Thesis, New Mexico Institute of Mining and Technology, Socorro, NM, USA, 2016. [Google Scholar]
  43. Krystinik, L.F.; Blakeney, B.A. Sedimentology of the Upper Morrow Formation in Eastern Colorado and Western Kansas; Rocky Mountain Association of Geologists: Denver, CO, USA, 1990. [Google Scholar]
  44. Gragg, E. Petroleum System Modeling of the Northwest Anadarko Basin: Implications for Carbon Storage. Master’s Thesis, New Mexico Institute of Mining and Technology, Socorro, NM, USA, 2016. [Google Scholar]
  45. Nelson, P.H.; Gianoutsos, N.J.; Ii, R.M.D. Underpressure in Mesozoic and Paleozoic rock units in the Midcontinent of the United States. AAPG Bull. 2015, 99, 1861–1892. [Google Scholar] [CrossRef]
  46. Sorenson, R.P. A dynamic model for the Permian Panhandle and Hugoton fields, western Anadarko basin. AAPG Bull. 2005, 89, 921–938. [Google Scholar] [CrossRef]
  47. Rasmussen, L.; Fan, T.; Rinehart, A.; Luhmann, A.; Ampomah, W.; Dewers, T.; Heath, J.; Cather, M.; Grigg, R. Carbon Storage and Enhanced Oil Recovery in Pennsylvanian Morrow Formation Clastic Reservoirs: Controls on Oil–Brine and Oil–CO2 Relative Permeability from Diagenetic Heterogeneity and Evolving Wettability. Energies 2019, 12, 3663. [Google Scholar] [CrossRef]
  48. Pettijohn, F.J.; Potter, P.E.; Siever, R. Sand and Sandstone; Springer: New York, NY, USA, 1987. [Google Scholar]
  49. Howarth, R.J. Improved estimators of uncertainty in proportions, point-counting, and pass-fail test results. Am. J. Sci. 1998, 298, 594–607. [Google Scholar] [CrossRef]
  50. Duan, Z.; Sun, R. An improved model calculating CO2 solubility in pure water and aqueous NaCl solutions from 273 to 533 K and from 0 to 2000 bar. Chem. Geol. 2003, 193, 257–271. [Google Scholar] [CrossRef]
  51. Darcy, H. Les Fontaines Publiques de la Ville de Dijon: Exposition et Application des Principes à Suivre et des Formules à Employer dans les Questions de Distribution d’Eau; Victor Dalmont: Paris, France, 1856; Volume 1. [Google Scholar]
  52. Bethke, C.M.; Yeakel, S. The Geochemists Workbench: Reference Manual; Aqueous Solutions, LLC: Champaign, IL, USA, 2013. [Google Scholar]
  53. Fjaer, E.; Holt, R.M.; Horsrud, P.; Raaen, A.M.; Risnes, R. (Eds.) Petroleum Related Rock Mechanics; Developments in Petroleum Science; Elsevier: Amsterdam, The Netherlands, 2008. [Google Scholar]
  54. D3967-95a; Standard Test Method for Splitting Tensile Strength of Intact Rock Core Specimens. ASTM International: West Conshohocken, PA, USA, 1995.
  55. Atkinson, B.K. Subcritical Crack Growth in Geological Materials. J. Geophys. Res. 1984, 89, 4077–4114. [Google Scholar] [CrossRef]
  56. Dove, P.M. Geochemical controls on the kinetics of quartz fracture at subcritical tensile stresses. J. Geophys. Res. Solid Earth 1995, 100, 22349–22359. [Google Scholar] [CrossRef]
  57. Ilgen, A.G.; Mook, W.M.; Tigges, A.B.; Choens, R.C.; Artyushkova, K.; Jungjohann, K.L. Chemical Controls on the Propagation Rate of Fracture in Calcite. Sci. Rep. 2018, 8, 16465. [Google Scholar] [CrossRef]
  58. Brzesowsky, R.H.; Hangx, S.J.T.; Brantut, N.; Spiers, C.J. Compaction Creep of Sands Due to Time-Dependent Grain Failure: Effects of Chemical Environment, Applied Stress, and Grain Size. J. Geophys. Res. Solid Earth 2014, 119, 7521–7541. [Google Scholar] [CrossRef]
  59. Hangx, S.J.T.; Spiers, C.J.; Peach, C.J. Creep of simulated reservoir sands and coupled chemical-mechanical effects of CO2 injection. J. Geophys. Res. Solid Earth 2010, 115, B09205. [Google Scholar] [CrossRef]
  60. Taifan, W.; Boily, J.F.; Baltrusaitis, J. Surface Chemistry of Carbon Dioxide Revisited. Surf. Sci. Rep. 2016, 71, 595–671. [Google Scholar] [CrossRef]
  61. Scholle, P.A.; Ulmer-Scholle, D.S. A Color Guide to the Petrography of Carbonate Rocks: Grains, Textures, Porosity, Diagenesis; American Association of Petroleum Geologists: Tulsa, OK, USA, 2003. [Google Scholar]
Figure 1. Schematic drawing of flow-through apparatus. Reprinted with permission from International Journal of Greenhouse Gas Control [38].
Energies 16 07949 g001
Figure 2. Schematic drawing of hydrostatic pressure vessel in creep/flow-through apparatus. Compared to the pressure vessel in flow-through apparatus, the hydrostatic pressure vessel has an additional linear variable differential transformer (LVDT) for measuring axial displacement from changing the confining pressure. Reprinted with permission from SSRN [37].
Energies 16 07949 g002
Figure 3. Diagenetic sequence. The question mark means that the exact start or end time is not specific and that the event could have begun or finished some time earlier or later than the bar line.
Energies 16 07949 g003
Figure 4. Indirect tensile strength of fifteen post-experimental samples as a function of the distance from the upstream end. Note that CO2-treated samples CCS1-2 show a prominent decrease in strength towards the upstream end of the sample, while all other sample show negligible differences in tensile strength across the sample length.
Energies 16 07949 g004
Figure 5. Post-test vs. pre-test P-wave velocity. In most samples, the pre-test P-wave velocity is slightly higher than or similar to the post-test P-wave velocity, except for two samples (Chl1 and Kao1).
Energies 16 07949 g005
Figure 6. (a,b) The 3D rendering of the pre- and post-test difference with 27 μm resolution in samples Chl1 (a) and Cal/Kao2 (b) showing minor dissolution with unconnected porosity in Chl1 and significant dissolution with connected porosity in Cal/Kao2. The color scale bar is a quantitative representation of the pre- and post-test difference. (c) Pre- and post-test data, and the subtraction of the post-test from the pre-test values of 11 µm resolution images for a slice of sample Unc3 showing clay migration and/or precipitation at multiple locations. The color scalebar indicates change reliability where positive is dissolution (white) and negative is precipitation or movement of clays (dark browns). Black is the most negative and generally represents an artifact in imaging and post-processing of the brightest phase. Reproduced with permission from [38].
Energies 16 07949 g006
Figure 7. Bar charts of cement and porosity from point count analysis on samples MP1-3 for the macroporous-dominated lithofacies studied in [37]. Uncertainty ranged from ±0.1 to 1.9% and is shown as error bars for each phase. Kao Micro is kaolinite microporosity, Dissolved is dissolution porosity, Macro is macroporosity, and Micro is clay microporosity and other microporosities.
Energies 16 07949 g007
Figure 8. Alteration of ankerite occurs frequently in tests performed with a CO2-rich fluid, as indicated by deterioration of its crystal structure. (a) MP1, which also sometimes displays new coatings of iron oxide; (b) MP4.
Energies 16 07949 g008
Figure 9. Microfractures that occur during burial usually have a low intensity and aperture, and deformed grains are in macroporous regions (a). Post-test, new microfractures exist with much greater intensities (bd), and are sometimes intergranular (b,c). Grain consolidation appears to occur in highly deformed zones noted by the loss of macroporosity (b,c). Offset of newly fractured zones within grains also occurs (d). Intergranular in (b,c) is an intergranular microfracture.
Energies 16 07949 g009
Figure 10. Change in porosity-permeability correlation or HFU of all 19 samples from flow-through and creep/flow-through experiments. CO2-reacted samples with disseminate carbonate (Disseminated Carb) include ten samples, CO2-reacted samples with poikilotopic calcite (Poikilotopic Calcite) include three samples, and control samples (Control) include six samples. Pre-test results are hollow markers and post-test results are solid markers. Note large deviations of permeability and porosity in some samples of Poikilotopic Calcite (red rhombi) and Disseminated Carb (blue triangles).
Energies 16 07949 g010
Table 1. Sample sources and their hydraulic flow units (HFUs).
Morrow B Sandstone SampleWellDepth (m)HFUAve. Diameter (cm)Ave. Length (cm)Number of Samples
(MP1, MP2, MP3, MP4)13-142354.7–2355.853.717.204
(Unc1, Unc2, Unc3)13-10A2340.7–2341.152.555.513
Siderite-chlorite-cemented
(Chl1, Chl2, Chl3)
13-10A2337.45–2338.3342.545.243
Ankerite-siderite-cemented
(ASCS1, ASCS2, ASCS3)
13-10A2339.4–2339.542.615.423
Kaolinite-cemented
(Kao1, Cal/Kao2, Kao3)
13-10A2342.28–2342.5732.565.223
Calcite-cemented
(CCS1, CCS2, CCS3)
13-10A2348.1–2348.212.605.203
Table 2. Flow-through experiments. Data from [38,40].
Sample IDFluidFlow Rate (mL/min)Duration (Days)Depth (m)Diameter (cm)Length (cm)Fluid Volume (mL)Pore Volume
Chl1Brackish + CO20.01352337.5–2338.32.575.32500130–260
Chl2Brackish + CO20.13.52.495.21500
Chl3Brackish0.01352.555.20500
ASCS1Brackish + CO20.01352339.4–2339.52.615.48500267
ASCS2Brackish + CO20.13.52.615.32500176
ASCS3Brackish0.01352.615.45500147
Unc1Brackish + CO20.01352340.7–2341.12.555.42500176
Unc2Brackish + CO20.13.52.565.54500166
Unc3Brackish0.01352.555.57500172
Kao1Brackish + CO20.01352342.3–2342.62.585.11500130–260
Cal/Kao2Brackish + CO20.13.52.575.11500
Kao3Brackish0.01352.545.44500
CCS1Brackish + CO20.01352348.1–2348.22.615.30500499
CCS2Brackish + CO20.02 + 0.01322.595.09500675
CCS3Brackish0.01352.595.20500597
Table 3. Creep/flow-through experiments. Data from [37,39].
Sample IDFluidFlow Rate (mL/min)Duration (Days)Depth (m)Diameter (cm)Length (cm)Fluid Volume (mL)Pore Volume
MP1Brackish + CO20.01242354.7–2355.83.637.1227224.4
MP2Brackish0.01283.677.1438838.0
MP3 *Brackish|Brackish + CO20.02383.727.52509|50842.1|42.0
MP4 *Brackish|Brackish + CO20.183.827.05509|51348.2|48.6
* Note: A brackish solution flowed through samples MP3 and MP4 for the first half of the experiment, followed by the flow of a CO2-enriched brackish solution for the second half of the experiment.
Table 4. Paragenetic events, accompanied with the description of evidence and photomicrographs.
Paragenetic EventEvidencePhotomicrographs
Quartz (Qtz) overgrowths occurred before carbonate cementation/replacementSiderite cement always surrounds quartz overgrowthsEnergies 16 07949 i001
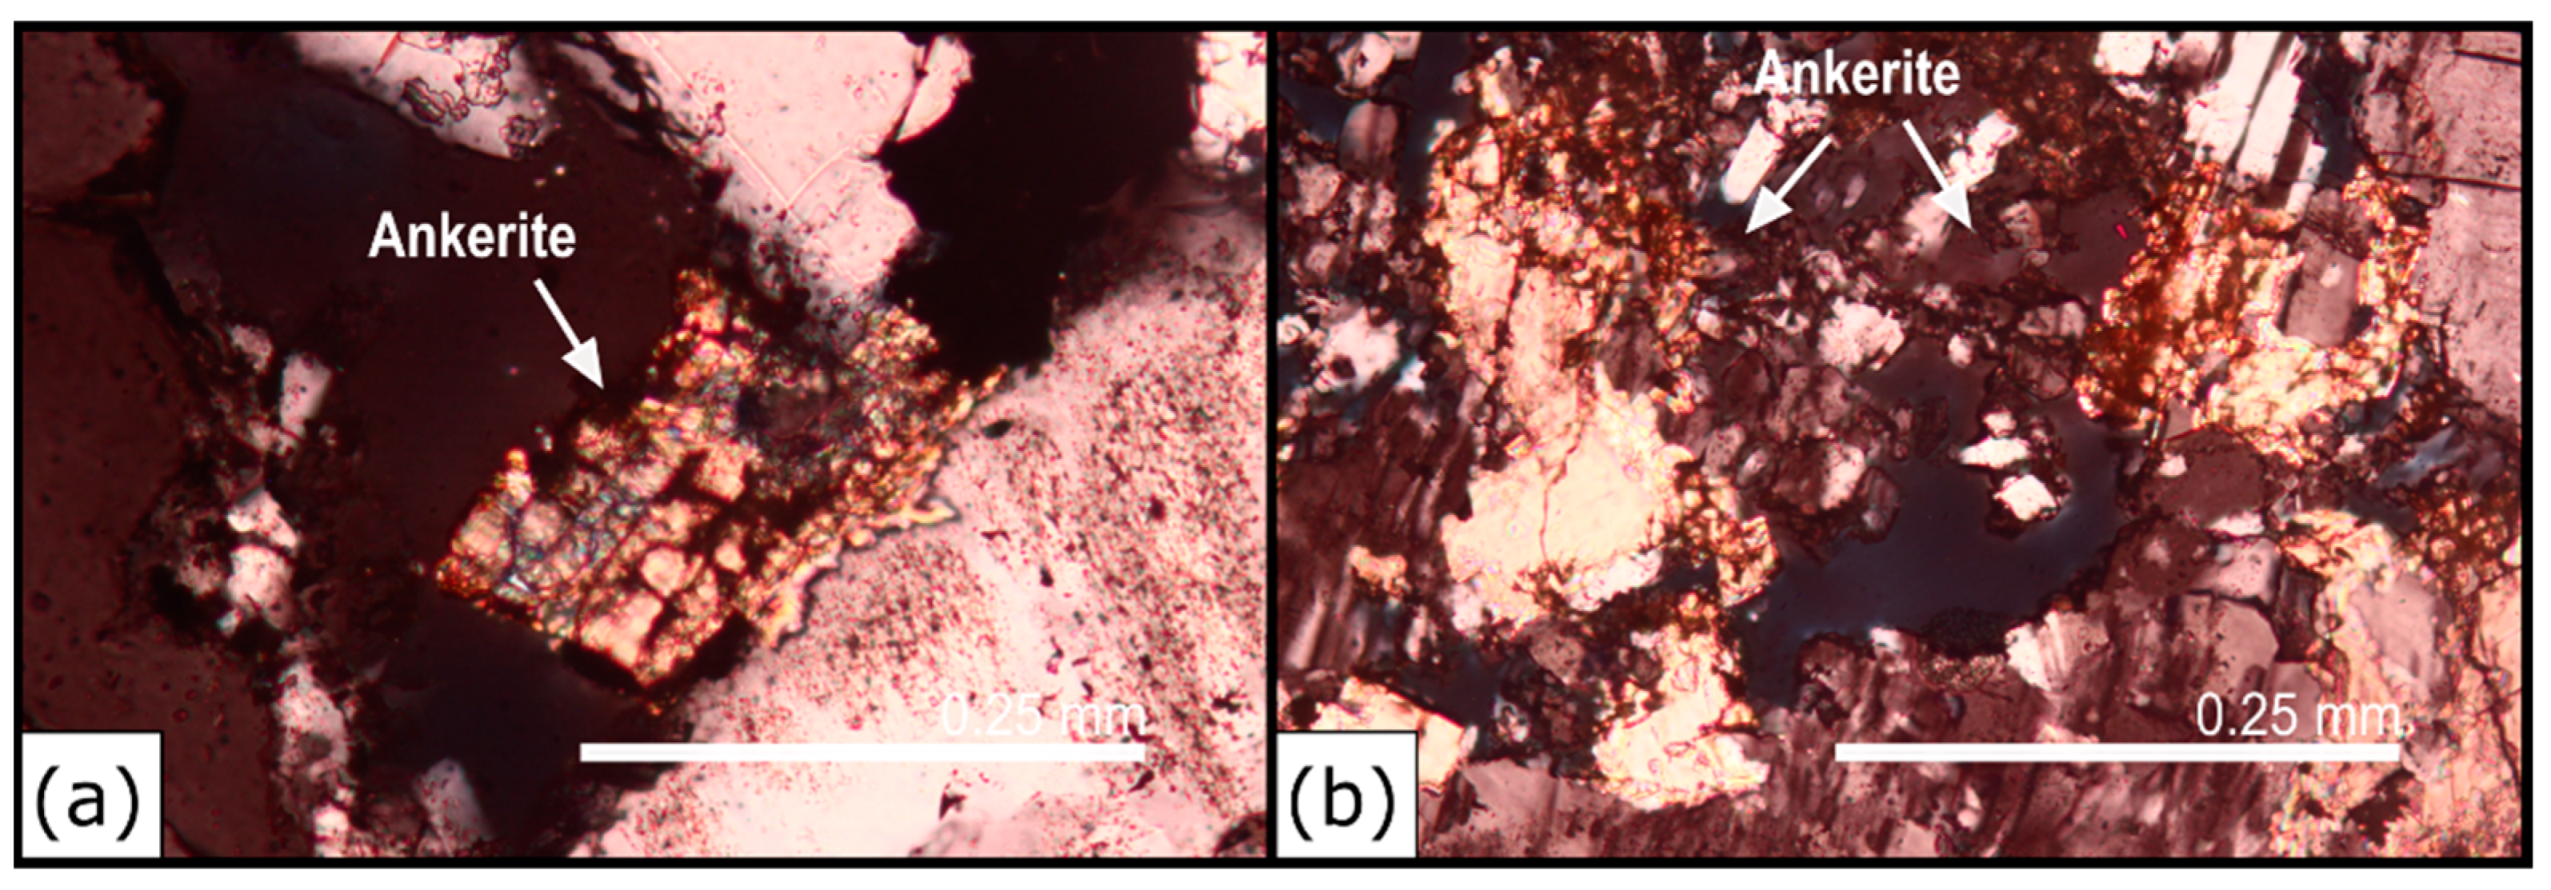
Siderite cementation occurred before ankerite cementationAnkerite always surrounds siderite cement when both minerals are presentEnergies 16 07949 i002
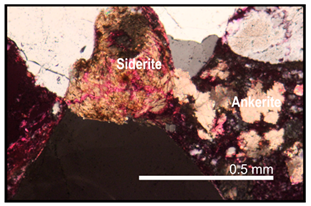
Siderite cementation occurred before calcite cementationCalcite always surrounds siderite cementEnergies 16 07949 i003
Carbonate cementation occurred before compactionAnkerite stops compaction by forming long contacts with framework grains in areas where loss of intergranular volume (IGV) is apparentEnergies 16 07949 i004
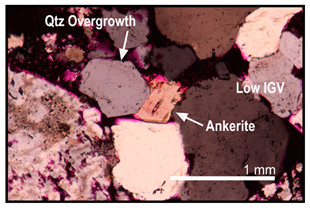
Carbonate replacement occurred before feldspar dissolutionFeldspar relics are observed within undissolved calcite that occurs inside dissolved feldspar grains
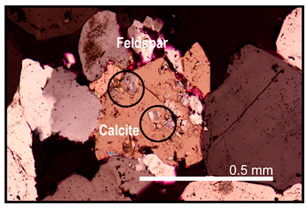
Energies 16 07949 i005
CompactionNumerous low IGV areas and long, sutured, and concavo-convex grain contactsEnergies 16 07949 i006
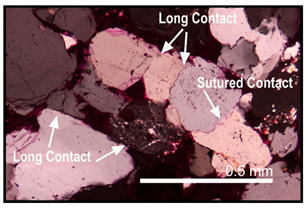
Some calcite cementation occurred during/after compactionCalcite cement is sometimes found outside heavily compacted low IGV areas and formed a poikilotopic textureEnergies 16 07949 i007
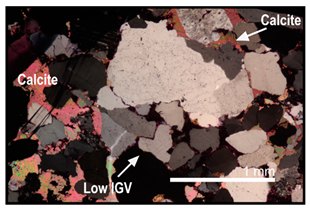
Feldspar dissolution primarily occurred after compaction but before clay cementationIntragranular porosity in dissolved feldspar is well preserved in low IGV areas while being filled with secondary claysEnergies 16 07949 i008
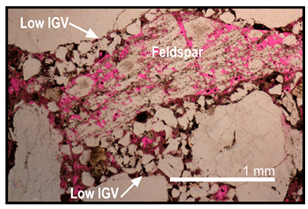
Clay cementation occurred before hydrocarbon emplacementClays are oil stained, as shown by the dark coatings
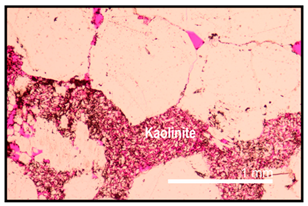
Energies 16 07949 i009
Table 5. Pre- and post-test porosity and permeability measurements.
Sample IDPre/PostPorosity (%)Abs. Change (%)Permeability (m2)Abs. Change (m2)
Chl1pre10.480.066.54 × 10−154.25 × 10⁻¹⁵
post10.54 1.08 × 10⁻¹⁴
Chl2pre15.120.335.96 × 10−154.84 × 10⁻¹⁵
post15.45 1.08 × 10⁻¹⁴
Chl3 (control)pre14.160.063.48 × 10−15−1.13 × 10⁻¹⁵
post14.22 2.36 × 10⁻¹⁵
ASCS1pre6.20 *0.30 *5.62 × 10−14−1.27 × 10⁻¹⁴
post6.50 4.35 × 10⁻¹⁴
ASCS2pre9.82 *0.28 *4.47 × 10−141.00 × 10⁻¹⁶
post10.10 4.48 × 10⁻¹⁴
ASCS3 (control)pre10.001.804.92 × 10−14−1.08 × 10⁻¹⁴
post11.80 3.84 × 10⁻¹⁴
Unc1pre10.37−0.046.12 × 10−162.97 × 10⁻¹⁵
post10.33 3.58 × 10⁻¹⁵
Unc2pre10.710.247.60 × 10−161.88 × 10⁻¹⁵
post10.95 2.64 × 10⁻¹⁵
Unc3 (control)pre10.43−0.266.61 × 10−165.13 × 10⁻¹⁶
post10.17 1.17 × 10⁻¹⁵
Kao1pre8.50−0.173.85 × 10−16−9.87 × 10⁻¹⁸
post8.33 3.75 × 10⁻¹⁶
Cal/Kao2pre7.361.261.68 × 10−161.04 × 10⁻¹⁵
post8.62 1.20 × 10⁻¹⁵
Kao3 (control)pre12.610.145.34 × 10−15−7.99 × 10⁻¹⁶
post12.75 4.54 × 10⁻¹⁵
CCS1pre2.71 *0.89 *3.35 × 10−187.47 × 10⁻¹⁷
post3.60 7.80 × 10⁻¹⁷
CCS2pre2.90−0.104.29 × 10−18−1.85 × 10⁻¹⁸
post2.80 2.44 × 10⁻¹⁸
CCS3 (control)pre3.20−0.104.50 × 10−18−3.13× 10⁻¹⁸
post3.10 1.37 × 10⁻¹⁸
MP1pre15.05-9.00 × 10⁻¹⁴−3.00 × 10⁻¹⁴
post- 6.00 × 10⁻¹⁴
MP2pre12.500.173.00 × 10−14−9.97 × 10⁻¹⁵
post12.67 2.00 × 10⁻¹⁴
MP3pre15.950.331.98 × 10−13−1.38 × 10⁻¹³
post16.28 6.00 × 10⁻¹⁴
MP4pre13.01−3.951.00 × 10−141.00 × 10⁻¹⁴
post9.06 2.00 × 10⁻¹⁴
* Note that these values are estimated from mass balance calculations of dominant carbonate mineral phases and could contain large uncertainties.
Table 6. Mineralogy degradation/deformation observed in post-test thin sections.
AlterationPhotomicrograph of Evidence
Siderite alteration occurred as noted by the precipitation of new iron oxide (Fe oxide) coatingsEnergies 16 07949 i010
Ankerite dissolution indicated by crystal deterioration and dissolved edgesEnergies 16 07949 i011
Calcite was often completely dissolved, but sometimes only partially dissolvedEnergies 16 07949 i012
Chlorite dissolution resulted in the release of iron which quickly reprecipitated as iron oxideEnergies 16 07949 i013
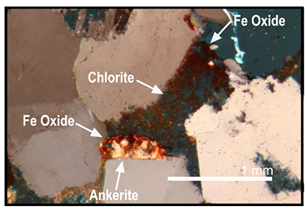
Microcracking occurred along the bottom length of sample MP2 resulting in a large zone of highly deformed framework grainsEnergies 16 07949 i014
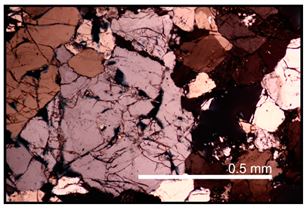
Higher resolution of the shattered quartz grain from the image aboveEnergies 16 07949 i015
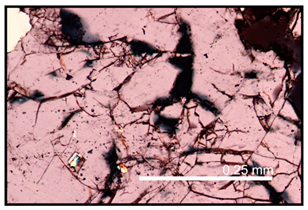
Disclaimer/Publisher’s Note: The statements, opinions and data contained in all publications are solely those of the individual author(s) and contributor(s) and not of MDPI and/or the editor(s). MDPI and/or the editor(s) disclaim responsibility for any injury to people or property resulting from any ideas, methods, instructions or products referred to in the content.

