1. Introduction
The deployment of hydrogen fuel cell electric vehicles (FCEVs) powered by hydrogen is critical to achieving zero emissions from the transport sector. Within the European Union, carbon dioxide emissions from all road transportation increased 27.8% from 1990 to 2019 (this represented 71.7% of the EU-27 transport sector emissions) [
1]. Similarly, in the US, transportation accounted for 28.5% of greenhouse gas emissions in 2021, making it the largest source of greenhouse gas in the US [
2]. Many countries signed the COP26 declaration to accelerate the transition to zero-emission passenger vehicles [
3]. The European Union set a new regulation (EU 2023/851 [
4]) banning new petrol and diesel cars from 2035 onwards to accelerate the switch to zero-emission vehicles (ZEVs). Typically, electric vehicles, such as battery (BEV) and fuel cell electric vehicles (FCEVs) producing zero tailpipe emissions, are classified as zero-emission vehicles. In 2022, global electric vehicle sales surpassed 10 million vehicles [
5]. The share of electric vehicles operating on fuel cell technology was comparatively low, with around 72,000 FCEVs operating in the world at the end of 2022 [
5]. However, FCEVs are considered key for reaching zero-tailpipe emissions from transport, especially for long-distance light-duty applications requiring fast refueling (i.e., taxi fleets); long-distance heavy duty applications, such as in trucks, rail, and maritime; and high-power-input vehicles (i.e., mining vehicles) [
6]. For these applications, the performance and durability of FCEVs are critical for ensuring successful deployment.
One key parameter influencing an FCEV’s performance and durability is hydrogen fuel quality [
7]. International standards, such as ISO 14687 [
8], EN 17124 [
9], and SAE J2719 [
10], define lists of chemical compounds with amount fraction thresholds in hydrogen fuel. These were established in attempt to avoid any issues with reduced performance of FCEVs. Even if the regulatory aspect is clearly established, challenges related to performance, maintenance, and the lifetime of FCEVs still arise for vehicle or fleet operators.
Currently, obtaining a direct determination of proton exchange membrane fuel cell (PEMFC) degradation rates and lifetime is challenging due to a large gap between a single-cell study in the laboratory and a stack in transport applications [
11] or even an FCEV in a real-life situation. Solving the challenges around laboratory experimental bench harmonization protocols (i.e., harmonized critical evaluation indicators, fuel cell test bench environment, operation history) is crucial to progress and develop a prognostic method to accurately predict the remaining lifetime of a PEMFC [
11]. The development of a test method that can assess real-life FCEV performance would provide a critical tool to advance such prognostic methods and enable proper comparisons of predictions versus real-life performance. This will allow better understanding of reversible and irreversible degradation effects for real-life FCEV cases (i.e., after a poor-quality hydrogen fuel refueling event).
The development of an infrastructure to study the performance of an FCEV powered by different hydrogen fuel qualities would complement the development of knowledge on the single-cell and stack degradation tests in the laboratory. However, there is no study on the actual impact of hydrogen fuel quality on the overall FCEV due to the technical complexity of performing such a study (i.e., how to accurately contaminate an FCEV), cost (i.e., potential irreversible damage caused to the FCEV), and representativity (i.e., there are only a small number of FCEV types available worldwide). Such a study should be carried out in accordance with the FCEV manufacturer and owner. The FCEVs should not be used after such studies (except if approval has been obtained by the manufacturer). There are several approaches that could be taken to deliver hydrogen that simulates poor-quality fuel: (1) creating a complete dedicated hydrogen refueling station (HRS) with controlled levels of contaminants, (2) using gas cylinders with bespoke composition, (3) generating a bespoke hydrogen fuel composition in the FCEV using gas cylinders and a normal HRS.
The first approach, using a dedicated HRS, would allow an FCEV to be refueled with a specific contaminated hydrogen fuel following the normal refueling process. A European project, MetroHyVe 1 [
12], investigated the feasibility of such a contamination directly at an HRS. However, the study revealed that this approach was too complex in terms of engineering and with regards to how the HRS would be cleaned up to ensure clean hydrogen could be delivered following the activity. Even if such an experimental HRS was desired, there are currently no known locations where this could be accurately realized. The second approach, using gas cylinders with bespoke composition, may be easier to realize; however, two technical challenges arise: achieving the required pressure from a gas cylinder (not all gas cylinders have a working pressure of 35 or 70 MPa) and achieving the creation of stable gas compositions with a few nmol/mol of reactive gas (i.e., H
2S) in such cylinders. The third approach proposes to perform accurate contamination of an FCEV or mock-up system using direct spiking of the fuel in the FCEV tank with impurities. The approach would follow the guideline for preparing gravimetric gas mixtures (ISO 6142-1 [
13]), where the hydrogen in the FCEV tank is considered the final gas mixture. While the mass of the gas added may not be directly recorded, it is possible to determine the mass of the primary reference gas transferred from the gas cylinder into the FCEV tank with a reasonable certainty. Additionally, the mass of gas in the FCEV tank may be determined based on indirect measurement of the temperature, pressure, and volume of the FCEV tank using the non-ideal gas law. Therefore, the third approach was considered realistic and simple to implement. Moreover, it allows any contamination case to be investigated without the requirement of complex infrastructure, contaminating an operational HRS, or the generation of large volumes of high-pressure contaminated hydrogen fuel in gas cylinders. It also allows the FCEV to be driven in real-life conditions on a safe road (i.e., privately owned racetrack or circuit) to directly understand the performance impact in terms of drivability.
The article will detail the methodology used to create four reference contaminated hydrogen fuels in an FCEV using direct spiking of the fuel in the FCEV tank with impurities. The hydrogen fuel compositions in the FCEV involved three types of chemical compounds (inert, low reactivity, and reactive compounds) at a level close to the ISO 14687 threshold. Therefore, the following gases were used: nitrogen (inert gas), a known contaminant of FCEVs; carbon monoxide (low reactivity in gas cylinders); and hydrogen sulfide, a known reactive contaminant of FCEVs. The study will present the contamination apparatus and detailed experimental conditions. The discussion will highlight the determination of the reference amount fraction of each compound in the different composition experiments based on the different measurement methods available (temperature, pressure, mass). The study will present the verification of the actual mixture composition through samplings using the National Physical Laboratory (NPL) sampling tool [
14] and gas analysis to assess its representativeness. Then, a discussion on the actual agreement between the theoretical value and the measured value is presented, with a focus on the sampling rig performance. The contaminated vehicle underwent a driving evaluation to assess the impact of the reference contaminated hydrogen fuel on the fuel cell (FC) performance. The results of the driving test will be presented and discussed with potential recommendations for further application.
Finally, insights on future experiments, potential improvement points for the sampling rig and/or the contamination methodology, or future FCEV performance testing will be presented.
3. Results
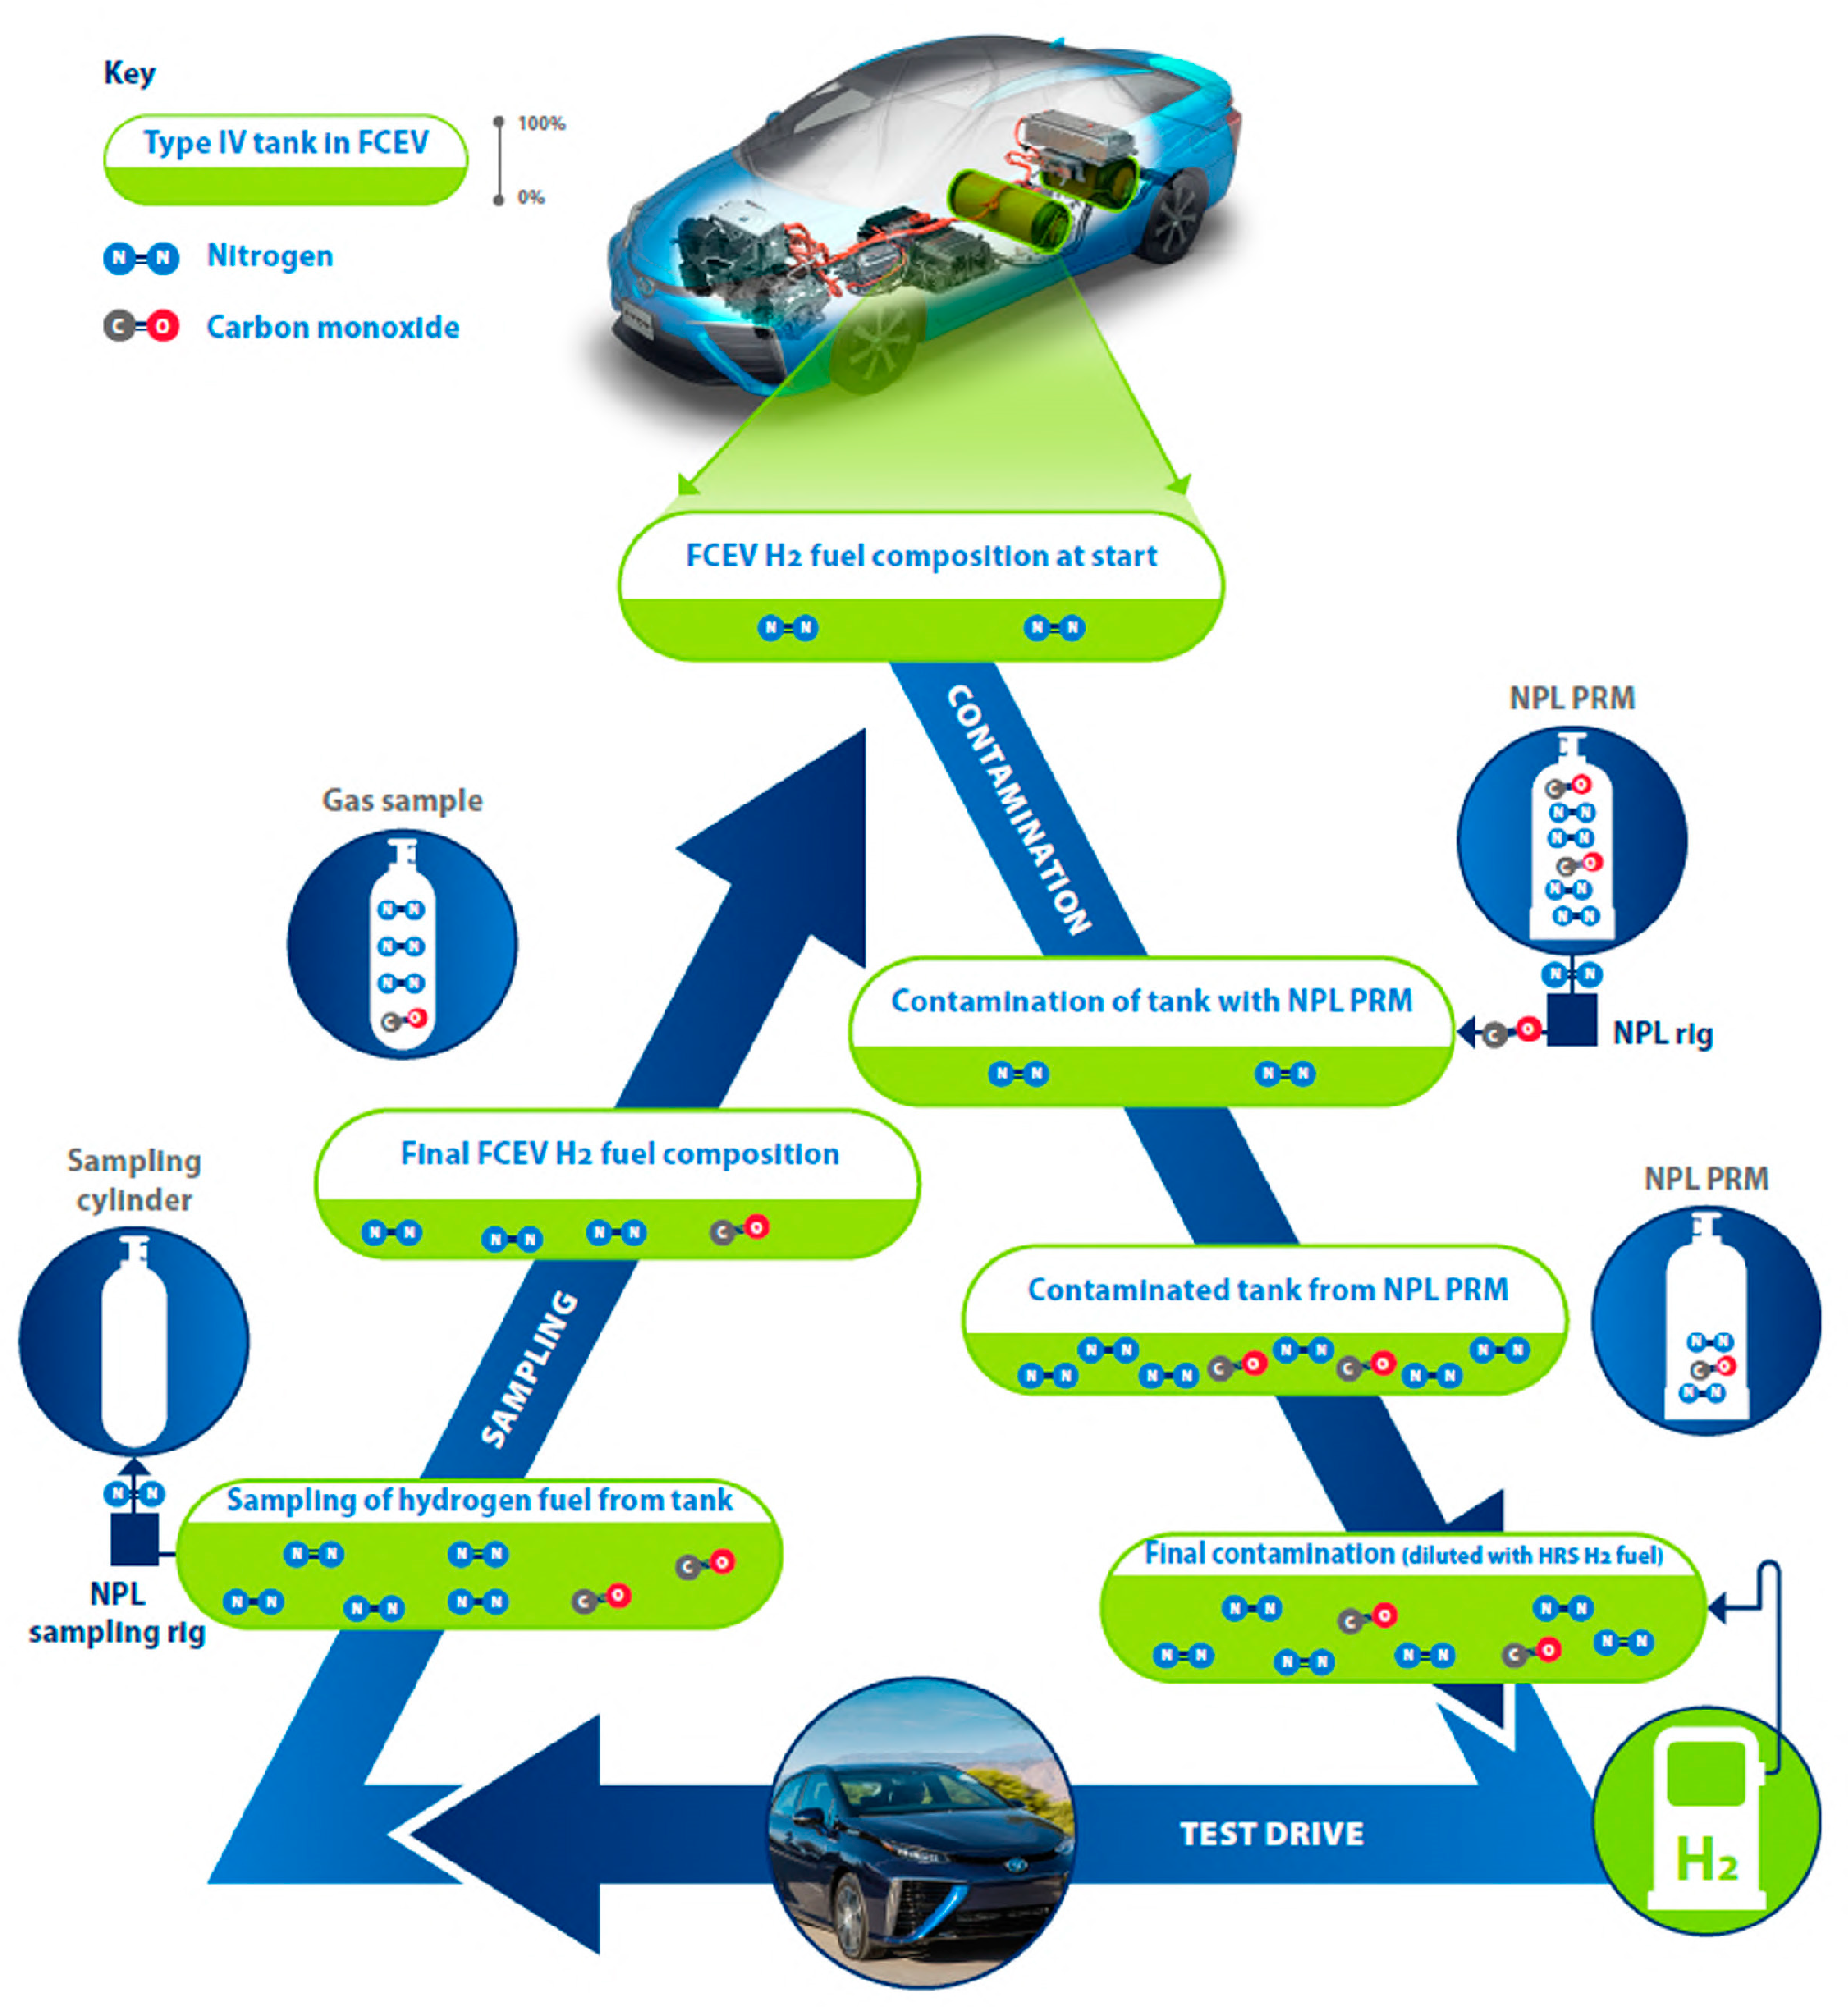
A summary schematic of the experiment performed is presented in
Figure 2; this schematic highlights all the steps of the experiments (the contamination of the FCEV tank, the addition of hydrogen fuel from the HRS, the sampling from the FCEV, and then the start of the next contamination).
3.1. Accurate Determination of FCEV Tank Composition by Gravimetry (Including Associated Measurement Temperature, Pressure, and Volume)
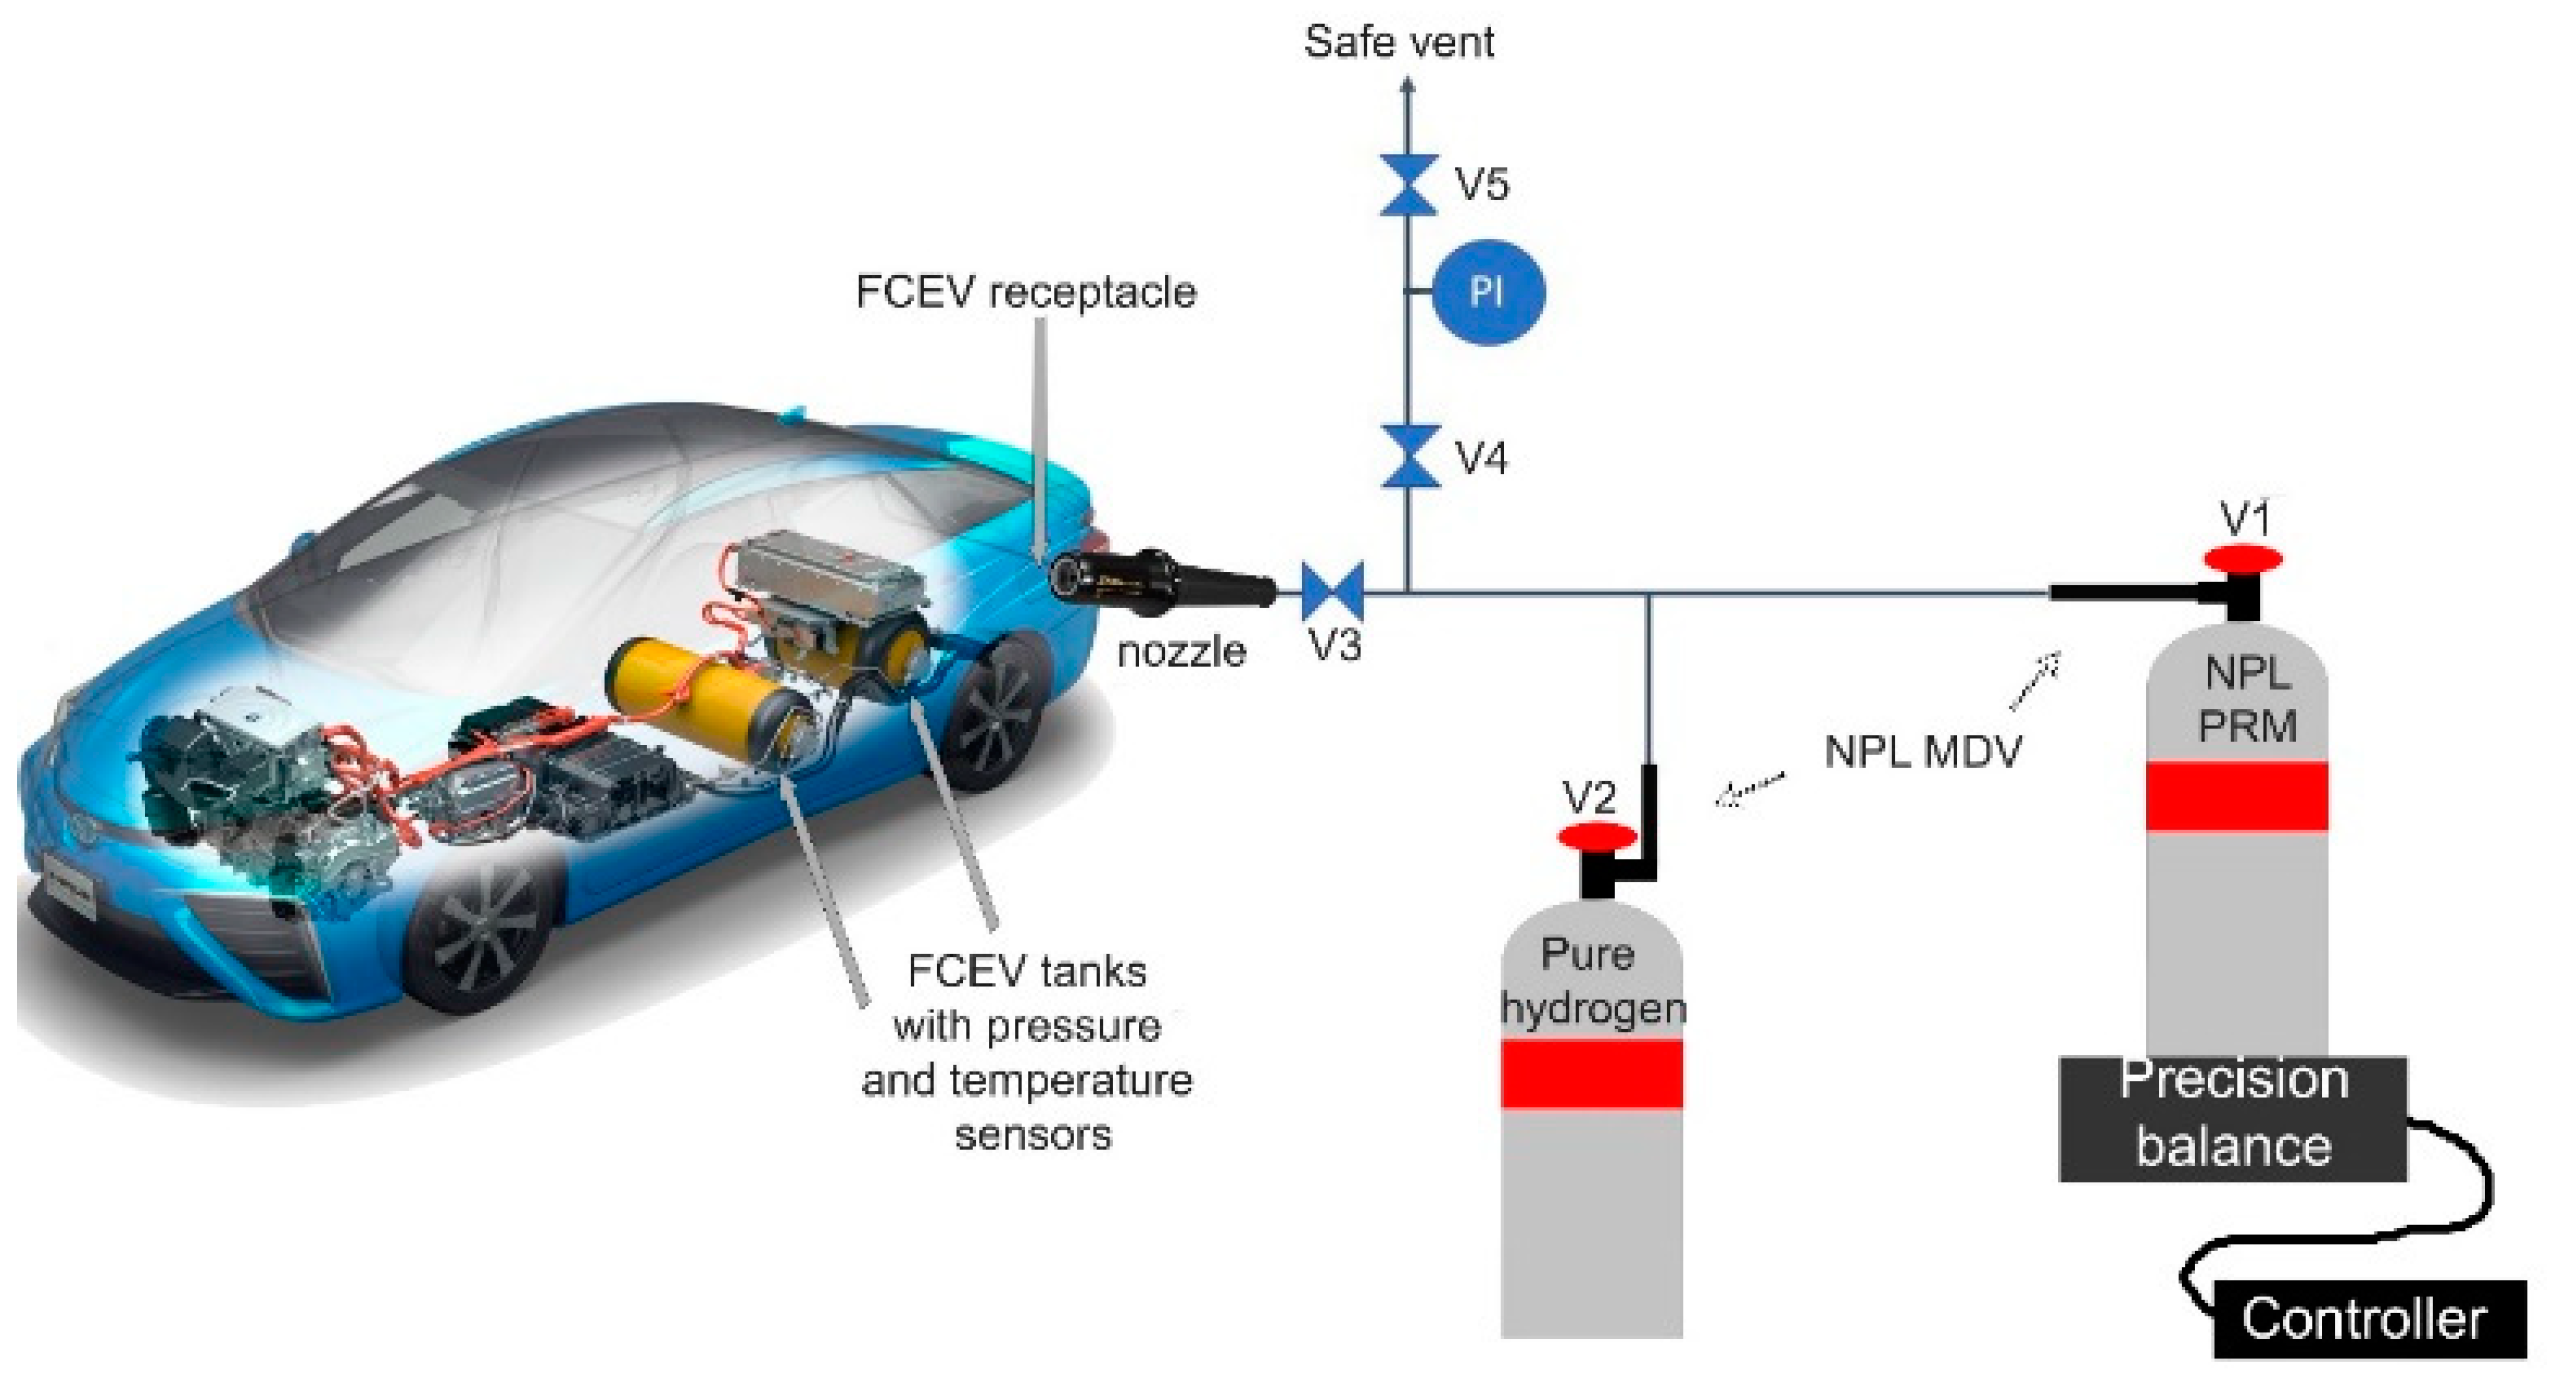
The gravimetric determination of the hydrogen fuel composition in the FCEV tank was based on four inputs and two parameters: the mass and the chemical composition. The four inputs were (1) the original hydrogen fuel in the FCEV tank; (2) the hydrogen fuel added at the hydrogen refueling station; (3) the NPL PRM cylinder; and (4) the pure hydrogen cylinder. Each input is discussed individually in the following sections.
3.1.1. Input for the Pure Hydrogen Cylinder
The gas composition of the pure hydrogen cylinder (hydrogen BIP+, Air Products, UK) was known and is defined in the Materials and Methods section. The mass transferred was small (less than 10 g) and, therefore, was considered a negligible mass compared to the other hydrogen fuel transferred by the HRS (over 1000 g). The input related to the pure hydrogen was considered negligible (less than 1% of the largest mass added) and contained no significant chemical compounds other than hydrogen.
3.1.2. Input for the NPL PRM Cylinder
The NPL PRM cylinder composition was known and is defined in the Materials and Methods section. The NPL PRMs were traceable PRMs with accurate chemical compound amount fractions and small uncertainties. Therefore, the uncertainties related to these inputs were considered low in the determination of the FCEV composition.
The mass transferred was based on the difference in mass of the NPL PRM cylinder before and after transfer into the FCEV tank. The accurate determination of the mass transferred could be realized directly using a precision balance or through indirect measurement of pressure and temperature of the gas (assuming the volume of the container). The mass determination using precision balance was complex due to the actual mass transferred (approximately 10 to 20 g) in comparison with the cylinder mass (17 kg). The experimental environment restricted the use of high-accuracy balance at the gram level. Secondly, the workshop environment was not optimized for accurate weighing (i.e., constant ventilation for safety reasons). The experimental conditions induced a higher uncertainty on the weighing than expected (relative uncertainty above 1%). However, the use of the precision balance did allow onsite calibration, traceability of the measurements, and direct mass determination.
3.1.3. Input for the Hydrogen Fuel Added at the Hydrogen Refueling Station
The chemical composition of the hydrogen fuel from the HRS needed to be determined, as it could not be assumed or extrapolated due to the possible variation in the hydrogen fuel quality delivered by the HRS [
19,
20]. Any compounds present in the HRS hydrogen fuel would contribute to the final hydrogen fuel composition in the FCEV tank. Only nitrogen and argon were quantified above the limit of detection. The results are presented in
Supplementary Materials. Sampling of the hydrogen fuel from the HRS was realized during the second set of experiments, following the methodology described in the Gas Sampling section [
21]. The measurements were performed by NPL’s hydrogen quality laboratory (Teddington, UK) as described in the Materials and Methods section.
The mass of the hydrogen fuel transferred is critical, as it represents a significant mass in the final determination of the FCEV tank hydrogen fuel composition. The mass was recorded from the HRS flow meter reading and determined by the pressure and temperature sensors from the FCEV tanks. The comparison of the two approaches presented in
Supplementary Materials showed that the HRS metering was approximately 6–11% lower than the mass determined by the FCEV sensors. However, the uncertainty of the HRS metering was considered conservative applying the OIML recommendation (maximum permissible error of 5%) [
22] and the uncertainties from the FCEV sensors (evaluated to 5%), and, as a result, the values were not significantly different at a confidence level of 95%. The mass determined directly from the FCEV tanks’ measurement data was considered more accurate, as it was determined directly from the FCEV tank in which the gas composition was realized.
3.1.4. Input for the Hydrogen Fuel in the FCEV Tank
The hydrogen fuel in the FCEV tank could not be neglected, as the FCEV would always contain a significant amount of hydrogen (between 3 and 5.4 MPa). The starting mass of hydrogen fuel in the tank could only be assessed by indirect measurement of pressure and temperature in the FCEV tanks. The sensors used for this study were the sensors integrated in the FCEV system (part of the commercial FCEV).
The final hydrogen fuel composition would be dependent on the quality of the hydrogen fuel from the previous refueling or experiment within this study (see
Figure 2). Before the first experiment, the FCEV was entirely fueled at the HRS. The hydrogen fuel composition in the FCEV tank for the first experiment was assumed to be of similar composition as the hydrogen fuel of the HRS. A more accurate determination would have involved sampling and analysis of the hydrogen fuel from the FCEV tank.
For the subsequent experiments, the hydrogen fuel starting in the FCEV tank was assumed to be the composition of the previous experiment, as presented in
Figure 2.
Once all these inputs were determined as described, it was then possible to accurately determine the amount fraction of impurities in the FCEV tanks. A summary of the contamination experiments and determination of the mass of all of the hydrogen gas inputs were provided in
Supplementary Materials. The objective of generating a controlled contaminated fuel in the FCEV without complex hardware was achieved; however, to confirm the accuracy of this approach, it was necessary to perform a comparison of the determined amount fractions of impurities between the gravimetric synthetic hydrogen fuel in the FCEV and the gas sampled from the FCEV.
3.2. Experimental Validation of the Synthetic Hydrogen Fuel from FCEV Tank Approach
The FCEV hydrogen fuel was sampled as described in the Materials and Methods section. Two independent samplings were carried out for each experiment. The results of analysis were compared to the expected composition of the hydrogen fuel in the FCEV based on the calculation detailed in section “Gravimetric determination of hydrogen fuel composition in FCEV”. The detailed results of analysis from NPL’s hydrogen quality laboratory (Teddington, UK) are presented in
Table 2.
3.2.1. Inert and Low-Reactivity Compound Behavior
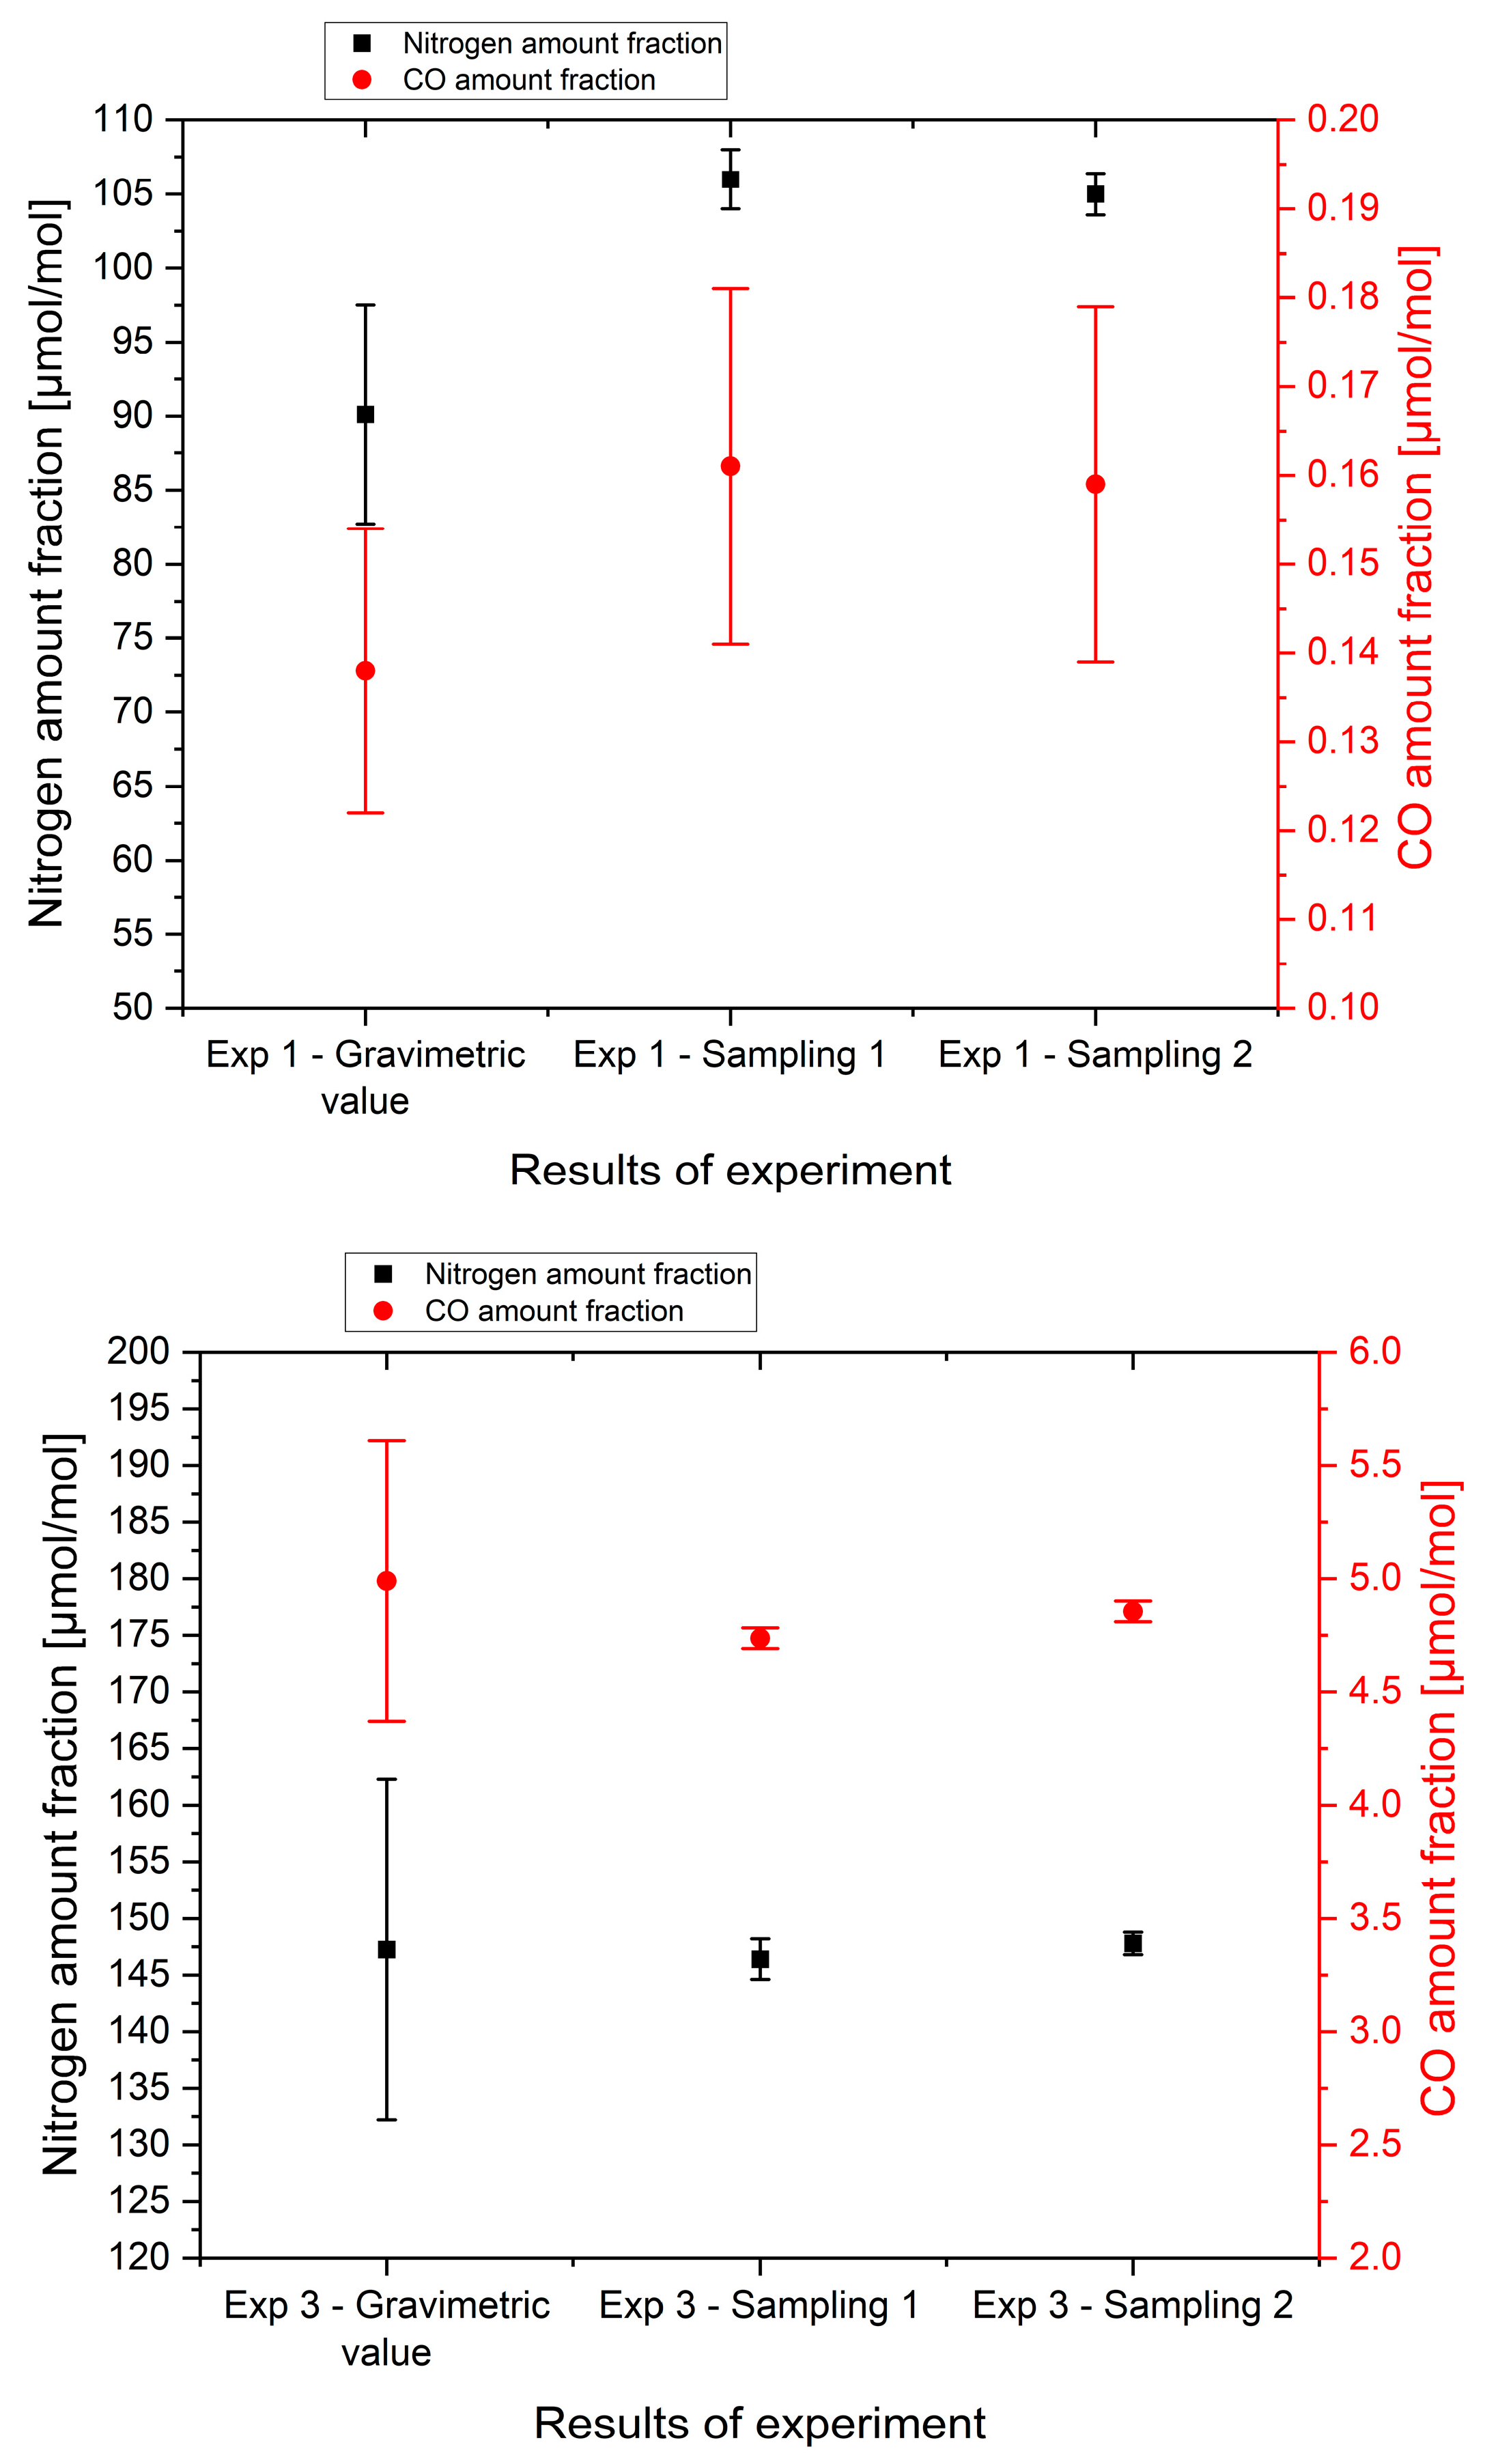
The first three experiments focused on inert and low reactivity gas (nitrogen and carbon monoxide, respectively).
Figure 3 presents the results of nitrogen and carbon monoxide amount fraction from direct sampling and analysis compared to the gravimetrically determined amount fractions. Considering the measurement uncertainty, no significant difference at a confidence level of 95% was observed between the gravimetric composition and the measured amount fraction of CO and nitrogen for the experiments except for the nitrogen amount fraction in experiment 1. For experiments 2 and 3, the agreement between the analytical results of the sampling and the synthetic hydrogen fuel used in the FCEV tank demonstrated that it was possible to produce synthetic contaminated hydrogen fuel directly in the FCEV with accurate control of the impurity levels.
Experiment 1 indicated a relative difference of approximately 15% between the expected composition of the hydrogen fuel in the FCEV and the measured composition (from both samples) for N2 and CO. Even if the difference was not statistically significant for CO due to a larger measurement uncertainty, the trend observed (15% increase) was coherent with the nitrogen observation. As the bias seemed consistent, a few potential explanations for the differences due to inaccuracies were considered: (1) determination of the mass transferred from NPL PRM into the FCEV, (2) the actual hydrogen fuel composition in the FCEV, (3) the hydrogen fuel composition from the HRS.
As detailed in the previous section, the actual mass of NPL PRM transferred from the gas cylinder may not have been accurately determined due to a lack of shielding from environmental disturbances or a slight bias in the weighing related to the pressure measurement which was performed in parallel. The gas composition could be another potential reason for the discrepancies. The composition of the hydrogen in the FCEV tank was not sampled before the first contamination; it was assumed to be similar to the hydrogen fuel composition from the HRS (measured during the second experiment). This highlights how critical it is to determine the hydrogen fuel composition of the four inputs (hydrogen fuel in the FCEV, hydrogen fuel from HRS, NPL PRM, and pure hydrogen) before starting any contamination experiments. Even if the results of experiment 1 showed a small difference, the sample results were not far from those of the synthetic hydrogen fuel realized in the FCEV tank. This provides confidence in the methodologies used for this study and highlights the importance of each step.
The results from the two samplings obtained during each experiment agree within a 95% confidence level for carbon monoxide and nitrogen. This demonstrates that the sampling procedure was repeatable and that the gas mixture in the FCEV tank was homogenous.
In
Figure 4, the CO and N
2 results from all of the experiments are presented together. This graph highlights the coherence of the results between the expected fuel composition and the measured values. All results except nitrogen in experiment 1 overlapped with the 0 line of the figure, which meant there was no significant difference between the measured values and the gravimetric amount fraction of the synthetic hydrogen fuel in the FCEV tank. This validates the approach proposed here to accurately contaminate the FCEV and to reliably sample hydrogen from the FCEV tank using the NPL sampling tool for inert and low-reactivity compounds.
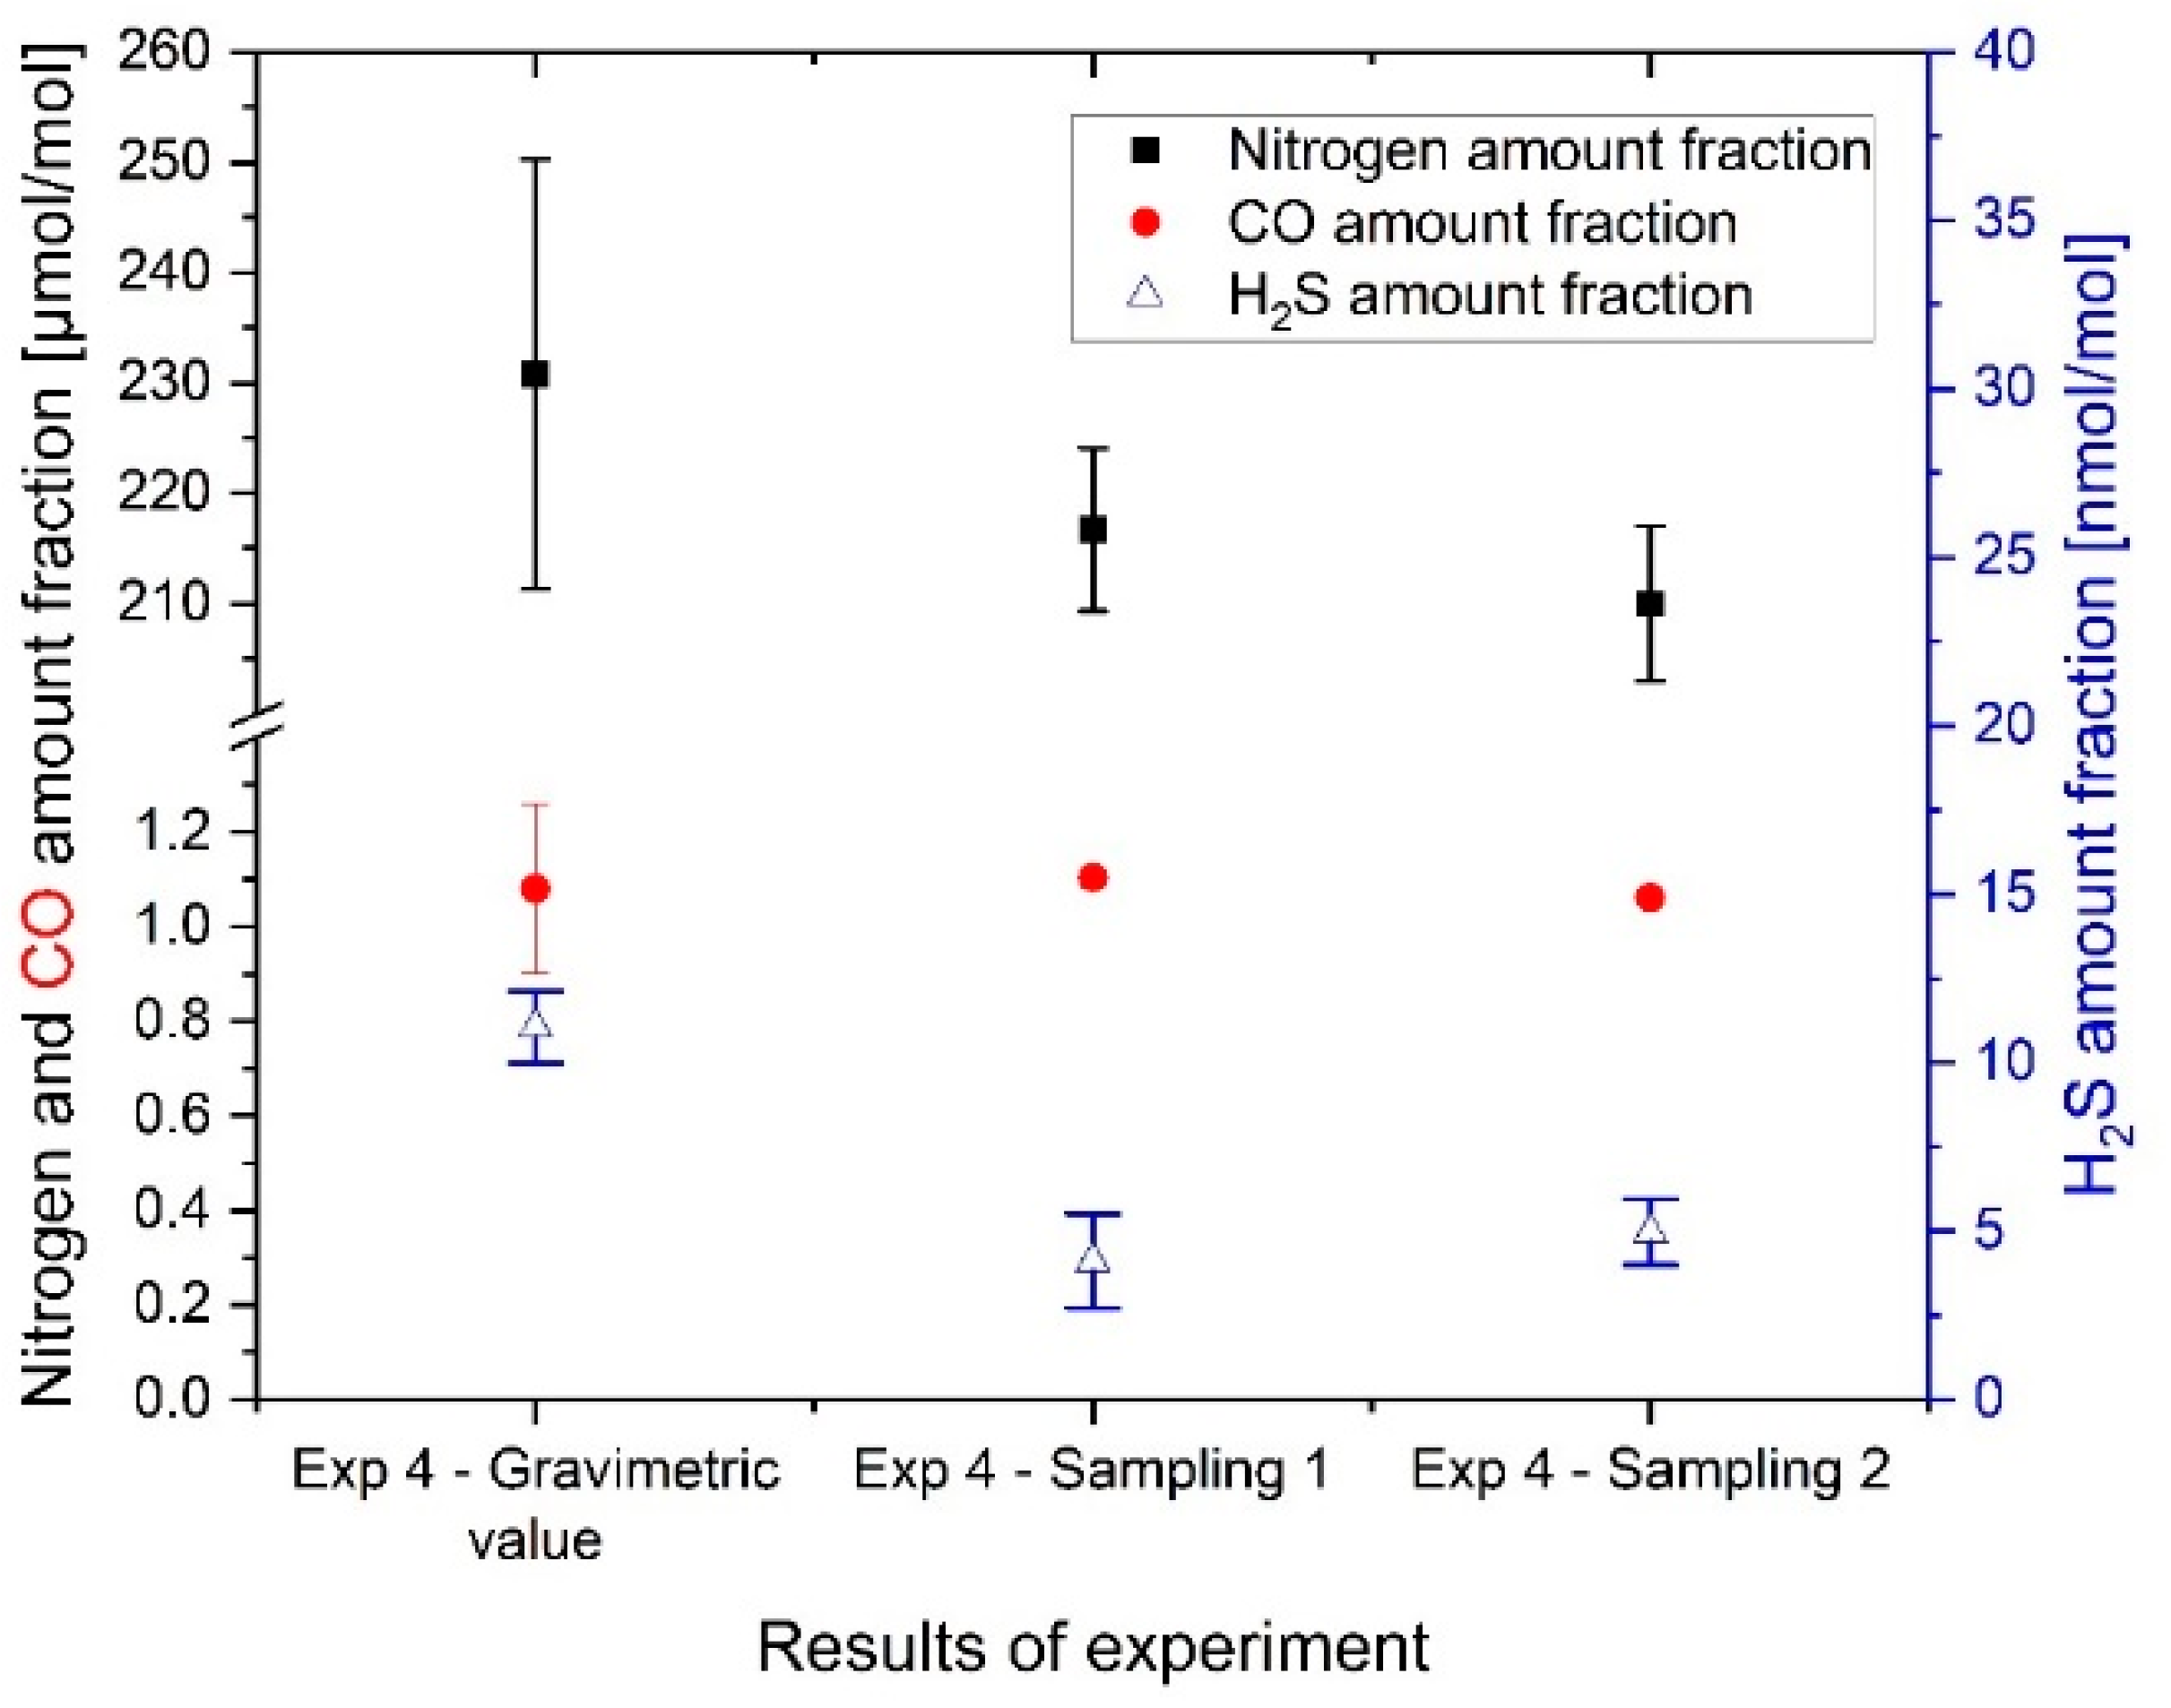
3.2.2. Reactive Compound Behavior
In the fourth experiment, the FCEV tanks were contaminated with a reactive compound (H
2S) in addition to CO and N
2 (results are shown in
Figure 5).
As detailed in the previous section, the amount fraction of CO and N2 agreed well between the synthetic hydrogen fuel realized in FCEV tank and the results of analysis (no significant difference at a confidence level of 95%). It validated that the preparation of the synthetic hydrogen fuel in the FCEV tanks was determined accurately.
The results of H2S amount fraction showed that the measured values from the two samplings agreed within a confidence level of 95% at 4–5 nmol/mol. This demonstrated that the nmol/mol level of H2S in hydrogen fuel will remain in the gas phase of an FCEV tank (i.e., it does not adsorb on walls) and may reach and degrade the fuel cell. This is a significant finding, as previously, it was hypothesized that H2S may be adsorbed out and, therefore, never reach the fuel cell.
However, the composition in the FCEV tank was expected to be around 11 nmol/mol; a difference of almost 6–7 nmol/mol of H
2S was observed between the gravimetric FCEV composition and the analysis of the samples. Several factors were identified as potential reasons for the loss of H
2S experienced: absorption along the FCEV gas flow path, time of contact (i.e., sampling realized after test drive), sampling representativity (i.e., delay between sampling and analysis of few weeks), or reactions between impurities within the FCEV tanks. The results obtained for CO and N
2 demonstrate that the preparation was realized correctly, which excludes this as a possible cause of the discrepancies. H
2S is known to react and adsorb onto metallic materials [
23]. The FCEV system was not built with passivated materials; therefore, adsorption of reactive impurities along the FCEV gas flow path (i.e., valve, pipes, regulators) could have reduced the amount of sulfur in the samples obtained.
Further experiments are needed to better understand how the FCEV gas flow path interacts with reactive compounds such as H2S (i.e., proportional loss or saturation amount fraction at which the tank material cannot adsorb additional H2S). The behavior of H2S on type IV FCEV tanks with a liner was previously unknown. This study shows that this nmol/mol level of H2S does not completely adsorb onto this type of liner; therefore, it essentially does not act as a defensive measure. To improve the accuracy of this experiment, one would need to investigate the behavior of H2S with type IV FCEV tanks; the experiments would be significantly improved if adsorption in this part of the FCEV system could be reduced.
The sampling representativity was important to exclude as a potential explanation of the discrepancy observed. Similar to the FCEV gas path, adsorption of the H2S could have occurred when hydrogen was in contact with the sampling rig, on the contamination rig, or within the sampling vessels. As the analysis from the two samplings agreed, it could be assumed that the sampling vessel type was not the main source of H2S loss. Even if the sampling hardware was fully Sulfinert-treated and provided representative samples for contaminants such as CO and nitrogen, it may be possible that it is not sufficient to ensure 100% of H2S recovery in the gas phase at low nmol/mol.
The contamination hardware that was used to transfer gas from the NPL PRM into the FCEV tank could have been an adsorption source, as it is mainly made of metallic materials. For this part of the system, all of the pipes, connections, and valves, except for the nozzle, were Sulfinert-treated, which would limit any potential H2S adsorption. As it was therefore possible that H2S adsorption may have happened between the nozzle and the receptacle, the use of a dedicated Sulfinert nozzle in the future would help to further reduce potential adsorption within this section of the system.
Even after recognizing these challenges in the experimental approach, the study demonstrated that it is possible to contaminate hydrogen fuel in the FCEV with 5–10 nmol/mol of H2S. It is important to continue the study with a simpler system to determine at which step of the process the loss of H2S occurred.
3.2.3. Identification of Other Compounds
During the experiments, no oxygen, argon, or water were deliberately added into the hydrogen fuel. Therefore, these compounds should only have been present due to their original presence in the hydrogen fuel in the FCEV or from the hydrogen fuel at the HRS. These compounds were measured to evaluate whether air contamination had occurred during the experiments. The oxygen amount fraction was always below the limit of detection or close to 1 µmol/mol. Even if the oxygen amount fraction values were very low, the fluctuation in this value between samples suggested the potential presence of a very small air leak during sampling. As the air leak was considered very small, it would not significantly affect the overall sample representativity even if a better control on this connection would be recommended in the future. Argon may be a good tracer to confirm whether an air leak was identified using oxygen. However, the argon/oxygen ratio was close to one, which was different from the argon/oxygen ratio expected to be found in air (approximately 1/22). The argon amount fraction remained constant over the different experiments, indicating that the hydrogen fuel from the HRS was the only source of argon. This hypothesis was confirmed by the good agreement between the measured argon fraction and the actual gravimetric hydrogen fuel composition determined using the same composition of the hydrogen fuel from the HRS.
A significant amount fraction of water was observed at similar levels across all experiments. This presence was surprising, as no water was introduced by any of the inputs; this was confirmed by the results of purity analysis. Therefore, the water amount fraction was expected to have decreased during the experiment through dilution with purer hydrogen. There were two potential sources of water: (1) labile water present in the FCEV tank adsorbed on the cylinder wall (equilibrating with the gas phase) or (2) measurement issues (sampling bias or measurement bias). An implementation of online water analysis during the sampling may provide new evidence to support this investigation. This unexpected outcome highlighted the need for further investigation into the potential source of water amount fraction in the hydrogen fuel sampled from the FCEV.
3.3. Impact of Contamination on FCEV Performance
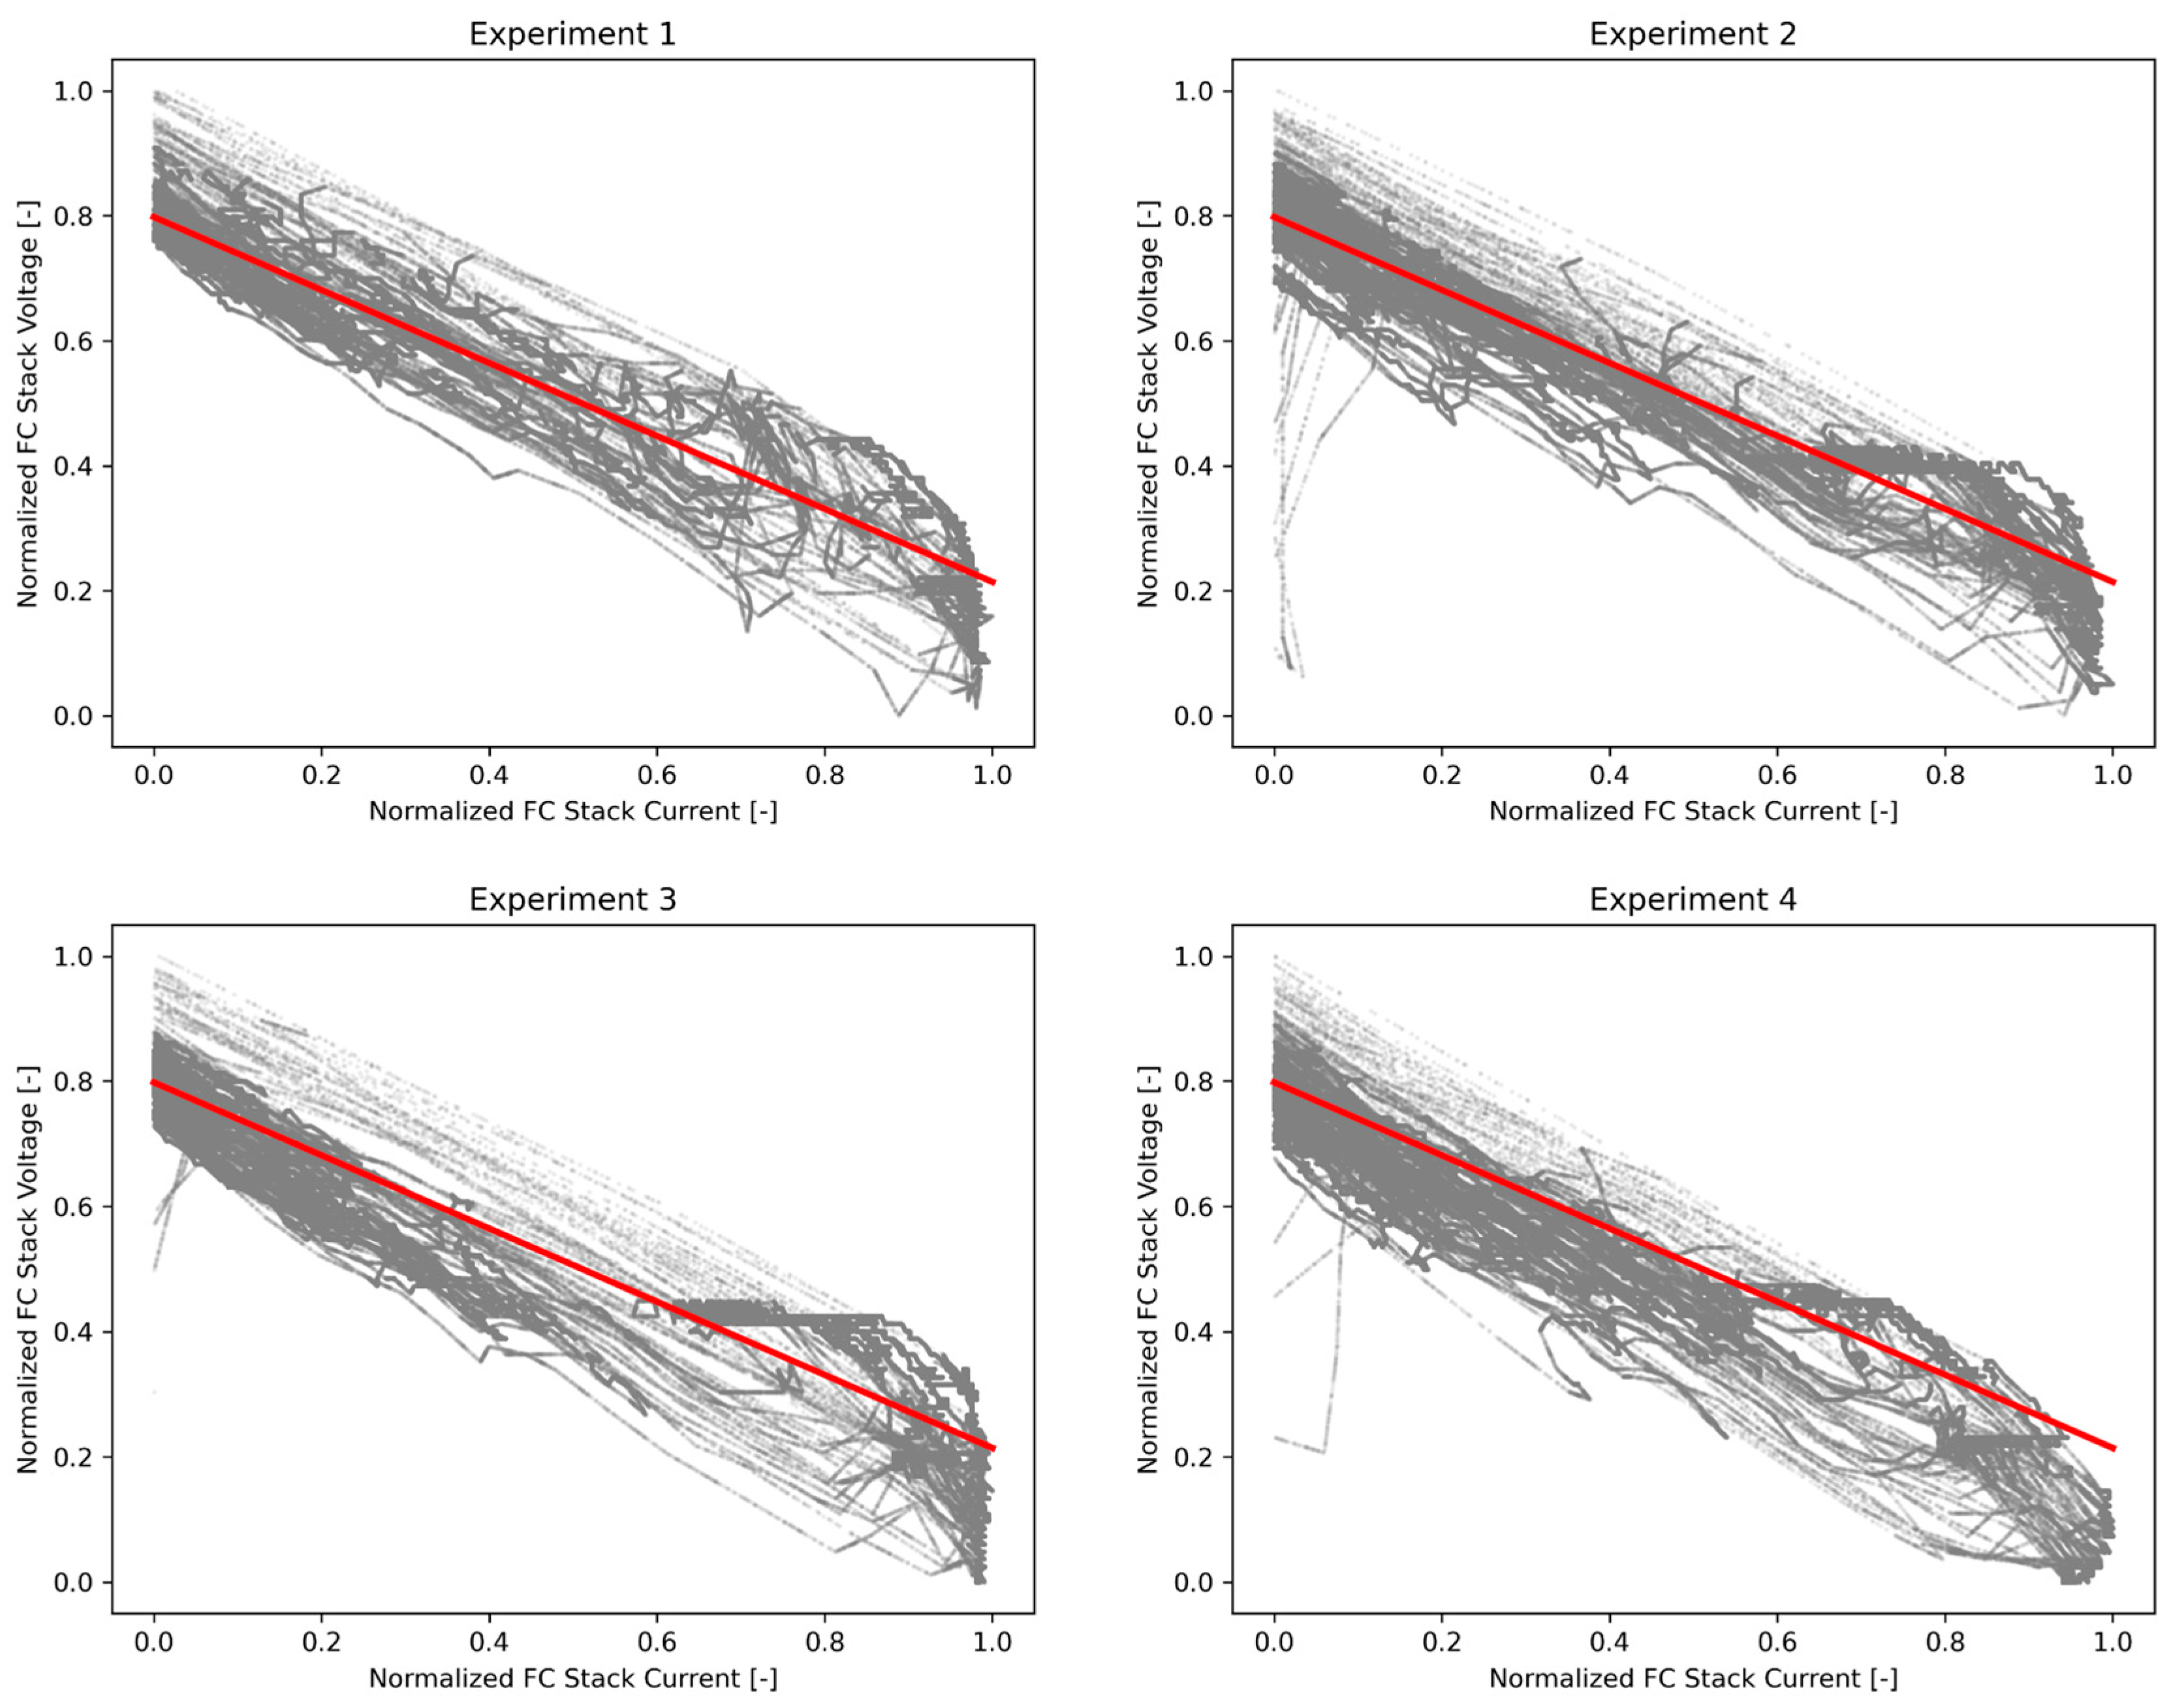
In
Figure 6, the polarization curves obtained from the FCEV test drive following the controlled contamination are summarized. On each plot, the trend line of the original polarization curve without contamination is visualized. It is clear that the current–voltage datapoints are not shifted significantly to lower voltage levels compared to the original trend line during experiment 1 and 2 (measured CO contamination of 0.161 and 0.586 µmol/mol, respectively; ISO14687:2019 CO limit is 0.2 µmol/mol). In experiment 3 and 4, however, the shift of the datapoints to lower voltages becomes clearly visible (experiment 3: measured CO contamination of 4.7 µmol/mol; experiment 4: 1.1 µmol/mol CO and 4.1 nmol/mol H
2S). ISO 14687:2019 has a CO limit of 0.2 µmol/mol and a H
2S limit of 4 nmol/mol.
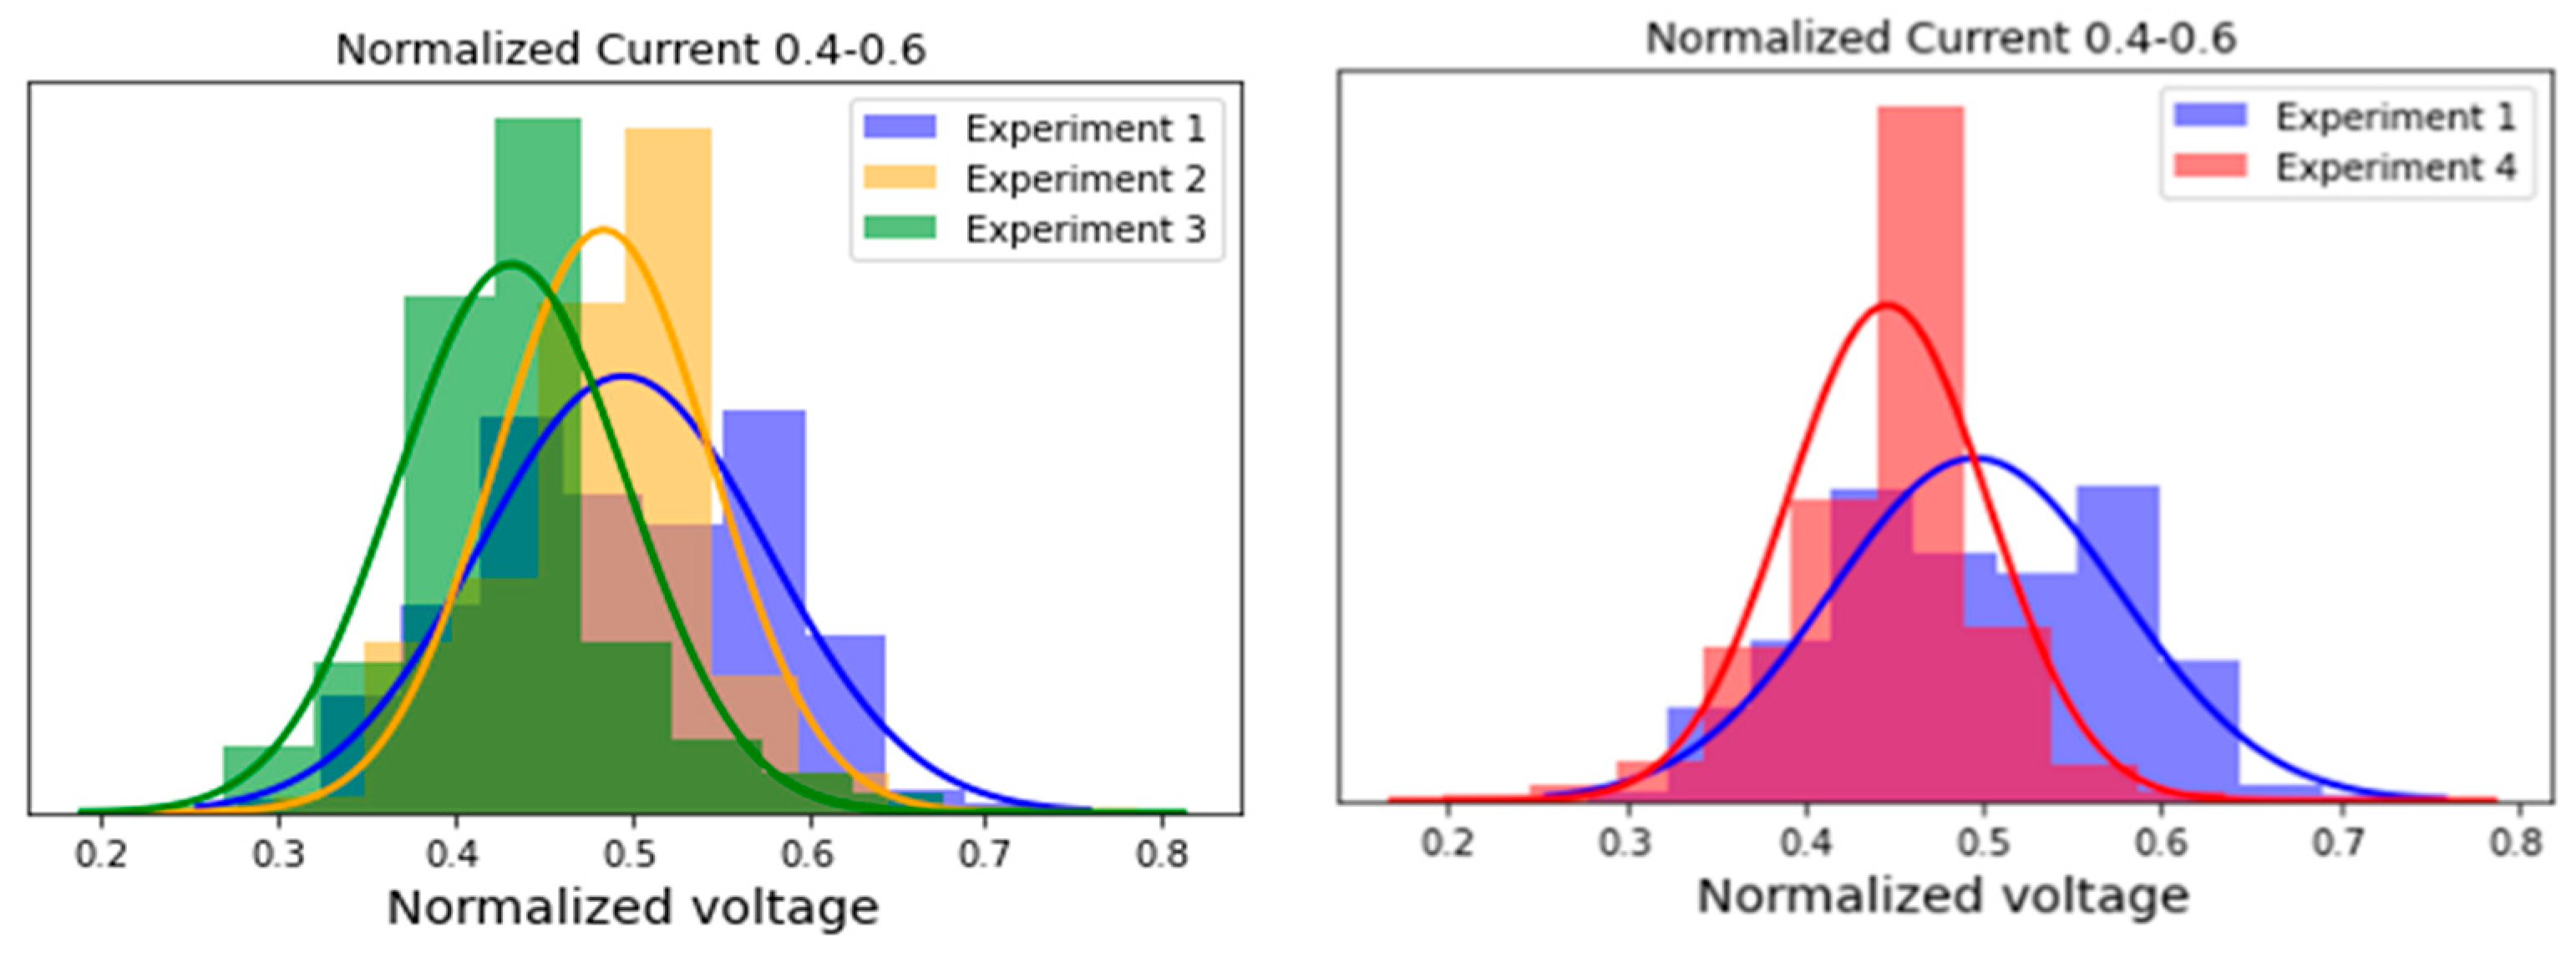
In order to quantify these findings, a data slice ranging from 0.4 to 0.6 normalized FC current (centre of the FCEV’s current range) was obtained, and the histogram of the voltages in this current range was obtained (see
Figure 7). Separate figures were made for experiment 1 to 3 (CO contamination) and 1 and 4 (CO and H
2S contamination). The mean normalized voltages in this range were 0.50, 0.48, 0.43, and 0.45 for experiments 1 to 4, respectively. The data obtained after experiment 1 were taken as a reference for visualization purposes, in order not to overload the graph, as the FC voltages did not drop during this experiment. Although not apparent in the polarization curve, a drop in potential could also be observed for experiment 2 in the histograms.
This shows that even a slight exceedance of the ISO 14687:2019 CO threshold has an immediate effect on the FC performance, even from a fairly low exposure to contaminants during the short test drive. The voltage drop trend continues to experiment 3, where a CO contamination level of 4.7 µmol/mol was achieved.
For H
2S contamination in experiment 4, the interpretation of the vehicle test data is more difficult because the tests were performed back to back. No cleaning of the FC stack and/or tanks was conducted, and the stack did not undergo any recovery procedure in between the experiments. Therefore, the effect of catalyst poisoning contaminants (such as CO) of previous experiments is very likely to be observed in the following contamination experiment. For this reason, the concentration of CO was increased stepwise from experiments 1 to 3. For experiment 4, however, the CO in the tank was diluted from 4.7 to 1.1 µmol/mol while 4.1 nmol/mol H
2S contamination was achieved, which resulted in the partial recovery of the normalized voltage from 0.43 to 0.45 going from experiment 3 to 4. Although the adsorption intensity and the poisoning effect of H
2S is higher than that of CO, the higher concentration of CO inhibited the adsorption of H
2S (competitive adsorption) [
24]. As a result, the CO and H
2S influence cannot be decoupled, as no specific H
2S poisoning experiment was performed.
The compounds’ amount fraction thresholds specified in ISO 14687:2019 and EN 17124:2022 have been defined by taking the useful vehicle life into account: the durability of FCEVs should not be affected by exposure to contamination in line with the standards. Although the discussed experiments do not contain evaluation of the durability of the FC, they clearly demonstrate that contamination of CO at ISO 14687 threshold levels does not appear to have an immediate effect on FCEV performance, while even slight exceedances of these thresholds immediately cause a voltage drop in the FC, even for short exposure times.
3.4. Perspective for FCEVs
The studies presented in this paper provide several interesting results for the future of FCEVs. Firstly, the studies verify that the novel sampling system for FCEV sampling proposed in this paper has been metrologically validated when targeting compounds of interest. The methodology applied did not require extensive infrastructure and is expected to have limited or controlled impact on the actual FCEV compared to other possible approaches. After contamination of the FCEV, it was possible to vent the FCEV tank without using the fuel cell. A proper FCEV clean-up process may, however, need to be adapted based on the selected compound and amount fraction level.
Secondly, the study allows direct testing of FCEV performance using simulated hydrogen fuel. This is an important validation step for the study of contaminants’ impact at the FCEV level for both instant impact as well as long-term durability effects. Compared to state-of-the-art single-cell or stack level testing, FCEV testing provides a dataset for real-life conditions adding the complexity of the FCEV’s gas flow path and a more direct experience of the impact the from contaminants, including how the end user or customer would experience this. For future evaluation of FCEVs, special attention should be paid to avoiding cross-effects of different contaminations, such as in experiment 4 in this study. Countermeasures could consist of flushing of the tanks and fuel lines when switching to other species or less concentrated contamination. Additionally, an FC regeneration protocol should also be considered to revert the state of the FC as close as possible to the original condition. The effect of exposure time should be considered as well, as longer test drives could provide more insight into contaminant behavior over time.
The results of the contamination studies from this paper using low level H2S are extremely interesting for industry. This study demonstrates, for the first time, that sulfur compounds present in hydrogen fuel may be transferred into an FCEV’s tank at nmol/mol (without, for example, being lost through adsorption upstream of the fuel cell). Despite the loss observed between the expected amount fraction and the measured amount fraction, low nmol/mol sulfur may still reach the fuel cell system. This result emphasizes the importance of monitoring sulfur compounds, as FCEV’s gas flow path may not act as a significant barrier for removing impurities from low-quality hydrogen fuel.
4. Conclusions
The study presented in this paper has demonstrated that it is possible to produce a synthetic hydrogen fuel in an FCEV tank without complicated hardware (e.g., an HRS with contaminated fuel) or without involving an extensive number of gas cylinders. The experiment was repeated four times with three contaminants (CO, N2, and H2S); each repeat showed good agreement between the gravimetric amount fraction of the synthetic hydrogen fuel realized in the FCEV tank and the measured value (within a confidence level of 95%). One study disagreed slightly; however, the bias in that case was small. The results of this study validated the methodology used to accurately contaminate an FCEV with inert and low-reactivity compounds. The study investigated the different inputs for the process and highlighted several possibilities to determine the mass and the importance of the different gas composition inputs.
The experiment involving a reactive compound (H2S) presented several challenges but a positive outcome. Firstly, it demonstrated that it is possible to contaminate an FCEV with low nmol/mol sulfur within a complex system. However, it highlighted the complexity related to reactive compounds, as the measured value in the two samples differed significantly from the expected composition. Due to the complexity of the system, it is difficult to determine if this complexity relates to the contamination (adsorption of the reactive compounds on the nozzle/receptacles or in the FCEV tanks) or to adsorption in other parts of system. This investigation could be performed using a simpler system, involving only a tank, and then progressively adding in the other components of the FCEV gradually until the loss of impurities is achieved.
For the first time, a traceable H2 contamination impact study on an FCEV was performed. The impact of CO and H2S around ISO 14687:2019 threshold amount fraction levels on the FCEV’s performance were demonstrated. Small exceedances above the threshold limits show a significant impact, even with relatively short exposure times.
The methodology proposed in this article can then be deployed to evaluate a large variety of hydrogen fuel compositions. It would allow performance testing of sampling methodologies and/or FCEVs using accurate and traceable hydrogen fuel composition and under real conditions. This will allow new studies to be carried out which closely simulate real-life conditions, thereby permitting new challenges to be identified (e.g., the impact of reactive compounds) and roadblocks (e.g., the validation of the sampling protocol) to be removed. When applying this approach to FCEV durability studies, key input could be provided to H2 standardization bodies such as ISO technical committee 197.


 ,
, 

