Article

An Ultra-Throughput Boost Method for Gamma-Ray Spectrometers

1
State Key Laboratory of NBC Protection for Civilian, Beijing 102205, China
2
National Institute of Metrology (NIM), Beijing 100029, China
*
Authors to whom correspondence should be addressed.
Energies 2024, 17(6), 1456; https://doi.org/10.3390/en17061456
Submission received: 1 February 2024 / Revised: 11 March 2024 / Accepted: 12 March 2024 / Published: 18 March 2024
(This article belongs to the Special Issue Advancements in Nuclear Energy Technology)

Abstract

:
(1) Background: Generally, in nuclear medicine and nuclear power plants, energy spectrum measurements and radioactive nuclide identification are required for evaluation of strong radiation fields to ensure nuclear safety and security; thereby, damage is prevented to nuclear facilities caused by natural disasters or the criminal smuggling of nuclear materials. High count rates can lead to signal accumulation, negatively affecting the performance of gamma spectrometers, and in severe cases, even damaging the detectors. Higher pulse throughput with better energy resolution is the ultimate goal of a gamma-ray spectrometer. Traditionally, pileup pulses, which cause dead time and affect throughput, are rejected to maintain good energy resolution. (2) Method: In this paper, an ultra-throughput boost (UTB) off-line processing method was used to improve the throughput and reduce the pileup effect of the spectrometer. Firstly, by fitting the impulse signal of the detector, the response matrix was built by the functional model of a dual exponential tail convolved with the Gaussian kernel; then, a quadratic programming method based on a non-negative least squares (NNLS) algorithm was adopted to solve the constrained optimization problem for the inversion. (3) Results: Both the simulated and experimental results of the UTB method show that most of the impulses in the pulse sequence from the scintillator detector were restored to δ-like pulses, and the throughput of the UTB method for the NaI(Tl) spectrometer reached 207 kcps with a resolution of 7.71% @661.7 keV. A reduction was also seen in the high energy pileup phenomenon. (4) Conclusions: We conclude that the UTB method can restore individual and piled-up pulses to δ-like sequences, effectively boosting pulse throughput and suppressing high-energy tailing and sum peaks caused by the pileup effect at the cost of a slight loss in energy resolution.

1. Introduction

Since the 20th century, nuclear energy and nuclear technology applications have developed rapidly and are now widely used in various fields, profoundly impacting and benefiting military, economic, and social life. While enjoying the various benefits brought by nuclear energy and nuclear technology, humanity also faces threats such as the nuclear security and safety of nuclear installations and facilities, nuclear terrorism, the illicit trafficking of radioactive material, and overexposure during the application of nuclear medicine or other domains. Faced with various hidden dangers that come with the development of nuclear energy, gamma-ray spectrum measurement technology plays an important role in nuclear emergencies, nuclear security, and other work. This technology can quickly identify radioactive nuclides and describe radiation environment characteristics, and thereby provide direct data support for radiation environment evaluation and radiation protection measure formulation. Due to noise interference, ballistic deficit, and the pileup effect, energy resolution and pulse throughput naturally become two mutually restrained and intertwined performance metrics for a gamma-ray spectrometer. The development of spectrometer technology is often accompanied by compromises or improvements in both metrics.
In the 1960s, the analog nuclear pulse processing theory, which focused on optimal SNR via noise whitening and matched filtering technologies [1], was proposed and gradually improved. In 1972, through the non-linear time-variant filter, namely the gated integrator (GI) [2], the throughput of high-purity germanium detector systems was improved to some extent and was relative to the quasi-Gaussian shaping method, which was a mainstream technology in the analog electronic age. With the development of high sampling frequency universal analog and digital converters and digital signal processing technologies in the 1990s, the well-known digital trapezoidal shaping method [3], which is a linear time-invariant filter with two cascaded moving averaging algorithms similar to GI, further relieved the mutually restrained extent of the two metrics. Meanwhile, digital deconvolution technologies [4,5,6], which deconvolve detector output signals into narrow pulses to reduce pileup probability, were also flourishing. They were applied to facilities such as the Large Hadron Collider. Both technologies gradually became mainstream during the era of digital technology. In recent years, more attention has been paid to the optimization method to boost the pulse throughput or energy resolution. Usually, the measurement process is established as a model while ensuring a balance between performance (a sufficiently accurate model) and robustness (not overly complex). The number, amplitude, and time delay of the input radiation events along with the system response of the detector are estimated by characterizing the output signal from the detector. The number of events and triggers is determined by a finite impulse response filter, and the quality of reconstruction is determined based on maximum likelihood estimation [7] or estimated RMS error, which is used for photon radiotherapy at a high count rate [8]. A new model for the NaI(Tl) detector system, whose fitting result is superior to others, has been [9] used for model-based pulse deconvolution calculations [10], with a minimum resolvable pulse interval of 200 ns and higher energy resolution. Some deconvolution methods based on regularized sparse reconstruction [11] and L0 penalty [12] have been proposed and validated to recover pileup pulses. For the energy spectrum, deconvolution methods based on constrained optimization have achieved a high-resolution boost [13,14] and may represent a complementary approach to the above pulse throughput enhancing method to compensate for resolution deterioration. With the rapid development of computing power and complex model equation-solving methods and algorithms, some works have used artificial intelligence methods [15,16,17,18] to restore pileup pulses. However, the pileup effect occurs because a certain number of piled-up pulses are rejected to maintain resolution and cannot be recognized.
In this article, an ultra-throughput boost (UTB) offline processing method is proposed and studied to boost the pulse throughput and reduce the pileup effect. It is a constrained optimization method solved by the non-negative least squares (NNLS) algorithm. The UTB method can simultaneously improve time resolution and resolve more piled-up pulse heights by transforming the deconvolution problem into algebraic equation inversion under the non-negative constraint. The reduction in the pileup effect and ultra-throughput spectroscopy have been experimentally verified through this method. In addition, the pulse throughput is defined as the quotient of the total counts recorded in the spectrum and the real time or the acquisition time. The UTB method is useful for rapid measurement in a strong radiation field and nuclide analysis when the ROI interval is located in the range generated by the piled-up effect.

2. Materials and Methods

The outline of the UTB method is shown in Figure 1, including the physical process and the corresponding modeling of the gamma-ray spectrometer, and the solving process of the constrained optimization problem for the model.
The physical layer includes a radiation source, a NaI(Tl) detector coupled with a photomultiplier tube (PMT), a high-speed digitizer, and a high-performance computer (HPC). After the interaction between the radiation source and detector, the analog nuclear pulse is generated through the PMT and fed to the high-speed digitizer, and then the digital nuclear pulse sequence is transmitted to the HPC executing the UTB program.
The modeling layer describes the mathematical representation for the physical behavior of each entity during the measurement process. Specifically, x · δ t denotes the particle incident events with different energy deposition. The response of the detector and the PMT is modeled by convolving two functions: the dual exponential tail function and the Gaussian kernel function. The solution of the mathematical model, denoted as x ^ · δ [ n ] , is the expectation of x · δ t .
The solving layer converts the deconvolution process into the inversion problem of the algebraic equations with certain constraints, and in this work, the constraints of the solution space are non-negative. The NNLS algorithm can be adopted to solve this constrained optimization problem.

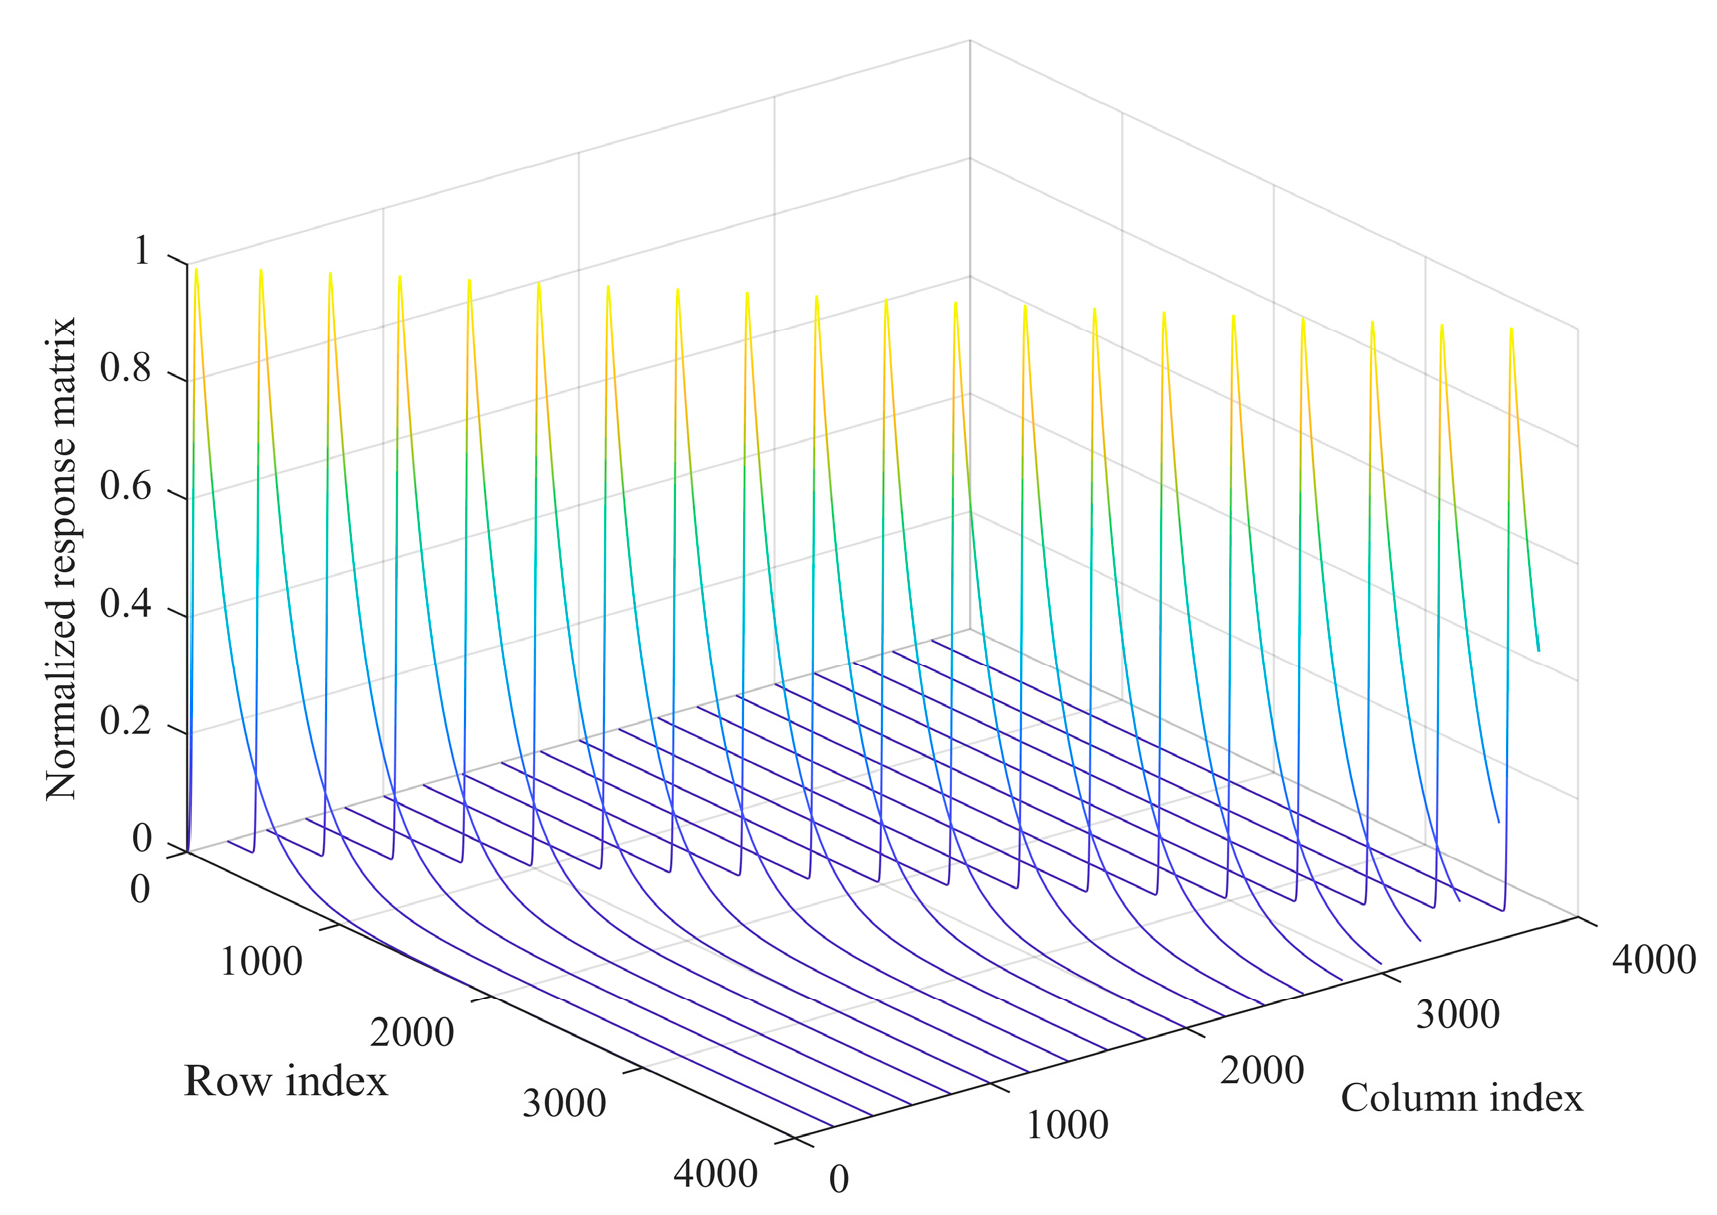
2.1. Description of the UTB Method

Figure 2 illustrates the workflow of the UTB method, which includes five steps described in detail as follows:
Step 1: Establishment of the pulse model, representing the pulse response based on the physical processes of the detector. The output signal from the PMT anode of NaI(Tl) detector was modeled with the convolution of the dual exponential tail and the Gaussian kernel functions, as shown in Equation (1), which is a simplified model mentioned in [9]. The derivation for the integral of the Gaussian kernel function convoluted with the exponential decay function can be found in Appendix A.
f ( t ) = H · { e ( σ 2 2 τ 1 2 t τ 1 ) · [ 1 + e r f ( t 2 σ 2 σ 2 τ 1 ) ] e ( σ 2 2 τ 2 2 t τ 2 ) · [ 1 + e r f ( t 2 σ 2 σ 2 τ 2 ) ] }
where H , σ , τ 1 , τ 2 denote the amplitude factor, standard deviation of the Gaussian kernel, and decay time constant of the fast and slow components, respectively. The erf is the error function.
Step 2: Fitting of the curve of the independent pulses and estimation of the parameters. The individual pulses are selected in the output signal with baseline deduction and amplitude normalization, and then the model of Equation (1) is used to fit the selected pulses independently to estimate the parameters. The baseline of the detector anode output signal is relatively stable [19]. In this work, the baseline of each slice time of signal acquisition is considered constant and obtained by calculating the average of the 200 sampling points before the pulse.
Step 3: Construction of the response matrix A based on the pulse model of Equation (1). The response matrix A is constructed as a Toeplitz matrix [20], whose columns are the normalized data of the successively right-shifted pulse as shown in Figure 3, where the column index denotes the number of the right shifts of the pulse, and the row index denotes the time of the normalized pulse model.
Step 4: Solving the non-negative optimization constraint problem based on NNLS. The most important goal of this work is to resolve each pulse height even if the successive pulses are overlapped. Through the conversion of the deconvolution problem into the algebraic equation inversion and the NNLS algorithm, the δ -like sequence x ^ · δ [ n ] , representing the pule heights with higher time resolution capability, can be obtained.
Step 5: Spectrum generation. After the solution x ^ · δ n is obtained, the energy spectrum can be acquired using the statistical histogram method.
The crucial aspect of the UTB method is the modeling and the solving of the constraint optimization problem in Step 4. The model of the convolution for the forward measurement process is shown in Equation (2):
y = A + A x + x ,   x 0
where x denotes the energy deposition of incident particles; A is the response matrix of the system; and y is the output signal from the PMT anode. ∆A and ∆x denote the mismatch between the models and the noise during the measurement, respectively. Due to the stable shape of the anode output signal of the NaI(Tl) detector coupled with PMT, it can be assumed that there is a slight difference in the system response matrix of the signal acquired each time compared to A. ∆x mainly includes the photon number fluctuation in the scintillator and the electron noise from the PMT. To simplify the solving process, the ∆A is negligible in this paper, and Equation (1) is relaxed to the following form as Equation (3):
y = A x + n ,   x 0
where n represents both the statistical fluctuation of the de-excited photon amount in the detector and the electronic noise.
The strong correlation among the columns of matrix A can lead to a serious ill-conditioned problem under the influence of the noise, whose solution through direct inversion is meaningless for its positive and negative oscillation, because the pulse height on behalf of the deposited energy cannot be negative. Regularization is a general approach to deal with the ill-conditioned problem, through adding some penalty terms in the loss function to reduce the solution space in order to avoid overfitting. However, the solution is not δ -like, i.e., limited time resolution.
Due to the non-negative and sparse nature of the solution results, NNLS is an effective algorithm to solve this non-native constrained optimization problem. To solve Equation (3), the following constrained optimization problem can be considered:
m i n x y A x 2 2 s u b j e c t t o :   x 0
where 2 2 denotes the 2 norm used to maintain the similarity between the measurement and its expectation; the constrained term x 0 is used to restrain the solution in the non-negative solution set; and the non-negative constraint can make the solution x sparse [21]. The NNLS algorithm is shown in Algorithm 1.
Algorithm 1. The NNLS Algorithm
StepDescription
1Set ε N U L L , Z = 1,2 ,   ,   n , and x 0 .
2Compute the n-vector w : = A T ( y A x ) .
3If the set Z is empty or if w j   0 for all j Z , go to Step 12.
4Find an index t Z such that w t = max { w j : j Z } .
5Move the index t from set Z to set ε
6Let A ε denote the matrix defined by
column j of A ε column   j   of   A       if   j ε 0                                                         if   j Z
Compute the n-vector z as a solution of the least squares problem A ε z y . Note that only the components z j , j ε , are determined by this problem. Define z j 0 for j Z .
7If z j > 0 for all j ε , set x z and go to Step 2.
8Find an index q ε such that x q / ( x q z q ) = min { x j / ( x j z j ) : z j 0 , j ε } .
9Set α x q / ( x q z q ) .
10Set x x + α ( z x ) .
11Move from set ε to set Z all indices j ε for which x j = 0 . Go to Step 6.
12Comment: the computation is completed.
Initially, the m × n matrix A is given, with the integers m and n , and a m -vector y . The n -vectors w and z provide working space. Index sets ε and Z will be defined and modified during the execution of the algorithm. Variables indexed in the set Z will be held at the value zero. If such a variable takes a nonpositive value, the algorithm will either move the variable to a positive value or else set the variable to zero and move its index from set ε to set Z . On termination, x will be the solution vector and w will be the dual vector.

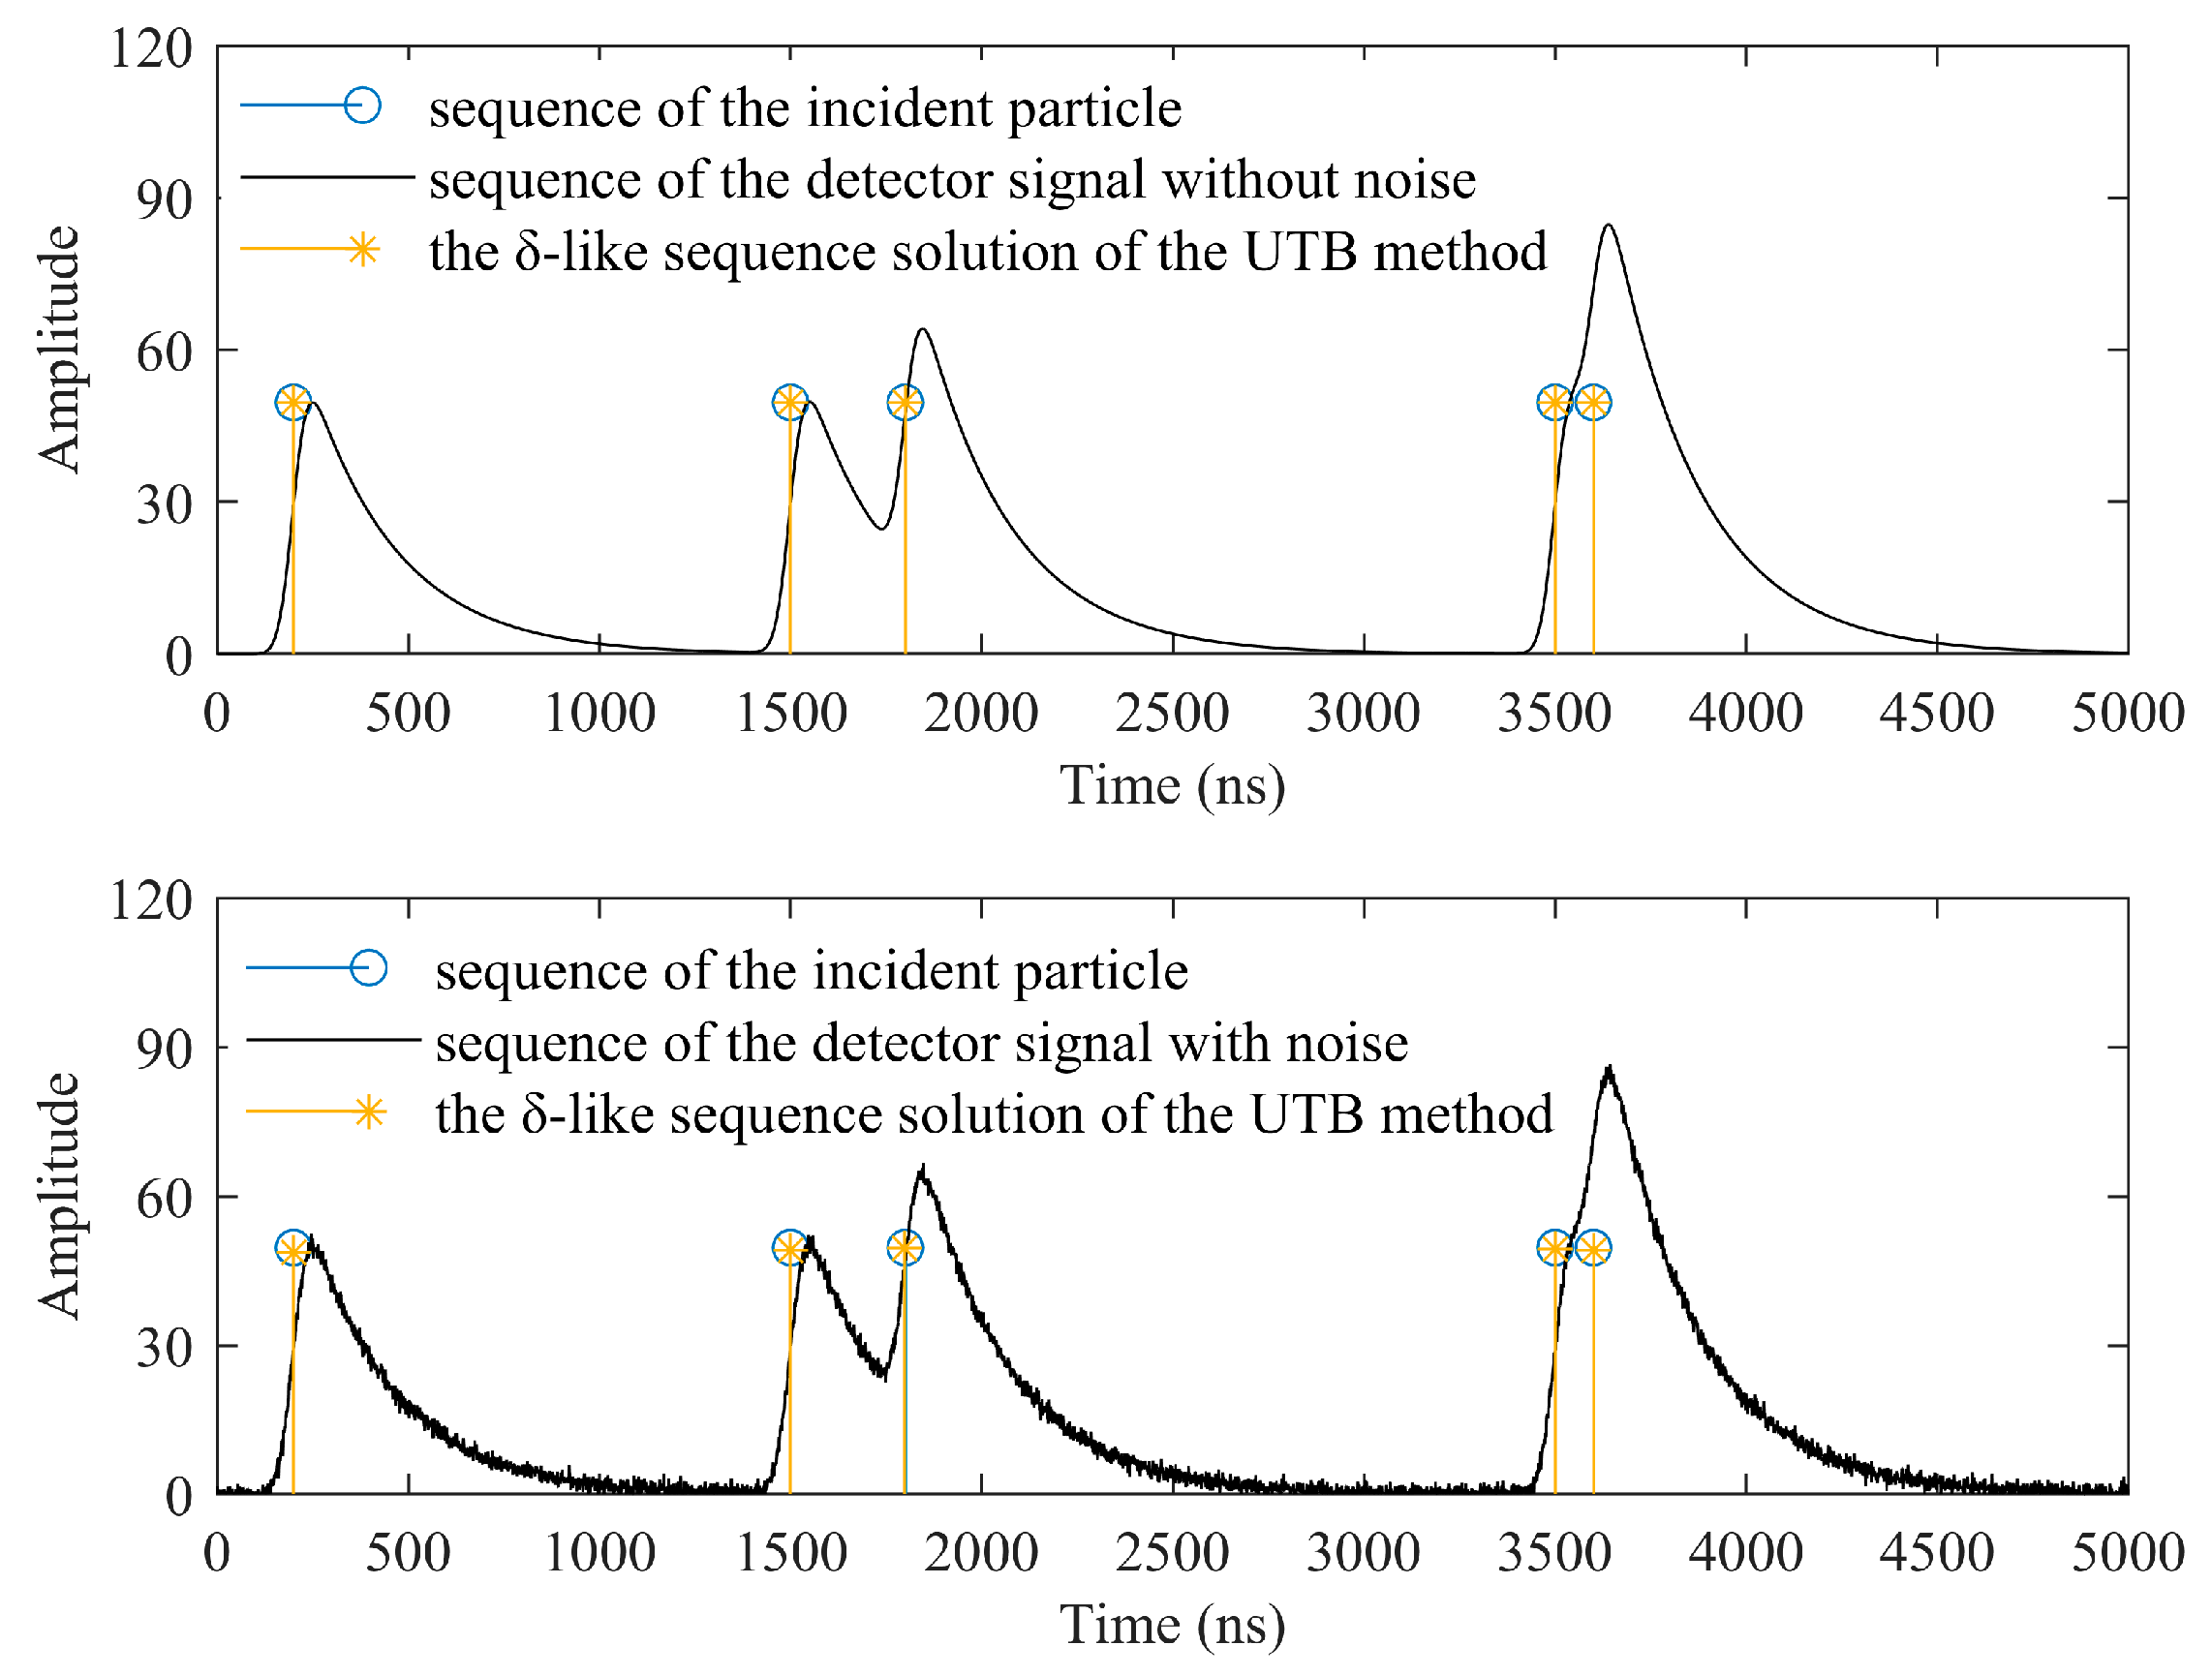
2.2. Simulation and Verification of the UTB Method

The trapezoidal shaper [3] is a mainstream digital pulse-processing technology for energy spectrum measurement, which is a linear time invariant filter with two cascaded moving averaging algorithms. It is widely used in energy spectrum measurement and has a certain noise suppression ability. The nuclear pulse is formed into a trapezoidal signal through a system function of trapezoidal shaping based on algorithms or hardware. When the flat top time of the trapezoid is greater than the charge collection time, it can effectively avoid ballistic deficit. It has the advantages of symmetrical pulse shape, narrow pulse width, and independent adjustable rise time and flat top time, etc. And it can be adapted for different count rates by separately adjusting the rise time and flat top time. However, considering the impact of ballistic deficit, pulse rise time, and energy resolution requirements, the width of the shaping pulse cannot be infinitely reduced. There are still pileup situations that cannot be handled by the trapezoidal shaper. The results of the trigger logic and shaping algorithm under the various situations of the random pulse sequence can be classified into four cases and are shown in Figure 4.
In Figure 4, ta represents the rise time of the trapezoid, tb represents the sum of the rise time and the flat top time, and tc represents the total time of the trapezoid (the sum of double rise time and the flat top time). For case (a), the pulse heights of E1 and E2 are correct and recorded in the spectrum; case (b) is a critical state for E3 and E4, so they can be recorded in the spectrum, but as the interval of the cascaded two pulses becomes shorter and shorter, only E4 can be recorded. Because of the interference of the latter pulse, E4, the former pulse E3 will be rejected and that will decrease the throughput; case (c) is another critical state where only E6 can be recorded; as the interval of the cascaded two pulses becomes shorter and shorter, both E5 and E6 should be rejected and that will decrease the throughput more severely; for case (d), only E9 will be recorded as the one incorrect higher pulse leading to the higher energy pileup phenomenon as well as the decrease in the throughput.
To verify the feasibility of the UTB method, under the condition of no baseline, the model of Equation (1) is used for the simulation and the parameter values for the simulation were set as follows: H = 50  mV, σ = 10   n s , τ 1 = 30   n s τ 2 = 230   n s .
The simulated δ -type impulse sequence of the incident particle with the constant height H and the different arrival time was convoluted with the response A to obtain the detector’s anode pulse signal. The solutions of the UTB method for the simulation are illustrated in Figure 5, which exhibits the simulated pulses without noise and with Gaussian white noise of which RMS is 2% of the maximum value of the simulated pulse.
The results indicate that the UTB method can resolve both the individual pulses and the piled-up pulses, such as tailing-pileup and peaking-pileup, into δ-like pulses. And the solution with noise has a slight deviation in pulse amplitude compared to the constant 50 mV. Compared to the trapezoidal shaping, the UTB method can resolve either tailing-pileup pulses or even some peaking-pileup pulses.
The simulation was performed under the condition of the Poisson flow intensity of the incident particles equal to 500 kcps, and the total count of the incident particles was set to 1000. The pulse height distribution spectra of the original input ideal δ-type sequence and the reconstructed δ-like pulses with noise or not by the UTB method are shown in Figure 6.
The results show that, compared to the original spectrum, the reconstructed spectrum without noise presents the same resolution, while the reconstructed spectrum with noise takes on a bit of resolution deterioration. The total count of all the three spectra is equal to 1000, which means that the UTB method achieved zero deadtime.

3. Results

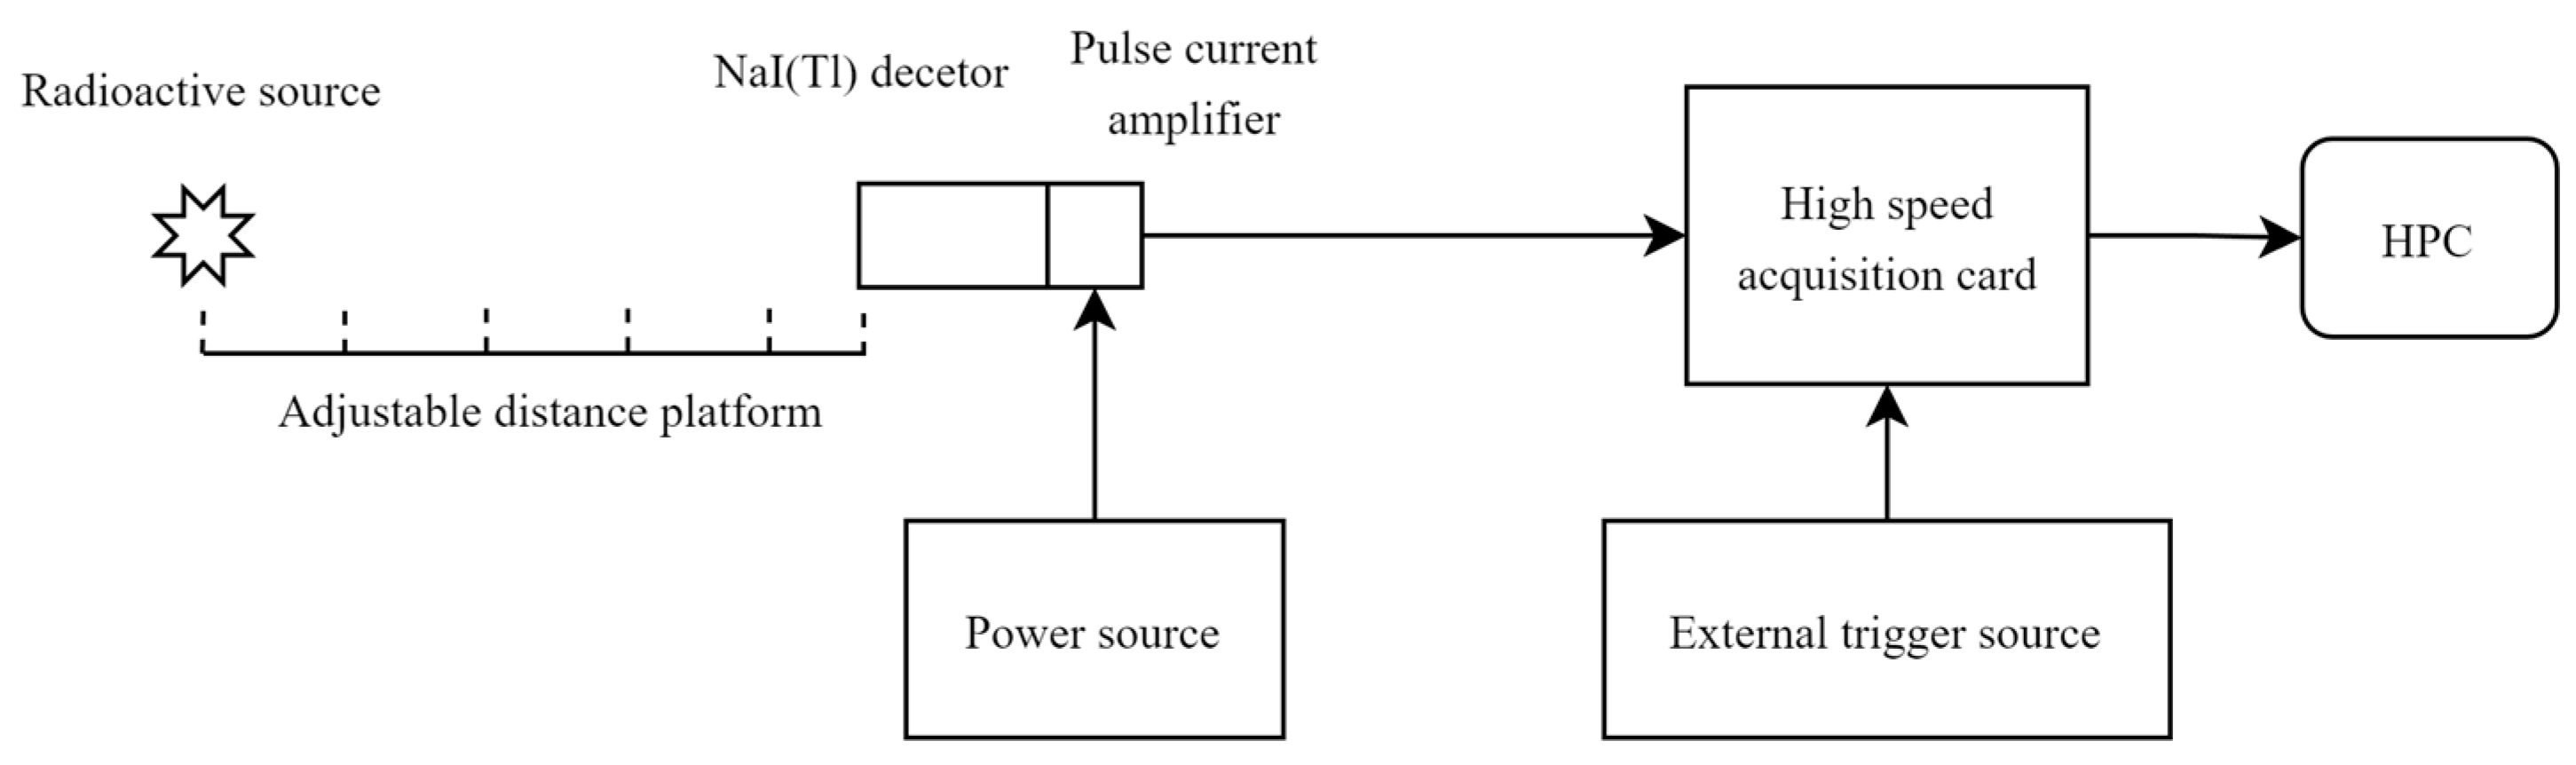
3.1. Setup of the Experiment

To verify the efficiency of the UTB method, the experiment was conducted under different dose rates. The schematic diagram of the experimental setup is shown in Figure 7.
The setup of the experiment included a 137Cs radioactive source (3 mCi with the heavy lead shielding), a Φ2″ × 2″ NaI(Tl) detector coupled with PMT (HAMAMATSU, Hamamatsu, Japan; Model CR173), with an anode light sensitivity (typical value) of 30 A/lm (1000 V) and a cathode light sensitivity (typical value) of 110 μA/lm), a self-developed current-sensitive preamplifier with high voltage module and divider, a digitizer (14-bit resolution @ 500 MS/s) built-in the digital MCA IP (CAEN, Viareggio, Italy; Model DT5730), an external trigger source (Tektronix, Portland, OR, USA; Model AFG31000), a power source (Tektronix, Model 2460), a shelf to adjust the distance between source and detector. The dose rates were measured by the dose rate meter (Automess, Ladenburg, Germany; Model 6150AD). The key configuration of the HPC in this experiment is the 12th Gen Intel® Core™ i9-12900K CPU with 16 physical cores and 3.20 GHz basic frequency, which supplies enough computing power for quickly solving the optimization problem.
For different dose rates, the high voltage was set to 630 V. The output signal of the detector was fed to directly the digitizer, the pulse sequences were acquired by the digitizer through the external periodic trigger source, while the spectra were measured by the gate integrator method and the trapezoidal shaping method via the digital MCA IP under the same experimental conditions. The gate integrator (GI) is a simple moving average filter like a comb. The setup for the measurement is listed in Table 1. The acquisition time is the total duration from the sum of many time slices, and limited by the transmission bandwidth and storage speed. There is a time interval between the two anterior and posterior time slices. In our study, the start time of each time slice was obtained from an external trigger source and the time length was set through the high-speed acquisition card; therefore, the effect of the acquisition time was equal to the real time of the DMCA IP.

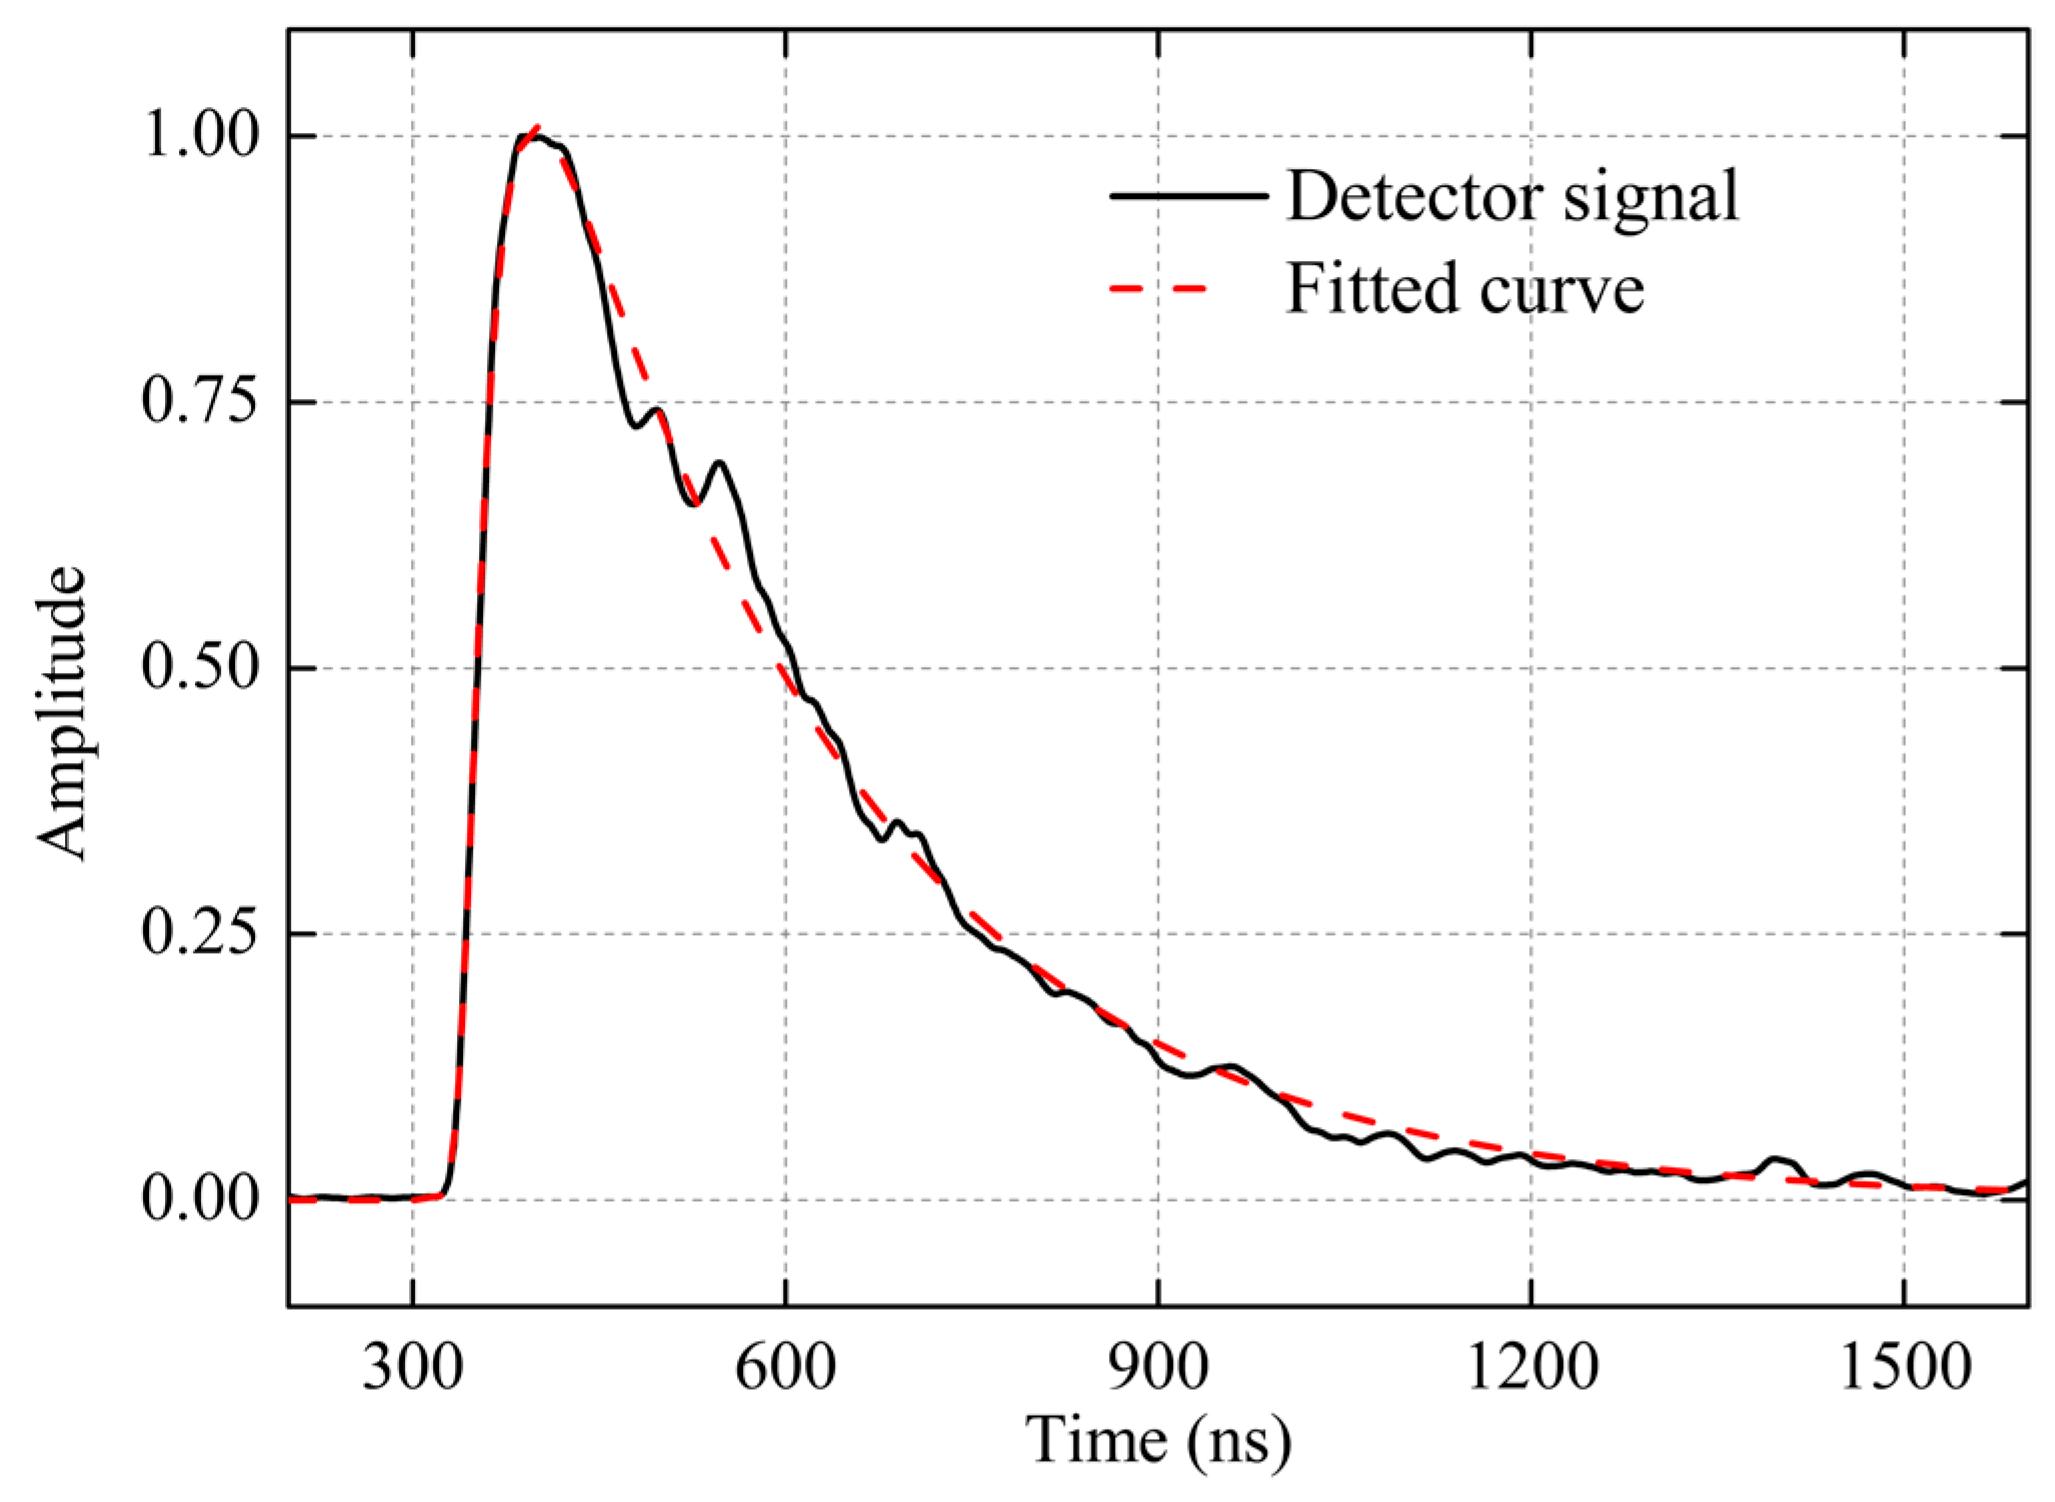
3.2. Parameter Estimation

To construct the response matrix A of the NaI(Tl) detector, the digitized signal was fitted by the model of Equation (1). The fitted curve in Figure 8 indicates that the measured signal agrees well with the model of Equation (1) in the tailing trend except for some statistical fluctuation.
The model parameters with different dose rates are listed in Table 2 and indicate that the variation in count rate exerts little influence on the model parameters.

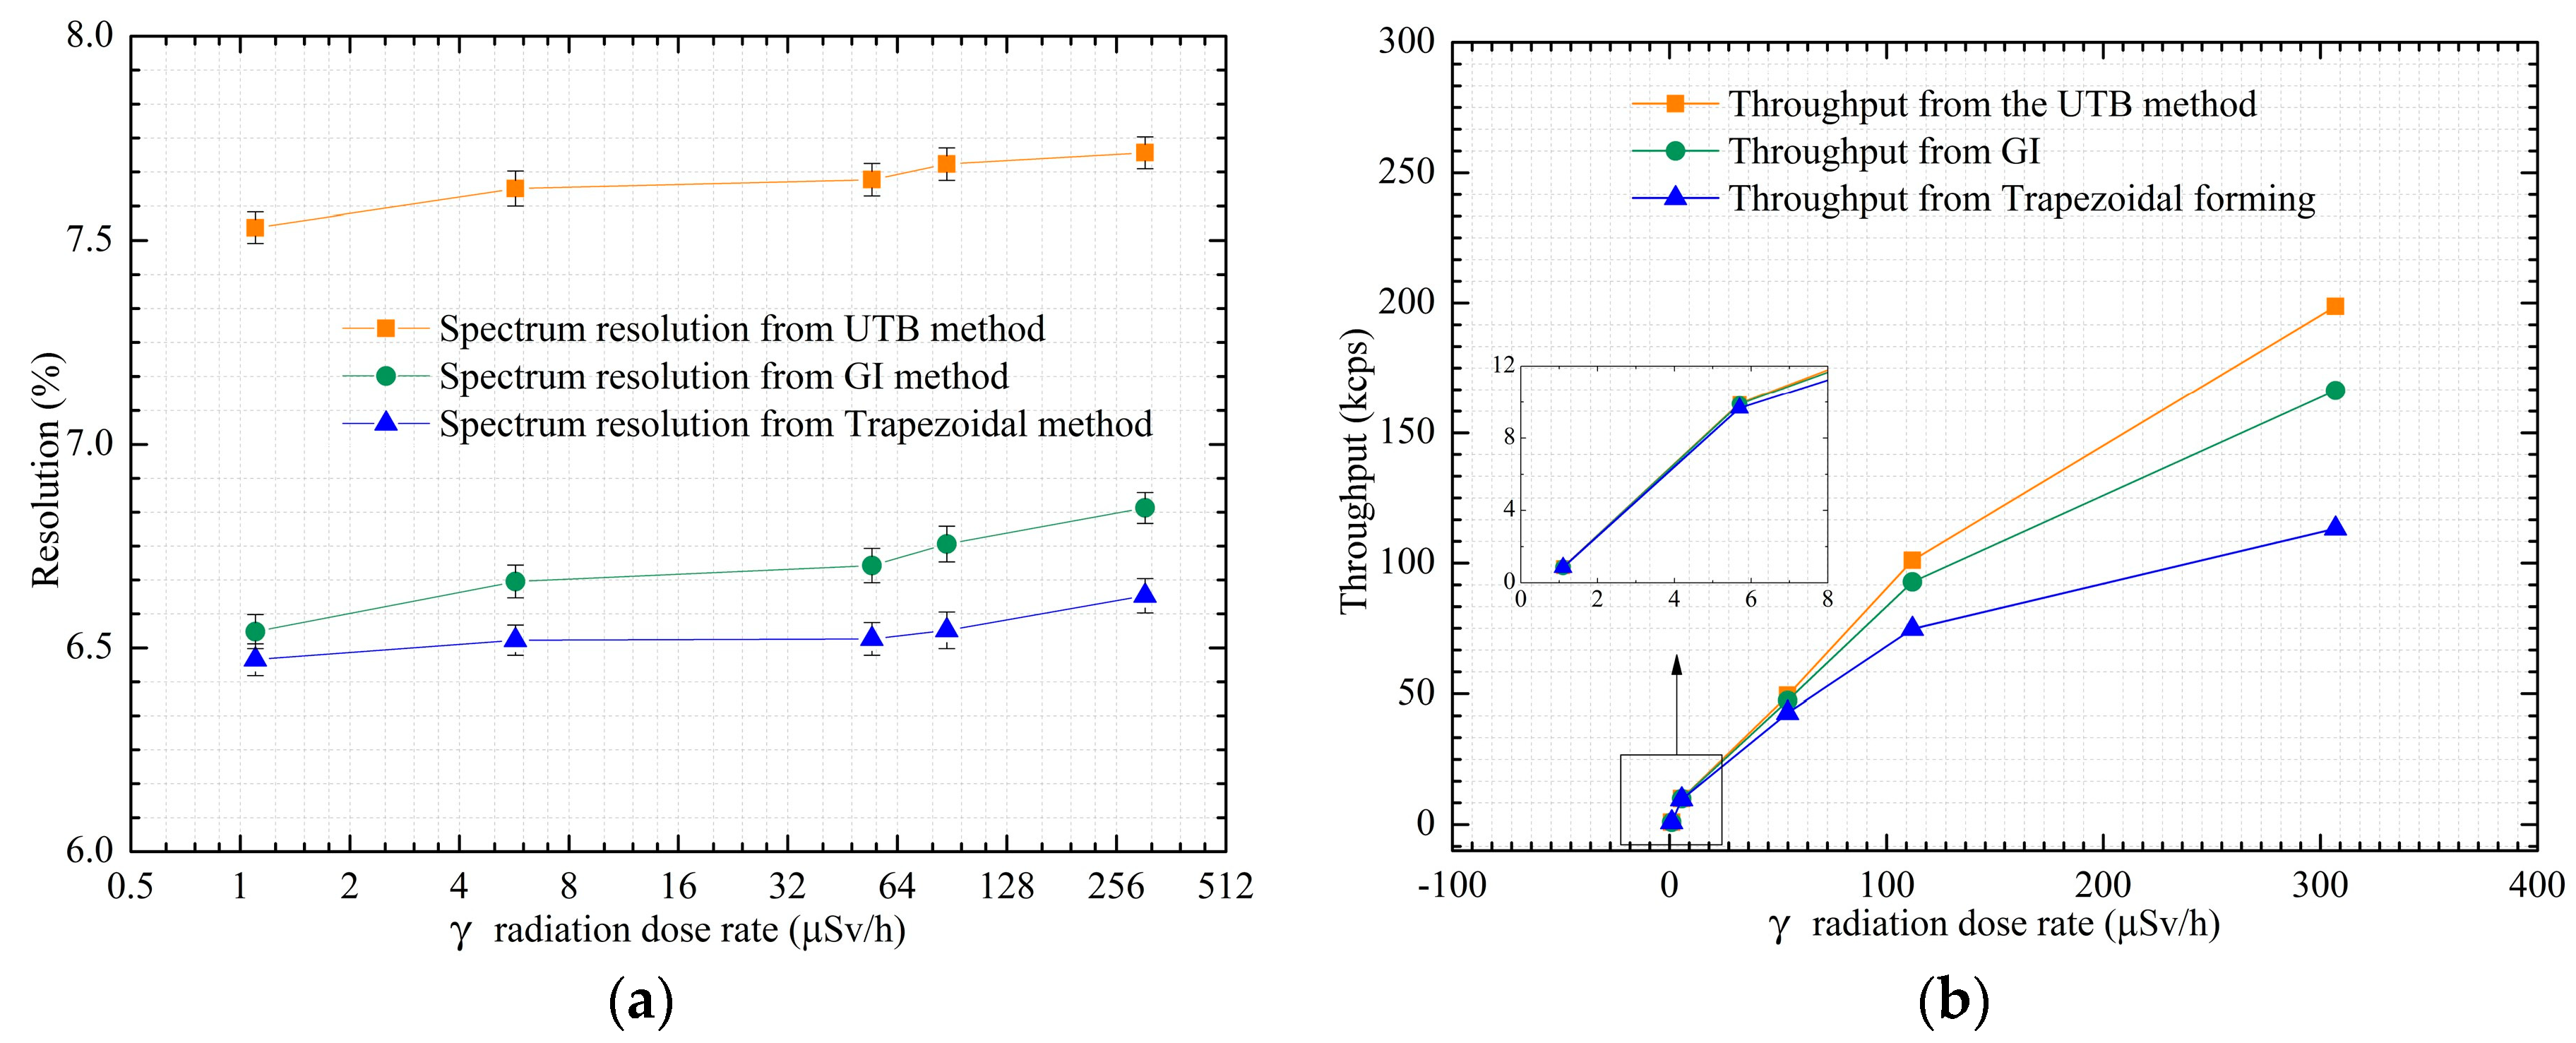
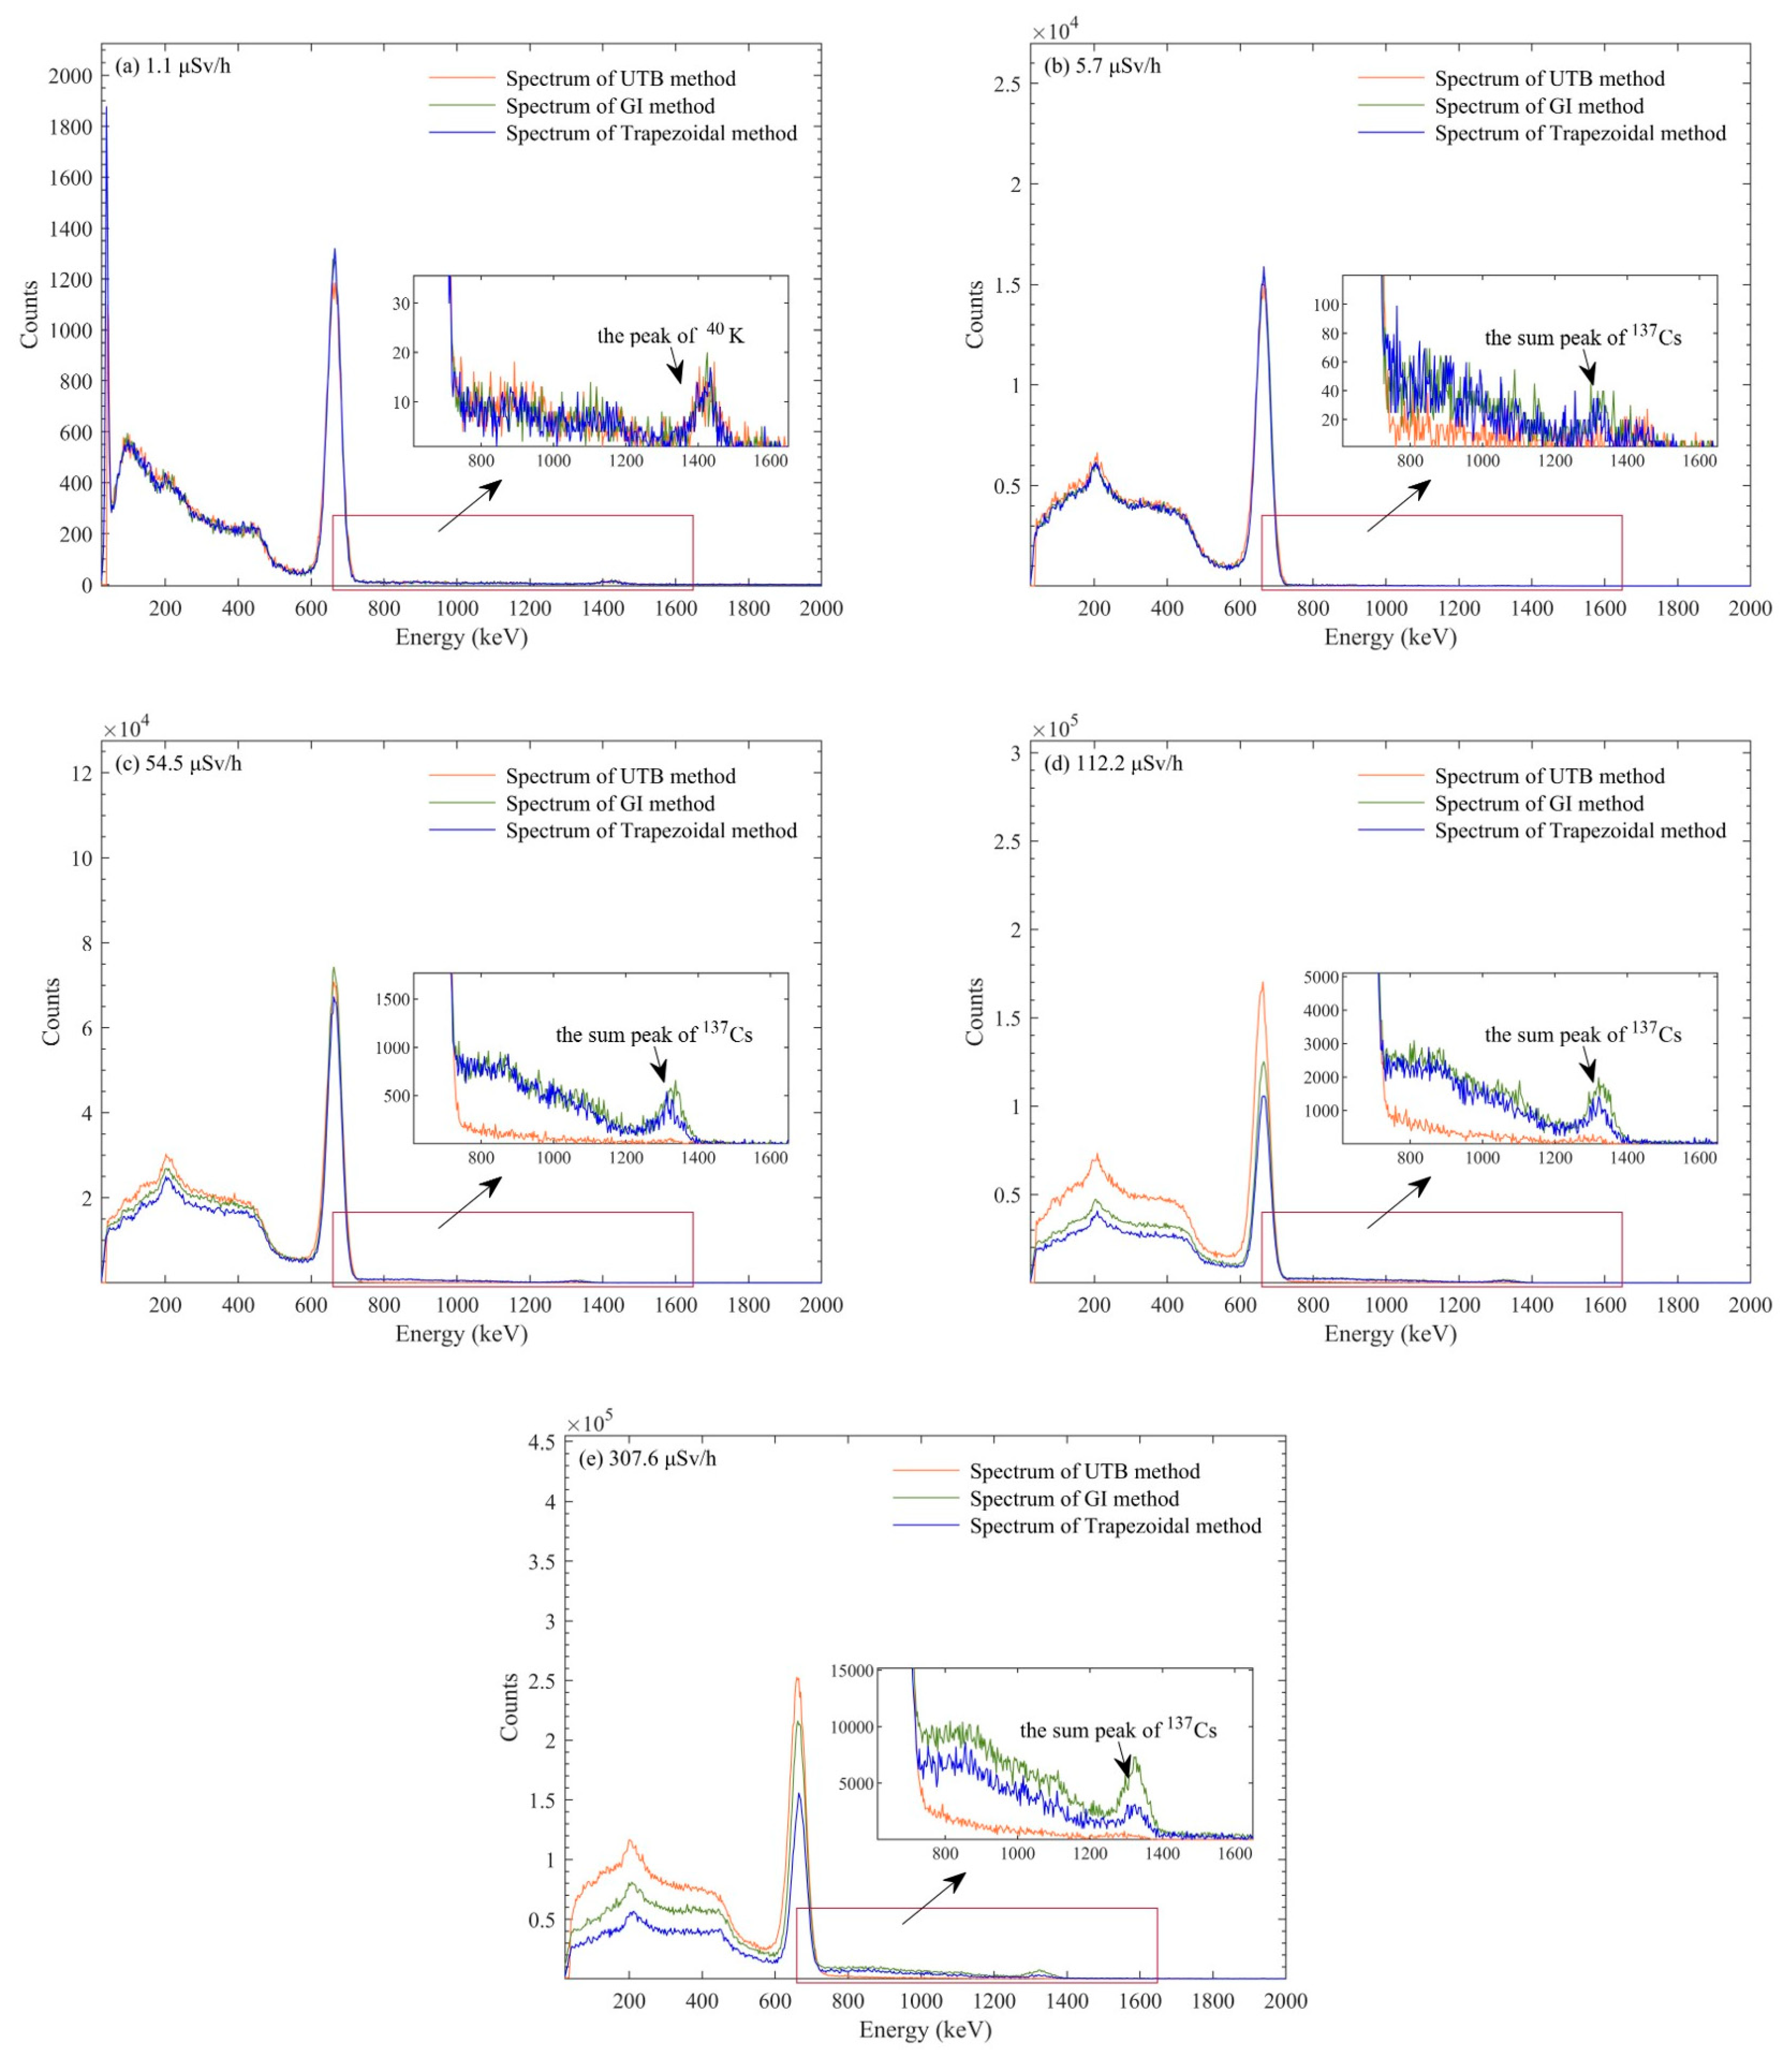
3.3. Verification Results

The results of the UTB method for some slices of the measured pulses are illustrated in Figure 9.
In Figure 9, the reconstructed signal represents the results of the δ-like solution convoluted by the response matrix A, and the residual between the detector signal and the reconstructed signal indicates the model mismatch and the noise. The key information of the incident particle, including the pulse arrival time and the pulse height, can be restored from the δ-like solution of the UTB method, even though the pulses are heavily piled-up.
The energy resolution and the pulse throughput of the UTB method, the GI method, and the trapezoidal shaping method are summarized and shown in Figure 10.
Due to the digital pileup rejection logic and the smoothing effect of the finite integration or accumulation convolution, the energy resolution of the measured spectra from the GI method and trapezoidal shaping method are around 6.5% and 6.7%, respectively. But as the dose rate increases, then the high-energy tailing in the peak zone, generated by scenario (d) in Figure 4, deteriorates the resolution. Because of the deconvolution operation and the mismatch of the model, the resolution of the UTB method is worse than the other two methods, but the throughput is evidently higher, as shown in Figure 10b.
To compare the details of the spectra, all the spectra from the UTB method, the GI method, and the trapezoidal shaping method are shown in Figure 11.
During the experiment, the testing environment was not changed, only the distance between the radiation source and the detector was changed. At the low dose rate, the photopeak of 40K can be displayed. As the count rate increases, the sum peak of 137Cs is more clearly displayed. The results of the comparison are as follows: (1) under the same measurement conditions, the profiles of the measured spectra (from the GI method and trapezoidal shaping method) and the calculated spectra (from the UTB method) are almost identical; (2) with the increase in the dose rates, the higher energy piled-up effect of the UTB method is obviously moderated through restoring the height of the piled-up pulses; (3) due to the resolving capability of the UTB method for the piled-up pulses, the higher energy piled-up area is transferred to the Compton area and the peak zone.

4. Discussion

In this study, an ultra-throughput boost (UTB) method with reduction in the pileup effect is proposed and verified. By the UTB method, the spectrum measuring process was transformed and modeled as the solving of the non-negative constrained optimization problem. Both the simulation and the experiment verification results indicate that this method can resolve the individual and piled-up pulses to the δ-like sequence, which effectively boosts pulse throughput and obviously suppresses the high-energy tailing and the sum peak caused by the pileup effect. Because of the deconvolution operation and the model mismatch during the solving of the constrained optimization problem, the UTB method brings about the limited loss of the energy resolution at different dose rates. With an NaI(Tl) detector, the throughput reached 207 kcps with the resolution of 7.71% @661.7 keV. The experimental results demonstrate that the UTB method cannot simultaneously improve the energy resolution and the throughput. The suppression of pileup effects on the energy spectrum and the improvement of throughput come at the cost of a slight loss of energy resolution.
In this study, the UTB method focuses on the pileup restoration and the throughput increase. It is very useful for nuclide analysis when the ROI interval is located in the range generated by the pileup effect. When the computing power is high enough, the UTB method can achieve online processing and reduce the measurement time, making it suitable for rapid measurement in the strong radiation field. And the UTB method could be also suitable for detectors such as a thin semiconductor with unchangeable pulse shape at different count rates.
In the past decade, high-performance processors and heterogeneous architecture processors have significantly improved computing speed, and the intelligent era characterized by “data + algorithms” has gradually begun. The mathematical modeling of physical problems using equation solving methods (information restoration ideas) is expected to further improve pulse pass rates while suppressing the impact of pileup effects on energy spectra.

Author Contributions

Conceptualization, W.L. and J.L.; methodology, W.L. and J.L.; software, W.L. and J.X.; validation, Q.Z. and Y.Z.; investigation, W.L.; writing—original draft preparation, W.L. and J.L.; writing—review and editing, Q.Z., Y.Z. and W.Z.; supervision, H.C. All authors have read and agreed to the published version of the manuscript.

Funding

This research received no external funding.

Institutional Review Board Statement

Not applicable.

Informed Consent Statement

Not applicable.

Data Availability Statement

The data that support the findings of this study are available from the corresponding author upon reasonable request.

Conflicts of Interest

The authors declare no conflicts of interest.

Appendix A. Convolution Integral Formula

The derivation for the integral of the Gaussian kernel function convoluted with the exponential decay function is shown as follows:
f t = h x g x = + h x · g t x d x
where g x 1 2 π σ · e x 2 2 σ 2 , and h x = e x / τ · u ( t ) .
f t = 0 + e x τ · 1 2 π σ · e t x 2 2 σ 2 d x = 0 + 1 2 π σ · e x 2 + 2 x t σ 2 τ + t σ 2 τ 2 + t 2 t σ 2 τ 2 2 σ 2 d x = e σ 2 2 τ 2 t τ 0 + 1 2 π σ · e [ x t σ 2 τ ] 2 2 σ 2 d x
Let z denote x ( t σ 2 τ ) 2 σ , then
f ( t ) = e σ 2 2 τ 2 t τ · 2 σ t σ 2 τ 2 σ +   1 2 π σ · e z 2 d z = 1 2 σ · e σ 2 2 τ 2 t τ · [ 1 + e r f ( t 2 σ 2 σ 2 τ ) ]
where erf x = 2 π 0 x e t 2 d t .

References

  1. Radeka, V.; Karlovac, N. Least-Square-Error Amplitude Measurement of Pulse Signals in Presence of Noise. Nucl. Instrum. Methods 1967, 52, 86–92. [Google Scholar] [CrossRef]
  2. Radeka, V. Trapezoidal Filtering of Signals from Large Germanium Detectors at High Rates. Nucl. Instrum. Methods 1972, 99, 525–539. [Google Scholar] [CrossRef]
  3. Jordanov, V.T.; Knoll, G.F. Digital Synthesis of Pulse Shapes in Real Time for High Resolution Radiation Spectroscopy. Nucl. Instrum. Methods Phys. Res. Sect. Accel. Spectrometers Detect. Assoc. Equip. 1994, 345, 337–345. [Google Scholar] [CrossRef]
  4. Jordanov, V.T. Deconvolution of Pulses from a Detector-Amplifier Configuration. Nucl. Instrum. Methods Phys. Res. Sect. Accel. Spectrometers Detect. Assoc. Equip. 1994, 351, 592–594. [Google Scholar] [CrossRef]
  5. Raad, M.W.; Deriche, M.; Noras, J.; Shafiq, M. A Novel Approach for Pileup Detection in Gamma-Ray Spectroscopy Using Deconvolution. Meas. Sci. Technol. 2008, 19, 065601. [Google Scholar] [CrossRef]
  6. Bingefors, N.; Bouvier, S.; Gadomski, S.; Hall, G.; Høgh, T.S.; Jalocha, P.; Vd. Lippe, H.; Michel, J.; Nygård, E.; Raymond, M.; et al. A Novel Technique for Fast Pulse-Shaping Using a Slow Amplifier at LHC. Nucl. Instrum. Methods Phys. Res. Sect. Accel. Spectrometers Detect. Assoc. Equip. 1993, 326, 112–119. [Google Scholar] [CrossRef]
  7. Scoullar, P.A.B.; Evans, R.J. Maximum Likelihood Estimation Techniques for High Rate, High Throughput Digital Pulse Processing. In Proceedings of the 2008 IEEE Nuclear Science Symposium Conference Record, Dresden, Germany, 19–25 October 2008; IEEE: Piscataway, NJ, USA, 2008; pp. 1668–1672. [Google Scholar]
  8. Miklavec, M.; Loher, B.; Savran, D.; Novak, R.; Sirca, S.; Vencelj, M. Pile-up Correction Techniques for Real-Time Dosimetry in Photon Radiotherapy. In Proceedings of the 2012 IEEE Nuclear Science Symposium and Medical Imaging Conference Record (NSS/MIC), Anaheim, CA, USA, 29 October–3 November 2012; IEEE: Piscataway, NJ, USA, 2012; pp. 3880–3882. [Google Scholar]
  9. Xiao, W.; Farsoni, A.T.; Yang, H.; Hamby, D.H. A New Pulse Model for NaI(Tl) Detection Systems. Nucl. Instrum. Methods Phys. Res. Sect. Accel. Spectrometers Detect. Assoc. Equip. 2014, 763, 170–173. [Google Scholar] [CrossRef]
  10. Xiao, W.; Farsoni, A.T.; Yang, H.; Hamby, D.M. Model-Based Pulse Deconvolution Method for NaI(Tl) Detectors. Nucl. Instrum. Methods Phys. Res. Sect. Accel. Spectrometers Detect. Assoc. Equip. 2015, 769, 5–8. [Google Scholar] [CrossRef]
  11. Kafaee, M.; Goodarzi, M.M. Pile-Up Correction in Spectroscopic Signals Using Regularized Sparse Reconstruction. IEEE Trans. Nucl. Sci. 2020, 67, 858–862. [Google Scholar] [CrossRef]
  12. De Rooi, J.; Eilers, P. Deconvolution of Pulse Trains with the L0 Penalty. Anal. Chim. Acta 2011, 705, 218–226. [Google Scholar] [CrossRef] [PubMed]
  13. Li, J.; Xiao, W.; Ai, X.; Chen, Y. Nonnegative Constraint Quadratic Program Technique to Enhance the Resolution of γ Spectra. Nucl. Instrum. Methods Phys. Res. Sect. Accel. Spectrometers Detect. Assoc. Equip. 2018, 887, 169–173. [Google Scholar] [CrossRef]
  14. Morháč, M.; Matoušek, V. High-Resolution Boosted Deconvolution of Spectroscopic Data. J. Comput. Appl. Math. 2011, 235, 1629–1640. [Google Scholar] [CrossRef]
  15. Ma, X.-K.; Huang, H.-Q.; Wang, Q.-C.; Zhao, J.; Yang, F.; Jiang, K.-M.; Ding, W.-C.; Zhou, W. Estimation of Gaussian Overlapping Nuclear Pulse Parameters Based on a Deep Learning LSTM Model. Nucl. Sci. Tech. 2019, 30, 171. [Google Scholar] [CrossRef]
  16. Ma, X.-K.; Huang, H.-Q.; Ji, X.; Dai, H.-Y.; Wu, J.-H.; Zhao, J.; Yang, F.; Tang, L.; Jiang, K.-M.; Ding, W.-C.; et al. Estimation of Trapezoidal-Shaped Overlapping Nuclear Pulse Parameters Based on a Deep Learning CNN-LSTM Model. J. Synchrotron Radiat. 2021, 28, 910–918. [Google Scholar] [CrossRef] [PubMed]
  17. Wang, Q.; Huang, H.; Ma, X.; Shen, Z.; Zhong, C.; Ding, W.; Zhou, W.; Zhou, J. Trapezoidal Pile-up Nuclear Pulse Parameter Identification Method Based on Deep Learning Transformer Model. Appl. Radiat. Isot. 2022, 190, 110515. [Google Scholar] [CrossRef] [PubMed]
  18. Ai, P.; Deng, Z.; Wang, Y.; Shen, C. Universal Uncertainty Estimation for Nuclear Detector Signals with Neural Networks and Ensemble Learning. J. Instrum. 2022, 17, P02032. [Google Scholar] [CrossRef]
  19. Li, H.; Wang, C.; Baghaei, H.; Zhang, Y.; Ramirez, R.; Liu, S.; An, S.; Wong, W.-H. A New Statistics-Based Online Baseline Restorer for a High Count-Rate Fully Digital System. IEEE Trans. Nucl. Sci. 2010, 57, 550–555. [Google Scholar] [CrossRef] [PubMed]
  20. Gray, R.M. Toeplitz and Circulant Matrices: A Review. Found. Trends® Commun. Inf. Theory 2005, 2, 155–239. [Google Scholar] [CrossRef]
  21. Boyd, S.P.; Vandenberghe, L. Convex Optimization; Cambridge University Press: Cambridge, UK; New York, NY, USA, 2004; ISBN 978-0-521-83378-3. [Google Scholar]
Figure 1. The outline of the UTB method.
Energies 17 01456 g001
Figure 2. The flow of the UTB method.
Energies 17 01456 g002
Figure 3. The response matrix A.
Energies 17 01456 g003
Figure 4. The trigger logic and shaping algorithm under the various situations.
Energies 17 01456 g004
Figure 5. The solution of UTB method to simulated pulses without noise and with noise.
Energies 17 01456 g005
Figure 6. The spectra from the UTB method compared with the ideal ones.
Energies 17 01456 g006
Figure 7. The schematic diagram of experimental setup.
Energies 17 01456 g007
Figure 8. The measured signal and fitted curve.
Energies 17 01456 g008
Figure 9. The solution of the UTB method to measured pulses.
Energies 17 01456 g009
Figure 10. The results of the resolution and the throughput. (a) The comparison results of the resolution; (b) the comparison results of the throughput.
Energies 17 01456 g010
Figure 11. The spectra normalized to 100 s by the real time and the acquisition time.
Energies 17 01456 g011
Table 1. The setup of the UTB method, the GI method, and the trapezoidal shaping method.
Dose Rate (μSv/h)UTBGITrapezoidalGI *Trapezoidal
Acquisition Time (s)Real Time (s)Rise Time/Flat Top (μs)
1.1100.0100.0100.00.016/11/1
5.720.020.020.00.016/11/1
54.510.010.010.00.016/11/1
112.25.05.05.00.016/11/1
307.62.02.02.00.016/11/1
*: Limited by the digital MCA IP, 0.016 μ s is the lower limit, which should be supposed to be 0 μ s .
Table 2. Parameters in Equation (4) at different dose rate.
Model Parameters (ns) Dose   Rate   ( μ S v / h )
1.15.754.5112.2307.6
σ 12.67812.75912.74912.76112.752
τ 1 31.10631.53231.43231.65331.591
τ 2 230.108231.302230.985231.689231.762
R-square0.99910.99880.99890.99850.9985
Disclaimer/Publisher’s Note: The statements, opinions and data contained in all publications are solely those of the individual author(s) and contributor(s) and not of MDPI and/or the editor(s). MDPI and/or the editor(s) disclaim responsibility for any injury to people or property resulting from any ideas, methods, instructions or products referred to in the content.

