Article

The Interaction between Short- and Long-Term Energy Storage in an nZEB Office Building

by
George Stamatellos
and
Antiopi-Malvina Stamatellou
*
Department of Mechanical Engineering, University of Thessaly, 38221 Volos, Greece
*
Author to whom correspondence should be addressed.
Energies 2024, 17(6), 1441; https://doi.org/10.3390/en17061441
Submission received: 9 February 2024 / Revised: 12 March 2024 / Accepted: 15 March 2024 / Published: 17 March 2024

Abstract

:
The establishment of near-autonomous micro-grids in commercial or public building complexes is gaining increasing popularity. Short-term storage capacity is provided by means of large battery installations, or, more often, by the employees’ increasing use of electric vehicle batteries, which are allowed to operate in bi-directional charging mode. In addition to the above short-term storage means, a long-term storage medium is considered essential to the optimal operation of the building’s micro-grid. The most promising long-term energy storage carrier is hydrogen, which is produced by standard electrolyzer units by exploiting the surplus electricity produced by photovoltaic installation, due to the seasonal or weekly variation in a building’s electricity consumption. To this end, a novel concept is studied in this paper. The details of the proposed concept are described in the context of a nearly Zero Energy Building (nZEB) and the associated micro-grid. The hydrogen produced is stored in a high-pressure tank to be used occasionally as fuel in an advanced technology hydrogen spark ignition engine, which moves a synchronous generator. A size optimization study is carried out to determine the genset’s rating, the electrolyzer units’ capacity and the tilt angle of the rooftop’s photovoltaic panels, which minimize the building’s interaction with the external grid. The hydrogen-fueled genset engine is optimally sized to 40 kW (0.18 kW/kWp PV). The optimal tilt angle of the rooftop PV panels is 39°. The maximum capacity of the electrolyzer units is optimized to 72 kW (0.33 kWmax/kWp PV). The resulting system is tacitly assumed to integrate to an external hydrogen network to make up for the expected mismatches between hydrogen production and consumption. The significance of technology in addressing the current challenges in the field of energy storage and micro-grid optimization is discussed, with an emphasis on its potential benefits. Moreover, areas for further research are highlighted, aiming to further advance sustainable energy solutions.

1. Introduction

The increasing production of electricity worldwide, which is necessary to address building and transportation electrification, must be supported by the further expansion of smart grids [1]. As a result, research on smart micro-grids established in nearly Zero Energy Buildings (nZEBs) has intensified [2]. A nearly zero-emission building is very efficient, with its minimal energy needs usually covered by renewable sources [3]. Micro-grids in nZEBs are increasingly designed to be self-sufficient, optimally controlling their grid transactions to safeguard their stability. The current European standards limit the net annual primary energy infusion to 20–30 kWh/m2y [4]. These buildings are characterized by an insulated shell and by smart features within their controls. Heating and cooling is implemented by high-efficiency heat pumps. Electricity is usually produced by photovoltaic installations. However, these sources are intermittent, opening spatial and temporal gaps between the availability of energy and its consumption by end-users. To address these issues, it is necessary to develop suitable energy storage systems for the power grid [5]. The EPBD Directive [6] mandates all new buildings to be nZEBs from 2021 onwards. A shift to zero-emission buildings (ZEBs) is projected to be achieved by 2030 [7]. Energy performance optimization is attained by high shell insulation, efficient lighting and advanced heat pump technology [8]. This concept results in a significant surplus of PV electricity around afternoon hours. A recent study on a campus building expanded the measured annual hourly load profiles with a data augmentation method [2] and proposed an improved energy management strategy for power production and storage. The performance indices employed include PV utilization ratio, load match ratio and grid flexibility factor. The optimal sizing of the system was performed based on its impact on the grid. It resulted in a 1050 kW peak PV installation, an internal fleet of 300 electric cars and an additional fixed battery capacity of 450 kWh. Nafeh et al. presented a methodology for the optimal sizing of a proposed PV battery grid-connected system for fast charging stations for electric vehicles in Cairo [9]. By shifting one’s attention to the big international picture, one can observe that the increasing penetration of wind farms and photovoltaic parks in modern electricity grids results in stochastic electricity production with frequent peaks, which disturb the grid’s operation and result in the dumping of large amounts of renewable energy. In an extensive study on the new power system paradigm of China, Yan et al. [10] conducted power supply and demand production simulations based on the characteristics of new energy generation in China. They found that when the penetration of new energy sources in the system exceeds 45%, long-term energy storage becomes an essential regulation tool. By comparing the storage duration, storage scale and application scenarios of various energy storage technologies, these researchers concluded that hydrogen storage is the most preferable choice to participate in large-scale and long-term energy storage. Jung et al. compared models of optimal capacity and facility operation methods based on long-term operational changes in distributed energy resources in a building with self-consumption in Korea [11]. The spread of energy storage systems in buildings plays a significant role, as these systems compensate for the intermittency of renewable energy and act as demand management resources through load leveling to transfer the power load [12]. Other forms of short-term storage are combined with the above techniques. Ju et al. studied the load-shaving capabilities of a 5 m3 thermal storage tank directly charged by the district heating supply water which was integrated into a substation of a Finnish office building [13]. In Germany, it is estimated that achieving the full grid penetration of renewables by 2050 would require about 80 TWh of storage capacity [14]. In that context, the economically favorable solution of water pumping in large reservoirs associated with hydro power is geographically limited. Thus, hybrid PV battery storage systems are increasingly applied in commercial buildings. Thermal storage (heating or cooling) is frequently combined with electricity storage in these buildings due to the high cost of batteries. According to a study by Chen et al., a 40% PV penetration combined with a 0.006 $/(kWhe) energy storage investment resulted in an impressive 27.3% cost reduction in a Beijing mall, while the optimal cooling storage rate decreased from 55% to 40%. [15]. An alternative approach with increasing research focus is the application of direct current (DC) microgrids [16] that can improve distribution efficiency by reducing power conversion stages. Research on distributed energy resources using renewable energy on DC microgrids is gaining momentum [17]. As battery costs decline and electricity prices fluctuate more, the battery would gradually replace cooling storage. However, there is a long way to go to reduce battery costs from the current value of 150 USD/kWh to a more economically viable 70 USD/kWh. The above restrictions have further increased attention to the use of hydrogen as an intermediate energy carrier. Hydrogen acts as a long-term storage medium for surplus renewable electricity [18]. Its role will be critical for the electrification of energy systems and the shift to zero greenhouse gas emissions [19]. In theory, hydrogen could be oxidized in a fuel cell to produce electricity at specific instances [20]. Currently, about 40% of the H2 currently consumed in industry is a by-product of large-scale chemical processes, while the remaining 60% is mainly produced as a by-product of fossil hydrocarbon extraction and processing. Since the investment in battery storage equipment is lagging due to the high costs involved, power-to-gas technology emerges as the most viable option. This involves the use of electrolyzer devices that produce hydrogen that can be stored in high-pressure tanks to fuel vehicles or be mixed with natural gas. The addition of renewable hydrogen to natural gas is a viable and promising strategy to achieve the gradual de-carbonization of the fuel mix used in electricity production and space heating. On the other hand, the use of renewable hydrogen as an automotive fuel is a valid strategy to achieve the de-carbonization of transportation, which develops in parallel with vehicle electrification [14]. In this respect, despite the high incentivization of plug-in hybrids in Germany and the EU, spark-ignition (SI) engine cars continue to dominate new registrations. If one additionally considers hybrids, which are mostly equipped with SI engines, the total amounts to two-thirds of new car registrations in 2023. On the other hand, using battery-powered electric trucks is not a viable option due to their covering of long distances at continuous near full load operation, which requires a large battery size and weight, as well as a long battery charging time. Under these circumstances, hydrogen, having the highest energy density of all fuels, with a lower heating value of 120 MJ, remains an ideal candidate for CO2-neutral, long-range, heavy-duty vehicles, which cause the battery capacity to be stressed to the limit. The above trends and perspectives lead to the development of advanced hydrogen-fueled, spark-ignition engines and high-pressure hydrogen storage tanks with advanced technology. The market growth for H2 storage tanks for mobile and on-site storage is expected to exceed a value of USD 7 billion by 2030 [21]. Large-scale synergies may be attained through the exploitation of the above technologies in the building sector, where a significant number of research works examine optimal grid integration in commercial and public nZEBs. These studies profit from on-site measurements and the modeling of a building’s and grid’s operation, taking into account the existing constraints and mutual information exchange [22]. The use of the storage capacity of employees’ electric cars is now a workable option to provide short-term electricity storage in commercial and public buildings. This option may be profitably combined with the usual electric vehicle charging infrastructure [23]. This includes both wired charging and wireless charging. Interoperability is crucial in the charging process and is the subject of intensive research [24]. New legislation already seeks the optimal exploitation of alternative charging sources by means of price regulation [25]. Engel et al. studied the effects of the increase in the share of electric vehicles to local peak loads and the slope of the evening ramp in a residential feeder circuit [26]. Thomas et al. [27] studied a smart grid in a university campus building, which comprised renewables, a fixed storage system and a fleet of electric cars. They employed two-year actual smart metering data to create discrete probabilities for PV production scenarios and found that the uncertainty in PV production could lead to a threefold increase in the daily system cost estimation. Such effects must be relaxed by adopting smart charging and exploiting the effect of more households being involved in one feeder circuit. Fachrizal [28] optimized a workplace with PV-powered chargers using load matching. Office nZEBs comprise a popular field of study in this context [29,30]. The optimized in-house charging system should be capable of reducing the cost for electric car owners by simultaneously protecting the grid [31]. The optimal sizing of a hybrid solar photovoltaic (PV) and battery energy storage (BES) system for grid-connected commercial buildings was studied in [32]. The authors optimized the energy system of a grid-connected university building in Malaysia. They attained a 12.3% reduction in electricity cost, a 22.6% reduction in annual energy consumption, and a 15.85% reduction in peak demand. Although battery storage is an established option for short-term photovoltaic electricity storage, long-term, seasonal energy storage is mandatory because of the significant seasonal variations in the heat pump’s electricity consumption. A convenient solution is to produce hydrogen from electrolyzer units powered by solar electricity [20]. Go et al. studied a H2 storage system comprising an electrolyzer, H2 tank and a fuel cell for seasonal storage [33]. They found that the H2 storage system compensated for a self-discharge loss of the battery for seasonal storage. Hai et al. modeled an autonomous residential building with four occupants for Kuwait’s capital, which was powered by solar panels and stored excess energy in a hydrogen tank [34]. Zahra et al. comparatively studied the effects of battery versus hydrogen storage in a typical residential building in Iran [35]. The prospect of using fuel cells to transform stored hydrogen to electricity is a subject of intense discussion due to the higher efficiency in energy conversion [36]. However, these applications are at a continuous experimental stage [37]. Moreover, extensive comparative lifecycle and reliability assessments of these alternatives would be necessary prior to their widespread application [38,39]. On the other hand, another electric power source is already available as standard equipment in commercial and public buildings in the form of diesel-powered engine generator sets for emergency power supply. A study of the effect of fueling a building’s genset using natural gas [40] pointed to its optimal sizing as an additional power source, resulting in limited electricity imports from the grid. Now, the problem with this type of configuration is caused by the lack of long-term electricity storage. The export of large quantities of electricity to the grid during hours with high insolation is the result in these cases. A comparison of the time slots with significant export to the grid during weekends with the load curves of the Greek electricity grid indicated that these quantities are not favorable for grid stability. The current work proposes a significant improvement to the micro-grid’s design by adding the in situ production of green hydrogen with a novel power system layout and timing. Green hydrogen is only produced during the weekends by means of commercially available alkaline electrolyzer units. The hydrogen produced is pressurized and stored in a high-pressure vessel. It can be employed to fuel an advanced state-of-the-art technology, direct-injection, spark-ignition engine that powers the generator set. This genset can be optimally dispatched by the smart grid during weekdays to minimize external grid interaction. The optimal sizing of several components of this micro-grid is critical to the success of this concept. An energy analysis of the optimized system indicates that the interaction between short-term (battery) and long-term (hydrogen) storage is beneficial to the overall system’s performance and may profitably match with the hydrogen infrastructure already in progress. All of this leads to a novel concept with a high reliability and degree of technological maturity for immediate application.
This paper is organized as follows: Section 2 describes the building and its energy system’s modeling details, the reasoning behind the main components’ sizing and the methodology for system optimization. Section 3 presents and discusses the transient system’s performance, with special emphasis placed on the interaction with the grid during weekdays and weekends. The conclusions follow in Section 4.

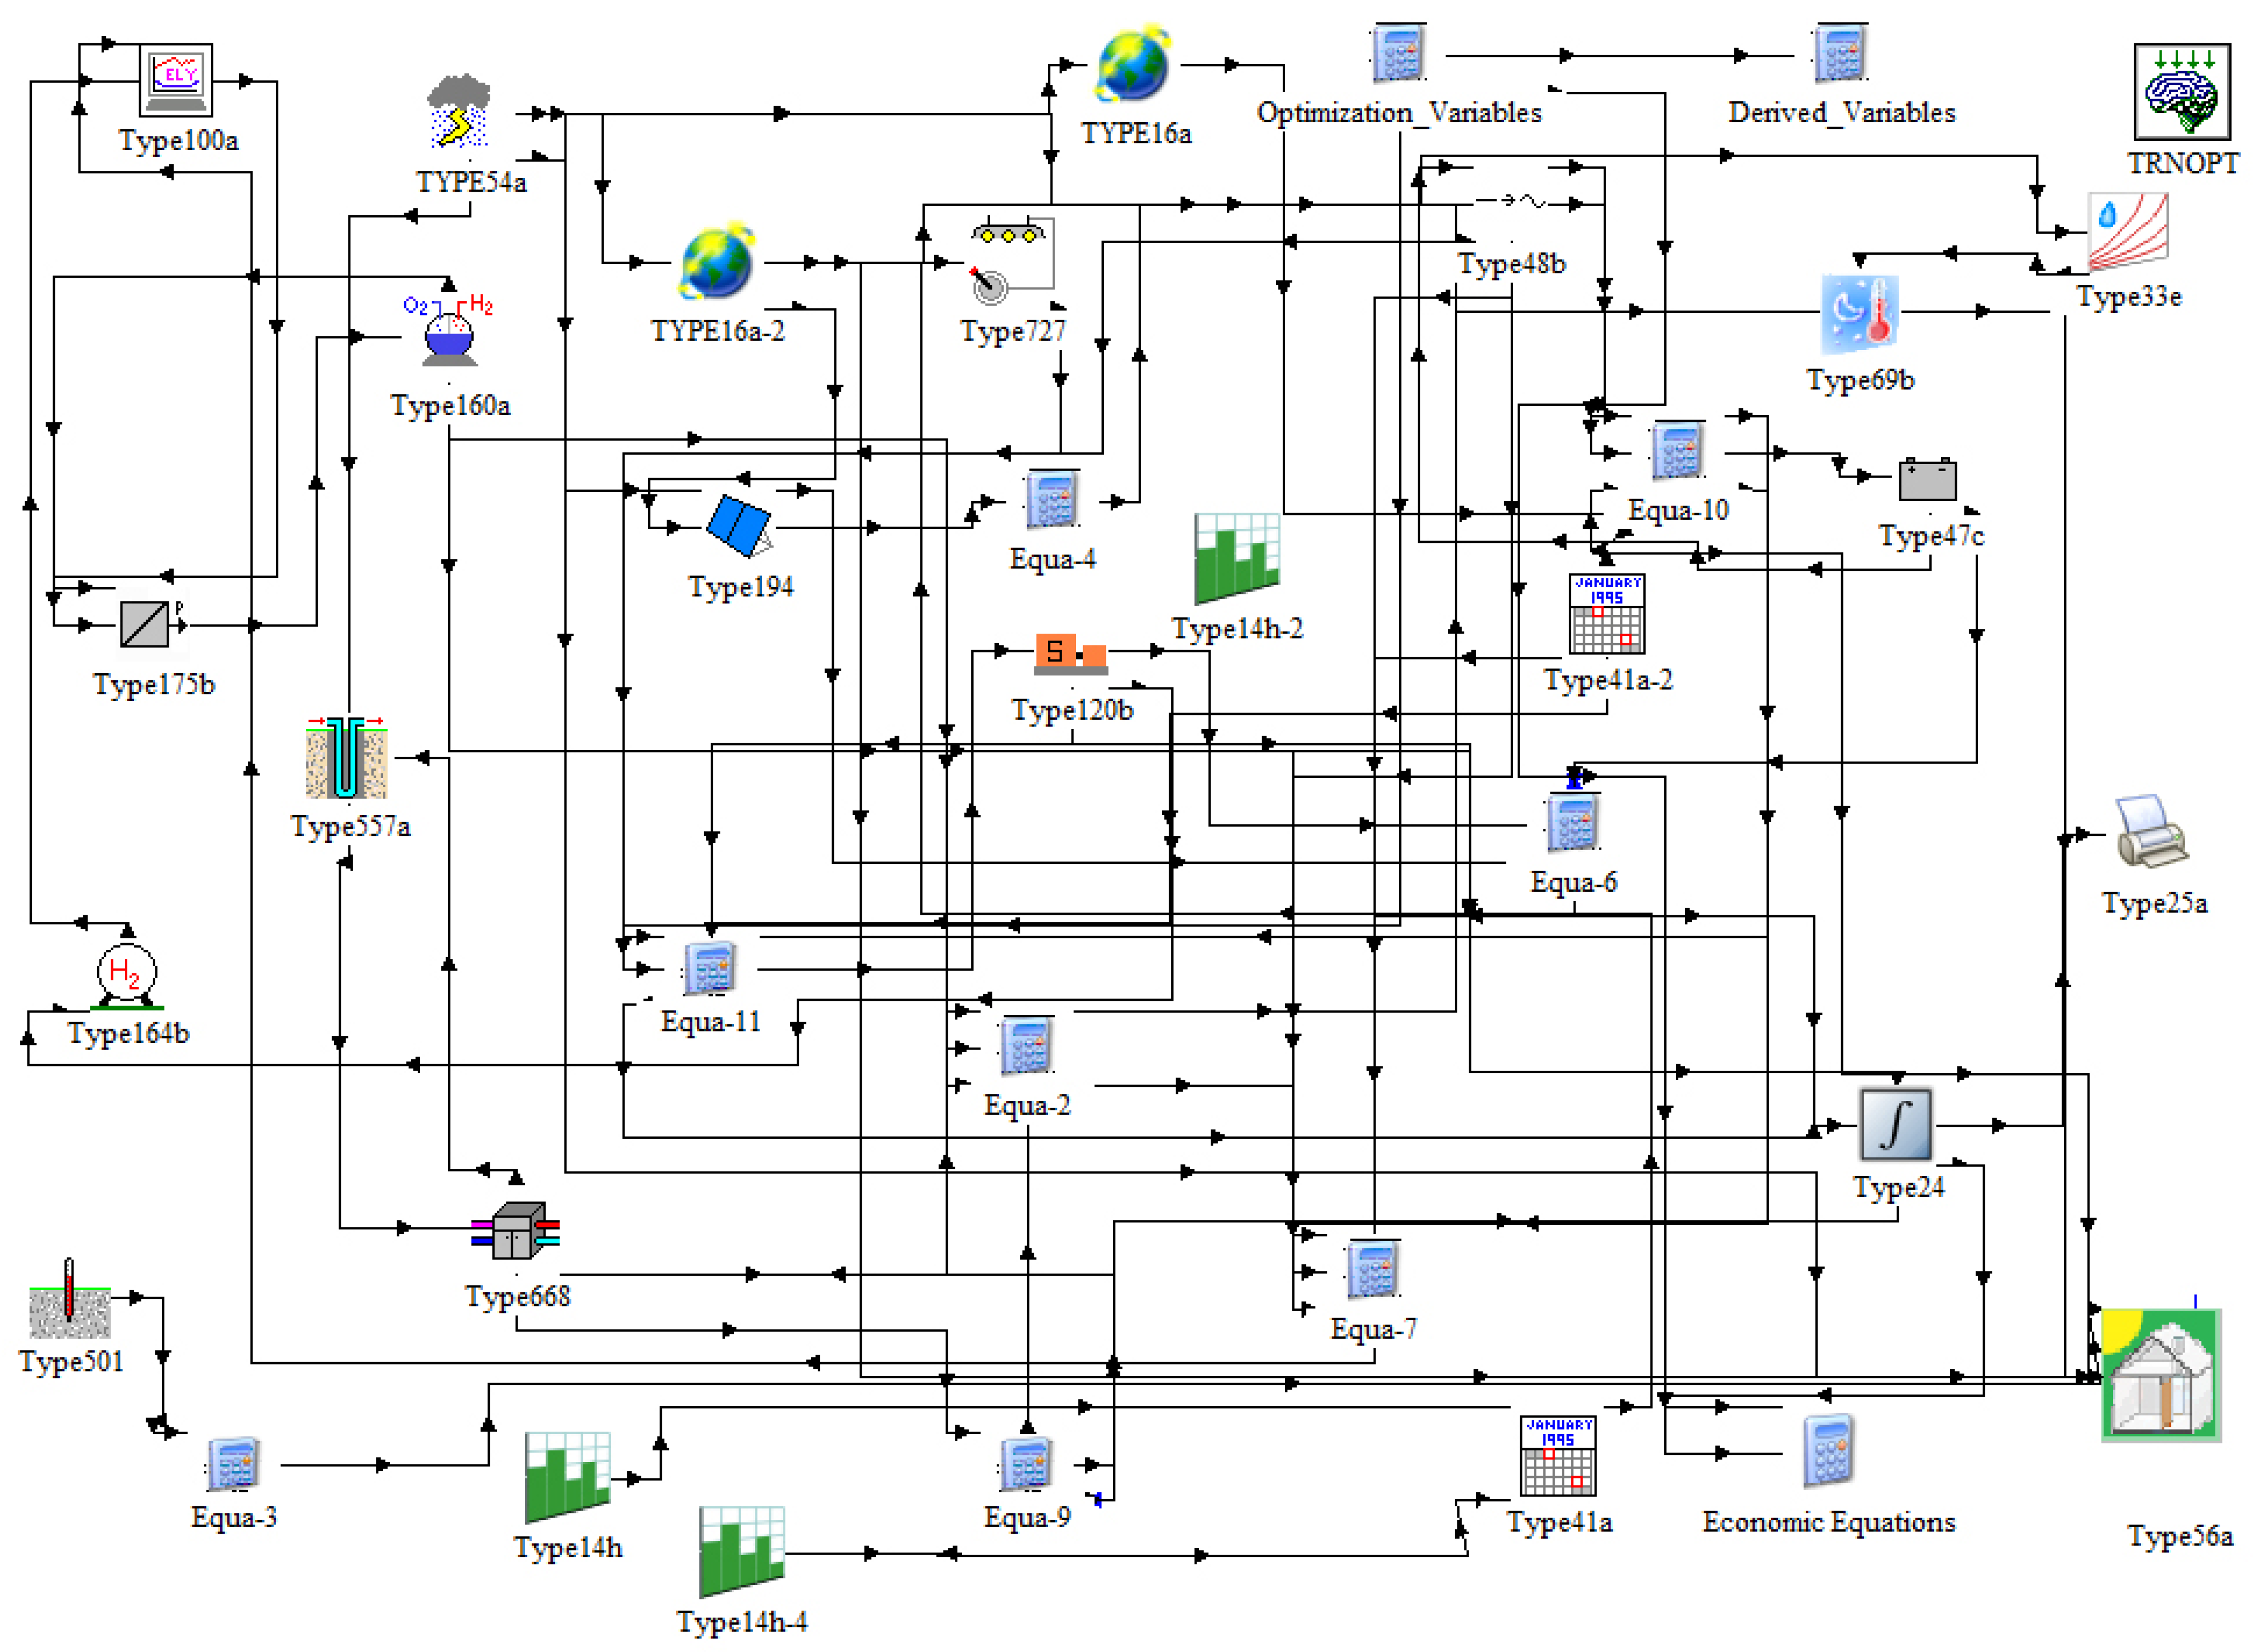
2. Materials and Methods

The interaction between short-term and long-term energy storage is demonstrated in an office nZEB. The transient performance of the building’s energy system is carried out in a TRNSYS environment. The modular structure of TRNSYS is favorable for the simulation of complex energy systems because it breaks them into smaller components [41]. TRNSYS is a well-known, standardized energy system simulation environment [42]. The various sub-systems’ models and the respective initial and boundary conditions are discussed next. The sizing of the main energy system’s components adheres to the nZEB legislation requirements. High-efficiency photovoltaic panels span the building’s flat rooftop space (Figure 1). Thus, the size of the photovoltaic installation is determined by the available rooftop space.

2.1. Building and HVAC System Description

The layout of a typical floor of an 18-zone office building is presented in Figure 1b. It consists of 4 stories, and more details on its design are summarized in Appendix A. This is a building with advanced insulation, high technology windows and advanced shading. Its total useful area is 5750 m2. There exist eighty parking places in the basement, which has a 6 m ceiling height. Twenty of these places are equipped with EV chargers [43].
The main TRNSYS components employed in the specific system’s simulation are presented in Figure 2. The building is modeled by a Type 56 multizone building model. A TMY for the city of Volos is inserted as meteorological boundary condition. A water-to-water heat pump is deployed for space heating and cooling. Heat is rejected in summer and gained in winter from the ground by means of eighty 0.2 m dia. boreholes, going to a depth of 80 m below ground level. The water exiting the heat pump feeds coil units (for office spaces) and air handling units for auditoriums. LED lighting is employed throughout the building. Type 668 is used to model the heat pump [44]. Type 557a is used to model the ground heat exchanger circuit [44].

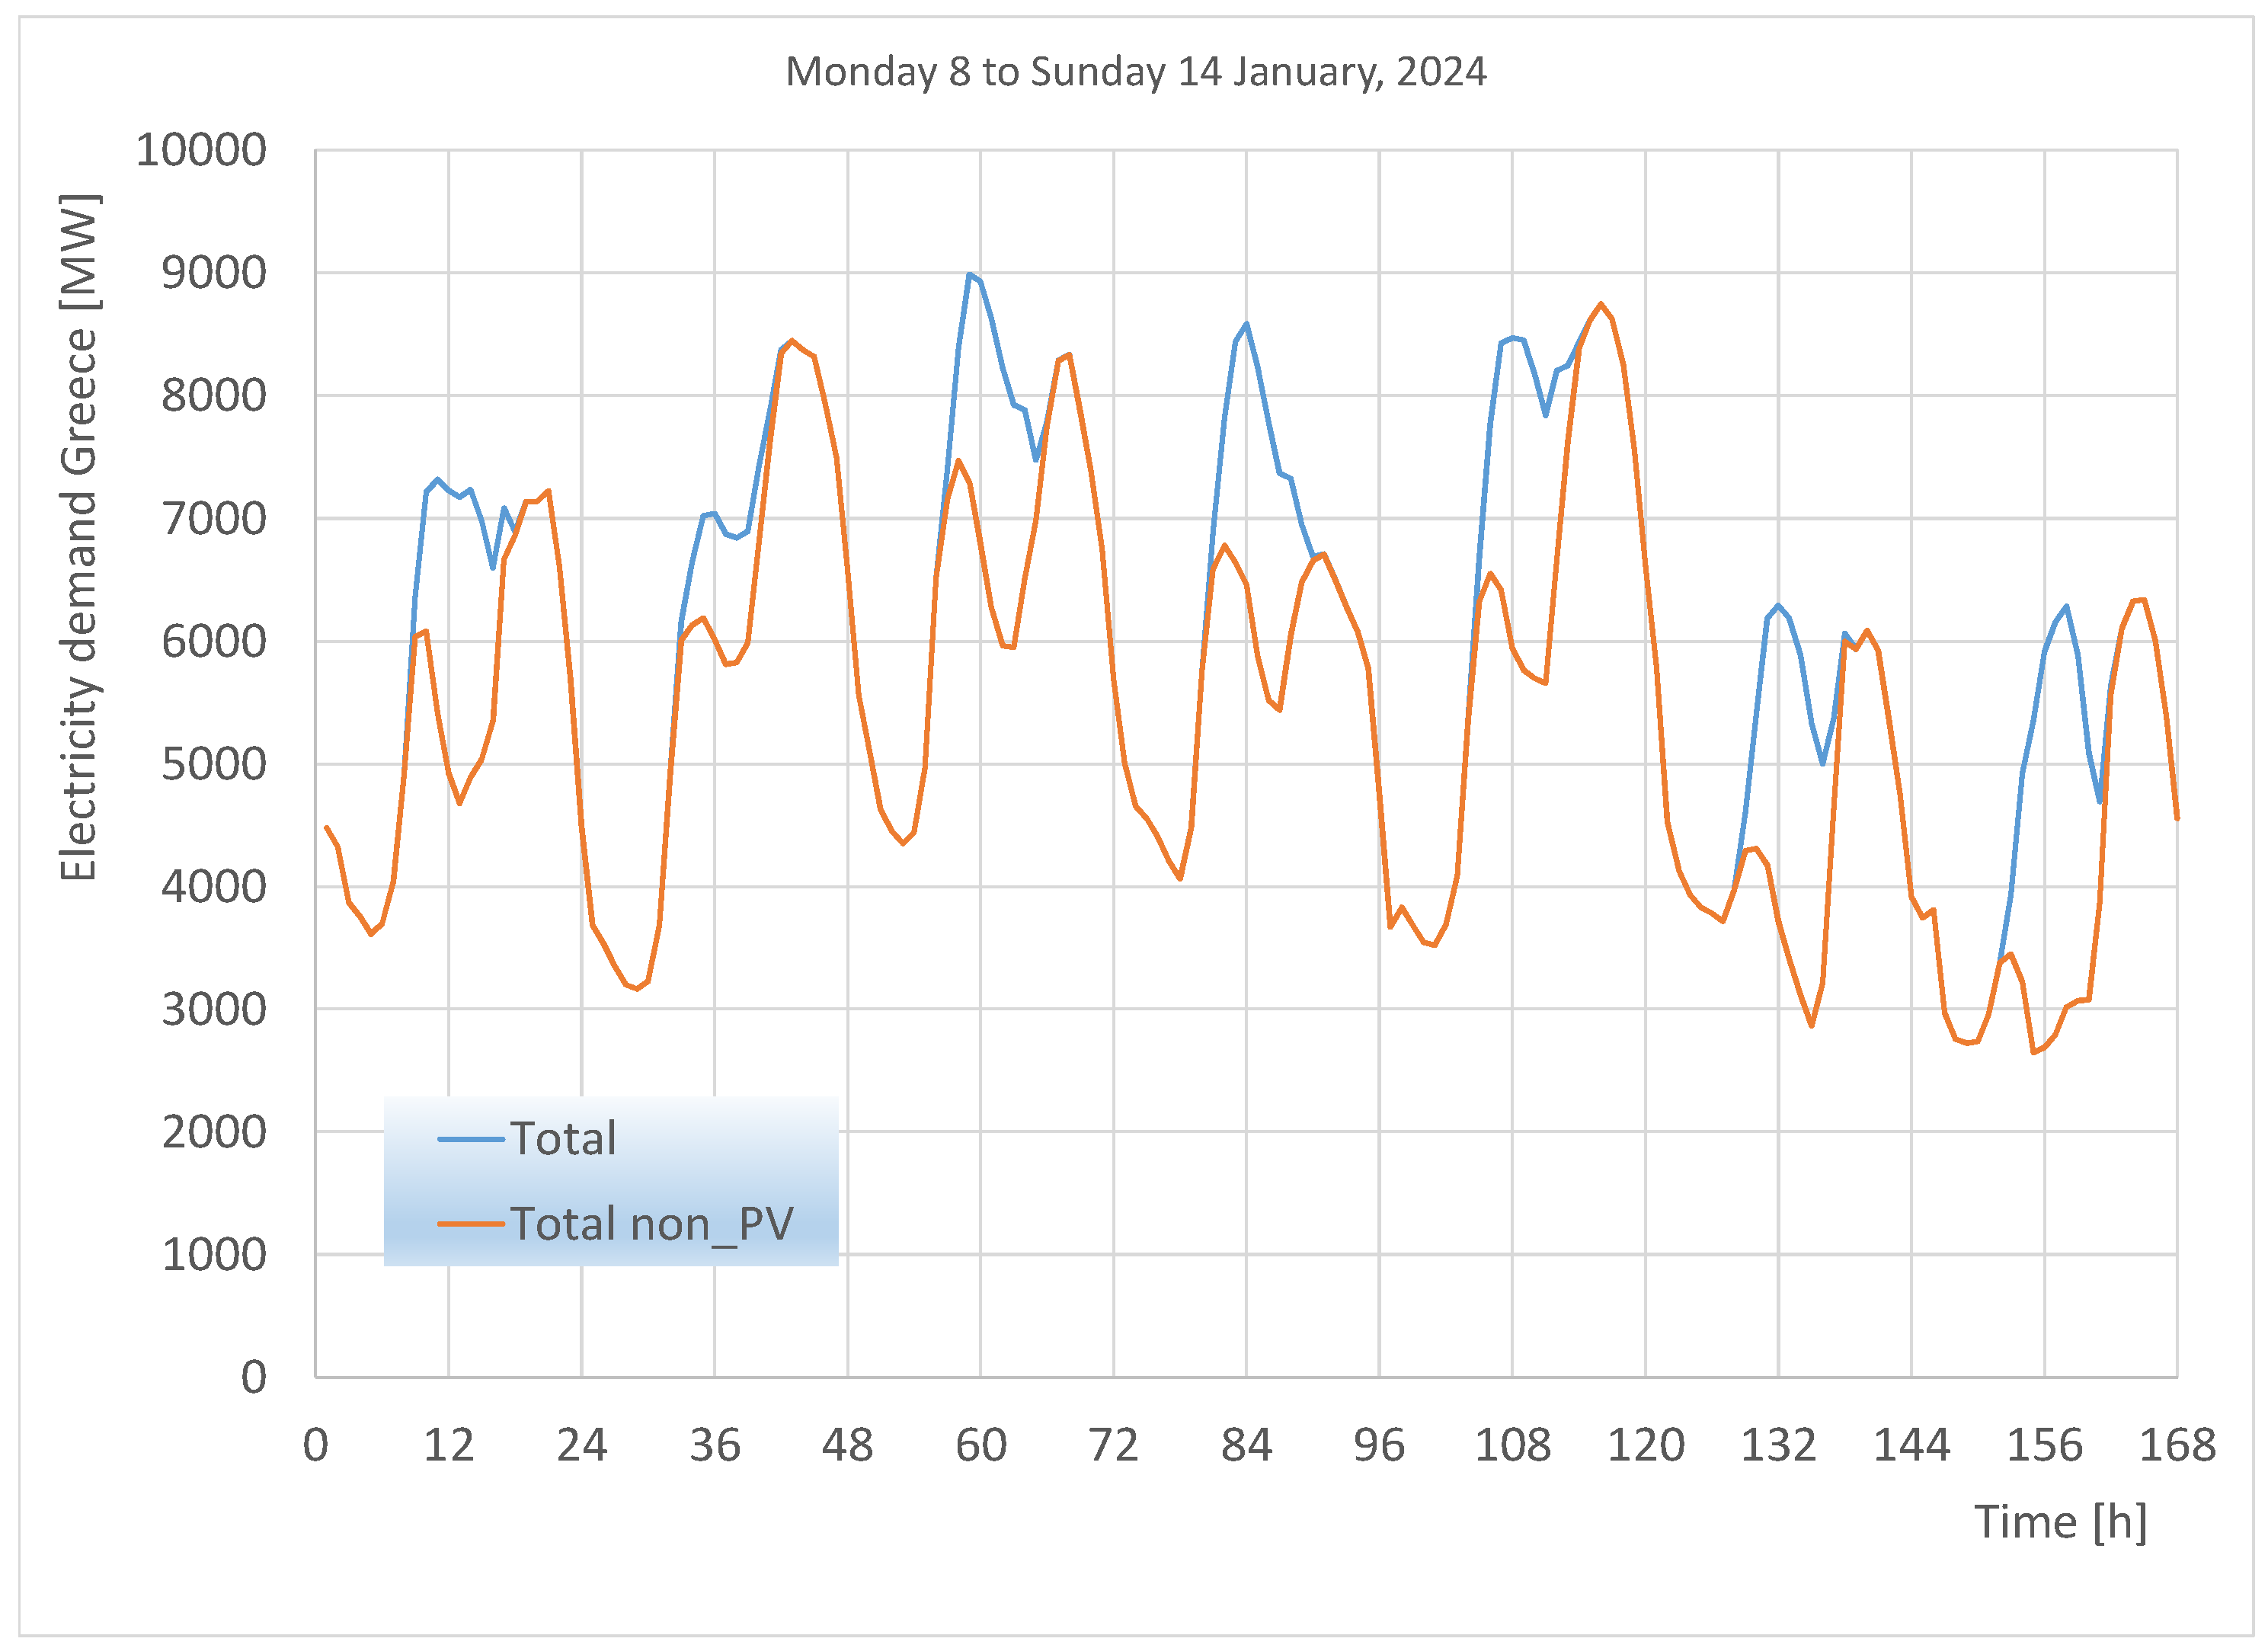
2.2. Photovoltaic Installation

A total of 525 rooftop panels are arranged facing the south–southwest (SSW) direction, which follows the building’s orientation (Figure 1). The main technical data of the PV panels are listed in the Appendix [45]. A standard model for the photovoltaic panels is employed [46]. TRNSYS Type 194 requires the current–voltage curves of the specific PV panels, which are computed based on the manufacturer’s data following the procedure detailed in [47].

2.3. Electric Vehicles and Batteries

Every working day, an average number of twenty electric cars are assumed to stay connected in the respective charging posts during working hours. The electricity consumption of electric cars lies in the range of 120–250 Wh per km. The specific values attained mainly depend on the car’s speed and the ambient temperature. Battery charging for employees’ electric cars is assumed to be implemented during their stay in the car charging places in the building’s basement. The average monthly distance covered by each EV during working days is 1100 km. The average in-house charging requirements for each car are calculated to be 190 Wh/km after the charging losses are considered. Obviously, the charging needs during weekends cannot be met in-house. Overall, charging twenty cars requires about 4200 kWh monthly. Each one of the level 2 three-phase chargers installed in the basement requires 11 h to charge a typical 82 kWh car battery. The TRNSYS Type 47c battery model is employed in the simulation. It is based on a correlation between the voltage, current and the battery state of charge (SOC). Hyman equations are employed, where the power is given as input [48]. Charging efficiency is assumed to be equal to 0.9, independent of charge.

2.4. H2-Fueled SI Engine of Generator Set

The performance of the hydrogen-fueled engine of the generator set is critical to the energy efficiency of the total system. Green hydrogen is produced from electric power feeding the electrolyzer, thus transforming electrical energy to primary energy (enthalpy of formation of hydrogen). Whenever the production of electricity by the genset engine operation becomes necessary, the transformation of the hydrogen fuel’s primary energy to electricity takes place with efficiency lower than 40%. Additionally, low-quality energy, in the form of heat rejected from the engine exhaust and cooling system, closes the energy balance. Both forms can be exploited to reduce heating loads and thus save electricity consumption from the heat pump. They are not considered in this specific study. Thus, electricity production through the operation of the genset comes with a significant efficiency penalty. Now, as regards state-of-the-art hydrogen-fueled SI engine technologies, possible operation strategies are (i) lean-only operation and (ii) stoichiometric and lean operation. As regards the fuel injection system, there also exist two variances: (i) direct injection and (ii) port fuel injection. Out of the above alternative choices, this study considers the more advanced ones of direct injection in the cylinder (DI) and lean-only operation, a combination that leads to the highest engine efficiency both in part and full loads. Advanced engines are also turbocharged, and ignition is modified with “cold” spark plug versions to address high temperatures inside the cylinder due to hydrogen combustion. Further modifications adopted in dedicated hydrogen engines include modified valves and valve seats, improved pistons and piston rings, enhanced crankcase ventilation and the use of improved engine lubrication oil.
The engine selected for this study is based on a concept engine developed by the University of Graz and Bosch [14], with main technical data shown in Table 1.
As already mentioned, this is a direct injection engine operating at a lean air-to-fuel ratio all over its map (Figure 3). Since the engine is connected to a 50 Hz synchronous generator, only the 3000 rpm operating points are used. For this engine speed of 3000 rpm, we see from Figure 3 that the equivalence ratio varies from 1.8 at full load to 3.2 at no load conditions. On the other hand, engine efficiency varies from the maximum of 39% at full load to 35% at 25% load. That is, we observe a certain loss of efficiency at low loads. Initial sizing of the genset was based on the building’s size and electricity consumption profile since the genset is always present for safety and backup purposes.
This is a significant field for novel technical solutions and cost reduction, which will be pushed by the huge market potential of hydrogen-fueled cars and heavy-duty vehicles.

2.5. Electrolyzer Unit

TRNSYS Type 160a is employed to model this unit. It is a high-pressure alkaline electrolyzer (Figure 1). The model combines a thermodynamic sub-model and a transient heat transfer sub-model. Empirical relationships are used to describe the electrochemical behavior. They are in the form of a current–voltage curve for a given pressure and a Faraday efficiency relation. The electrolyzer temperature is calculated from the model [49,50]. The number of electrolyzer units is an optimization variable in the system’s model. The units are turned on at the beginning of each weekend and kept on for 48 h, maintaining the minimum power of 4 kW with electricity imported from the grid whenever there is no PV electricity available.

2.6. Pressurized Hydrogen Storage Tank

The green hydrogen from the electrolyzer is pressurized and stored in a storage tank with a 100 m3 volume (Figure 1). The size of the tank was chosen after carrying out initial system simulations in order to be able to keep the system autonomous for approximately three months during winter. The maximum hydrogen pressure allowed in the tank is 250 bar. The hydrogen storage module (Type 164b) employs the Van der Waals equation to compute hydrogen mass stored in the tank as a function of its pressure and temperature. Hydrogen from the tank is used to fuel the engine of the generator set. At the start of the simulation, the hydrogen storage tank is assumed to be filled up to 95% of its maximum pressure.

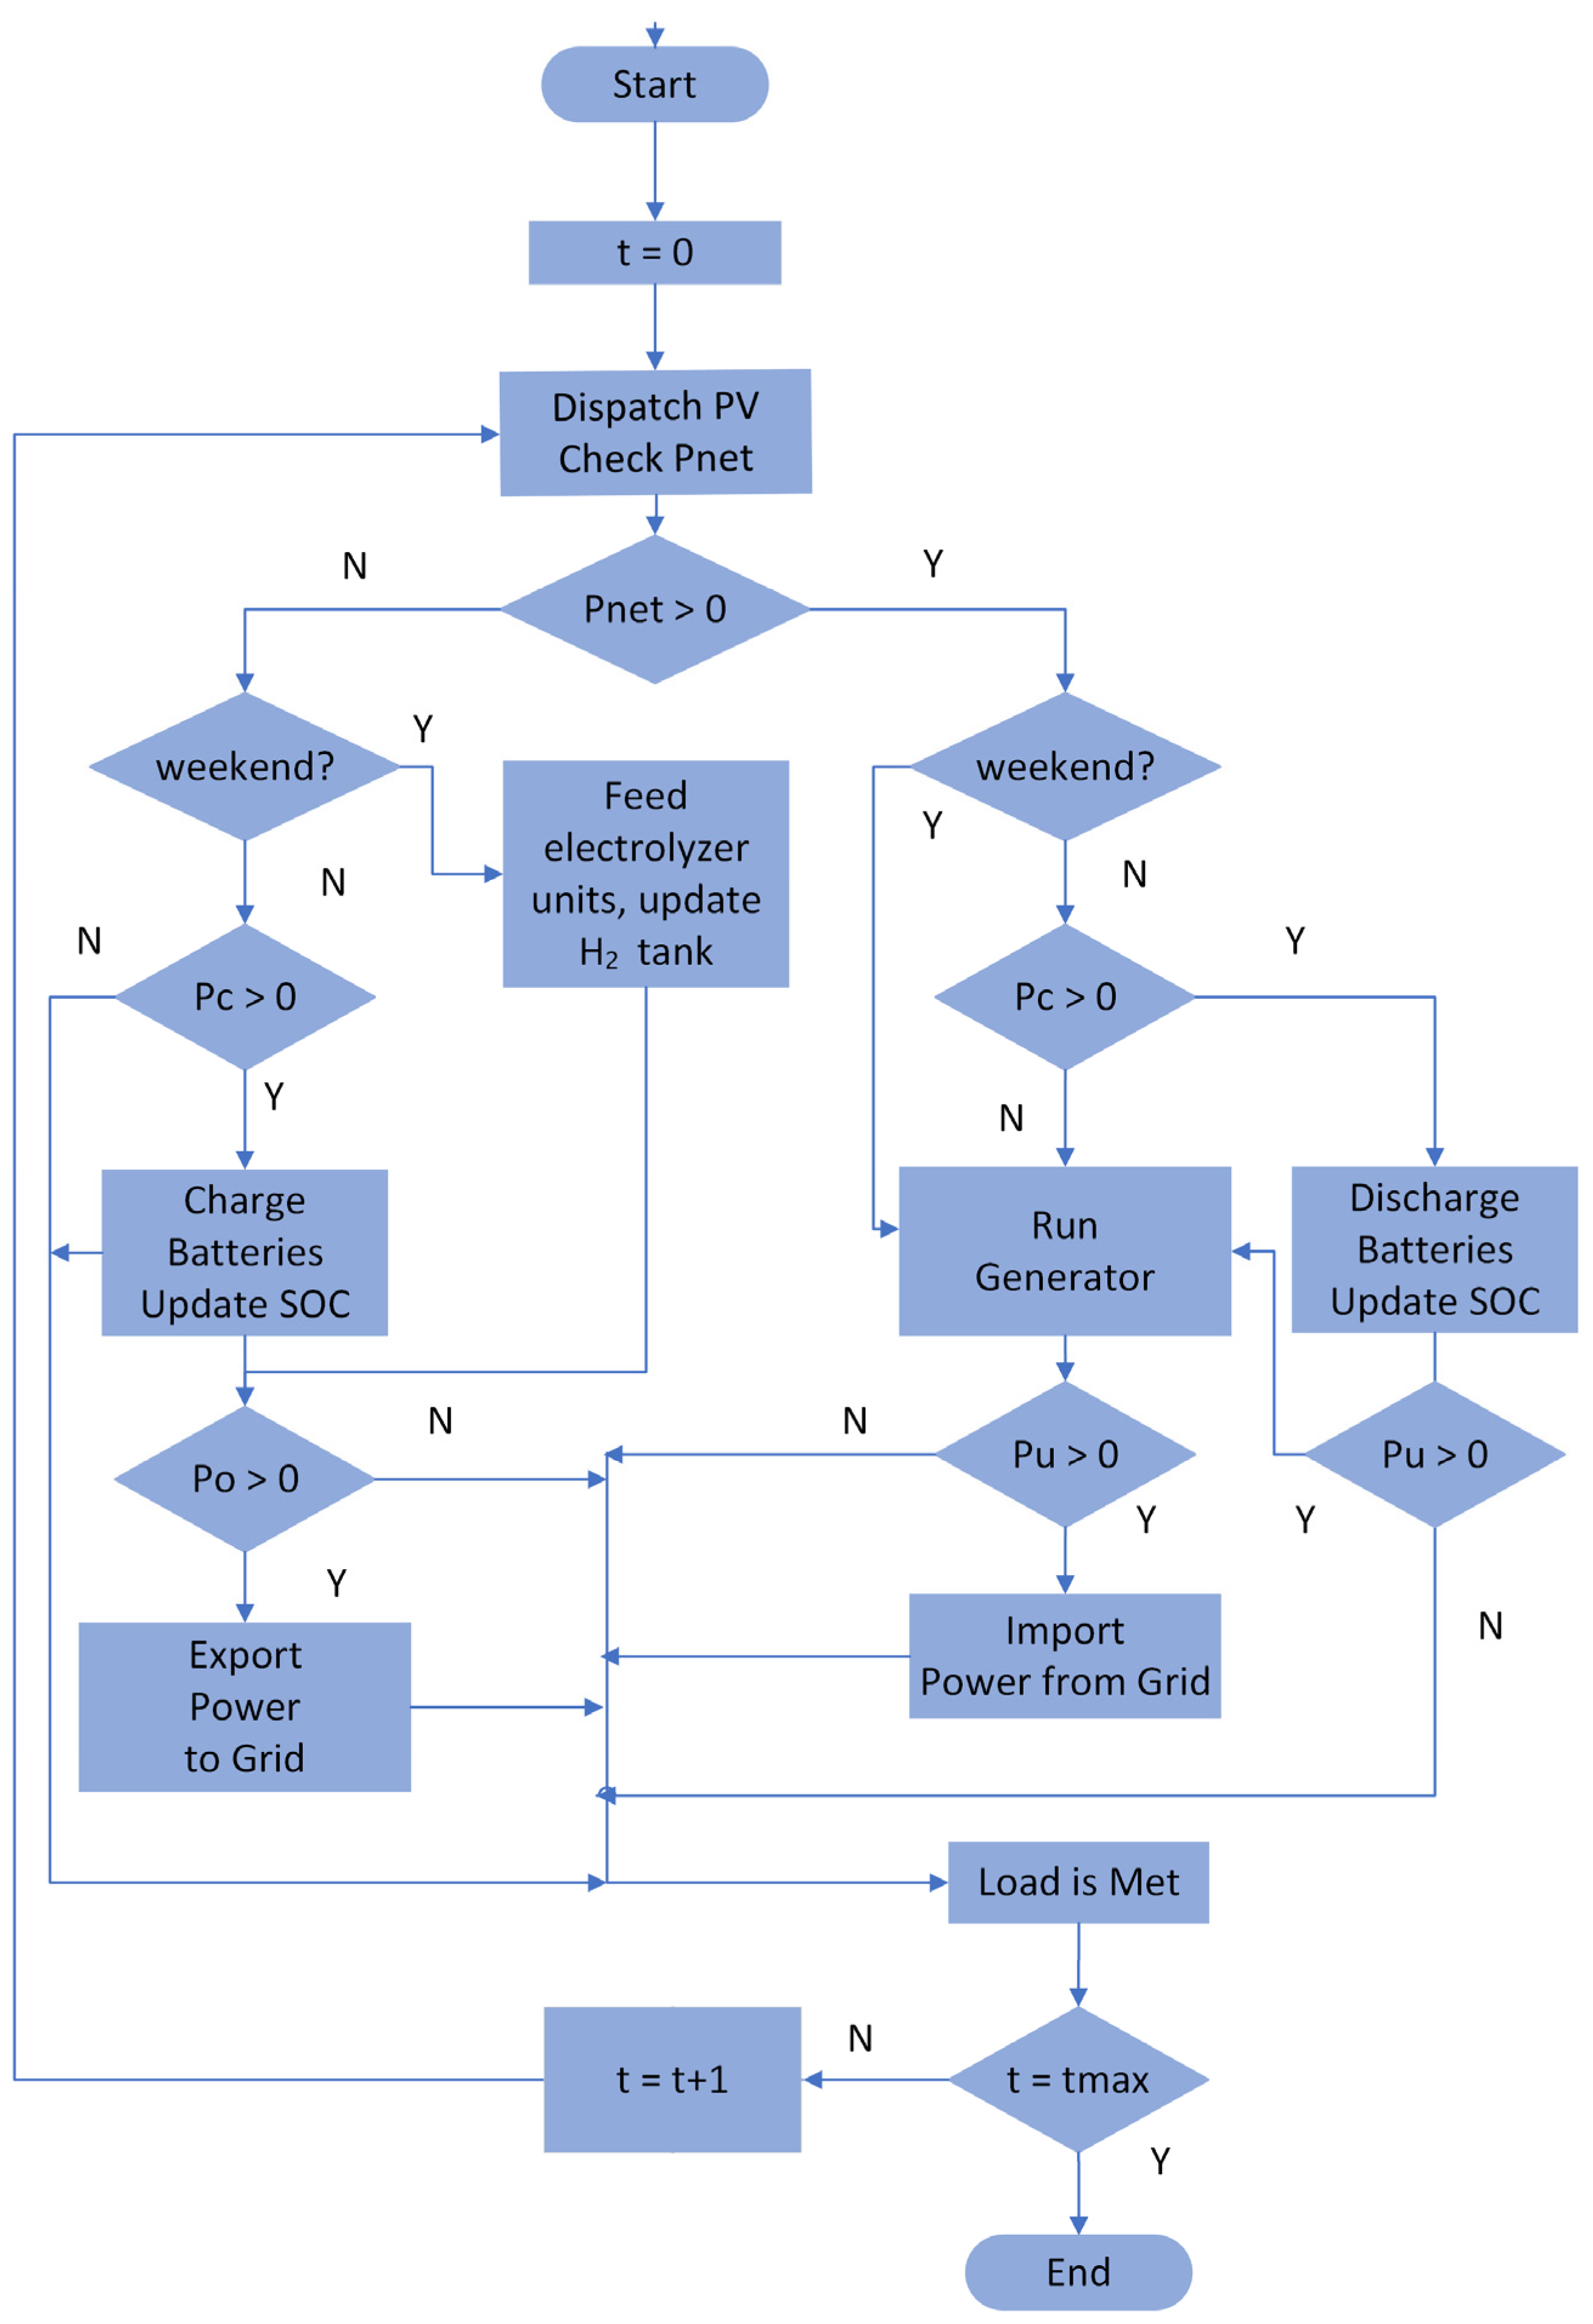
2.7. Dispatch Logic for Various Sources

The dispatch logic of the different power sources to the internal grid is presented in Figure 4. The battery’s fractional state of charge (FSC) is a critical parameter for this logic. The low limit of FSC is set to 0.36. The charge-to-discharge limit is set to 0.50. Whenever the FSC is lower than 0.50, the car batteries are charged with first priority. Second priority is given to the use of photovoltaic electricity for load coverage.
During the weekend, the car batteries are no longer connected to the internal grid. The surplus of PV production is diverted to feed the electrolyzer units, which produce hydrogen. Whenever the power diverted to these units exceeds their maximum capacity, the remaining electricity must be diverted to the external grid. P C denotes the power allocated to battery charging. P D is the power available for discharging by the batteries. S o c t denotes the instantaneous FSC. E b a t , t is the instantaneous battery capacity at time step, t. E b a t is the maximum aggregate battery capacity [51]. The discharge power depends on the C-rate of the battery. The C-rate is defined as the charge allowed to discharge from the battery in one hour divided by the maximum battery capacity. The above parameters are related through the following equations:
S o c t = E b a t , t E b a t × 100 %
P C = 1 S o c t E b a t 1 h
P D = S o c t S o c min E b a t 1 h
where S o c t and S o c min are percentages. E b a t is expressed in kWh. P C and P D are measured in kW. Four power sources are available: the photovoltaic panels, the batteries, the genset and the import from the grid. The power sources are dispatched sequentially, according to the flowchart, which differentiates between working days and weekends. Finally, the unmet load must be zero. The PV output is dispatched first. P net   (kW) is computed as the net required load after subtracting the PV contribution as follows:
P net = P req P p v *  
P p v * = η p v , i n v P p v , d c
In the above relations, P req   is the required load in kW. P p v * is the photovoltaic generated power in kW. η p v , i n v is the efficiency of the inverter. P p v , d c is the inverter input in kW. The net required loads’ sign determines the power flow. If it is zero, we have a perfect match of PV power to the load.
If excess power is available, it is routed to battery charging during working days or used to feed electrolyzer units during weekends. Surplus is exported to the grid. A positive sign of the net required load indicates a shortage of power. This must be compensated by battery discharging during working days, whenever SOC > 0.36. Additional needs are met by the operation of the genset. Finally, imports from the grid could become necessary to cover additional loads. The battery’s set point P b a t * , expressed in k W , during working days is given as follows:
P b a t * = 0 if   P n e t = 0 m i n P D , P net η binv if   P net > 0 m i n P C , η b r e c P net if   P net < 0
where η binv is the efficiency of the inverter and η brec is the rectifier’s efficiency, respectively. On the other hand, the dispatch power of the genset, P g e n * ( k W ), is calculated as follows after comparison with its rated power P G ,   max   :
P g e n * = m i n P G , max , P net   + P C η brec   ( during the working days )
This applies during working days.
During weekends, the generator does not operate, except for emergency situations as follows:
P g e n * = 0   ( during the weekend )
The unmet load P u is computed at each step of battery or genset dispatch as follows:
P u = P n e t P b a t * batteries   dispatched   first   P n e t P g e n * GenSet   dispatched   first P n e t P b a t * + P g e n * both   sources   dispatch ed
At the end of the time step, the remaining unmet load must be covered by imported electricity as follows:
P g r i d * = m i n P g r i d , m a x , P u
As already reported, twenty cars are assumed to be connected from 9:00 to 17:00 each working day; 80 kW is set as the maximum total charging power allowed. No car batteries are connected on weekends. During working hours, the car batteries may discharge, when necessary (up to a 30 kW maximum total discharge power) to cover building loads. An S o c min optimization study has already been carried out using GenOpt for a similar system, giving the value of S o c min = 0.36 , which is adopted here [40].

2.8. Components’ Size Optimization

Obviously, the energy system considered here has a certain degree of complexity. The decision about the sizing of several critical components affects the overall system’s performance. The starting point for this procedure was the fixing of the rooftop photovoltaic system’s size, which was determined by the available rooftop space, as already explained. Next, the number of available electric cars for connecting was determined based on the current statistics of EVs in the Greek car fleet. The size of the pressurized hydrogen storage tank was determined based on its capability to support the system’s autonomy for three months in winter.
Finally, there remain three additional energy system parameters, which are selected to be determined by an optimization process. They are listed in Table 2, along with the selected ranges, and they are briefly explained as follows:
  • The first parameter is the tilt angle of the rooftop photovoltaic panels. It is allowed to vary between 20 and 50 degrees for the system’s optimization. Usual values applied in PV installations in Greece are between 30 and 40 degrees. Higher tilt angles tend to increase electricity production during winter months.
  • The second parameter is the maximum aggregate capacity of the electrolyzer units. It is allowed to vary between 2 and 5 stacks of 24 kW. The range was decided based on the available power levels for export during weekends.
  • The third parameter is the rated power of hydrogen-fueled generator engine. This is allowed to vary between a minimum value of kW, required to cover basic backup electricity needs of the office building, and a maximum value of 80 kW that would cover the maximum computed levels of power imported from the grid. A rated power that is closer to the lowest value would be more energy efficient due to the higher engine efficiency values associated with the engine operating close to full load.
The optimization procedure for the system’s three size parameters values was carried out by means of the GenOpt 2.1.0 optimization software. The Hooke–Jeeves method was selected, with the following hyperparameter values: A value of 2 for the mesh size divider, a zero initial mesh size exponent, a mesh size exponent increment equal to one and four step reductions were allowed.
Since our aim is to minimize the system’s interaction with the external grid and external hydrogen supply network, the objective function was formulated according to the following expression:
Minimize   E e l , e x p 2 + E e l , i m p 2 + V H 2 , cons · H H V H 2 · η t 2
Subject   to   20 ° θ t i l t 50 °   20   kW P g e n s e t 80   kW 48   kW P m a x , e l 120   kW
where
  • Eel, exp is the total electricity exported annually to the grid (kWh);
  • Eel, imp is the total electricity imported from the grid (kWh);
  • VH2, cons is the net hydrogen annually consumed (Nm3);
  • HHVH2 is the higher heating value of hydrogen (3.54 kWh/Nm3);
  • η t is the total efficiency of the engine generator set (-).
As may be observed from the above expression, it is assumed that a maximum of 40% of the hydrogen’s higher heating value is recoverable by using engine genset technology for the production of electricity (see Section 2.4). The specific form of the objective function with the squaring of the three main component values was decided in order to bias towards a balanced sizing for all three components.

3. Results

The starting point in this section is the determination of initial values for the main system’s sizing parameters. The building energy system’s simulation is carried out with these initial parameter values. The characteristic results are shown as transient performance graphs and overall energy balances on a monthly basis. The results are discussed to better understand the system’s performance and component sizing effects. The optimal values of these parameters are determined based on a standard optimization procedure.

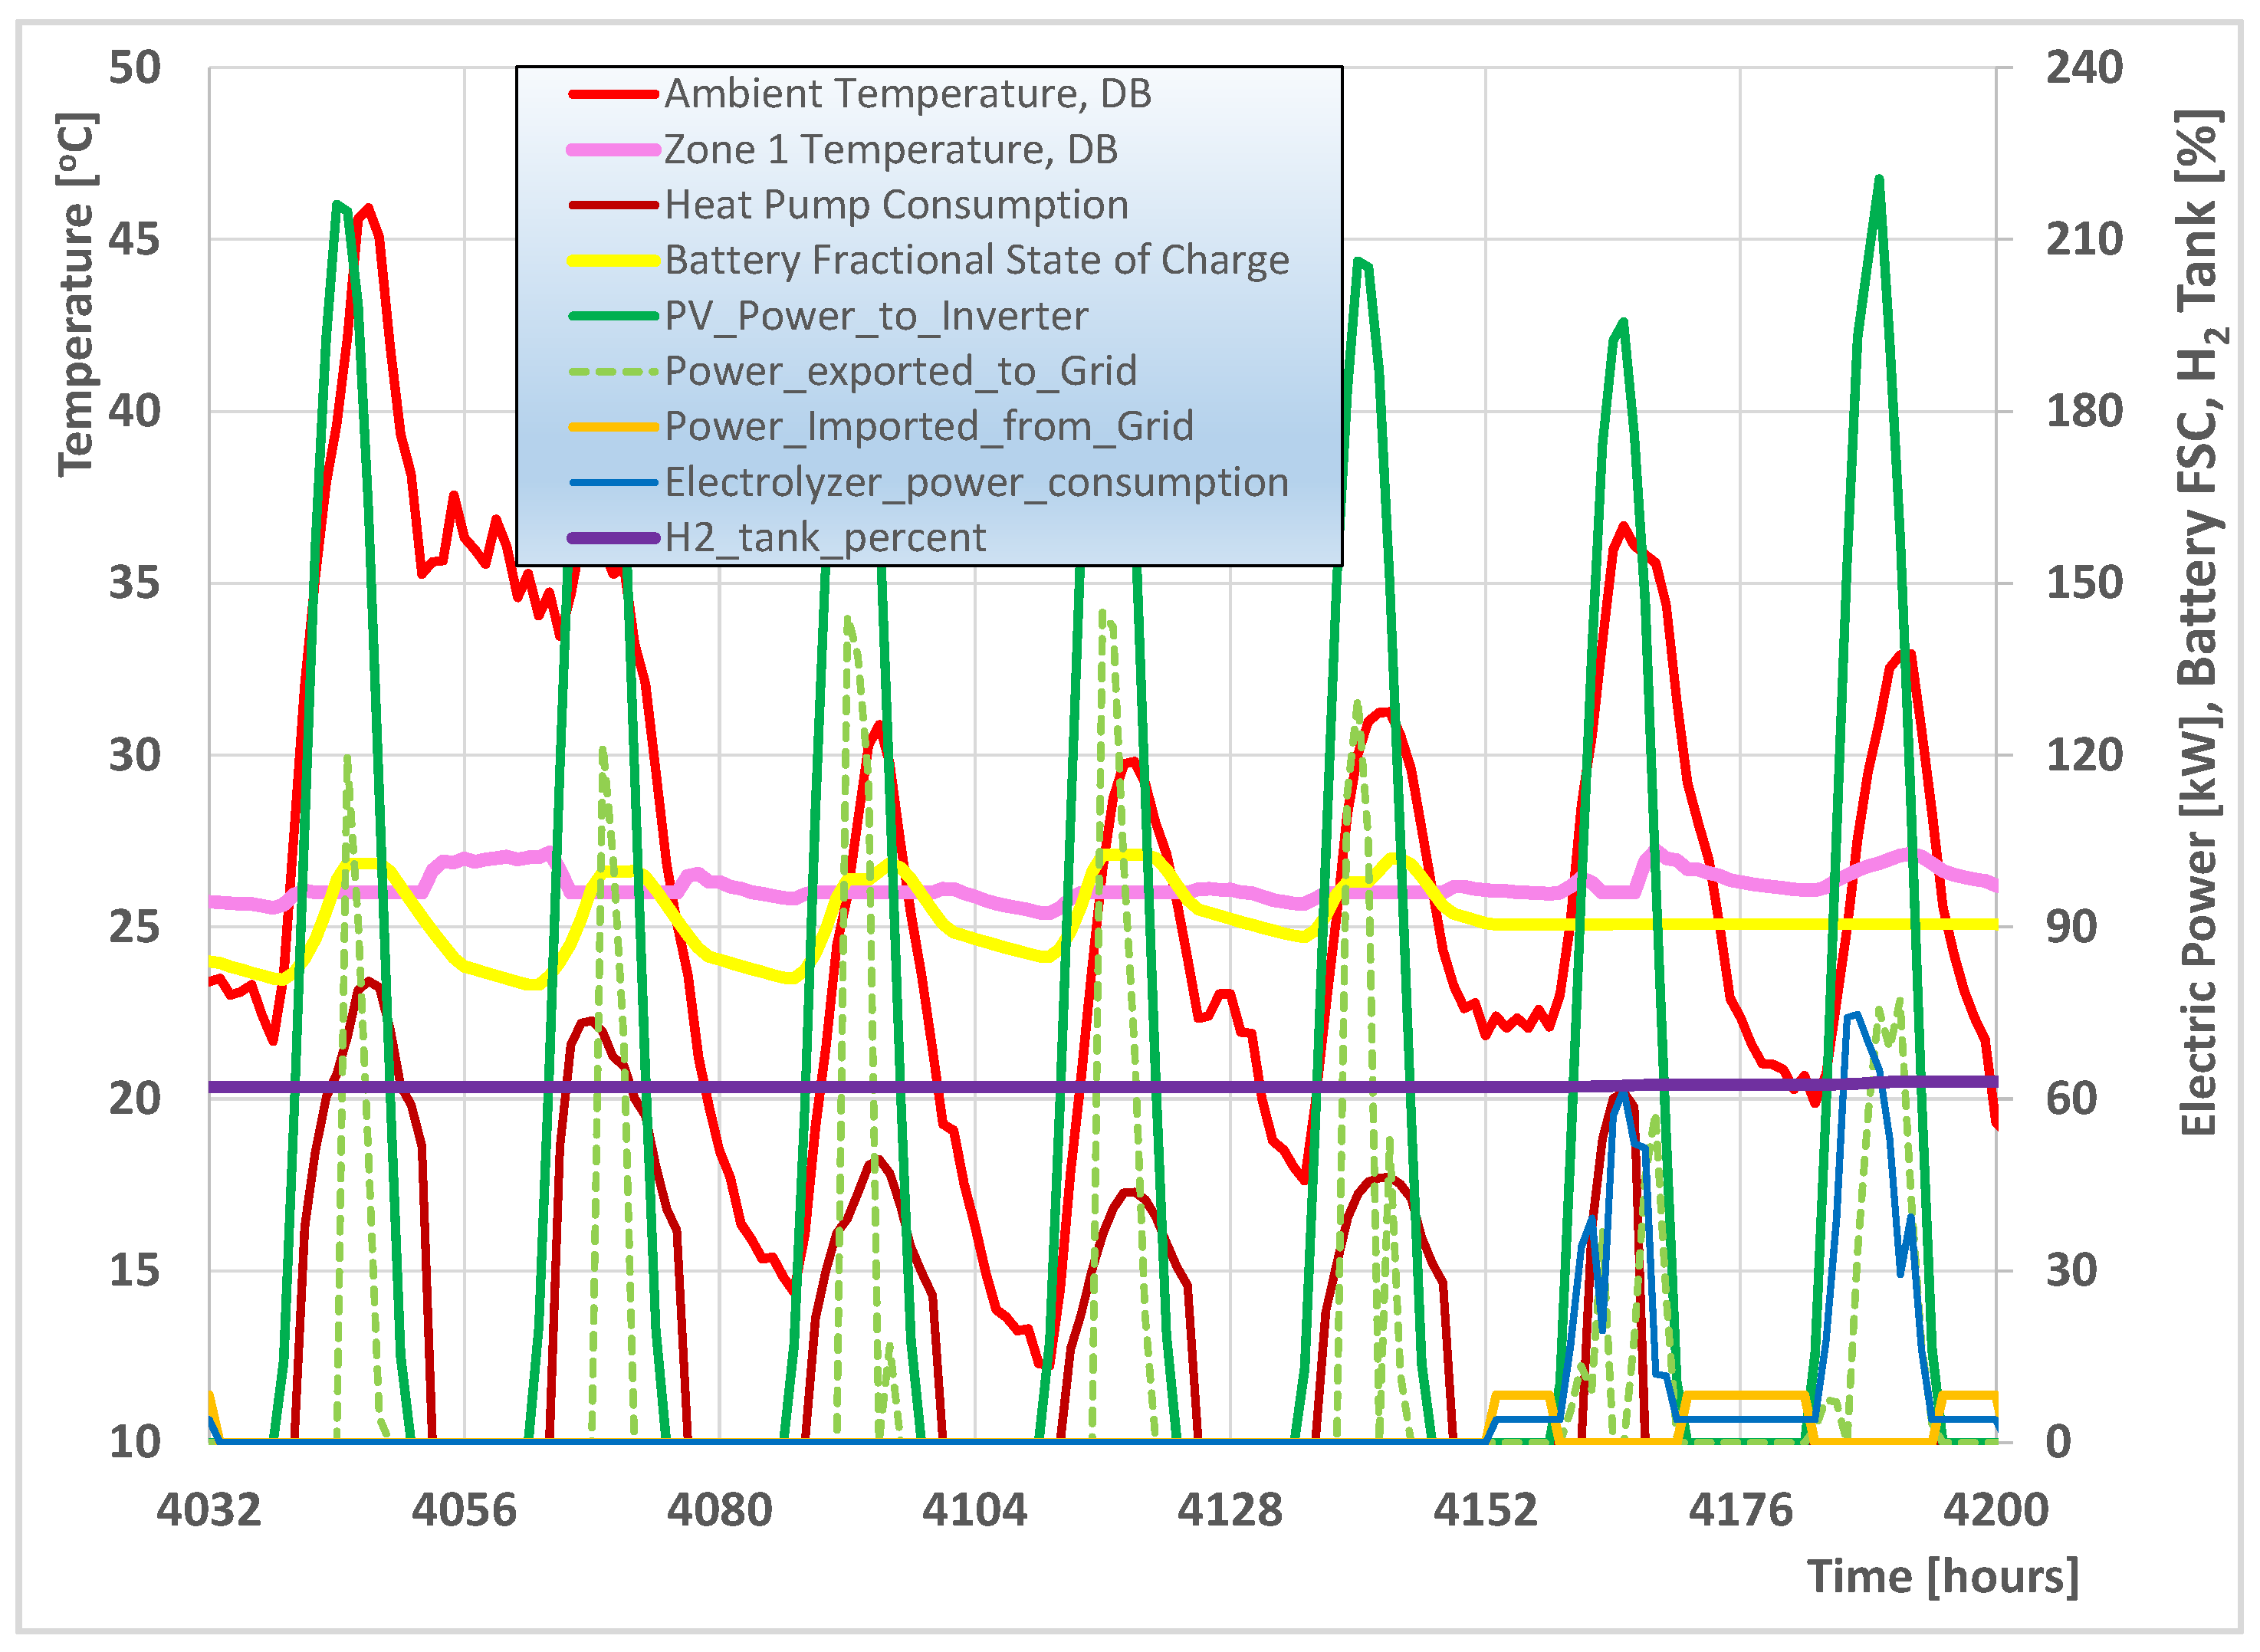
3.1. System’s Performance with Initial Sizing Parameters’ Values

The transient performance graphs are produced with a 1 h time step. The battery’s FSC, the power produced from genset and electricity imported or exported to the grid, are presented in the graphs. Additionally, the power consumed by the electrolyzer units during weekend operation are shown, along with the filling level of the pressurized hydrogen vessel. As already reported, this control strategy changes during weekends, when the electricity surplus is first routed to the electrolyzer units. Whenever the maximum aggregate capacity of these units is reached, the remaining electricity is exported to the grid.
The hydrogen-fueled generator is initially rated at 50 kW at 3000 rpm. Five electrolyzer stacks with a peak electricity consumption of 120 kW are initially assumed. The 100 m3 hydrogen tank is assumed to be filled with hydrogen at a pressure of 237.5 bar during the start of the simulation (95% of its maximum pressure). The tank’s pressure is monitored throughout the year, and the generator is allowed to operate with a minimum tank hydrogen pressure of 10 bar. The filling of the hydrogen tank occurs during the weekends, when the operation of the electrolyzer units is scheduled. The variation in the above-mentioned systems parameters for a week in the beginning of January is shown in Figure 5. A significant dispatch of the generator’ power is observed during Wednesday, Thursday and Friday. This is necessary because of the batteries’ low FSC and insufficient PV input. The operation of the genset occurs at the expense of hydrogen fuel from the tank, whose long-term storage curve (percentage of maximum pressure) is seen to slope downwards during this period. Car batteries are seen to discharge whenever necessary and permitted. Also, whenever the required electricity is very low during the night, it is imported from the grid, and the genset is not dispatched at such a low power setting. During the two weekend days, no battery capacity is available. Whenever necessary, the already reduced building and electrolyzer units’ minimum loads are covered by being electricity imported from the grid.
It is interesting to compare this simulated winter weekly behavior of the building’s energy system, regarding its interaction with the external grid, with the Greek system’s load during a similar weekly period (Figure 6).
The hourly variation in the Greek system’s load is presented here for the specific week, along with the respective variation of the load covered by the remaining power sources if we subtract photovoltaic production. The small quantities of electricity required to be imported from the grid during the weekend in Figure 5 are seen to occur during hours of low demand for the Greek electricity system.
Next, the building’s system’s behavior in the beginning of July is shown in Figure 7.
The PV output is high due to clear skies and long days. The batteries’ SOC reach 100% at afternoon hours. Significant power is exported to the electric network. The amount of exported power is much smaller during the weekend, where the electrolyzer units consume most of the electricity surplus. Overall, the average hydrogen tank pressure drops to 60% after the first six months of the year. Next, a comparison of the above energy system’s behavior with the Greek system’s load variation would be useful. A week in July 2023 with a heat wave episode is selected for this purpose (Figure 8). The Greek system’s load curve peaks in the morning are quite impressive, especially during working days, reaching a maximum of 10.5 GW. On the other hand, there is significant PV production during the morning and afternoon hours, which relieve the conventional power sources from a big workload, to overcome the steep morning ramp. The building’s energy system is predicted, as shown in Figure 7, to export electricity to the grid, especially during the late morning hours in working days, where they are welcome to cover the steep load curve. However, the power exported to the grid is reduced on the weekend and shifted toward the afternoon hours, which is in line with the reduced needs of the Greek system, as seen in Figure 8.
The above short inspection of the system’s transient behavior for two weeks representing cold and hot seasons of the year will be helpful for the discussion in the next section. As a next step, it is important to assess the building’s performance on a monthly basis. The initial component sizing refers to a 50 kW genset rating and the 120 kW electrolyzer units. The initial PV panels’ tilt angle is 30 degrees. The photovoltaic energy produced monthly is presented in Figure 9. The maximum production is in June (43,600 kWh) and July (44,600 kWh). The lowest production is observed in December at 12,700 kWh.
The HVAC system’s consumption is highly variable according to the climatic conditions prevailing each month. It is minimized during the spring and autumn, respectively. The monthly summary of Figure 9 does not include the production and consumption of green hydrogen, which is presented separately in Figure 10. As a general remark, the production and consumption volumes are comparable for all months except January. During January, a significant quantity of hydrogen is consumed in the genset, almost eliminating the imports from the grid. This increased consumption is also necessitated by the somewhat increased consumption of the heat pump, but mainly by the charging of the electric car batteries, which are considered to start uncharged in the beginning of the year. As a result, the pressure in the hydrogen tank reduces to 62% of its maximum at the end of January, down from the initial value of 95%. During the remaining months, we observe fluctuations in the tank capacity of a much lower amplitude, and the tank drops to one-third of its capacity at the end of December. That is, the system is a net importer of hydrogen from the external supply facility.
The building’s lighting and electrical appliances consume an average of 4000 kWh monthly. Overall, the building consumes 117,000 kWh. The normalized primary energy consumption amounts to 59.5 kWh/m2y. An additional primary energy consumption of 12,400 kWh of primary energy must be added due to the net hydrogen consumption of 3490 Nm3 reported above. Thus, we have a total of 61.7 kWh/m2y. This is well below the nZEB threshold of 80–90 kWh/m2y set in [4]. The total annual photovoltaic production is 329,000 kWh. A further 19,400 kWh is contributed by the genset. A total of 11,800 kWh is imported, and 62,200 kWh is exported to the electricity network. Thus, electricity self-production significantly exceeds consumption. The nZEB designation is well deserved. The above figures will be further improved by the performance of the optimized system, as presented in the next sections.

3.2. Component Sizing Parameters’ Optimization Results

The optimization process for the size of the main system’s components shown in Table 2 with the objective function presented above in the TRNSYS-Genopt environment resulted in the following optimal parameter values:
  • Tilt angle of rooftop photovoltaic panels: 39 degrees;
  • Maximum capacity of electrolyzer units: three stacks, 72 kW total peak power;
  • Rated power of hydrogen-fueled generator engine: 40 kW.
As a final step, a new building energy system simulation is carried out using TRNSYS, setting the optimal values of the above three parameters. The annual energy balances of the optimized system are presented on a monthly basis in Figure 11.
Most electricity is seen to be exported during April, May and June. The generator needs to be operated in January and December. The export to the grid is maximized in April and May. Again, additional monthly data concerning the electrolyzer units’ hydrogen production and the consumption from the engine generator set are presented in Figure 12. A comparison with the initial results of Figure 10 indicates that the optimized system has a reduced hydrogen consumption during January. Additionally, the optimized system demonstrates lower hydrogen consumption levels during the rest of the year. Finally, the annual net hydrogen energy consumption is significantly reduced. The overall performance comparison of the initial and optimally sized energy system is summarized in Table 3.
The optimized building consumes a total of 116,000 kWh annually (Table 3). An additional primary energy consumption amount of 9160 kWh of primary energy must be added due to the net hydrogen consumption of 2580 Nm3 reported above. Thus, we have a total of 60.6 kWh/m2y, which is well below the legislated threshold [4]. Photovoltaic electricity totals 322,000 kWh. The contribution of the hydrogen-fueled generator is now 17,900 kWh. The total building interaction with the grid is reduced now. The amount of annual imports is 12,400 kWh, and the amount of annual exports has been reduced to 53,300 kWh.
Next, the hourly performance of the energy system during weekdays and weekend days in the course of the year is presented. First, the variation in the batteries’ state of charge is presented in Figure 13. As observed to the left of the map, the batteries start with a near zero charge, according to the assumption employed in the simulation. They are observed to be quickly charged to high SOC levels from the PV electricity during the hours of sunshine. Also, they are seen to discharge to meet building loads in cloudy days. Starting from the middle of March, the batteries become fully charged on days with clear skies. They may also discharge to the micro-grid while they are connected. They also discharge when the cars are used outside the building. In this case, they follow the model assumptions with respect to EV electricity consumption. The state of the charge levels increases in spring due to the reduced HVAC electricity needs and the increase in PV production. During late spring and all summer, they reach 100% capacity during the day. In autumn, the battery charging levels fluctuate following photovoltaic output variations. The charging levels drop again in the winter. The above concerns the short-term storage carried out daily by the car batteries. In addition, the system comprises a long-term storage capacity by means of the green hydrogen storage tank. The evolution of the storage tank’s capacity, expressed in normalized cubic meters (Nm3) divided by the maximum quantity determined at the maximum tank pressure, is presented in Figure 14. As expected, the hourly variation in the tank’s capacity is negligible when compared to the weekly and seasonal variation. The hydrogen tank is assumed to start at nearly a 100% capacity on the first of January.
A significant drop to a level of 80% is observed until the end of January, as reported in Figure 12. The tank capacity further deteriorates during the winter months. With the advent of the spring season, the tank’s capacity levels increase. This is due to the negligible heat pump consumption and increased photovoltaic output. Hydrogen production is shown to fill the storage tank during the weekends, where the electrolyzer units operate. During late spring and all summer, they reach a capacity of over 80% due to the maximized photovoltaic output. During late autumn and the start of winter, their levels further deteriorate, finally dropping to 40%.
A view of the operation of the 40 kVA genset is presented in Figure 15 on an hourly basis during a full year. A high load operation is observed during working days in January. This is due to the low battery charging levels at the simulation’s start. The increased generator’s output is used to cover heat pump consumption on cloudy days. Starting from March and moving to spring and summer, the required operation of the genset is negligible. The genset starts operating again in October due to the significant reduction in the batteries’ state of charge, as seen in Figure 13.
An additional issue of interest is the timing of electricity imports from the grid based on the hour of day and the season of the year. According to the results presented Figure 16, small quantities of electricity need to be imported from the grid, mainly during weekends, to keep the minimum power demand of the electrolyzer units whenever the PV production is insufficient as well as in other (rare) circumstances where the infusion of external energy is required. Overall, the power imported from the grid is at low levels, seldom exceeding 10 kW.
Finally, the timing of electricity exports to the grid in hourly, weekly and seasonal bases is presented in Figure 17. During the first two months of the year, only small quantities are exported to the grid during days with sunshine and mild temperatures. Most of the PV electricity is used to charge car batteries. Starting from March and during April, the electricity quantities exported become higher during weekdays, especially during weekdays with nice weather and sunshine. As we move to the summer months, the electricity exported to the grid stays at lower levels due to the increased HVAC system’s needs. During weekend days, the electricity export to the grid is significantly reduced. This is a favorable consequence of the operation of the electrolyzer units since the Greek electricity demand curve does not need these quantities due to the reduced weekend power requirements. This will be discussed next in the context of analyzing typical electricity demand data from the Greek system.

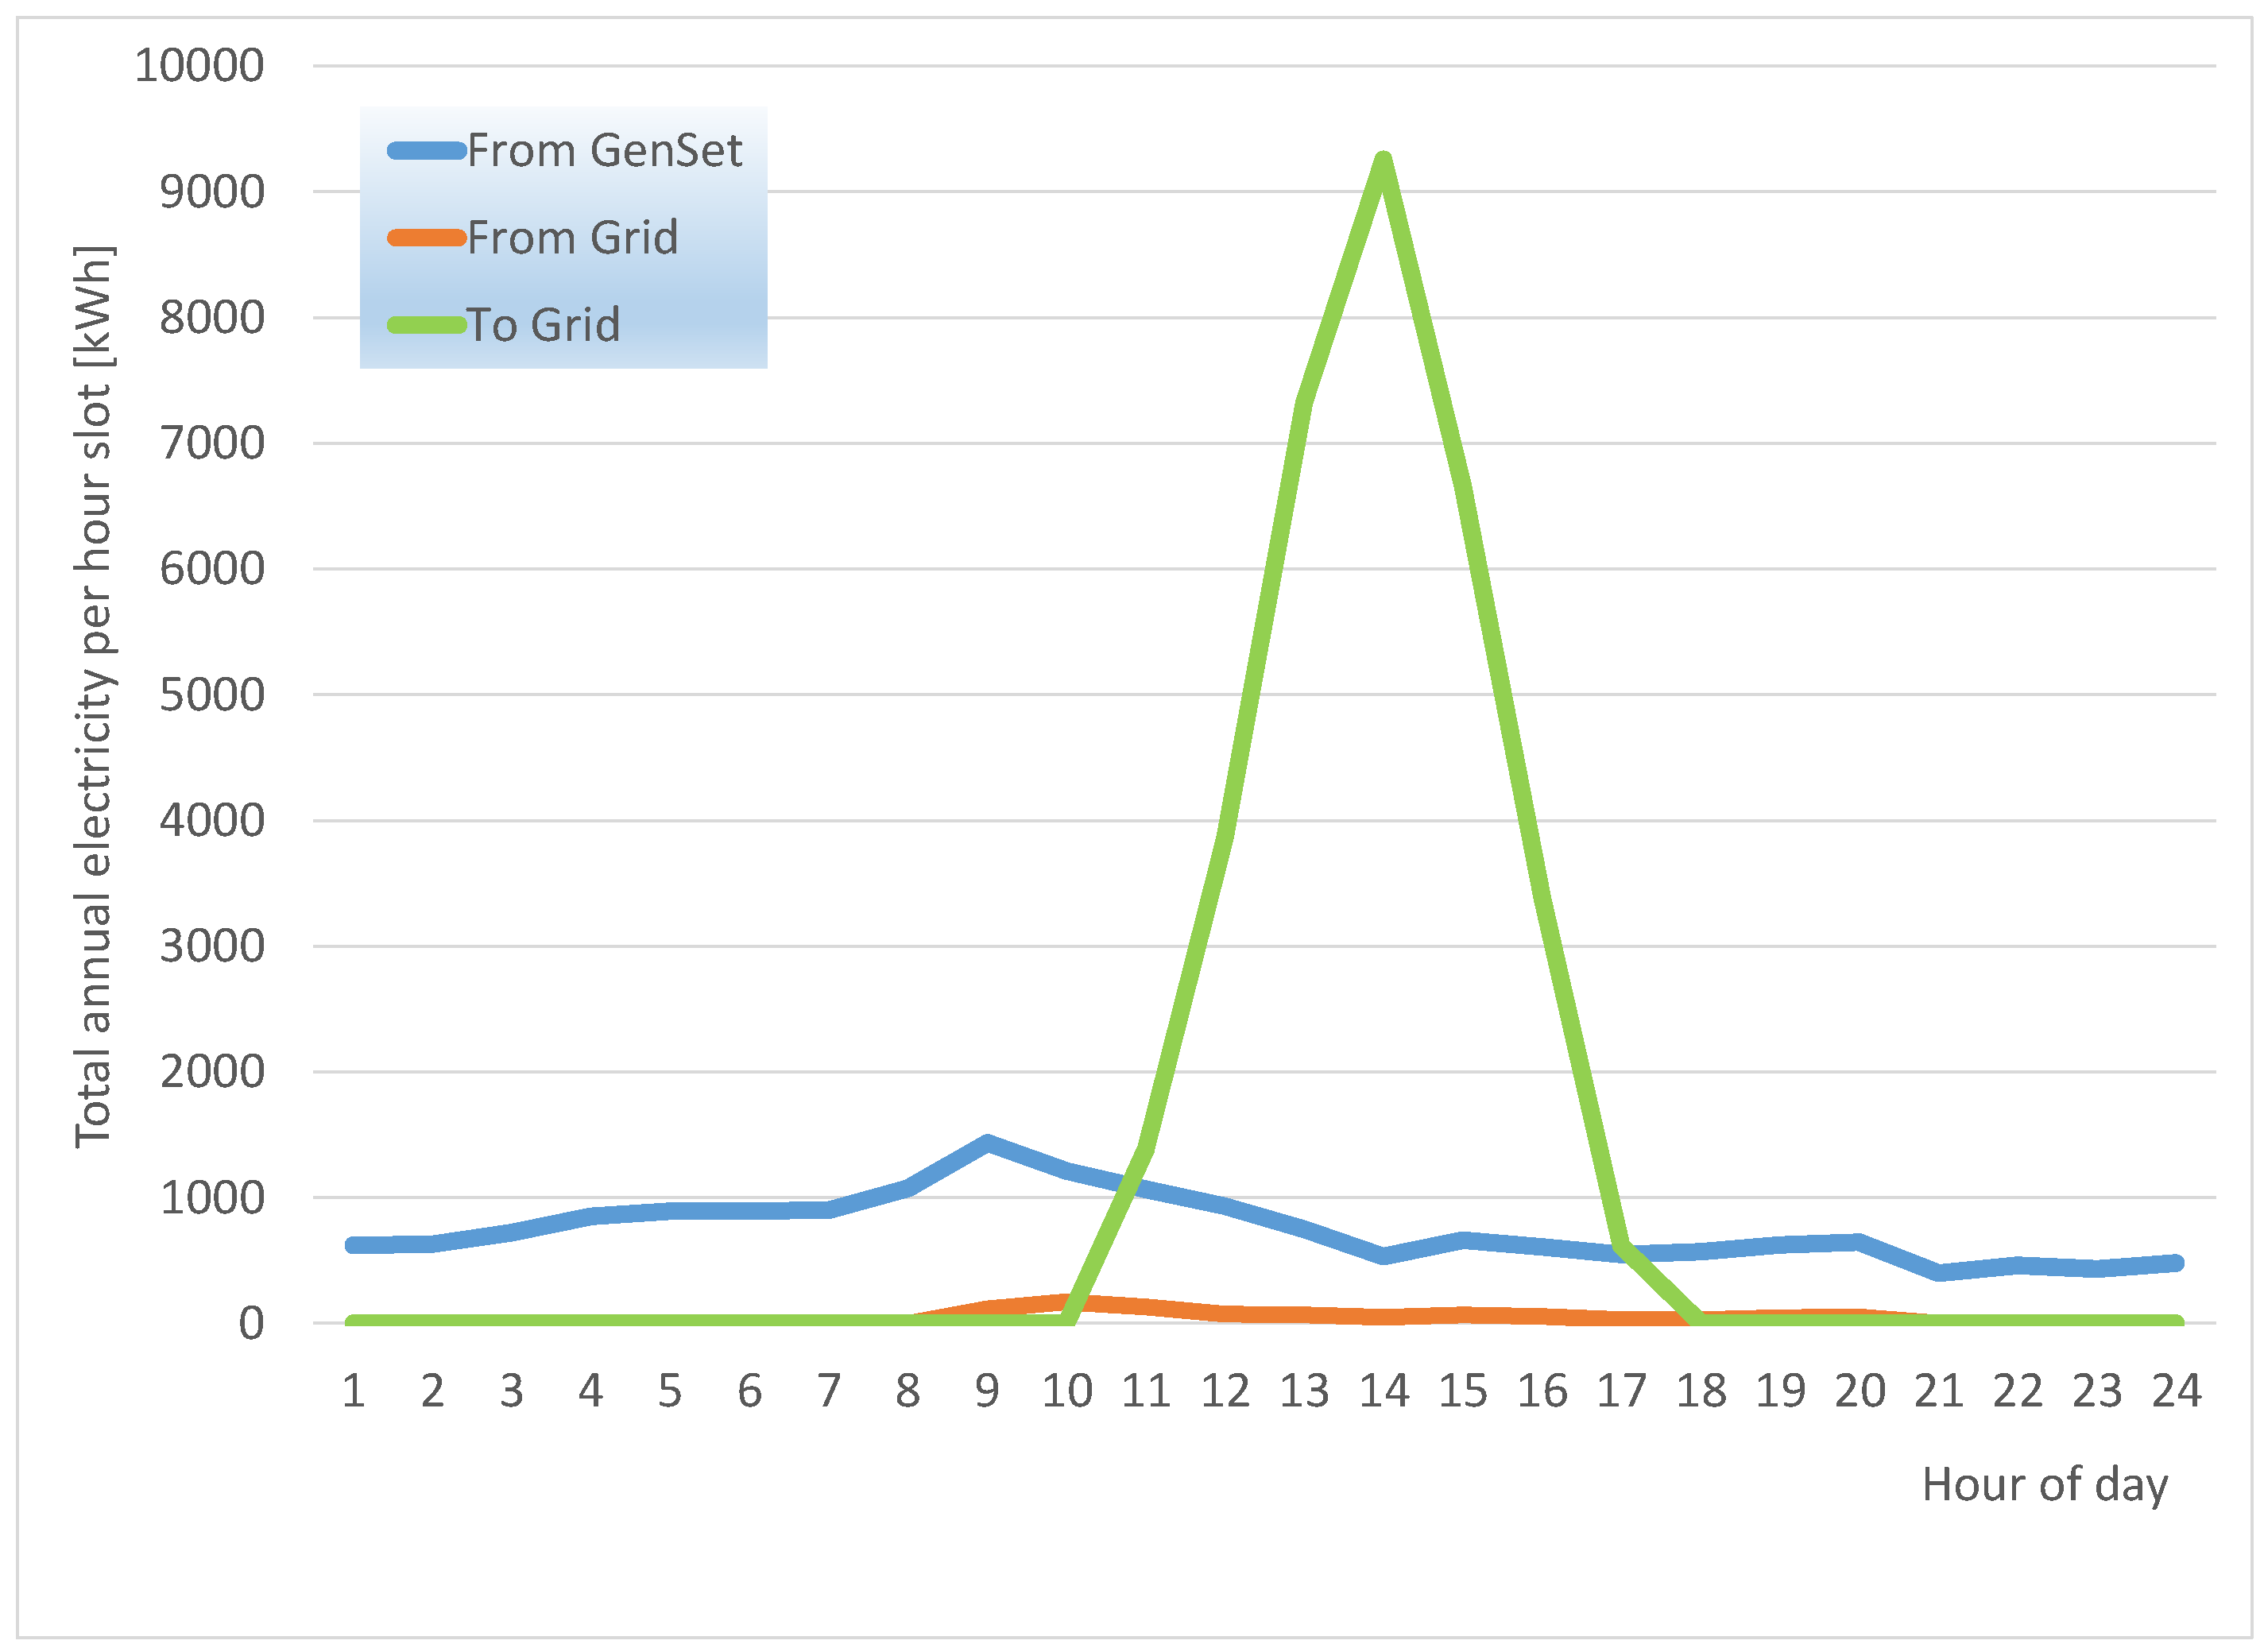
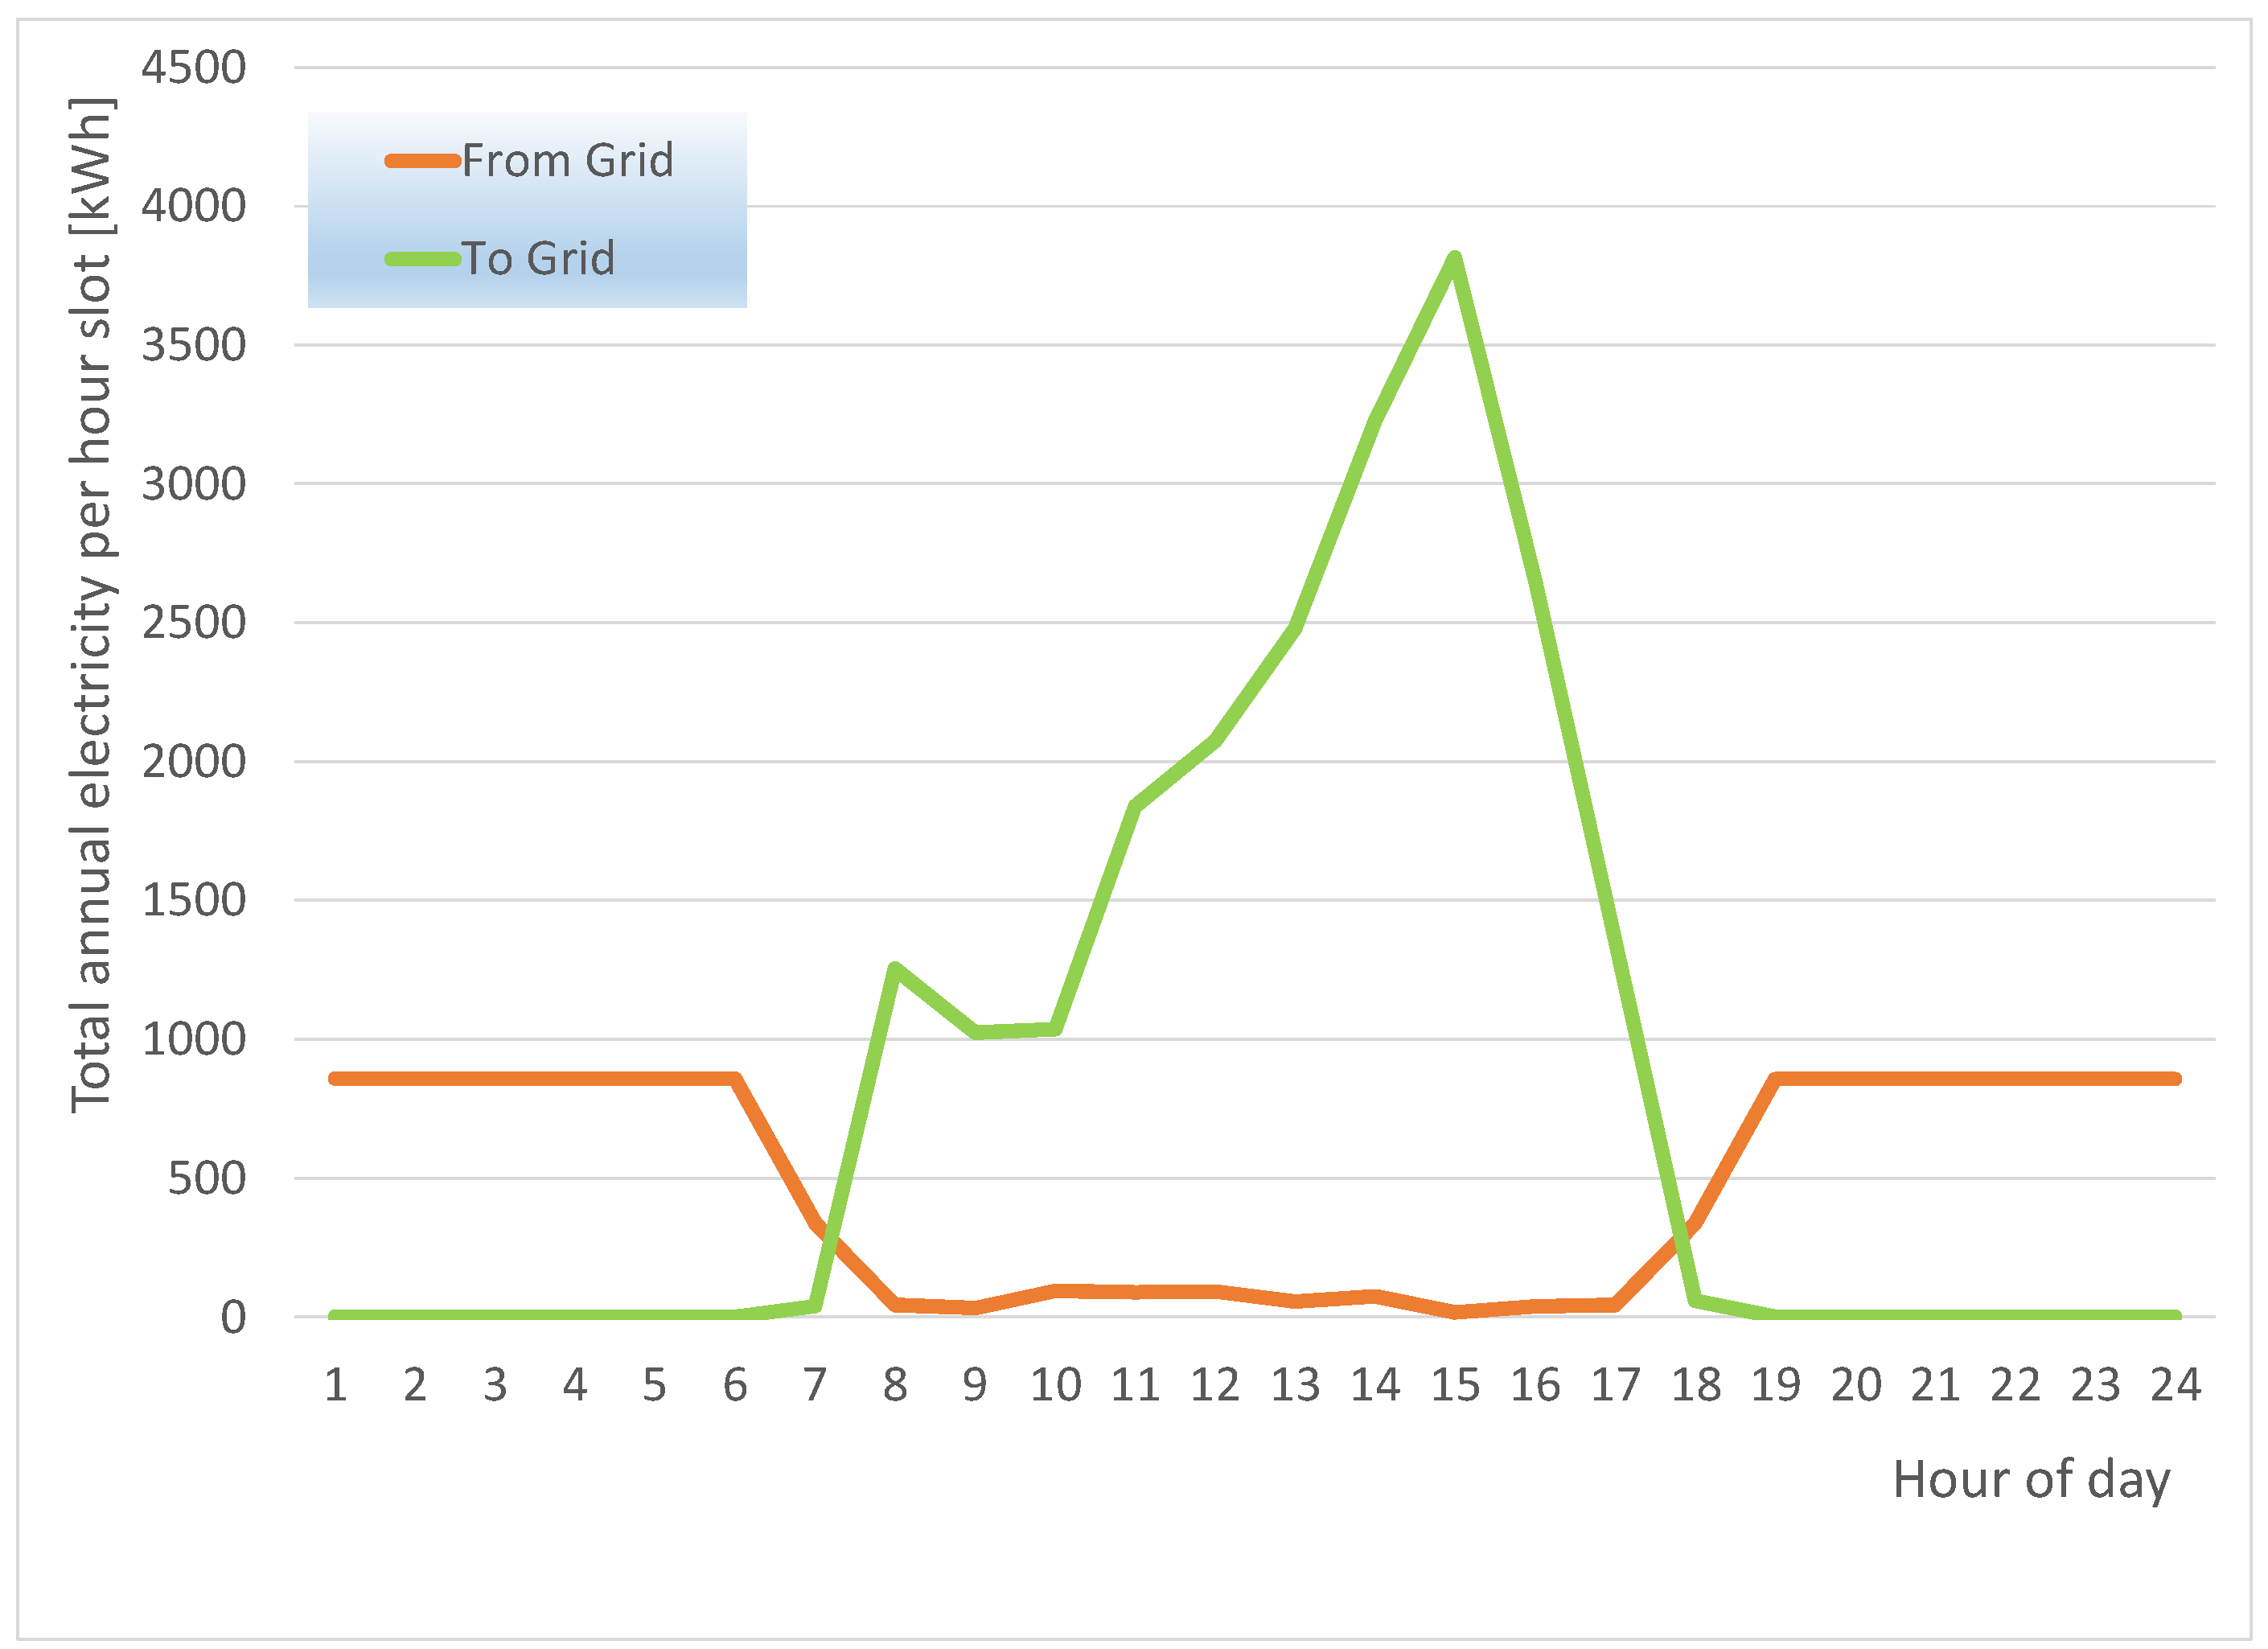
3.3. Cumulative Hourly Distributions of Grid Interaction

As a next step, to demonstrate the significance of the proposed concept in addressing the current challenges in the field of energy storage and micro-grid optimization in nZEBs, the timing of electricity exports to the grid are presented in Figure 18 and Figure 19. These are cumulative electrical energy quantities for the whole year. The results are presented separately for weekdays and weekend days. The total electricity dispatched from the generator, imported from the grid and exported to the grid during working weekdays, produces the diagram shown in Figure 18. The total annual exports to the grid during working days per hour of the day are seen to reach a maximum slightly exceeding 9000 kWh at the 14:00–15:00 time slot. The shift of electricity exports occurring later towards the afternoon hours is usually beneficial to the external grid, as explained in the context of Figure 6 and Figure 8. On the other hand, any necessary imports from the grid have become negligible during the morning ramp (07:00–10:00), a fact which is beneficial for the external grid.
The respective integration results during weekend days produce the diagram in Figure 19. As already mentioned above, the genset is not operated during weekends. The total annual electricity exported to the grid during weekend days per hour of the day is seen to reach a maximum of 3800 kWh at the 15:00–16:00 time slot.
More generally, according to the diagram in Figure 19, exports to the grid during the weekends are maximized at afternoon hours in the 13:00–17:00 period. Despite the increased electricity surplus during weekends, a significant part is exploited by the electrolyzer stacks. Thus, the remaining electricity exported to the grid is limited. As already demonstrated in Figure 6 and Figure 8, this is in line with the reduced load of the Greek system during weekends. On the other hand, electricity imports during weekends are required only during the night hours, which is a time slot of low demand for the Greek system. A comparison with the results of similar studies shows that the 0.18 kW/kWp PV power setting of the genset is reasonable, as well as the 0.33 kWmax/kWp PV maximum power setting of the electrolyzer units. As regards other alternatives for long-term energy storage, one could mention the use of cost-effective iron-based aqueous redox flow batteries for large-scale energy storage applications [52]. However, the use of hydrogen in this respect allows for a better integration with the hydrogen economy, which is a strategic choice already made, as seen by the worldwide infrastructure under intensive development and expansion [53]. Finally, regarding electrolyzer technology, alkaline electrolyzers may not prove to be favorable to cooperate with renewable energy sources that have rapid fluctuation characteristics in comparison with PEM electrolyzers [54]. This could be a further direction for system improvements. Last but not least, the lives of lithium-ion batteries are mainly determined by the number of charge and discharge cycles. Thus, it is a direction of the optimization of the smart grid to avoid the unnecessary cycling of electric vehicles’ batteries by sequentially arranging the discharging of employees’ electric cars for one day. These are areas for further research and development in the context of nZEBs and building micro-grids, which are expected to further advance sustainable energy solutions in this sector.

4. Conclusions

The interactions between short-term and long-term energy storage in a novel concept applied in an nZEB building’s smart grid are studied with the aid of transient simulation. Short-term electricity storage is supplied by the electric batteries of employees’ cars. These are bi-directionally connected to the building’s smart grid during working days. As regards long-term storage, an optimally sized 40 kW (0.18 kW/kWp PV) green hydrogen-fueled genset is deployed to keep the micro-grid near-autonomous by simultaneously optimizing the tilt angle of PV panels to 39°. Production and storage in a 100 m3 volume, high-pressure tank of green hydrogen with optimally sized electrolyzer units with a maximum capacity of 72 kW (0.33 kWmax/kWp PV during weekends provides the necessary long-term energy storage option required for optimal system tuning. The optimally sized system is demonstrated to minimize the interaction with the external grid both on working days and weekend days. Moreover, the timing of hourly electricity exports is more favorable for the external grid’s demand profiles. The new concept’s potential benefits to the integration of nZEBs to the network are discussed, and areas for further research and development to advance sustainable energy solutions are discussed.

Author Contributions

Conceptualization, G.S. and A.-M.S.; methodology, A.-M.S.; software, G.S.; validation, G.S.; formal analysis, A.-M.S.; investigation, G.S.; writing—original draft preparation, G.S.; writing—review and editing, A.-M.S.; project administration, A.-M.S. All authors have read and agreed to the published version of the manuscript.

Funding

This research received no external funding.

Data Availability Statement

Data are contained within the article.

Acknowledgments

The authors would like to give special thanks to Olympia Zogou for her advice on the TRNSYS system’s model improvements and fruitful discussions of the simulation results.

Conflicts of Interest

The authors declare no conflicts of interest.

Appendix A

As regards the location, climate and building envelope characteristics, the following information is cited: Volos is a coastal Greek city (latitude 39°21′, longitude 22°56′). Volos has a warm, temperate climate. The average winter temperatures are 8–10 °C. The average summer temperatures are 25–28 °C. The annual precipitation averages around 500 mm with significant year-to-year fluctuation.
Table A1 summarizes the shell insulation data. They adhere to the stricter Greek standards in use. Advanced technology includes double-glazed windows with U = 1.29 W/m2K and a solar heat gain coefficient of g = 0.333. The average window–to-wall ratio is 0.29. Automatic shading devices are prescribed for vertical openings. The shading coefficients range from 0.5 (south-facing openings) to 0.8 (north-facing openings). The building’s ventilation fulfills EN 16798–1:2019 [55]. The operating schedule assumes working hours of 9:00–18:00 on weekdays and 09:00–14:00 on Saturdays. High-efficiency LED lighting with a 5 W/m2 electricity consumption (peak) is used in office spaces. The amount of energy consumed for office equipment is assumed to be 200 W per employee.
Table A1. Building insulation data (U-values).
Shell TypeLayersU (W/m2K)
Roof insulationReinforced concrete slab, extruded polystyrene, lightweight concrete, ceramic tiles0.272
Concrete columnReinforced concrete, extruded polystyrene0.324
Outside wallCeramic brick, extruded polystyrene, ceramic brick0.319
Floor insulationReinforced concrete slab, extruded polystyrene0.443
Table A2. Water–water heat pump efficiency data for heating and cooling modes.
Heating Mode: Ground Loop Water Temperature [°C]
18.015.013.010.08.57.04.52.00.0
kW thermal271.4255.4241.9228.8216.0209.7193.2183.0173.0
KW46.845.644.84443.242.84241.641.2
COP5.85.65.45.254.94.64.44.2
Cooling Mode: Ground Loop Water Temperature [°C]
202530354045
kW thermal201.6198.9196.1194.2185.6177.8
kW48515355.55863.5
COP4.23.93.73.53.22.8
The main technical data of the PV panels employed in this study are listed in Table A3 according to the manufacturer’s datasheet. They are employed to tune the model of the photovoltaic panel’s operation in the TRNSYS environment [46].
Table A3. Technical data of 415 Wp monocrystalline silicon, 120 half-cell PV panels NU JC415 [45], as used in TRNSYS type194.
PV Module ParameterValueComments
ISC at STC13.87 AShort circuit current
VOC at STC38.08 VOpen circuit voltage
IMPP at STC13.18 ACurrent at max power point
VMPP at STC31.49 VVoltage at max power point
Temperature coefficient of ISC (STC)0.054%/KαISC
Temperature coefficient of VOC (STC)−0.262%/KβVOC
Number of cells wired in series2 strings × 60 mod.
Module temperature at NOCT315.5 K
Ambient temperature at NOCT293 K
Module area1.95 m2
Module efficiency21.25%

References

  1. Zheng, Z.; Shafique, M.; Luo, X.; Wang, S. A systematic review towards integrative energy management of smart grids and urban energy systems. Renew. Sustain. Energy Rev. 2024, 189, 114023. [Google Scholar] [CrossRef]
  2. Liu, J.; Wu, H.; Huang, H.; Yang, H. Renewable energy design and optimization for a net-zero energy building integrating electric vehicles and battery storage considering grid flexibility. Energy Convers. Manag. 2023, 298, 117768. [Google Scholar] [CrossRef]
  3. European_Commission. Nearly Zero-Energy Buildings. 2022. Available online: https://energy.ec.europa.eu/topics/energy-efficiency/energy-efficient-buildings/nearly-zero-energy-buildings_en (accessed on 10 March 2024).
  4. European Commission. COMMISSION RECOMMENDATION (EU) 2016/1318 of 29 July 2016 on Guidelines for the Promotion of Nearly Zero-Energy Buildings and Best Practices to Ensure that, by 2020, All New Buildings Are Nearly Zero-Energy Buildings; Commission of the European Communities, Ed.; Official Journal of the European Union: Brussels, Belgium, 2016. [Google Scholar]
  5. Sun, C.; Negro, E.; Vezzù, K.; Pagot, G.; Cavinato, G.; Nale, A.; Bang, Y.H.; Di Noto, V. Hybrid inorganic-organic proton-conducting membranes based on SPEEK doped with WO3 nanoparticles for application in vanadium redox flow batteries. Electrochim. Acta 2019, 309, 311–325. [Google Scholar] [CrossRef]
  6. European Commission. Directive 2010/31/EU of the European Parliament and of the Council of 19 May 2010 on the Energy Performance of Buildings; Official Journal of the European Union: Brussels, Belgium, 2010. [Google Scholar]
  7. European_Commission. Proposal for a DIRECTIVE OF THE EUROPEAN PARLIAMENT AND OF THE COUNCIL on the Energy Performance of Buildings (Recast) COM/2021/802 Final; Office for Official Publications of the European Communities: Luxembourg, 2021. [Google Scholar]
  8. Stamatellos, G.; Zogou, O.; Stamatelos, A. Energy Analysis of a NZEB Office Building with Rooftop PV Installation: Exploitation of the Employees’ Electric Vehicles Battery Storage. Energies 2022, 15, 6206. Available online: https://www.mdpi.com/1996-1073/15/17/6206 (accessed on 10 March 2024). [CrossRef]
  9. Nafeh, A.E.S.A.; Omran, A.E.F.A.; Elkholy, A.; Yousef, H.M. Optimal economical sizing of a PV-battery grid-connected system for fast charging station of electric vehicles using modified snake optimization algorithm. Results Eng. 2024, 21, 101965. [Google Scholar] [CrossRef]
  10. Yan, H.; Zhang, W.; Kang, J.; Yuan, T. The Necessity and Feasibility of Hydrogen Storage for Large-Scale, Long-Term Energy Storage in the New Power System in China. Energies 2023, 16, 4837. [Google Scholar] [CrossRef]
  11. Jung, J.; Baek, K.; Lee, E.; Ko, W.; Kim, J. Economic Analysis of Special Rate for Renewable Energy Based on the Design of an Optimized Model for Distributed Energy Resource Capacities in Buildings. Energies 2021, 14, 645. [Google Scholar] [CrossRef]
  12. Shorbila, S.E.A.; Hebala, O.M.; Ashour, H.A. Decarbonization of Net Zero Energy Buildings by an Intelligent Energy Management System for Smart Grids. In Proceedings of the 2022 11th International Conference on Power Science and Engineering (ICPSE), Eskisehir, Turkey, 23–25 September 2022. [Google Scholar]
  13. Ju, Y.; Jokisalo, J.; Kosonen, R. Peak Shaving of a District Heated Office Building with Short-Term Thermal Energy Storage in Finland. Buildings 2023, 13, 573. [Google Scholar] [CrossRef]
  14. Seboldt, D.; Mansbart, M.; Grabner, P.; Eichlseder, H. Wasserstoffmotoren für zukünftige Pkw und leichte Nutzfahrzeuge. Mot. Z. 2021, 82, 47–51. [Google Scholar] [CrossRef]
  15. Chen, Q.; Kuang, Z.; Liu, X.; Zhang, T. Optimal sizing and techno-economic analysis of the hybrid PV-battery-cooling storage system for commercial buildings in China. Appl. Energy 2024, 355, 122231. [Google Scholar] [CrossRef]
  16. Oussama, H.; Amine, H.M.; Amine, S.M.; Aissa, B.; Abdeselem, C.; Othmane, A. Intelligent Energy Management Strategy For Multi-Sources Isolated DC-Microgrid. In Proceedings of the 2023 Second International Conference on Energy Transition and Security (ICETS), Adrar, Algeria, 12–14 December 2023. [Google Scholar]
  17. Lee, H.; Kang, J.-W.; Choi, B.-Y.; Kang, K.-M.; Kim, M.-N.; An, C.-G.; Yi, J.; Won, C.-Y. Energy Management System of DC Microgrid in Grid-Connected and Stand-Alone Modes: Control, Operation and Experimental Validation. Energies 2021, 14, 581. [Google Scholar] [CrossRef]
  18. Bosisio, A.; Morotti, A.; Penati, S.; Berizzi, A.; Pasetti, C.; Iannarelli, G. A feasibility study of using renewable-based hydrogen in off-grid domestic energy systems: A case study in Italy. In Proceedings of the 2022 Second International Conference on Sustainable Mobility Applications, Renewables and Technology (SMART), Virtual, 23–25 November 2022. [Google Scholar]
  19. Sharshir, S.W.; Joseph, A.; Elsayad, M.M.; Tareemi, A.A.; Kandeal, A.; Elkadeem, M.R. A review of recent advances in alkaline electrolyzer for green hydrogen production: Performance improvement and applications. Int. J. Hydrogen Energy 2024, 49, 458–488. [Google Scholar] [CrossRef]
  20. Abdolmaleki, L.; Berardi, U. Dynamic simulation of a hydrogen-fueled system for zero-energy buildings using TRNSYS software. In Proceedings of the IAQVEC2023 E3S Web of Conferences, Tokyo, Japan, 20–23 May 2023. [Google Scholar]
  21. Siebel, T. Druck im Wasserstofftank. Mot. Z. 2021, 82, 8–12. [Google Scholar]
  22. Razmara, M.; Bharati, G.R.; Shahbakhti, M.; Paudyal, S.; Robinett, R.D. Bilevel Optimization Framework for Smart Building-to-Grid Systems. IEEE Trans. Smart Grid 2018, 9, 582–593. [Google Scholar] [CrossRef]
  23. Zhang, J.; Jiang, Q.; Pan, A.; Li, T.; Liu, Z.; Zhang, Y.; Jiang, L.; Zhan, X. An Optimal Dispatching Strategy for Charging and Discharging of Electric Vehicles Based on Cloud-Edge Collaboration. In Proceedings of the 2021 3rd Asia Energy and Electrical Engineering Symposium (AEEES), Chengdu, China, 26–29 March 2021. [Google Scholar]
  24. Song, K.; Lan, Y.; Zhang, X.; Jiang, J.; Sun, C.; Yang, G.; Yang, F.; Lan, H. A Review on Interoperability of Wireless Charging Systems for Electric Vehicles. Energies 2023, 16, 1653. [Google Scholar] [CrossRef]
  25. Dreisbusch, M.; Mang, S.; Ried, S.; Kellerer, F.; Pfab, X. Regulation of Grid-efficient Charging from the User’s Perspective. MTZ Worldw. 2020, 81, 66–70. [Google Scholar] [CrossRef]
  26. Engel, H.; Hensley, R.; Knupfer, S.; Sahdev, S. The Potential Impact of Electric Vehicles on Global Energy Systems; McKinsey Center for Future Mobility: Milpitas, CA, USA, 2018. [Google Scholar]
  27. Thomas, D.; Deblecker, O.; Ioakimidis, C.S. Optimal operation of an energy management system for a grid-connected smart building considering photovoltaics’ uncertainty and stochastic electric vehicles’ driving schedule. Appl. Energy 2018, 210, 1188–1206. [Google Scholar] [CrossRef]
  28. Fachrizal, R.; Shepero, M.; Åberg, M.; Munkhammar, J. Optimal PV-EV sizing at solar powered workplace charging stations with smart charging schemes considering self-consumption and self-sufficiency balance. Appl. Energy 2021, 307, 118139. [Google Scholar] [CrossRef]
  29. Pyloudi, E.; Papantoniou, S.; Kolokotsa, D. Retrofitting an office building towards a net zero energy building. Adv. Build. Energy Res. 2015, 9, 20–33. [Google Scholar] [CrossRef]
  30. Karlessi, T.; Kampelis, N.; Kolokotsa, D.; Santamouris, M.; Standardi, L.; Isidori, D.; Cristalli, C. The Concept of Smart and NZEB Buildings and the Integrated Design Approach. Procedia Eng. 2017, 180, 1316–1325. [Google Scholar] [CrossRef]
  31. Wang, B.; Yu, X.; Xu, H.; Wu, Q.; Wang, L.; Huang, R.; Li, Z.; Zhou, Q. Scenario analysis, management, and optimization of a new Vehicle-to-Micro-Grid (V2μG) network based on off-grid renewable building energy systems. Appl. Energy 2022, 325, 119873. [Google Scholar] [CrossRef]
  32. Hossain, J.; Shareef, H.; Hossain, A.; Kalam, A.; Kadir, A.F.A. Hybrid PV and Battery System Sizing for Commercial Buildings in Malaysia: A Case Study of FKE-2 Building in UTeM. IEEE Trans. Ind. Appl. 2024, 1–14. [Google Scholar] [CrossRef]
  33. Go, J.; Byun, J.; Orehounig, K.; Heo, Y. Battery-H2 storage system for self-sufficiency in residential buildings under different electric heating system scenarios. Appl. Energy 2023, 337, 120742. [Google Scholar] [CrossRef]
  34. Hai, T.; Ali, M.A.; Dhahad, H.A.; Alizadeh, A.; Sharma, A.; Almojil, S.F.; Almohana, A.I.; Alali, A.F.; Wang, D. Optimal design and transient simulation next to environmental consideration of net-zero energy buildings with green hydrogen production and energy storage system. Fuel 2023, 336, 127126. [Google Scholar] [CrossRef]
  35. Mohammadi, Z.; Ahmadi, P.; Ashjaee, M. Comparative transient assessment and optimization of battery and hydrogen energy storage systems for near-zero energy buildings. Renew. Energy 2024, 220, 119680. [Google Scholar] [CrossRef]
  36. Hassan, Q.; Azzawi, I.D.J.; Sameen, A.Z.; Salman, H.M. Hydrogen Fuel Cell Vehicles: Opportunities and Challenges. Sustainability 2023, 15, 11501. [Google Scholar] [CrossRef]
  37. Ascione, F.; Festa, V.; Manniti, G.; Ruggiero, S.; Tariello, F.; Vanoli, G.P. H2 micro-cogeneration in buildings: From nZEBs to HZEBs. State of Art, with a novel experimental set-up. In Proceedings of the 2023 8th International Conference on Smart and Sustainable Technologies (SpliTech), Split/Bol, Croatia, 20–23 June 2023. [Google Scholar]
  38. Yang, Z.; Wang, B.; Jiao, K. Life cycle assessment of fuel cell, electric and internal combustion engine vehicles under different fuel scenarios and driving mileages in China. Energy 2020, 198, 117365. [Google Scholar] [CrossRef]
  39. Sinigaglia, T.; Martins, M.E.S.; Siluk, J.C.M. Technological forecasting for fuel cell electric vehicle: A comparison with electric vehicles and internal combustion engine vehicles. World Pat. Inf. 2022, 71, 102152. [Google Scholar] [CrossRef]
  40. Stamatellos, G.; Stamatelos, T. Study of an nZEB Office Building with Storage in Electric Vehicle Batteries and Dispatch of a Natural Gas-Fuelled Generator. Energies 2023, 16, 3195. [Google Scholar] [CrossRef]
  41. SEL. TRNSYS 16 Manual; Solar Energy Laboratory, University of Wisconsin-Madison: Madison, WI, USA, 2005. [Google Scholar]
  42. Neymark, J.; Judkoff, R.; Knabe, G.; Le, H.-T.; Dürig, M.; Glass, A.; Zweifel, G. Applying the building energy simulation test (BESTEST) diagnostic method to verification of space conditioning equipment models used in whole-building energy simulation programs. Energy Build. 2002, 34, 917–931. [Google Scholar] [CrossRef]
  43. IEEE. IEEE Standard for Technical Specifications of a DC Quick and Bidirectional Charger for Use with Electric Vehicles-Redline; IEEE Std 2030.1.1-2021 (Revision of IEEE Std 2030.1.1-2015)-Redline; IEEE: Piscataway, NJ, USA, 2022; pp. 1–263. [Google Scholar]
  44. Thermal Energy Systems Specialists. T.E.S.S. Component Libraries for TRNSYS, Version 2.0. User’s Manual; T.E.S.S.: Madison, WI, USA, 2004; Available online: http://www.tess-inc.com/services/software (accessed on 10 March 2024).
  45. Sharp. 415Wp/Mono NUJC415 Data Sheet; Sharp, Japan 2023. Available online: https://docs.aws.sharp.eu/Marketing/Datasheet/2208_NUJC_415_HC-Mono_Datasheet_EN.pdf (accessed on 10 March 2024).
  46. De Soto, W.; Klein, S.A.; Beckman, W.A. Improvement and validation of a model for photovoltaic array performance. Sol. Energy 2006, 80, 78–88. [Google Scholar] [CrossRef]
  47. Stamatellos, G.; Zogou, O.; Stamatelos, A. Interaction of a House’s Rooftop PV System with an Electric Vehicle’s Battery Storage and Air Source Heat Pump. Solar 2022, 2, 186–214. [Google Scholar] [CrossRef]
  48. Hussein, A.A.; Batarseh, I. An overview of generic battery models. In Proceedings of the 2011 IEEE Power and Energy Society General Meeting, Detroit, MI, USA, 24–29 July 2011. [Google Scholar]
  49. Ulleberg, Ø. Stand-Alone Power Systems for the Future: Optimal Design, Operation and Control of Solar-Hydrogen Energy Systems. Ph.D. Thesis, Norges Teknisk-Naturvitenskapelige Universitet, Trondheim, Norway, 1998. [Google Scholar]
  50. Ulleberg, Ø. Modeling of advanced alkaline electrolyzers: A system simulation approach. Int. J. Hydrogen Energy 2003, 28, 21–33. [Google Scholar] [CrossRef]
  51. Sundén, B. Chapter 6-Thermal management of batteries. In Hydrogen, Batteries and Fuel Cells; Sundén, B., Ed.; Academic Press: Cambridge, MA, USA, 2019; pp. 93–110. [Google Scholar]
  52. Zhang, H.; Sun, C. Cost-effective iron-based aqueous redox flow batteries for large-scale energy storage application: A review. J. Power Sources 2021, 493, 229445. [Google Scholar] [CrossRef]
  53. Dudkina, E.; Villar, J.; Bessa, R.J.; Crisostomi, E. The Role of Batteries in Maximizing Green Hydrogen Production with Power Flow Tracing. In Proceedings of the 2024 4th International Conference on Smart Grid and Renewable Energy (SGRE), Doha, Qatar, 8–10 January 2024. [Google Scholar]
  54. Kojima, H.; Nagasawa, K.; Todoroki, N.; Ito, Y.; Matsui, T.; Nakajima, R. Influence of renewable energy power fluctuations on water electrolysis for green hydrogen production. Int. J. Hydrog. Energy 2023, 48, 4572–4593. [Google Scholar] [CrossRef]
  55. EN 16798-1:2019; Energy Performance of Buildings-Ventilation for Buildings-Part 1: Indoor Environmental Input Parameters for Design and Assessment of Energy Performance of Buildings Addressing Indoor Air Quality, Thermal Environment, Lighting and Acoustics. European Committee for Standardization CEN: Brussels, Belgium, 2019.
Figure 1. (a) A layout drawing of the building’s rooftop PV installation. (b) The plan of a typical floor. (c) A schematic of EV parking places with chargers in the building’s basement. Green arrows indicate car movement directions. (d) A schematic of an electrolyzer unit. (e) A pressurized hydrogen tank.
Energies 17 01441 g001
Figure 2. The simulated system’s diagram as it is developed in the TRNSYS simulation studio environment. The interaction of the main system’s components is shown in this diagram.
Energies 17 01441 g002
Figure 3. Operation points of a modern hydrogen-fueled, spark-ignition engine (load versus engine speed). Engine equivalence ratio (λ) is mapped in the left diagram. Engine thermal efficiency is mapped on the right. This is a direct-injection, turbocharged SI engine, specially adapted to burn hydrogen as fuel. Adapted from [14].
Energies 17 01441 g003
Figure 4. A flowchart describing the basic logic of system operation. The dispatch of electricity produced by the available power sources (PV panels, genset, car batteries and external grid imports) to cover the system’s loads is explained. The differentiation of the dispatch logic during weekend days is also depicted.
Energies 17 01441 g004
Figure 5. The transient simulation results of the building’s energy system performance during the second week of January. The indoor temperature setpoint is 20 °C. The genset is observed to operate mainly from Wednesday to Friday, reducing the content of the hydrogen tank. The operation of the electrolyzer units is noticeable during the weekend.
Energies 17 01441 g005
Figure 6. The electricity demand of the Geek system during a cold week in January 2024. The morning and evening ramps of each day are observable in the total consumption curve (blue). The subtraction of the PV contribution substantially reduces the operation of conventional power sources to meet the morning ramp. The reduced electricity demand during Saturday and Sunday is also observable.
Energies 17 01441 g006
Figure 7. The transient operation of the system during the second week of July. The indoor temperature setpoint is 26 °C in the cooling operation. Significant electricity export to the external grid is observed in the early afternoon during working days. The car batteries’ state of charge is seen to be above 90% as long as they are connected to the chargers. The heat pump electricity consumption is maximized during Monday and Tuesday due to the heat wave episode.
Energies 17 01441 g007
Figure 8. The electricity demand of the Geek system during a week in July 2023 with a heat wave episode occurring from Monday to Wednesday. The peak power demand of Greece exceeded 10 GW during these days. The significant contribution of PV electricity is observable to almost diminish the huge morning ramp of the system during all days of this week.
Energies 17 01441 g008
Figure 9. The monthly evolution of the building’s energy performance for one year. The genset has a rated power of 50 kW. The rooftop PV panels are placed with a tilt angle of 30 degrees. Five electrolyzer stacks with a maximum power consumption of 120 kW are installed for green hydrogen production.
Energies 17 01441 g009
Figure 10. Monthly hydrogen production from the electrolyzer unit (in blue color) and monthly hydrogen consumption of the 50 kW-rated genset (in red) for one year.
Energies 17 01441 g010
Figure 11. The energy performance of the optimally sized system on a monthly basis for one year with a 40 kW generator rating, three electrolyzer stacks with a 72 kW maximum power consumption and a 39 degree tilt angle for the rooftop PV panels. The total electricity exports to the grid are reduced, and the maximum is shifted to April and May.
Energies 17 01441 g011
Figure 12. Monthly hydrogen production from the 72 kW electrolyzer units (in blue) and the electricity consumption of the 40 kW-rated genset for one year (optimized system).
Energies 17 01441 g012
Figure 13. The evolution of the battery’s state of charge as a function of the hour of day (vertical axis) and the day of the year (horizontal axis) is presented. The batteries start with a negligible charge at the beginning of the year. They are charged during working hours and discharge afterwards. The maximum state of charge is observed in June and July. Significant charge fluctuations are observed in winter months.
Energies 17 01441 g013
Figure 14. Hourly variation in the hydrogen tank capacity (%) as a function of the hour of day (vertical axis) and the day of the year (horizontal axis) during a full year. The tank is full at the beginning of the year. It is filled close to 90% at the end of summer, and its capacity reduced again to 50% at the end of December.
Energies 17 01441 g014
Figure 15. Hourly electric power output of the 40 kW-rated genset as function of the hour of day (vertical axis) and the day of the year (horizontal axis) during a full year. The operation of the genset varies according to the electricity deficit of the building. It is limited to the working days of the week. No genset operation is necessary during late spring and summer.
Energies 17 01441 g015
Figure 16. The hourly electricity import from the grid of the optimized system as a function of the hour of day (vertical axis) and the day of the year (horizontal axis) during a full year. Routine imports of small amounts of electricity from the grid are observed during all weekends of the year to keep the electrolyzer units at an idle state of operation.
Energies 17 01441 g016
Figure 17. The hourly variation in electricity exported to grid (kW) of the optimally sized system as a function of the hour of day (vertical axis) and the day of the year (horizontal axis) during a full year. The electricity exports are maximized around afternoon hours, especially during workdays in the spring.
Energies 17 01441 g017
Figure 18. The hourly distribution of the total annual electricity dispatched from the 40 kW-rated genset, the total annual electricity imported from grid and the total annual electricity exported to the grid during workdays (optimized system).
Energies 17 01441 g018
Figure 19. The hourly distribution of the total annual electricity imported from grid and the total annual electricity exported to the grid during all weekend days.
Energies 17 01441 g019
Table 1. Main technical data of modern direct-injection hydrogen-fueled SI engine.
Engine TypeIn Line, 4 Cylinder, 4-Stroke SI, Turbocharged
Engine displacement2.0 dm3
Compression ratio9.8
Injection systemH2 direct injection
Ignition systemSeries production ignition coils, cold spark plugs
Cam phasingHydraulic cam phasers for inlet/exhaust valves
Rated torque382 Nm @3000 rpm (bmep = 24 bar@3000 rpm)
Rate power140 kW@6000 rpm
Rated power for genset operation120 kW@3000 rpm
Table 2. Optimization variables, limits and step.
Optimization VariableMINMAXSTEPUnits
PV panels’ tilt angle20501deg
Number of electrolyzer stacks251[-]
Rated power of genset20805kW
Table 3. Performance comparison of initial and optimized energy system.
Optimization VariableInitial ValueOptimizedUnits
Annual electricity consumption 117,000116,000kWh
Annual net hydrogen consumption34902580Nm3
Annual primary energy consumption61.760.6kWh/m2y
Annual PV electricity production329,000322,000kWh
Annual electricity production, genset19,40017,900kWh
Annual electricity imported from grid11,80012,400kWh
Annual electricity exported to grid62,20053,300kWh
Disclaimer/Publisher’s Note: The statements, opinions and data contained in all publications are solely those of the individual author(s) and contributor(s) and not of MDPI and/or the editor(s). MDPI and/or the editor(s) disclaim responsibility for any injury to people or property resulting from any ideas, methods, instructions or products referred to in the content.

