
Simulation and Experimental Results for Energy Production Using Hybrid Photovoltaic Thermal Technology


Abstract
1. Introduction
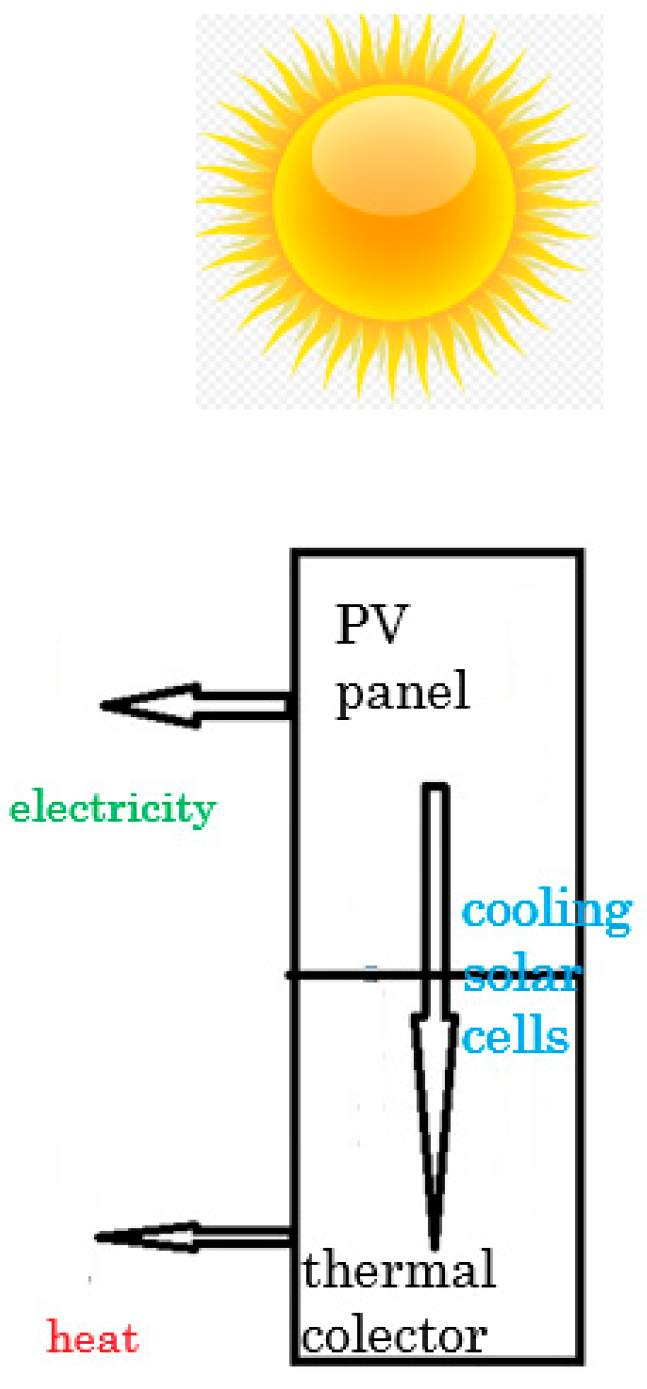
1.1. Background
1.2. Brief Literature Review
1.3. Contribution and Paper Organization
2. Materials and Methods
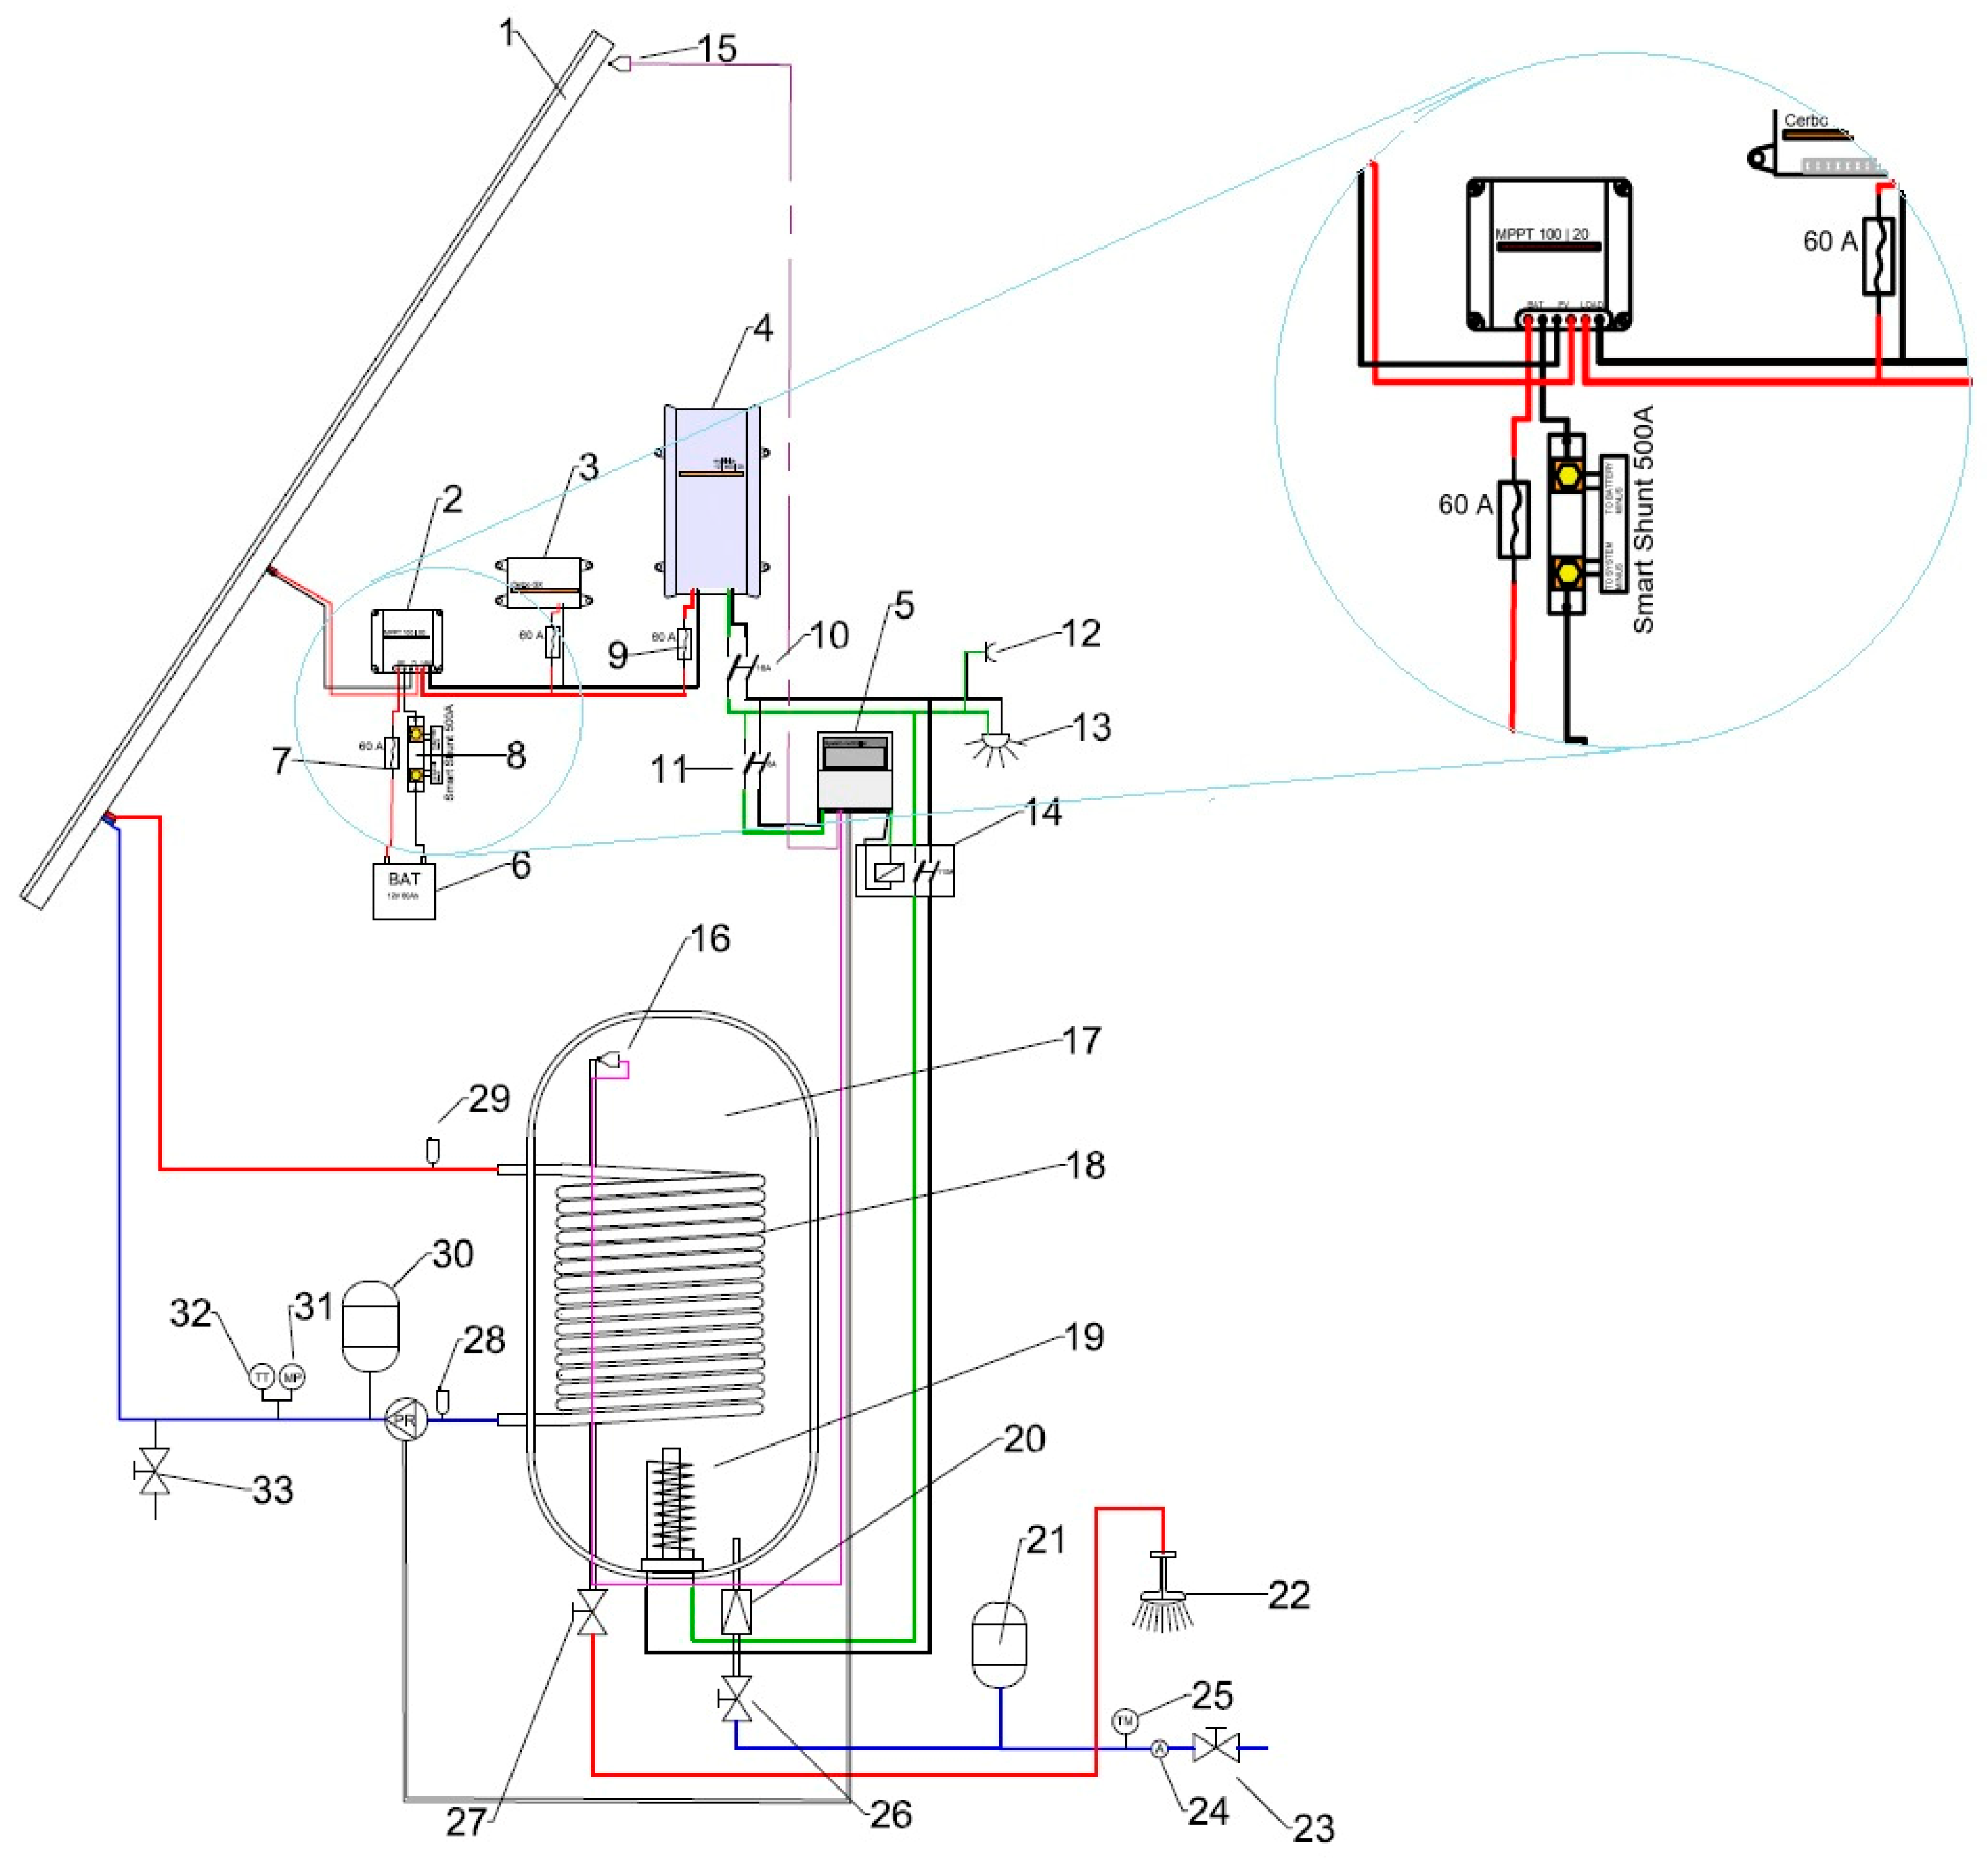
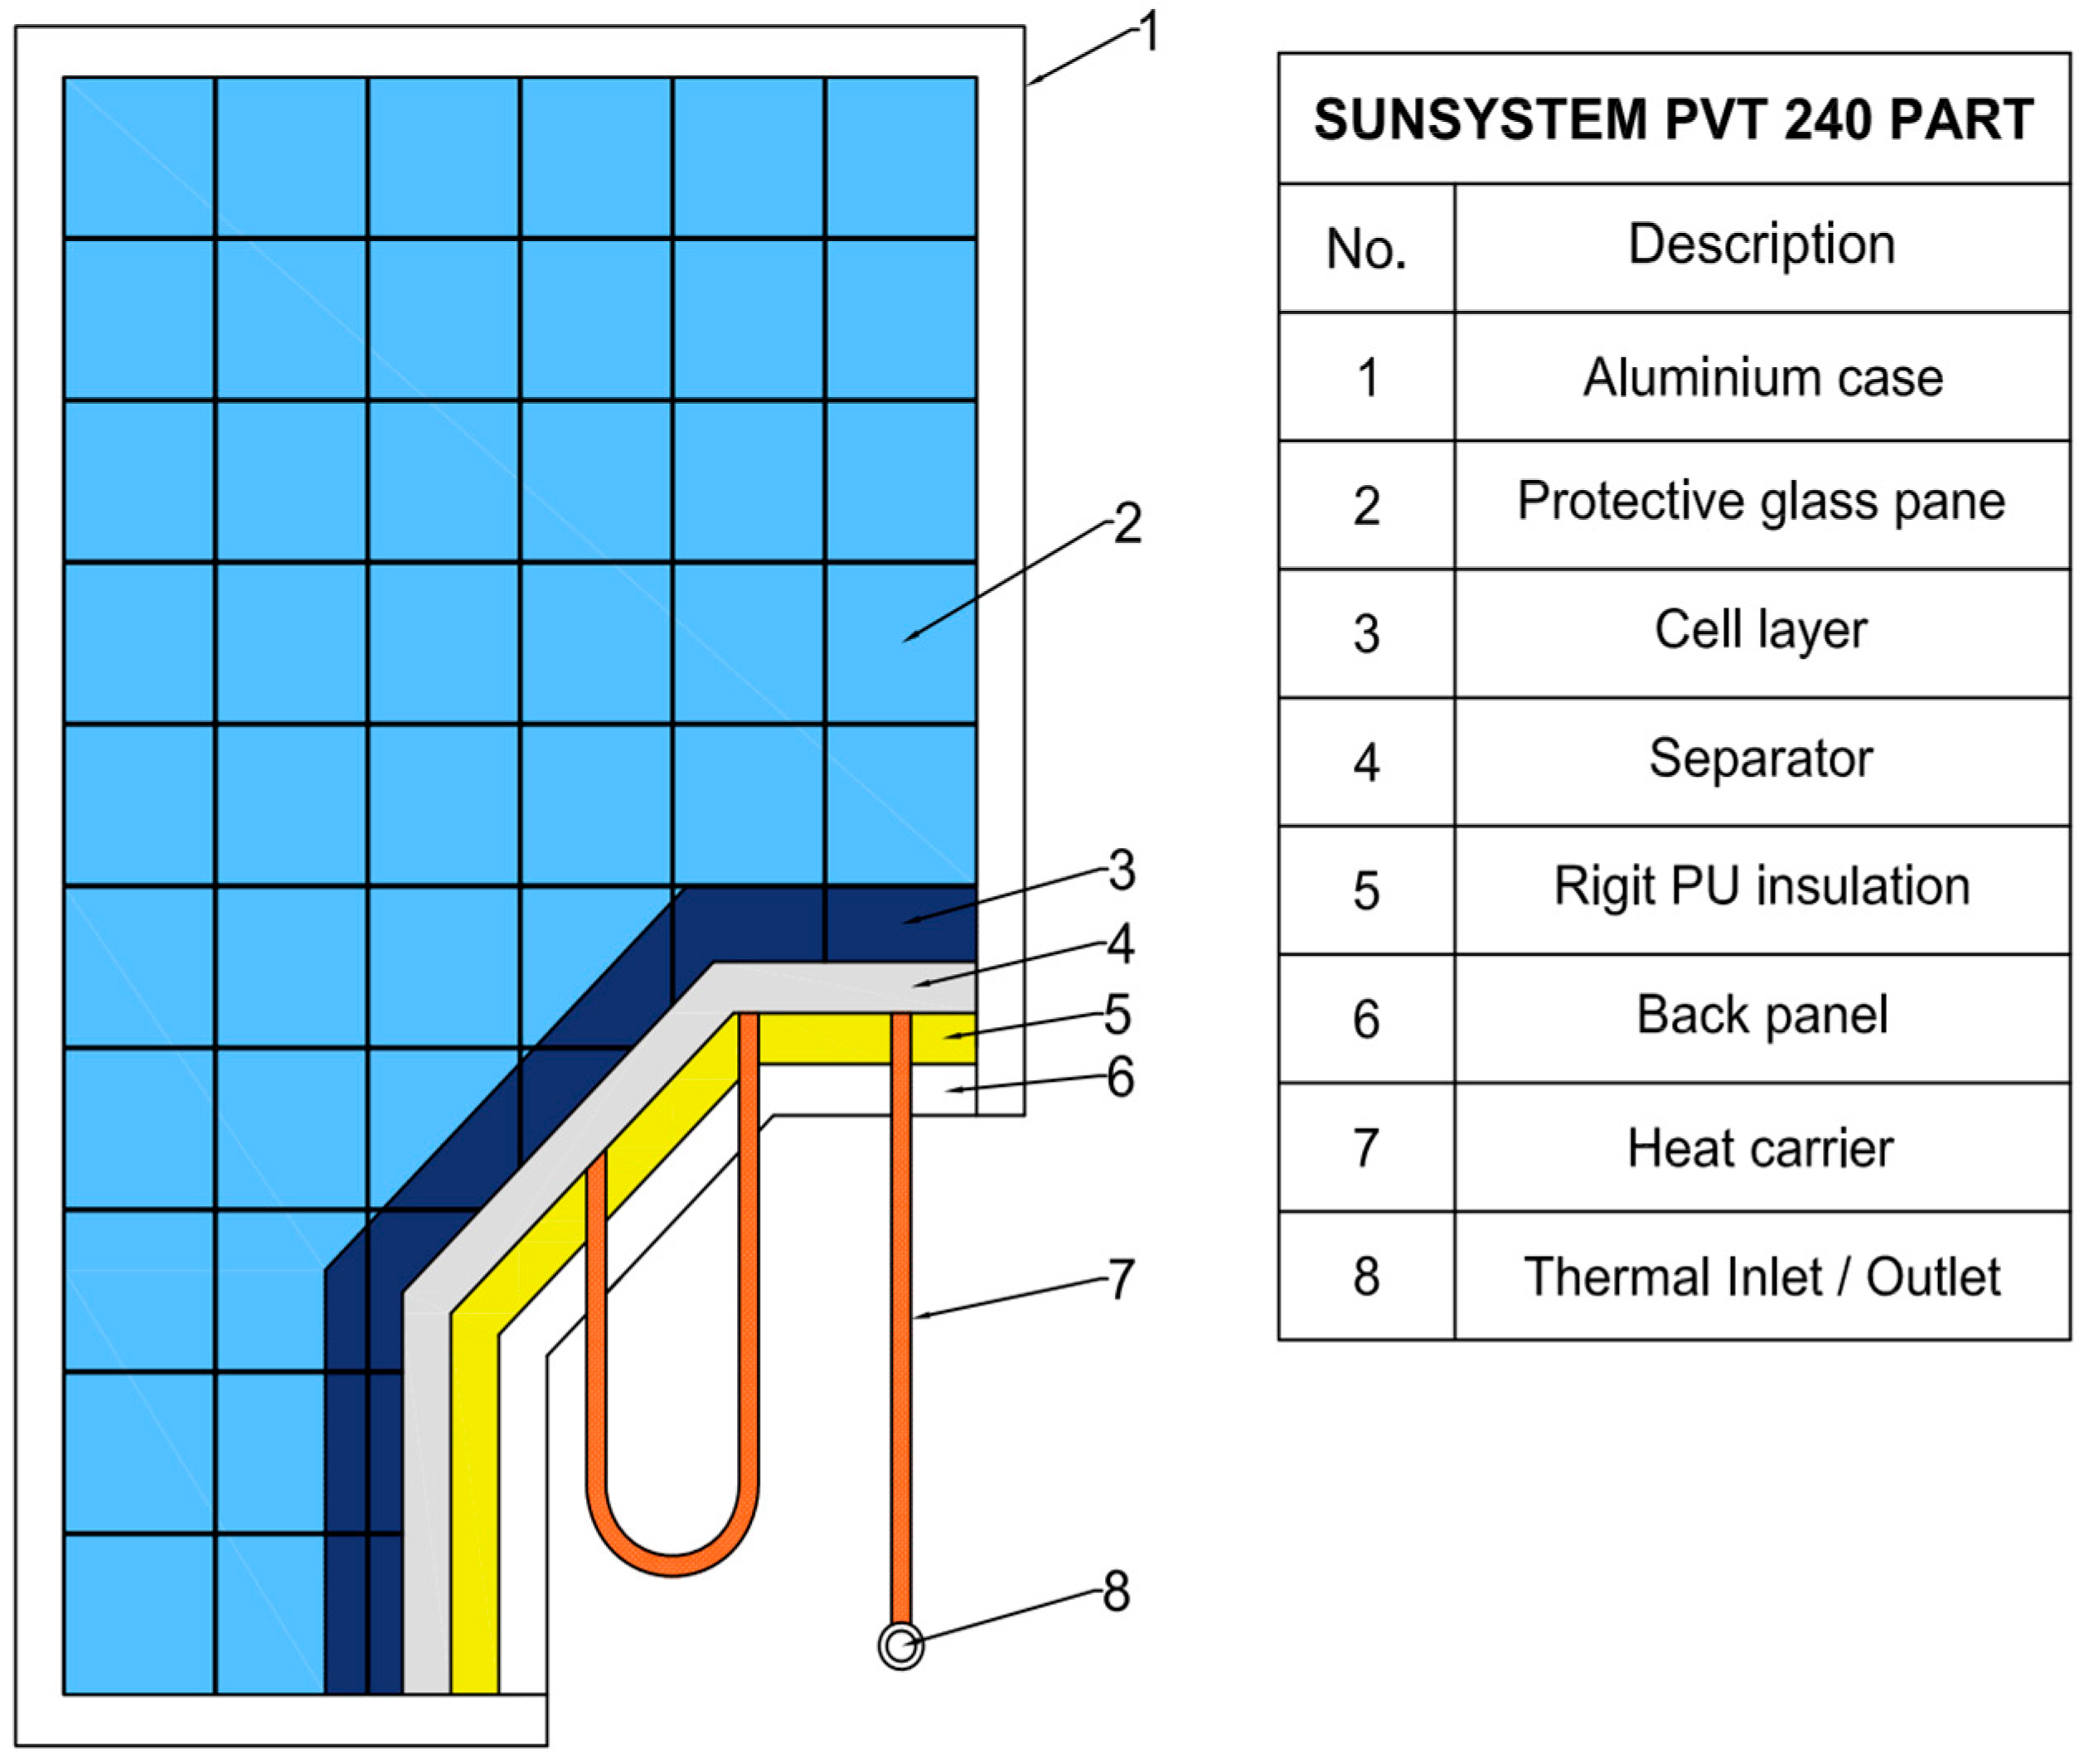
2.1. Test Stand Description
2.2. Experimental Measurements
- Amprobe Solar-100 Solar power meter, Fluke, accuracy +/−10 W/m2.
- Multimetrix digital pyranometer SPM 72, accuracy +/−10 W/m2.
2.3. Mathematical Modeling of the System
- The material properties of the components of the PV/T panel were constant;
- The glass cover was at a uniform temperature;
- A steady-state system (Model 1) and quasi-steady-state system (Model 2) were considered;
- Uniform wind speed surrounded the PV/T panel;
- Negligible heat loss and pressure drop in the system;
- The water flow was uniform during operation;
- The thermal inertia of the PV/T system was not considered;
- PV/T panel was not located in a shaded area.
2.4. Model 1: Analytical Calculation
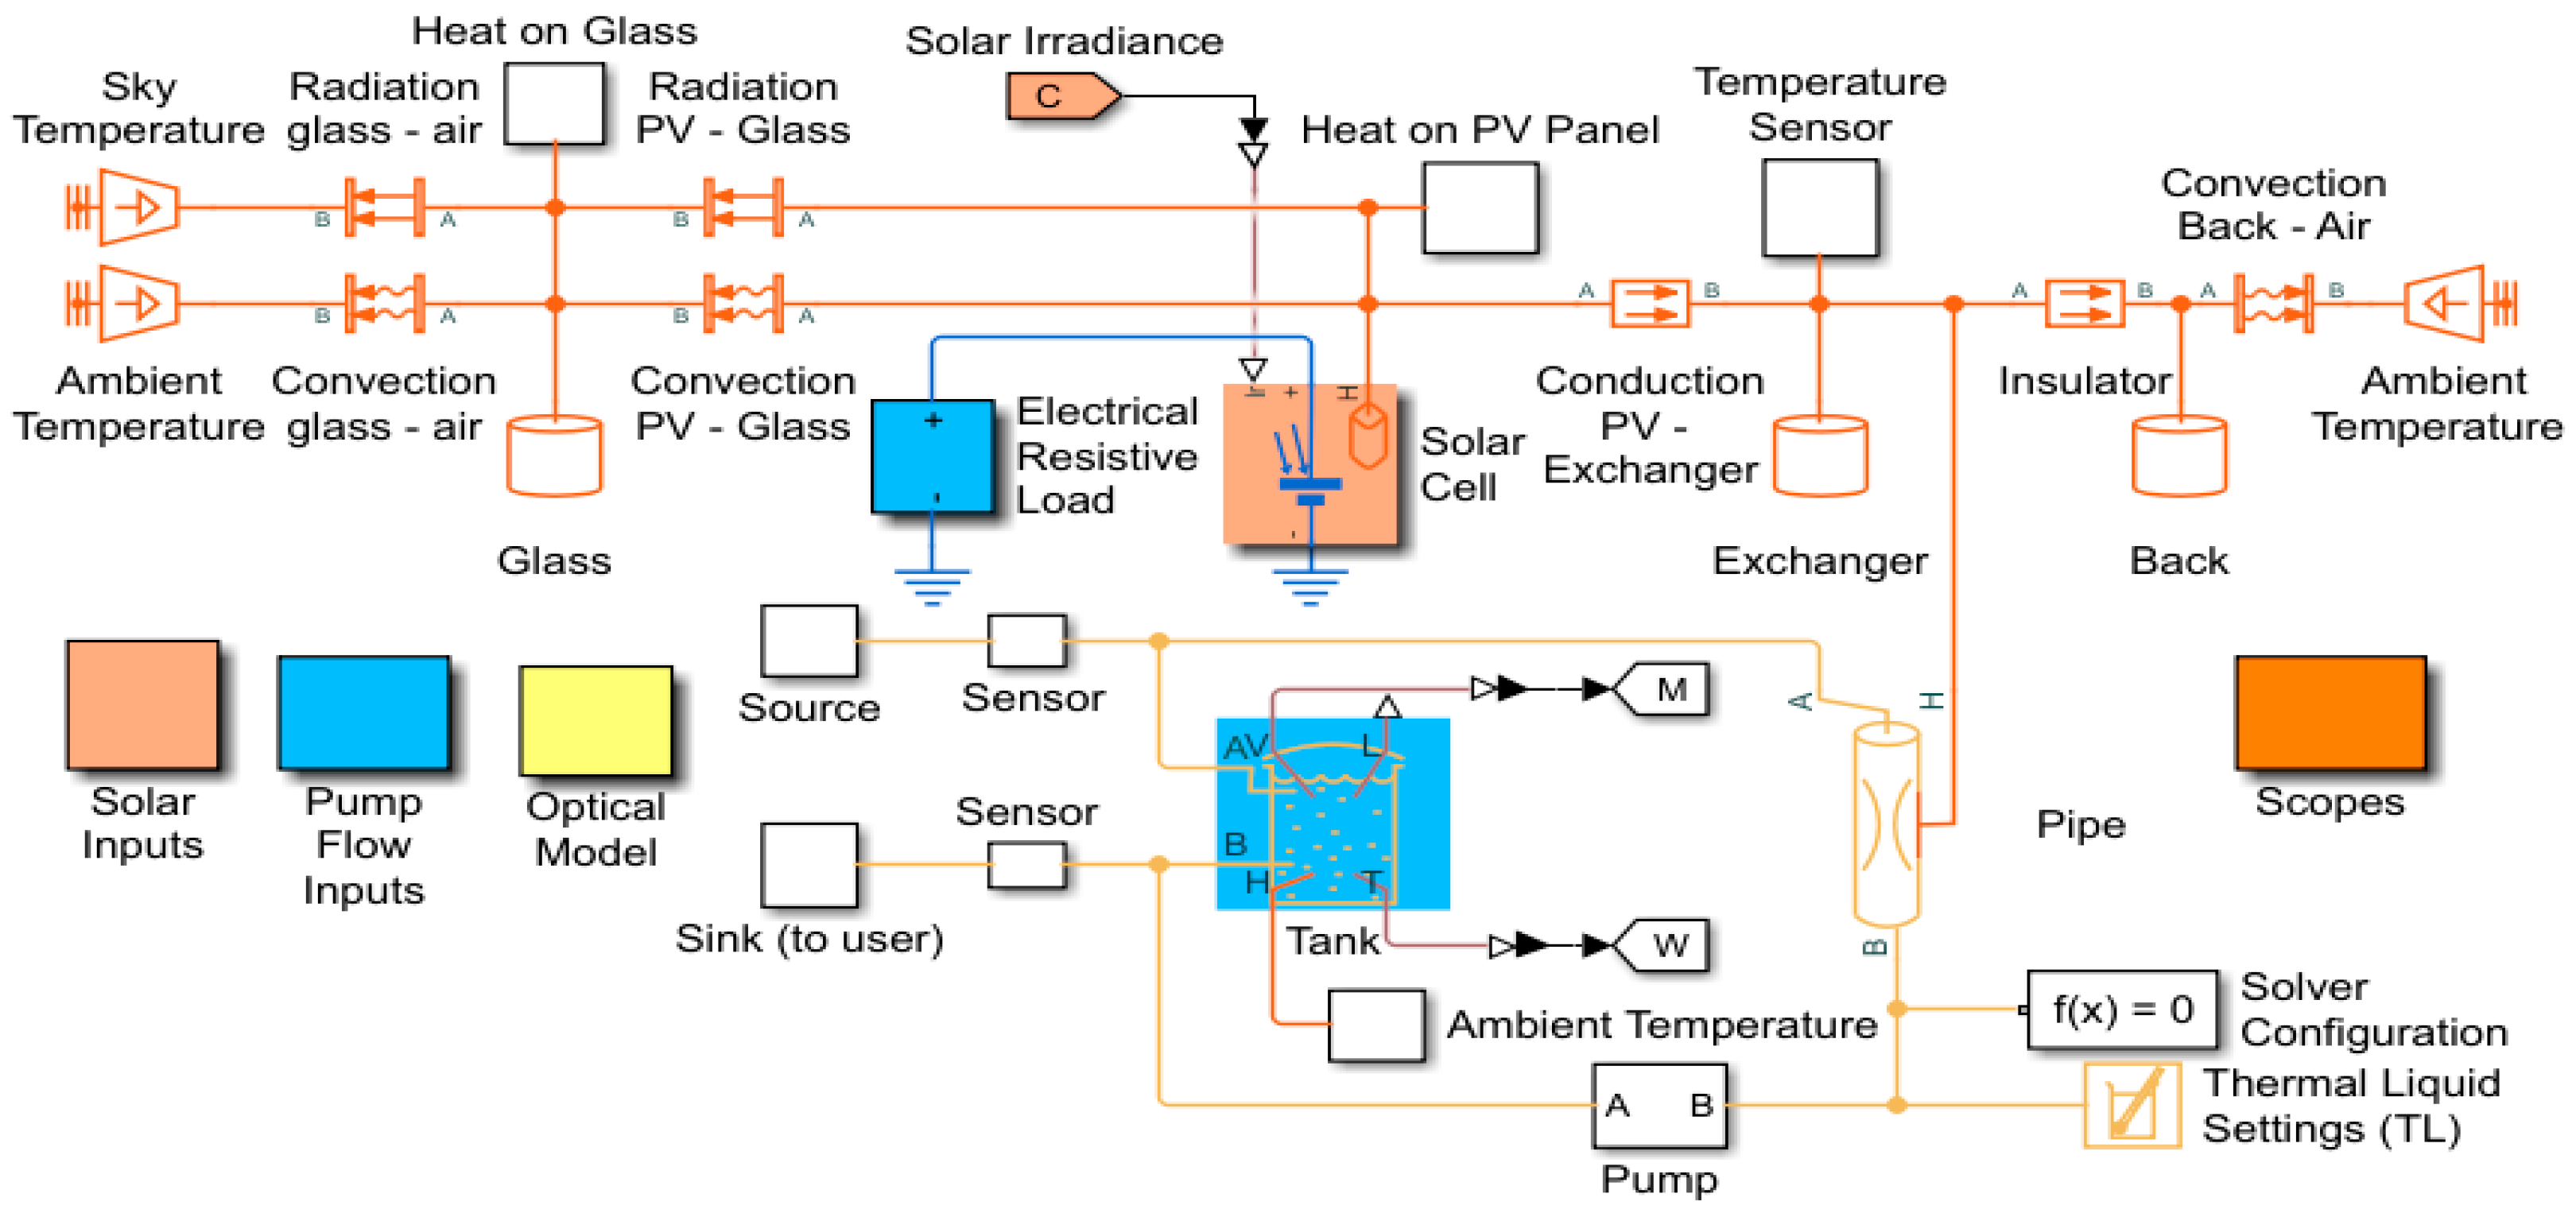
2.5. Model 2: Modeling and Simulation in Matlab/Simulink
2.5.1. Thermal Modeling
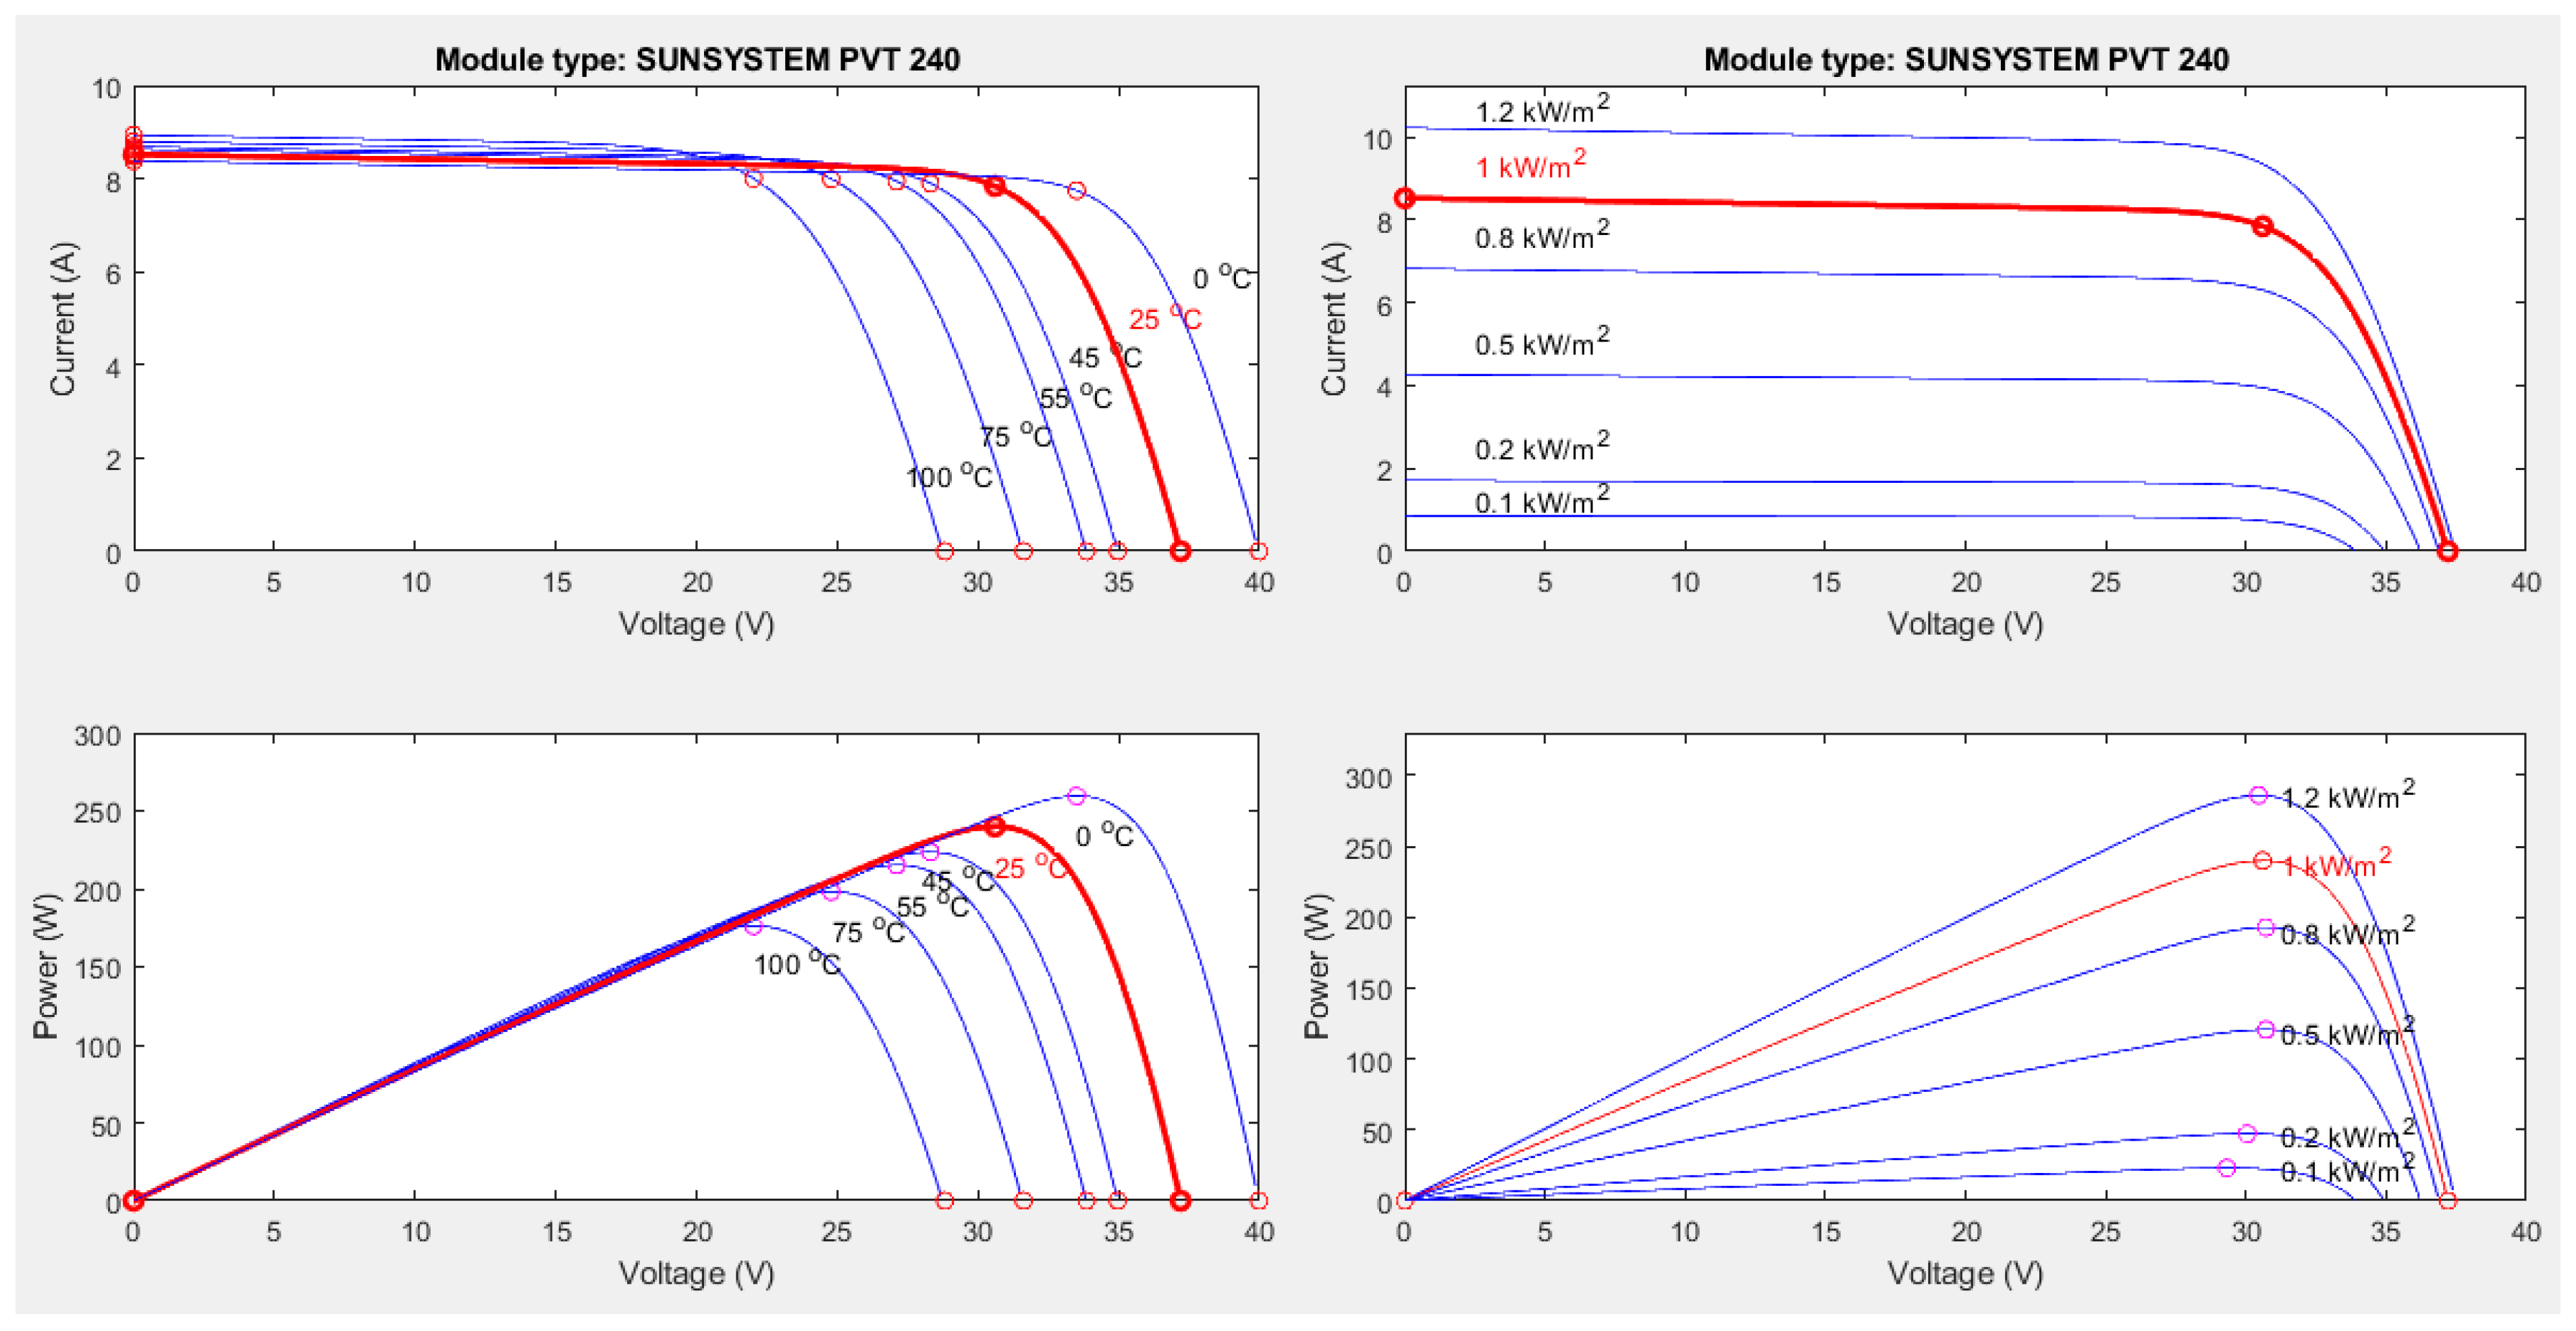
2.5.2. Electrical Modeling: Solar Cell Modeling
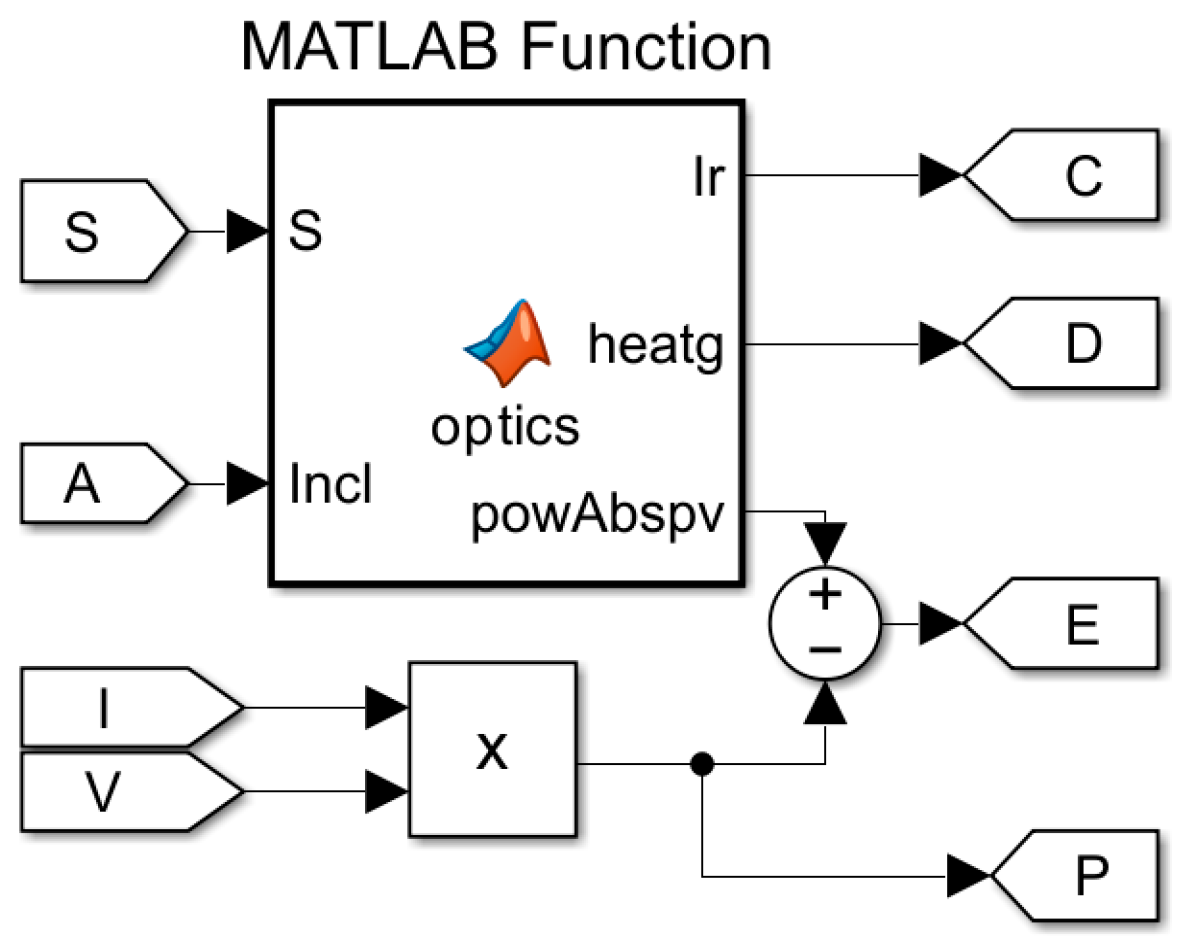
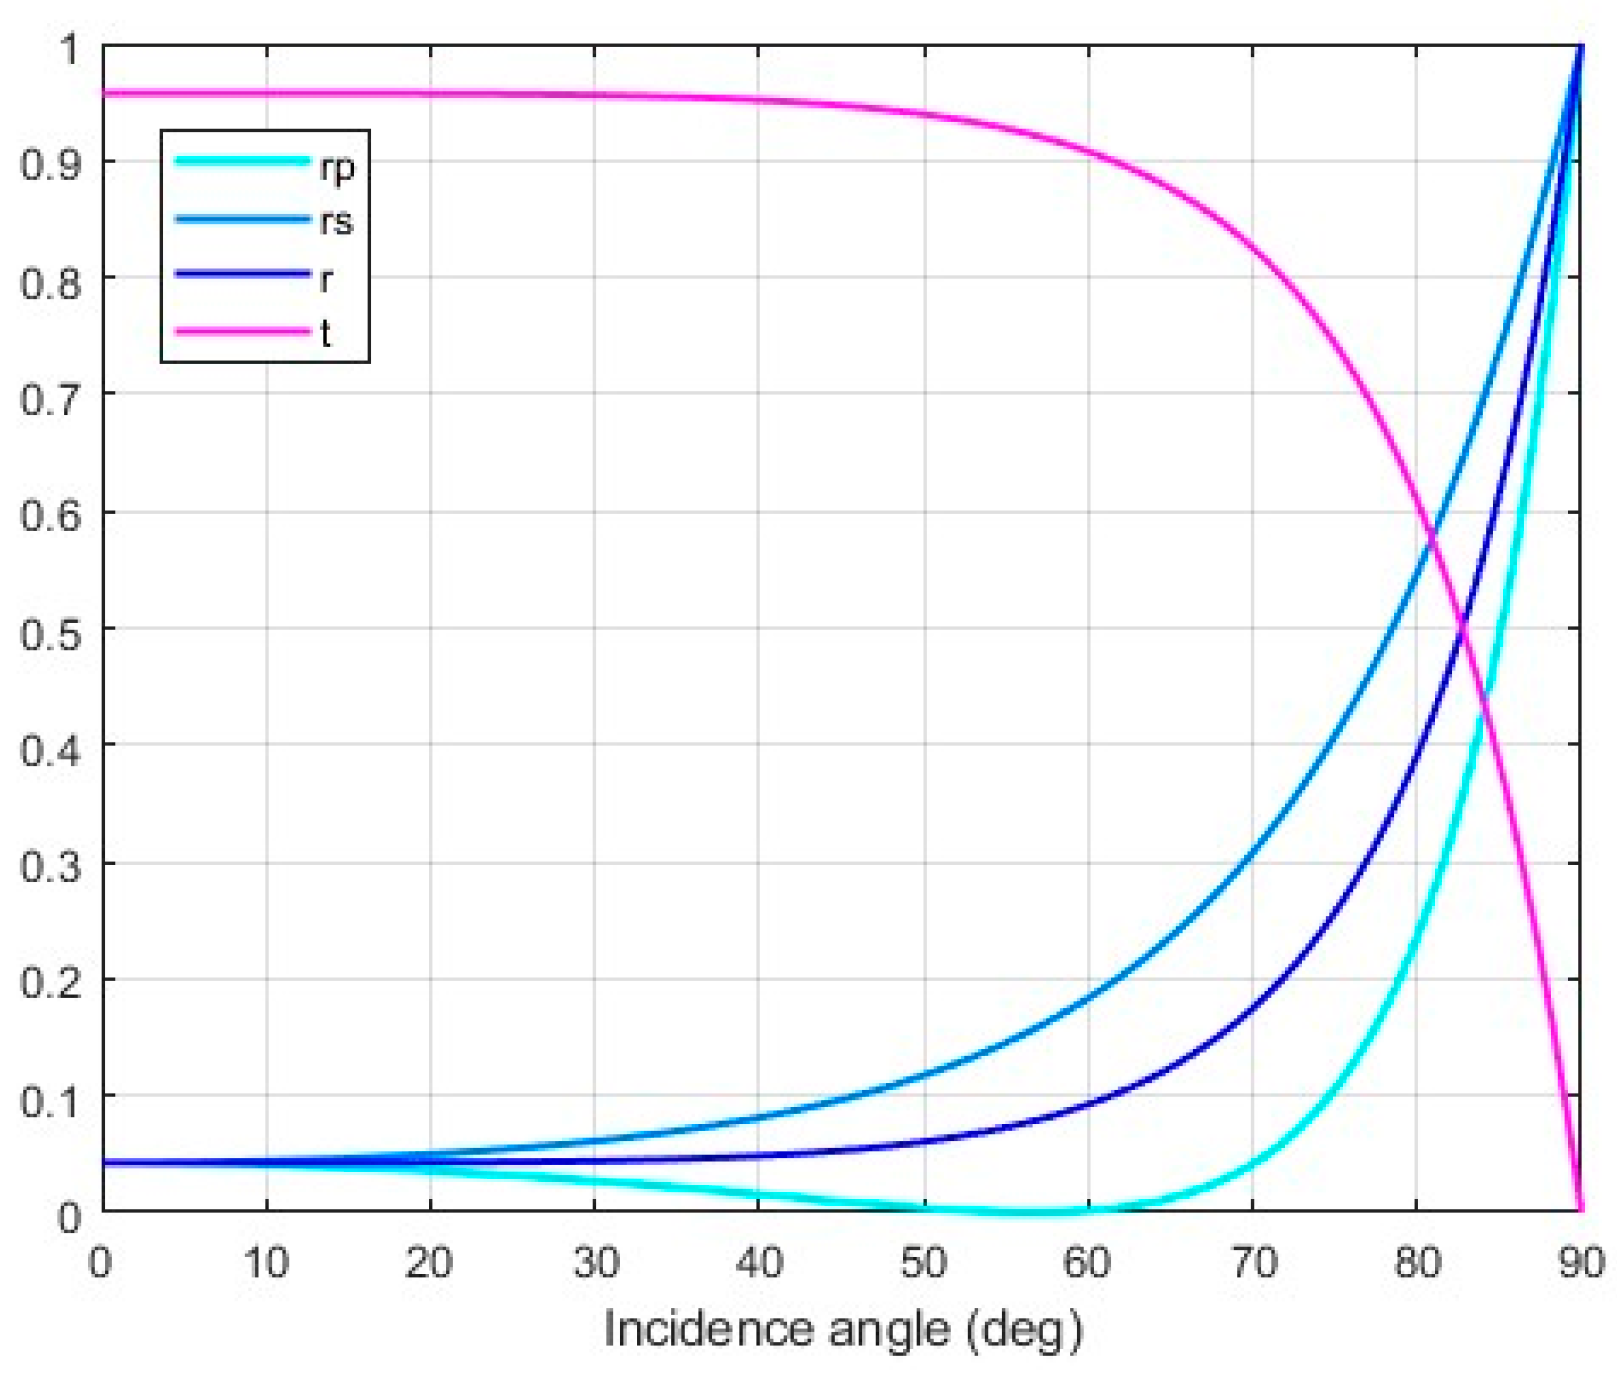
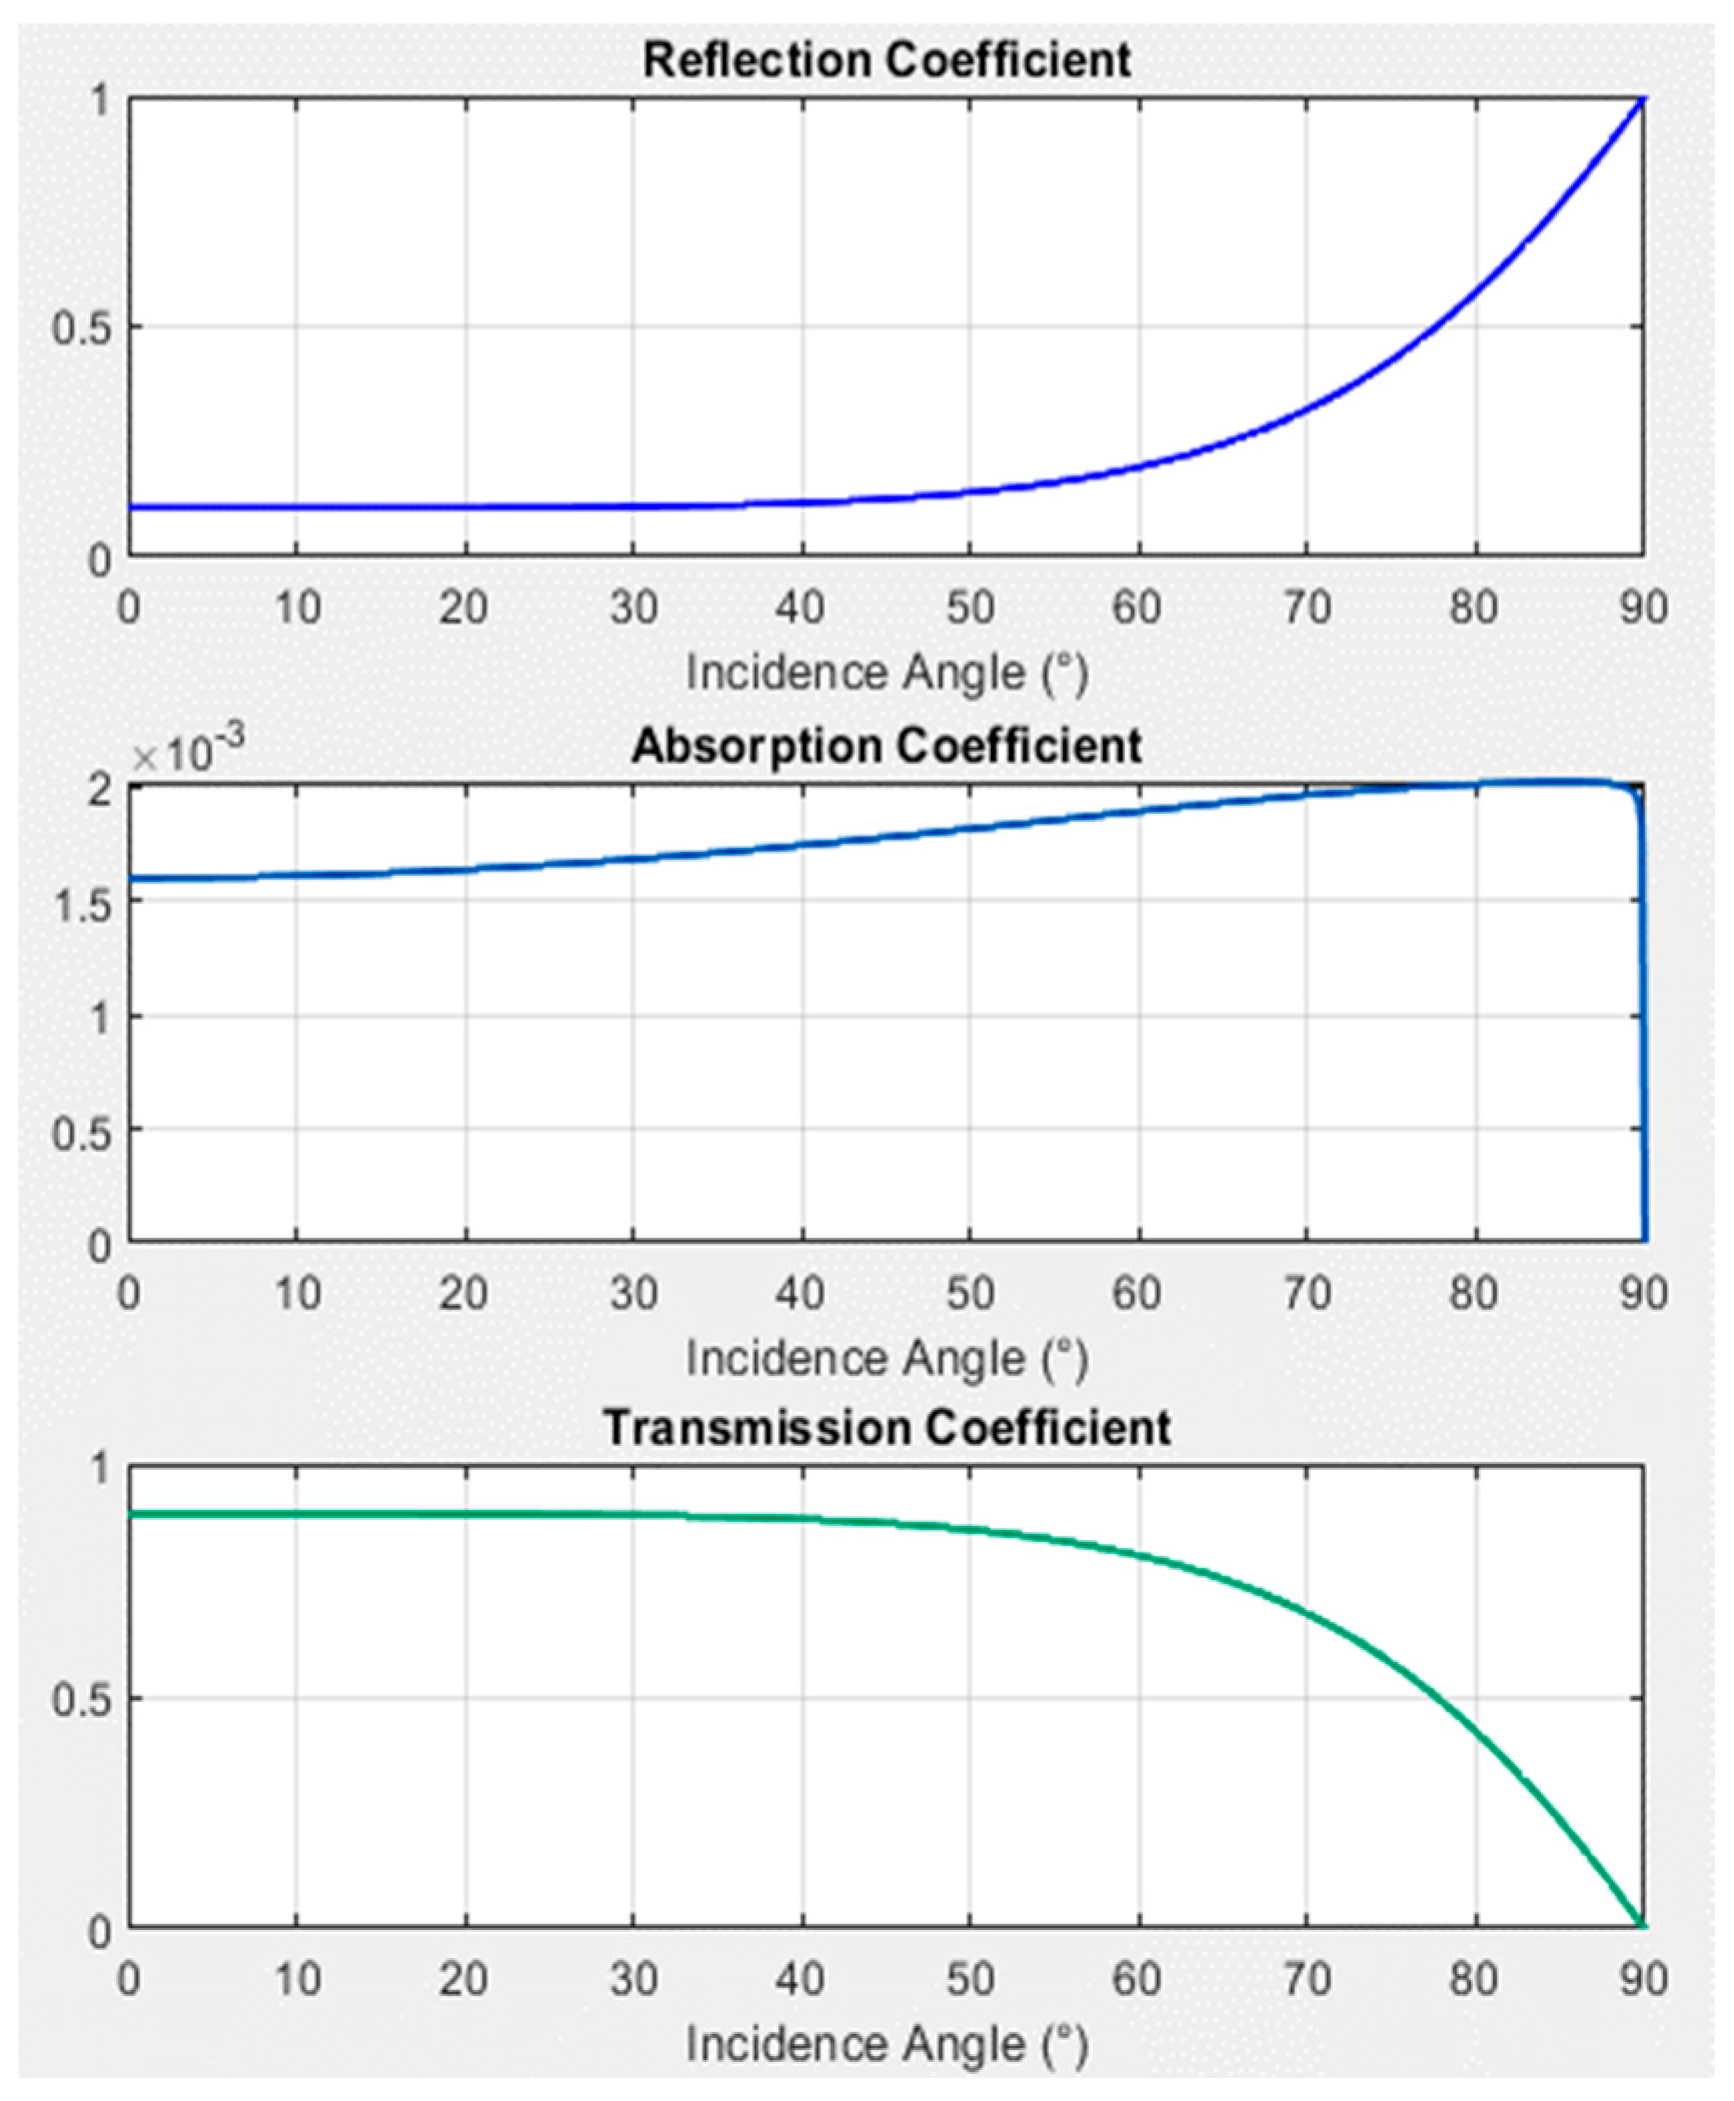
2.5.3. Optical Model for the Glass Cover
2.5.4. Optical Characteristics of Glass Cover
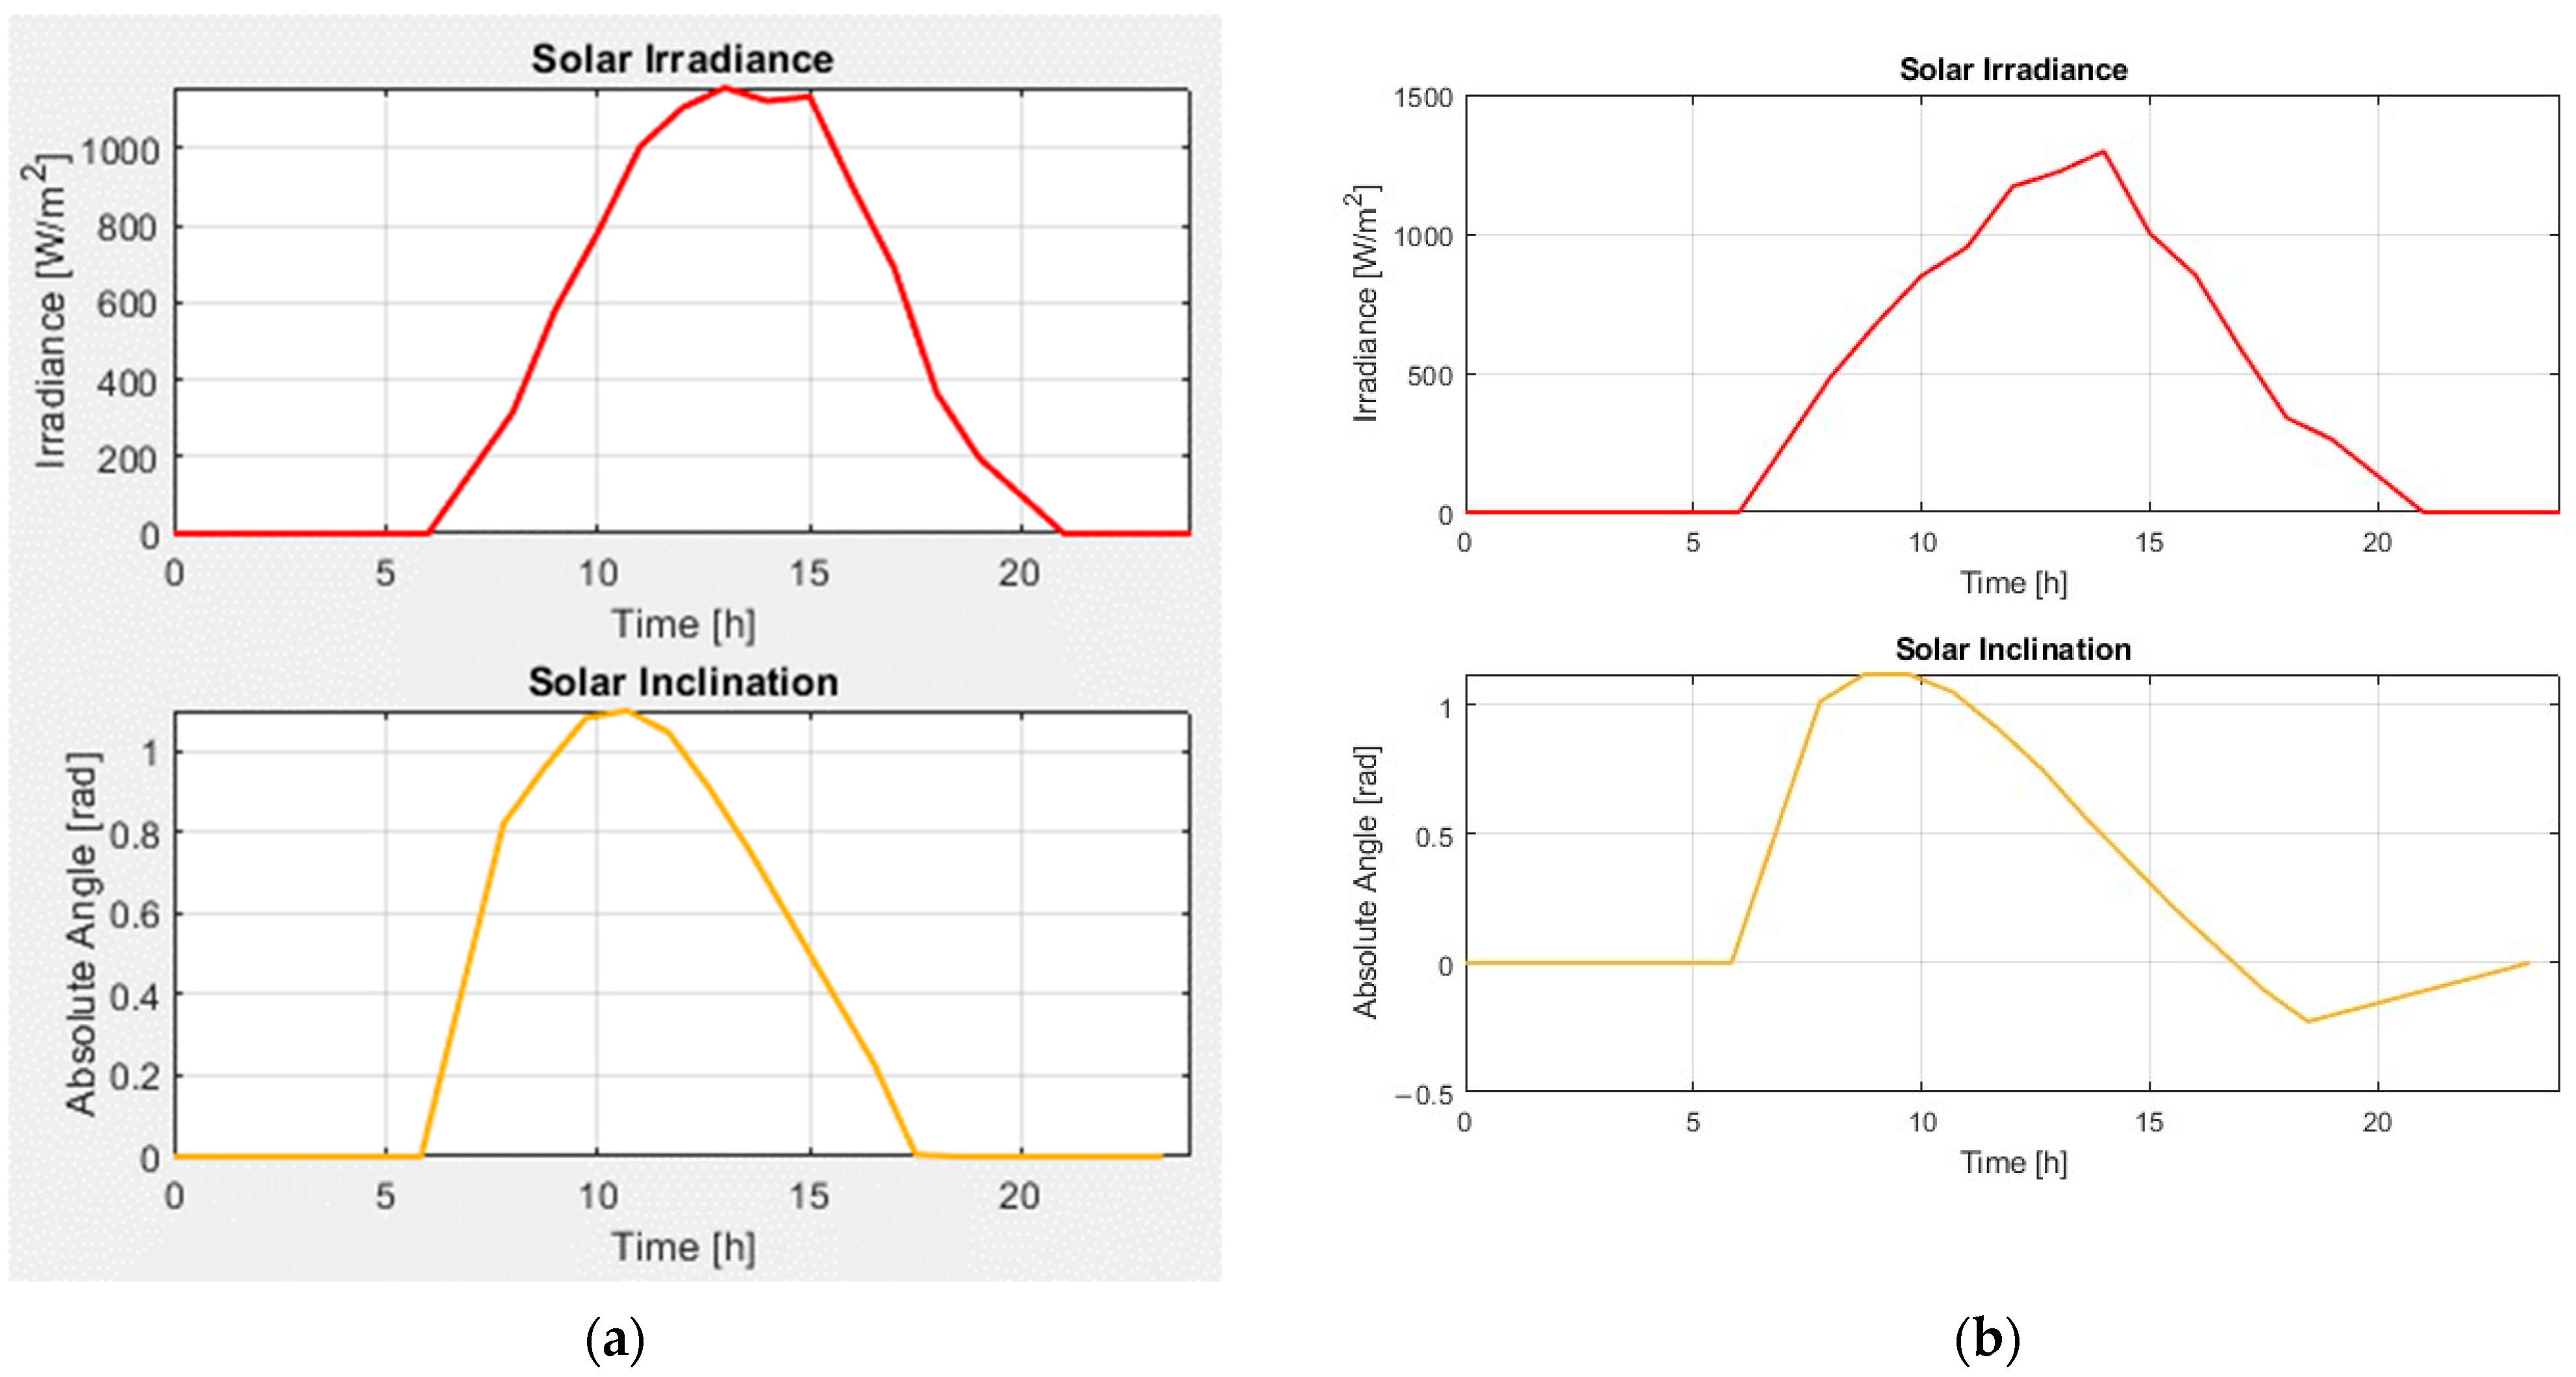
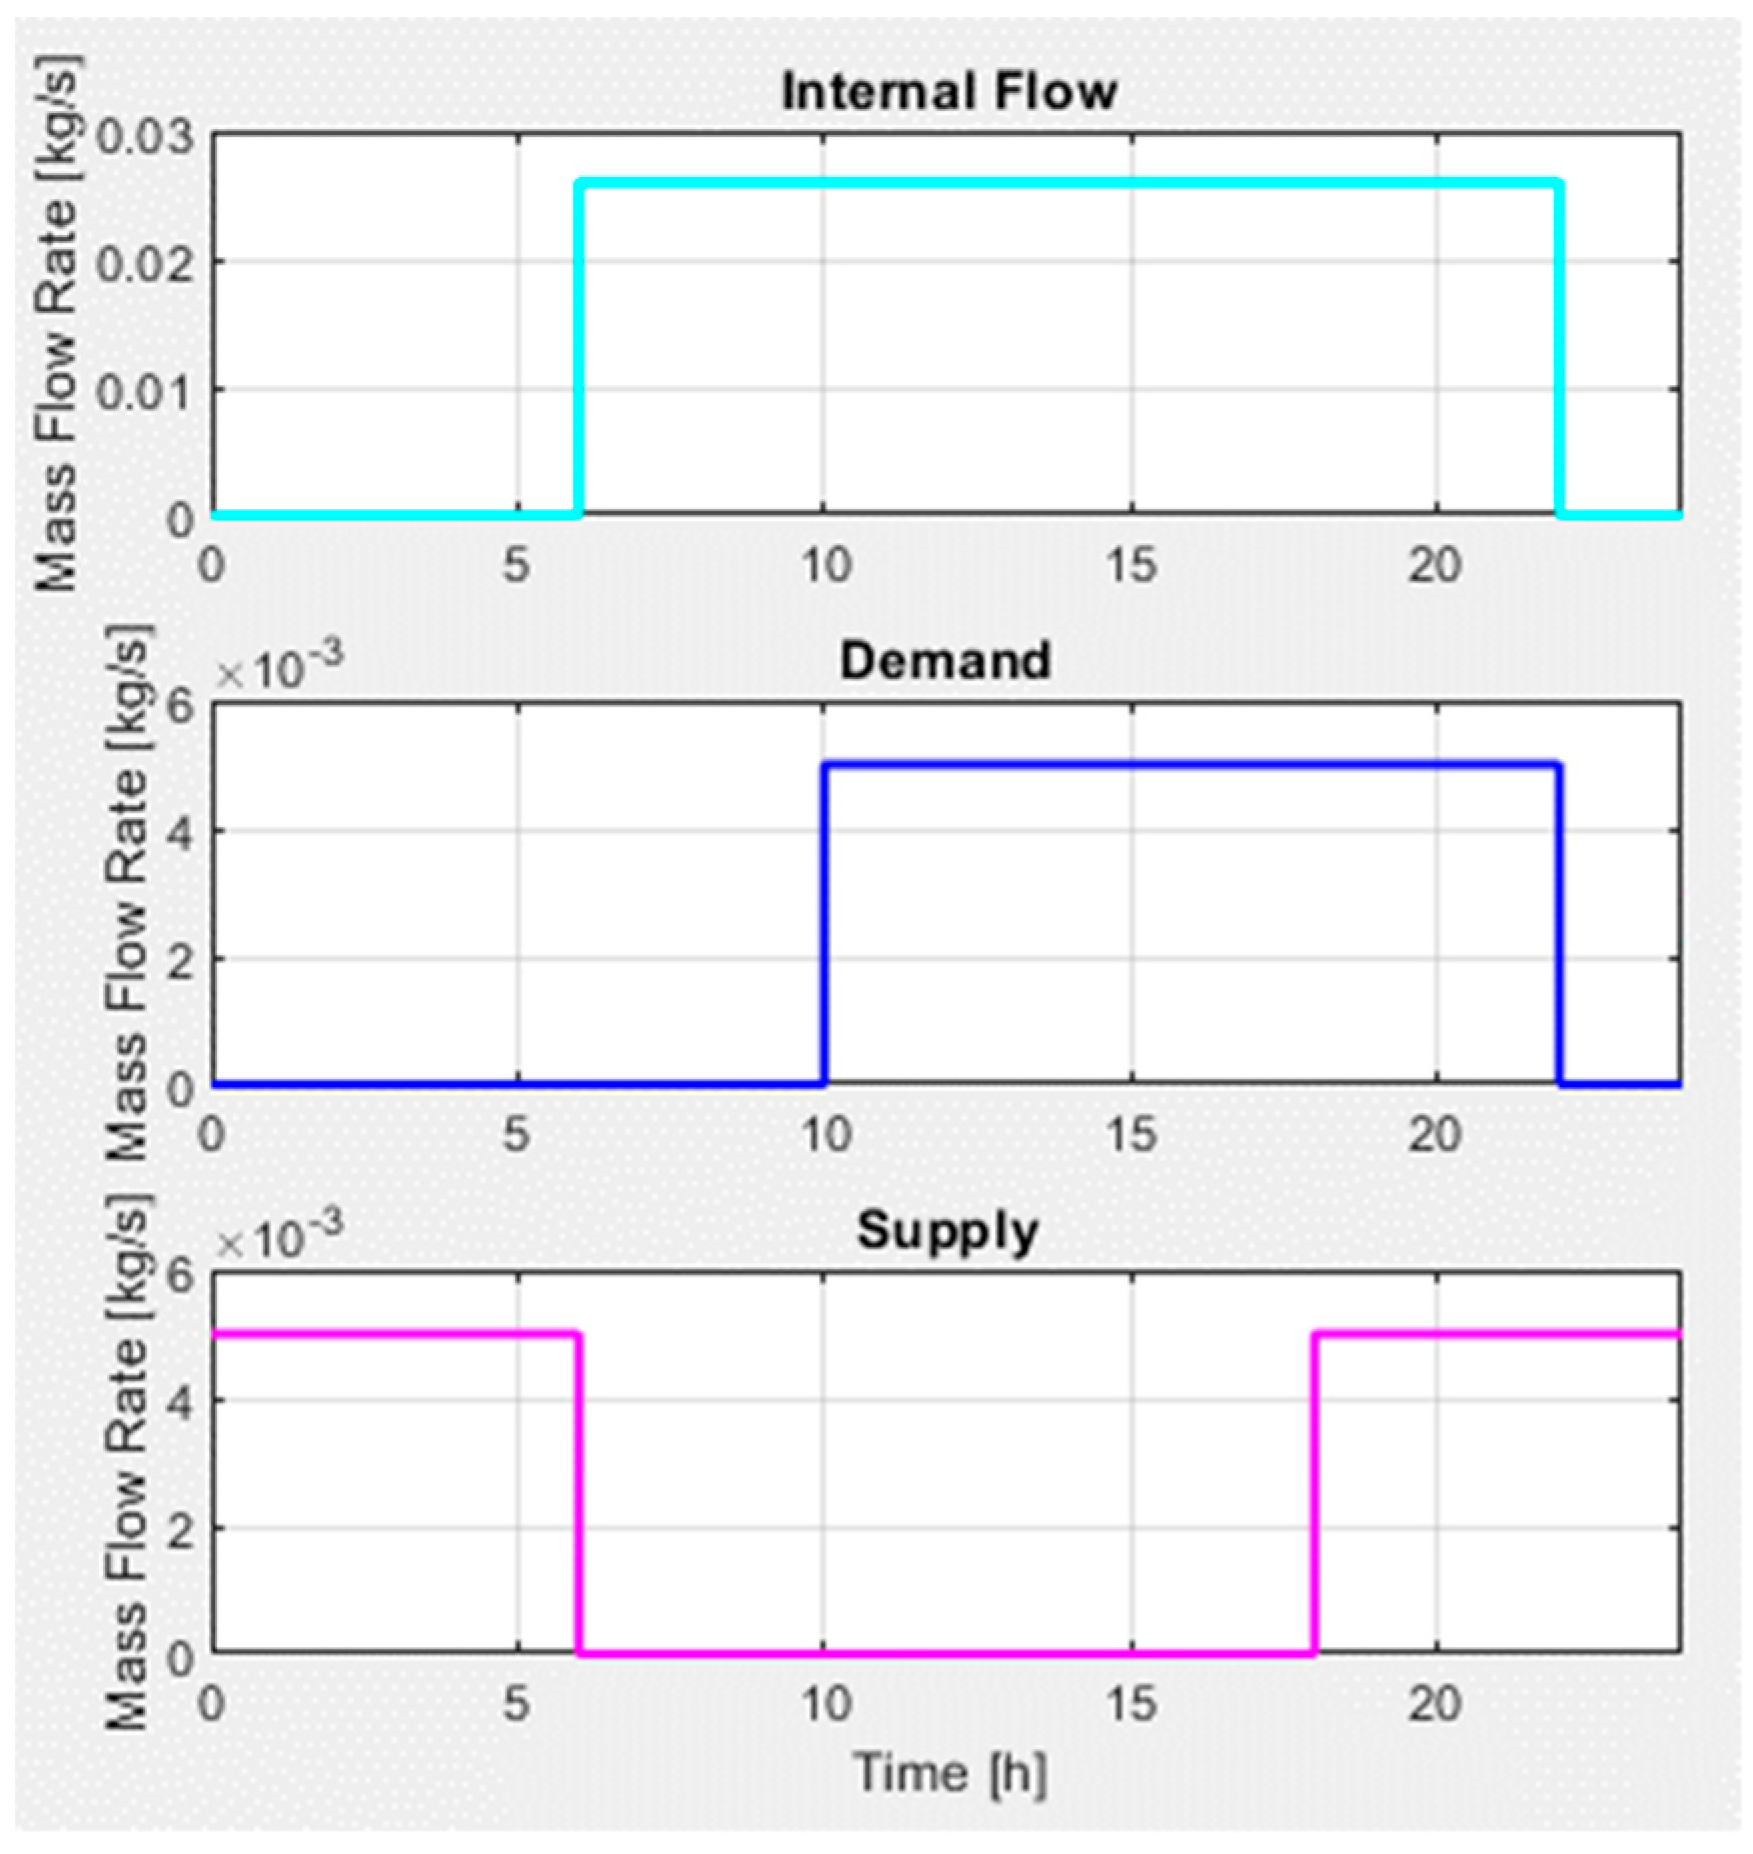
2.5.5. PV/T System Model Inputs
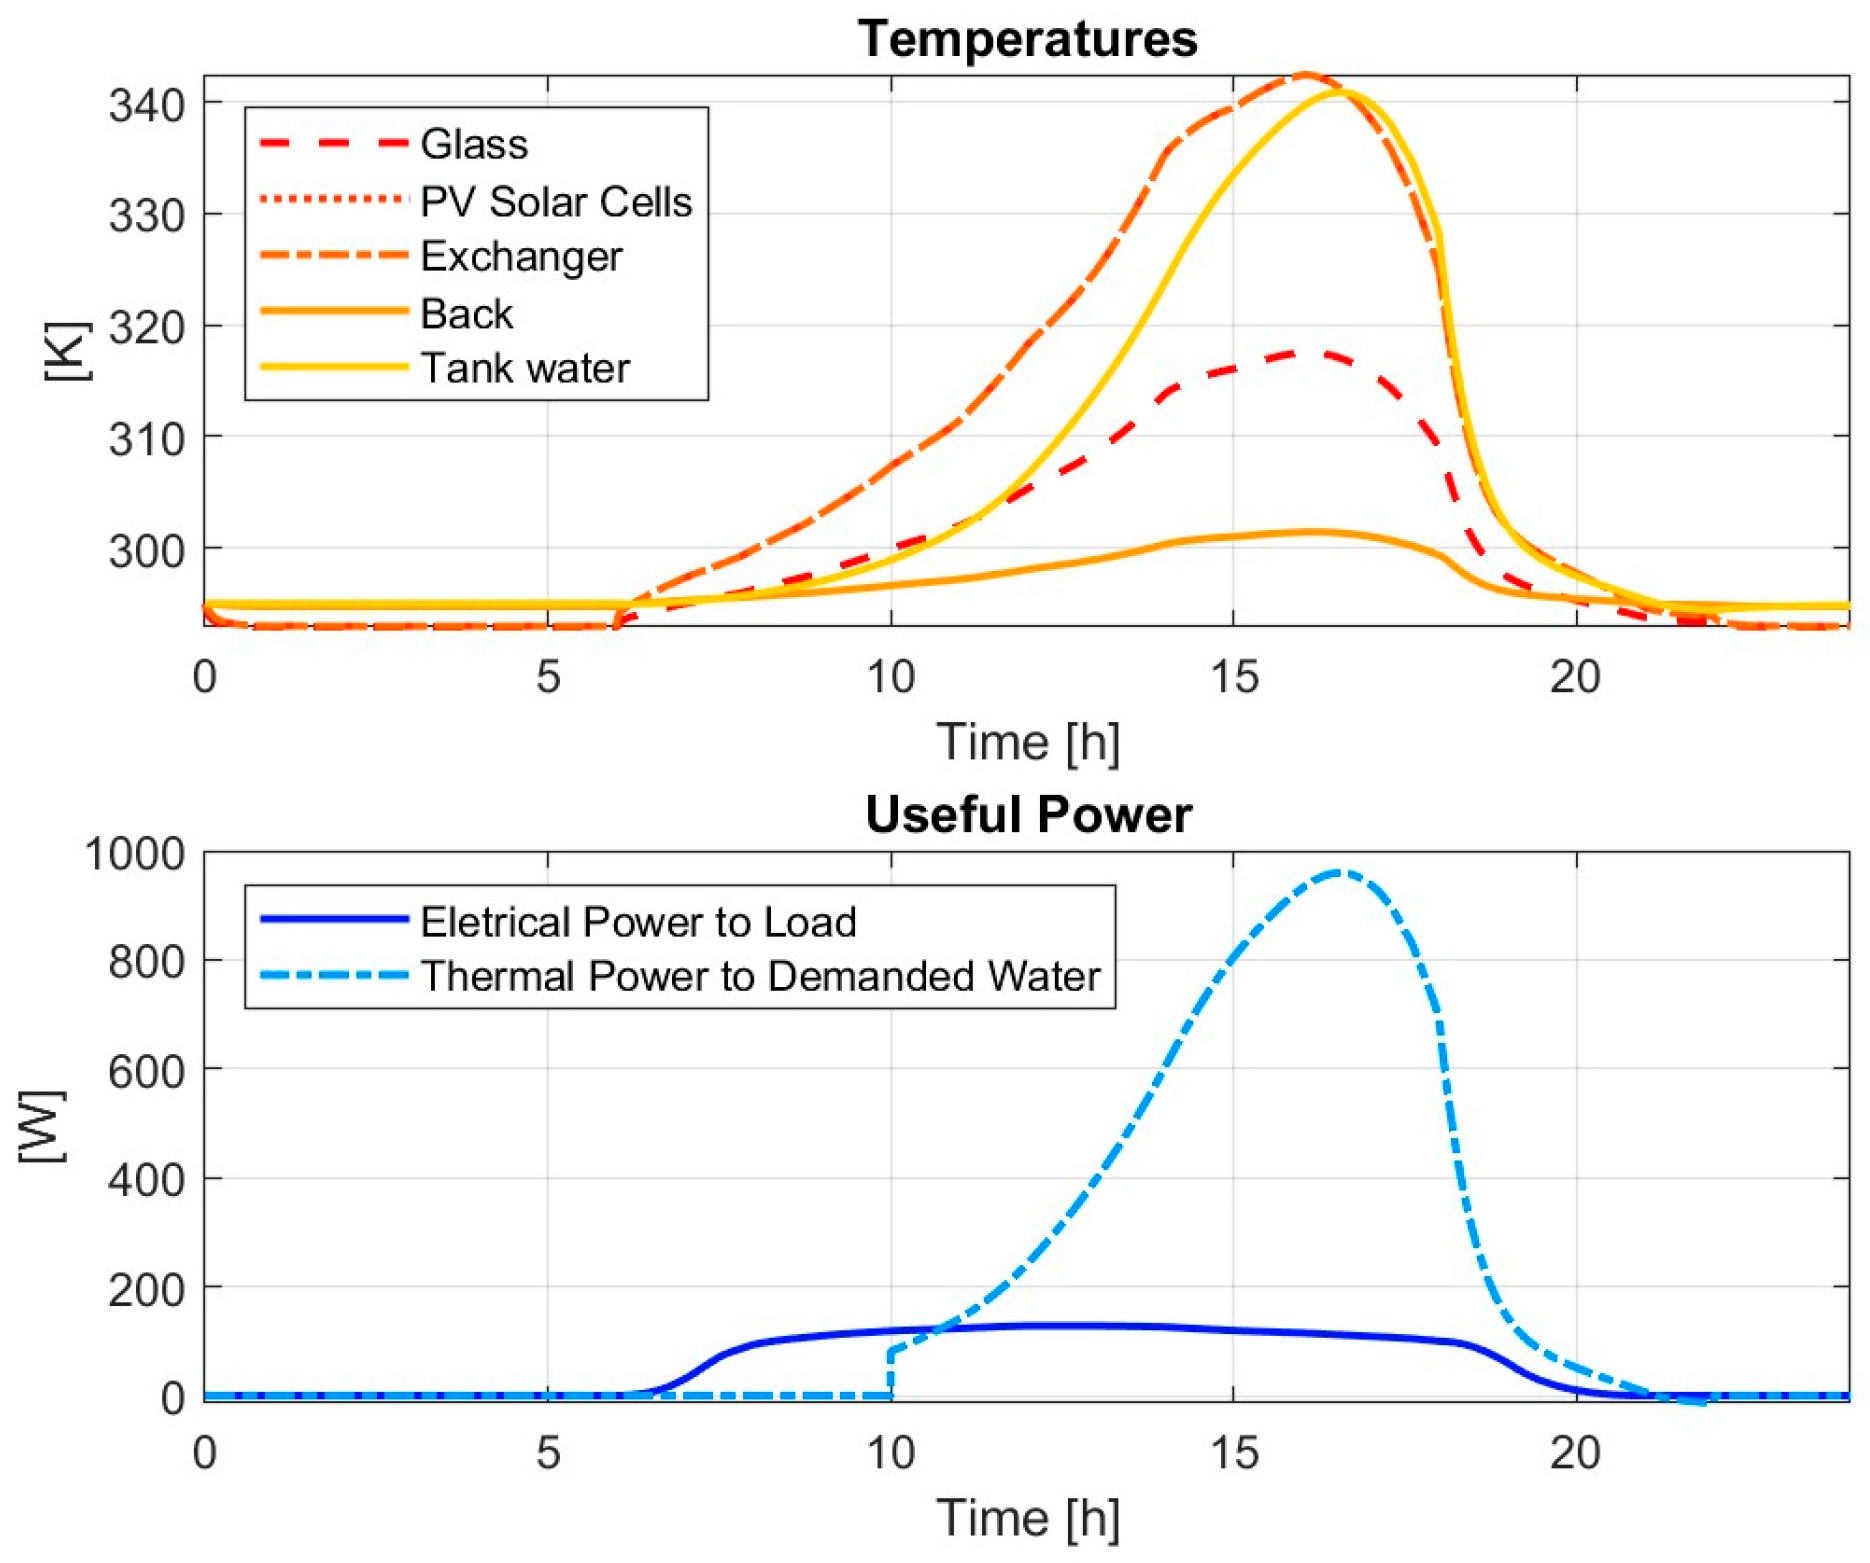
3. Results and Discussion
4. Conclusions
Author Contributions
Funding
Data Availability Statement
Conflicts of Interest
References
- OurWorldInData.org. Available online: https://ourworldindata.org/grapher/sub-energy-fossil-renewables-nuclear (accessed on 28 January 2024).
- Ritchie, H.; Rosado, P.; Roser, M. Energy Production and Consumption, Published online at OurWorldInData.org. 2020. Available online: https://ourworldindata.org/energy-production-consumption (accessed on 28 January 2024).
- Badea, A.; Necula, H.; Coordinators. Surse Regenerabile de Energie; Editura AGIR: Bucharest, Romania, 2013. [Google Scholar]
- Directive (EU) 2023/2413 of the European Parliament and of the Council of 18 October 2023 Amending Directive (EU) 2018/2001, Regulation (EU) 2018/1999 and Directive 98/70/EC as Regards the Promotion of Energy from Renewable Sources, and Repealing Council Directive (EU) 2015/652. Available online: https://eur-lex.europa.eu/legal-content/EN/TXT/?uri=CELEX%3A32023L2413&qid=1699364355105 (accessed on 28 January 2024).
- Irimia, O.; Tomozei, C.; Panainte-Lehadus, M.; Dinu, M.C. Evaluation of the potential of wind energy as a source of electricity generation: Case study—Vanatori Wind Power Plant. In Proceedings of the 2020 7th International Conference on Energy Efficiency and Agricultural Engineering (EE&AE), Ruse, Bulgaria, 12–14 November 2020. [Google Scholar] [CrossRef]
- Chandrasekar, M.; Senthilkumar, T. Five decades of evolution of solar photovoltaic thermal (PVT) technology—A critical insight on review articles. J. Clean. Prod. 2021, 322, 128997. [Google Scholar] [CrossRef]
- Tiwari, A.K.; Chatterjee, K.; Agrawal, S.; Singh, G.K. A comprehensive review of photovoltaic-thermal (PVT) technology: Performance evaluation and contemporary development. Energy Rep. 2023, 10, 2655–2679. [Google Scholar] [CrossRef]
- Motoasca, M.; de la Fontaine, C.; Vermeulen, B. Photovoltaic-Thermal (PV/T) Hybrid Systems State-of-the-Art Technology, Challenges and Opportunities. 2018. Available online: https://www.interregsolarise.eu/wp-content/uploads/2018/12/FINAL-SOLARISE-EVENT-18_10-2018-presPVT.pdf (accessed on 28 January 2024).
- Diwania, S.; Agrawal, S.; Siddiqui, A.S.; Singh, S. Photovoltaic–thermal (PV/T) technology: A comprehensive review on applications and its advancement. Int. J. Energy Environ. Eng. 2020, 11, 33–54. [Google Scholar] [CrossRef]
- Furbo, S.; Perers, B.; Dragsted, J.; Gomes, J.; Gomes, M.; Coelho, P.; Yıldızha, H.; Yilmaz, I.H.; Aksay, B.; Bozkurt, A.; et al. Best Practices for PVT Technology. In Proceedings of the SWC 2021: ISES Solar World Congress, Virtual Conference, 25–29 October 2021. [Google Scholar]
- Kramer, K. Status Quo of PVT Characterization, SHC Task 60—Report B1. Available online: https://task60.iea-shc.org/Data/Sites/1/publications/IEA-SHC-Task60-B1-Status-Quo-Report-PVT-Characterization.pdf (accessed on 31 January 2023).
- Sciubba, E.; Toro, C. Modeling and Simulation of a Hybrid PV/Thermal Collector. In Proceedings of the 24th International Conference on Efficiency, Cost, Optimization, Simulation and Environmental Impact of Energy Systems, ECOS 2011, Novi Sad, Serbia, 4–7 July 2011. [Google Scholar]
- Ouhsiane, L.; Siroux, M.; Ganaoui, M.E.; Mimet, A. Multi-Objective Optimization of Hybrid PVT Solar Panels. In Proceedings of the 2018 International Conference and Utility Exhibition on Green Energy for Sustainable Development (ICUE), Phuket, Thailand, 24–26 October 2018; pp. 1–5. [Google Scholar] [CrossRef]
- Barbu, M.; Darie, G.; Siroux, M. Analysis of a Residential Photovoltaic-Thermal (PVT) System in Two Similar Climate Conditions. Energies 2019, 12, 3595. [Google Scholar] [CrossRef]
- Bandaru, S.H.; Becerra, V.; Khanna, S.; Radulovic, J.; Hutchison, D.; Khusainov, R. A Review of Photovoltaic Thermal (PVT) Technology for Residential Applications: Performance Indicators, Progress, and Opportunities. Energies 2021, 14, 3853. [Google Scholar] [CrossRef]
- Rosli, M.A.M.; Misha, S.; Sopian, K.; Mat, S.; Sulaiman, M.Y.; Salleh, E. Thermal Efficiency of the Photovoltaic Thermal System with Serpentine Tube Collector. Eng. Environ. Sci. Appl. Mech. Mater. 2014, 699, 455–461. [Google Scholar] [CrossRef]
- Ben cheikh el hocine, H.; Touafek, K.; Kerrour, F.; Haloui, H.; Khelifa, A. Model Validation of an Empirical Photovoltaic Thermal (PV/T) Collector. Energy Procedia 2015, 74, 1090–1099. [Google Scholar] [CrossRef]
- Nualboonrueng, T.; Tuenpusa, P.; Ueda, Y.; Akisawa, A. Field Experiments of PV-Thermal Collectors for Residential Application in Bangkok. Energies 2012, 5, 1229–1244. [Google Scholar] [CrossRef]
- Hazi, A.; Hazi, G.; Grigore, R.; Vernica, S. Opportunity to use PVT systems for water heating in industry. Appl. Therm. Eng. 2014, 63, 151–157. [Google Scholar] [CrossRef]
- A Photovoltaic Thermal Panel for Heat-Pump Houses. Available online: https://www.pv-magazine.com/2020/04/20/a-photovoltaic-thermal-panel-for-heat-pump-houses/ (accessed on 28 January 2024).
- Tsai, H.L. Design and Evaluation of a Photovoltaic/Thermal-Assisted Heat Pump Water Heating System. Energies 2014, 7, 3319–3338. [Google Scholar] [CrossRef]
- Ghazy, M.; Ibrahim, E.M.M.; Mohamed, A.S.A.; Askalany, A.A. Cooling technologies for enhancing photovoltaic–thermal (PVT) performance: A state of the art. Int. J. Energy Environ. Eng. 2022, 13, 1205–1235. [Google Scholar] [CrossRef]
- Pokorny, N.; Matuška, T. Glazed Photovoltaic-thermal (PVT) Collectors for Domestic Hot Water Preparation in Multifamily Building. Sustainability 2020, 12, 6071. [Google Scholar] [CrossRef]
- Barbu, M.; Minciuc, E.; Frusescu, D.C.; Tutica, D. Integration of Hybrid Photovoltaic Thermal Panels (PVT) in the District Heating System of Bucharest, Romania. In Proceedings of the 2021 10th International Conference on ENERGY and ENVIRONMENT (CIEM), Bucharest, Romania, 14–15 October 2021. [Google Scholar] [CrossRef]
- Kandilli, C. A comparative study on the energetic- exergetic and economical performance of a photovoltaic thermal system (PVT). Res. Eng. Struct. Mater. 2019, 5, 75–89. [Google Scholar] [CrossRef]
- Al Tarabsheh, A.; Etier, I.; Fath, H.; Ghazal, A.; Morci, Y.; Asad, M.; El Haj, A. Performance of photovoltaic cells in photovoltaic thermal (PVT) modules. IET Renew. Power Gener. 2016, 10, 1017–1023. [Google Scholar] [CrossRef]
- Hazi, A.; Grigore, R.; Hazi, G. Energy Efficiency of the PVT System Used in Industry. In Proceedings of the 2012 11th International Conference on Environment and Electrical Engineering, Venice, Italy, 18–25 May 2012; pp. 235–240. [Google Scholar] [CrossRef]
- Ngunzi, V.; Njoka, F.; Kinyua, R. Modeling, simulation and performance evaluation of a PVT system for the Kenyan manufacturing sector. Heliyon 2023, 9, e18823. [Google Scholar] [CrossRef] [PubMed]
- Arabkoohsar, A.; Xie, G.; Wei, J.; Asok, A.; Behzadi, A.; Mahian, O. Perspectives and review of photovoltaic-thermal panels in net-zero energy buildings. J. Therm. Anal. Calorim. 2022, 147, 8621–8630. [Google Scholar] [CrossRef]
- Hazi, A.; Hazi, G.; Grigore, R. Performance Optimization of a PVT That Is Integrated into an Industrial Company. Bul. AGIR 2012, 3, 185–190. Available online: https://www.agir.ro/buletine/1382.pdf (accessed on 28 January 2024).
- Brahim, T.; Jemni, A. PVT Solar Collector Assessment Using Matlab/Simulink. In Advances in Thermal Science and Energy; Ali-Toudert, F., Draoui, A., Halouani, K., Hasnaoui, M., Jemni, A., Tadrist, L., Eds.; JITH 2022. Lecture Notes in Mechanical Engineering; Springer: Cham, Switzerland. [CrossRef]
- Tiwari, G.N.; Tiwari, A.; Shyam. Handbook of Solar Energy, Theory, Analysis and Applications; Energy Systems in Electrical Engineering; Springer: Singapore, 2016. [Google Scholar] [CrossRef]
- SUNSYSTEM, Solar Thermal System, Catalogue. pp. 16–18. Available online: https://www.amadeuscom.ro/wp-content/uploads/2021/08/Catalog-panouri-solare-Sunsystem.pdf (accessed on 28 January 2024).
- Engineers Edge. Available online: https://www.engineersedge.com/heat_transfer/thermal_conductivity_propylene_glycol_15916.htm (accessed on 3 February 2024).
- Chow, T.T. A review on photovoltaic/thermal hybrid solar technology. Appl. Energy 2010, 87, 365–379. [Google Scholar] [CrossRef]
- Fujisawa, T.; Tatsuo, T. Annual exergy evaluation on photovoltaic-thermal hybrid collector. Sol. Energy Mater. Sol. Cells 1997, 47, 135–148. [Google Scholar] [CrossRef]
- Lateef Abdullah, A.; Misha, S.; Tamaldin, N.; Afzanizam, M.; Rosli, M.; Sachit, F.A. Hybrid Photovoltaic Thermal PVT Solar Systems Simulation via Simulink/Matlab. CFD Lett. 2019, 11, 64–78. [Google Scholar]
- SR EN ISO 9806-2017; Solar Thermal Collectors, Test Methods. International Organization for Standardization: Geneva, Switzerland, 2017.
- Boureima, D.; Sikoudouin, T.M.K.; Ouedraogo, E.; Hayibo, K.S.; Bathiebo, D.J. Theoretical Study of a Thermal Photovoltaic Hybrid Solar Collector. Indian J. Sci. Technol. 2018, 11, 1–9. [Google Scholar] [CrossRef]
- The MathWorks, Inc. Photovoltaic Thermal (PV/T) Hybrid Solar Panel. Matlab Help Center. 2023. Available online: https://www.mathworks.com/help/sps/ug/photovoltaic-thermal-pvt-hybrid-solar-panel.html (accessed on 25 July 2023).
- Grigore, R.M.; Vernica, S.G.; Popa, S.E.; Banu, I.V. PVT Hybrid Solar Panel—Simulink Model and Dataset. IEEE Dataport 2024. [Google Scholar] [CrossRef]
- Duffie, J.A.; Beckman, W.A. Solar Engineering of Thermal Processes, 4th ed.; Wiley: New York, NY, USA, 2013. [Google Scholar]
- Lontsi, K.A.; Tangka, J.K.; Djousse, K.B.M. Experimental study on the electrical and thermal characteristics of a hybrid photovoltaic/thermal water solar collector model using photovoltaic solar modules of different brands. Energy Convers. Manag. X 2022, 14, 100198. [Google Scholar] [CrossRef]
- Banu, I.V.; Istrate, M. Modeling and Simulation of Photovoltaic Arrays. World Energy System Conference—WESC 2012. Bul. AGIR 2012, 3, 161–166. Available online: http://www.agir.ro/buletine/1378.pdf (accessed on 25 July 2023).
- Banu, I.V.; Beniuga, R.; Istrate, M. Study on Temperature for Modeling of Photovoltaic Solar Array using Experimental Test Data. Acta Electroteh. 2013, 54, 51–54. [Google Scholar]
- Banu, I.V.; Istrate, M.; Machidon, D.; Pantelimon, R. Study regarding modeling photovoltaic arrays using test data in MATLAB/Simulink. UPB Sci. Bull. C Electr. Eng. Comput. Sci. 2015, 77, 227–234. Available online: https://www.scientificbulletin.upb.ro/rev_docs_arhiva/full83f_148621.pdf (accessed on 25 July 2023).
- Fatehi, J.H.; Sauer, K.J. Modeling the incidence angle dependence of photovoltaic modules in PVsyst. In Proceedings of the 2014 IEEE 40th Photovoltaic Specialist Conference (PVSC), Denver, CO, USA, 8–13 June 2014; pp. 1335–1338. [Google Scholar] [CrossRef]
- Santbergen, R.; van Zolingen, R.J.C. The absorption factor of crystalline silicon PV cells: A numerical and experimental study. Sol. Energy Mater Sol. Cells 2008, 92, 432–444. [Google Scholar] [CrossRef]
- Santbergen, R.; Goud, J.M.; Zeman, M.; van Roosmalen, J.A.M.; van Zolingen, R.J.C. The AM1.5 absorption factor of thin-film solar cells. Sol. Energy Mater Sol. Cells 2010, 94, 715–723. [Google Scholar] [CrossRef]
- Li, W.; Paul, M.; Rolley, M.; Sweet, T.; Gao, M.; Baig, H.; Fernandez, E.; Mallick, T.; Montecucco, A.; Siviter, J.; et al. A coupled optical-thermal-electrical model to predict the performance of hybrid PV/T-CCPC roof-top systems. Renew. Energy 2017, 112, 166–186. [Google Scholar] [CrossRef]
- Ji, Y.; Xu, Q.; Riggs, B.; Islam, K.; Ollanik, A.; Ermer, J.H.; Krut, D.D.; Romanin, V.; Codd, D.; Escarra, M.D. Optical Design and Validation of an Infrared Transmissive Spectrum Splitting Concentrator Photovoltaic Module. IEEE J. Photovolt. 2017, 7, 1469–1478. [Google Scholar] [CrossRef]
- Solar API and Wheather Forescasting Tool. Available online: http://www.solcast.com (accessed on 28 January 2024).


| Parameter | Value/Type |
|---|---|
| Height × Width × Thickness | 1650 × 990 × 40 mm |
| Weight | 28 kg |
| Frame | Aluminum |
| Front side | Tempered solar glass 3.2 mm |
| Back side | Aluminum panel |
| Type of PV module cells | polycrystalline |
| Number of cells/module/Size of cell | 60 (6 × 10)/156 × 156 mm |
| Maximum power Pmax | 240 Wp |
| Open circuit voltage Voc | 37.2 V |
| Current at maximum power Imax | 7.84 A |
| Short circuit current Isc | 8.52 A |
| Voltage at maximum power Vmp | 30.6 V |
| Cell/Module efficiency | 16.4%/14.7% |
| Overall surface | 1.62 m2 |
| Nominal thermal capacity | 900 W |
| Heat carrier inlet/outlet | 2·G ½ |
| Distance between heat carrier inlet/outlet | 840 mm |
| Thermal Agent | PG 50% |
| Thermal Agent Volume | 1.17 L |
| Flow rate of Thermal Agent | 1.5 ÷ 2.5 L/min. |
| Thermal loss coefficient k1 | 9.13 W/m2K |
| Thermal loss coefficient k2 | 0.00 W/m2K2 |
| Efficiency in relation to aperture ηo | 0.559 |
| Material of separator | Aluminum |
| Material of absorber pipe system | Cooper |
| Insulation | rigid PU—20 mm |
| Temperature [°C] | Thermal Conductivity [W/mK] | Specific Heat [J/kgK] |
|---|---|---|
| 21.11 | 0.3632 | 3537.85 |
| 26.66 | 0.3649 | 3558.78 |
| 32.22 | 0.3684 | 3579.71 |
| 37.77 | 0.3701 | 3604.83 |
| 43.33 | 0.3719 | 3625.77 |
| Parameter | G | Ta | Tpv | Tf2 | Tf1 | Tf = (Tf1 + Tf2)/2 |
|---|---|---|---|---|---|---|
| Hour | W/m2 | °C | °C | °C | °C | °C |
| 8 a.m. | 484 | 14 | 19.6 | 28.5 | 23 | 25.90 |
| 9 a.m. | 676 | 19.50 | 32.70 | 29 | 22.5 | 28.00 |
| 10 a.m. | 849 | 21.3 | 43.58 | 29.5 | 20 | 29.35 |
| 11 a.m. | 952 | 23.9 | 37.90 | 31.6 | 22 | 31.30 |
| 12 a.m. | 1170 | 28 | 41.50 | 35.1 | 24 | 35.05 |
| 1 p.m. | 1222 | 28.8 | 45.40 | 38 | 24 | 37.85 |
| 2 p.m. | 1296 | 29.3 | 47.30 | 40 | 24 | 39.65 |
| 3 p.m. | 1002 | 28.7 | 46.24 | 39 | 23.5 | 36.20 |
| 4 p.m. | 852 | 29 | 35.10 | 32 | 21.5 | 31.85 |
| 5 p.m. | 585 | 28.9 | 34.10 | 37 | 24 | 33.90 |
| 6 p.m. | 340 | 26 | 25.70 | 33 | 22.5 | 31.25 |
| 7 p.m. | 261 | 25 | 21.70 | 32.5 | 23 | 30.80 |
| Parameter | G | Ta | Tpv | Tf2 | Tf1 | Tf = (Tf1 + Tf2)/2 |
|---|---|---|---|---|---|---|
| Hour | W/m2 | °C | °C | °C | °C | °C |
| 8 a.m. | 315 | 21.85 | 22.45 | 33 | 24.9 | 28.95 |
| 9 a.m. | 581 | 22.30 | 31.20 | 30 | 29.5 | 29.75 |
| 10 a.m. | 781 | 24 | 38.46 | 34 | 33.9 | 33.95 |
| 11 a.m. | 1005 | 25.9 | 44.48 | 38 | 37.7 | 37.85 |
| 12 a.m. | 1106 | 30.6 | 47.50 | 41 | 40.4 | 40.7 |
| 1 p.m. | 1158 | 31.3 | 49.62 | 43.2 | 42.7 | 42.95 |
| 2 p.m. | 1123 | 33 | 52.90 | 46 | 44.8 | 45.4 |
| 3 p.m. | 1125 | 33.1 | 42.18 | 37 | 36.6 | 36.8 |
| 4 p.m. | 903 | 34.2 | 38.18 | 38 | 37.4 | 37.7 |
| 5 p.m. | 688 | 33.9 | 36.26 | 36 | 34 | 35 |
| 6 p.m. | 364 | 32.7 | 36.08 | 36 | 34.5 | 35.25 |
| 7 p.m. | 196 | 33.6 | 35.95 | 35.8 | 35.3 | 35.55 |
| PV/T Component, Index | Thickness, L (m) | Thermal Conductivity k, (W/mK) | Specific Heat, cp, (J/kgK) |
|---|---|---|---|
| glass, g | 0.0032 | 1 | 800 |
| solar cell, pv | 0.000005 | 148 | 200 |
| separator, sepT | 0.0002 | 230 | 897 |
| heat exchanger (copper tube), e | 0.002 | 390 | 400 |
| insulation layer, ins | 0.002 | 0.022 | |
| backcover, b | 0.035 | 230 | 897 |
| 30 May 2023 | 24 July 2023 | |||
|---|---|---|---|---|
| Parameter | Solar Inclination | Solar Inclination | ||
| Hour | Degree | Rad | Degree | Rad |
| 8 a.m. | 58 | 1.012 | 47 | 0.821 |
| 9 a.m. | 64 | 1.117 | 55 | 0.960 |
| 10 a.m. | 64 | 1.117 | 62 | 1.082 |
| 11 a.m. | 60 | 1.047 | 63 | 1.100 |
| 12 a.m. | 52 | 0.908 | 60 | 1.047 |
| 1 p.m. | 43 | 0.75 | 52 | 0.908 |
| 2 p.m. | 32 | 0.559 | 43 | 0.750 |
| 3 p.m. | 22 | 0.384 | 33 | 0.576 |
| 4 p.m. | 12 | 0.209 | 23 | 0.401 |
| 5 p.m. | 3 | 0.052 | 13 | 0.227 |
| 6 p.m. | −6 | −0.105 | 3 | 0.005 |
| 7 p.m. | −13 | −0.227 | −6 | 0.000 |
| Initial Temperatures [K] | Value |
| Glass cover, Tg0 [K] | 295 |
| PV solar cells, Tpv0 [K] | 295 |
| Heat exchanger, Te0 [K] | 295 |
| Water in the tank, Tw0 [K] | 295 |
| Back cover, Tb0 [K] | 295 |
| Geometry | Value |
| Area of a PV solar cell, Acell [m2] | 0.024336 |
| Number of PV solar cells, Ncell | 60 |
| Optical Properties | Value |
| Refractive index ratio glass/air, ng | 1.62 |
| Absorption coefficient of glass cover per unit length, Ag [1/m, m−1] | 0.2 |
| Thickness of glass cover, Lg [m] | 0.0032 |
| Reflection factor of PV solar cell, rpv | 0.15 |
| Heat Transfer Properties | Value |
| Temperature of ambient air, Ta [K] | 294.15 |
| Temperature of sky (for radiative heat transfer), Tsky [K] | 278.48 |
| Mass of glass cover, Mg [kg] | 11.6 |
| Mass of one PV solar cell, Mpv [kg] | 0.0726 |
| Mass of heat exchanger, Me [kg | 7.044 |
| Mass of back cover, Mb [kg] | 5 |
| Specific heat of glass, Cg [J/kg/K] | 800 |
| Specific heat of PV solar cell, Cpv [J/kg/K] | 200 |
| Specific heat of heat exchanger, Ce [J/kg/K] | 400 |
| Specific heat of back cover, Cb [J/kg/K] | 897 |
| Emissivity of glass, εg | 0.75 |
| Emissivity of PV solar cell, εpv | 0.7 |
| Free convection coefficient between ambient air and glass, hga [W/m2/K] | 6.1 |
| Free convection coefficient between glass and PV solar cells, hgpv [W/m2/K] | 24 |
| Free convection coefficient between back cover and ambient air, hba [W/m2/K] | 6.1 |
| Thermal conductivity of heat exchanger, ke [W/m/K] | 390 |
| Thickness of heat exchanger, Le [m] | 0.002 |
| Thermal conductivity of insulation layer, kins [W/m/K] | 0.022 |
| Thickness of insulation layer, Lins [m] | 0.02 |
| PV Solar Cell Electrical Properties | Value |
| Short-circuit current, Isc [A] | 8.52 |
| Open-circuit voltage, Voc [V] | 0.62 |
| Diode saturation current, Is [A] | 1 × e−6 |
| Diode saturation current, Is2 [A] | 0 |
| Solar-generated current for measurements, Iph0 [A] | 8.5445 |
| Solar irradiance used for measurements, G0 [W/m2] | 1000 |
| Quality factor, N1 | 1.5 |
| Quality factor, N2 | 2 |
| Series resistance, Rs [Ω] | 0 |
| Parallel resistance, Rp [Ω] | ∞ |
| First order temperature coefficient for Iph, TIPH1 [1/K, K−1] | 0.065 |
| Energy gap, EG [eV] | 1.11 |
| Temperature exponent for Is, TXIS1 | 3 |
| Temperature exponent for Is2, TXIS2 | 3/2 |
| Temperature exponent for Rs, TRS1 | 1 |
| Temperature exponent for Rp, TRP1 | 0 |
| Measurement temperature, Tmeas [°C] | 25 |
| Pipe Parameters | Value |
| Pipe length, length [m] | 5.83 |
| Cross-sectional area, area [m2] | 0.000201 |
| Hydraulic diameter, Dh [m] | 0.016 |
| Aggregate equivalent length of local resistances, lengthadd [m] | 0.8 |
| Internal surface absolute roughness, roughness [m] | 0.000015 |
| Laminar flow upper Reynolds number limit, Relam | 2000 |
| Turbulent flow lower Reynolds number limit, Retur | 4000 |
| Shape factor for laminar flow viscous friction, shapefactor | 64 |
| Nusselt number for laminar flow heat transfer, Nulam | 3.66 |
| Tank Parameters | Value |
| Maximum tank capacity, Volmax [m3] | 0.1 |
| Tank cross-sectional area, Atank [m2] | 0.148 |
| Initial volume in the tank, Voltank0 [m3] | 0.01 |
| Initial temperature in the tank, Ttank0 [K] | 295 |
| Insulating layer thickness, Lins [m] | 0.02 |
| Thermal conductivity of insulation layer, kins [W/m/K] | 0.022 |
| Free convection coefficient between tank and ambient air, hta [W/m2/K] | 10 |
| Pump Flow Input Parameters | Value |
| Internal circuit mass flow rate, mdotint [kg/s]> | 0.026 |
| Demand mass flow rate (to the sink), mdotdem [kg/s] | 0.005 |
| Supply mass flow rate (from the source), mdotsup [kg/s] | 0.005 |
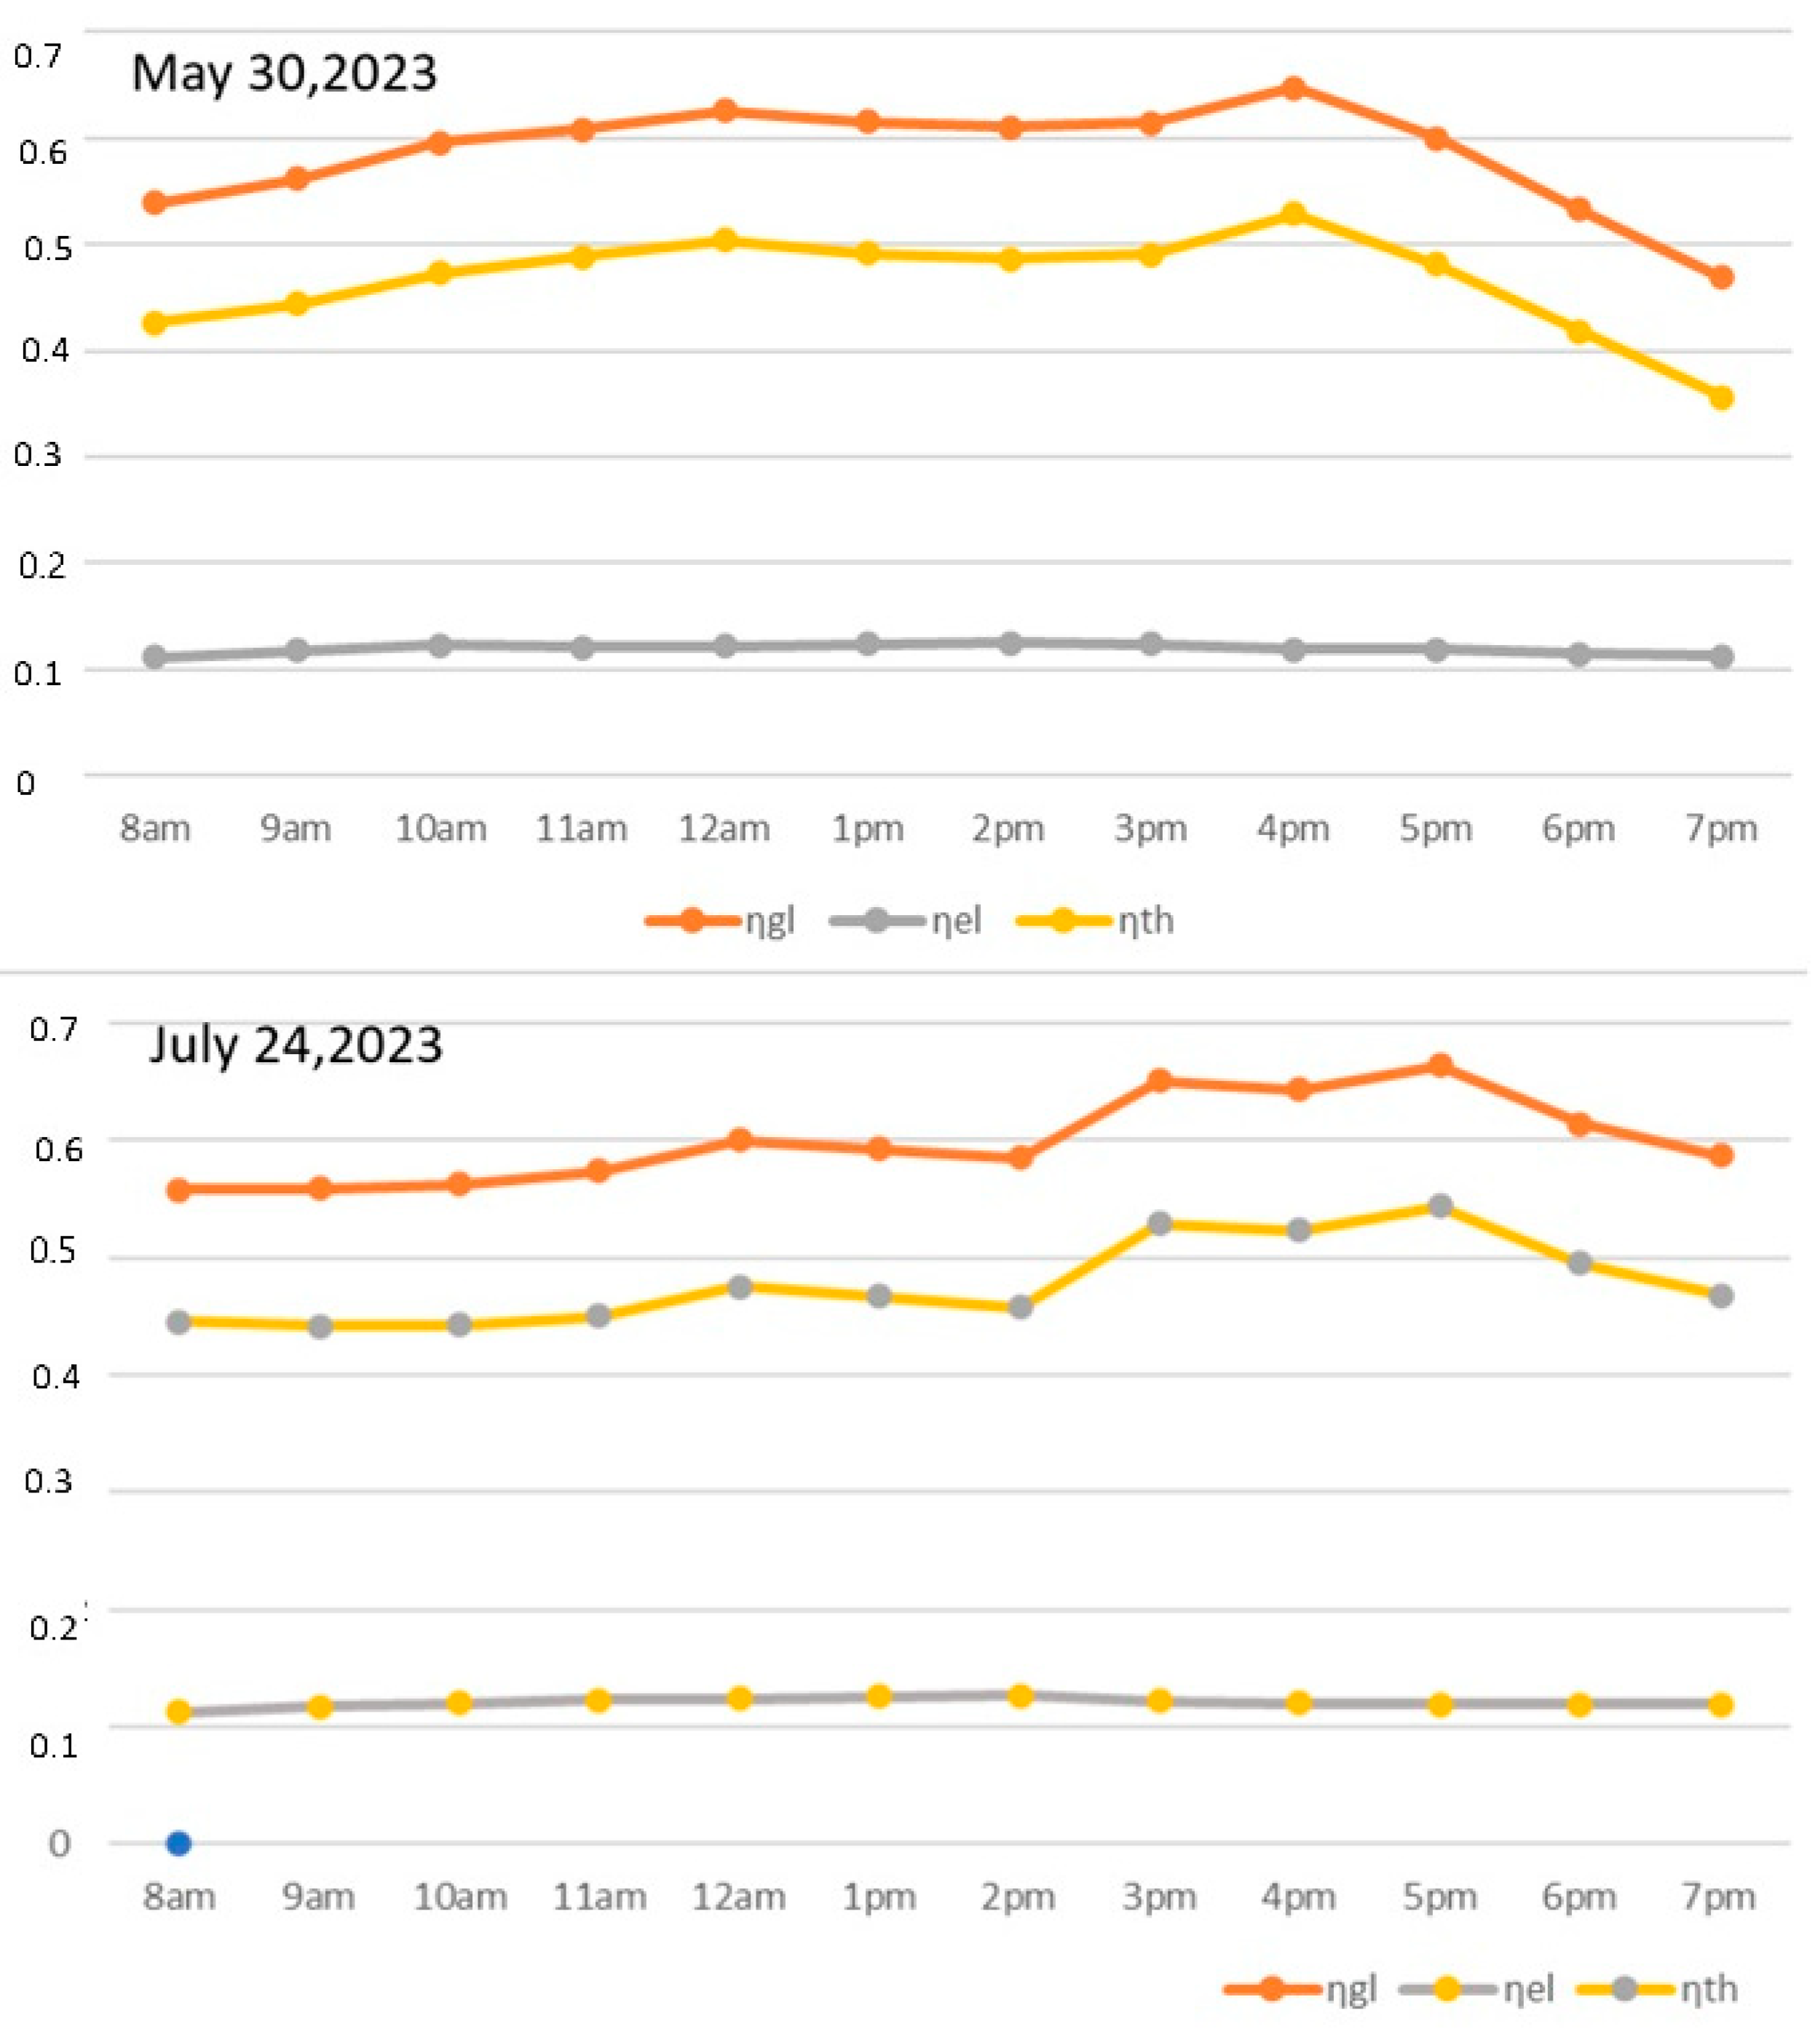
| Hour | ∆T | ηth | ηel | ηgl |
|---|---|---|---|---|
| 8 a.m. | 11.9 | 0.4269 | 0.1118 | 0.5387 |
| 9 a.m. | 8.5 | 0.4443 | 0.1178 | 0.5622 |
| 10 a.m. | 8.05 | 0.4725 | 0.1228 | 0.5953 |
| 11 a.m. | 7.4 | 0.4881 | 0.1202 | 0.6083 |
| 12 a.m. | 7.05 | 0.5040 | 0.1219 | 0.6259 |
| 1 p.m. | 9.05 | 0.4915 | 0.1236 | 0.6151 |
| 2 p.m. | 10.35 | 0.4862 | 0.1245 | 0.6107 |
| 3 p.m. | 7.5 | 0.4907 | 0.1240 | 0.6148 |
| 4 p.m. | 2.85 | 0.5285 | 0.1189 | 0.6474 |
| 5 p.m. | 5 | 0.4811 | 0.1185 | 0.5995 |
| 6 p.m. | 5.25 | 0.4182 | 0.1146 | 0.5328 |
| 7 p.m. | 5.8 | 0.3563 | 0.1128 | 0.4691 |
| Hour | ∆T | ηth | ηel | ηgl |
|---|---|---|---|---|
| 8 a.m. | 7.1 | 0.4456 | 0.1132 | 0.5587 |
| 9 a.m. | 7.45 | 0.4421 | 0.1172 | 0.5592 |
| 10 a.m. | 9.95 | 0.4428 | 0.1205 | 0.5633 |
| 11 a.m. | 11.95 | 0.4506 | 0.1232 | 0.5738 |
| 12 a.m. | 10.1 | 0.4757 | 0.1246 | 0.6003 |
| 1 p.m. | 11.65 | 0.4672 | 0.1256 | 0.5928 |
| 2 p.m. | 12.4 | 0.4583 | 0.1271 | 0.5854 |
| 3 p.m. | 3.7 | 0.5290 | 0.1222 | 0.6512 |
| 4 p.m. | 3.5 | 0.5237 | 0.1203 | 0.6440 |
| 5 p.m. | 1.1 | 0.5444 | 0.1195 | 0.6639 |
| 6 p.m. | 2.55 | 0.4951 | 0.1194 | 0.6145 |
| 7 p.m. | 1.95 | 0.4683 | 0.1193 | 0.5876 |
| Model 1 | |||
|---|---|---|---|
| Date | ηth | ηel | ηgl |
| 30 May 2023 | 0.4657 | 0.1193 | 0.5850 |
| 24 July 2023 | 0.4786 | 0.1210 | 0.5996 |
| Parameter | Value | |
|---|---|---|
| 30 May 2023 | 24 July 2023 | |
| Total input solar energy in the period [kWh] | 11.11872 | 10.1199 |
| Total electricity supplied to the load [kWh] | 1.3716 | 1.2923 |
| Total absolute thermal energy in the water supplied to the user | 10.4368 | 10.1358 |
| Total absolute thermal energy in the water extracted from the source [kWh] | 5.5001 | 5.5004 |
| Total used thermal energy (sink–source) [kWh] | 4.9367 | 4.6353 |
| Electrical efficiency | 0.12336 | 0.12769 |
| Thermal efficiency | 0.44400 | 0.45804 |
| Total efficiency | 0.56736 | 0.58574 |
| Model | ηth | ηel | ηgl |
|---|---|---|---|
| Model 1 | 0.4721 | 0.1201 | 0.5923 |
| Model 2 | 0.4510 | 0.1255 | 0.5766 |
Disclaimer/Publisher’s Note: The statements, opinions and data contained in all publications are solely those of the individual author(s) and contributor(s) and not of MDPI and/or the editor(s). MDPI and/or the editor(s) disclaim responsibility for any injury to people or property resulting from any ideas, methods, instructions or products referred to in the content. |
© 2024 by the authors. Licensee MDPI, Basel, Switzerland. This article is an open access article distributed under the terms and conditions of the Creative Commons Attribution (CC BY) license (https://creativecommons.org/licenses/by/4.0/).
Share and Cite
Grigore, R.; Vernica, S.G.; Popa, S.E.; Banu, I.V. Simulation and Experimental Results for Energy Production Using Hybrid Photovoltaic Thermal Technology. Energies 2024, 17, 1422. https://doi.org/10.3390/en17061422
Grigore R, Vernica SG, Popa SE, Banu IV. Simulation and Experimental Results for Energy Production Using Hybrid Photovoltaic Thermal Technology. Energies. 2024; 17(6):1422. https://doi.org/10.3390/en17061422
Chicago/Turabian StyleGrigore, Roxana, Sorin Gabriel Vernica, Sorin Eugen Popa, and Ioan Viorel Banu. 2024. "Simulation and Experimental Results for Energy Production Using Hybrid Photovoltaic Thermal Technology" Energies 17, no. 6: 1422. https://doi.org/10.3390/en17061422
APA StyleGrigore, R., Vernica, S. G., Popa, S. E., & Banu, I. V. (2024). Simulation and Experimental Results for Energy Production Using Hybrid Photovoltaic Thermal Technology. Energies, 17(6), 1422. https://doi.org/10.3390/en17061422