1. Introduction
Recovery is the most important comprehensive index to measure the development effect and level of oil and gas fields, and it is also one of the key issues in the dynamic analysis of oil and gas fields [
1,
2,
3,
4]. Tight sandstone gas reservoirs are characterized by low porosity, low permeability, and high water saturation [
5,
6], which makes it difficult to develop them, and there are many influencing factors and complex influencing mechanisms [
7,
8]. Therefore, the study of recovery evaluation for tight sandstone gas reservoirs is of great guiding significance for the efficient development of gas reservoirs, and it is helpful to understand and evaluate the recovery level of gas reservoirs.
For many years, the research on recovery of gas reservoirs has been continuous. There are various calibration methods for recovery of tight sandstone gas reservoirs, including the empirical method [
9], material balance method [
3], modified pressure drop method [
10], production decline method [
11], Rogersti function method [
12], analog method [
13], etc. Improving the recovery of gas reservoirs has always been a hot topic of concern among scholars and experts around the world. The main methods to improve the recovery of tight sandstone gas reservoirs include reservoir fracturing and reconstruction technology [
14,
15], well pattern encryption technology [
16,
17,
18], surface pressurization technology [
19,
20], and increasing the ultimate economic production [
21].
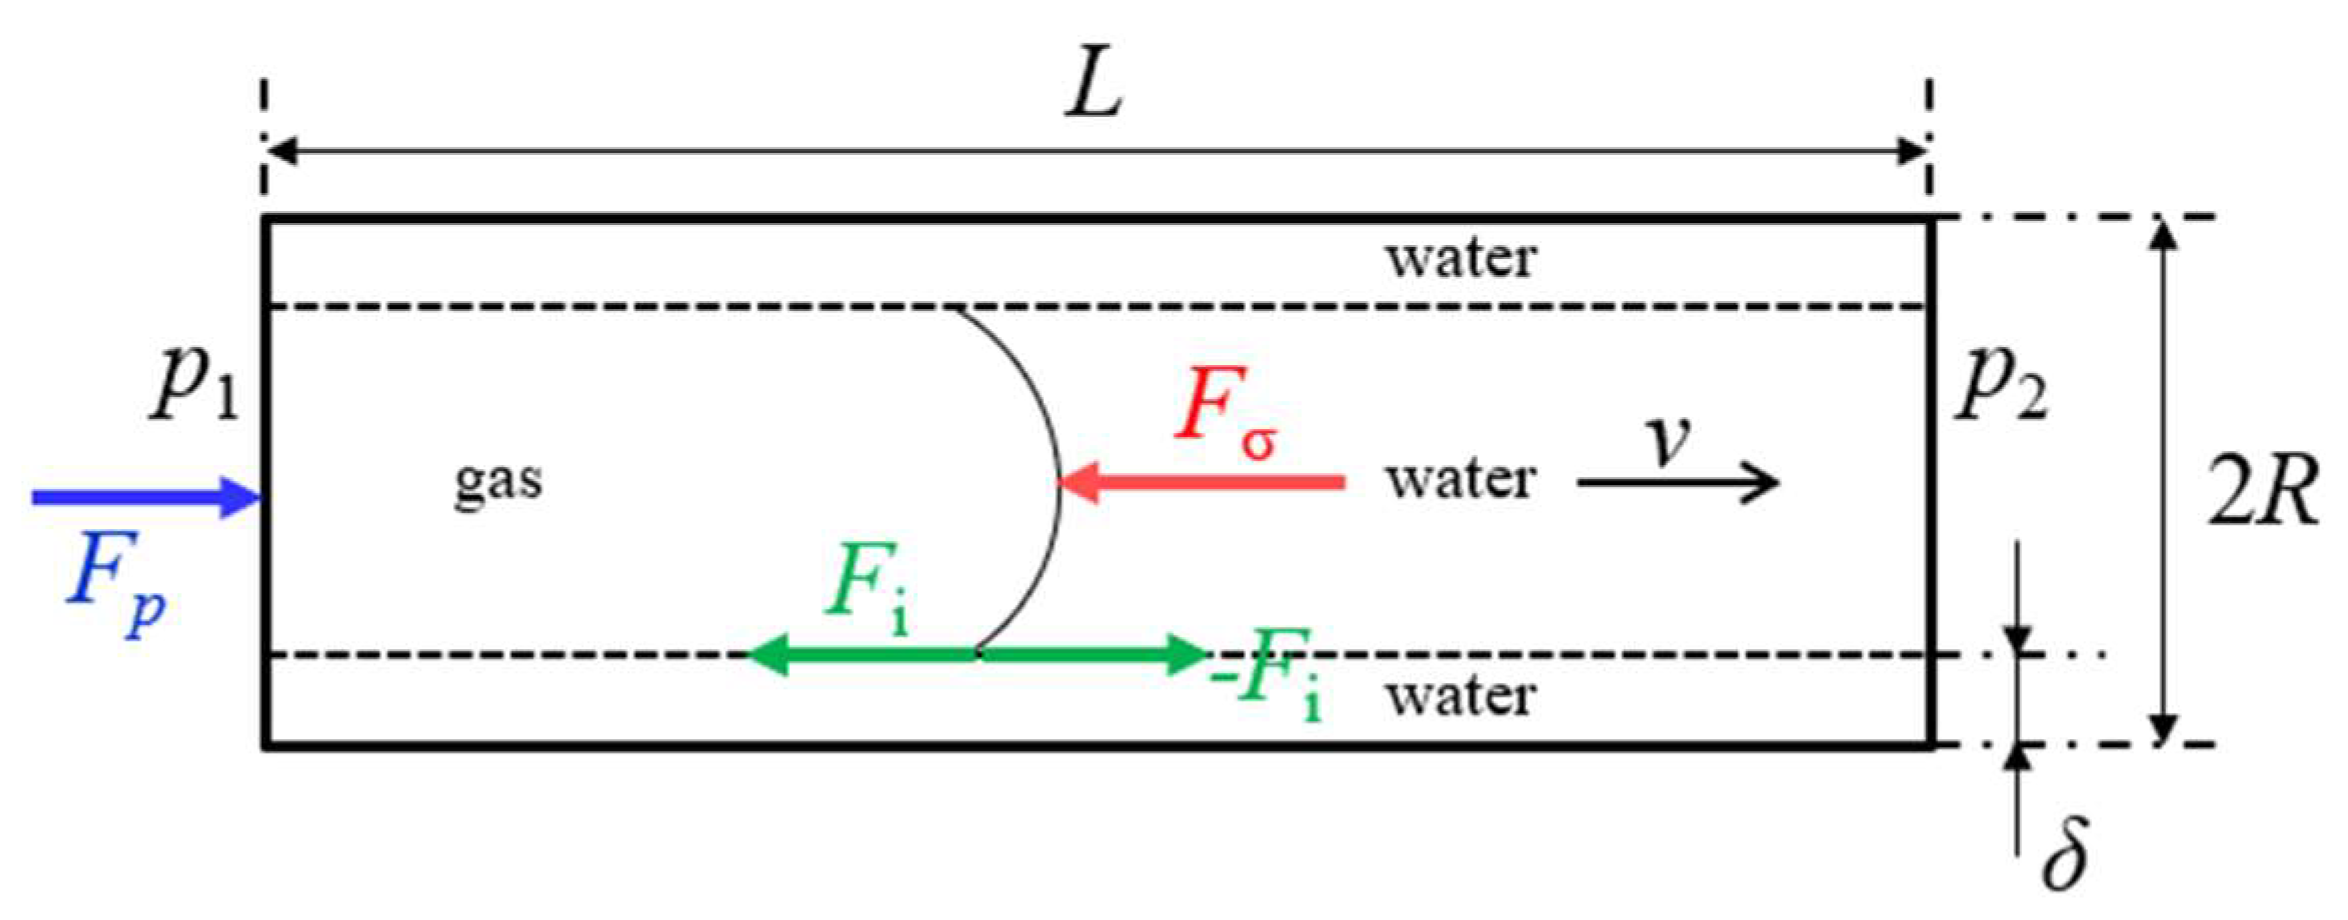
Based on Newton’s law of motion, this paper deduces the steady-state model of gas–water two-phase seepage and its corresponding productivity equation by means of mechanical analysis. Then, on the basis of the steady-state model, the calculation method of effective production radius of tight sandstone gas reservoir is established, and the effective production radius is calculated under different production and reservoir physical properties. Finally, according to the productivity equation, gas recovery under different conditions of constant pressure difference production and constant output production is calculated by the Matlab programming method, and an example is calculated.
3. Effective Control Radius of a Tight Sandstone Gas Reservoir
The key to effective development of tight sandstone gas reservoirs is to determine reasonable well pattern density and effective development well spacing of gas reservoirs based on the effective control radius of the gas reservoir and comprehensive consideration of technical, economic, and other factors [
23,
24]. Therefore, the analysis of the fluid flow process in a gas reservoir and the determination of the effective control radius have important guiding significance for the deployment of a gas reservoir development well pattern.
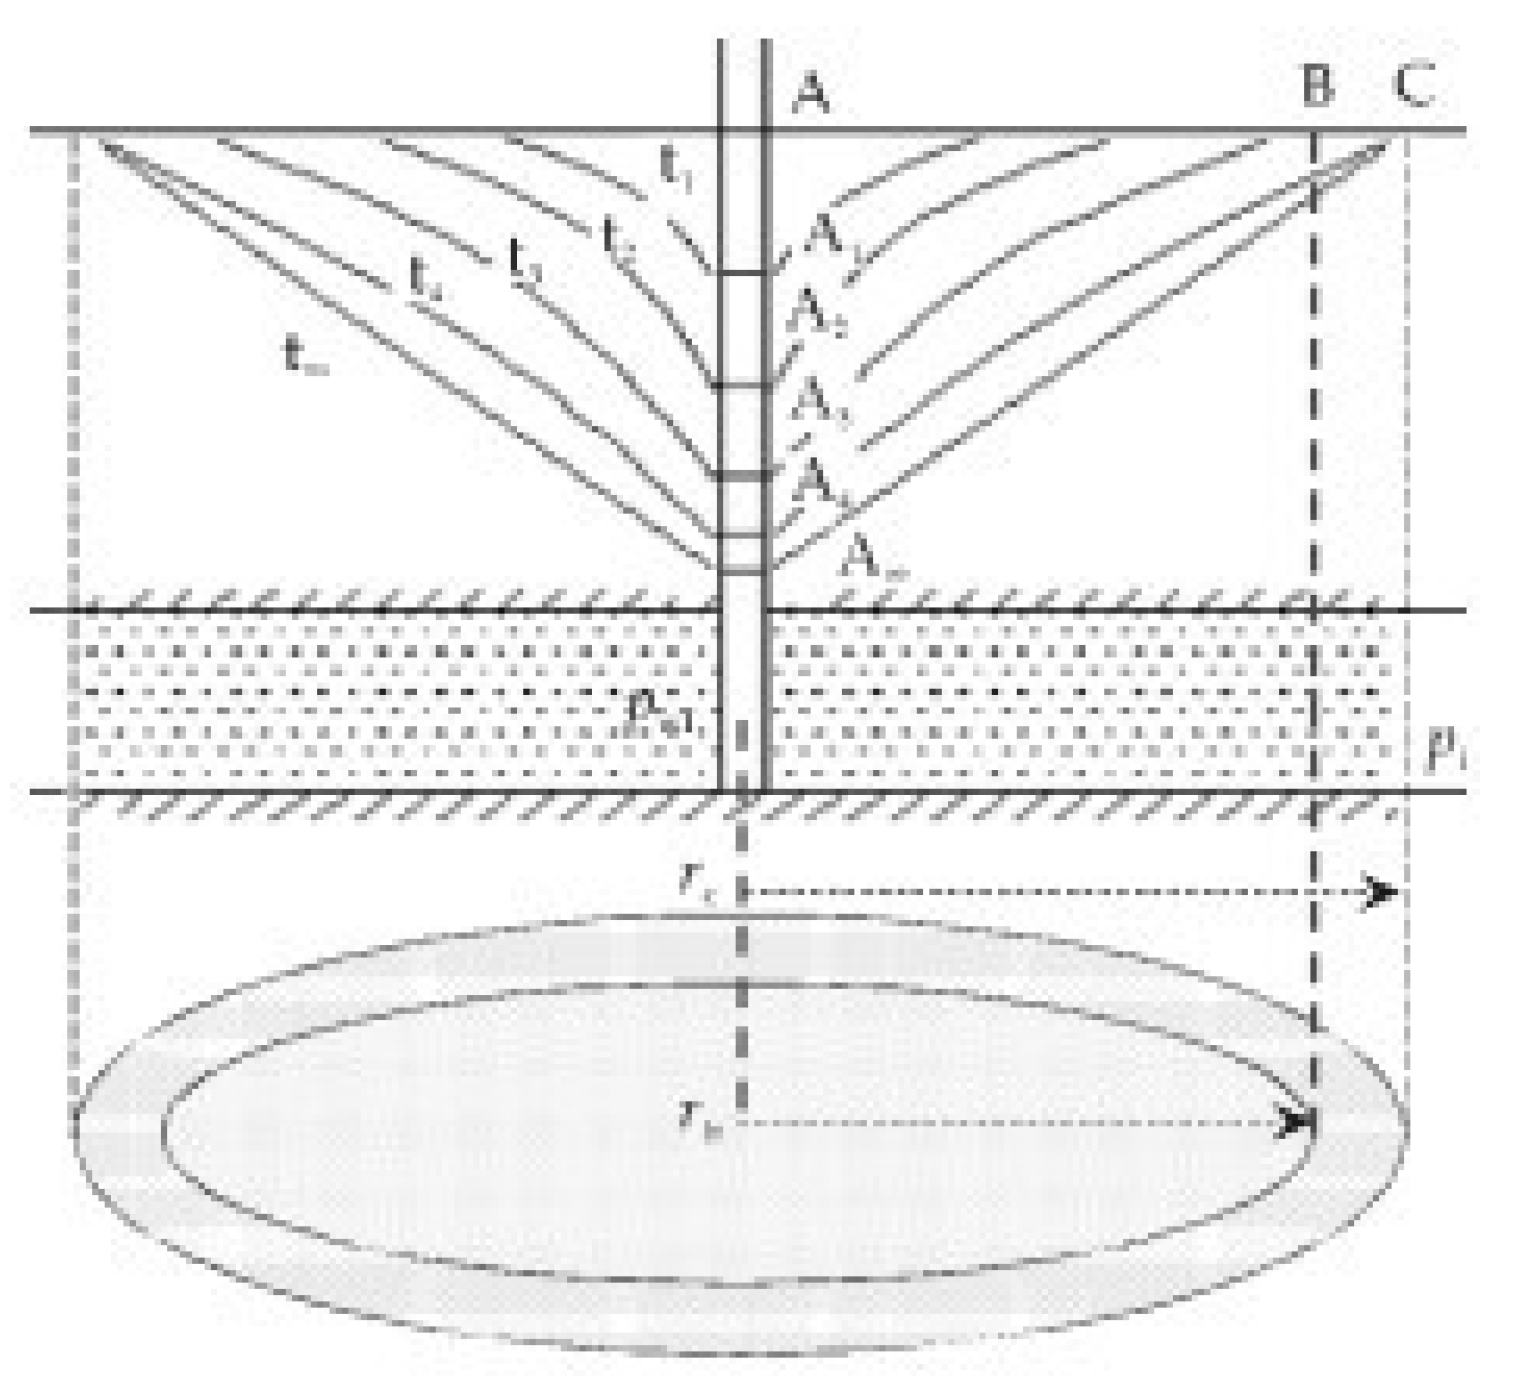
The process of pressure propagation in the reservoir is shown in
Figure 3 [
25]. With the increase in production time, formation pressure gradually decreases, pressure waves constantly propagate outward from well point A, and the reservoir utilization scope gradually increases, but the driving pressure gradient gradually decreases.
In the reservoir, the pressure gradient at the radius
rc (C in
Figure 3) is less than the starting pressure gradient, so that the seepage velocity
v = 0, and the radius
rc is the limit control radius. The limit control radius usually refers to the leakage radius corresponding to the zero-seepage velocity in the reservoir under the given pressure difference condition [
26]. The development well spacing determined by the limit control radius has some problems in actual production. On the one hand, when the pressure wave propagates to the boundary, the gas well production is already below the economic daily gas limit, and the well has to be shut in, effectively making the reserves in the area near the boundary impossible to use. On the other hand, even if the shut-in limit is very low to meet the pressure wave propagation to the limit control radius, the overall pressure drop in the area near the boundary is also small, so the degree of reserve exploitation in this part is also very low.
In the actual production and development, the fluid near the boundary of the reservoir must also have a certain seepage speed, so that when the pressure wave is transmitted here, it also has a certain output, which can meet the requirements of the production limit of the gas well. Therefore, the actual development well spacing should be less than the limit control radius, that is, the effective control radius, as shown by B in
Figure 3.
The effective control radius of the reservoir is actually the maximum development well distance that the gas reservoir can benefit from economically under certain development conditions. Under the given gas reservoir physical property conditions and determined production pressure difference, the control radius rb, corresponding to the economic limit of daily production Qm, is the effective control radius of the reservoir.
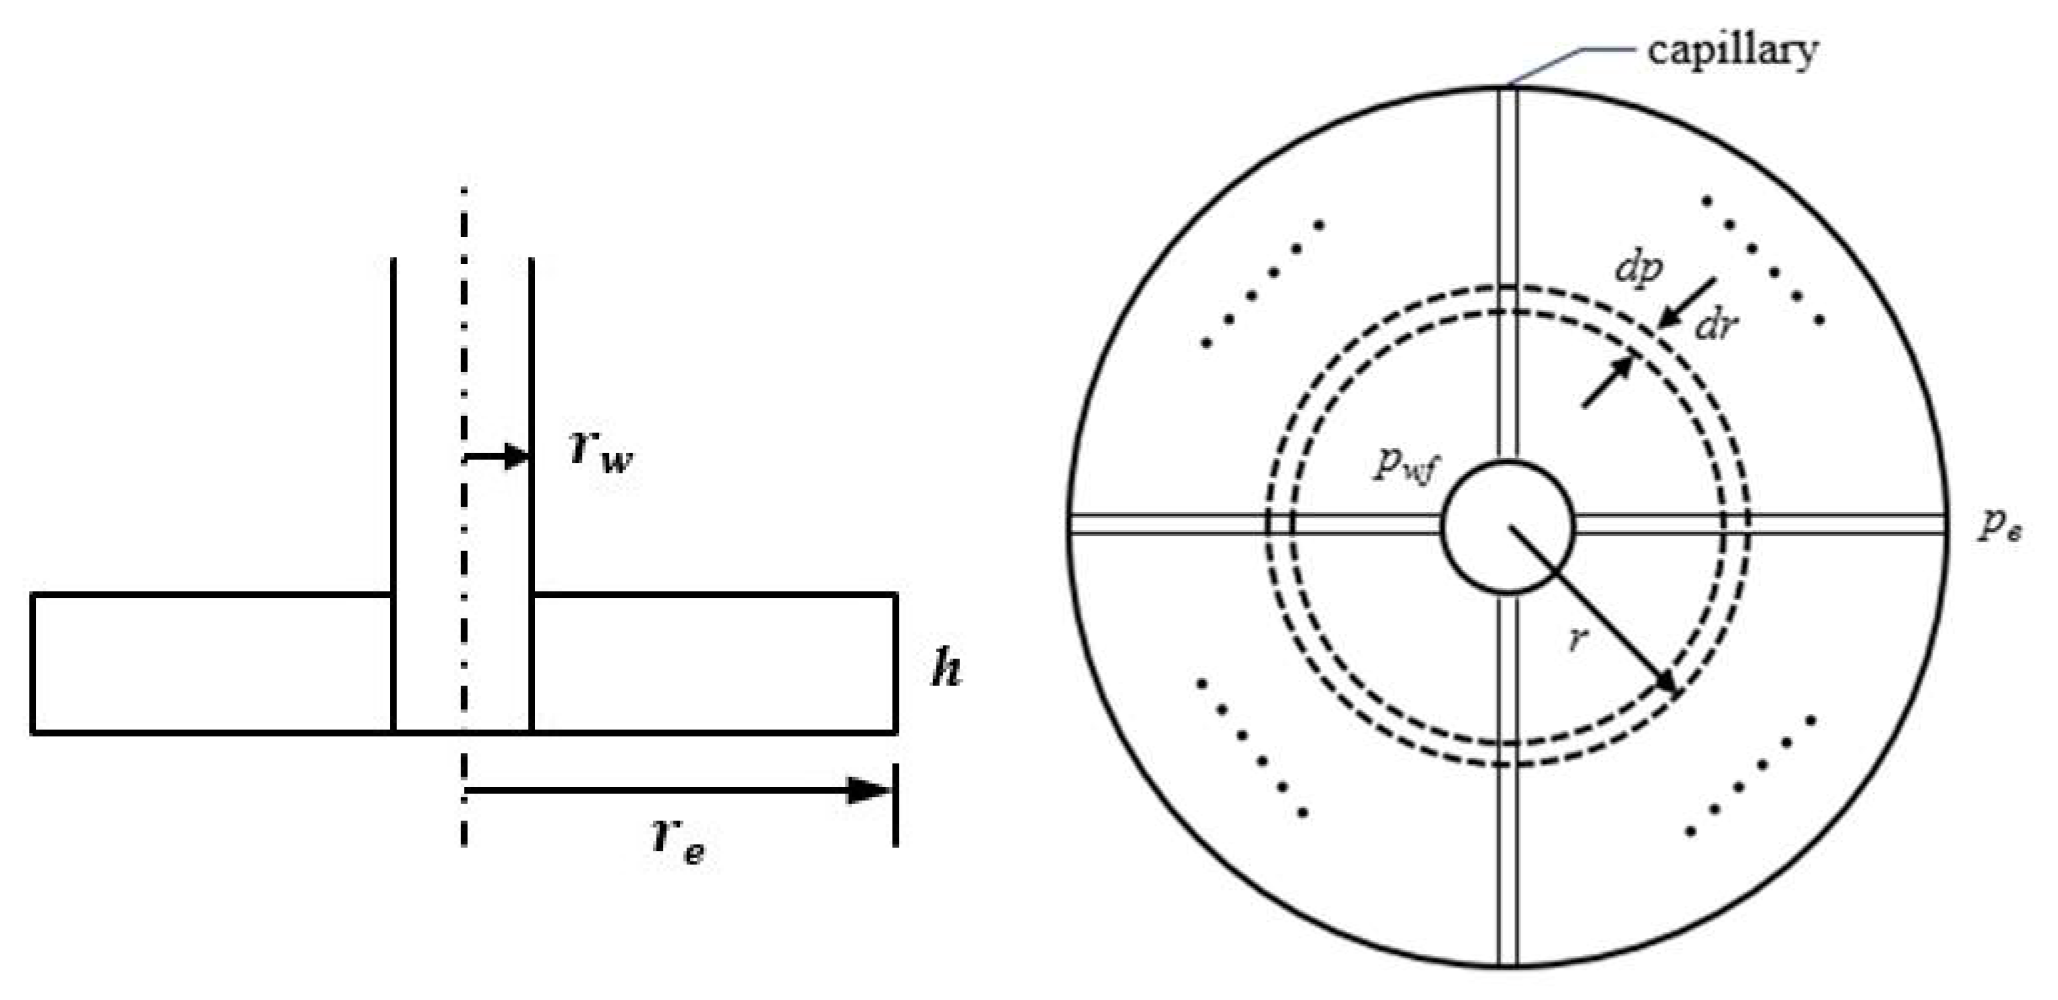
In the circular uniform thickness constant pressure boundary formation model shown in
Figure 2, Equation (5) is rewritten into polar coordinate form, that is:
Considering the starting pressure gradient, Equation (15) becomes:
where
G is the starting pressure gradient, in MPa∙m
−1.
The flow rate throughout the formation is:
The pressure gradient is:
The pressure distribution expression can be obtained from Equation (18) as follows:
The specific steps for calculating the propagation range of pressure waves are as follows:
- (1)
Determine the initial conditions, take the bottom of the gas well as the starting point, and gradually extrapolate for iterative calculation. The fitting time ti starts from 0, 1, … , tm, … , tn changes. The corresponding pressure wave propagates outward gradually, and the control radius increases gradually.
- (2)
Determine the initial radius increment Δr, calculate the effective propagation range of the pressure wave, and calculate the change of the pressure distribution within the range.
- (3)
At a certain time ti, the corresponding propagation distance, that is, the control radius, is ti∙Δr, and the gas well production and displacement pressure gradient corresponding to the control radius are calculated.
- (4)
Judge the situation of the ti moment to determine whether the displacement pressure gradient at the pressure wave propagation is greater than the starting pressure gradient. If so, increase the pressure propagation distance and continue the iterative calculation. If not, reduce the radius increment Δr.
- (5)
When the production reaches a certain time tm, the pressure wave propagates to a place rb in the formation, where the displacement pressure gradient is greater than the starting pressure gradient, and the pressure wave can continue to propagate outward. When the gas well production Q is equal to the economic limit of daily gas production Qm, the corresponding rb is the effective control radius of the reservoir.
Sulige gas field is a typical tight sandstone gas reservoir. A well was selected as an example for analysis. The basic parameters are shown in
Table 1 below.
The initial economic limit of the gas reservoir is set at 1.5 m3∙d−1. The shut-in daily production limit is the production rate at which the daily production revenue (sales revenue per day) of the gas well is equal to the daily production expenditure of the gas well.
Based on the theoretical basis of Equations (15)–(19), taking the basic data of X gas well in Sulige gas field as an example, the above calculation methods and steps were used to study the distribution law of reservoir displacement pressure gradient under different conditions, and the effective control radius of the gas well was determined according to the economic limit of shut-in daily gas production.
Under the conditions of different production pressure differences and start-up pressure gradients with given reservoir physical property conditions, the displacement pressure gradient distribution law within the reservoir production range is shown in
Figure 4 below.
As can be seen from
Figure 4, under certain production pressure differential conditions, the displacement pressure gradient within the range of operation increases with the increase in the starting pressure gradient. Under a certain starting pressure gradient condition, the larger the production pressure difference, the larger the displacement pressure gradient in the range of production. Especially in the pre-production area near the well, the difference is more obvious, and the variation range of the displacement pressure gradient in the range of production also increases with the increase in the production pressure difference.
With the progress of gas well production, the pressure wave gradually propagates outward, and the gas well production gradually decreases. When the gas well production reaches the economic limit of daily gas production Qm, the corresponding control radius is the effective control radius of the reservoir. When gas well production Q = 0, the corresponding control radius is the limit control radius. Under different production conditions, the effective control radius of the reservoir is smaller than the limit control radius under the same condition.
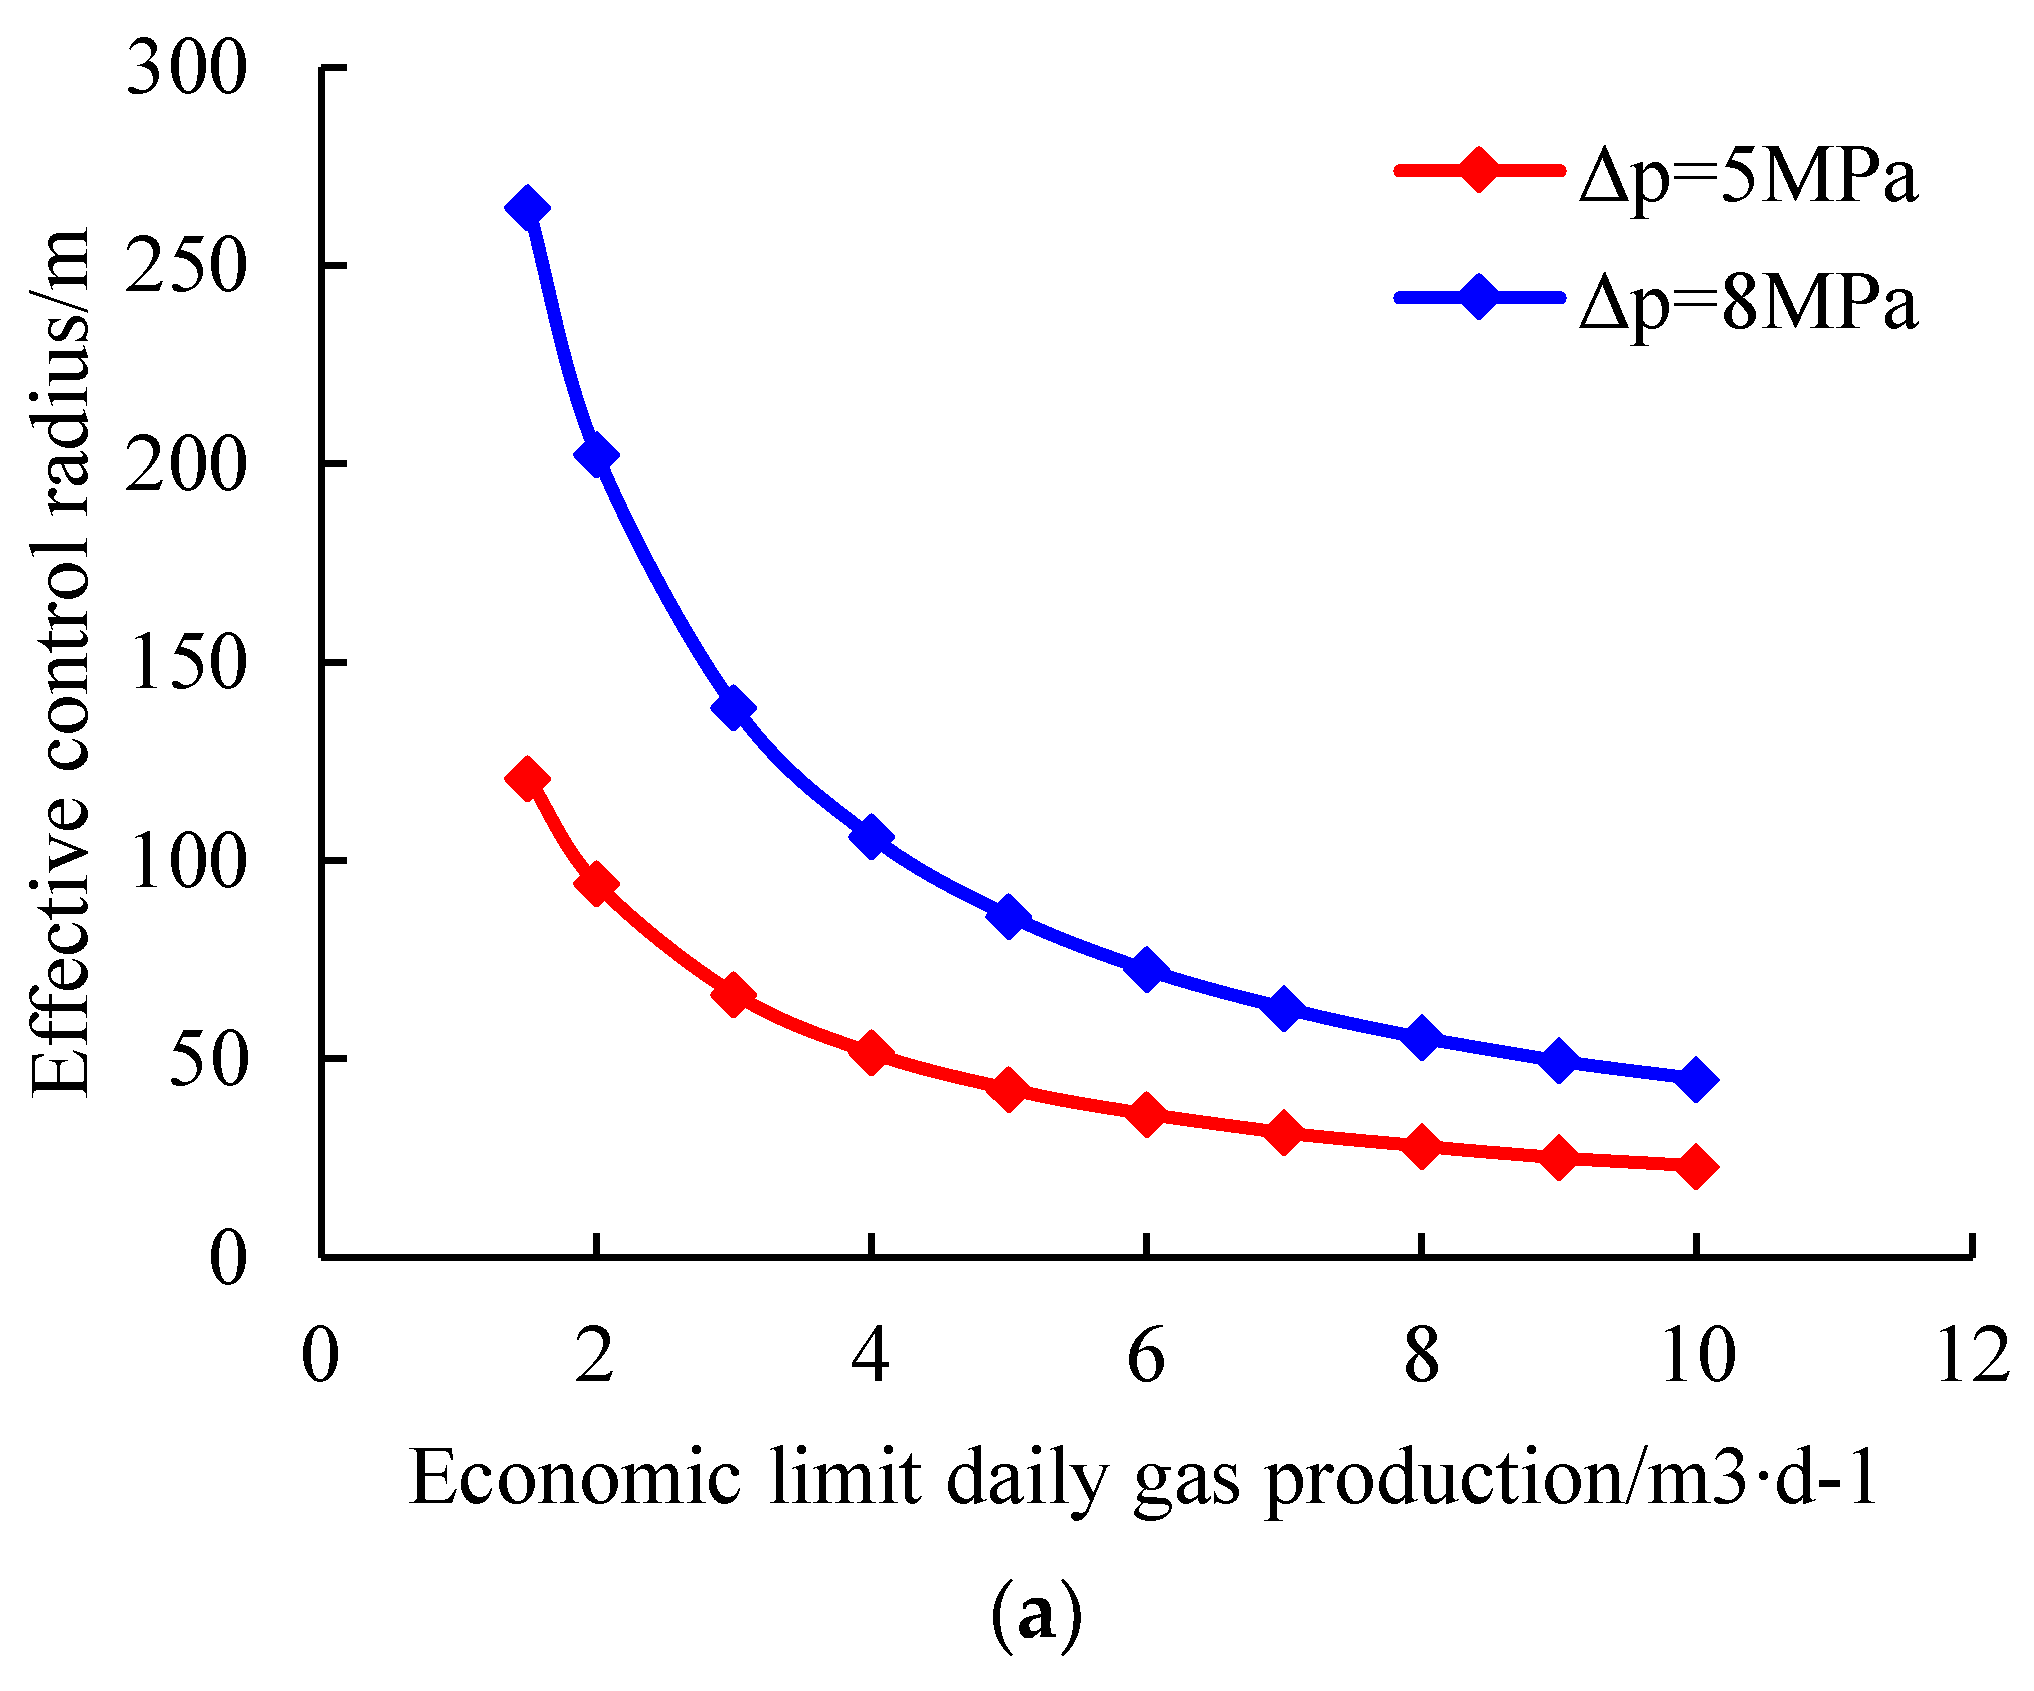
Given the starting pressure gradient of 0.05 MPa∙m
−1, the relationship between the effective control radius of the reservoir and the economic limit of daily gas production under different production pressure differential conditions is shown in
Figure 5a below.
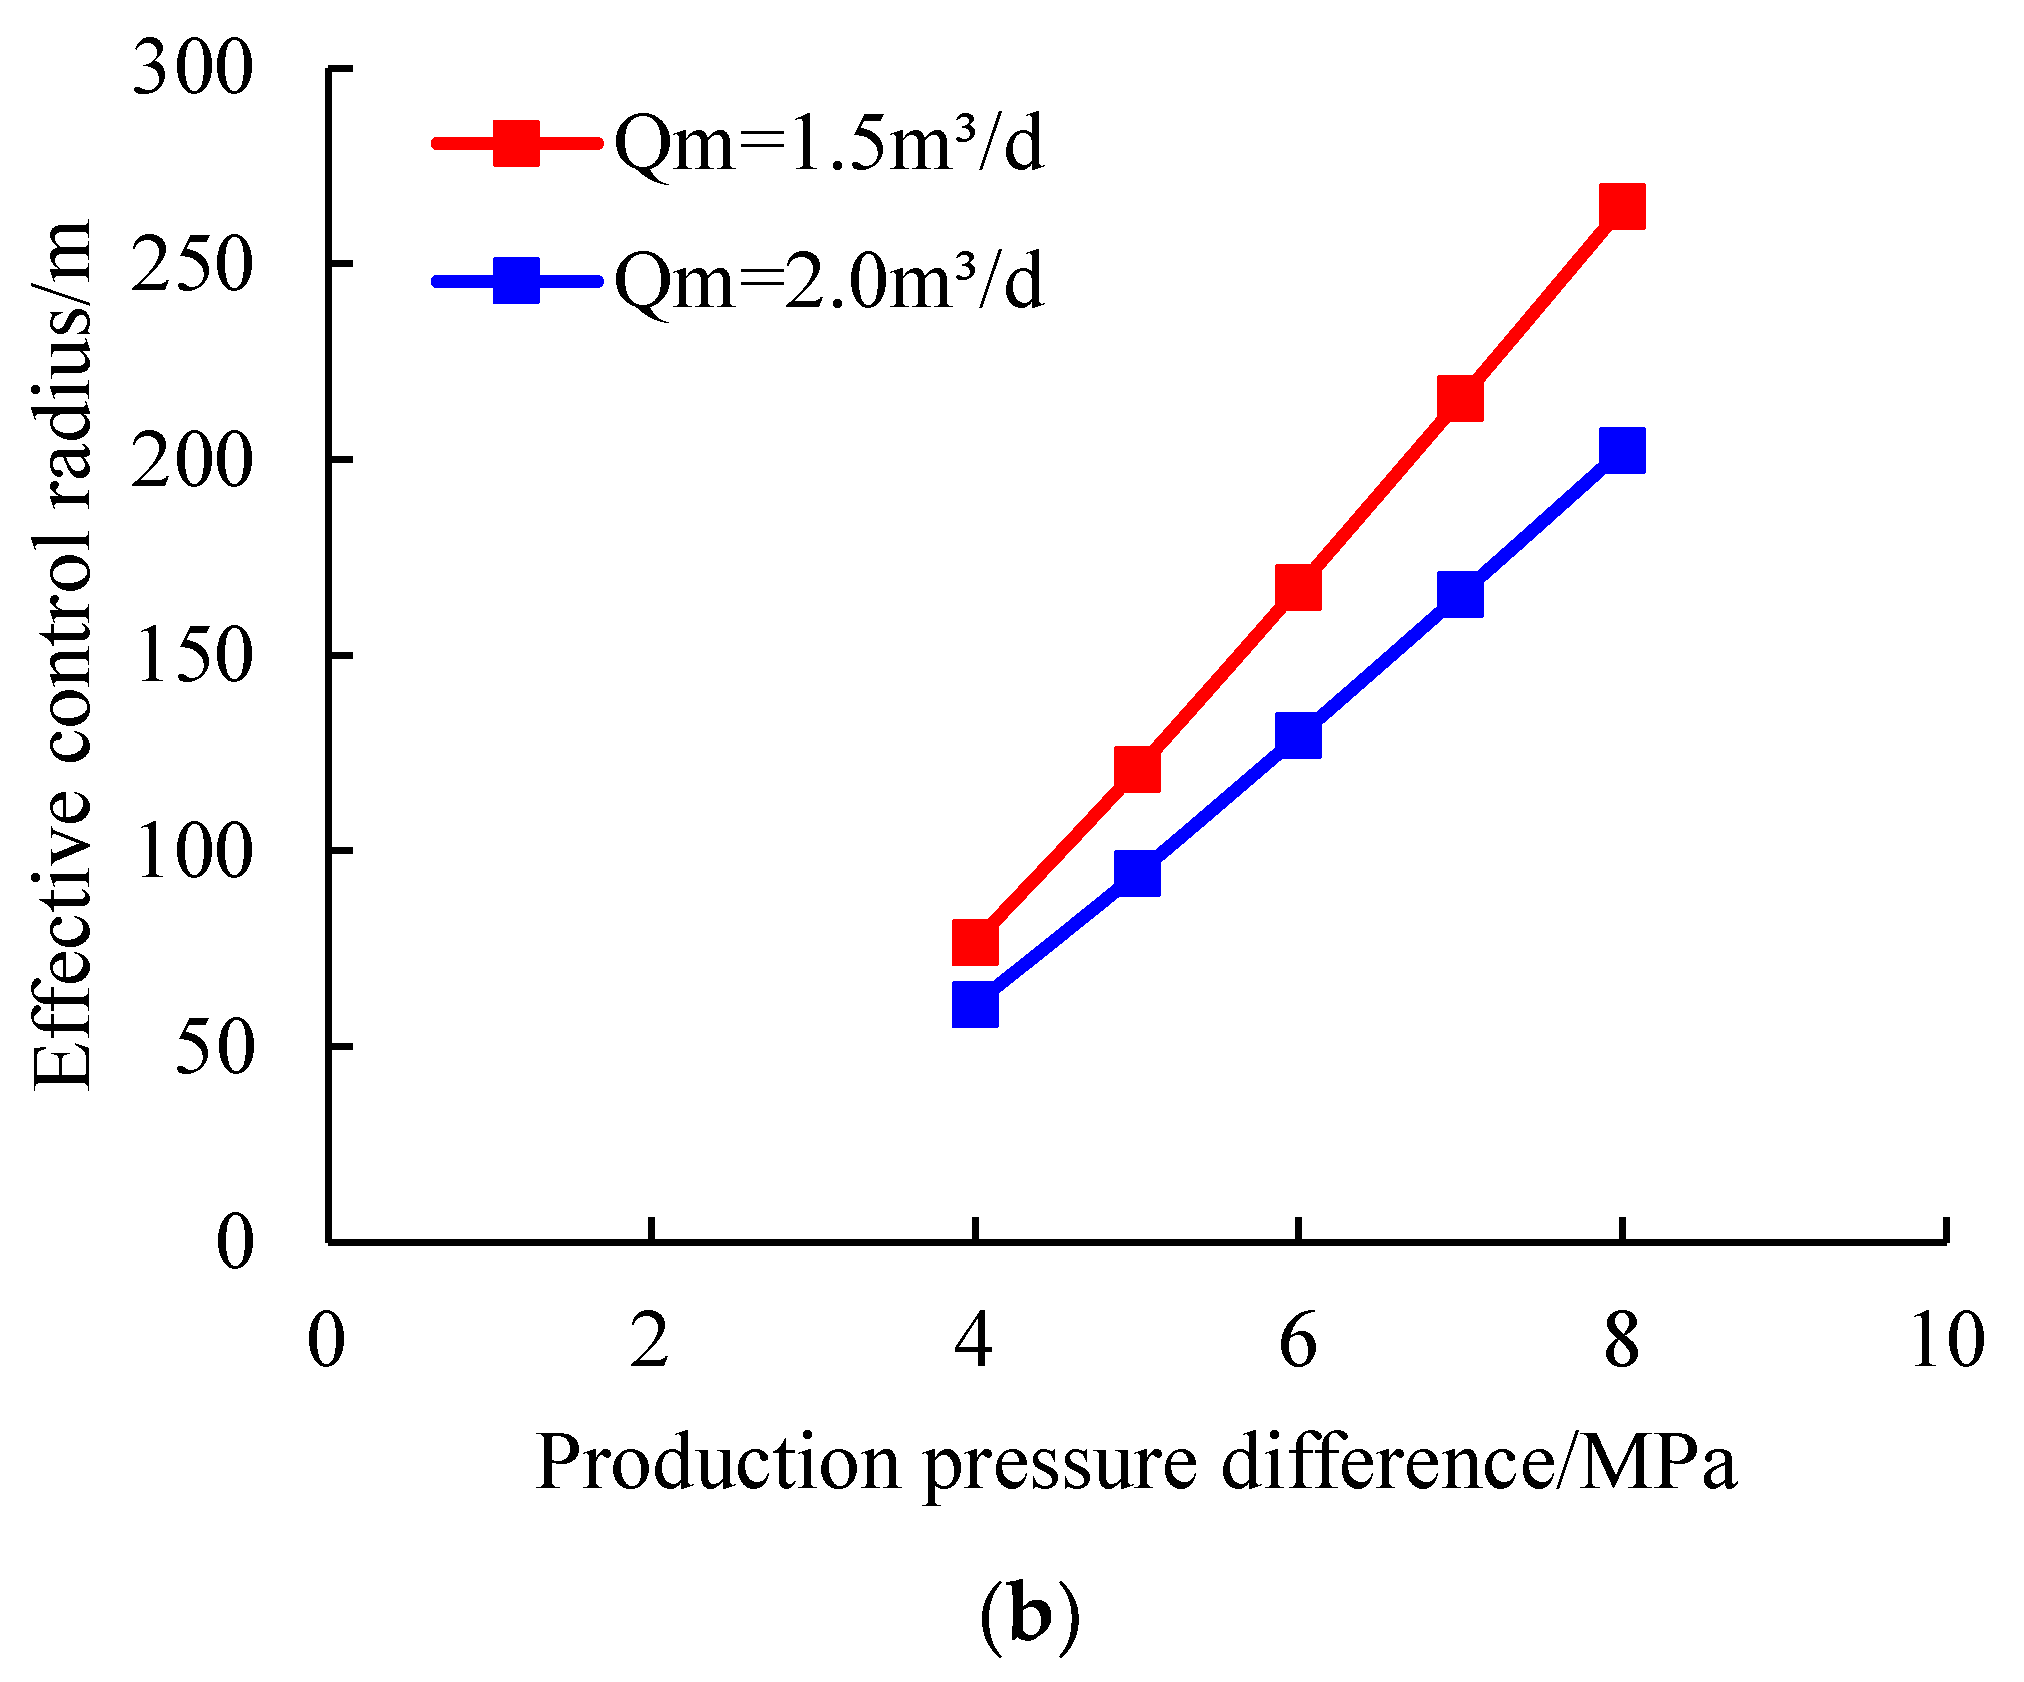
It can be seen from
Figure 5a that under certain production pressure differential conditions, the effective control radius of the reservoir gradually decreases with the increase in the economic limit of daily gas production and shows an exponential downward trend. The curves show the same pattern under different production pressure differences. The smaller the production pressure difference is, the smaller the variation range of the effective control radius of the reservoir.
Given a starting pressure gradient of 0.05 MPa∙m
−1, the relationship between the effective control radius of the reservoir and the production pressure difference is shown in
Figure 5b under different economic limits of daily gas production conditions.
As can be seen from
Figure 5b, under certain economic limits of daily gas production conditions, the effective control radius of the reservoir gradually increases with the increase in the production pressure differential, and the linear relationship between the two is basically satisfied. When the economic limit of daily gas production is reduced, the demand for the production pressure difference is reduced, and only a lower production pressure difference is needed to achieve the same effective control radius of the reservoir.
The above analysis is carried out under the premise that the physical property of the reservoir is unchanged, and the physical property of the reservoir has a crucial influence on the law of seepage in the reservoir.
The starting pressure gradient of a reservoir is a form of reservoirs’ physical properties. There is a functional relationship between the starting pressure gradient of a low-permeability tight sandstone gas reservoir and its fluidity. According to previous studies, the logarithmic relationship between starting pressure gradient
G and mobility
K/
μ is satisfied, which can be expressed as [
27]:
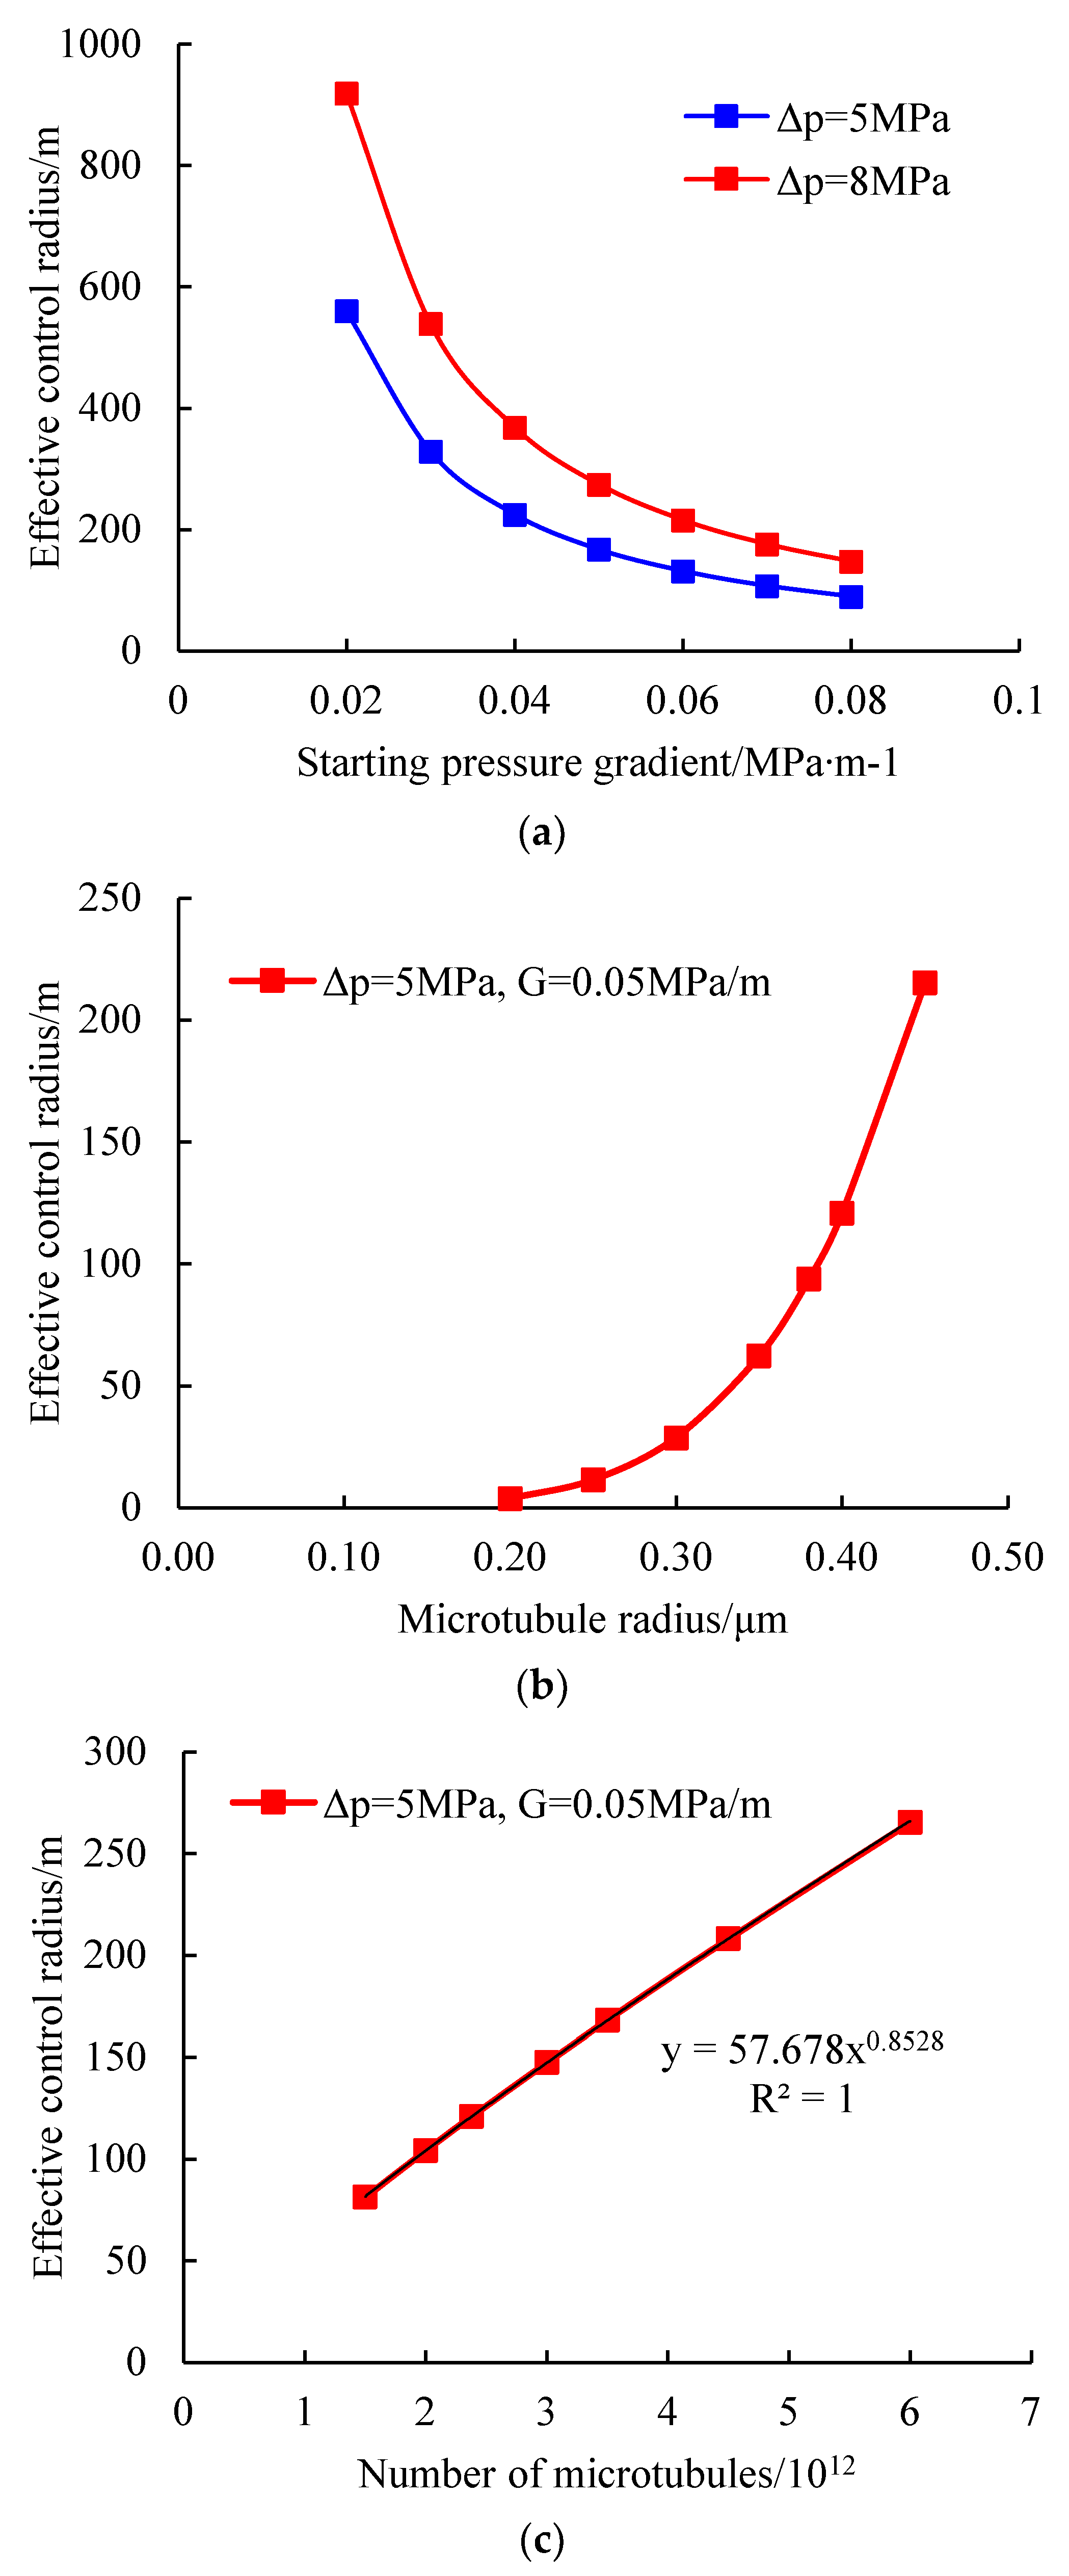
Given the economic limit of daily gas production of 1.5 m
3∙d
−1, the relationship between the effective control radius of the reservoir and the starting pressure gradient under different production pressure differential conditions is shown in
Figure 6a below.
As can be seen from
Figure 6a, under certain production pressure differential conditions, the effective control radius of the reservoir gradually decreases with the increase in the starting pressure gradient, and the relationship between the two presents a power function. Under certain starting pressure gradient conditions, there is an obvious change trend between the effective control radius and production pressure difference, and the greater the production pressure difference, the greater the effective control radius of the reservoir.
In the theoretical model presented in this paper, the reservoir’s physical properties are mainly reflected in the microtubule radius R and the number of microtubules N, both of which have important effects on the permeability and porosity of the reservoir. The influences of these two parameters on the effective control radius of the reservoir are analyzed respectively.
Given that the production pressure difference is 5 MPa, the starting pressure gradient is 0.05 MPa∙m
−1, and the economic limit of daily gas production is 1.5 m
3∙d
−1, the relationship between the effective control radius of the reservoir and the microtubule radius is shown in
Figure 6b under the condition of a certain number of microtubules.
As can be seen from
Figure 6b, under the condition of a certain number of microtubules, both porosity and permeability of the reservoir increase with the increase in the microtubule radius, the effective control radius of the reservoir gradually increases, and the exponential power relationship between the two accords with “concave”. When the microtubule radius is reduced to a certain extent, the effective control radius of the reservoir becomes very small, which indicates that when the porosity and permeability drop to a certain value, the gas in the reservoir will be difficult to use, and the seepage will be difficult.
Similarly, given that the production pressure difference is 5 MPa, the starting pressure gradient is 0.05 MPa∙m
−1, and the economic limit of daily gas production is 1.5 m
3∙d
−1, the relationship between the effective control radius of the reservoir and the number of microtubules is shown in
Figure 6c under the condition that the microtubule radius is certain.
As can be seen from
Figure 6c, under the condition of a certain microtubule radius, the effective control radius of the reservoir increases with the increase in the number of microtubules, and the exponential power relationship between the two is “convex” (that is, the power index is less than 1).
Based on the above analysis, the calculation results of the effective control radius of the Sulige tight sandstone gas reservoir under different production conditions and given reservoir physical properties are shown in
Table 2 below.
Based on the calculation results in
Table 2, the effective development well spacing in different regions of the Sulige gas field can be determined.
4. Recovery Evaluation of Tight Sandstone Gas Reservoirs
According to the definition of recovery efficiency, the gas recovery is:
where
η is gas recovery, in %;
Gp is the cumulative gas production, in 10
4 m
3; and
G is the geological reserves, in 10
4 m
3.
For the circular uniform constant pressure boundary formation of equal thickness shown in
Figure 2, its geological reserves are:
where
Sg is the gas saturation.
The cumulative gas production
Gp is calculated from the productivity equation (Equation (14)) in
Section 3.
Through Matlab software programming, the output/pressure changes under different conditions can be calculated respectively under two modes of constant pressure difference production and constant flow production.
4.1. Gas Recovery under Different Conditions at a Given Pressure Difference
Based on the productivity equation (Equation (14)), the program’s realization of the constant pressure difference production process is as follows:
(1) The parameters and initial conditions were assigned: the external boundary pressure pe(0) = 30 MPa; bottom-hole flow pressure pwf(0) = 30 MPa; the coefficient , (viscosity μ and deviation factor Z are functions of average pressure p = (pe + pwf)/2); the cumulative gas production Gp(0) = 0; and gas recovery η(0) = 0.
(2) For constant pressure difference production, production pressure difference Δ
p =
pe −
pwf was a fixed value. Keeping
pe unchanged before the bottom hole flow pressure
pwf could drop to
pe-Δ
p,
pwf was adjusted to the 0.5 MPa drop interval. The flow rate
Qsc was obtained by calculating Equation (14), and gas recovery was calculated using the definition (Equation (21)).
(3) When the bottom-hole flow pressure pwf dropped to pe − Δp, pe and pwf simultaneously dropped at an interval of 0.5 MPa to keep the pressure difference Δp unchanged, and the flow rate Qsc was calculated by Equation (14) as in step (2).
(4) The cycle was followed until the termination condition was reached (pwf reached the abandonment pressure).
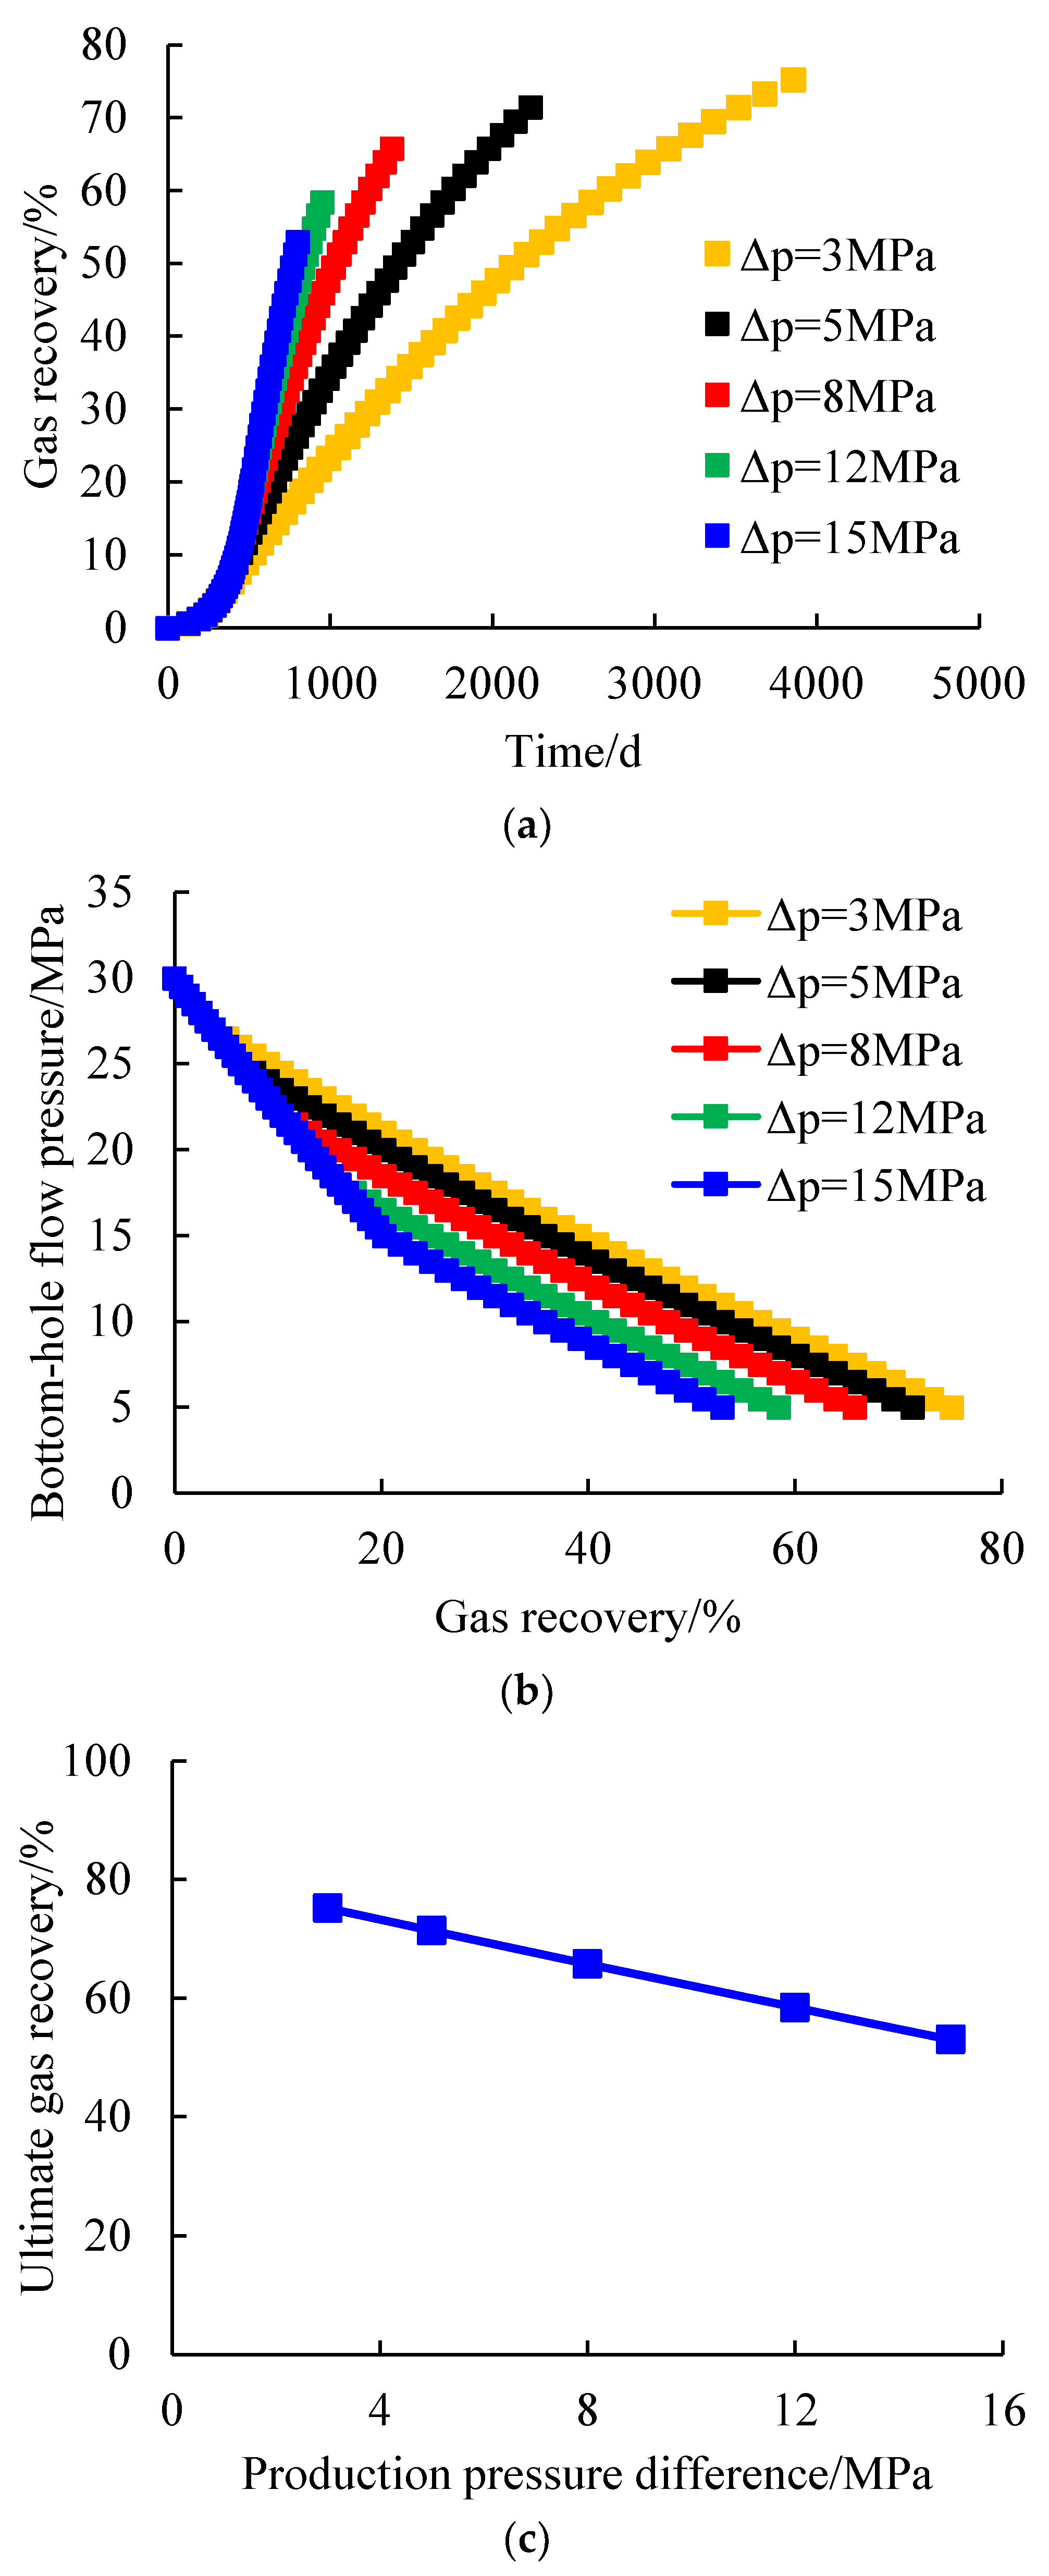
The production process of constant pressure difference under different production pressure differences was simulated to obtain the variation curves of gas recovery with time and bottom-hole flow pressure (
Figure 7a,b), and the relationship between the ultimate gas recovery and production pressure difference was fitted, as shown in
Figure 7c.
It can be seen from
Figure 7a,b that under constant pressure differential production, the greater the production pressure differential, the faster the bottom-hole flow pressure drop, the shorter the time required to reach the abandoned bottom-hole pressure, and the corresponding recovery degree, that is, the smaller the gas recovery. When the production pressure difference is 3 MPa, 5 MPa, 8 MPa, 12 MPa, and 15 MPa, the ultimate gas recovery after reaching the abandoned bottom-hole pressure is 75.18%, 71.40%, 65.78%, 58.42%, and 53.01%, respectively. As can be seen from
Figure 7c, the ultimate gas recovery after reaching the abandoned bottom-hole pressure decreases with the increase in the production pressure difference, and the relationship between the two basically satisfies the linear function.
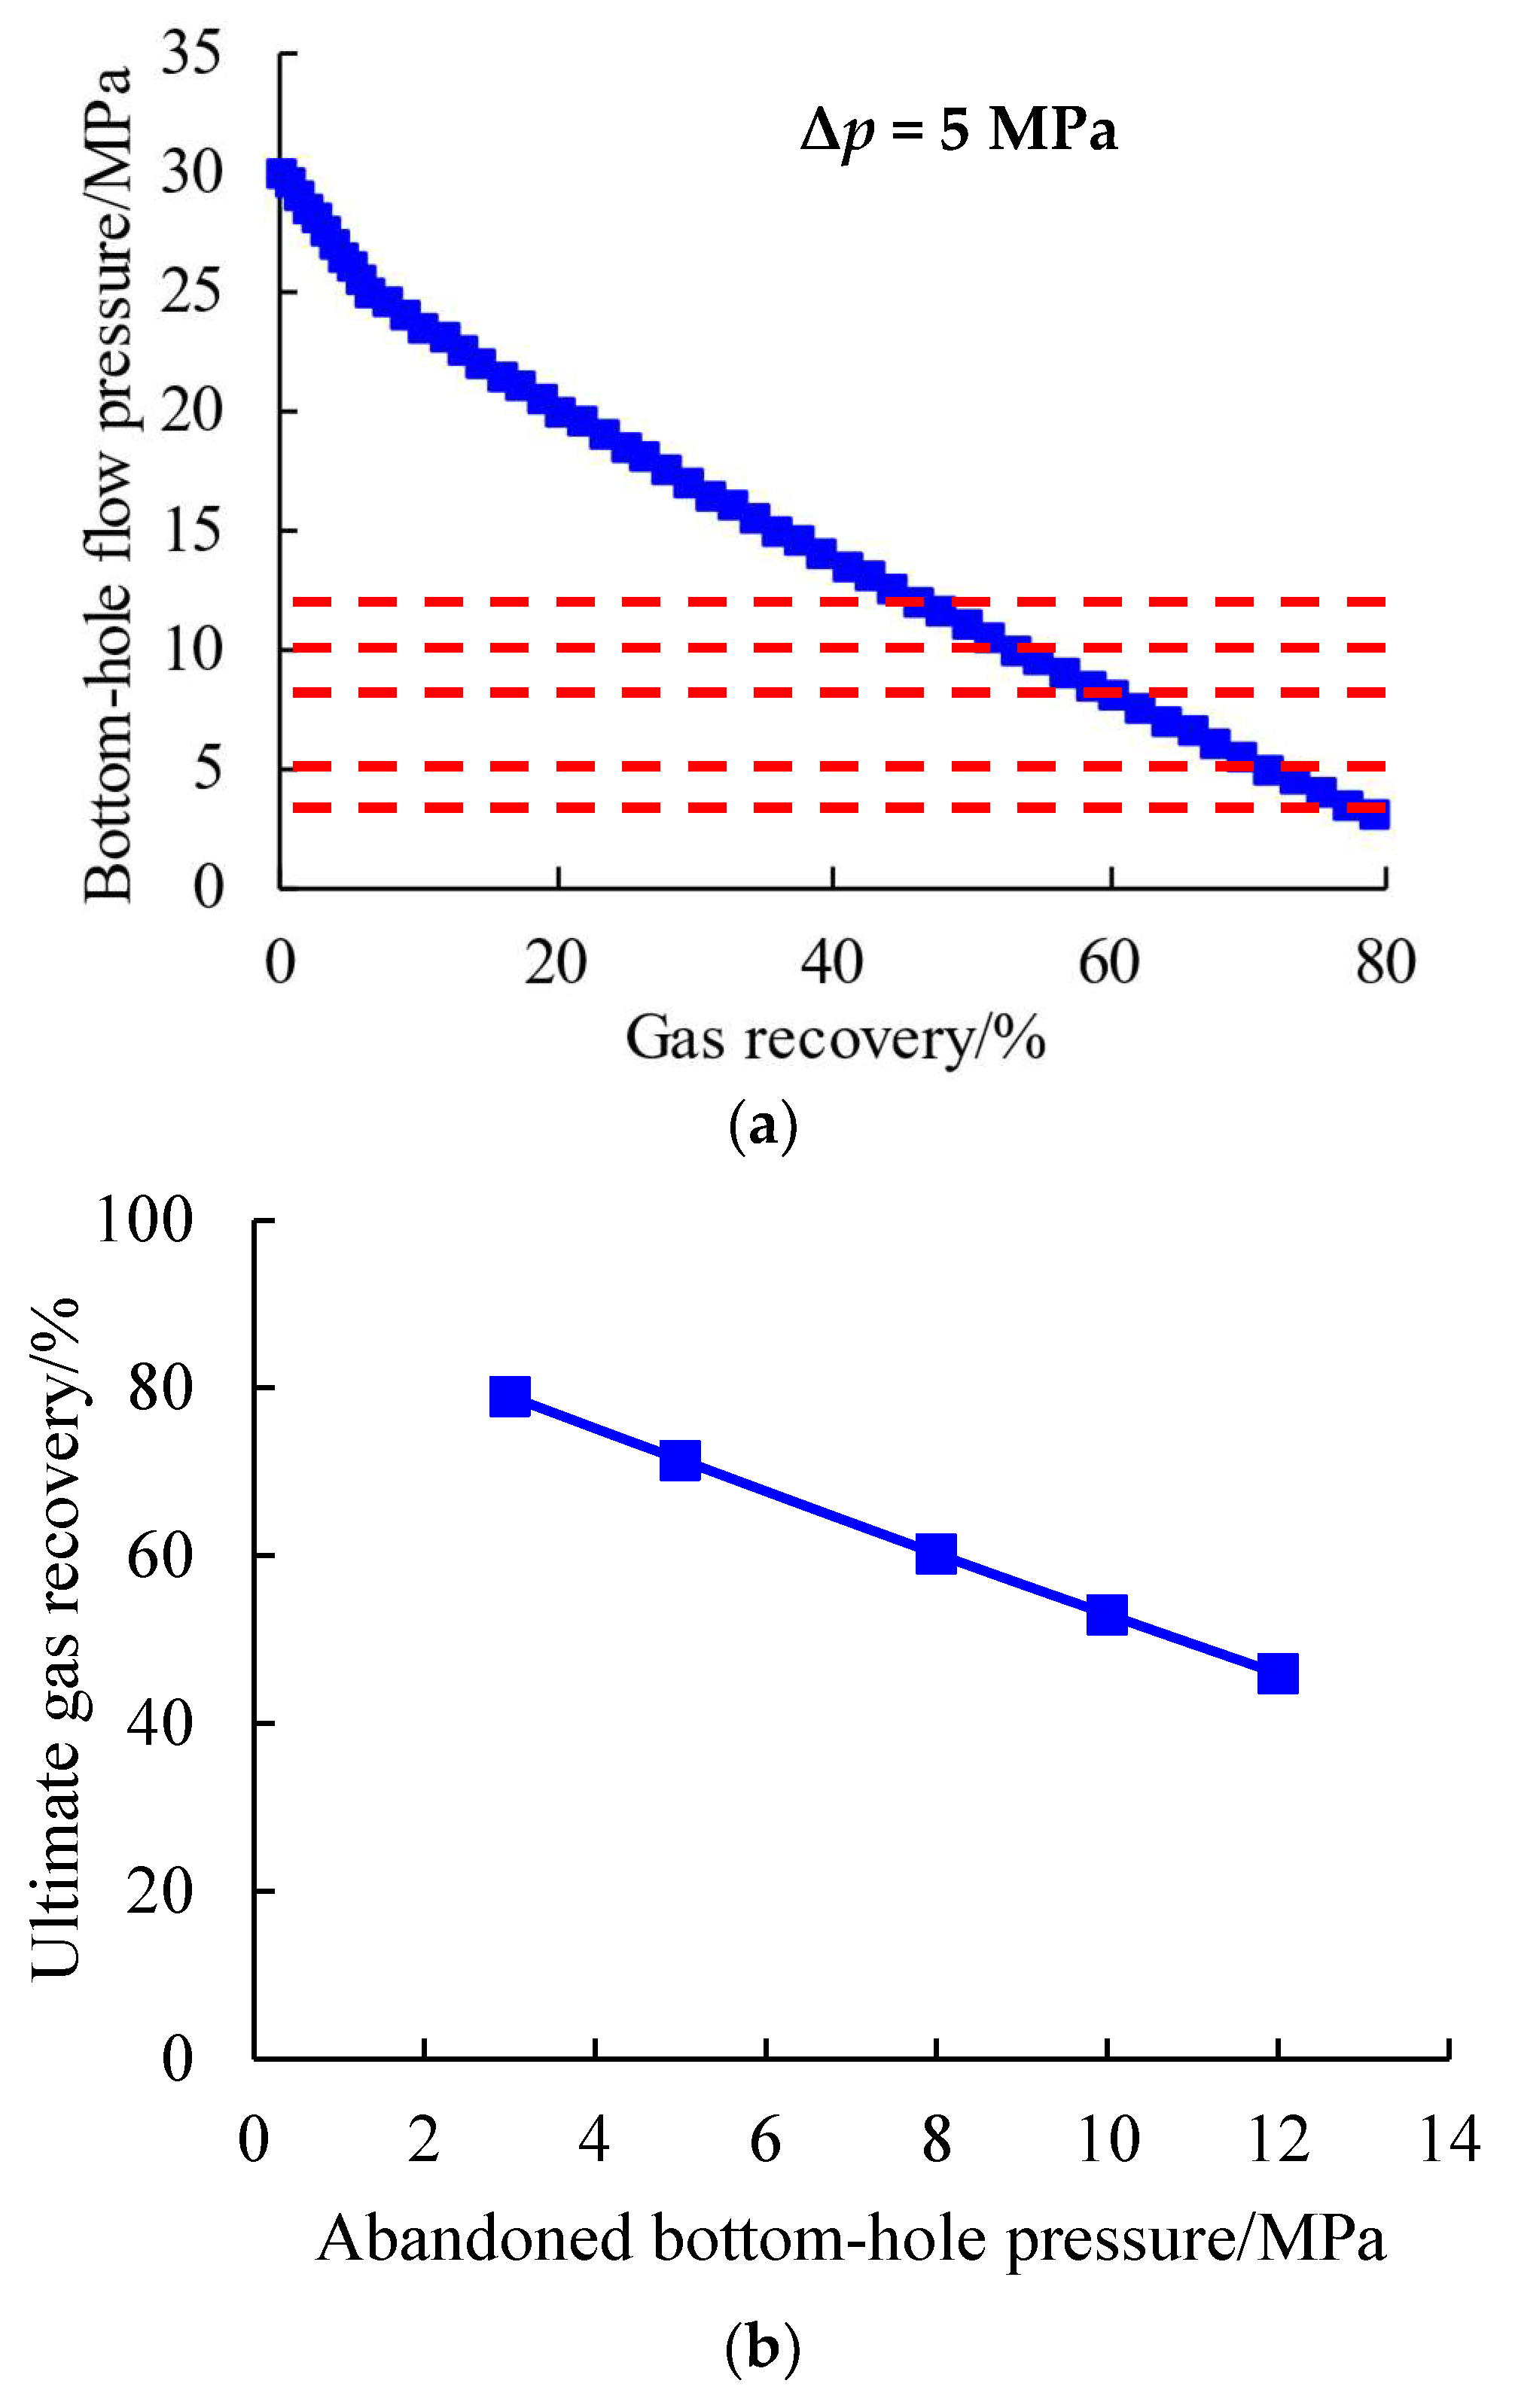
Under the condition of constant reservoir physical properties, given a production pressure difference of 5 MPa, the change curve of gas recovery with bottom-hole flow pressure was simulated (
Figure 8a), and the relationship curve between ultimate gas recovery and abandoned bottom-hole pressure was fitted, as shown in
Figure 8b.
As can be seen from
Figure 8a, under the condition that the production pressure difference is 5 MPa, the corresponding gas recovery gradually decreases with the increase in the abandoned bottom-hole pressure. When the abandoned bottom-hole pressure is 3 MPa, 5 MPa, 8 MPa, 10 MPa, and 12 MPa, the ultimate gas recovery is 78.98%, 71.40%, 60.25%, 53.01%, and 45.98%, respectively, and the relationship between the ultimate gas recovery and the abandoned bottom-hole pressure basically presents a linear function (
Figure 8b).
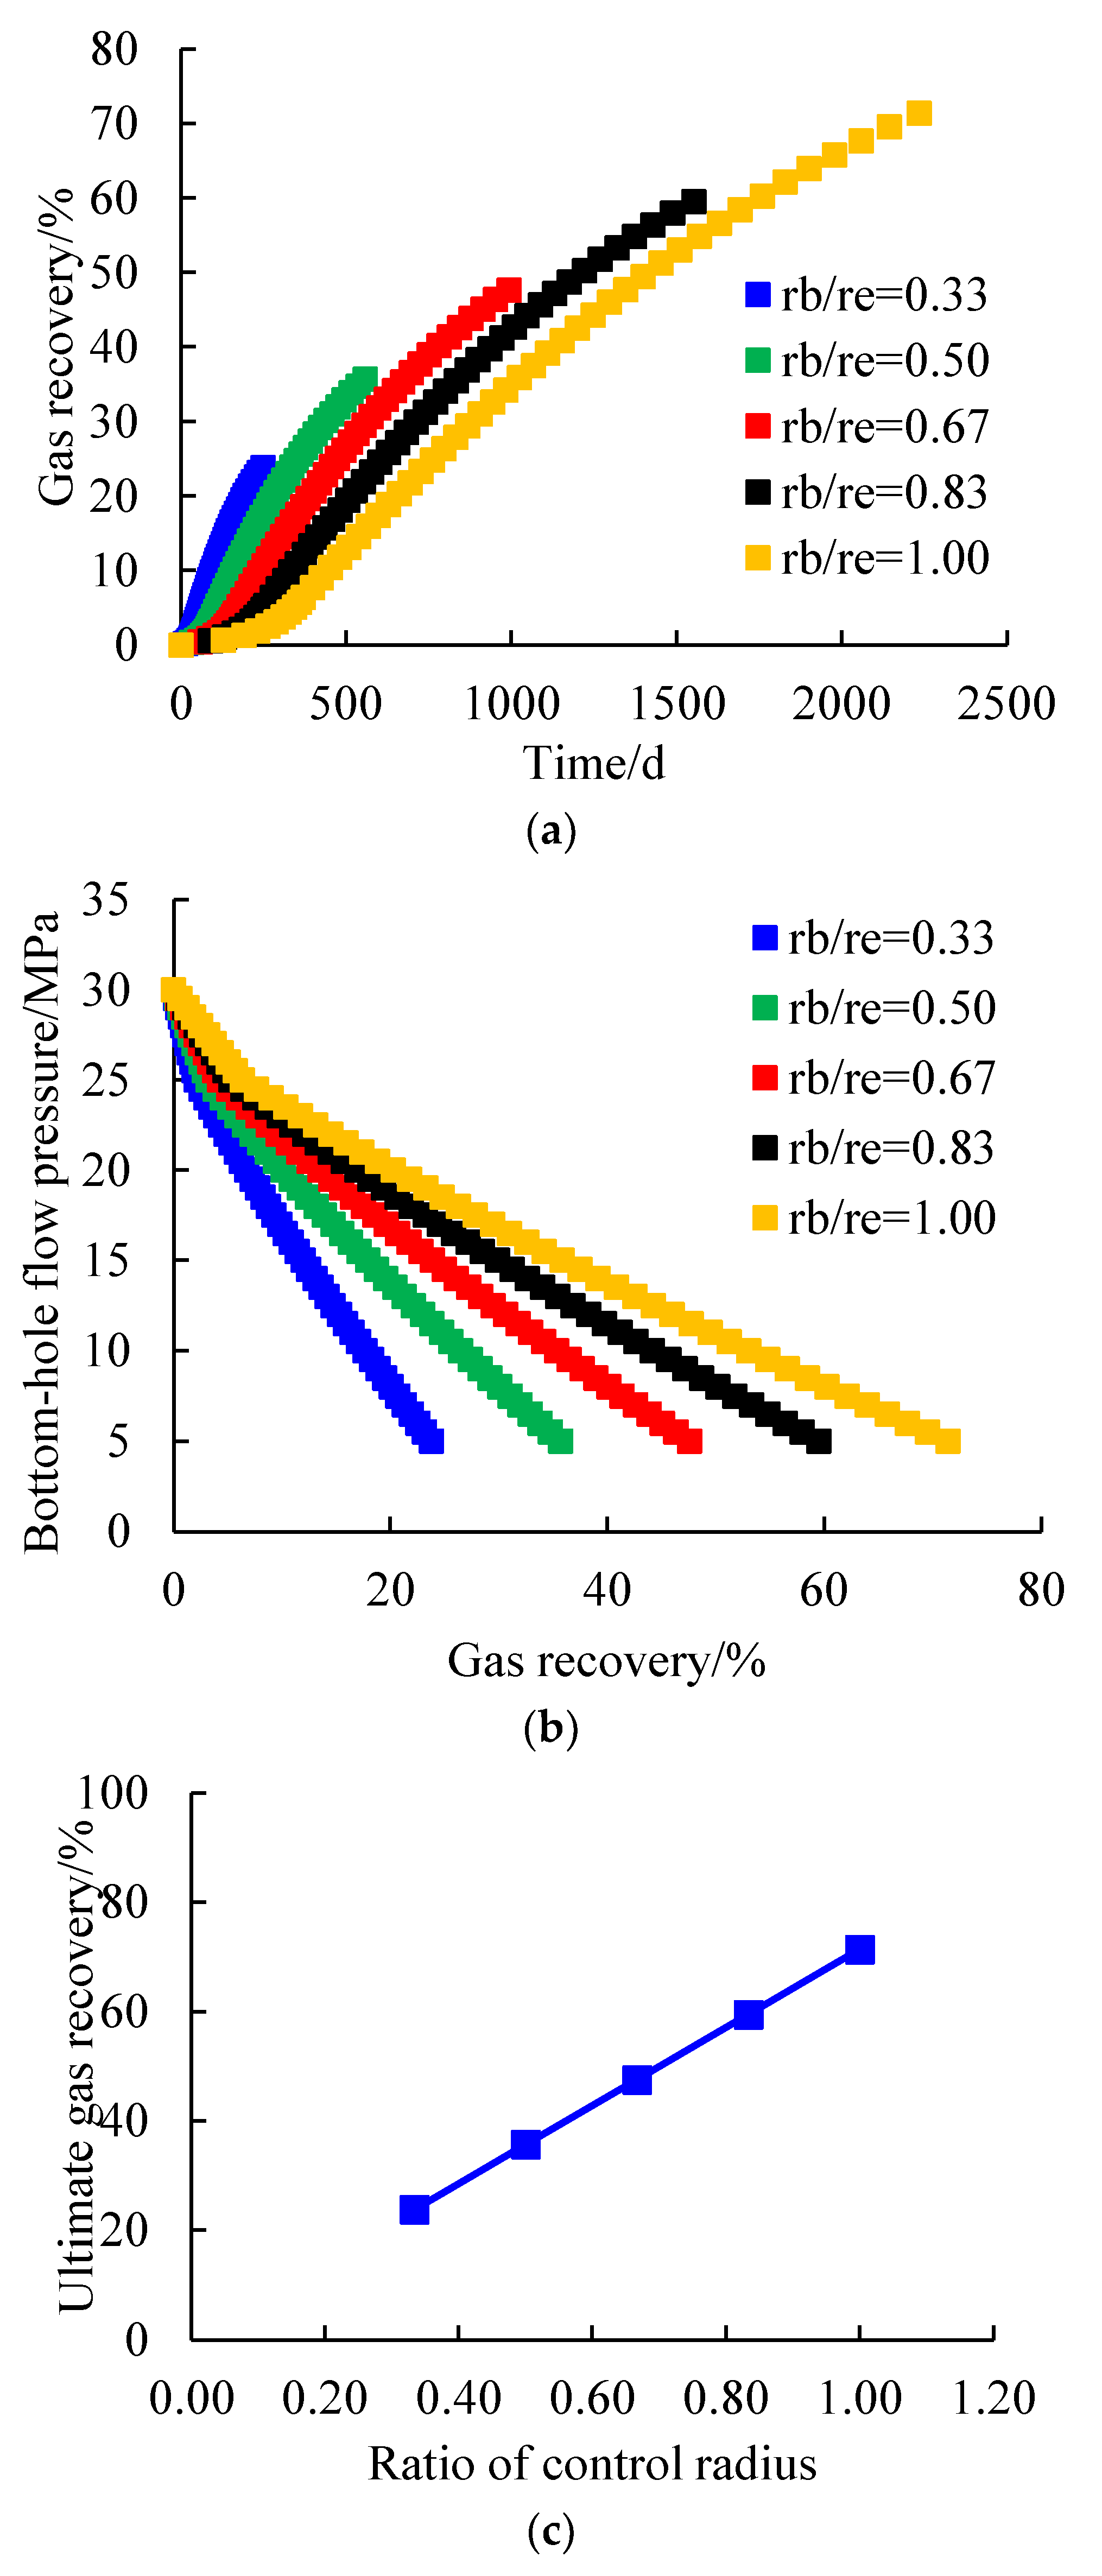
The size of the single-well control radius is the standard to measure the recoverable reserves of a gas well. A larger single-well control radius means more reservoir reserves can be utilized by a gas well. Under the condition that the reservoir’s physical properties and reservoir radius remain unchanged, the production pressure difference is 5 MPa, and the change curves of gas recovery with time and bottom-hole flow pressure under different ratios of the control radius were simulated (
Figure 9a,b). The relationship curves between the ultimate gas recovery and the ratio of control radius were fitted, as shown in
Figure 9c.
As can be seen from
Figure 9a,b, under the condition that the production pressure difference is 5 MPa, the smaller the control radius of a single well, the smaller its ratio to the reservoir radius, the faster the bottom-hole flow pressure drops, and the smaller the gas recovery under the same bottom-hole flow pressure. When the ratio of the control radius is 0.33, 0.50, 0.67, 0.83, and 1.00, the ultimate recovery rate of gas reservoir is 23.78%, 35.69%, 47.59%, 59.49%, and 71.40%, respectively. As can be seen from
Figure 9c, the ultimate gas recovery after reaching the abandoned bottom-hole pressure increases with the increase in the ratio of the control radius, and the relationship between the two is in line with a linear function.
Reservoir quality index (RQI) is a characteristic parameter that reflects the change in the microscopic pore structure and is an embodiment of a reservoir’s physical properties. The reservoir quality index is defined as [
28]:
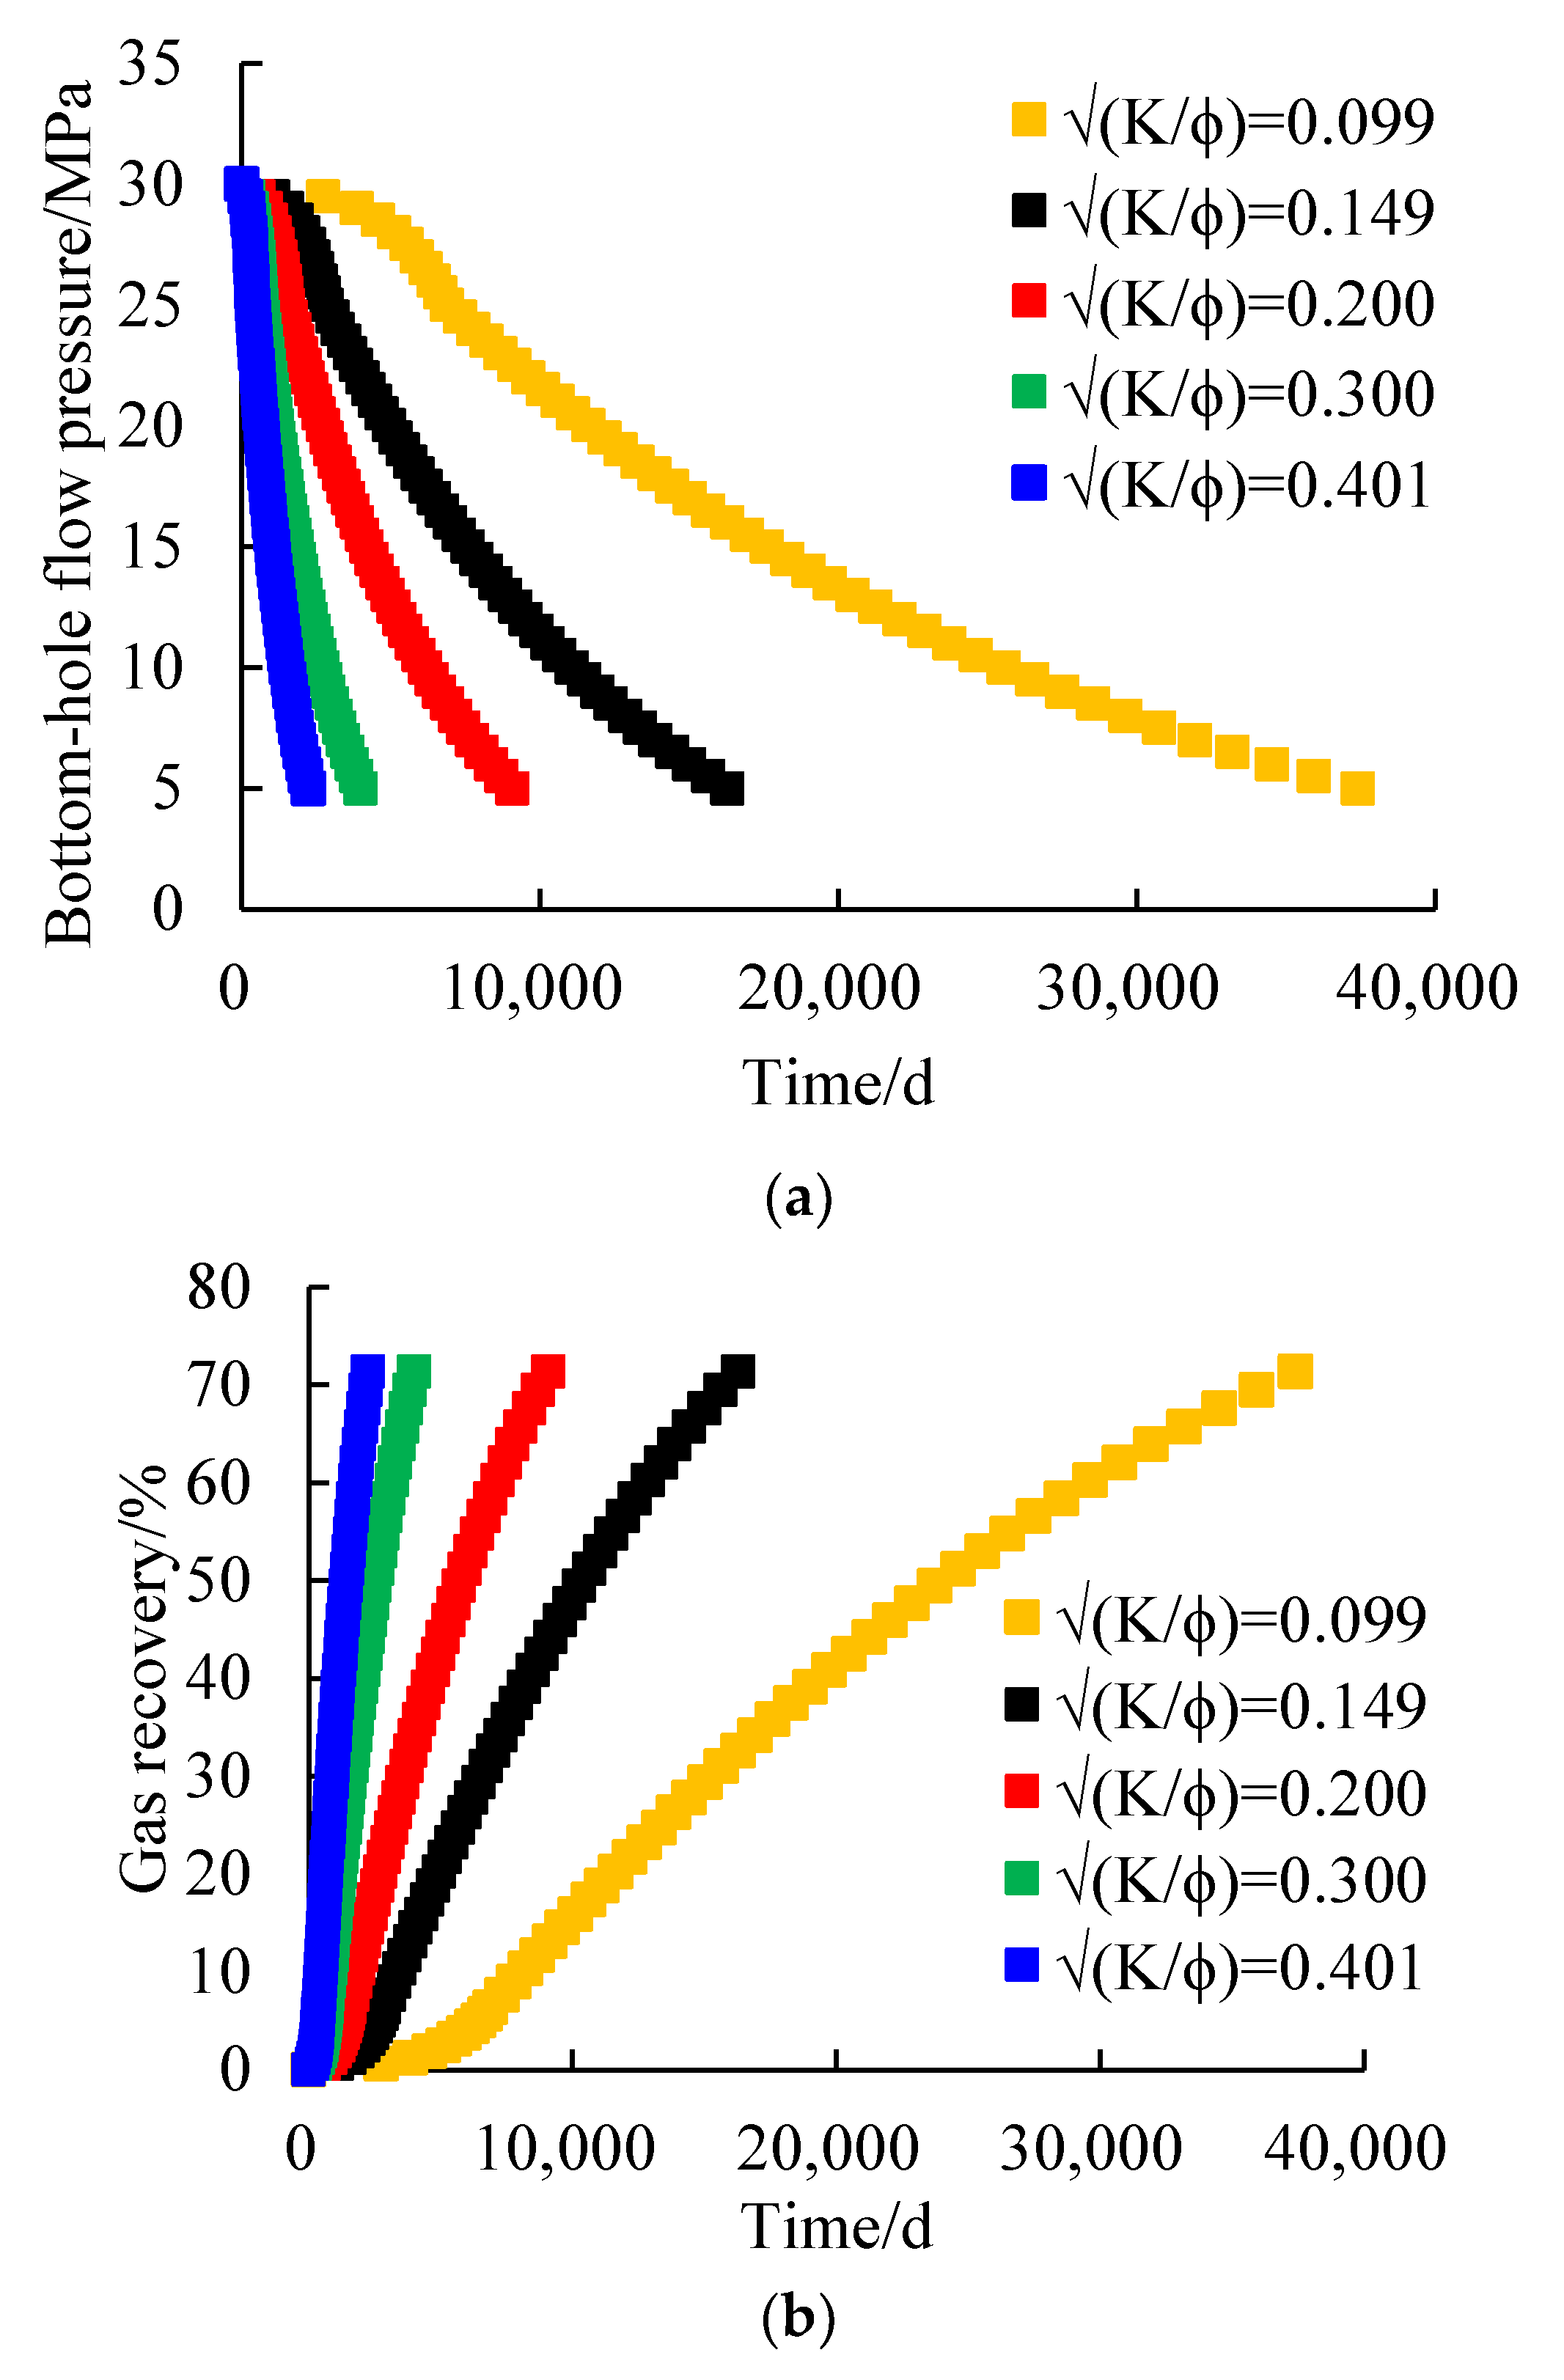
Given that the production pressure difference is 5 MPa, the variation curves of bottom-hole flow pressure and gas recovery with time under different reservoir quality indexes were simulated, as shown in
Figure 10a,b.
It can be seen from
Figure 10a,b that reservoirs with different reservoir quality indexes have the same ultimate gas recovery after production reaches abandoned bottom-hole pressure, but the time required is different. The larger the reservoir quality index is, the faster the bottom-hole flow pressure drops, and the shorter the time required to reach abandoned bottom-hole pressure.
4.2. Gas Recovery under Different Conditions at a Given Production Rate
Based on the productivity equation (Equation (14)), the program’s realization of the production process with a fixed production rate was as follows:
(1) As with the production of the constant pressure difference, the parameters and initial conditions were preassigned: the external boundary pressure pe(0) = 30 MPa; bottom-hole flow pressure pwf(0) = 30 MPa; the coefficient , (viscosity μ and deviation factor Z are functions of average pressure p = (pe + pwf)/2); the cumulative gas production Gp(0) = 0; and gas recovery η(0) = 0.
(2) Production starting point:
Qsc is a fixed value. Assuming that the starting point (point 1)
pe is unchanged, that is,
pe(1) = 30 MPa, then the average pressure
p(1) = (
pe(1) +
pwf(1))/2 = (30 +
pwf(1))/2. Viscosity
μ(1) and deviation factor
Z(1) are functions of average pressure
p(1), coefficients
a(1) and
b(1) are functions of the viscosity and deviation factor, so
a(1) and
b(1) are functions of the average pressure
p(1).
pwf(1) was calculated by Equation (14), and gas recovery was calculated by Equation (21).
(3) Point 2: Assigning ω∙pe(1) + (1 − ω)∙pwf(1) (ω is the scale coefficient) to pe(2), pwf(2) was calculated from Equation (14).
(4) The cycle was followed until the termination condition was reached (
pwf reached the abandonment pressure).
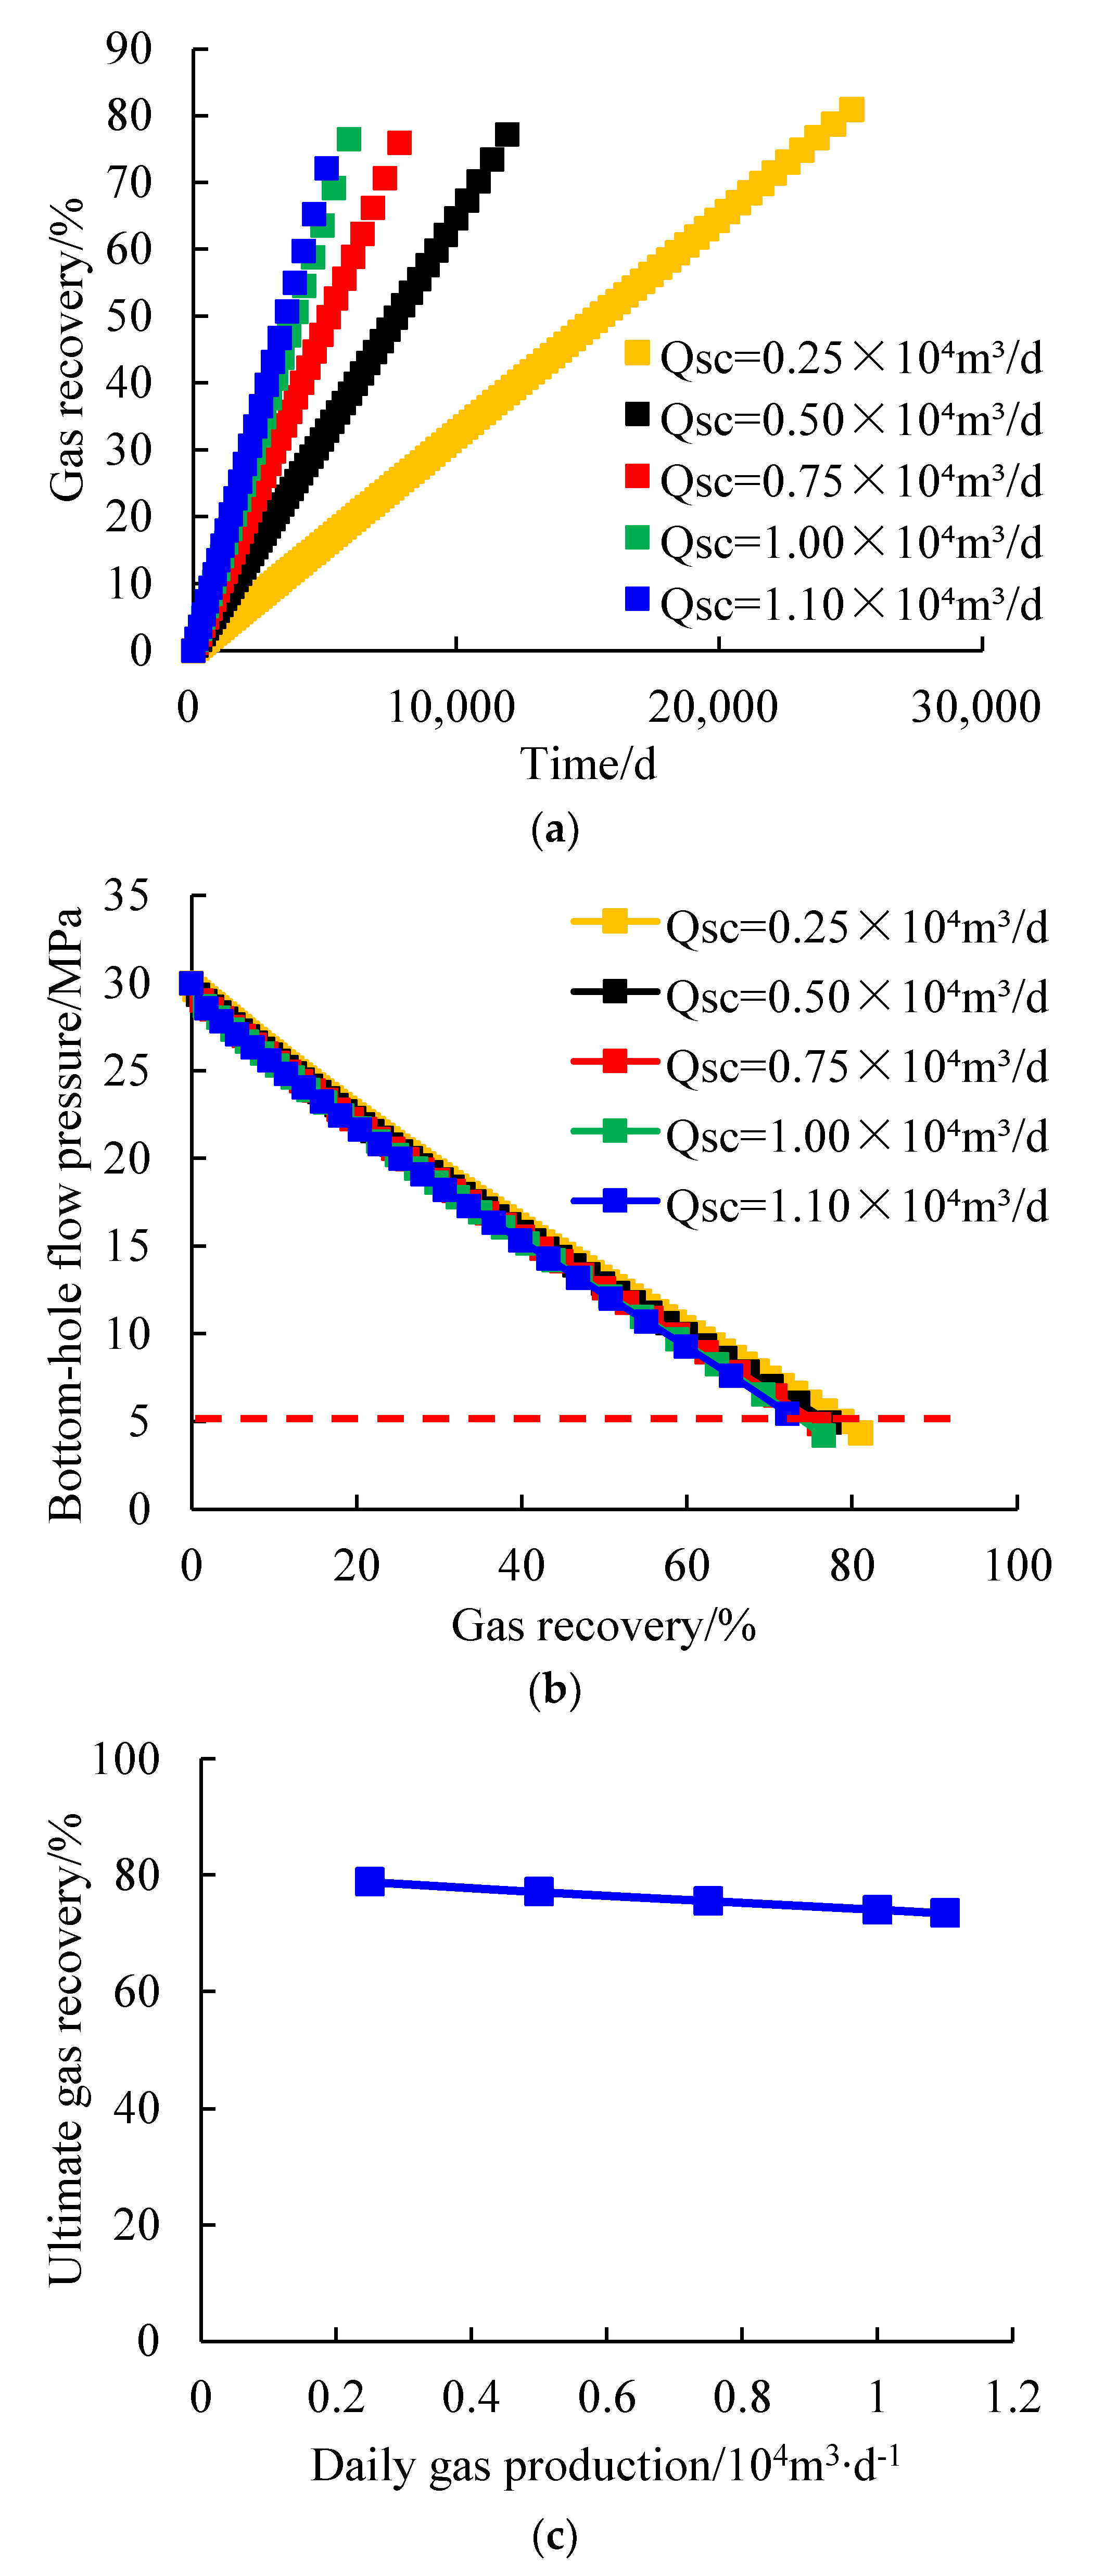
The variation curves of gas recovery with time and bottom-hole flow pressure (
Figure 11a,b) were obtained by simulating the production process at a given production rate under different daily gas production limits, and the relationship between the ultimate gas recovery and daily gas production was fitted, as shown in
Figure 11c.
It can be seen from
Figure 11a,b that at a fixed production rate, the higher the daily gas production, the faster the bottom-hole flow pressure drops, the shorter the time required to reach the abandoned bottom-hole pressure, and the smaller the corresponding gas recovery. When the daily gas production is 0.25 × 10
4 m
3∙d
−1, 0.50 × 10
4 m
3∙d
−1, 0.75 × 10
4 m
3∙d
−1, 1.00 × 10
4 m
3∙d
−1, and 1.10 × 10
4 m
3∙d
−1, the ultimate gas recovery after reaching the abandoned bottom-hole pressure is 78.85%, 77.13%, 75.58%, 74.09%, and 73.47%, respectively. As can be seen from
Figure 11c, the ultimate gas recovery after reaching the abandoned bottom-hole pressure decreases with the increase in daily gas production, and the relationship between the two basically satisfies the linear function.
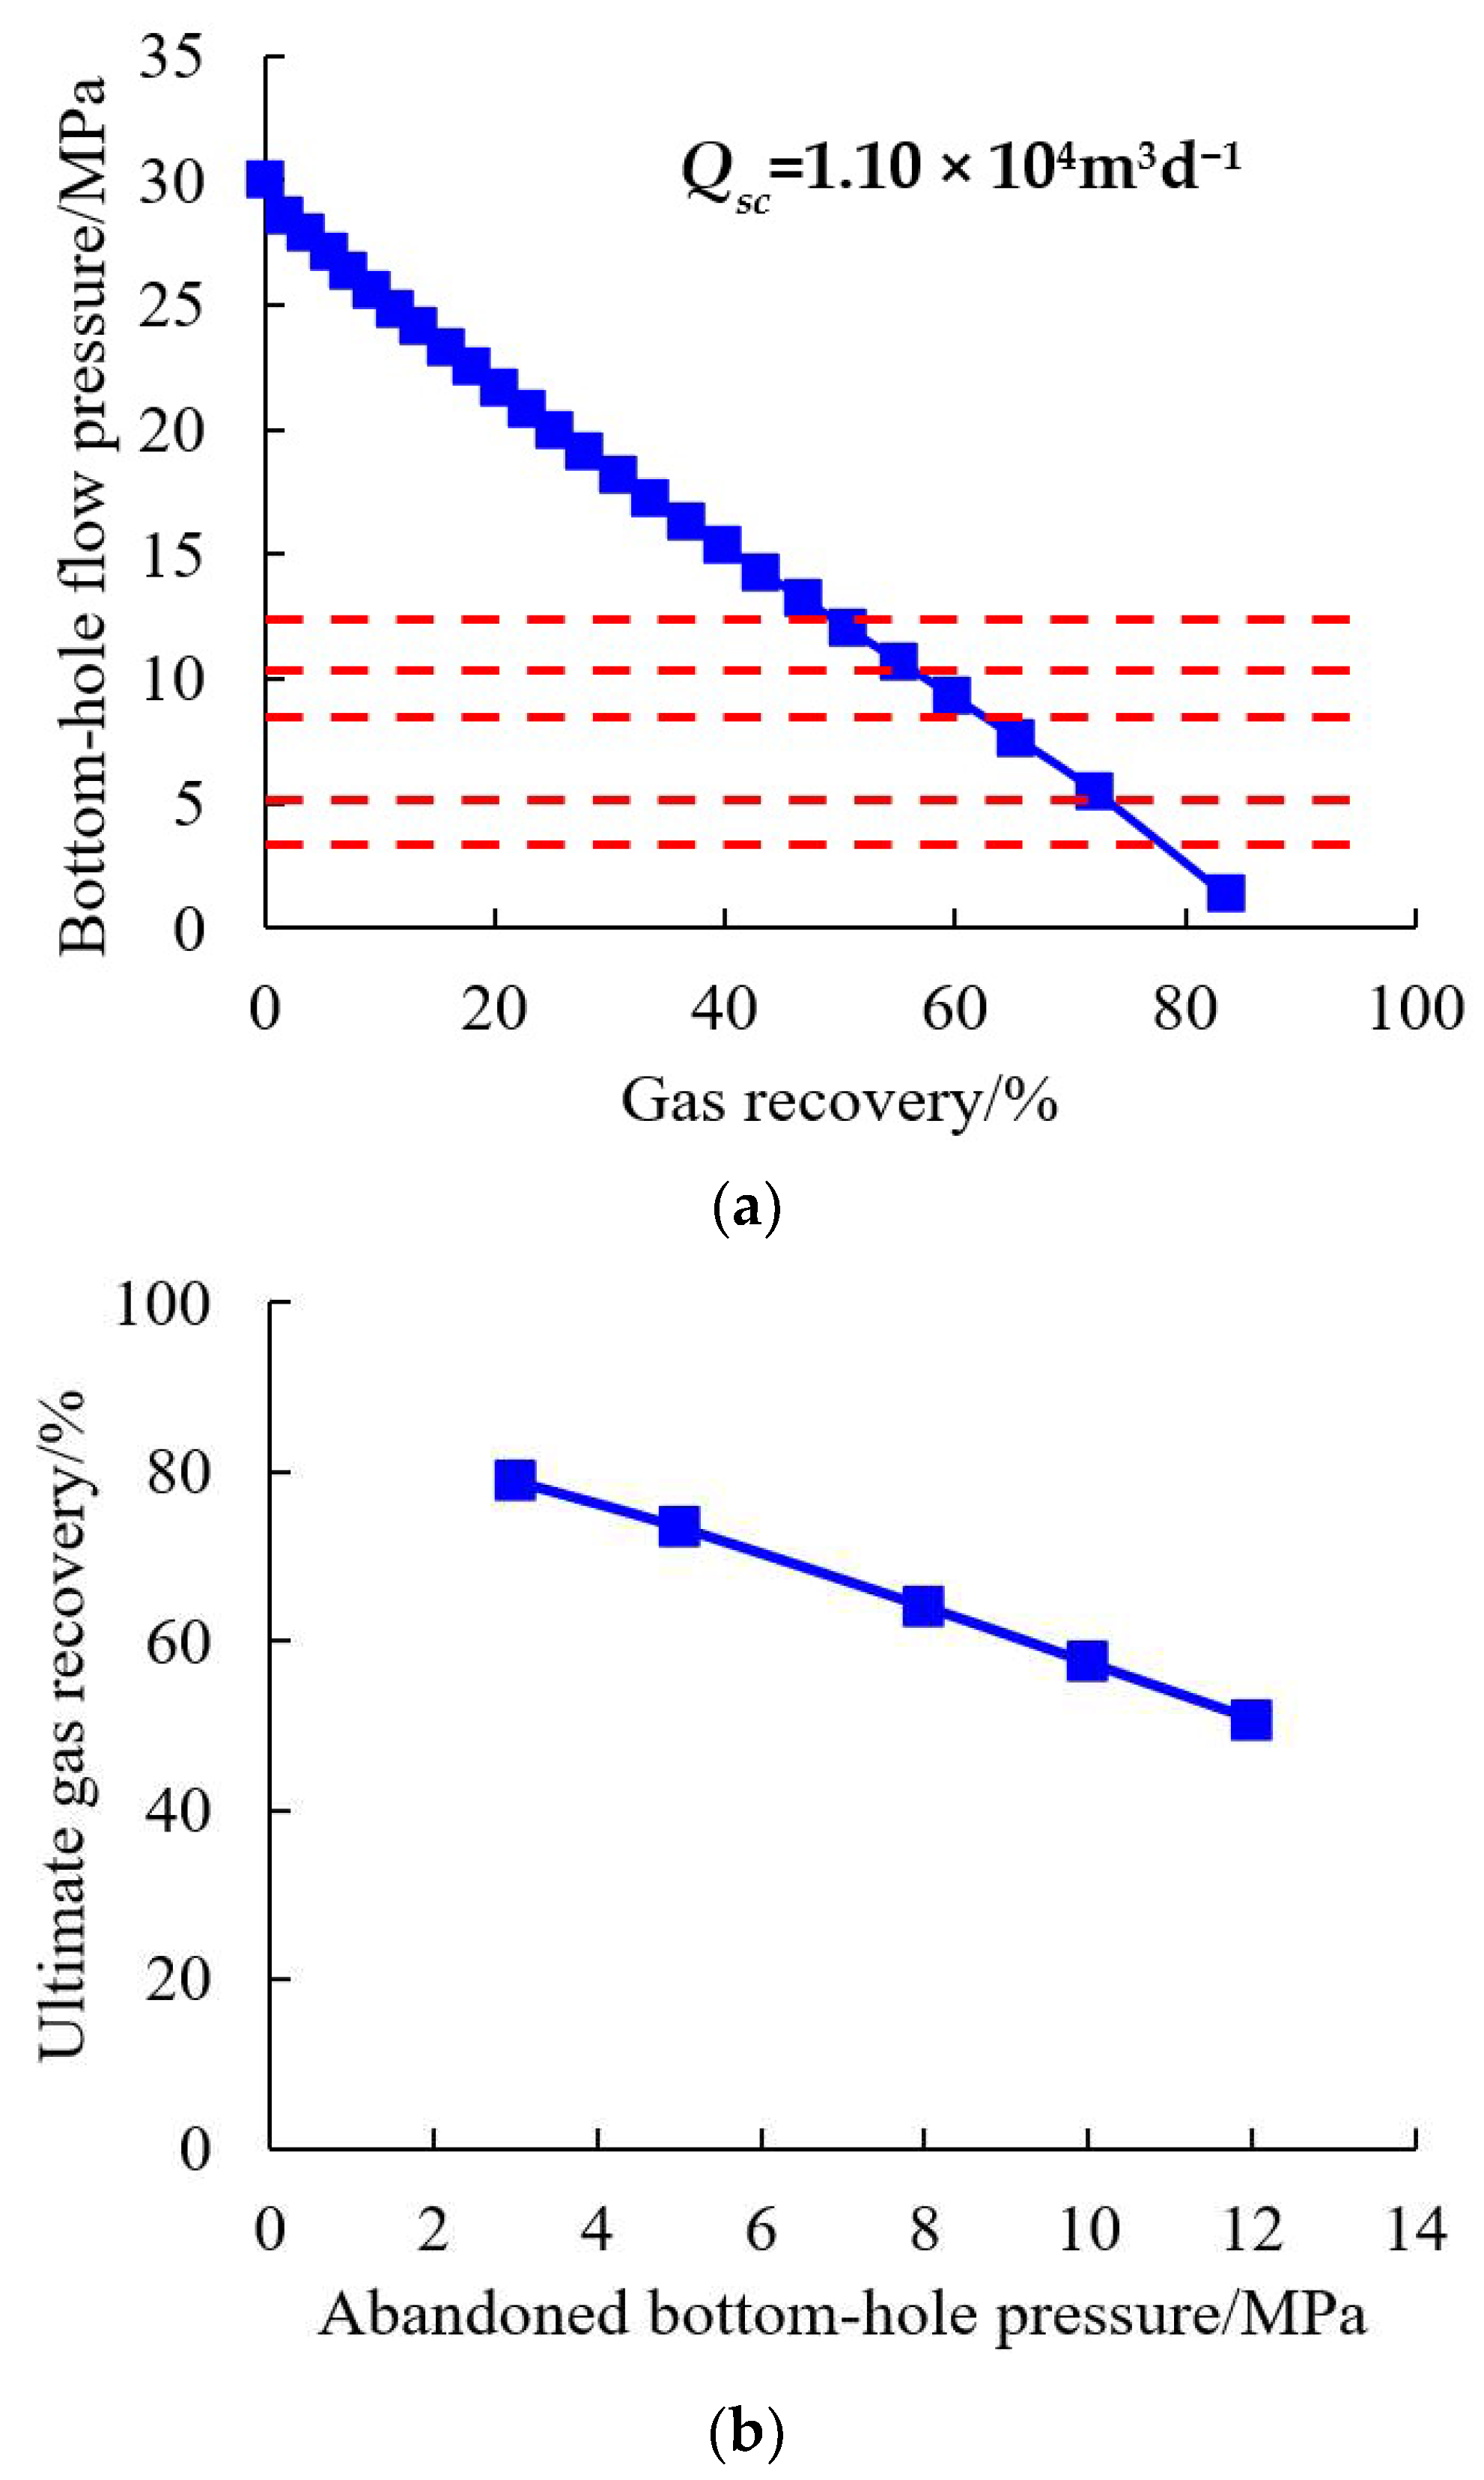
Under the condition of constant reservoir physical properties and given daily gas production of 1.10 × 10
4 m
3∙d
−1, the variation curve of gas recovery with bottom-hole flow pressure was simulated (
Figure 12a), and the relationship curve between the ultimate gas recovery and abandoned bottom-hole pressure was fitted, as shown in
Figure 12b.
As can be seen from
Figure 12a, under the condition of daily gas production of 1.10 × 10
4 m
3∙d
−1, the corresponding gas recovery gradually decreased with the increase in abandoned bottom-hole pressure. When the abandoned bottom-hole pressure is 3 MPa, 5 MPa, 8 MPa, 10 MPa, and 12 MPa, the ultimate gas recovery is 78.93%, 73.47%, 64.09%, 57.48%, and 50.81%, respectively. The relationship between the ultimate gas recovery and the abandoned bottom-hole pressure basically presents a linear function (
Figure 12b).
With the same reservoir physical properties and reservoir radius, given daily gas production of 1.10 × 10
4 m
3∙d
−1, the variation curve of gas recovery with bottom-hole flow pressure under different ratios of the control radius was simulated (
Figure 13a), and the relationship curve between the ultimate gas recovery and the ratio of the control radius was fitted, as shown in
Figure 13b.
As can be seen from
Figure 13a, under the condition of daily gas production of 1.10 × 10
4 m
3∙d
−1, the smaller the control radius, the smaller the ratio to the reservoir radius, the faster the bottom-hole flow pressure drops, and the smaller the gas recovery under the same bottom-hole flow pressure. When the ratio of the control radius is 0.33, 0.50, 0.67, 0.83, and 1.00, the ultimate gas recovery is 8.48%, 19.11%, 34.00%, 53.14%, and 76.55%, respectively. As can be seen from
Figure 13b, the ultimate gas recovery after reaching the abandoned bottom-hole pressure increases with the increase in the ratio of the control radius, and the relationship between the two conforms to the power function relationship.
Given the daily gas production of 1.10 × 10
4 m
3∙d
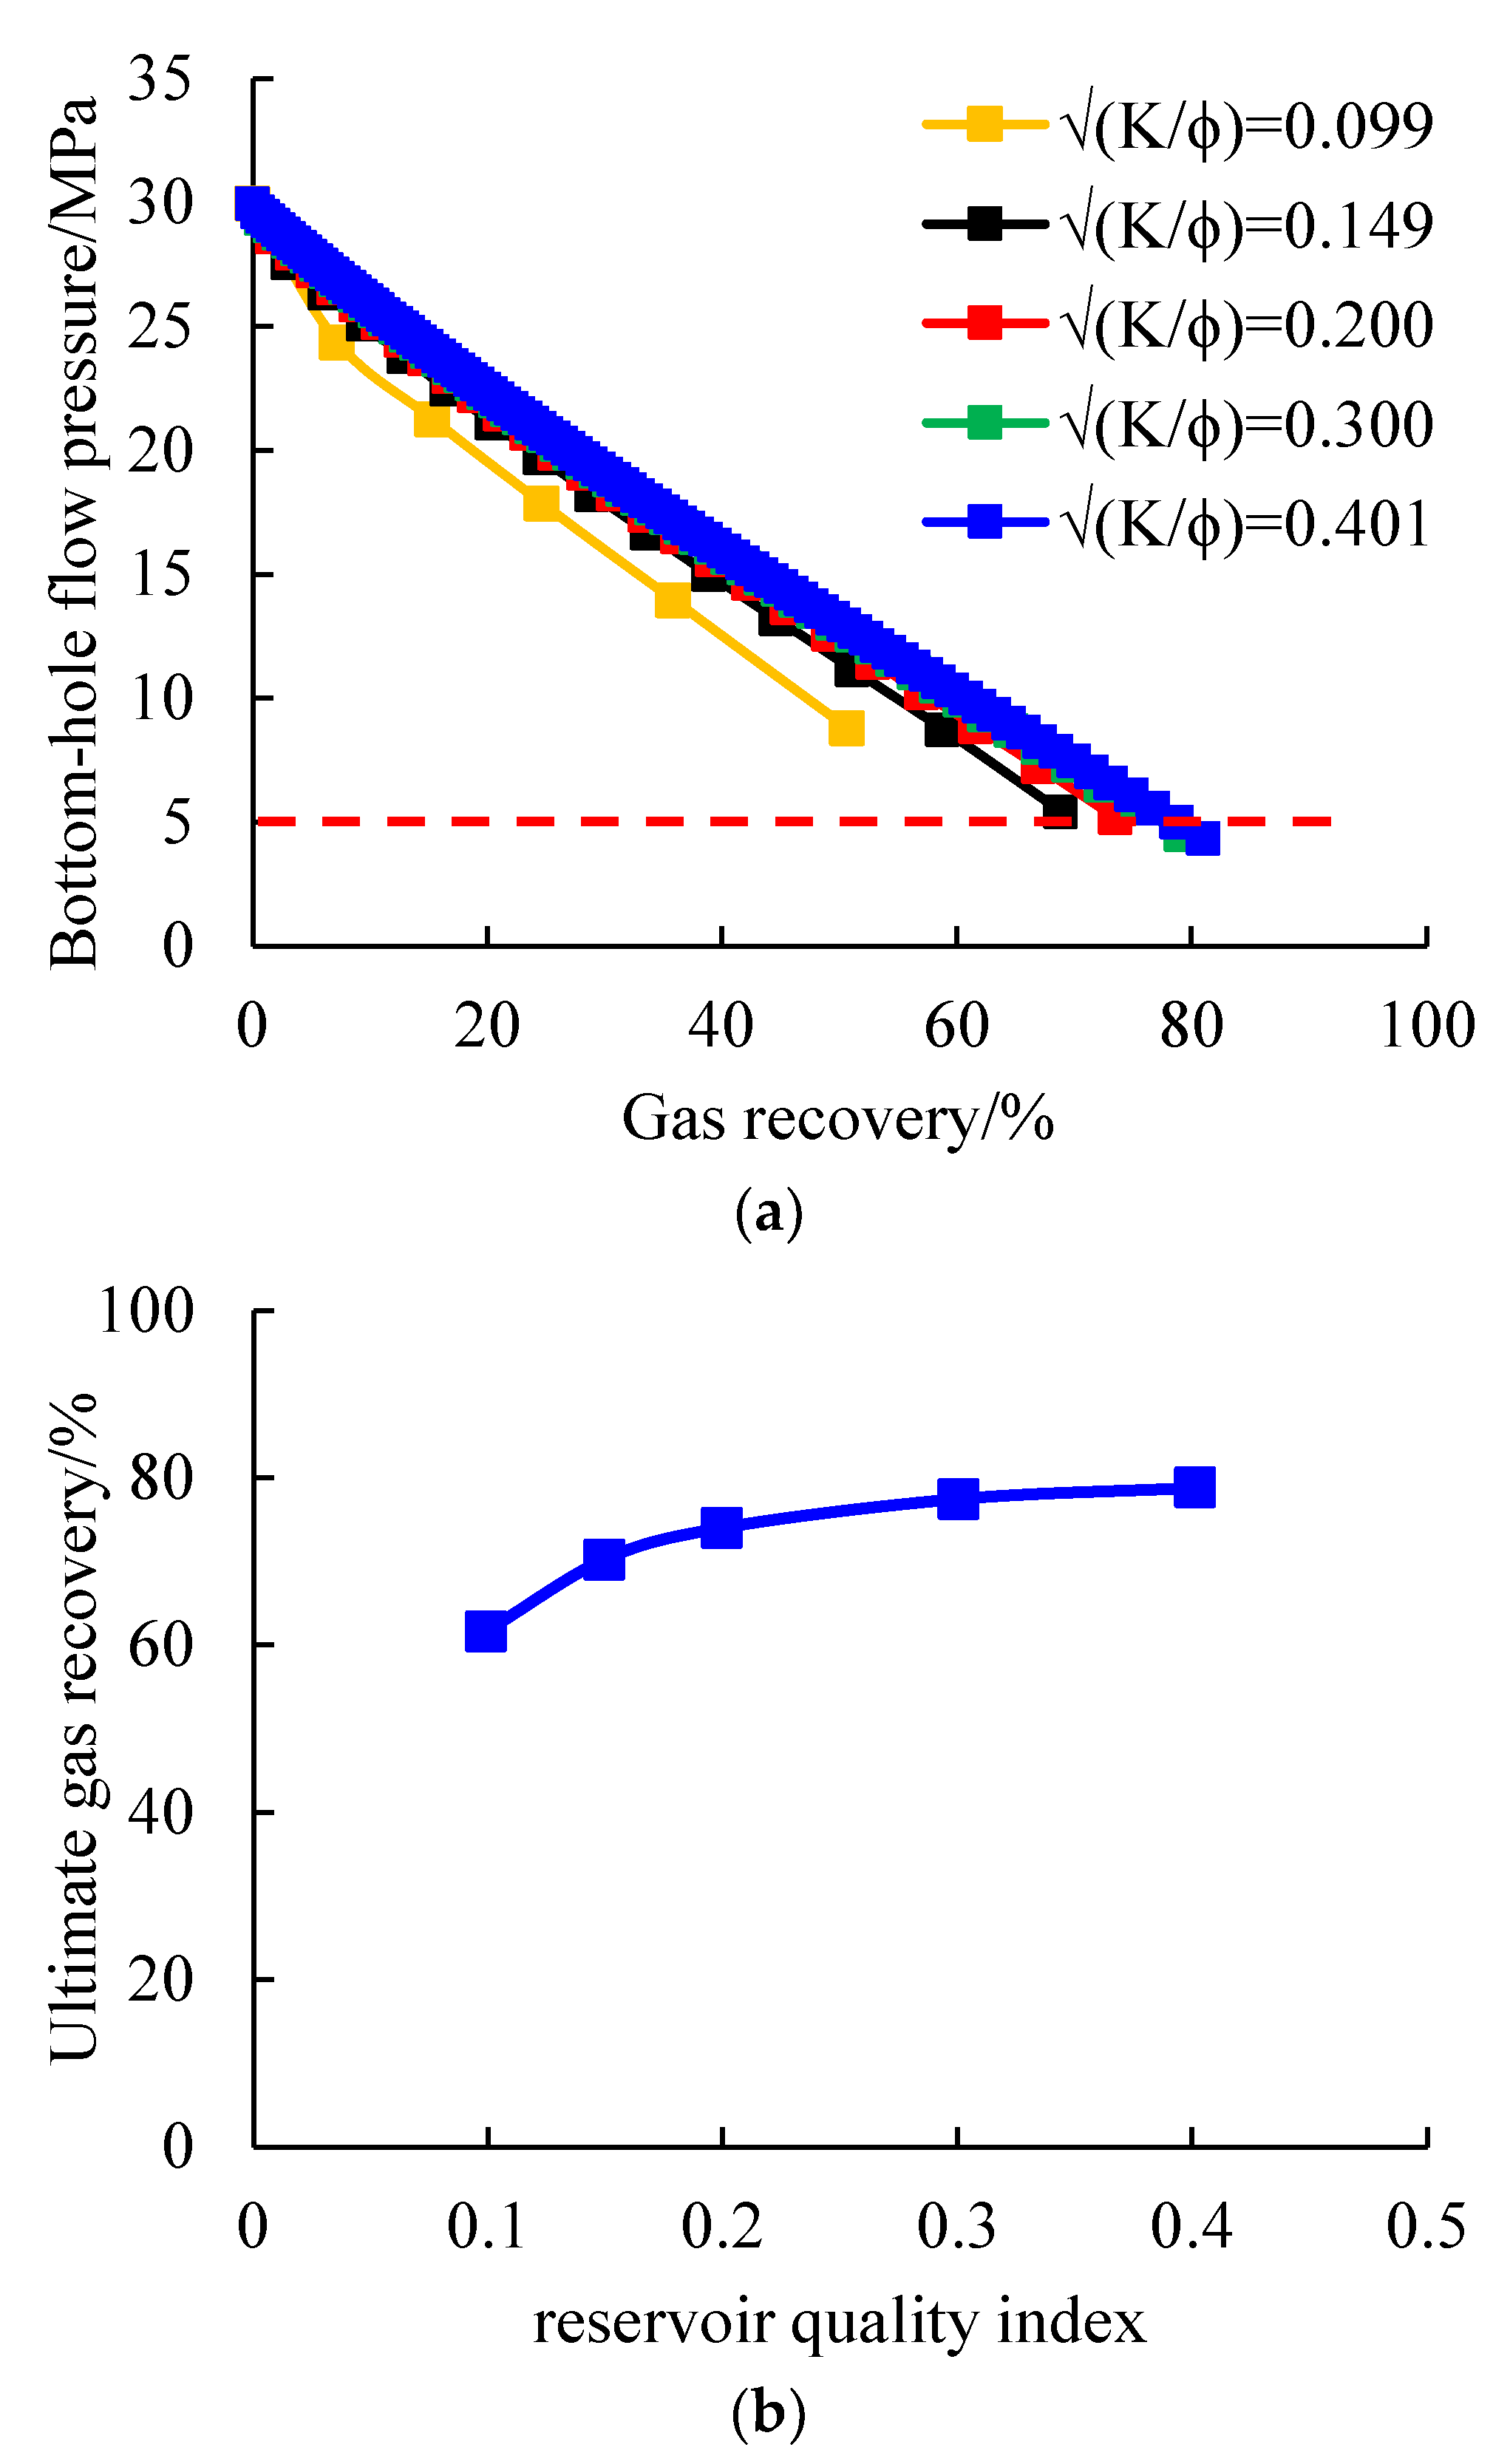
−1, the variation curve of gas recovery with bottom-hole flow pressure under different reservoir quality indexes was simulated (
Figure 14a), and the relationship curve between the ultimate gas recovery and reservoir quality index was fitted, as shown in
Figure 14b.
As can be seen from
Figure 14a, under the condition of daily gas production of 1.10 × 10
4 m
3∙d
−1, the smaller the reservoir quality index is, the faster the bottom-hole flow pressure drops, and the shorter the time required to reach the abandoned bottom-hole pressure. When the reservoir quality index is 0.099, 0.149, 0.200, 0.300, and 0.401, the ultimate gas recovery is 61.64%, 70.22%, 74.03%, 77.46%, and 78.85%, respectively. As can be seen from
Figure 14b, there is a nonlinear relationship between the ultimate gas recovery and the reservoir quality index. With the increase in the reservoir quality index, the ultimate gas recovery first increases rapidly and then slows, and there is an obvious critical permeability (0.1 mD).
4.3. Application Example
The Su75 well is located in the north of the western Sulige gas field, with a block area of 989 km2. The ancient strata in the Su75 block include the Benxi Formation, Taiyuan Formation, Shanxi Formation, Shihezi Formation, and Shiqianfeng Formation from the bottom up. The main gas-bearing formations in the area are He-8 Member and Shan-1 Member; in addition, there are the Taiyuan Formation, Shan-2 Member, and other formations. The reservoir porosity ranges from 5.02% to 19.91%, with an average value of 8.91%. Permeability ranges from 0.005 to 14.726 mD, with an average of 0.077 mD. The original gas saturation of the He-8 Member is 62.3%, that of the Shan-1 Member is 59%. The original formation pressure was 29.22 MPa in the He-8 Member and 29.56 MPa in the Shan-1 Member.
For a select production well in the Su75 well area of the Sulige gas field, the basic geological information is shown in
Table 3.
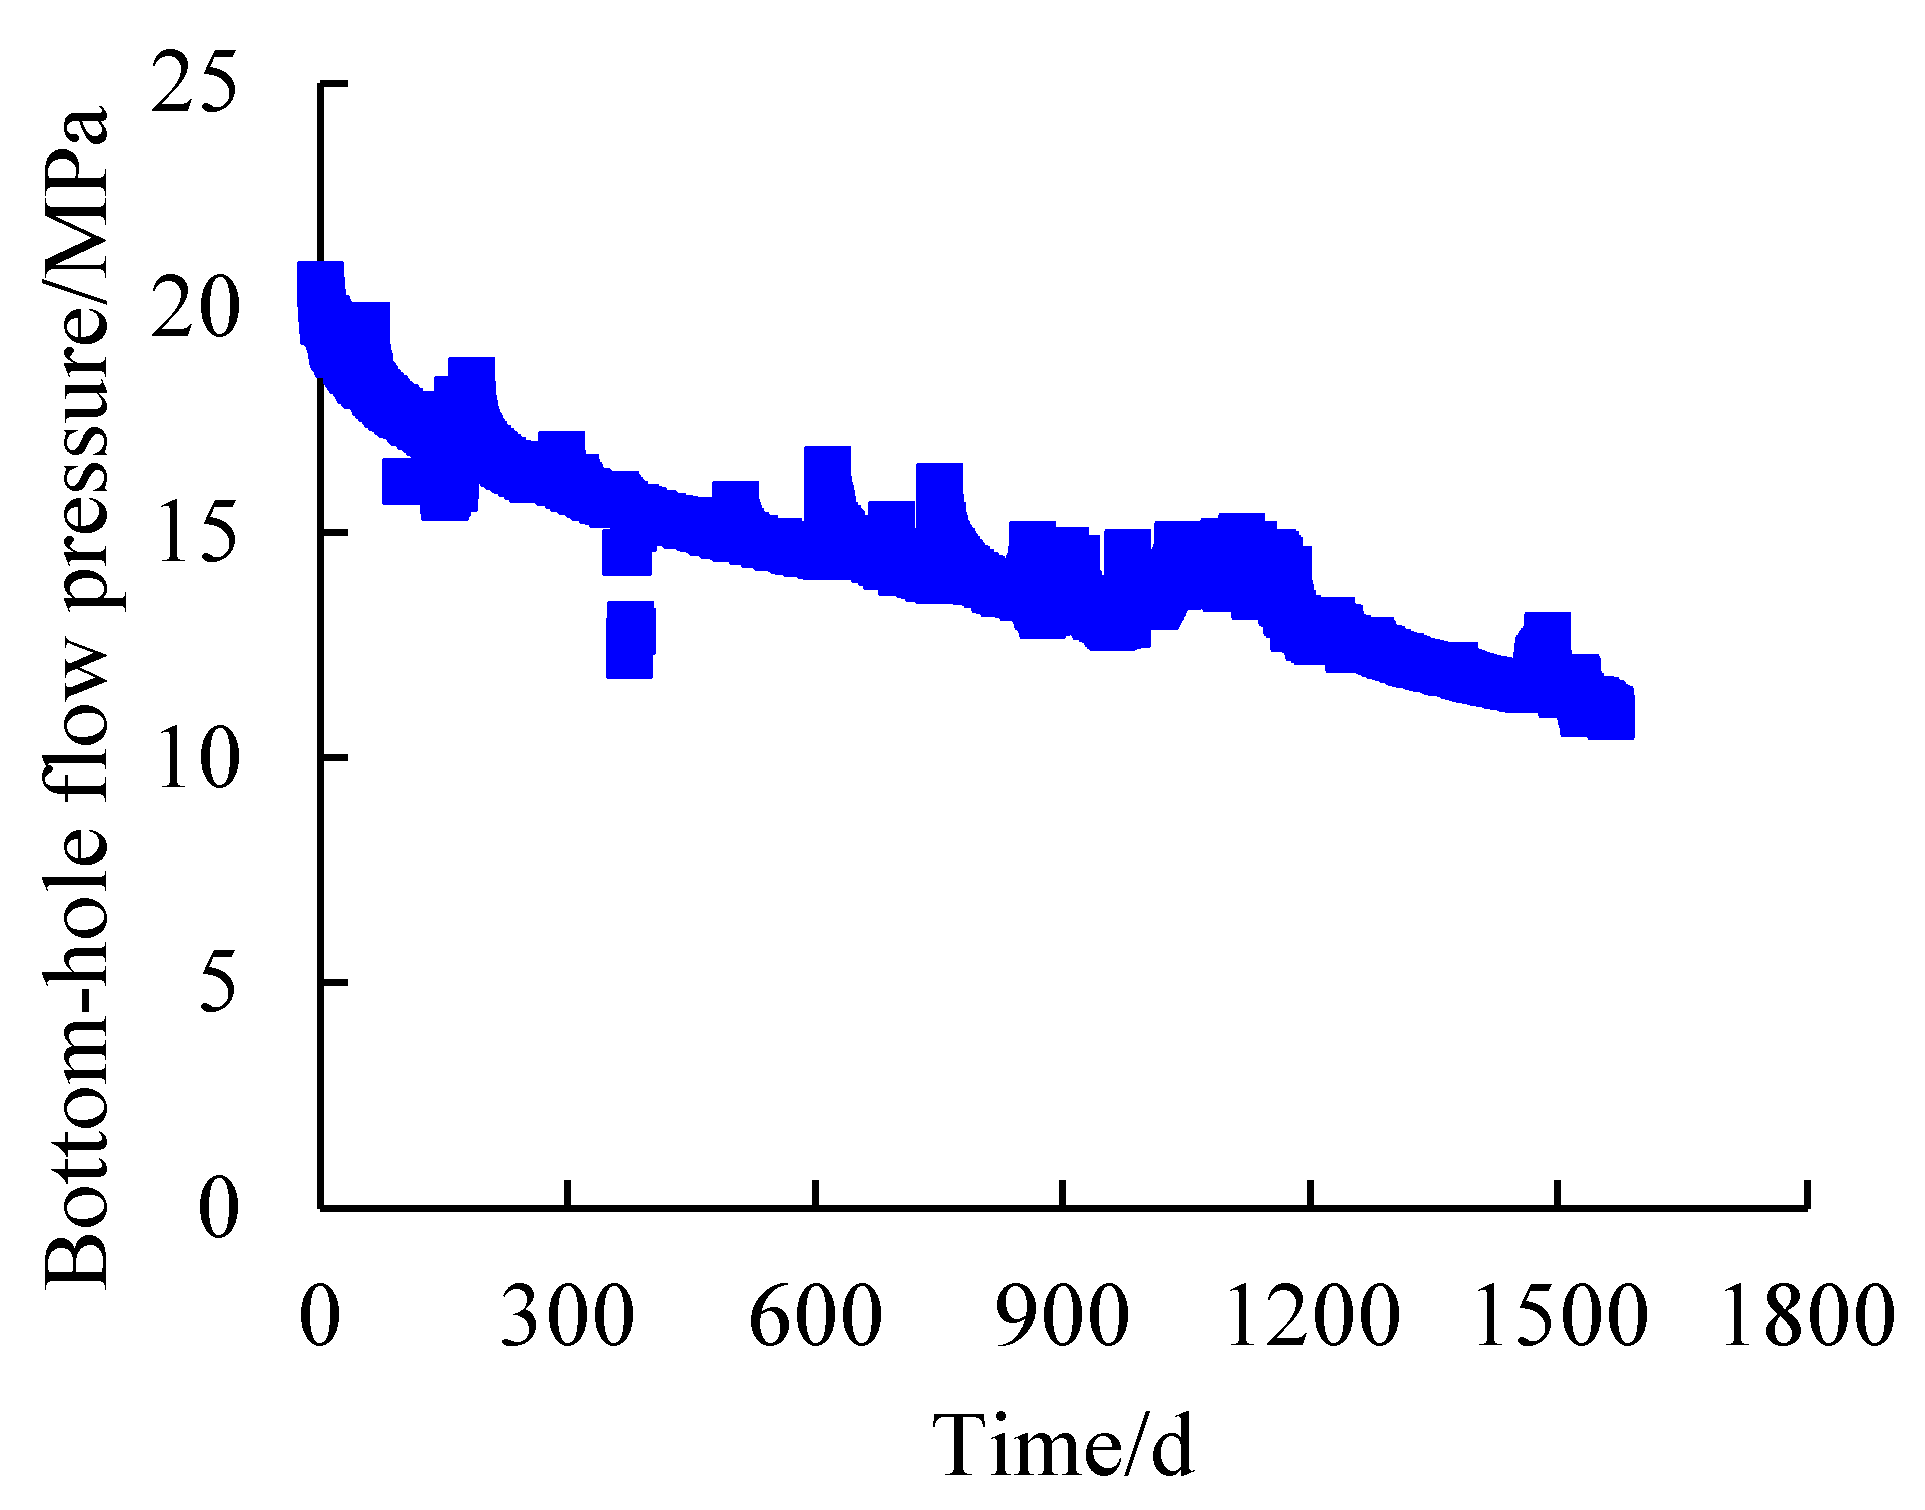
The actual production data of the well (
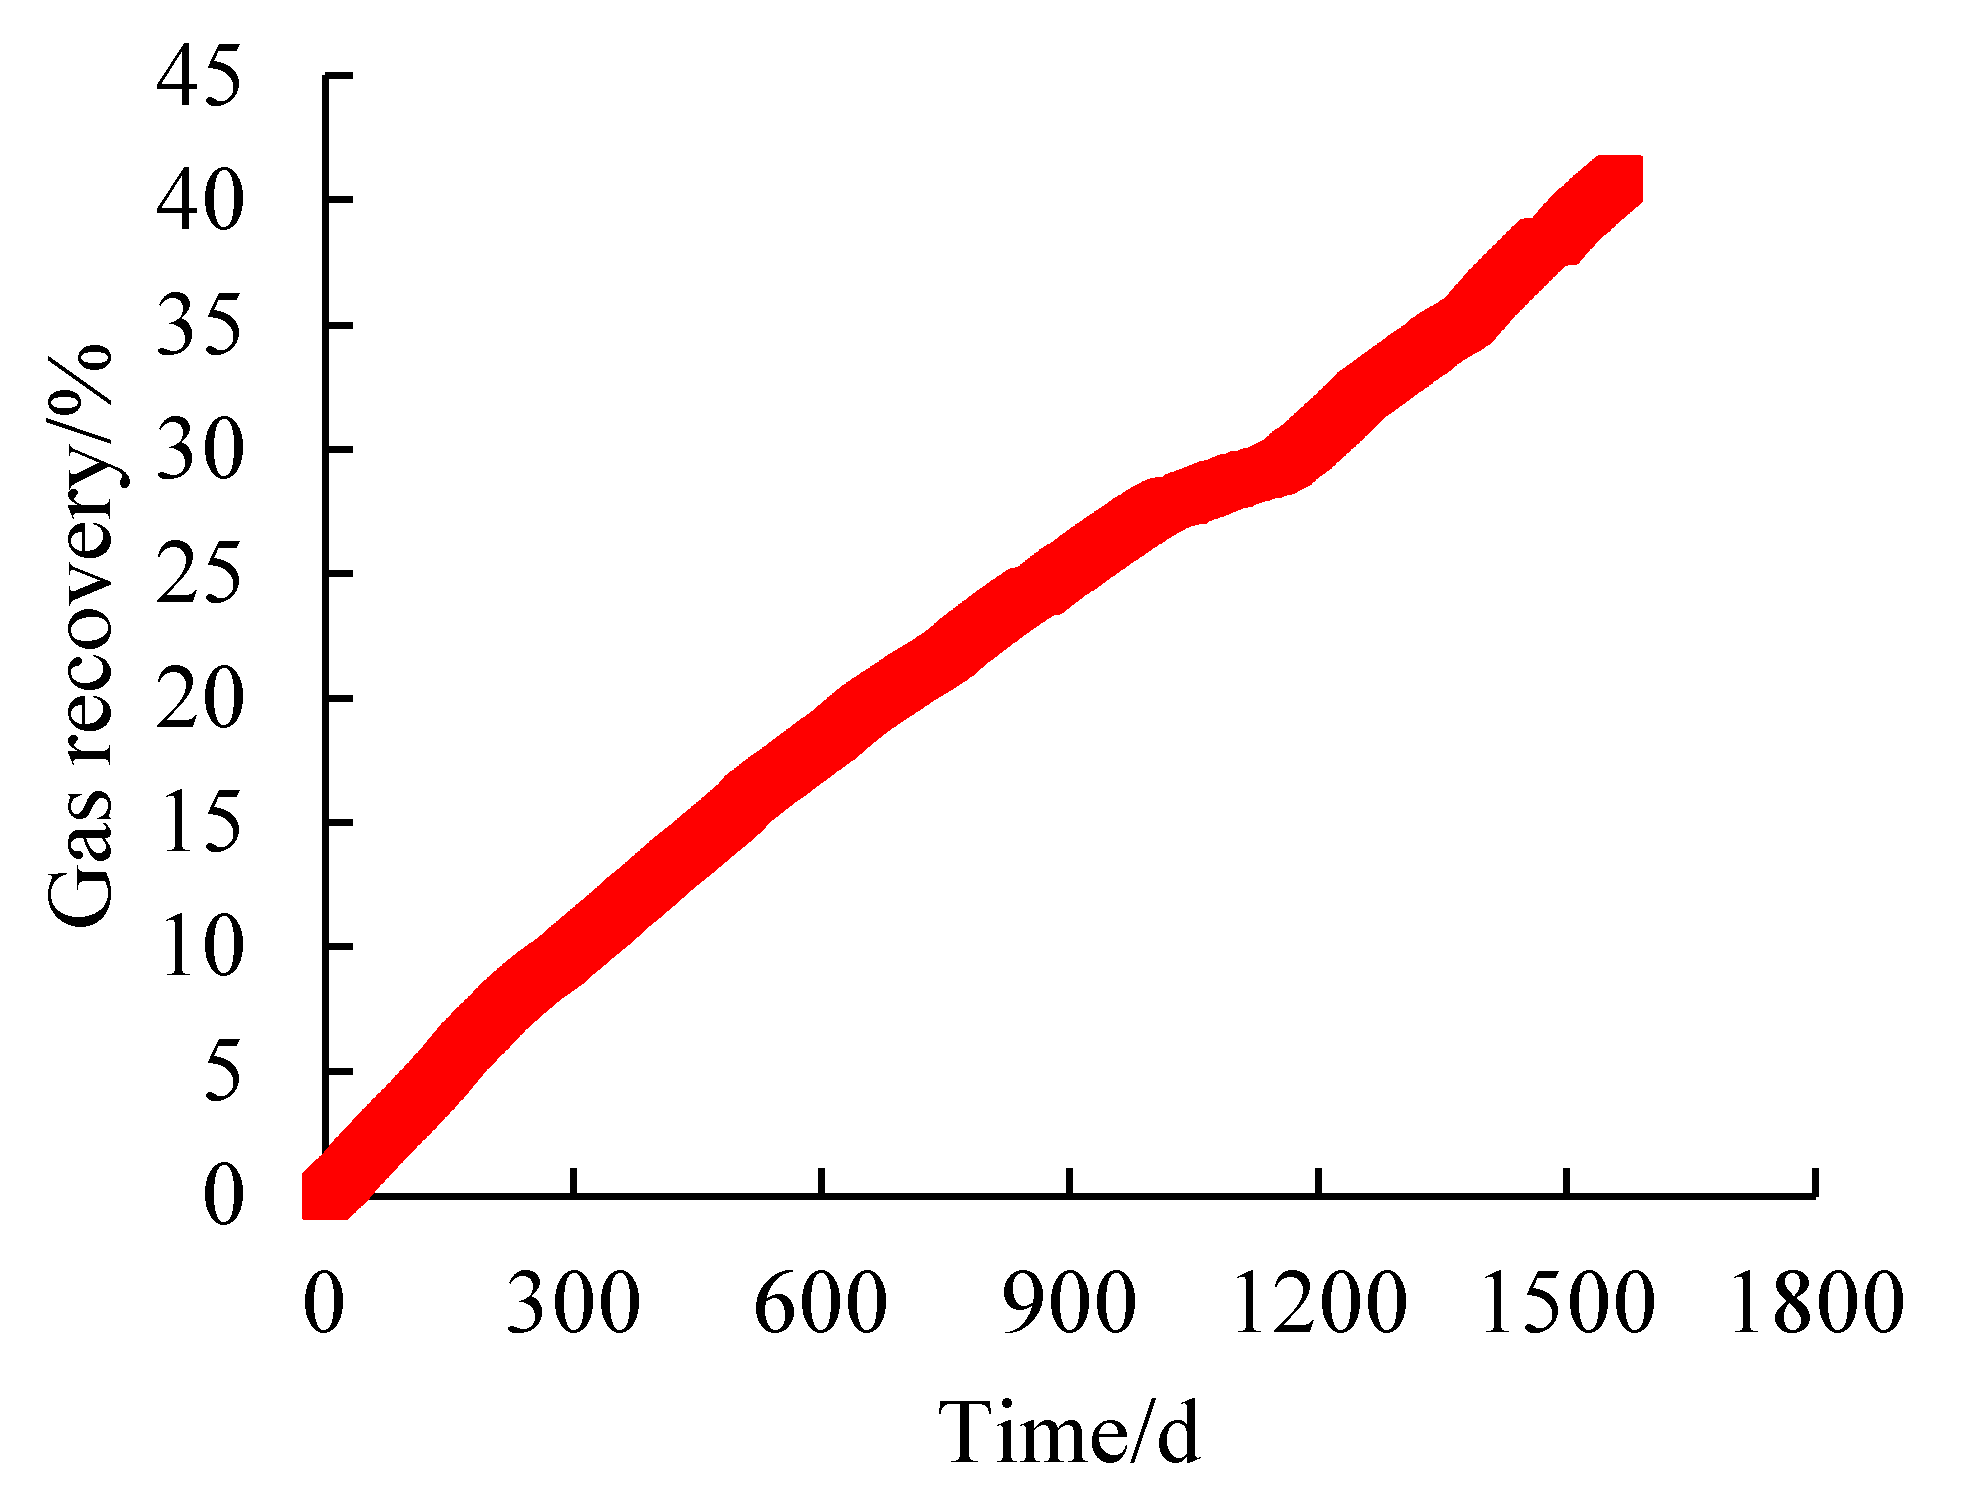
Figure 15) were used to simulate and calculate the change curve of the recovery efficiency, and the results are shown in
Figure 16.
As can be seen from
Figure 16, the final recovery rate of well SX-1 based on the production data simulation calculation is 40.88%.
