Article

Energy Efficiency and Stability of Micro-Hydropower PAT-SEIG Systems for DC Off-Grids

by
João M. R. Catelas
1,
João F. P. Fernandes
2,*,
Modesto Pérez-Sánchez
3,
P. Amparo López-Jiménez
3,
Helena M. Ramos
4,* and
P. J. Costa Branco
2
1
Instituto Superior Técnico, Universidade de Lisboa, 1049-001 Lisboa, Portugal
2
IDMEC, Instituto Superior Técnico, Universidade de Lisboa, 1049-001 Lisboa, Portugal
3
Hydraulic and Environmental Engineering Department, Universitat Politècnica de València, 46022 Valencia, Spain
4
Department of Civil Engineering, Architecture and Environment, CERIS, Instituto Superior Técnico, Universidade de Lisboa, 1049-001 Lisboa, Portugal
*
Authors to whom correspondence should be addressed.
Energies 2024, 17(6), 1382; https://doi.org/10.3390/en17061382
Submission received: 21 February 2024 / Revised: 4 March 2024 / Accepted: 11 March 2024 / Published: 13 March 2024
(This article belongs to the Section A: Sustainable Energy)

Abstract

:
Using pumps operating as turbines (PATs) offers the possibility of increasing the sustainability of water and energy systems by recovering the excess energy that would be otherwise lost in pressure-reducing valves or head loss chambers. Regarding on-grid applications, there have been many research works, and PATs have been implemented in several ways. However, more research still needs to be done on optimizing the efficiency and stability of PATs operating in off-grid systems. This work contributes to the development of stable direct current (DC) off-grid electric systems based on PATs using a self-excited induction generator (SEIG). In this context, a methodology is proposed, based on the hydraulic, mechanical, and electric subsystems, to define the PAT-SEIG operational area to maximize energy conversion and system efficiency. These limits depend highly on the capacitor value, rotational speed, and electric load. In addition, an analytical model is proposed to estimate the PAT-SEIG operation under specific conditions. With this, water managers can design and optimize an off-grid PAT-SEIG system and define the best hydraulic machines, electronic equipment, and control elements to maximize energy conversion within the target of operational limits. Two micro PAT-SEIG setups were implemented in the hydraulic laboratory of IST/CERIS under typical operating conditions to validate the proposed methodology. The system’s maximum efficiency and operational limits can be adapted using different capacitor values for the excitation of the SEIG. Considering the nominal efficiencies of the system’s components, the maximum p.u. efficiency obtained for each PAT-SEIG system was between 0.7 and 0.8 p.u.

Graphical Abstract

1. Introduction

The electrification and incorporation of renewable energy sources are seen today as an important solution to increase the sustainability of society [1,2]. This is not only important for the industrial and energy sectors but also for the water–energy nexus [3,4]. For example, in both urban and irrigated areas, water distribution systems (WDSs) require high energy consumption to complete a whole cycle (i.e., water capture, purification, filtering, drink and grey water treatment, distribution, and reuse), leading to high exploration costs and high energy losses [5]. One currently viable solution to increase the energy efficiency in these systems is applying pumps working as turbines (PATs) connected to the electric grid (on-grid) to recover the excess energy that would be otherwise lost for excess pressure control during the system’s normal operation. While on-grid PAT solutions have already shown the potential to increase the system’s energy efficiency, there is still a lack of methodologies to accomplish stable and energy-efficient solutions for off-grid systems [6,7]. Therefore, to answer this “question”, this paper contributes a novel methodology for developing DC off-grid systems based on PATs by optimizing system energy efficiency and defining stable operational limits for different electric-hydraulic loads.
Regarding on-grid solutions, in a WDS, a pumping station should provide enough pressure to supply the farthest consumer. However, excess pressure may damage the closest consumers. Therefore, pressure-reducing valves (PRVs) are typically installed to regulate the pressure along the system. This pressure regulation produces energy losses that compromise the system’s sustainability [8]. One solution is replacing or coupling, depending on the system restrictions, the PRV with micro hydropower solutions capable of recovering the energy losses originated by the pressure reduction.
The use of hydropower systems could be focused on classical hydraulic machines (i.e., Francis or Pelton turbines, mainly), which have higher investment costs and, in most cases, show economic unfeasibility for these types of small flow projects [9]. Another more viable solution is using reversible systems, such as PATs, with much more positive techno-economic feasibility ratios for system owners and managers [6,10]. Several researchers have shown different examples of applicability in the last few years. Italy’s Casamassima water distribution system was analyzed for the possibility of recovering daily energy equal to 2300 kWh using a PAT [11]. In [12], a study was performed on the potential energy recovery in Merano City (Italy), showing a daily potential recovery of 338 kWh. The efficiency of the PAT booster applied in an isolated village in Normandia (France) was analyzed, reaching a daily recovered energy equal to 9.61 kWh [13]. Different irrigation systems, which contained isolated recovery systems, were shown in the REDAWN project—Interreg (2017–2021) and in the literature review, such as the Zújar channel in Spain (2569 kWh/day) [14] and in Italy (3500 kWh/day) [15]. Other studies have shown the possibility of using PATs in the wastewater of oil refineries [16]. More case studies applied to supply and irrigation networks could be consulted in the review developed by [17]. The mentioned cases are just some examples of the applicability of PATs, which water managers can use to reach higher efficiency ratios while minimizing investment costs.
For off-grid applications, PATs could offer an energy source in remote and off-grid areas, such as isolated irrigation areas, in developed countries, and/or in isolated urban areas, such as small energy communities [18]. This possibility led different researchers to study the PAT behavior from both hydraulic and electric phenomena. In [19,20], conventional pumps in water distribution systems were proposed to recover energy and increase the system’s energy efficiency. The prediction of the PAT behavior can be obtained with different methods from its pumping curves, which facilitates the selection of the PAT for a specified application [21,22]. CFD methods are also important tools for this task [23,24]. A method to select a PAT was proposed in [25], introducing an energy exploitation coefficient and combining different previous methods. The cost analysis methods were proposed by [26]. The use of a PAT system, both in parallel and serial, was analyzed by different authors to increase the recovered energy [27], including the VOS strategy. In [28,29], the authors focused on the hydraulic and electric behaviors of the machines in terms of flow–head and flow–efficiency curves.
Despite all theoretical and experimental knowledge, the benefits of PAT systems in off-grid applications are still limited due to their highly non-linear behavior, generally associated with the lack of a constant frequency electric grid. Typically, PATs are provided with squirrel-cage induction machines due to their high robustness and lower cost [30]. Thus, in PAT operation, these induction machines operate as generators consuming reactive power to create their air-gap rotating magnetic field. This reactive power is crucial to optimize the active power generated by the electric machine while minimizing its losses [28,31]. When the machine operates isolated from the grid, the induction generator must be supported by capacitors to supply the required reactive power. This is called a self-excited induction generator (SEIG). Because of the lack of a constant electric frequency, energy conversion and efficiency will depend on many factors, such as the electric load, the rotational speed, the capacitor value, and other hydraulic variables such as head, flow, and fluid properties. This originates a variable AC electric output with variable efficiency, which may compromise the supply of conventional electric loads [32,33,34].
Therefore, there is currently a need to design stable off-grid electric systems based on PATs capable of supplying the electric loads with maximum efficiency. To achieve this, it is required to (a) define the PAT-SEIG operational area to maximize the energy conversion and; (b) stabilize the electric quantities (voltage and frequency) to allow the connection of conventional electric loads. One solution for stable electric quantities is creating a DC off-grid using AC/DC converters.
Following this research topic, this work proposes a new methodology based on the interaction between the hydraulic, mechanical, and electric subsystems, which is tested experimentally, to define the operation region of a PAT-SEIG system and to maximize its efficiency, creating a stable DC electric off-grid. These two objectives highly depend on the capacitor value, electric load, and rotational speed. An analytical model is developed to estimate the PAT-SEIG operation and its limits. This model will allow water managers to design and optimize an off-grid PAT-SEIG system and to define the best hydraulic machines and electronic equipment under the smart water–energy grid concept and all control elements to maximize energy conversion within the target under suitable operational limits.
The work is structured as follows: Section 2 presents the materials used in this investigation and the proposed methodology to identify and estimate the system efficiency and operational limits. Section 3 presents the experimental results and the accuracy of the proposed analytical model in identifying the system’s operational restriction, efficiency, and reliability. Section 4 presents the main conclusions of this work.

2. Methodology and Methods

The proposed research methodology is divided into three parts, as shown in Figure 1. First, experimental tests are carried out to evaluate the electric and hydraulic operational limits of a DC off-grid system based on a pump as turbine (PAT) coupled to a self-excited induction generator (SEIG, nº:06/2017, VEM motors, Thurm, Germany). The DC off-grid system is composed of a conventional pump, operating as a turbine, coupled to an induction generator, PAT-SEIG, excited by a capacitor bank and an AC/DC-DC/DC system to guarantee a stable DC voltage (Figure 2). In this system, the energy conversion is carried from the excess of hydraulic energy into mechanical energy, mechanical to AC electrical energy, and, finally, AC electrical to DC electrical energy. Due to the multiple physics phenomena in this system, it is of utmost importance to understand the system’s operational restrictions and define design methodologies for its adequate operation.
The electric experimental characterization consists of no-load and load tests to evaluate the SEIG’s required excitation capacitors and losses and to test the DC/DC converter under variable load. After this characterization, electric load tests are performed on the SEIG-DC/DC system, with a DC motor (nº: GA3105-1ZE20-0EA1-Z, Siemens, Germany) mimicking the PAT operation. The latter allows for the identification of the electric-suitable operational area. After these, the system is coupled to the PAT and hydraulic system shown in Figure 2. With these, the influence of the excitation capacitor and the electric load on the hydraulic operation is analyzed. Finally, the PAT-SEIG operational area is identified.
After this experimental investigation, an analytical model is proposed to estimate the electric-hydraulic operational zone of the PAT-SEIG system. This analytical model uses the SEIG’s capacitor, rotational speed, and requested load as input parameters and is capable of estimating its efficiency, electric current, voltage, and frequency. The operational domain is determined using the maximum current and voltage and the minimum voltage required to self-excite the induction generator.
Section 2.1, Section 2.2 and Section 2.3 define the main materials used in this study, and Section 2.4, Section 2.5 and Section 2.6 present the experimental methodology and the proposed analytical model.

2.1. Pump as Turbine (PAT)

With a variable efficiency, the pump as turbine (PAT) converts the hydraulic power into mechanical power so that the SEIG can later convert it into electrical power. The experimental tests were conducted in the CERIS-Hydraulic Laboratory of Instituto Superior Técnico, University of Lisbon. This work uses two PATs, as shown in Figure 3, with the nominal values displayed in Table 1. PAT1 is rated at 1050 rpm and PAT2 at 760 rpm. Note that these are conventional pumps used in turbine mode.
Their characteristic curves are defined by Equations (1), (2) and (5), where A, B, and C are coefficients of their HQ characteristic curve, Q is the flow in l/s; H is the recovered head in m w.c.; D, E, and F comprise the efficiency coefficients curve and η is the PAT efficiency [35].
H = A + B Q + C Q 2
η = D + E Q + F Q 2
When the affinity laws are applied to previous equations, the new curves are defined by Equations (3) and (4)
H = α 2 A + α B Q + C Q 2
η = D + E α Q + F α 2 Q 2
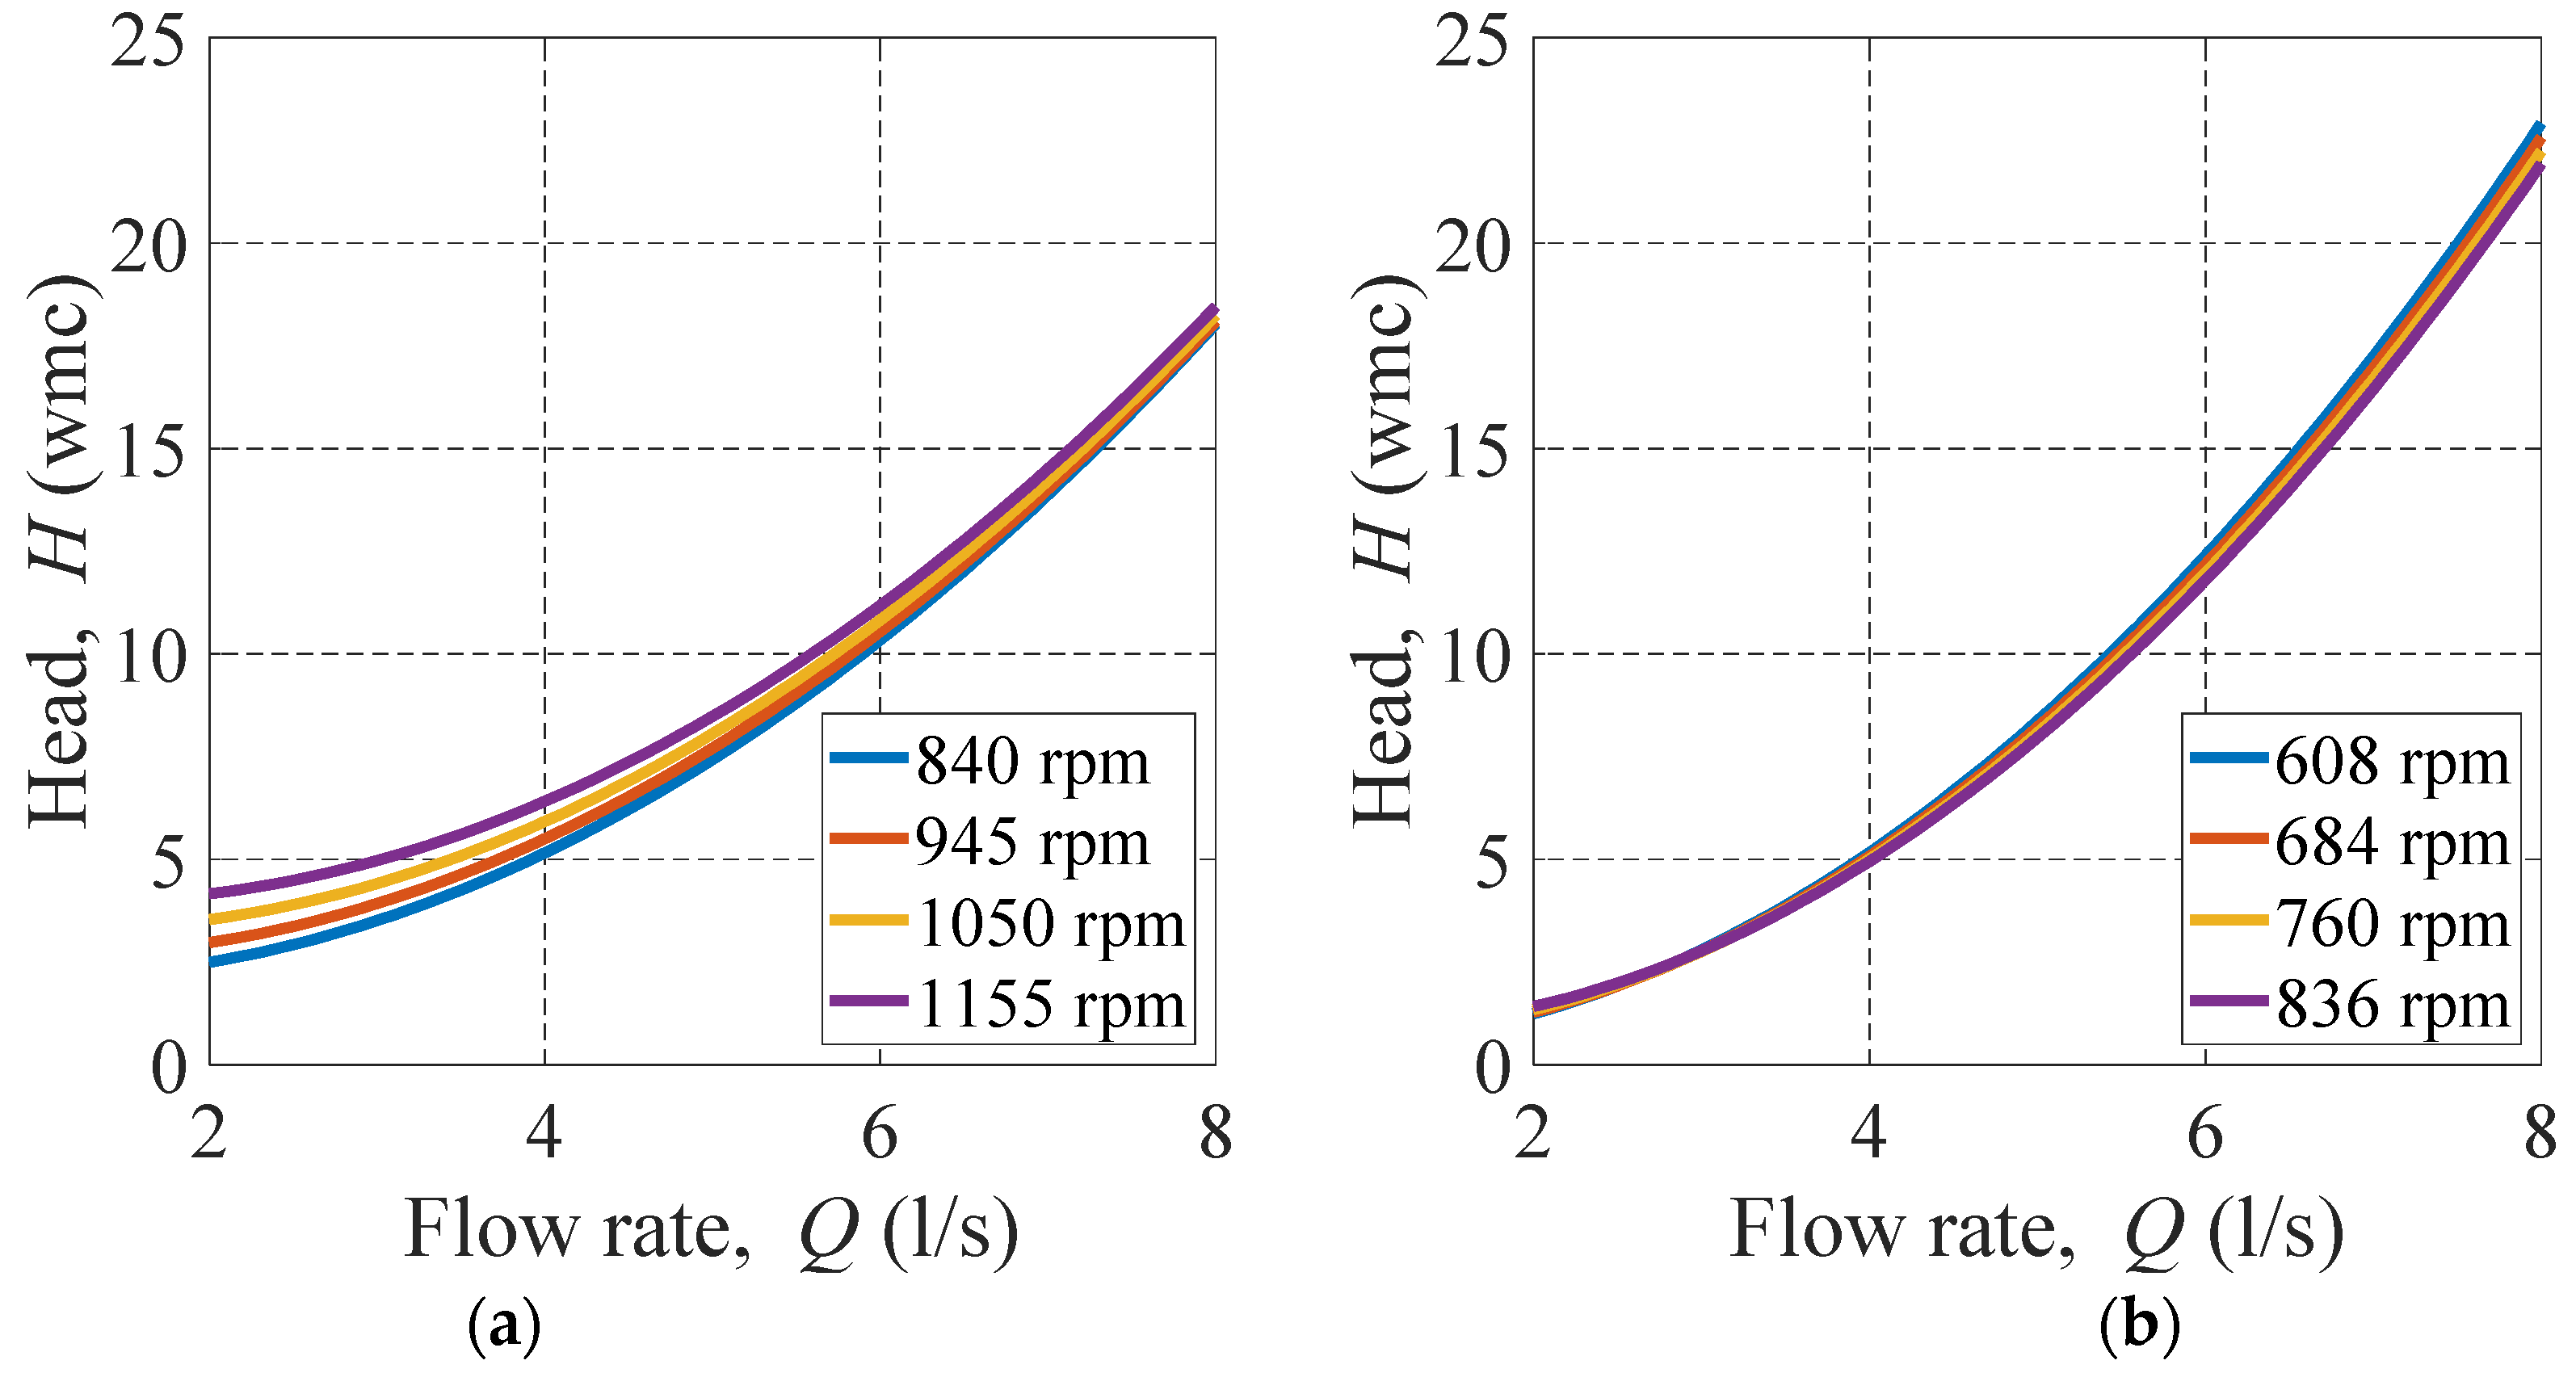
where α is the relation between the rotational speed (Nr) and nominal or reference rotational speed (Nref). In the turbine mode, the relation between the head, H, flow, Q, and speed, Nr, is shown in Figure 4a,b for PAT1 and PAT2, respectively, where A = 3.664, B = −694.5, and C = 314,560 for PAT1 and A = 1.854, B = −885.2, C = 412,400 for PAT2. These were obtained experimentally in our laboratory.

2.2. Self-Excited Induction Generator

The squirrel-cage induction machine used as a self-excited induction generator (SEIG) is shown in Figure 5. Its nominal parameters are presented in Table 2. This machine is coupled to each PAT to convert the excess hydraulic energy into electricity in off-grid conditions. The SEIG is first tested in the IST Electrical Machine’s Laboratory, coupled to a DC motor mimicking the PAT operation, to evaluate the performance and limits of the electric circuit.
The energy generated by the induction machine is rectified and supplied to a DC/DC converter. In this topology, as the machine is disconnected from the grid, a source of reactive power is necessary to excite the induction machine; therefore, a capacitor bank is also installed. The capacitor value per phase required to self-excite the induction machine varies with frequency. The value of the reactive power produced by the capacitors should be the same as that consumed by the SEIG, which is mainly set by the magnetization inductance, Lm. This corresponds to a resonance between the SEIG and capacitors. If the capacitor values are too high, the SEIG will saturate and overload; if these are too low, there is insufficient reactive power to excite the SEIG. Experimental tests are carried out with the SEIG to determine the values of the capacitors required for different ranges of rotational speed (Figure 6). These are performed without load and using a DC motor as the prime mover.
A simplified method to estimate the required capacitor value is considering the SEIG’s magnetization inductance, Lm, in parallel with the capacitor, C, as shown in Equation (5). If there is no access to the magnetization induction value, this can be estimated based on the reactive power provided by the manufacturer ( Q = 3 U N I N sin φ = 3 U M 2 ω L m ,   w h e r e   E   i s   t h e   m a g n e t i z a t i o n   v o l t a g e ). Other more detailed analytical models have been proposed to increase the accuracy of the capacitor required to excite the SEIG, as presented in [4,28], where the influence of additional parameters, such as leakage and stator and rotor resistances, can also be applied.
1 2 C U 2 = 1 2 L m U ω L m 2 C = 1 ω 2 L m
Experimental no-load tests are carried out to characterize the SEIG used to obtain its magnetization inductance, Lm, and iron and mechanical losses, Pfe + Pmec. From these, it is possible to estimate the correct value of capacitors required to self-excite the induction generator and to compare its behavior with the experimental results. Moreover, with the SEIG losses, it is possible to estimate the SEIG efficiency during load tests and when coupled with the PAT.

2.3. DC/DC System

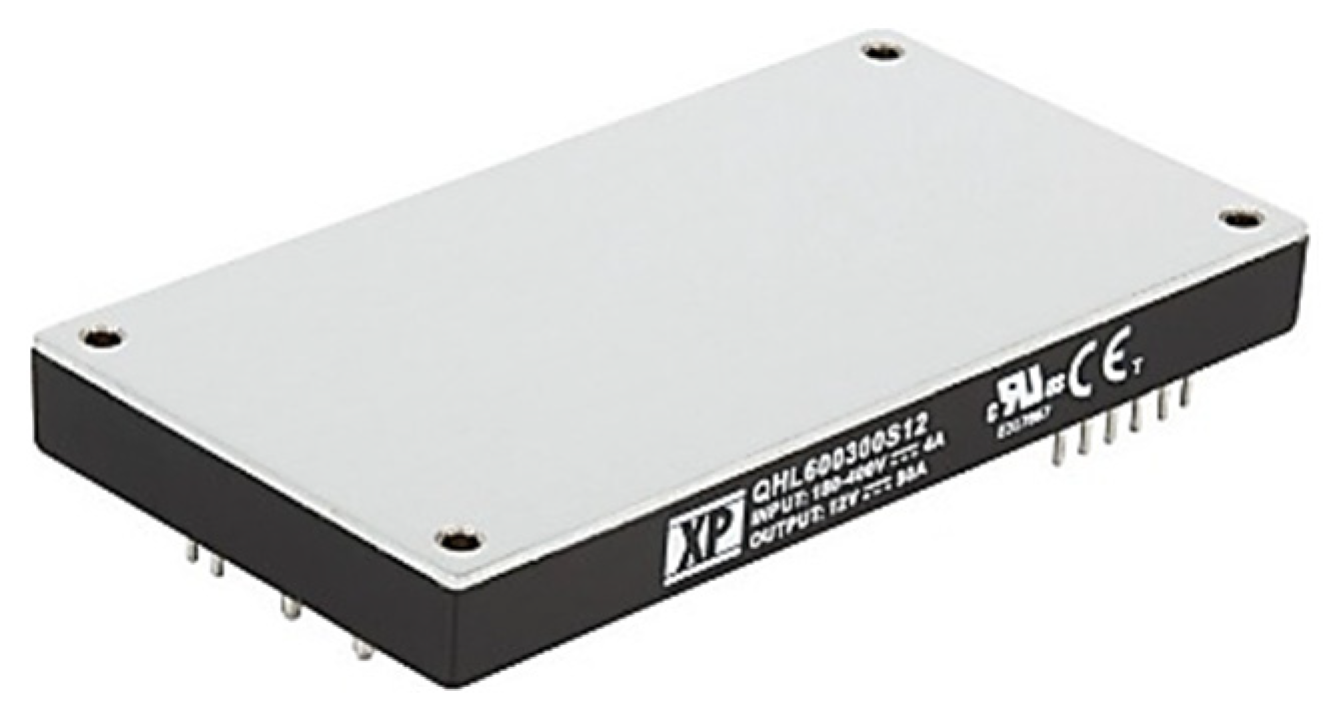
Another component required to develop the DC off-grid system is a DC/DC converter capable of stable DC voltage output for a wide range of DC voltage inputs. Due to the off-grid operation, the electric frequency is not fixed, and, thus, a rectifier is used. The resonance operation between the induction generator and the capacitor bank sets the electric frequency. In addition, the SEIG’s stator voltage is not fixed as it depends on the frequency, speed, mechanical input power, and load. Therefore, the output voltage of the rectifier will vary along the PAT-SEIG system operation. The selected DC/DC converter is capable of maintaining its output voltage for a wide input voltage range (180–425 Vdc) (Figure 7). Moreover, its output voltage can be regulated using a variable rheostat. Its main parameters are listed in Table 3.

2.4. Experimental Tests of SEIG with DC/DC System

To understand the behavior of the DC/DC system, experimental tests are first performed on the DC/DC converter without load and under load. These tests allow for verifying its stable output voltage for the range of the admissible input voltage. In addition, the behavior of the output voltage is acquired during the activation and deactivation of the DC/DC converter to verify its time constant.
After the DC/DC converter is verified, experimental tests are carried out on the setup, and a load is connected. The electric operational region from the SEIG, DC/DC converter, and rectifier are obtained with a resistive load. The equipment necessary to carry out these tests is shown in Figure 8. Please note that the DC motor acts as the PAT to facilitate its command during the first stage of electric tests.
The measurement apparatus consisted of AC and DC voltage, current probes, and power analyzers. The uncertainty of this equipment is 1% of the reading plus 0.02% of the full scale for the current probes and 0.2% of the reading plus 0.01% of the full scale for the voltage probe. The uncertainty of the power analyzer is 1.2% of the reading for both active and reactive powers.

2.5. Hydraulic-Electric Experiment Setup

After the verification of the electric components, experimental tests are carried out at the CERIS hydraulic laboratory to simulate the system operation in a hydraulic system. These experimental tests aim to test the system at a technological readiness level of TRL4. The experimental setup is shown in Figure 9, composed of a flow control tank (1), recirculating pumps (2), an air vessel (3), a 20 m HDPE pipe (4), and the PAT-SEIG system (5).
The function of the flow control tank, identified as (1) in Figure 9a, is to simulate the downstream reservoir of a micro hydro and the suction tank of a pump system, where the flow of water at lower pressure is received or is pumped, guaranteeing the minimum submergence in the pumps water intake (Figure 10a,b). The water level is measured in this tank to estimate the low pressure at which it is stored. This reservoir is inserted inside another tank, as shown in Figure 10b, whose function is to buffer the system in case of sudden flow rate and pressure changes. This is necessary because these possible changes can significantly affect the closed system and cannot be controlled after immediately checking out the hydraulic system’s stability. At last, the buffer can also serve as a water storage method, allowing control over the amount of water that can or cannot be pumped into the upstream reservoir for the hydropower system, (3) in Figure 9a, to increase its pressure using an air vessel or hydropneumatic reservoir.
The recirculating pump to be used, identified as (2) in Figure 9a,b, is signed in Figure 11a with a red arrow. Only one pump is used since only one PAT will operate simultaneously, although the system is also prepared to operate with two PATs and the two recirculating pumps in parallel or in series. In addition, we should also highlight the valve marked in red, as it is through its operation that it is possible to regulate the amount of water to be pumped into the upstream reservoir.
The upstream reservoir is the air vessel marked as (3) in Figure 9b and represented in Figure 11b, as well as its flow control valve. This is intended to simulate the upstream reservoir of the hydropower system (3) in Figure 9 and Figure 11b, from which water is routed at high pressure towards the PAT. With the aid of the isolated valve (Figure 11a), it is possible to fit the pressurized flow by injecting or releasing compressed air in the air vessel. This allows adjusting the pressure drop applied to the PAT and, consequently, the water flow to control the amount of hydropower available.
The experimental hydraulic-electric tests follow the proposed analysis tests to evaluate the system’s range operation. These measurements are used to obtain the power and the efficiency contour maps of the PAT-SEIG system to verify the same electric range of operation obtained previously but now conditioned by the hydraulic system operating conditions. Finally, the PAT, SEIG, PAT-SEIG, and the global efficiency maps of the system are computed.

2.6. Analytical Model for PAT-SEIG Operation

The proposed analytical model for estimating the PAT-SEIG operation is based on the resonance principle of the self-excited induction generator (SEIG). Due to the lack of an electrical grid in a stand-alone operation, the required reactive power for the SEIG is provided by capacitors. An excess of reactive power will saturate the SEIG and lead to overheating, and a deficiency of reactive power will lead to the loss of excitation of the SEIG. A similar effect is also presented for the active power. The mechanical power provided to the SEIG should match its losses and the electric load. Therefore, from the SEIG point of view, considering the load and capacitors, its total admittance, Yt, should be null. The real part of the admittance is related to the active power balance and the imaginary part to the reactive one [32]. Therefore, for an imposed SEIG rotational speed (equal to the PAT speed) and an applied capacitor value and requested load, the resonance criteria should allow the computation of the resonance electric frequency and, thus, the electric operation of the SEIG.
This can be evaluated based on the SEIG equivalent electric circuit. Figure 12 represents the equivalent electric circuit, whose parameters are per-unit frequency, with a = f/fN, where f is the resonance electric frequency and fN is the rated frequency. The load, stator, and rotor resistances are defined as RL, Rs, and Rr, respectively. The nominal stator, rotor, magnetization, and capacitor reactances are X s N , X r N ,   X m N ,   and X c N , and are computed for the nominal electric frequency, fN. The iron loss resistance is defined as Rm. Parameter b is the per unit rotor speed, b = N/NSN, where N is the rotational speed and NSN is the nominal synchronous speed.
From this circuit, the total admittance, Yt, can be computed considering the admittance of the load, YL, capacitor, Yc, stator, Ys, magnetization, Ym, and rotor, Yr, described from (6) to (8).
Y t = Y L + Y c + Y s Y m + Y r Y s + Y m + Y r
Y s = 1 R s a + j X s N ,     Y r = 1 R r a b + j X r N ,     Y m = a R m + 1 j X m N
Y L = 1 R L ,     Y c = a 2 j X c N ,  
Therefore, the solution of the electric resonance defined by parameter a can be obtained by setting the real and imaginary parts of the total admittance to zero, R e Y t = 0 , and I m Y t = 0 . These solutions were obtained by these authors previously in [32]. However, in the later work, the problem was to define the minimum capacitor value capable of exciting the SEIG. Now, the value of the capacitor is already defined; thus, only the real part of the equation is considered to find the electric resonance frequency. The solution of the per-unit frequency, a, is obtained from (9), where parameters D1 to D6 are defined in Appendix A.
D 6 a 6 + D 5 a 5 + D 4 a 4 + D 3 a 3 + D 2 a 2 + D 1 a  
Of the six possible solutions of a, only the purely real ones are considered. From the latter, the selected one corresponds to the maximum frequency. This requires an iterative process because of the non-linearity of the magnetization inductance, Lm(E/f), which depends on the magnetizing flux, i.e., on the magnetizing voltage divided by the frequency, E/f. This magnetization inductance is used to compute the magnetization reactance. Moreover, parameters a, b, and RL require an iterative process. Parameters a and b refer to the unknown electric frequency, and RL should be adjusted to keep the required electric load with the variation of the machine output voltage.
The iterative process is shown in Figure 13. The analytical procedure starts by defining the input variables, rotational speed, N, capacitance value, C, and requested load active power, Pload. Then, the method starts by defining initial values for the electric frequency, f, and magnetization voltage, E. With these, the per unit speed, b, magnetization inductance, Lm(E/f), and load resistance, RL, are computed. Next, the coefficients Dk in (9) are computed, and the equation is solved to obtain the possible solutions of the per-unit frequency, ak. The selected frequency corresponds to the maximum frequencies of those without an imaginary part. The equivalent circuit is solved with the selected frequency, and new values of the stator, US, and magnetization voltages, E, are computed. These are compared with the previous iterations and the convergence is checked. If no convergence is found, this cycle is repeated with the new values of the magnetization voltage, E, and electric frequency, f. If there are no possible real frequencies, the machine is under-excited and out of operation.
This analytical procedure estimates the SEIG efficiency and operational limits for any rotational speed input, capacitor value, and electric load.

3. Results and Discussion

This section presents and discusses the results of the experimental and analytical methodologies. First, the SEIG experimental tests are presented to allow the calculation of its losses and magnetization inductance, Lm(E/f). Then, the range of operation of the SEIG + DC grid and the PAT-SEIG + DC grid are defined and evaluated based on experimental electric and hydraulic tests. Finally, the analytical procedure is applied and verified against experimental results.

3.1. SEIG Electric Load Tests

The SEIG, DC/DC converter, and the fully electric system are first tested separately from the PAT to obtain their electric operational performance and application field. This allows for separating the analysis of the electric and hydraulic phenomena.

3.1.1. SEIG No-Load Tests

To characterize the SEIG, its magnetization inductance, Lm, and iron and mechanical losses were obtained from no-load tests. The magnetization inductance, Lm, significantly impacts the SEIG operation because it will define the required capacitor value, C, and the required reactive power for a desired electric frequency, f. The iron and mechanical losses, Pmec + Pfe, and the copper losses, Pcu, will impose the SEIG efficiency. Note that rotor losses are also presented. However, for this low nominal power machine, they are very low compared to the previous losses.
For a fixed frequency equal to the SEIG nominal frequency, f = 50 Hz, the magnetization inductance, Lm, was obtained for different values of stator voltage, Figure 14a. The presented behavior is expected for typical induction machines, where Lm slightly decreases when approaching the nominal magnetic flux, i.e., the nominal stator voltage for the nominal frequency. This occurs due to the saturation of the iron core, which decreases its magnetic permeability. Typically, electrical machines are designed to operate near the saturation point. Please note that the magnetizing magnetic flux, λm, is proportional to U/f, reaching its nominal value for the nominal stator voltage and frequency, UN/fN.
The mechanical and iron losses are presented in Figure 14b. The mechanical losses in the SEIG result mainly from friction in its bearings, β N r 2 , and iron losses derive mainly from hysteresis phenomena ( k h B 2 f ) and eddy currents ( k e B 2 f 2 ). However, for the range of electric frequencies used, eddy current losses can be typically neglected (10). In (10), β is the mechanical bearing coefficient, N r is the rotational speed, k h and k e are the hysteresis and eddy current losses coefficients, and B is the magnetic flux density. The magnetic flux density B is proportional to the magnetizing flux, λm, which is proportional to U/f. From the experimental results in Figure 14b, the mechanical and iron losses can be obtained by interpolation (11), with a = 1.83 and b = 0.0011, resulting in β = 3.73 × 10 6 and k h = 0.055 . These results allow us to estimate the SEIG efficiency when coupled to the PAT.
P m e c + P f e = β N r 2 + k h B 2 f + k e B 2 f 2 β N r 2 + k h B 2 f
P m e c + P f e β N r 2 + k h U f 2 f = a + b U 2
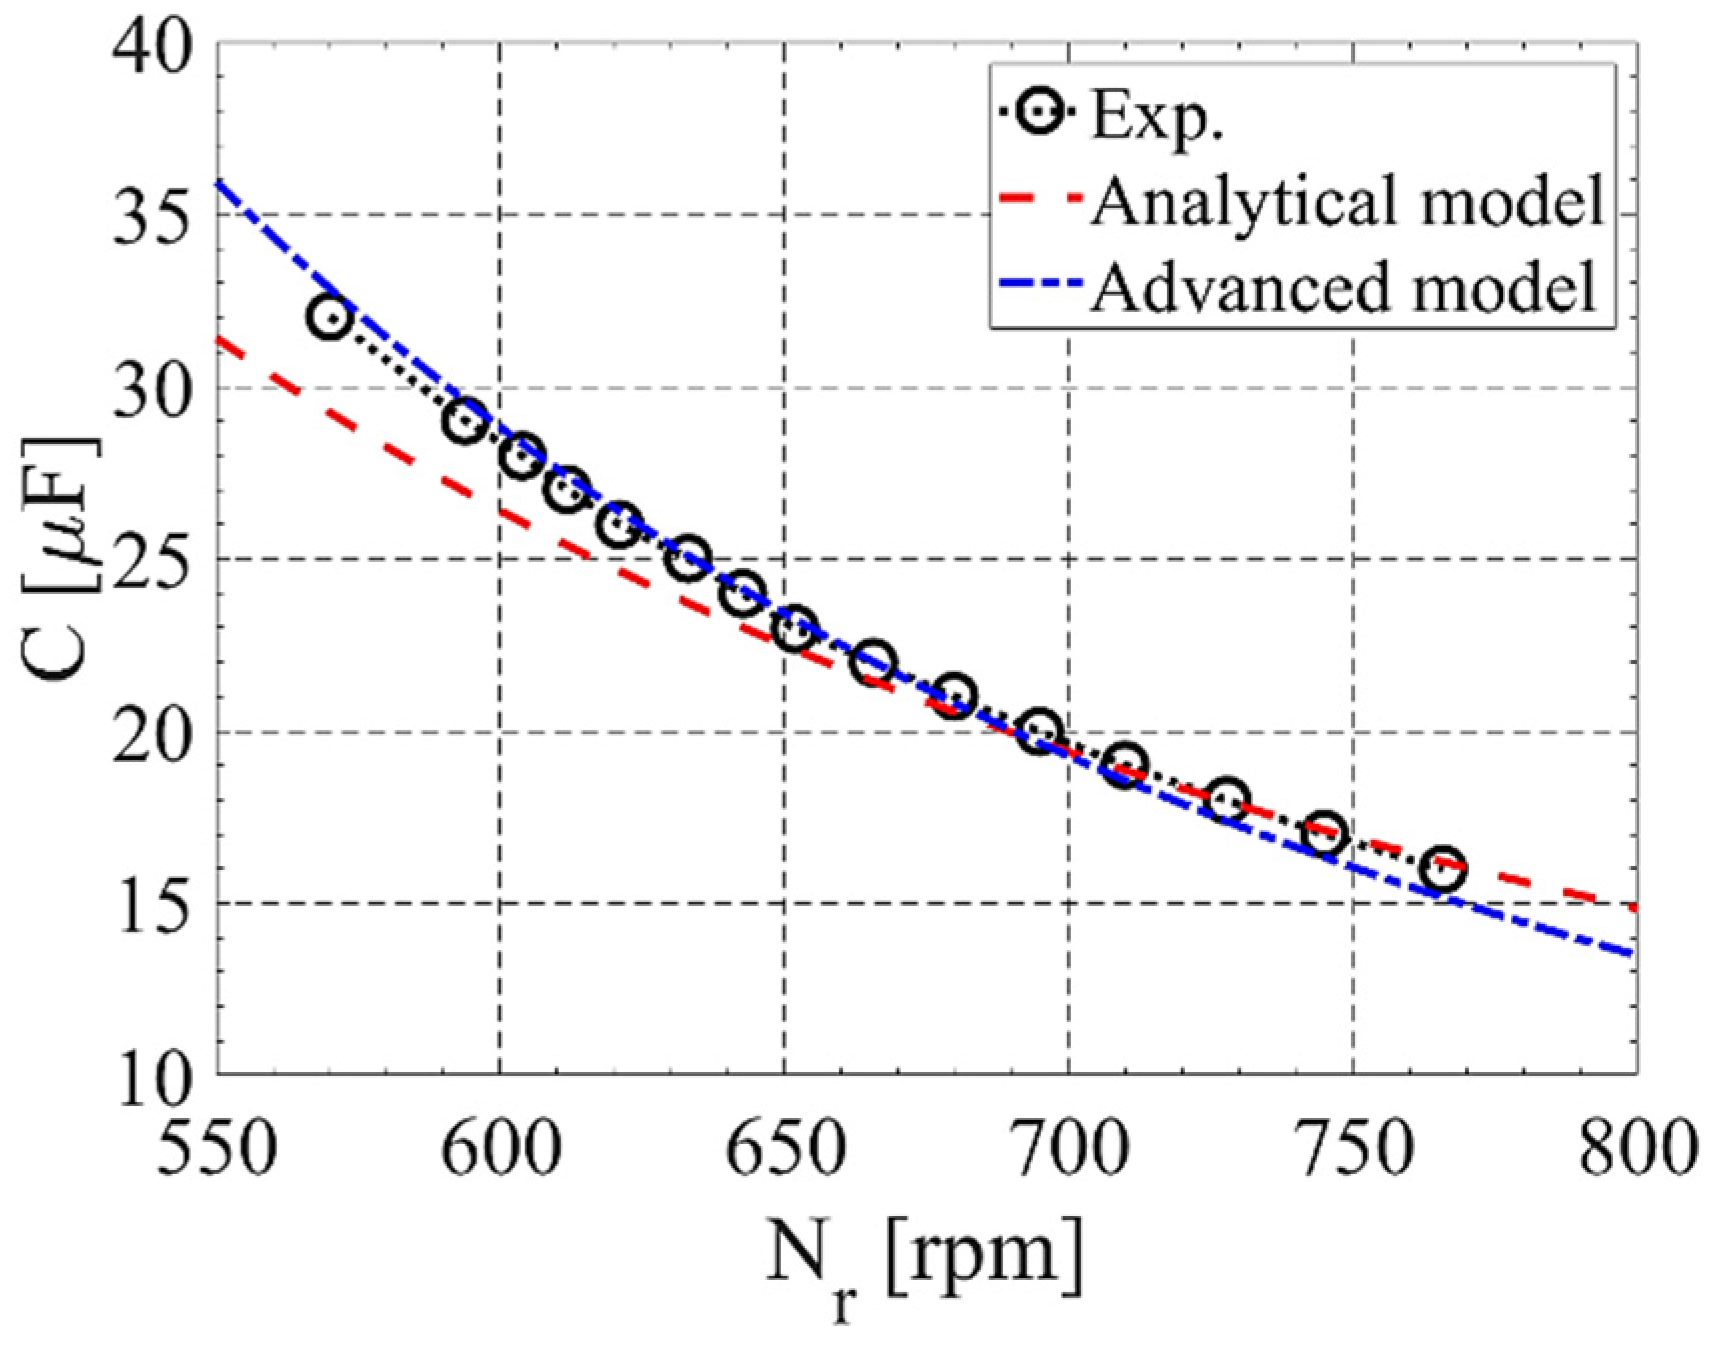
To obtain the necessary capacitor values for the self-excitation of the SEIG at different speeds, the procedure described in Section 2.2 was performed, resulting in the experimental curve represented in Figure 15. In addition to the experimental results, the analytical results using Equation (5), considering no-load conditions ( f ~ f r = N r n p p / 60 ) and the advanced model developed in [28], are shown in Figure 15. These analytical models are useful in predicting the range of capacitors required for a specific SEIG.

3.1.2. DC/DC Converter Load Tests

Experimental tests are performed with and without load to understand the behavior of the DC/DC converter. The expected behavior is maintaining the output voltage for the input voltage range shown in Table 3, with a low voltage ripple. From no-load and load tests, it can be verified in Figure 16 that the DC/DC converter can maintain the output voltage level for the input voltage between 180 V and 360 V, with a maximum voltage ripple of 7.2%.

3.2. Analysis of Electric SEIG + DC System’s Range Operation and Efficiency

The SEIG and DC systems are tested under different loads and speeds with a constant capacitor value and using a DC motor as a prime mover (Figure 17). These were obtained by changing the resistance value to keep the output SEIG’s current constant, IL, for different rotor speeds. The limits of the range operation were observed during these tests, defined in Figure 17 by four red lines. These are the nominal current of the SEIG (limit 4), the nominal current of the DC machine armature (limit 2), the nominal current of the rheostat used as the load (limit 3), which cannot be exceeded, and the lower limit of the admissible input voltage in the DC/DC converter (limit 1), which, if not exceeded, does not allow its activation. It should be noted that, from now on, the input voltage at the DC/DC converter will be identified by the output rectified voltage Urect. Table 4 shows the values corresponding to the limits previously mentioned.
To associate each operation boundary drawn to previously mentioned borders, the curves presented in Figure 18 are shown, where the experimental measurements, in red, were fitted using polynomial curves. These show the influence of each variable on the system’s limitations. Comparing the different figures, it is possible to match the bounds of Figure 17 with the results of Figure 18.
With the measurements carried out previously, it is possible to obtain the efficiency map of the total electric system, measured from the mechanical power supplied by the DC motor, mimicking the PAT, to the power consumed at the load (Figure 19). A maximum efficiency of about 40% was achieved, as shown in Figure 19a. Please note that this value is typical for very low-power systems because, as shown in Table 2, the induction machine’s nominal efficiency is 57% at 693 rpm. Therefore, it is useful to verify the efficiency of the per-unit values shown in Figure 19b, referring to the equipment’s nominal efficiency, to extrapolate for other higher-power machines. As can be seen, the SEIG reaches around 0.68 p.u. of its nominal efficiency.
After analyzing the system operating curves for speeds between 740 and 800 rpm, which correspond to a capacitor value of C = 16 µF, it was inferred that, depending on the capacitor value chosen, the operating range of rotation speeds of the SEIG would be different. Therefore, the same tests as before were performed but now using a lower capacitor value of C = 14 µF, revealing a change in the speed region from [740–800] rpm to [790–860] rpm in Figure 20. This is in line with the results presented in Figure 15, which show that, when decreasing the capacitor value, the SEIG speed increases. Please note that for C = 14 µF, with the increase in rotational speed, the limit of the nominal current of the DC machine armature is not present because of the higher induced armature voltages. With a higher armature voltage, the armature current required decreases.

3.3. Analysis of Electrical-Hydraulic PAT-SEIG-DC System’s Operational Limits and Efficiency

Following the proposed methodology, the SEIG-DC system is now coupled to a PAT in the hydraulic system presented in Figure 9. It is possible to obtain the results to analyze the behavior of the whole electrical-hydraulic system.
The first test is to verify the impact of the capacitor value on the system’s speed, Nr, hydraulic head, H, and flow, Q (Figure 21). As expected, before the excitation of the SEIG, the system rotates in a runaway, i.e., at a higher speed. During this operation, the hydraulic power required is only related to the mechanical losses of the system since the system is in no-load conditions and without SEIG’s excitation. This scenario is represented by the blue curve in Figure 21a, in which the system operates around 1900 rpm at a lower water flow and higher head.
By increasing the capacitor value to excite the SEIG, the system speed decreases, the water flow increases, and the head decreases, as represented by the remaining curves in Figure 21a. Figure 21b represents the same curves in detail for the different capacitors. With the SEIG excited and under no-load conditions, the hydraulic power required by the PAT1 is given by the sum of mechanical losses of the PAT -SEIG system and SEIG’s copper and iron losses. The mechanical losses are now approximately nine times smaller than in the runaway scenario since P m e c = β N r 2 and the speed decreases by nearly 2.5 times. However, with the excitation of the SEIG, iron and copper losses will occur even at no load since P F e = K h U s / f 2 and P c u = 3 R s I s 2 . Thus, there is a balance between the decrease in mechanical losses and the increase in copper and iron losses. The hydraulic power is between 350 W and 400 W for different capacitor values since the sum of mechanical, copper, and iron losses does not vary significantly for the obtained operation speed range. The same applies to the water flow and head, which remain around 5 L/s and 7.3 m w.c., respectively.
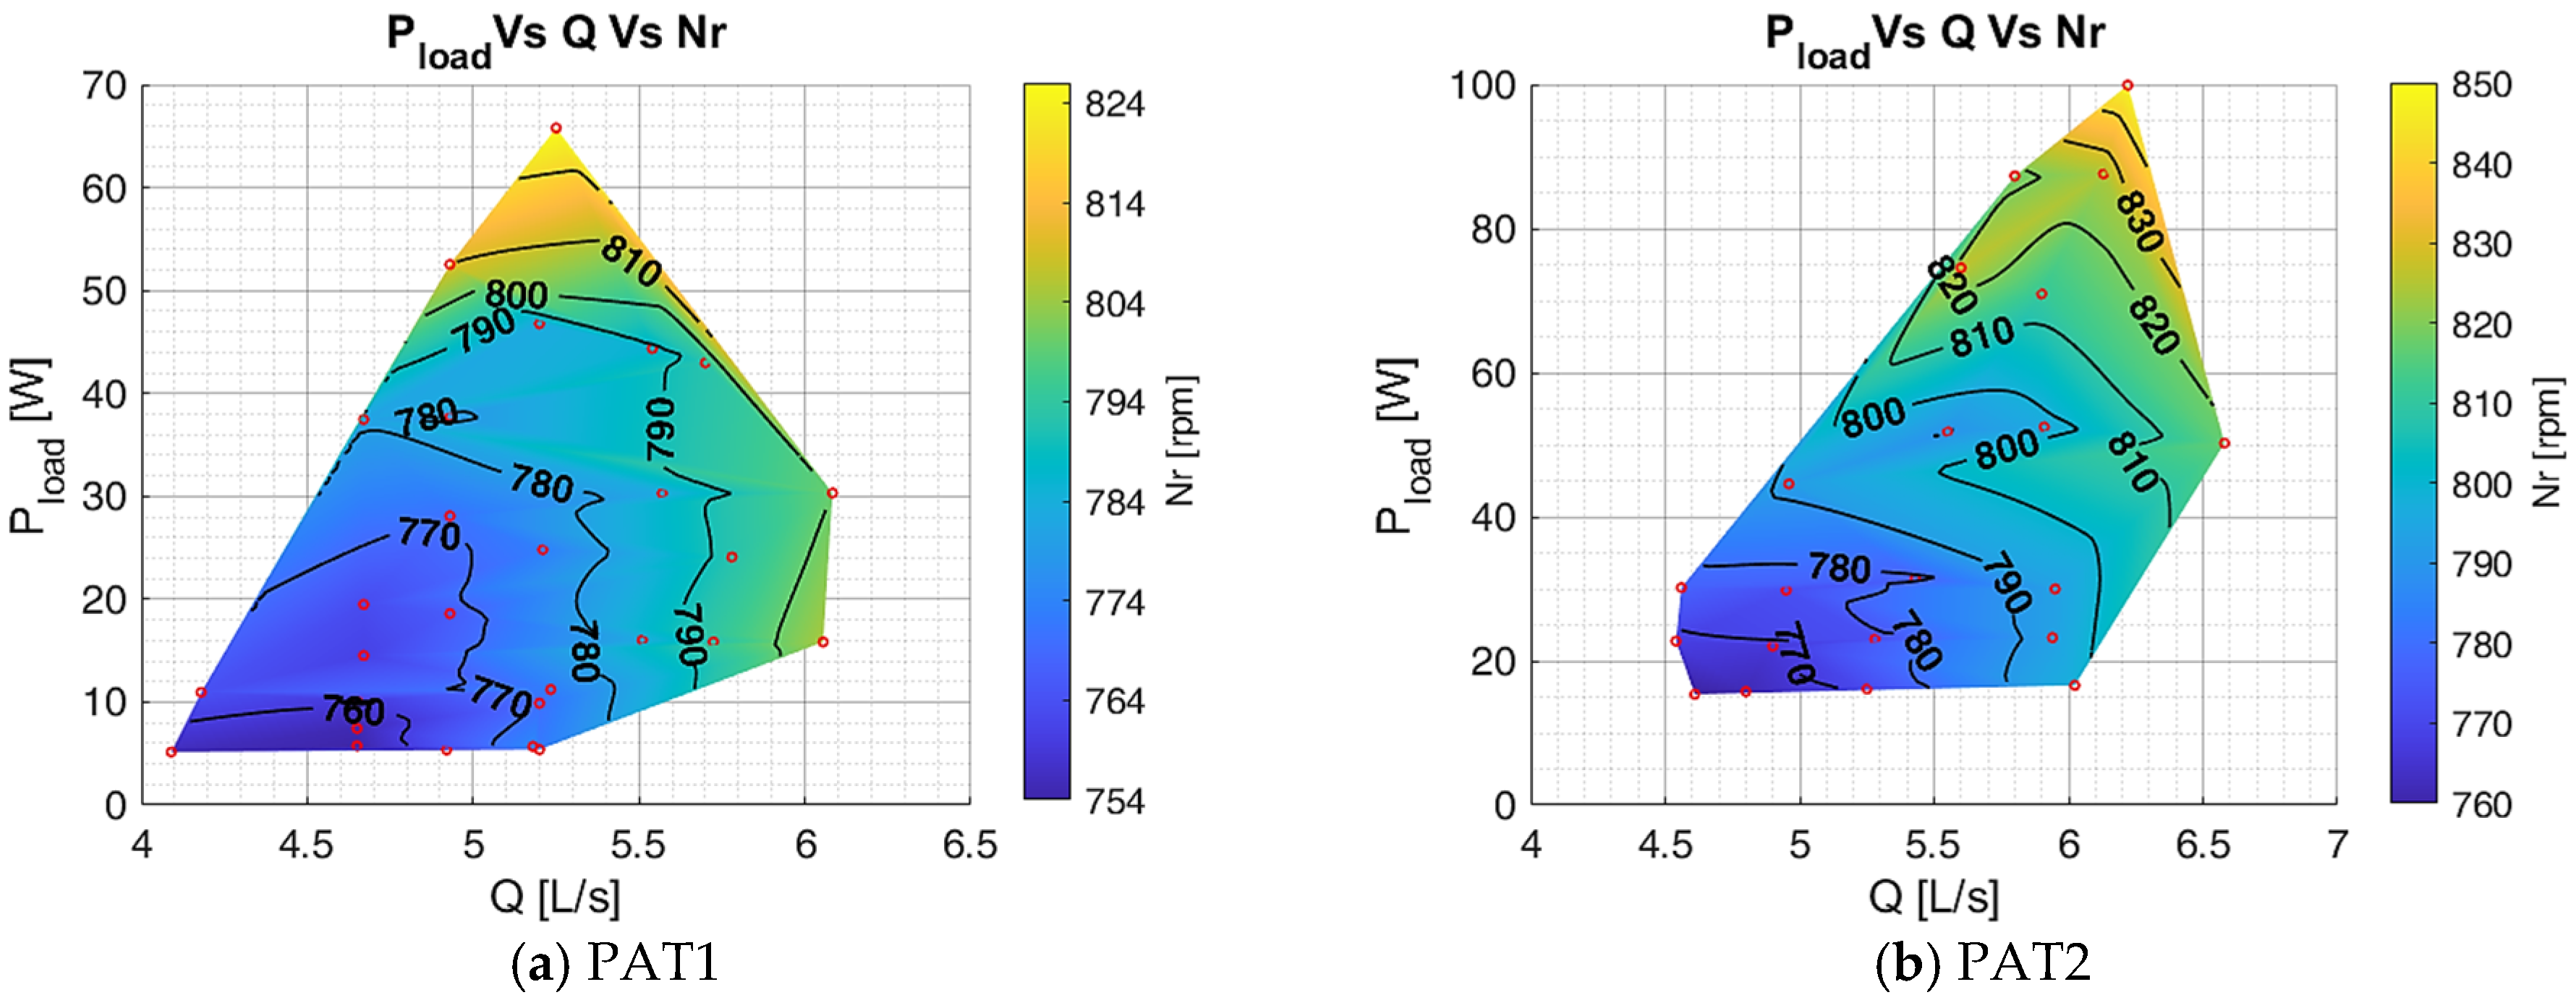
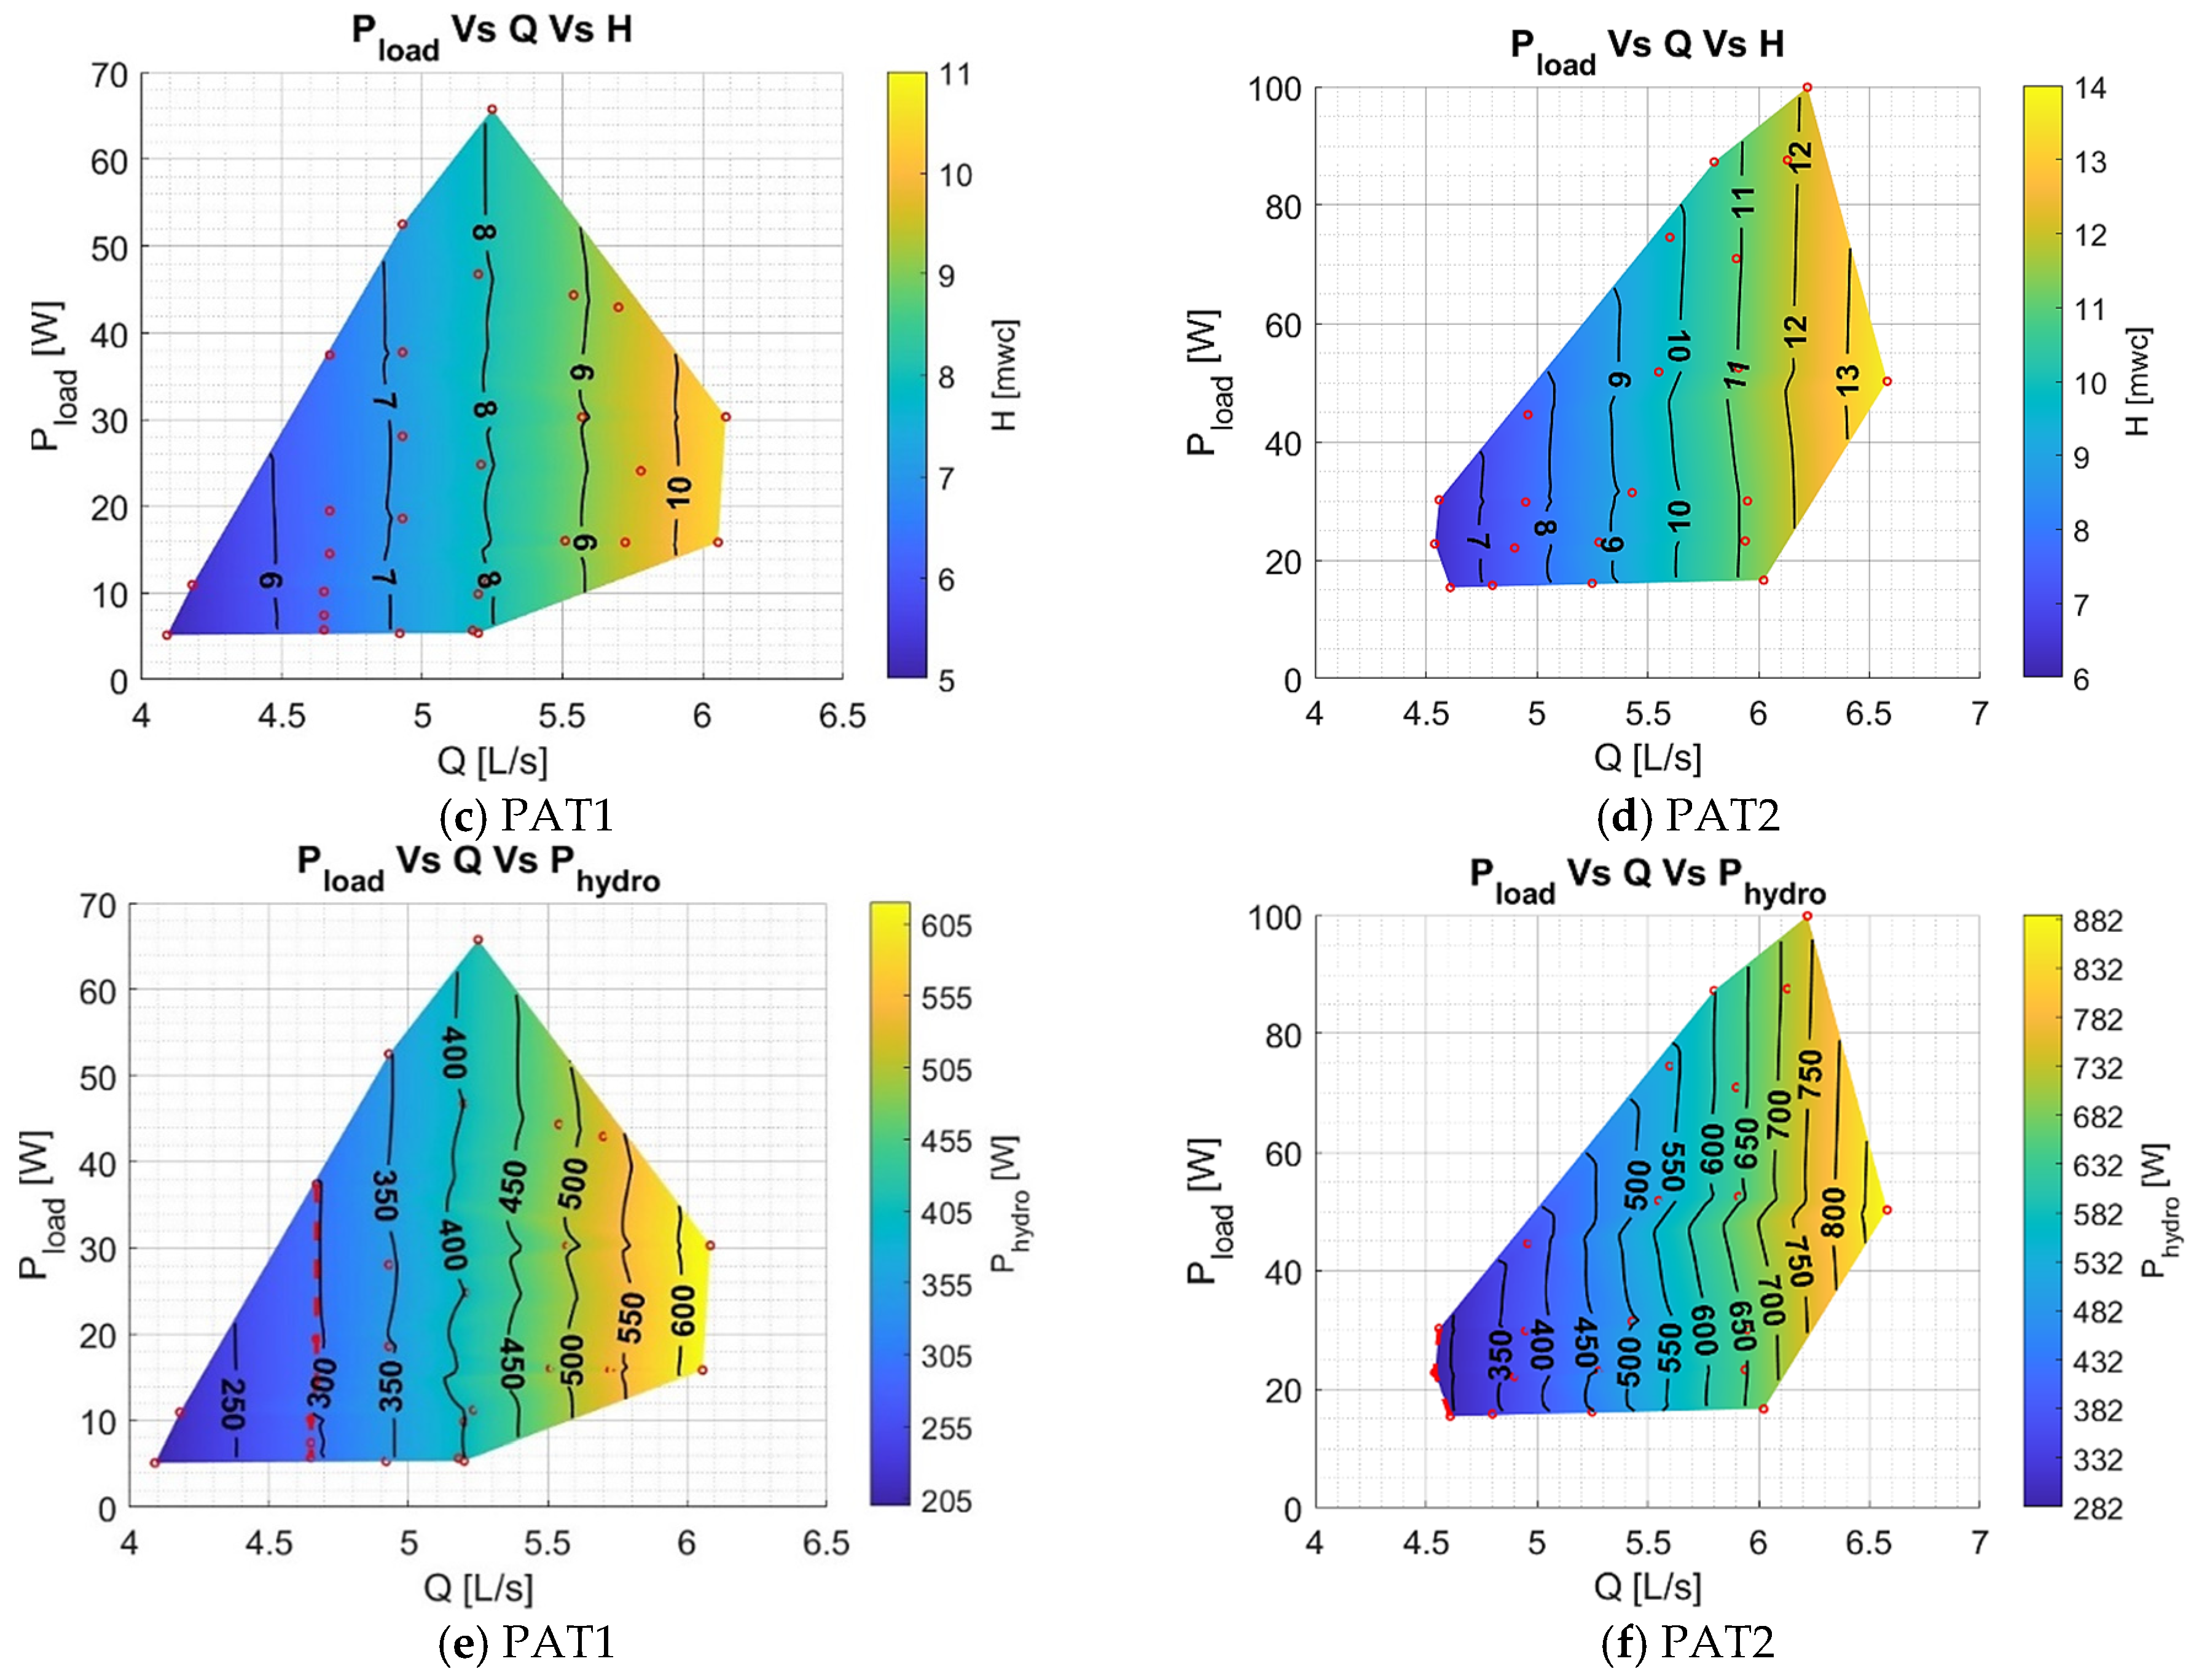
To be consistent with the study carried out in the previous section, the value of C = 16 µF has also been used to excite the SEIG since the speed operating range and the electric limits are already known for the SEIG electric operation. Each experiment used PATs, specifically, PAT1 and PAT2 coupled to the SEIG. Figure 22 shows the results of each PAT speed, Nr, and head, H, as a function of the power load, Pload, and water flow, Q. The red points correspond to the measured experimental points, while the colored area was obtained using the fit equation of the experimental results.
The electric load and water flow were changed to obtain a wide range of operational points for these radial PATs. From Figure 22a,b, it is possible to confirm, as expected, that the rotational speed increases when the electric load increases. In Figure 22c,d, following a vertical line of the experimental points, it is possible to observe that the water flow almost does not change with the increasing load, and the head only presents a slight increase. This means that when the electric load increases, the hydraulic power remains almost the same (Figure 22e,f). Therefore, this indicates that the system increases its efficiency for higher electric loads for the same water flow.
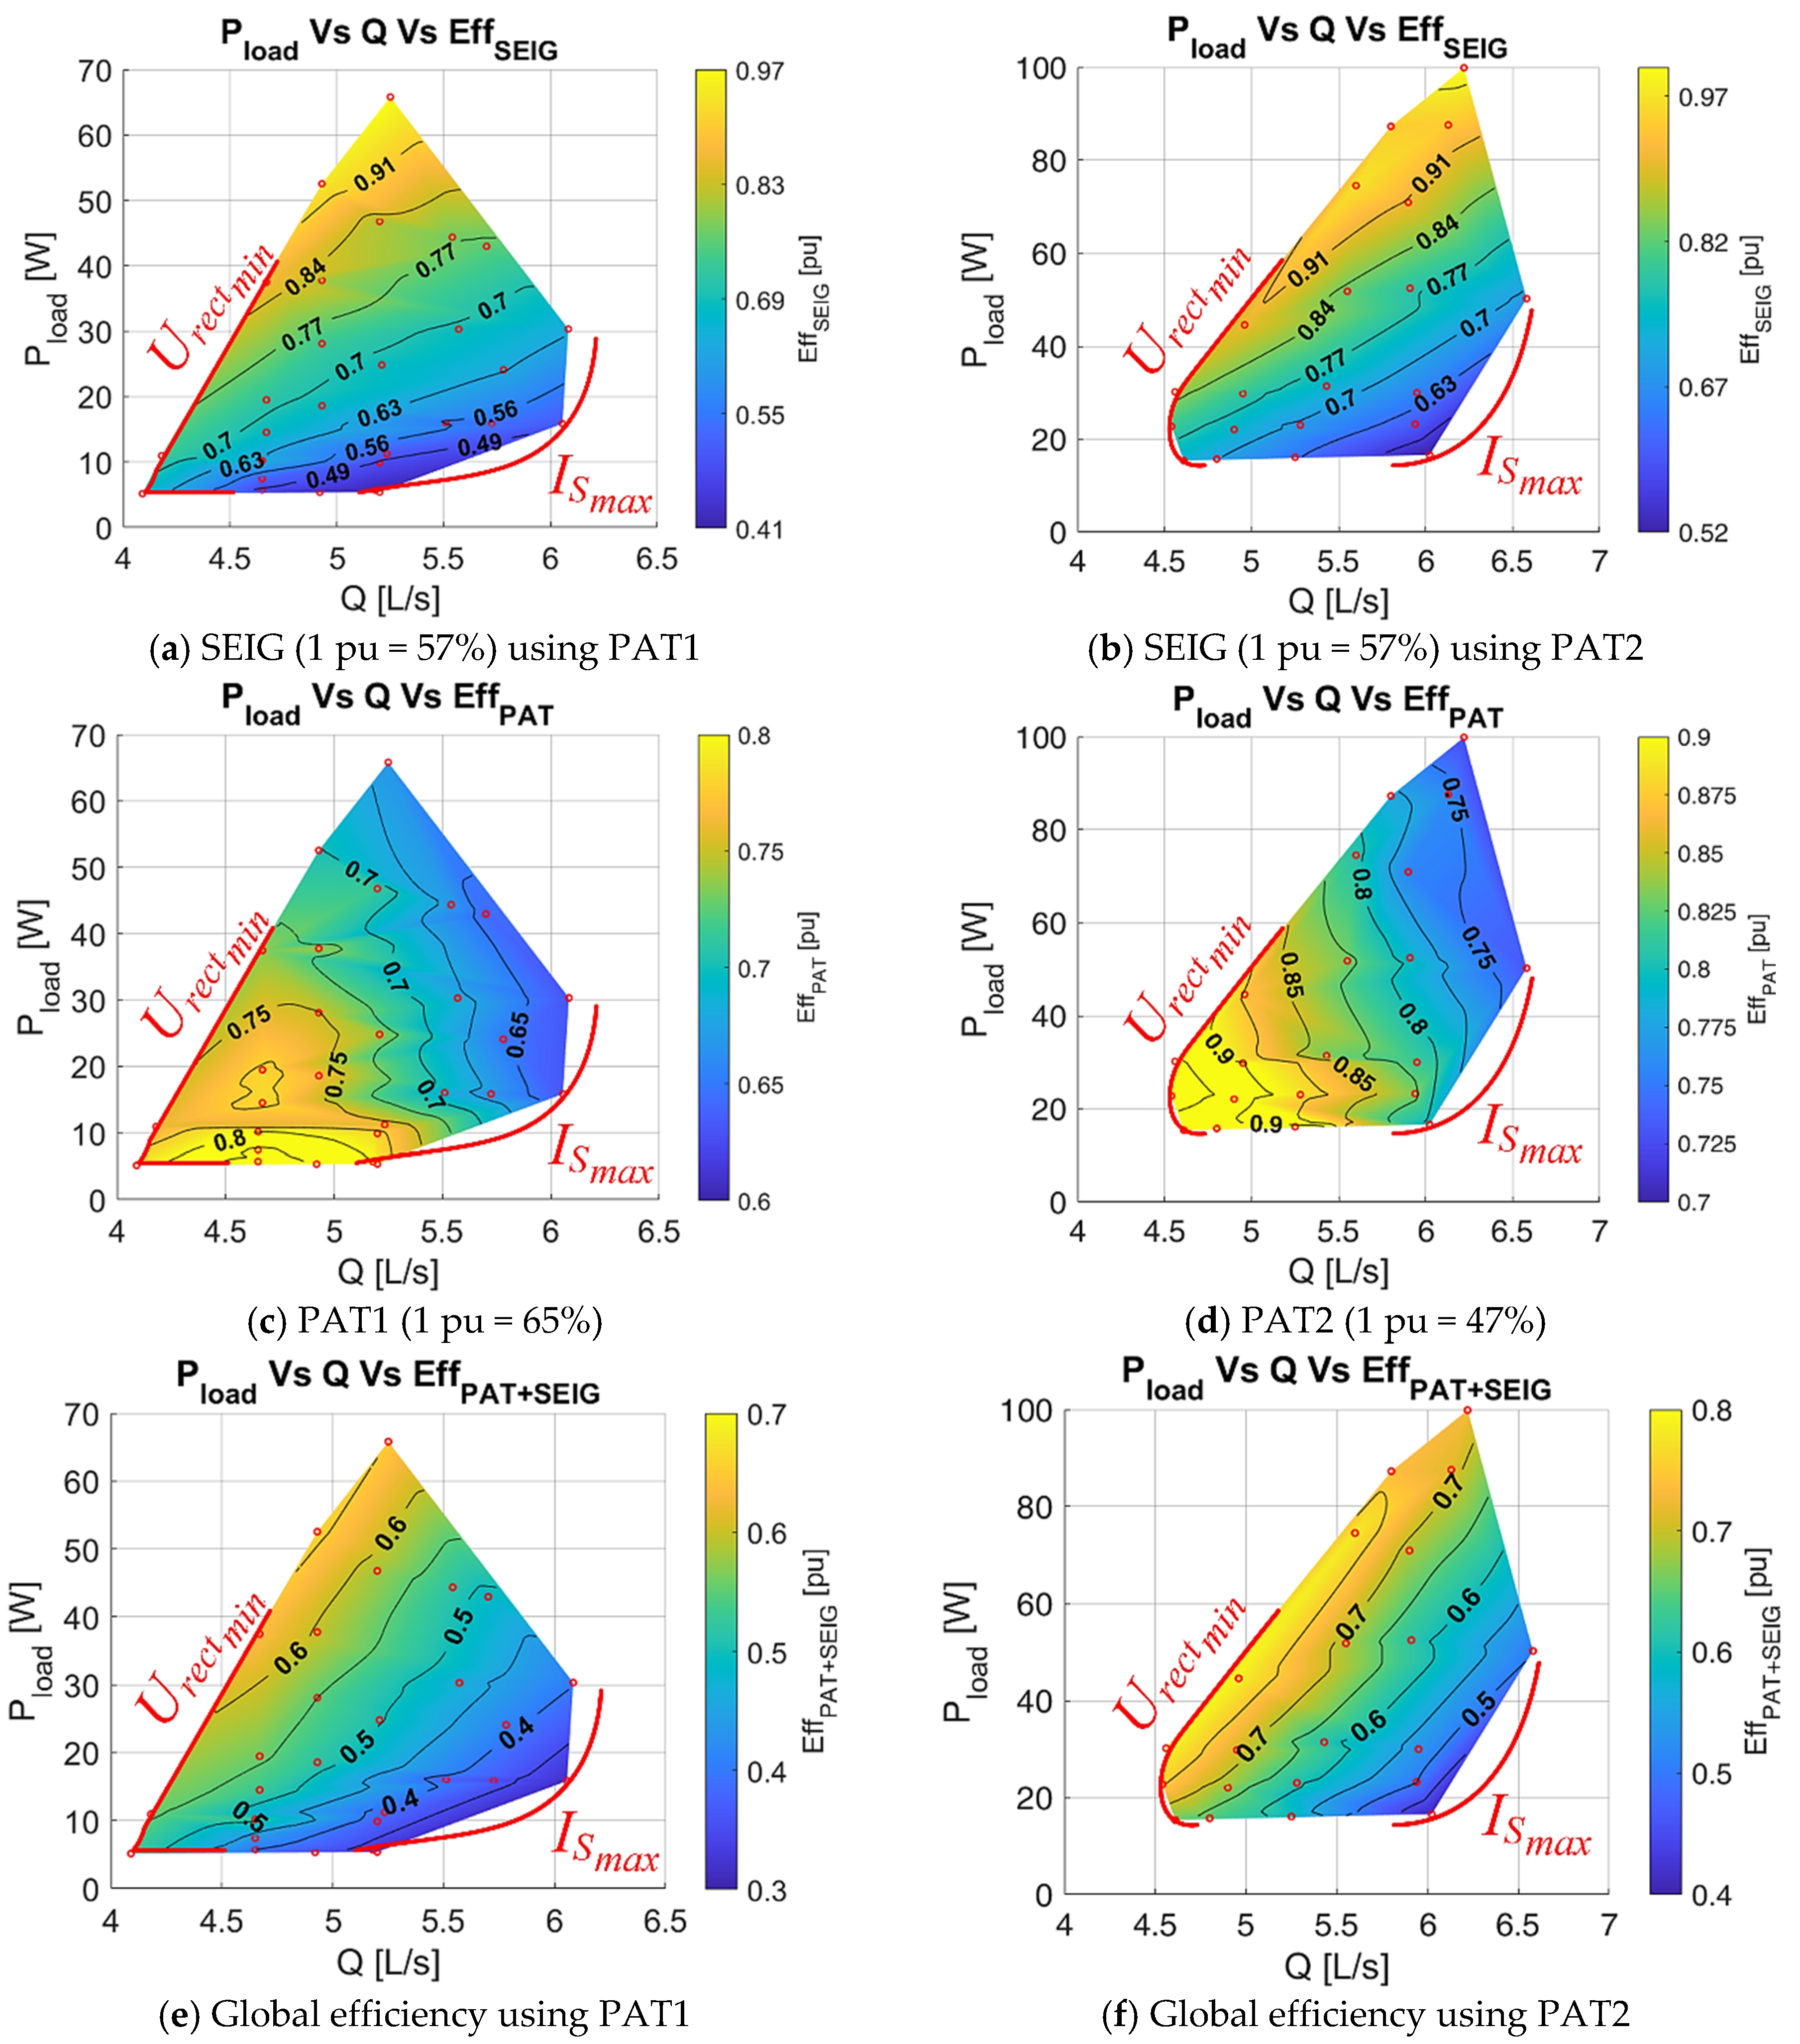
To obtain a better perception of the efficiency maps, these are represented in p.u. (per-unit system), i.e., as the ratio to their nominal efficiencies (Figure 23). In this way, it is possible to scale the results obtained for machines with higher power and/or efficiency. Please note that for low-power applications, such as the SEIG and PAT used in this research, in the order of a few hundred Watts, the maximum efficiencies of the systems are very low. The maximum efficiency of the used SEIG is 57%, and the ones of the PATs are between 47% and 65%. For power levels in the order of kW, these efficiencies usually increase to higher than 90% for SEIG and higher than 60–90% for the PAT.
The equipotential efficiency lines in Figure 23 show that the SEIG (Figure 23a,b) and PAT (Figure 23c,d) have two different behaviors. The SEIG efficiency increases for higher loads and lower water flows, while the PAT efficiency increases for lower loads and water flows. However, the efficiency range is higher for the SEIG; thus, the final system efficiency presents a similar behavior to the SEIG (Figure 23e,f). Considering the nominal efficiencies of the system’s components, the maximum p.u. efficiency for the PAT1 + SEIG and PAT2 + SEIG are 0.7 p.u. (or 0.7 p u · 57 % · 65 % = 26 % ) and 0.8 p.u. ( 0.8 p u · 57 % · 47 % = 21.4 % ) , respectively. In addition, Figure 23e,f presents the bounds of the operation system regarding the minimum DC/DC input voltage, Urectmin, and the maximum SEIG current, ISmax.

3.4. Analytical Procedure for Estimating the Operational Limits

The analytical procedure described in Section 2.6 is now applied for the same range of rotational speed and load used during the experimental tests of the SEIG. The analytical results were obtained for C = 16 μF and C = 14 μF. These are presented in Figure 24a. To facilitate the comparison, the experimental results obtained in Figure 20 are transferred to Figure 24b. The new advanced analytical model is capable of capturing the bounds of the operating range of the application regarding the minimum voltage required for the self-excitation of the SEIG and the maximum SEIG current. Reducing the value of the capacitor also produces a shift of the operation zone to higher speeds. The root-mean-square deviation (RMSD) was used to verify the accuracy of the proposed advanced analytical model, (12), where effexp and effan are the experimental and analytical results, respectively, and N corresponds to the number of experimental results. The RMSD between the analytical and experimental results is about 2.3%. These results show that the proposed analytical model is suitable for estimating the operational range and efficiency of PAT-SEIG systems when a rotational speed, capacitor value, and load are applied to the SEIG.
R M S D = n = 1 N e f f e x p e f f a n 2 N

4. Conclusions

In off-grid applications, obtaining an efficient and stable energy conversion using pumps working as turbines (PATs) coupled to self-excited induction generators (SEIGs) requires additional methodologies to maximize system efficiency and stabilize electric quantities. In this research, the proposed developed methodologies enabled, within the range of suitable operation, the creation of a stable DC voltage off-grid from a PAT-SEIG system. AC/DC and DC/DC converters were included to supply a load at constant DC voltage within a set of hydraulic, mechanical, and electrical bounds.
The operational range is essentially limited by the system’s electrical limits, namely, the minimum input voltage on the DC/DC converter and the input current on the SEIG. The choice of the capacitor value to excite the SEIG defines the speed range of the system. Therefore, selecting the best value to maximize the system’s efficiency is mandatory. Besides this, the increase in the load demanded also influences it by increasing the rotational speed and the water head for nearly constant water flow in these radial PAT impellers. The experimental methodology was verified for two sets of PAT-SEIG systems, achieving a maximum p.u. efficiency between 0.7 and 0.8 p.u.
The proposed analytical model has proved to be suitable for estimating the operational limits and efficiency of off-grid PAT-SEIG systems. This method is based on the resonance principle of the SEIG coupled to the load. The proposed analytical method was verified against experimental results with different capacitor values and presented a maximum root-mean-squared deviation of about 2.3%.
This investigation shows the capacitor value’s significance in defining the best strategy to regulate the PAT-SEIG systems to reach the maximum efficiency considering the system’s flow, available head, rotational speed, and load. Future lines of research should be aligned to define the operational control systems, considering the boundary application limits of the machines in terms of hydraulic and mechanical aspects.

Author Contributions

Conceptualization, J.F.P.F., P.J.C.B., H.M.R., M.P.-S. and P.A.L.-J.; methodology, J.F.P.F., J.M.R.C. and H.M.R.; software and calculus, J.M.R.C. and J.F.P.F.; writing—original draft preparation, J.M.R.C. and J.F.P.F.; review and editing, P.J.C.B., H.M.R., M.P.-S. and P.A.L.-J.; supervision and final preparation, all authors. All authors have read and agreed to the published version of the manuscript.

Funding

The authors are grateful for the Foundation for Science and Technology’s support of the first author through the funding UIDB/04625/2020 from the research unit CERIS and UID/EMS/50022/2019.

Data Availability Statement

The used data are available in the manuscript and can be shared upon request.

Acknowledgments

This work was supported by FCT, through IDMEC, under LAETA, project UID/EMS/50022/2019, and the project HY4RES (Hybrid Solutions for Renewable Energy Systems) EAPA_0001/2022 from INTERREG ATLANTIC AREA PROGRAMME and CERIS- UIDB/04625/2020. The research was also developed along with the research of Modesto Pérez-Sánchez called “The Improvement of the Energy Efficiency in Water Systems Using Microhydropowers Systems and Other Renewable Systems”.

Conflicts of Interest

The authors declare no conflicts of interest.

Nomenclature

DCDirect Current
PATPumps operating as turbines
PRVPressure-reducing valves
RMSDRoot-mean-square deviation
SEIGSelf-excited induction generator
WDSWater distribution system
aFrequency ratio
bSpeed ratio
CCapacitor (F)
EMagnetization voltage (V)
fElectric frequency (Hz)
HHead (m w.c.)
INNominal current (A)
keEddy current losses coefficient
khHysteresis losses coefficient
LmMagnetization inductance (H)
NNNominal speed (rpm)
nppNumber of pole pairs
NRRotational speed (rpm)
NrefReference rotational speed (rpm)
PcuCopper losses (W)
pfPower factor
PfeIron losses (W)
PmecMechanical losses (W)
QFlow (l/s)
RLLoad resistance (Ω)
RmIron losses resistance (Ω)
RrRotor resistance (Ω)
RSStator resistance (Ω)
TNNominal Torque (Nm)
UNNominal voltage (V)
XcNNominal capacitor reactance (Ω)
X r N Nominal rotor reactance (Ω)
XSNNominal stator reactance (Ω)
YcCapacitor admittance (S)
YLLoad admittance (S)
YrRotor admittance (S)
YsStator admittance (S)
αSpeed ratio
βViscous friction losses
ηEfficiency (%)
λ m Magnetization flux (Wb)

Appendix A

Parameters D1 to D6 are defined in (A1)–(A7). In these, parameters X S ,     X r ,     X m , and X L are the stator, rotor, magnetization, and load reactances, computed with the electric frequency, f. A more simplified model, without considering iron losses, Rm, was developed in [28].
D 6 = X m 2 X r 2 R s + R m X L 2 + R L X s 2
D 5 = 2 X m 2 b X r 2 ( R s + R m ) X L 2 + R L X s 2
D 4 = R r 2 ( R L X s 2 + R s X L 2 ) + ( X L 2 b 2 + R L 2 + 2 R L R s ) X r 2 + 2 R r R L X s 2 + 1 2 X L 2 ( R r + 2 R s ) R m + + R L ( X s + X r ) 2 + X L 2 ( R r + R s ) R m 2 + R L ( R L R S + X S 2 b 2 + R s 2 ) + b 2 R s X L 2 X r 2 X m 2 + + 2 R m 2 X r ( R L X r X s + R L X s 2 + R s X L 2 ) X m + X r 2 ( R L X s 2 + R s X L 2 ) R m 2
D 3 = 2 b ( X r + X s ) 2 R L + 1 2 X L 2 ( R r + 2 R s ) X m 2 + 2 X r X m R L ( X s X r + X s 2 ) + R s X L 2 + + X r 2 ( R L X s 2 + R s X L 2 ) R m 2 + R L 2 X r 2 + ( R r X s 2 + 2 R s X r 2 ) R L + R r R s X L 2 X m 2 R m + R L R s X m 2 X r 2 ( R L + R s )
D 2 = ( X r + X s ) 2 b 2 + ( R r + R s ) 2 X m 2 + 2 R s 2 X r + 2 X s ( X r 2 b 2 + X r X s b 2 + R r 2 ) X m + R s 2 X r 2 + + X s 2 ( X r 2 b 2 + R r 2 ) R m 2 + 2 R s X m 2 ( X r 2 b 2 + R r 2 + R r R s ) R m + R s 2 X m 2 ( X r 2 b 2 + R r 2 ) R L + + R m 2 R s X L 2 ( X m X r ) 2 b 2 + R r 2 + R m 2 ( R r + R s ) X m 2 + 2 R s X r X m + R s X r 2 + + X m 2 R m ( X r 2 b 2 + R r 2 + 2 R r R s ) + R s ( X r 2 b 2 + R r 2 ) R L 2
D 1 = R m R L b 2 ( X m + X r ) 2 R s 2 + ( 2 R L + 2 R r ) X m 2 + 4 R L X r X m + 2 R L X r 2 R s + R L R r X m 2 R m + 2 R r R s X m 2 ( R L + R s )
D 0 = R m 2 R L R s ( R L + R s ) ( X m + X r ) 2 b 2 + R r 2

References

  1. Meha, D.; Pfeifer, A.; Sahiti, N.; Schneider, D.R.; Duić, N. Sustainable transition pathways with high penetration of variable renewable energy in the coal-based energy systems. Appl. Energy 2021, 304, 117865. [Google Scholar] [CrossRef]
  2. Wang, Z.; Fang, G.; Wen, X.; Tan, Q.; Zhang, P.; Liu, Z. Coordinated operation of conventional hydropower plants as hybrid pumped storage hydropower with wind and photovoltaic plants. Energy Convers. Manag. 2023, 277, 116654. [Google Scholar] [CrossRef]
  3. O’Neil, R.; Oikonomou, K.; Parvania, M.; Tidwell, V.; Al-Awami, A.T.; Panteli, M.; Conrad, S.; Brekken, T.; Goharian, E.; Voisin, N. Integrated Water and Power Systems: Current State and Research Roadmap; IEEE PES Task Force on Water Power Systems, Technical Report, TR114; IEEE: Piscataway, NJ, USA, 2023. [Google Scholar]
  4. Tashtoush, B.; Alyahya, W.; Al Ghadi, M.; Al-Omari, J.; Morosuk, T. Renewable energy integration in water desalination: State-of-the-art review and comparative analysis. Appl. Energy 2023, 352, 121950. [Google Scholar] [CrossRef]
  5. Qin, J.; Duan, W.; Chen, Y.; Dukhovny, V.; Sorokin, D.; Lu, Y.; Wang, X. Comprehensive evaluation and sustainable development of water–energy–food–ecology systems in Central Asia. Renew. Sustain. Energy Rev. 2022, 157, 112061. [Google Scholar] [CrossRef]
  6. Kostner, M.K.; Zanfei, A.; Alberizzi, J.C.; Renzi, M.; Righetti, M.; Menapace, A. Micro hydro power generation in water distribution networks through the optimal pumps-as-turbines sizing and control. Appl. Energy 2023, 351, 121802. [Google Scholar] [CrossRef]
  7. Moazeni, F.; Khazaei, J. Optimal energy management of water-energy networks via optimal placement of pumps-as-turbines and demand response through water storage tanks. Appl. Energy 2020, 283, 116335. [Google Scholar] [CrossRef]
  8. Karadirek, I.E.; Kara, S.; Yilmaz, G.; Muhammetoglu, A.; Muhammetoglu, H. Implementation of Hydraulic Modelling for Water-Loss Reduction Through Pressure Management. Water Resour. Manag. 2012, 26, 2555–2568. [Google Scholar] [CrossRef]
  9. Kashyap, K.; Thakur, R.; Kumar, R.; Kumar, S. Feasibility analysis for conversion of existing traditional watermills in Western Himalayan region of India to micro-hydropower plants using a low head Archimedes screw turbine for rural electrification. Int. J. Ambient Energy 2022, 43, 7463–7473. [Google Scholar] [CrossRef]
  10. Nasir, A.; Dribssa, E.; Girma, M.; Madessa, H.B. Selection and Performance Prediction of a Pump as a Turbine for Power Generation Applications. Energies 2023, 16, 5036. [Google Scholar] [CrossRef]
  11. Balacco, G.; Fiorese, G.; Alfio, M.; Totaro, V.; Stefanizzi, M.; Torresi, M.; Binetti, M. PaT-ID: A tool for the selection of the optimal pump as turbine for a water distribution network. Energy 2023, 282, 128366. [Google Scholar] [CrossRef]
  12. Rossi, M.; Righetti, M.; Renzi, M. Pump-as-turbine for Energy Recovery Applications: The Case Study of An Aqueduct. Energy Procedia 2016, 101, 1207–1214. [Google Scholar] [CrossRef]
  13. Carravetta, A.; Del Giudice, G.; Fecarotta, O.; Morani, M.C.; Ramos, H.M. A New Low-Cost Technology Based on Pump as Turbines for Energy Recovery in Peripheral Water Networks Branches. Water 2022, 14, 1526. [Google Scholar] [CrossRef]
  14. Morani, M.C.; Chacón, M.C.; Morillo, J.G.; McNabola, A.; Fecarotta, O. Energy Efficiency Enhancement in Pressurized Irrigation Networks through Optimal Location of Pumps-as-Turbines: A Case Study in Spain. Environ. Sci. Proc. 2022, 21, 33. [Google Scholar]
  15. Stefanizzi, M.; Capurso, T.; Balacco, G.; Binetti, M.; Camporeale, S.M.; Torresi, M. Selection, control and techno-economic feasibility of Pumps as Turbines in Water Distribution Networks. Renew. Energy 2020, 162, 1292–1306. [Google Scholar] [CrossRef]
  16. Renzi, M.; Rudolf, P.; Štefan, D.; Nigro, A.; Rossi, M. Installation of an axial Pump-as-Turbine (PaT) in a wastewater sewer of an oil refinery: A case study. Appl. Energy 2019, 250, 665–676. [Google Scholar] [CrossRef]
  17. Ávila, C.A.M.; Sánchez-Romero, F.J.; López-Jiménez, P.A.; Pérez-Sánchez, M. Improve leakage management to reach sustainable water supply networks through by green energy systems. Optimized case study. Sustain. Cities Soc. 2022, 83, 103994. [Google Scholar] [CrossRef]
  18. Morabito, A.; Hendrick, P. Pump as turbine applied to micro energy storage and smart water grids: A case study. Appl. Energy 2019, 241, 567–579. [Google Scholar] [CrossRef]
  19. Ramos, H.; Borga, A. Pumps as turbines: An unconventional solution to energy production. Urban Water 1999, 1, 261–263. [Google Scholar] [CrossRef]
  20. Carravetta, A.; Del Giudice, G.; Fecarotta, O.; Ramos, H.M. PAT Design Strategy for Energy Recovery in Water Distribution Networks by Electrical Regulation. Energies 2013, 6, 411–424. [Google Scholar] [CrossRef]
  21. Polák, M. Innovation of Pump as Turbine According to Calculation Model for Francis Turbine Design. Energies 2021, 14, 2698. [Google Scholar] [CrossRef]
  22. Amelio, M.; Barbarelli, S.; Schinello, D. Review of Methods Used for Selecting Pumps as Turbines (PATs) and Predicting Their Characteristic Curves. Energies 2020, 13, 6341. [Google Scholar] [CrossRef]
  23. Karpenko, M.; Bogdevičius, M. Investigation of Hydrodynamic Processes in the System—“Pipeline-Fittings”. In TRANSBALTICA XI: Transportation Science and Technology; Gopalakrishnan, K., Prentkovskis, O., Jackiva, I., Junevičius, R., Eds.; TRANSBALTICA 2019. Lecture Notes in Intelligent Transportation and Infrastructure; Springer: Cham, Switzerland, 2020. [Google Scholar]
  24. Karpenko, M.; Stosiak, M.; Šukevičius, Š.; Skačkauskas, P.; Urbanowicz, K.; Deptuła, A. Hydrodynamic Processes in Angular Fitting Connections of a Transport Machine’s Hydraulic Drive. Machines 2023, 11, 355. [Google Scholar] [CrossRef]
  25. Stefanizzi, M.; Filannino, D.; Capurso, T.; Camporeale, S.; Torresi, M. Optimal hydraulic energy harvesting strategy for PaT installation in Water Distribution Networks. Appl. Energy 2023, 344, 121246. [Google Scholar] [CrossRef]
  26. Mitrovic, D.; Novara, D.; Morillo, J.G.; Díaz, J.A.R.; Mc Nabola, A. Prediction of Global Efficiency and Economic Viability of Replacing PRVs with Hydraulically Regulated Pump-as-Turbines at Instrumented Sites within Water Distribution Networks. J. Water Resour. Plan. Manag. 2022, 148, 04021089. [Google Scholar] [CrossRef]
  27. Hussain, S.; Humza, M.; Yazdan, T.; Abbas, G.; Cho, H.-W. Parallel Water Column Technique for Obtaining a Smooth Output Power of the Pump as a Turbine at a Variable Water Flow Rate. Appl. Sci. 2023, 13, 3232. [Google Scholar] [CrossRef]
  28. Capelo, B.; Pérez-Sánchez, M.; Fernandes, J.F.; Ramos, H.M.; López-Jiménez, P.A.; Branco, P.C. Electrical behaviour of the pump working as turbine in off grid operation. Appl. Energy 2017, 208, 302–311. [Google Scholar] [CrossRef]
  29. Hu, J.; Su, W.; Li, K.; Wu, K.; Xue, L.; He, G. Transient Hydrodynamic Behavior of a Pump as Turbine with Varying Rotating Speed. Energies 2023, 16, 2071. [Google Scholar] [CrossRef]
  30. Williams, A. Pumps as turbines for low cost micro hydro power. Renew. Energy 1996, 9, 1227–1234. [Google Scholar] [CrossRef]
  31. Ayodele, T.; Ogunjuyigbe, A.; Adetokun, B. Optimal capacitance selection for a wind-driven self-excited reluctance generator under varying wind speed and load conditions. Appl. Energy 2017, 190, 339–353. [Google Scholar] [CrossRef]
  32. Fernandes, J.F.; Pérez-Sánchez, M.; da Silva, F.F.; López-Jiménez, P.A.; Ramos, H.M.; Branco, P.C. Optimal energy efficiency of isolated PAT systems by SEIG excitation tuning. Energy Convers. Manag. 2019, 183, 391–405. [Google Scholar] [CrossRef]
  33. Pagaimo, M.C.; Fernandes, J.F.; Pérez-Sánchez, M.; López-Jiménez, P.A.; Ramos, H.M.; Branco, P.C. Transient study of series-connected pumps working as turbines in off-grid systems. Energy Convers. Manag. 2021, 245, 114586. [Google Scholar] [CrossRef]
  34. Zhang, H.; Chen, D.; Wu, C.; Wang, X.; Lee, J.-M.; Jung, K.-H. Dynamic modeling and dynamical analysis of pump-turbines in S-shaped regions during runaway operation. Energy Convers. Manag. 2017, 138, 375–382. [Google Scholar] [CrossRef]
  35. Mataix, C. Turbomáquinas Hidráulicas; Universidad Pontificia Comillas: Madrid, Spain, 2009. [Google Scholar]
Figure 1. Proposed research methodology.
Energies 17 01382 g001
Figure 2. DC off-grid composed using a PAT-SEIG system.
Energies 17 01382 g002
Figure 3. Pump as turbines used: PAT1 rated for 1050 rpm; PAT2 rated for 760 rpm.
Energies 17 01382 g003
Figure 4. Head–flow curves of PATs used: (a) PAT1 rated 1050 rpm and (b) PAT2 rated 760 rpm.
Energies 17 01382 g004
Figure 5. Induction machine used as SEIG.
Energies 17 01382 g005
Figure 6. Experimental setup to determine the required capacitor values as a function of the rotational speed.
Energies 17 01382 g006
Figure 7. DC/DC converter.
Energies 17 01382 g007
Figure 8. Block diagram of self-excited induction generator, coupled to the DC motor (acting as a PAT), excited by the capacitor bank and powering a load.
Energies 17 01382 g008
Figure 9. (a) Hydraulic circuit schematic, (b) Experimental hydraulic circuit. Hydraulic system composed by (1) flow control tank, (2) recirculating pump, (3) air vessel, (4) pipes, and (5) a PAT coupled to the SEIG.
Energies 17 01382 g009
Figure 10. (a) Downstream reservoir inserted in the (b) buffer tanks to ensure a pressure drop at the PAT and a closed loop system.
Energies 17 01382 g010
Figure 11. (a) Pump (arrow) to feed water from the buffer to the air vessel reservoir. The red circle is a hand valve. (b) Air vessel (or hydropneumatic) reservoir connected to an air pressure control valve to allow pressure and flow variation at the PAT input.
Energies 17 01382 g011
Figure 12. Equivalent electric circuit of the self-excited induction generator based on the per-unit frequency a.
Energies 17 01382 g012
Figure 13. Flowchart describing the analytical procedure.
Energies 17 01382 g013
Figure 14. (a) Magnetizing inductance and (b) mechanical and iron losses as a function of the stator voltage.
Energies 17 01382 g014
Figure 15. Required capacitor value to self-excite the induction machine for different speeds. Experimental tests in ‘o’, the analytical model (5) in red, and the advanced model developed in [28] are shown here in blue.
Energies 17 01382 g015
Figure 16. DC/DC output voltage for two input voltage values and for a load of 200 W. In the (a) for an input voltage of 180 V and in the (b) for an input voltage of 360 V.
Energies 17 01382 g016
Figure 17. System load curve as a function of SEIG rotation speed for C = 16 µF.
Energies 17 01382 g017
Figure 18. Load curves as a function of rotational speed and system boundary operation zone for C = 16 µF: (a) rectified voltage, (b) DC motor armature current, (c) load current, and (d) SEIG current. The red dots are the collected experimental data.
Energies 17 01382 g018
Figure 19. Efficiency map of the electric system for C = 16 µF: (a) absolute values of efficiency and (b) efficiency per unit values referred to the SEIG nominal efficiency. The red dots are the collected experimental data.
Energies 17 01382 g019
Figure 20. Comparison between the efficiency maps for C = 16 µF and C = 14 µF. 1 p.u. corresponds to 40%. The red dots are the collected experimental data.
Energies 17 01382 g020
Figure 21. SEIG excitation influences the H–Q of the PAT1 curve for several capacitor values and different operation points. The white dots are the collected experimental data. (a) overall curve, and (b) zoomed view around the measured experimental points.
Energies 17 01382 g021
Figure 22. Influence on the hydraulic parameters for increasing loads, as a function of the load, Pload, and water flow, Q: (a,b) rotational speed, Nr, (c,d) head, H, and (e,f) hydraulic power, Phydro, for PAT1 and PAT2. The red dots are the collected experimental data.
Energies 17 01382 g022aEnergies 17 01382 g022b
Figure 23. System’s efficiency as a function of the load, Pload, and water flow, Q: (a,b) SEIG efficiency, (c,d) PAT efficiencies, and (e,f) global efficiency for PAT1 and PAT2. The red dots are the collected experimental data.
Energies 17 01382 g023
Figure 24. Comparison between analytical (a) and experimental results (b) applied for the same range of rotational speed and load of the SEIG. The red dots are the collected experimental data.
Energies 17 01382 g024
Table 1. Nominal parameters of pumps as turbines.
ParameterPAT1PAT2
Nominal speed [rpm]1050760
Nominal flow [m3/h]12.9611.5
Nominal head [mwc]4.02.78
Nominal efficiency [%]6547
Table 2. Nominal parameters of the induction machine.
ParametersValues
Frequency, f N [Hz]50
Nominal Voltage, U N [V] (delta/star)230/400
Nominal Current, I N [A] (delta/star)1.95/1.12
Nominal Power Factor, pf0.56
Number of Pole Pairs, n p p 4
Nominal Output Power [kW]0.25
Nominal Input Power [kW]0.435
Nominal Speed, N N [rpm]693
Nominal Torque, T N [Nm]3.45
Nominal Efficiency, η N 57%
Table 3. Nominal parameters of DC/DC converter.
ParameterValue
Input Voltage Range [V]180–425
Nominal Power [W]600
Input Current: No-Load [mA]10
Input Current: Full-Load [A]2.20
Output Voltage [V]48
Output Current [A]12.5
Ripple and Noise [mV]480
Efficiency91%
Maximum Capacitive Load [µF]8000
Table 4. Electric system operational limits.
ParameterValuesLimit
Urect [V]180(1)
I DC armature [A]7.5(2)
ILoad [A]1.2(3)
ISEIG [A]1.95(2)
Disclaimer/Publisher’s Note: The statements, opinions and data contained in all publications are solely those of the individual author(s) and contributor(s) and not of MDPI and/or the editor(s). MDPI and/or the editor(s) disclaim responsibility for any injury to people or property resulting from any ideas, methods, instructions or products referred to in the content.