Abstract
Knock in spark ignition (SI) engines occurs when the air–fuel mixture in the combustion chamber ignites spontaneously ahead of the flame front, reducing combustion efficiency and possibly leading to engine damage if left unattended. The use of knock sensors to prevent it is common practice in modern engines. Another measure to mitigate knock is the use of higher-octane fuels. The American Society for Testing and Materials’ (ASTM) determination of the Research Octane Number (RON) and Motor Octane Number (MON) of spark ignition fuels has been based on measuring cylinder pressure rise at the onset of knock since its inception in the 1930s. This is achieved through a low-pass filtered pressure signal. Knock detection in contemporary engines, however, relies on measuring engine vibrations caused by high-frequency pressure oscillations during knock. The difference between conditions in which fuels are evaluated for their octane rating and the conditions that generate a knock intensity signal from the knock sensor suggests a potential difference between octane rating and the knock limit typically identified by a contemporary knock sensor. To address this disparity, a modified RON measurement method has been developed, incorporating pressure oscillation measurements. This test method addresses the historical lack of correlation between RON and high-frequency pressure oscillation intensity during knock. Using toluene standardization fuels (TSFs) as a reference, the obtained results demonstrate excellent high-frequency knock intensity-based RON estimations for gasoline. The method is able to differentiate between two fuels that share the same ASTM RON, associating them with a RON-like metric that is more aligned with their performance in a modern SI engine. This alternative method could potentially serve as a template for an upgrade to the existing ASTM RON method without significantly disrupting the current approach. Additionally, its capability to evaluate fuels beyond RON 100 opens the door to assessing a wider range of fuels for antiknock properties and the intensity of fuel oscillations during knocking combustion.
1. Introduction
With more than 1 billion vehicles in the world today [1] and counting, sustainable fuels could play an important role in the reduction in the carbon footprint of the world’s existing vehicle fleet. In SI engines, one of the most important aspects of fuel quality is its resistance to knock, indicated by the octane number. Knocking combustion occurs when the mixture of air and fuel in front of the advancing flame front undergoes spontaneous ignition. This results in rapid pressure oscillations, resulting in loss of engine power and efficiency, and even posing a risk of engine damage or failure. Knocking combustion is avoided by the engine control unit (ECU), which adapts the spark ignition timing when the onset of knock is detected. Application of knock limited spark advance (KLSA) strategies comes at the cost of engine efficiency, since the spark ignition timing is adjusted to move away from the optimum spark timing for maximum brake torque (MBT). Fuels with higher knock-resistive properties are therefore beneficial for SI engine efficiency.
A fuel’s knock-resistant properties are defined by various parameters, such as chemical structure, latent heat of vaporization (HOV), and laminar flame speed. The operating conditions, often related to the engine load, pressure and temperature in the combustion chamber, as well as engine speed, also affect the tendency for a fuel to knock.
Investigation of the knock phenomenon dates back to the early 1900s. Around 1930, the Cooperative Fuel Research Committee introduced the Cooperative Fuel Research (CFR) engine and the octane scale. This scale assesses the autoignition characteristics of a sample fuel by comparing it to a reference blend with a specified octane number. The reference blends consist of binary combinations of 2,2,4-trimethylpentane (also known as iso-octane) and n-heptane, referred to as primary reference fuels (PRFs). According to the definition, the octane number (ON) of a PRF blend is equivalent to the volumetric ratio of iso-octane in a mixture of iso-octane and n-heptane, as expressed in Equation (1). For instance, a blend comprising 95% iso-octane and 5% n-heptane would have an ON of 95.
Two traditional test methods were developed to assign a fuel’s octane rating. The initial ON development involved the research octane number (RON) test method first, with the motor octane number (MON) test being introduced later. The MON method was developed in response to on-road testing that revealed the inadequacy of RON alone, since some fuels that met RON specifications did not seem to meet performance expectations on the road. The MON test provides additional information on a fuel’s resistance to knocking under different driving conditions by simulating higher-speed and heavier-load engine operation. The main differences between RON and MON conditions are listed in Table 1. Due to the constant inlet mixture temperature, the MON test cancels the cooling effect of components with a high latent heat of vaporization, making it possible to isolate the antiknock impact of the fuel chemistry.

Table 1.
RON and MON test conditions.
Generally, gasoline tends to have a higher RON in comparison to its corresponding MON. The disparity between these numbers is defined as “fuel sensitivity” (S), represented by Equation (2).
This phenomenon is rooted in the negative temperature coefficient (NTC) reactivity of paraffinic fuels [2], including primary reference fuels, influencing their ignition delay as temperatures increase. Contemporary gasolines are composed of a blend of normal-, iso-, and cyclo-paraffins, oxygenates, olefins, and aromatics; the latter two components usually lacking a distinct NTC region, or not having it at all [3]. As a result, during the MON test, paraffinic fuels exhibit higher resistance to autoignition, leading to higher MON values compared to their oxygenated counterparts with the same RON [3,4].
In the RON and MON measurement setup as described in ATSM-D2699 and D-2700, respectively [5,6], knock intensity is assessed by analysing the output signal from the so-called detonation pickup-model D1 sensor. This system comprises a magnetorestrictive rod mounted in a coil, generating a voltage in response to changes in pressure within the combustion chamber. The sensor’s signal undergoes processing through a detonation meter, which, in turn, produces a signal for the knock meter—a display indicating the intensity of knock. It is a known fact that this system acts as a low-pass signal filter with a 2.85 kHz limit [7]. It measures , the sudden pressure increase at the so-called “knock point” where the cylinder pressure trace bends upwards, moving away from the normal cylinder pressure trace, when knocking combustion occurs as illustrated in Figure 1.
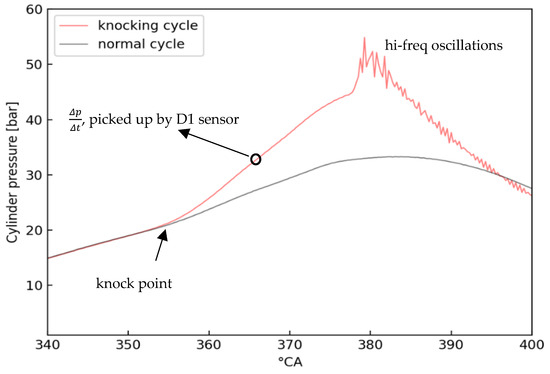
Figure 1.
Knocking combustion cycle vs. normal combustion cycle for RON 98 PRF.
Arrigoni was one of the first scientists to investigate the knock phenomenon in depth in the 1970s [8], and they noticed high-frequency pressure oscillations around top dead centre (TDC) when knocking combustion occurred. These oscillations usually occur within a frequency range of 3.5 to 15 kHz and are represented by the pressure spikes in Figure 1. In a contemporary production SI engine, those high-frequency oscillations cause engine vibrations that are picked up by a so-called knock sensor. The majority of knock sensor technology is based on based on piezo-ceramic material, combined with seismic mass, generating a signal to the engine’s ECU when the sensor is excited by the high-frequency pressure oscillations—not necessarily the —during knocking combustion. Next to the fact that the D1 pickup system’s frequency spectrum is limited to 2.85 kHz, knock sensors are generally mounted on the engine block surface in contrast to the D1′s mounting position, flush with the combustion chamber wall. Arrigoni’s work indicated that there is a good correlation between the knock meter signal and the high-frequency pressure oscillations, and later work from Yates et al. [9] revealed an inconsistent correlation between the pressure oscillations and the corresponding octane number for the Research and Motor method reference conditions.
The shortcomings of the ASTM RON/MON methodology further become evident in Figure 2, which illustrates a knocking combustion cycle of a PRF and a toluene standardization fuel (TSF), both sharing the same RON of 97. Both fuels show the same (identical RON) after the knock point, but feature a different oscillation intensity. In this case, the engine’s knock sensor would “measure” another kind of “RON” than what would be measured by the D1 pickup.
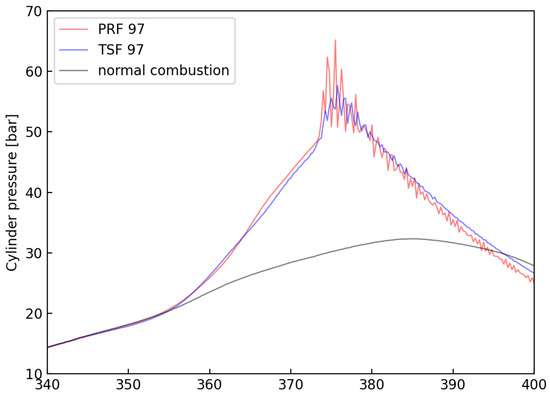
Figure 2.
Oscillation behaviour of PRF RON 97 and TSF RON 97 for one knocking combustion cycle. Compression ratios are 9.1 for the PRF and 8.6 for the TSF.
The inconsistency between the knock intensity signal from the knock sensor and the conditions used for rating fuels for octane values suggests a potential difference between octane rating and the knock limit typically detected by a modern knock sensor [10]. Additionally, the conditions under which the RON and MON tests are conducted diverge considerably from those found in a modern-day engine. This further supports the argument that RON and MON are not reliable indicators of knock resistance for contemporary engines.
In the context of a pioneering second-generation SI biofuel initiative [11,12], a novel approach to octane rating was devised. This method hinges on the fuel’s oscillation characteristics, aiming to address the limitations of the ASTM octane rating system. This work introduces a novel approach that addresses the traditionally weak correlation between oscillation intensity and ASTM RON, a step not previously taken. The subsequent sections delve into the background of knock intensity, present the methodology description of past work, and discuss the results obtained with an improved method using different reference fuels.
2. Methodology
2.1. Knock Intensity Definition
Since the introduction of Arrigoni’s work, knock intensity (KI) was redefined in the literature to better match the phenomenon that is measured by the knock sensor. Based on a filtered pressure signal where the oscillations are isolated from the cylinder pressure trace, different expressions have been developed to quantify knock intensity. A commonly used KI indicator is the maximum amplitude of pressure oscillation (MAPO), the highest occurring pressure peak in a combustion cycle. However, upon examining consecutive combustion cycles, it becomes evident that there is a weak correlation—if any—between the rate of pressure change at the knock point and the pressure oscillations that ensue from it. Figure 3 shows two separate combustion cycles with PRF 98 in the CFR engine. Cycle 1 has a steeper compared to cycle 2, which would lead to higher readings on the ASTM D1 pickup, but it features lower pressure peaks, leading to a lower MAPO-based KI reading. So a steeper does not always lead to higher oscillation pressures.
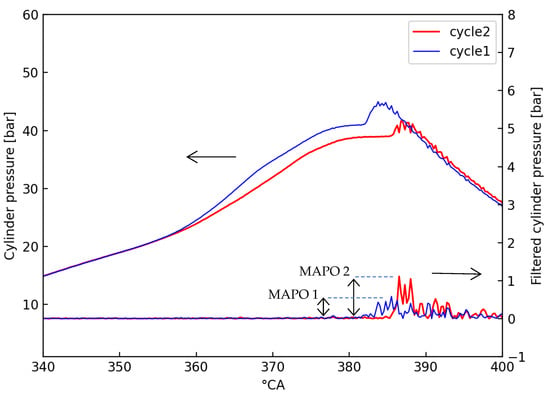
Figure 3.
Example of successive knocking cycles of RON 98 PRF. Steeper initial pressure curves do not necessarily lead to higher pressure oscillation amplitudes.
Different methods have been applied in the literature to provide quantification metrics of successive knocking combustion cycles, with the running average of MAPO being commonly applied [13]. However, even with a high number of combustion cycles, although the running average may evolve to a stable KI outcome, there is generally a weak correlation between a fuel’s octane number and AMPO-based KI quantification [14,15].
2.2. Correlating Oscillation-Based Knock Intensity with a Novel RON Estimation Method
Given the weak correlations between MAPO, RON, and corresponding KIs found in the literature, the authors found a method to deal with the stochastic nature of knock [16]. As the current study relies on this prior research, it is essential to provide a brief overview of the previously developed method for better comprehension. The experimental setup was based around a CFR engine, where the original carburetor system was replaced by a port fuel injection system. The D1 pressure pickup sensor was replaced by a Kistler 701A pressure transducer mounted flush with the cylinder wall. A PID-controlled electrical air heater was mounted in the air intake in front of the fuel injector. A crank angle encoder with 0.25° resolution was connected to the crankshaft. The system, depicted in Figure 4, was connected to a National Instruments data acquisition system controlled by a Labview 2015 program while the engine was controlled by a Motec ECU.
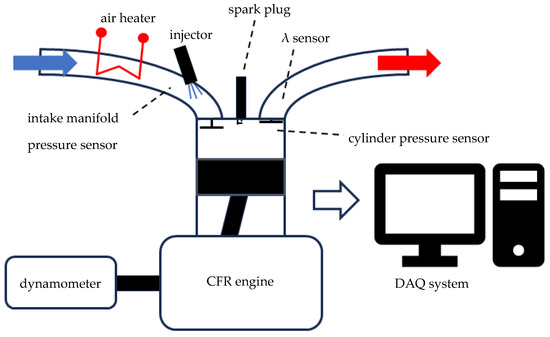
Figure 4.
Experimental setup.
The NI hardware is based on a PXI-1050 chassis, with pressure sensors connected to a BNC-2120 data acquisition system.
For each cycle, the pressure trace was filtered using a 5th-order band-pass Butterworth filter in a Python 3.10 script, with cutoff frequencies set at 3.5 kHz and 10.8 kHz. Huber et al. recommended a bandpass filter range of 3.5 to 15 kHz [7], but with a sampling rate of 4 samples per crank angle degree, Nyquist’s theorem limits the achievable higher cutoff frequency.
Instead of MAPO, the (single) highest pressure peak, indicated as p1 in Figure 5, a multitude of pressure peaks in the same cycle were used. The method is called MAMPO, for mean average maximum pressure oscillations. With this method, KI is calculated by averaging the highest pressure oscillation amplitudes, expressed in Equation (3), where X is the number of pressure peaks considered. This KI is defined as the average of the maximum pressure oscillations using X pressure peaks (AMPOX)
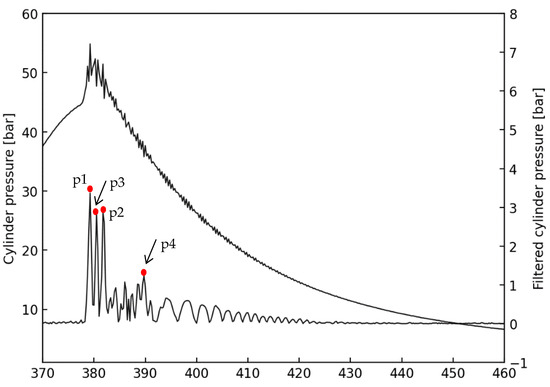
Figure 5.
A knocking combustion cycle and its corresponding filtered signal, with the four highest amplitudes shown.
When AMPOX is averaged out over a number of combustion cycles, the mean average maximum pressure oscillations using X pressure peaks (MAMPOX) can be calculated, expressed in Equation (4).
In a previous study, the authors conducted a comparative analysis [16], determining knock intensities for ten primary reference fuels (PRFs) with RON values ranging from 90 to 100 in increments of 1 RON. The knock intensities were assessed based on the 1, 2, 5, 10, 20, and 30 highest pressure peaks, with sample sizes varying from 250 to 3000 successive cycles. The findings concluded that employing 20 pressure peaks (MAMPO20) with a minimum sample of 500 successive cycles for KI calculations of a PRF yielded stable knock intensity results under unchanged operating parameters. Conversely, employing fewer pressure peaks or a smaller sample size led to a higher coefficient of variation, resulting in an unstable knock intensity outcome. Additionally, it was discovered that a certain threshold of knock intensity was necessary for reproducible results. A knock intensity value of 40 kPa using 20 pressure peaks (MAMPO20 = 40 kPa) was deemed sufficient. The engine speed was configured to 900 RPM, the highest allowable on a CFR setup, aiming to more closely mimic real-world engine speeds. Intake air temperature and ignition timing were selected according to ASTM RON specifications. Table 2 outlines the MAMPO test parameters.

Table 2.
Parameters of the MAMPO RON estimation test.
Applying the parameters of Table 2, all ten PRF fuels were tested in the CFR engine, and the compression ratio was increased until knock occurred. A MAMPO20 knock intensity value of 40 kPa was aimed for and the compression ratios to obtain a knock intensity slightly above and slightly below this value, with a maximum deviation of 10 kPa, were noted. The compression ratio to obtain a MAMPO20 knock intensity was then obtained via interpolation. A highly correlated linear relationship between PRF octane number and interpolated compression ratio was found, with an R² value of 0.9888. This is depicted in Figure 6.
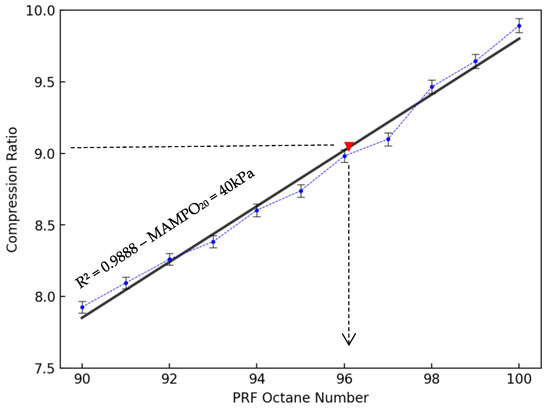
Figure 6.
Compression ratio as a function of PRF octane number for MAMPO20 KI of 40 kPa.
To determine the estimated RON of a fuel sample, it is subjected to combustion over 500 consecutive cycles with a MAMPO20 KI just above and slightly below 40 kPa (±10 kPa), with the interpolated compression ratio calculated for 40 kPa. Subsequently, the octane number of the sample fuel can be derived using Equation (5), with an experimental uncertainty of ±0.3, as specified in [17].
Equation (6) is graphically represented in Figure 6. The CFR’s interpolated compression ratio for a sample fuel to knock with a MAMPO20 KI of 40 kPa is indicated by the triangular marker.
2.3. Experimental Uncertainty Analysis
It is evident that the error in the measured MAMPO20 ON is directly influenced by the error in the compression ratio, which is adjusted to achieve a MAMPO20 of 40 kPa. Several factors affect the CR adjustment, including fluctuations in air temperature, air-to-fuel ratio, ignition timing, inaccuracies in PRF blend composition, and the precision of the pressure sensors.
The in-cylinder pressure sensor gauges the cylinder pressure relative to the absolute inlet pressure. Both sensors possess a relative error (RE) of 0.5%. Consequently, the relative in-cylinder pressure is measured with a total RE of ±1%. It is assumed that the digital Butterworth filter applied to the pressure trace does not affect the error, meaning the 1% error propagates throughout the entire AMPO and MAMPO calculations. For the targeted value of 40 kPa, this translates to an absolute error (AE) of 0.4 kPa. Given the utilization of 20 pressure peaks, the AE accumulates to 8 kPa, which, when divided by 20, maintains the AE at 0.4 kPa. To assess the impact of this 0.4 kPa discrepancy on the compression ratio (CR), the scenario of PRF 95 was considered, where MAMPO20 was measured at two distinct compression ratios, as outlined in Table 3. The rule of three was employed to compute the variance in compression ratio due to the 0.4 kPa error in MAMPO20 calculations.

Table 3.
CR-MAMPO20 relationship for PRF 95.
The compression ratio error can be determined by employing the cylinder head position gauge of the CFR, which offers a reading accuracy of ±0.01, resulting in a CR AE of ±0.011. Consequently, the total CR error is 0.013, which, when incorporated into Equation (6), yields a MAMPO20 RON error of ±0.066. This figure is rounded to 0.1 MAMPO20 RON, making it more relevant within its context. The ignition timing error remains constant at 13° BTDC (Before Top Dead Centre) under all circumstances, determined by the upward ramp signal of a hall effect sensor in the engine’s ignition system and is considered negligible. All PRF blends were internally produced using a graduated cylinder with 1 mL divisions and manufactured in 1 L batches. For the PRF with a RON of 95, the AE on the RON of the calibration PRF was calculated to be 0.095, and this error was consistently applied across all calibration PRFs. No significant correlation was observed between a 10 °C variation in intake air temperature and the resulting MAMPO20 RON value, thus the error is considered negligible. However, the literature indicates a significant correlation between the λ value (air–fuel ratio) and MAMPO20 RON. Measurements of the identical E10 fuel batch were conducted under both lean and rich stoichiometric combustion conditions, with the resulting derived octane numbers provided in Table 4.

Table 4.
Influence of λ on derived MAMPO20 ON of gasoline E10.
To define the MAMPO20 RON error, the worst case of a 10% increase in λ resulting in a 2.22% increase in calculated MAMPO20 RON was taken into consideration. Given that the AE on the λ value is 0.01 as defined by the air–fuel ratio measurement system (an RE of 1% at λ = 1), the RE on the MAMPO20 RON that would be caused by an error in λ is 0.222% for a RON 95 fuel, leading to an absolute error of 0.21 MAMPO20 RON. The total combined error, caused by λ and CR uncertainties on the MAMPO20 ON measurement, is therefore estimated at ±0.3 MAMPO20 ON, which is in line with uncertainties.
This relatively small error seems to be confirmed by the high R2 value of the regression model of Equation (6) and is in line with uncertainty limits found in the literature [17].
Despite the good correlation when using PRFs, it was found that MAMPO20 RON estimations for fuels showing different oscillation behaviours than those of PRFs tend to underestimate the obtained RON value. This method results in an offset with the fuel’s ASTM RON number. This offset, although unwanted, is to be expected since the oscillation behaviours of oxygenated fuels like E10 or E05 are known to be different than those of paraffinic fuels [14,18].
In order to explore potential enhancements to the method’s RON estimation outcomes, tests were performed next with toluene standardization fuels (TSFs) instead of primary reference fuels, which was the main subject of this work.
2.4. New Methodology for MAMPO-Based RON Estimations Using Toluene Standardization Fuels
TSFs consist of ternary mixtures of n-heptane, iso-octane, and toluene, which more accurately reflect the behaviour of the aromatic components found in real gasoline fuels [19,20,21]. It has led in the past to an amendment of the ASTM RON test method, which since then includes a “fit for use” test using TSFs with accepted reference value (ARV) RONs [5]. This RON test method is based on TSFs ranging from 65.1 RON to 113.0 RON, incorporating blends of toluene, n-heptane, and iso-octane.
To explore a potential improvement of the method outlined in the previous section, a number of TSFs were selected and tested according to the same operating conditions listed in Table 2. The TSFs that were used in the experiment are listed in Table 5. TSFs lower than RON 89.3 were not considered.

Table 5.
TSF blends per ASTM-D2699 with associated compression ratios for MAMPO20 KI of 40 kPa.
3. Results
In accordance with the methodology that was used with PRFs, all TSFs were subjected to knocking combustion with a MAMPO20 intensity slightly above and below 40 kPa. Table 5 lists the interpolated compression ratios for which all TSFs would be knocking with a MAMPO20 intensity of 40 kPa. Similar to the PRF scenario, a linear relationship was observed between the TSF’s octane number and the compression ratio needed to obtain a 40 kPa MAMPO20 knocking intensity. The R² value of the regression line was found to be 0.9909, better than in the PRF case. The thus obtained TSF-based RON estimation can be expressed by Equation (6).
For clarity and to distinguish between the PRF-based method, the TSF-based MAMPO20 will from now on be indicated as MAMPO20T, where T stands for “TSF-based”.
The regression line of the TSFs is juxtaposed with that of the PRFs in Figure 7, with the earlier compression ratio measurements for E10 and E05 highlighted on the graph. The significant deviation of the TSF measurements from the TSF regression line can be attributed to the inclusion of three measurements above RON 100 in the regression, which, although utilized for the analysis, are not visible on the chart.
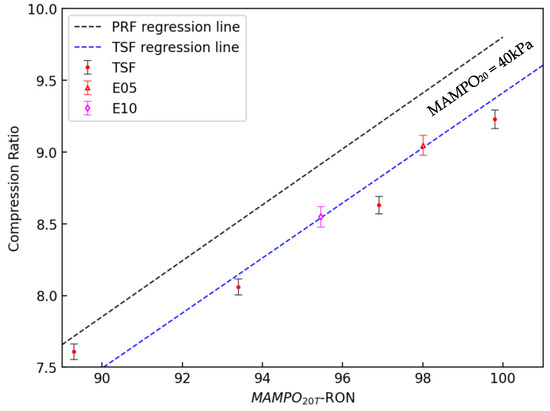
Figure 7.
Compression ratios for RON 95 and RON 98 gasoline to obtain MAMPO20T KI of 40 kPa.
One can note that the offset between ASTM RON and MAMPO20T RON is noticeably smaller for both gasoline types compared to the case when PRFs are used as a reference. Table 6 gives a comparative overview.

Table 6.
Differences between PRF- and TSF-based MAMPO20 RON estimations.
The small differences between ASTM RON and MAMPO20T RON seem to confirm the fact that TSFs correctly represent the oscillation behaviour of gasoline and that RON estimations can be made, based on oscillation behaviour during knock, within experimental uncertainty limits of ±0.7 RON, as mentioned in the work by Singh et al. [22].
The method becomes particularly interesting when assessing RON values for fuels exceeding RON 100. Compared to the higher experimental uncertainty with the ASTM method using TSFs that can go up to ±1.7 RON, the uncertainty of the MAMPO20T method remains unchanged based on the performed uncertainty analysis.
Three distinct RON 100+ fuels underwent testing using the MAMPO20T method, and the findings are juxtaposed with their corresponding ASTM RON values in Table 7. The ASTM RON values were obtained from the SI Fuel database by Vom Lehn et al. [23].

Table 7.
Differences between ASTM and MAMPO20 RON for RON 100+ fuels.
The chart in Figure 8 gives a complete overview of the RON classification of all fuels used in the test and shows the same distinct linear relationship between compression ratio and octane number for PRFs and TSFs alike. Interestingly, ethanol is associated with higher MAMPO20T RON values when compared to its respective ASTM RON, while the inverse is true for methanol and toluene.
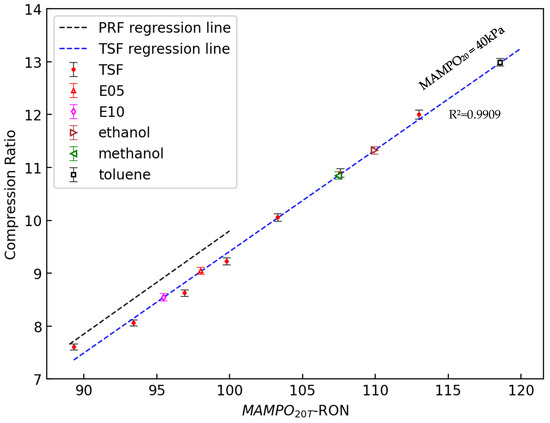
Figure 8.
Compression ratio as a function of TSF octane number for MAMPO20T of 40 kPa.
In order to explain this difference, the AMPO20 distributions of different TSFs were compared to ethanol, methanol, and toluene in the box-whisker diagram of Figure 9. Each circular marker shows the average of the 20 highest oscillation pressure peaks per combustion cycle. A total of 500 successive combustion cycles were plotted for every fuel. The mean AMPO20 value for every fuel (MAMPO20) was 40 kPa ± 5 kPa and is represented by the horizontal line in the graph, indicating that all fuels knock with comparable knock intensity. For every fuel, the needed compression ratio to obtain a MAMPO20 of 40 kPa is listed on the x-axis.
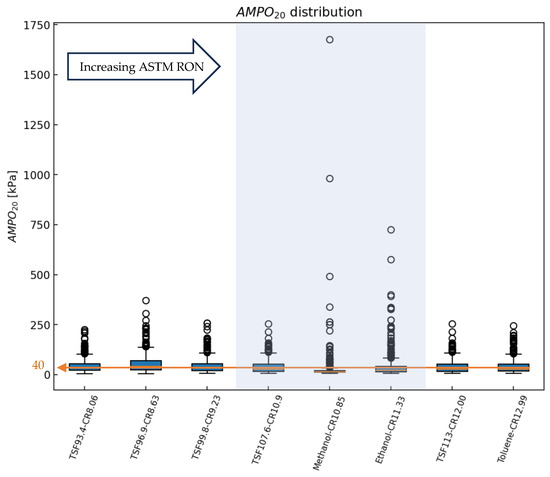
Figure 9.
AMPO20 distribution of different fuels in ascending RON order, 500 combustion cycles per fuel, knocking with MAMPO20 around 40 kPa.
Across all TSF fuels, it is evident that the oscillation behaviour remains consistent up to the TSF with RON 113. However, the divergence in oscillation behaviour between methanol, ethanol, and the TSFs is significant. In the shaded area on Figure 9, the oscillation behaviours of TSF 107.6, methanol, and ethanol are compared. Although they feature a comparable ASTM RON, methanol demonstrates oscillation events that are one order of magnitude higher than the primary oscillations. Ethanol exhibits comparable but notably lower oscillation intensities. Consequently, ethanol demonstrates a higher MAMPO20T RON compared to methanol, despite having an almost identical ASTM RON. The intense oscillation properties of methanol and ethanol could be subscribed to the respective high laminar flame speed velocities of both alcohols. Since ethanol features lower laminar flame speeds than methanol [24], one can conclude that flame speed and oscillation intensity are likely connected. This seems to be confirmed by the oscillation behaviour of toluene, shown on the right side of the graph. In comparison, toluene and TSFs in general show lower laminar flame speeds than ethanol and methanol [25,26], and it is observed that toluene exhibits much milder pressure oscillations, similar to all TSFs used in the test. Consequently, high laminar flame speeds may well be a possible cause of the extreme outliers in the case of methanol and ethanol. Other factors influencing the oscillation behaviour may be found in deviations in end-gas autoignition characteristics as was found in the study by Han et al. [26].
The utilization of TSFs as reference fuels ensures that the MAMPO20T scale does not disrupt the RON scale for current gasoline formulations. However, it does introduce discrepancies in the RON scale for experimental fuels exceeding RON 100. In such cases, fuels like ethanol and methanol, despite sharing the same ASTM RON, are classified differently. This disparity underscores the inadequacy of the ASTM RON test in capturing the behaviour of fuels during knock and confirms the possible added value of the MAMPO20T method as a “real life” octane classification method.
4. Discussion
The MAMPO20 method exhibits a strong correlation between the ASTM RON scale and oscillation behaviour during knock and shows a significant improvement to the historically weak correlations between AMPO and RON in the literature for PRFs and TSFs alike.
Due to the difference in oscillation behaviour of both reference fuel types, an offset exists between the regression lines of PRFs and TSFs. Since TSFs better represent the behaviour of real-world gasolines, they can be used as reference fuels to estimate RON numbers within acceptable error limits of ±0.7 ON. While the experimental uncertainty remains consistent with comparable measurement setups, conducting additional measurements, particularly with different fuels, is necessary to confirm repeatability.
In contrast to assertions in the literature [27], utilizing a pressure oscillation system such as MAMPO20T does not inherently disturb the RON scale, although discrepancies in RON may emerge with fuels exceeding RON 100.
The MAMPO20T RON method, in contrast to the ASTM method, is able to distinguish the difference in oscillation behaviour between PRFs and TSFs that share the same ASTM RON. As a result, the approach links PRF reference fuels (illustrated by the dashed PRF regression line in Figure 9) with a MAMPO20T RON number higher than their corresponding ASTM RON. This is due to the requirement of higher compression ratios for PRFs compared to RON-equivalent TSFs to achieve the MAMPO20 knock intensity of 40 kPa.
The divergence in classifying PRFs on the MAMPO20T RON scale can likely be attributed to differences in lower flame speeds of PRFs, which necessitate higher compression ratios to obtain equal knock intensities compared to oxygenated fuels. The absence of this distinction in the ASTM method underscores the credibility of the MAMPO20T method as a more accurate octane quantification system reflecting real-world conditions. Fuels with molecular structures similar to those of primary reference fuels would exhibit smaller deviations from ASTM RON when the PRF-based MAMPO RON method is used.
The MAMPO20T method seems viable for assessing fuels surpassing RON 100 without complications. Notably, this method discerns between ethanol and methanol, showcasing a MAMPO20T RON difference of 2.4, whereas the ASTM RON method indicates only a 0.1 RON difference.
This underscores how the MAMPO20T method can distinguish between two fuels with nearly identical ASTM RON values based on variations in oscillation behaviour. The inadequacy of the ASTM RON test to capture the behaviour of fuels during knock confirms the possible added value of the MAMPO20T method as a “real life” octane classification method for fuels below and above RON 100.
One limitation of the MAMPO20T method arises from its inability to measure knock intensity in real time through post-processing, rendering it impractical for real-time applications. Due to its reliance on an averaging algorithm, the method loses detailed cylinder pressure information upon application.
The systematic factors influencing high-frequency oscillation behaviour, while showing a connection to laminar flame speed, remain incompletely understood to date. Further investigation is necessary to gain deeper insights into this behaviour.
The existing approach utilizes a CFR engine where the compression ratio serves as the adjustable parameter for evaluation. Given that the MAMPO method can be implemented whenever cylinder chamber pressure can be monitored, future investigations could utilize a commercial engine with a fixed compression ratio. Other parameters such as ignition timing, boost pressure, or intake temperature could be manipulated instead, on the condition that the results are sufficiently reproducible.
Implementing a version of the MAMPO method in a production engine would enable a more direct assessment of a fuel’s octane behaviour within that specific engine. It would also allow a direct approach for an assessment of the engine’s octane requirement (OR) [28] since the method enables a direct measurement of knock intensity, independent of the antiknock strategy of the engine’s ECU that relies on measurements of the knock sensor instead. It would also provide a solution to the contention that operating conditions deviate from real-world scenarios. In future research, the connection between MAMPO20 knock intensity and knock sensor output will be explored and potential correlations will be assessed. This investigation could facilitate the quantification of knock intensity using a knock sensor, potentially replacing the need for pressure transducers entirely.
Author Contributions
Conceptualization, investigation, methodology, validation, writing—original draft preparation, T.R.; visualisation, V.S.; writing—review and editing, T.L. and S.V.; supervision, S.V. All authors have read and agreed to the published version of the manuscript.
Funding
This research was funded by the Belgian Energy Transition fund—Ad-Libio.
Data Availability Statement
Data will be made available upon request. The data are not publicly available due to technical limitations.
Conflicts of Interest
The authors declare no conflicts of interest. The funders had no role in the design of the study; in the collection, analyses, or interpretation of data; in the writing of the manuscript; or in the decision to publish the results.
Abbreviations
| AE | absolute error |
| AMPO | average maximum pressure oscillation |
| AMPO20 | average maximum pressure oscillation using 20 highest pressure peaks |
| AMPOX | average maximum pressure oscillation using X highest pressure peaks |
| ARV | accepted reference value |
| BTDC | before top dead centre |
| CA | crank angle |
| CFR | cooperative fuel research |
| CR | compression ratio |
| E05 | RON 98 gasoline |
| E10 | RON 95 gasoline |
| ECU | engine control unit |
| HOV | heat of vaporization |
| IT | ignition timing |
| KI | knock intensity |
| KLSA | knock limited spark advance |
| MAMPO | mean average maximum pressure oscillation |
| MAMPO20 | mean average maximum pressure oscillation using 20 pressure peaks |
| MAMPO20T | mean average maximum pressure oscillation using 20 pressure peaks and toluene standardization fuels |
| MAMPOX | mean average maximum pressure oscillation using X pressure peaks |
| MAPO | maximum amplitude of pressure oscillation |
| MBT | maximum brake torque |
| MON | motor octane number |
| NTC | negative temperature coefficient |
| OI | octane index |
| ON | octane number |
| OR | octane requirement |
| PRF | primary reference fuel |
| RON | research octane number |
| SI | spark ignition |
| TDC | top dead centre |
| TSF | toluene standardization fuel |
References
- Bonnici, D. How Many Cars Are There in the World? October 2022. Available online: https://www.whichcar.com.au/news/how-many-cars-are-there-in-the-world (accessed on 15 January 2024).
- Viljoen, C.L.; Yates, A.D.; Coetzer, R.L. A Molecular Modelling Investigation of Selected Gasoline Molecules to Relate Oxidation Pathways to Their Autoignition Behaviour; SAE Technical Paper; SAE International: Warrendale, PA, USA, 2007. [Google Scholar]
- Leppard, W.R. The Chemical Origin of Fuel Octane Sensitivity; SAE International: Warrendale, PA, USA, 1990; pp. 862–876. [Google Scholar]
- Mittal, V.; Heywood, J.B.; Green, W.H. The Underlying Physics and Chemistry behind Fuel Sensitivity. SAE Int. J. Fuels Lubr. 2010, 3, 256–265. [Google Scholar] [CrossRef]
- ASTM D2699-15a; Standard Test Method for Research Octane Number of Spark-Ignition Engine Fuel. ASTM International: West Conshohocken, PA, USA, 2015. Available online: https://www.astm.org/d2699-15a.html (accessed on 10 January 2024).
- ASTM D2700-23; Standard Test Method for Motor Octane Number of Spark-Ignition Engine Fuel. ASTM International: West Conshohocken, PA, USA, 2023. Available online: https://www.astm.org/d2700-23.html (accessed on 10 January 2024).
- Huber, K.; Hauber, J.; Raba, A.; Nell, R. New Test Procedure to Determine Fuel’s Knock Resistance. MTZ Worldw. 2013, 74, 62–69. [Google Scholar] [CrossRef]
- Arrigoni, V.; Cornetti, G.; Spallanzani, G.; Calvi, F.; Tontodonati, A. High Speed Knock in SI Engines; SAE Technical Paper; SAE International: Warrendale, PA, USA, 1974. [Google Scholar]
- Yates, A.D.; Swarts, A.; Viljoen, C.L. Correlating Auto-Ignition Delays and Knock-Limited Spark-Advance Data for Different Types of Fuel; SAE International: Warrendale, PA, USA, 2005; pp. 735–747. [Google Scholar]
- Swarts, A.; Yates, A.; Viljoen, C.; Coetzer, R. A Further Study of Inconsistencies between Autoignition and Knock Intensity in the CFR Octane Rating Engine; SAE International: Warrendale, PA, USA, 2005; pp. 702–720. [Google Scholar]
- Robeyn, T.; Verhelst, S.; Vinke, I. Investigation of Naphtha-Type Biofuel from a Novel Refinery Process; SAE Technical Paper 2022-01-0752; SAE International: Warrendale, PA, USA, 2022. [Google Scholar]
- Robeyn, T.; Larsson, T.; Demeersseman, J.; Van Biesen, J.; Verhelst, S. Development of a Novel Drop-in Naphthenic Spark Ignition Biofuel by Means of a Fuel Blend Calculator and a Simplified Octane Number Verification Method; SAE Technical Paper 2023-01-0317; SAE International: Warrendale, PA, USA, 2023. [Google Scholar]
- Shahlari, A.J.; Ghandhi, J.B. A Comparison of Engine Knock Metrics; SAE Technical Paper; SAE International: Warrendale, PA, USA, 2012. [Google Scholar]
- Brunt, M.F.; Pond, C.; Biundo, J. Gasoline Engine Knock Analysis Using Cylinder Pressure Data; SAE International: Warrendale, PA, USA, 1998; pp. 1399–1412. [Google Scholar]
- Rockstroh, T.; Kolodziej, C.; Jespersen, M.; Goldsborough, S.; Wallner, T. Insights into Engine Knock. SAE Int. J. Fuels Lubr. 2018, 11, 545–562. [Google Scholar] [CrossRef]
- Robeyn, T.; Larsson, T.; Verhelst, S. Alternative RON estimation method by using pressure oscillation analysis, serving novel spark ignition fuel development. Fuel 2024, 364, 131086. [Google Scholar] [CrossRef]
- Badra, J.A.; Bokhumseen, N.; Mulla, N.; Sarathy, S.M.; Farooq, A.; Kalghatgi, G.; Gaillard, P. A methodology to relate octane numbers of binary and ternary n-heptane, iso-octane and toluene mixtures with simulated ignition delay times. Fuel 2015, 160, 458–469. [Google Scholar] [CrossRef]
- Han, D.; Lyu, D.; Sun, Z.; Liang, X.; Huang, Z. On knocking combustion development of oxygenated gasoline fuels in a cooperative fuel research engine. Int. J. Engine Res. 2023, 24, 2410–2421. [Google Scholar] [CrossRef]
- Kim, D.; Westbrook, C.K.; Violi, A. Two-stage ignition behavior and octane sensitivity of toluene reference fuels as gasoline surrogate. Combust. Flame 2019, 210, 100–113. [Google Scholar] [CrossRef]
- Hoth, A.; Manchiraju, R.; Andretti, C.; Sinur, R.; Kolodziej, C.P. Towards Developing an Unleaded High Octane Test Procedure (RON>100) Using Toluene Standardization Fuels (TSF). SAE Int. J. Adv. Curr. Prac. Mobil. 2020, 3, 197–207. [Google Scholar] [CrossRef]
- Kalghatgi, G.; Head, R.; Chang, J.; Viollet, Y.; Babiker, H.; Amer, A. An Alternative Method Based on Toluene/n-Heptane Surrogate Fuels for Rating the Anti-Knock Quality of Practical Gasolines. SAE Int. J. Fuels Lubr. 2014, 7, 663–672. [Google Scholar] [CrossRef]
- Singh, E.; Badra, J.; Mehl, M.; Sarathy, S.M. Chemical Kinetic Insights into the Octane Number and Octane Sensitivity of Gasoline Surrogate Mixtures. Energy Fuels 2017, 31, 1945–1960. [Google Scholar] [CrossRef]
- Lehn, F.V.; Cai, L.; Tripathi, R.; Broda, R.; Pitsch, H. A property database of fuel compounds with emphasis on spark-ignition engine applications. Appl. Energy Combust. Sci. 2021, 5, 100018. [Google Scholar]
- Sileghem, L.; Alekseev, V.; Vancoillie, J.; Nilsson, E.; Verhelst, S.; Konnov, A. Laminar burning velocities of primary reference fuels and simple alcohols. Fuel 2014, 115, 32–40. [Google Scholar] [CrossRef]
- Sileghem, L.; Alekseev, V.; Vancoillie, J.; Van Geem, K.; Nilsson, E.; Verhelst, S.; Konnov, A. Laminar burning velocity of gasoline and the gasoline surrogate components iso-octane, n-heptane and toluene. Fuel 2013, 112, 355–365. [Google Scholar] [CrossRef]
- Han, D.; Deng, S.; Liang, W.; Zhao, P.; Wu, F.; Huang, Z.; Law, C.K. Laminar flame propagation and nonpremixed stagnation ignition of toluene and xylenes. Proc. Combust. Inst. 2017, 36, 479–489. [Google Scholar] [CrossRef]
- Kalghatgi, G.T. Fuel Anti-Knock Quality-Part I. Engine Studies; SAE International: Warrendale, PA, USA, 2001; pp. 1993–2004. [Google Scholar]
- Kalghatgi, G.T. Fuel Anti-Knock Quality-Part II. Vehicle Studies-How Relevant Is Motor Octane Number (MON) in Modern Engines? SAE International: Warrendale, PA, USA, 2001; pp. 2005–2015. [Google Scholar]
Disclaimer/Publisher’s Note: The statements, opinions and data contained in all publications are solely those of the individual author(s) and contributor(s) and not of MDPI and/or the editor(s). MDPI and/or the editor(s) disclaim responsibility for any injury to people or property resulting from any ideas, methods, instructions or products referred to in the content. |
© 2024 by the authors. Licensee MDPI, Basel, Switzerland. This article is an open access article distributed under the terms and conditions of the Creative Commons Attribution (CC BY) license (https://creativecommons.org/licenses/by/4.0/).