Article

Initial Occurrence State and Movability Evaluation of the Gulong Shale Oil Reservoir, Songliao Basin

1
Exploration and Development Research Institute of Daqing Oilfield Company Ltd., Daqing 163712, China
2
Heilongjiang Provincial Key Laboratory of Reservoir Physics & Fluid Mechanics in Porous Medium, Daqing 163712, China
3
School of Petroleum Engineering, China University of Petroleum (Beijing), Beijing 102249, China
*
Author to whom correspondence should be addressed.
Energies 2024, 17(6), 1358; https://doi.org/10.3390/en17061358
Submission received: 9 August 2023 / Revised: 14 January 2024 / Accepted: 16 January 2024 / Published: 12 March 2024
(This article belongs to the Special Issue Unconventional Oil and Gas Well Monitoring and Development)

Abstract

:
The Qing-1 layer of the Gulong Depression in the northern Songliao Basin is a liquid-rich shale oil reservoir that has the characteristics of nanopores, high maturity, high gas/oil ratio (GOR), etc. The production performance of wells in the Gulong shale oil reservoir shows the characteristics of “single gas production followed by oil-gas production”. It is difficult to analyze the initial occurrence state and movability of fluid in the shale nanopores using conventional methods. In this study, a comprehensive method, including phase behavior analysis, physical experiments, and molecular simulation, was established to analyze the initial occurrence state and movability of fluid in the Gulong shale oil reservoir. The phase state of the fluid was calculated by the equation of state (EOS), considering nano-confinement effects, and the initial occurrence state was quantitatively evaluated by combining two-dimensional nuclear magnetic resonance (NMR) and molecular dynamics simulation. The movable fluid saturation was quantitatively determined by centrifugal experiments. The results show that the condensate gas state was in small pores, while the volatile oil state was in large pores. The occurrence states of oil were mainly adsorbed oil and free oil. The proportion of adsorbed oil in inorganic pores was about 24.4%, while the proportion of absorbed oil in organic pores was about 57.8%. Based on the cutoff value of T2 before and after the centrifuged laboratory experiments, the movable limit of oil was determined to be 4.5 nm, and the movable fluid saturation was about 11%. The research method proposed in this study has important guiding significance for the initial occurrence state and movability evaluation of similar liquid-rich shale reservoirs.

1. Introduction

The initial occurrence state and movability of fluid, which are closely related to the interaction between the fluid composition and pore throat characteristics, directly determine the development method of a shale oil reservoir [1,2,3,4]. However, the pore throat of a shale oil reservoir is mainly nanometer scale. The phase state, physical properties, and flow characteristics of the fluid in the nano space are obviously different from those in the bulk space, which is called nano-confinement effects [5,6,7,8]. Therefore, it is challenging to determine the initial occurrence state and movability of fluid in shale nanopores.
In recent years, some scholars have studied the initial occurrence state and movability of fluids through laboratory experiments, empirical methods, etc. Generally speaking, shale oil reservoirs have four initial occurrence states: the free state, adsorption state, swelling state, and dissolution state [9,10,11,12]. During an experiment, O’Brien et al. [13] observed that there were two types of occurrence states of liquid oil: one is spherical oil droplets presented in microfractures, and the other is a coated oil layer present in the microfracture wall. Zhang and Ke [14,15] suggest that there are three kinds of shale oil occurrence states in the reservoir of the Biyang Depression, which are the free state, adsorption state, and dissolution state. Through further research on the location of different occurrence states, it has been found that free oil is presented as oil droplets in nanopores, such as matrix pores, structural fractures, and microfractures of clay, feldspar, dolomite, and other minerals. For adsorbed shale oil, it is mainly presented as an oil film on the surface of clay particles and kerogen. Moreover, an energy spectrum analysis of shale oil in the Biyang Depression by electron microscopy was carried out to verify the above conclusions. Ning et al. [16] believed that the main occurrence states are the free state and the adsorption state. In a study of shale oil movability, Jarvie’s research showed that the lower limit of shale oil is about 100 mg/g, which can be characterized by the ratio of pyrolysis parameter S1 to TOC (total organic carbon). The favorable layers of a shale oil reservoir are also divided by oil/TOC [17]. Sun et al. [18] carried out nuclear magnetic resonance combined with centrifugal experiments on 12 high-maturity shale cores to study the distribution characteristics of movable fluid in the cores. Zhou et al. [19] conducted centrifugal experiments on 12 marine Longmaxi shale cores in Southern China and analyzed the minimum pore throat size of movable fluid distribution. Li et al. proposed a conceptual model for calculating the shale adsorption potential (Sp) in the Dongying Depression [20]. This model divides the rock into five types: clay minerals, quartz, carbonate minerals, pyrite, and organic matter. Cao et al. studied the conceptual model of shale adsorption potential (Sp) calculation for the Qing-1 layer in the Songliao Basin [21]. Fei et al. [22] carried out porosity and permeability tests on Gulong shale cores and analyzed the fluid occurrence space characteristics and imbibition oil recovery based on nuclear magnetic resonance (NMR). Chao et al. [23] conducted a high-speed centrifugation experiment based on NMR and mercury injection experiments to describe the movability of oil and water in shale and developed a mathematical model to analyze the effect of nanopores and the direction of the capillary on the movability of oil and water. Xin et al. [24] used nuclear magnetic resonance (NMR) technology to classify the T2 spectra of different shale reservoirs, analyzed the correlation between the T2 cutoff values and the main peaks of the T2 spectra of the shale reservoirs, and established a rapid identification and evaluation method for different fluid signals of the reservoirs. Artificial intelligence (AI) techniques assist with enhanced oil recovery processes; moreover, the NMR technique provides a new method of EOR for shale oil reservoirs [25,26,27]. In general, there have been many studies on the occurrence state and movability of shale oil, but the pore throat is not subdivided into organic pores and inorganic pores in these research processes, and there is less evaluation of the fluid state and movability in shale nanopores.
In this study, the Gulong liquid-rich shale reservoir located in the Songliao Basin, China, was selected as the research object. The initial occurrence state and mobility of fluid in the shale nanopores were determined by phase calculation, molecular simulation, and nuclear magnetic resonance. Moreover, a multi-component fluid model was established in the molecular dynamics simulation, which is the innovation of this study. The research results and methods have important guiding significance for the initial occurrence state and movability evaluation of similar shale oil reservoirs.

2. Methodology

Due to the impacts of nano-confinement effects in different shale nanopores, the capillary pressure and van der Waals force of fluid molecules in nanopores have changed significantly in the Gulong shale reservoir, which seriously affects the initial occurrence state and movability of fluid [5,8,22]. In this section, a comprehensive research method, including nano-confined phase behavior analysis, NMR (nuclear magnetic resonance), monitoring, and molecular dynamics simulation, is established.

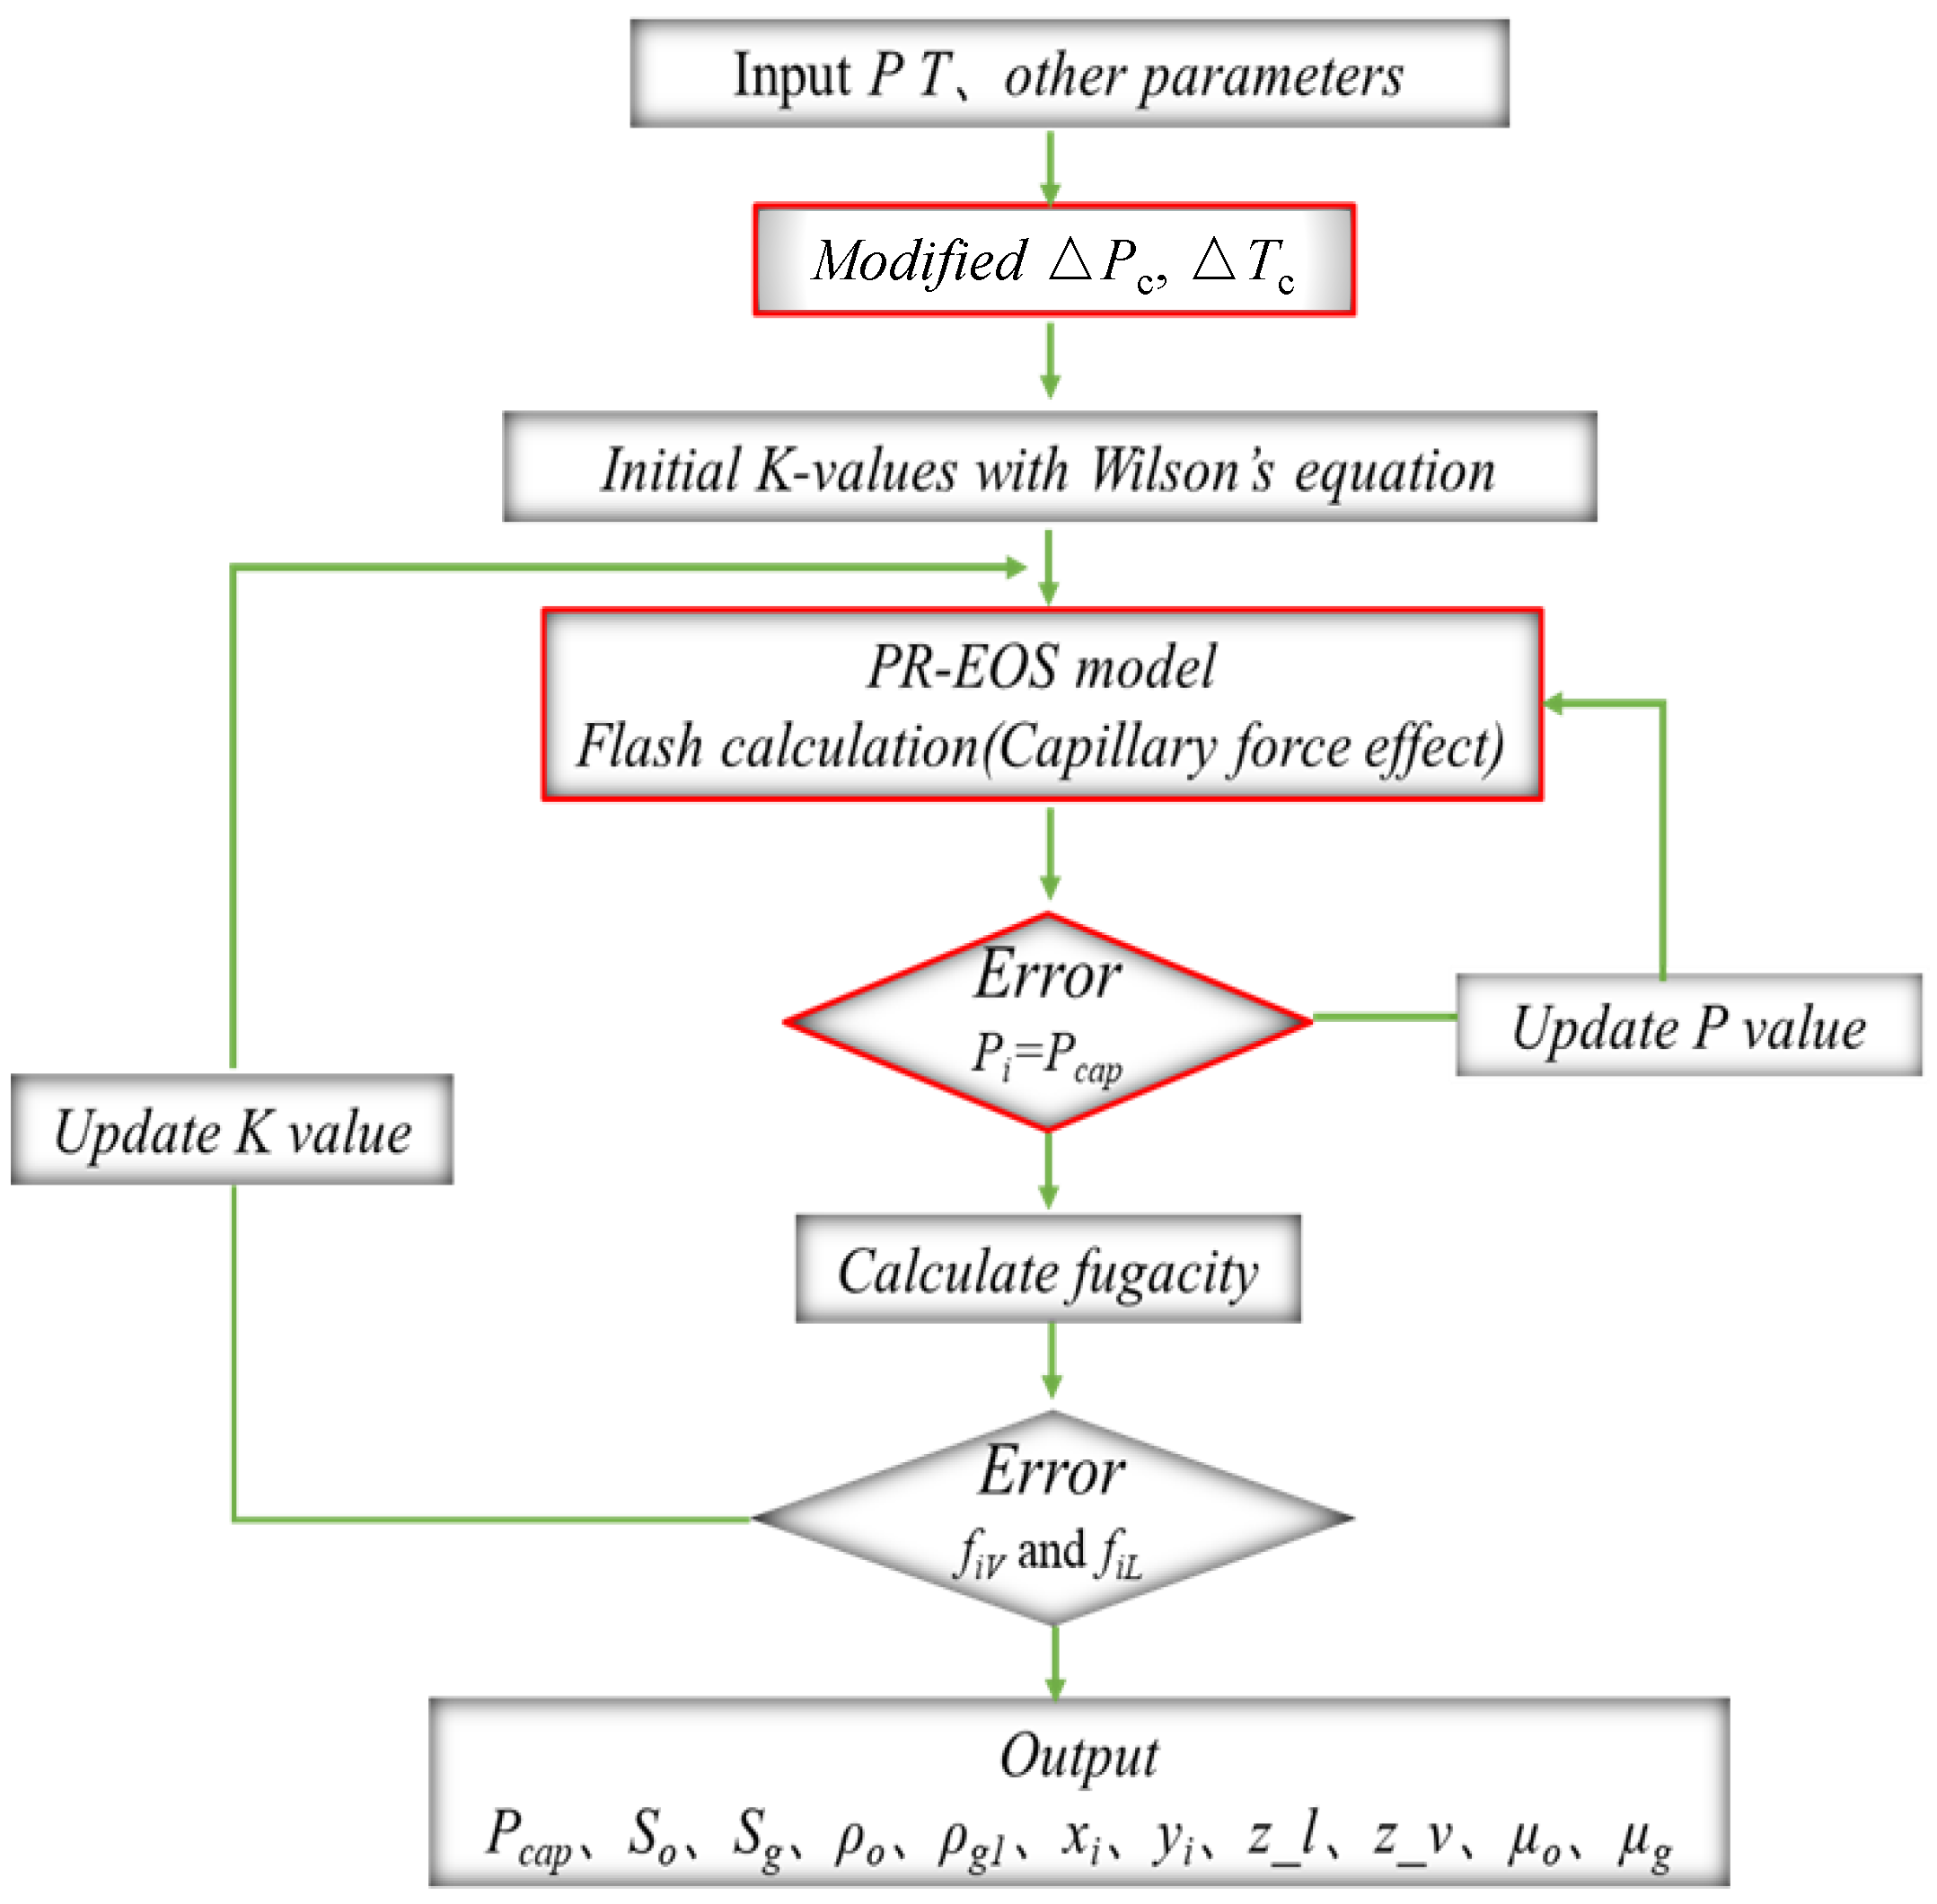
2.1. Nano-Confined Phase State Calculation Method

In this study, the modified Peng–Robinson equation of state (modified PR-EOS) is used for phase state calculation. The expression of PR-EOS is as follows:
p = R T V b m a m ( T ) V V + m 1 b m + b m V + m 2 b m
where V is the molar volume; T is temperature in K; R is the gas constant, 8.314 J/(mol·K); am and bm represent the attractive and repulsive terms of the mixture, respectively. The van der Waals mixing rule is used to calculate
a m T = i = 1 n j = 1 n x i x j a i a j α i α j 0.5 1 k i j
b m = i = 1 n x i b i
The coefficients of the modified PR-EOS are calculated by the following formula:
a = 0.457235529 R 2 T c 2 P c 2 b = 0.077796074 R T c P c m 1 = 1 + 2 m 2 = 1 2
α = 1 + 0.37464 + 1.54266 ω i 0.26992 ω i 2 1 T r i 0.5 2 ω i 0.49 1 + 0.379642 + 1.48503 ω i 0.164423 ω i 2 + 0.016666 ω i 3 1 T r i 0.5 2   ω i > 0.49
where ωi is the acentric factor, kij is the binary interaction coefficient, Tr is the reduced temperature; and α is a dimensionless function of reduced temperature and acentric factor. In order to accurately explain the phase behavior of fluid in nano-confined pores, the nano-confinement effects are considered as critical parameters, proposed by Zarragoicoechea and Kuz [28]. The expression is as follows:
Δ P c = P c P c m P c = 0.9409 σ L J / R 0.2415 σ L J / R 2
Δ T c = T c T c m T c = 0.9409 σ L J / R 0.2415 σ L J / R 2
where ΔPc and ΔTc are relative critical temperature and pressure shift, respectively (dimensionless). Pc is the critical pressure in bulk space, atm. Tc is the bulk critical temperature in bulk space, K. Pcm is the critical pressure in nano-confined space, atm. Tcm is the critical temperature in nano-confined space, K. σLJ is the Lennard–Jones size parameter, nm. R is the pore radius, nm. It should be noted that Pcm and Tcm are the modified critical pressure and temperature for the nano-confined space. In Equations (6) and (7), we use these two equations and the σLJ and R to calculate Pcm and Tcm. So, Pcm and Tcm are determined using Equations (6) and (7) and the for the next calculation.
In addition, due to the large matrix pore space in conventional reservoirs, the flash calculation model ignores the effects of vapor–liquid capillary pressure. However, in shale nanopores, vapor–liquid capillary pressure will significantly affect the phase equilibrium. The fugacity balance considering capillary pressure is as follows:
μ L , i P L , x i = μ V , i P V , y i
where μV,i, μL,i are the chemical potentials of component i in the vapor phase and liquid phase, respectively. xi and yi are the concentrations of liquid and vapor components, respectively. PL and PV are liquid and vapor pressure, MPa, respectively. The capillary pressure between the vapor and liquid is calculated by the Young–Laplace formula as follows:
P c a p = P V P L = 2 σ cos θ R
where Pcap is capillary pressure, MPa. σ is interfacial tension, mN/m. θ is the contact angle, °. In this study, the parachor model is used to estimate the vapor–liquid interfacial tension [9]:
σ = i N c ρ L P i x i ρ V P i y i
where ρL and ρV are the molar densities of the liquid and vapor phases, respectively, mol/m3. [P]i is the parachor of component i. When vapor–liquid phases are in equilibrium, the fugacity of gas phase and liquid phase is equal. The liquid–vapor equilibrium calculation is carried out using the successive iteration method, which is shown in Figure 1. Table 1 shows the reconstituted components of crude oil and thermodynamic parameters, which are obtained by experiments.

2.2. Nuclear Magnetic Resonance Experimental Method

In this section, we use the NMR methodology to obtain the pore radius of the core from the Q1 and Q3 subzones of the Qing-1 layer of the Gulong shale oil reservoir. The pore radius is a basic and key parameter for the nano-confined phase state calculation and analysis of the initial occurrence state in nanopores. The nuclear magnetic resonance (NMR) monitoring experiment uses the Macro12-150H-I low-field nuclear magnetic resonance (LF-NMR) instrument (Niumag Analytical Instrument Corporation, Suzhou, China), and the centrifugal test uses CSC-12S super-core high-speed freezing centrifuge (Lu Xiangyi Centrifuge Instrument Co., Ltd., Shanghai, China). The cores of the experiment are the actual core from the Q1 and Q3 subzones of the Qing-1 layer of the Gulong shale oil reservoir. The principle of LF-NMR monitoring is based on the relaxation characteristics of the hydrogen nucleus in the fluid when it is affected by the external magnetic field. The nuclear magnetic resonance signals of different pore sizes are analyzed using the mathematical explanation method. The expression is as follows:
M ( t ) = M 0 e t T 2 = M 0 e 2 n τ T 2
where M(t) is the echo amplitude at time t. 2τ is the echo interval. M0 is the initial echo amplitude. n is the number of echoes. The relaxation time T2 mainly includes the bulk relaxation time, surface relaxation time, and diffusion relaxation time. The expression is as follows:
1 T 2 = 1 T 2 S + 1 T 2 B + 1 T 2 D = ρ 2 S V + 1 T 2 B + D f γ G T E 2 12
where T2S is the surface relaxation time, ms. T2B is the bulk relaxation time, ms. T2D is the diffusion relaxation time, ms. ρ2 is the surface relaxation strength, μm/ms. S/V is the area-volume ratio, 1/μm2. Df is the bulk diffusion coefficient of fluid, μm2/ms. γ is the gyromagnetic ratio, MHz/T. G is the magnetic field gradient, G/μm. TE is the echo interval, ms, where the bulk relaxation time and diffusion relaxation time can be neglected; then, Equation (12) can be simplified as
1 T 2 = 1 T 2 S = ρ 2 S V
The area–volume ratio S/V can be written as a function of the geometric shape factor and the pore radius. Moreover, considering that the geometric shape factor and the surface relaxation strength are constant for a certain porous medium, the conversion relationship between T2 and the pore radius r can be obtained. The expression is as follows:
T 2 = 1 ρ 2 V S = r ρ 2 F S = r C
where r is the pore radius, μm. FS is the geometry shape factor. C is the conversion coefficient, μm/ms. The pore distribution and T2 spectrum obtained by LF-NMR were calculated using the correlation coefficient method, and the conversion coefficient C was obtained. The formula is as follows:
R = i = 1 n x i x ¯ y i y ¯ i = 1 n x i x ¯ 2 i = 1 n y i y ¯ 2
where R is the correlation coefficient. xi is the distribution frequency of the NMR T2 spectrum in the i interval, %. yi is the pore throat distribution frequency under a scanning electron microscope in the i interval, %. x is the average frequency of the NMR T2 spectrum distribution, %. y is the average value of the scanning electron microscope (SEM) distribution frequency, %. The centrifugal experiment and nuclear magnetic monitoring steps are as follows:
(1)
Measure the dry weight of the core by balance and test T2 spectrum of dry rock samples with a nuclear magnetic resonance instrument.
(2)
Saturate the shale core with oil samples, and maintain the saturation process for 15 days. Measure the quality of the shale core after saturation; obtain the NMR T2 spectrum and 2D T1-T2 spectrum of shale rock samples after saturation.
(3)
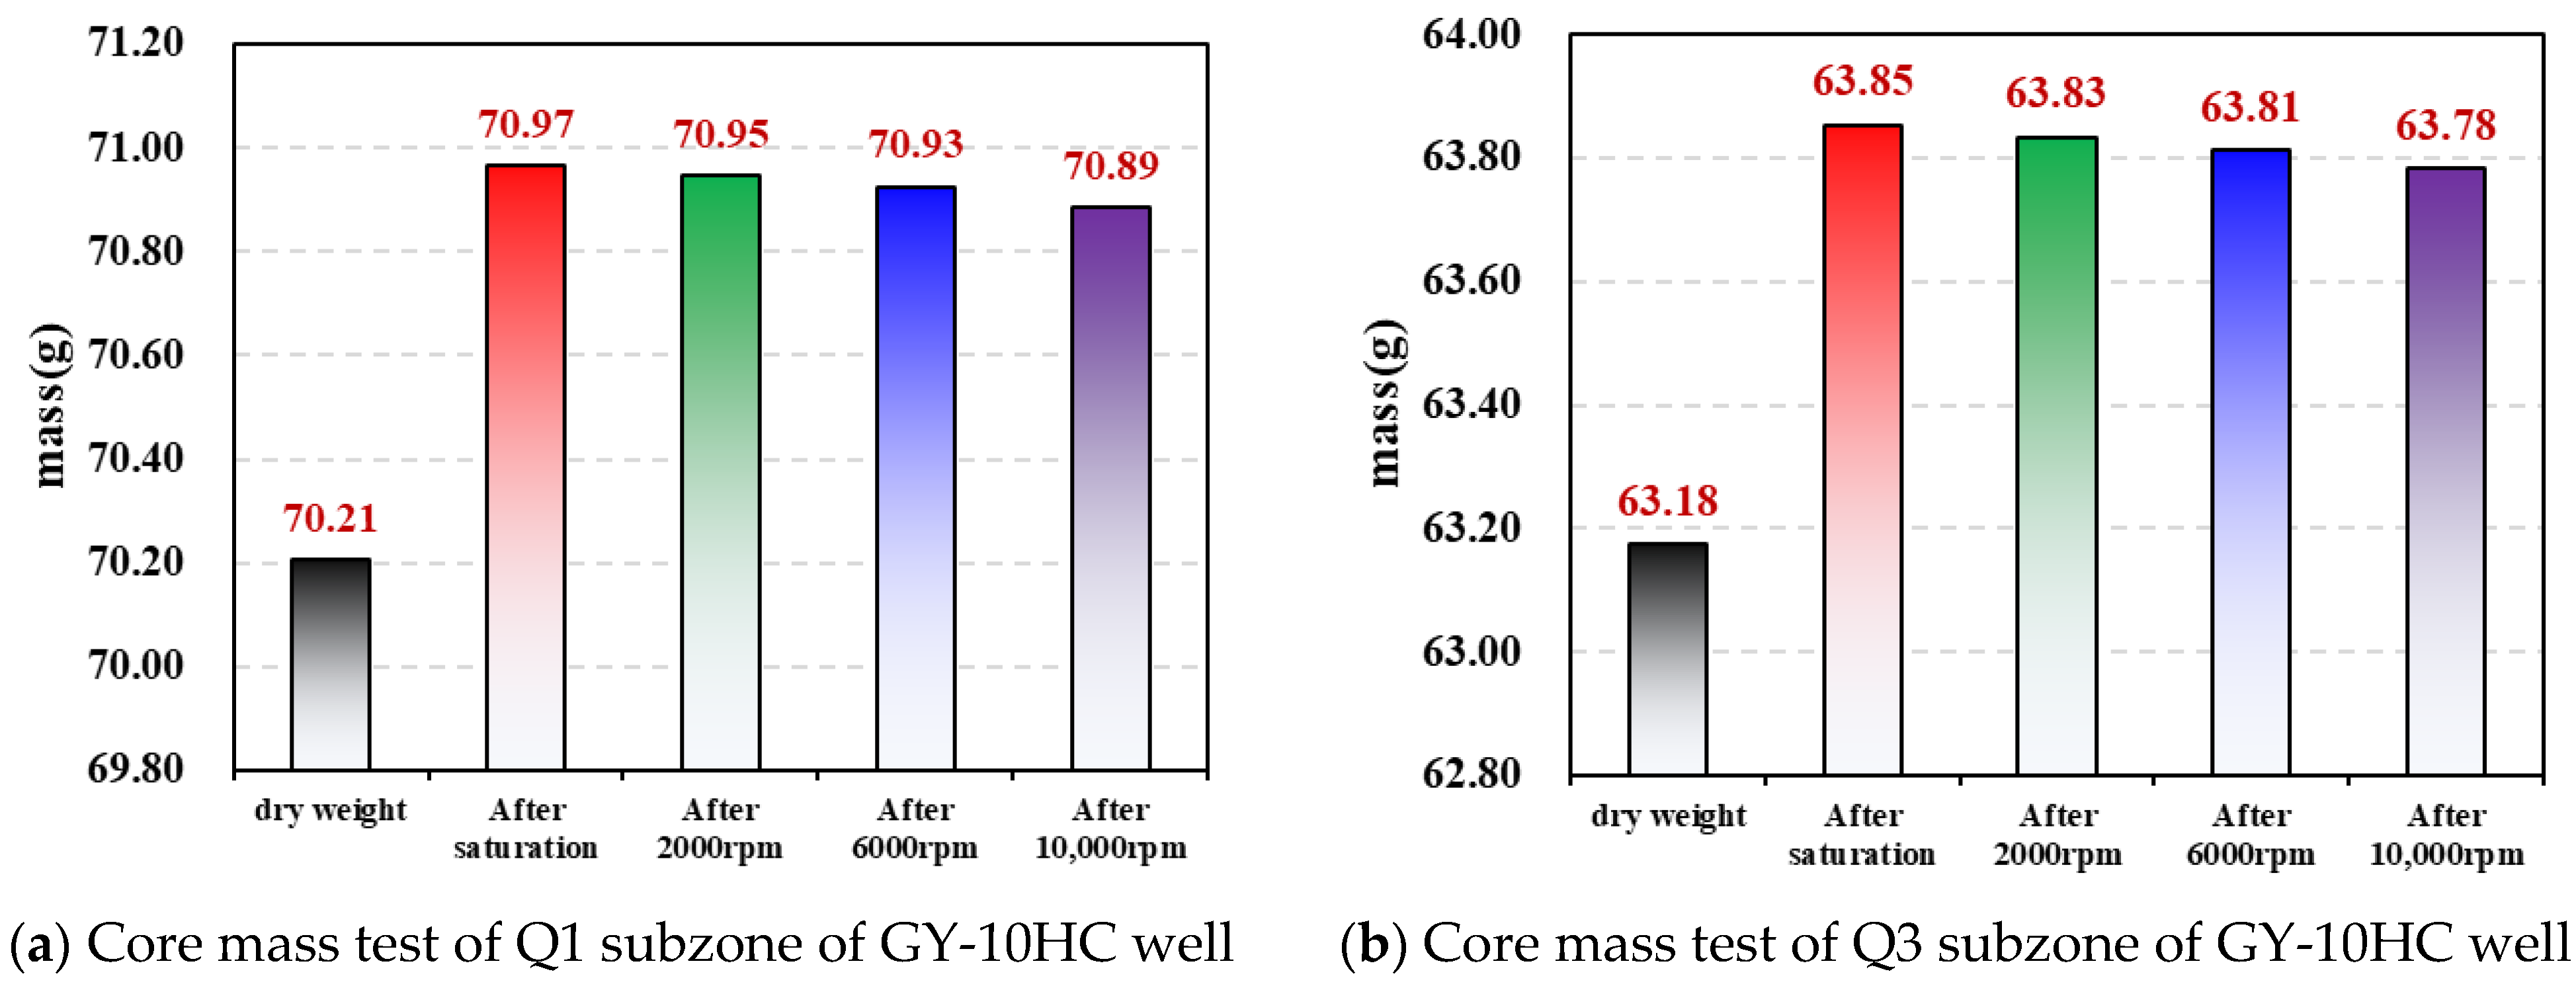
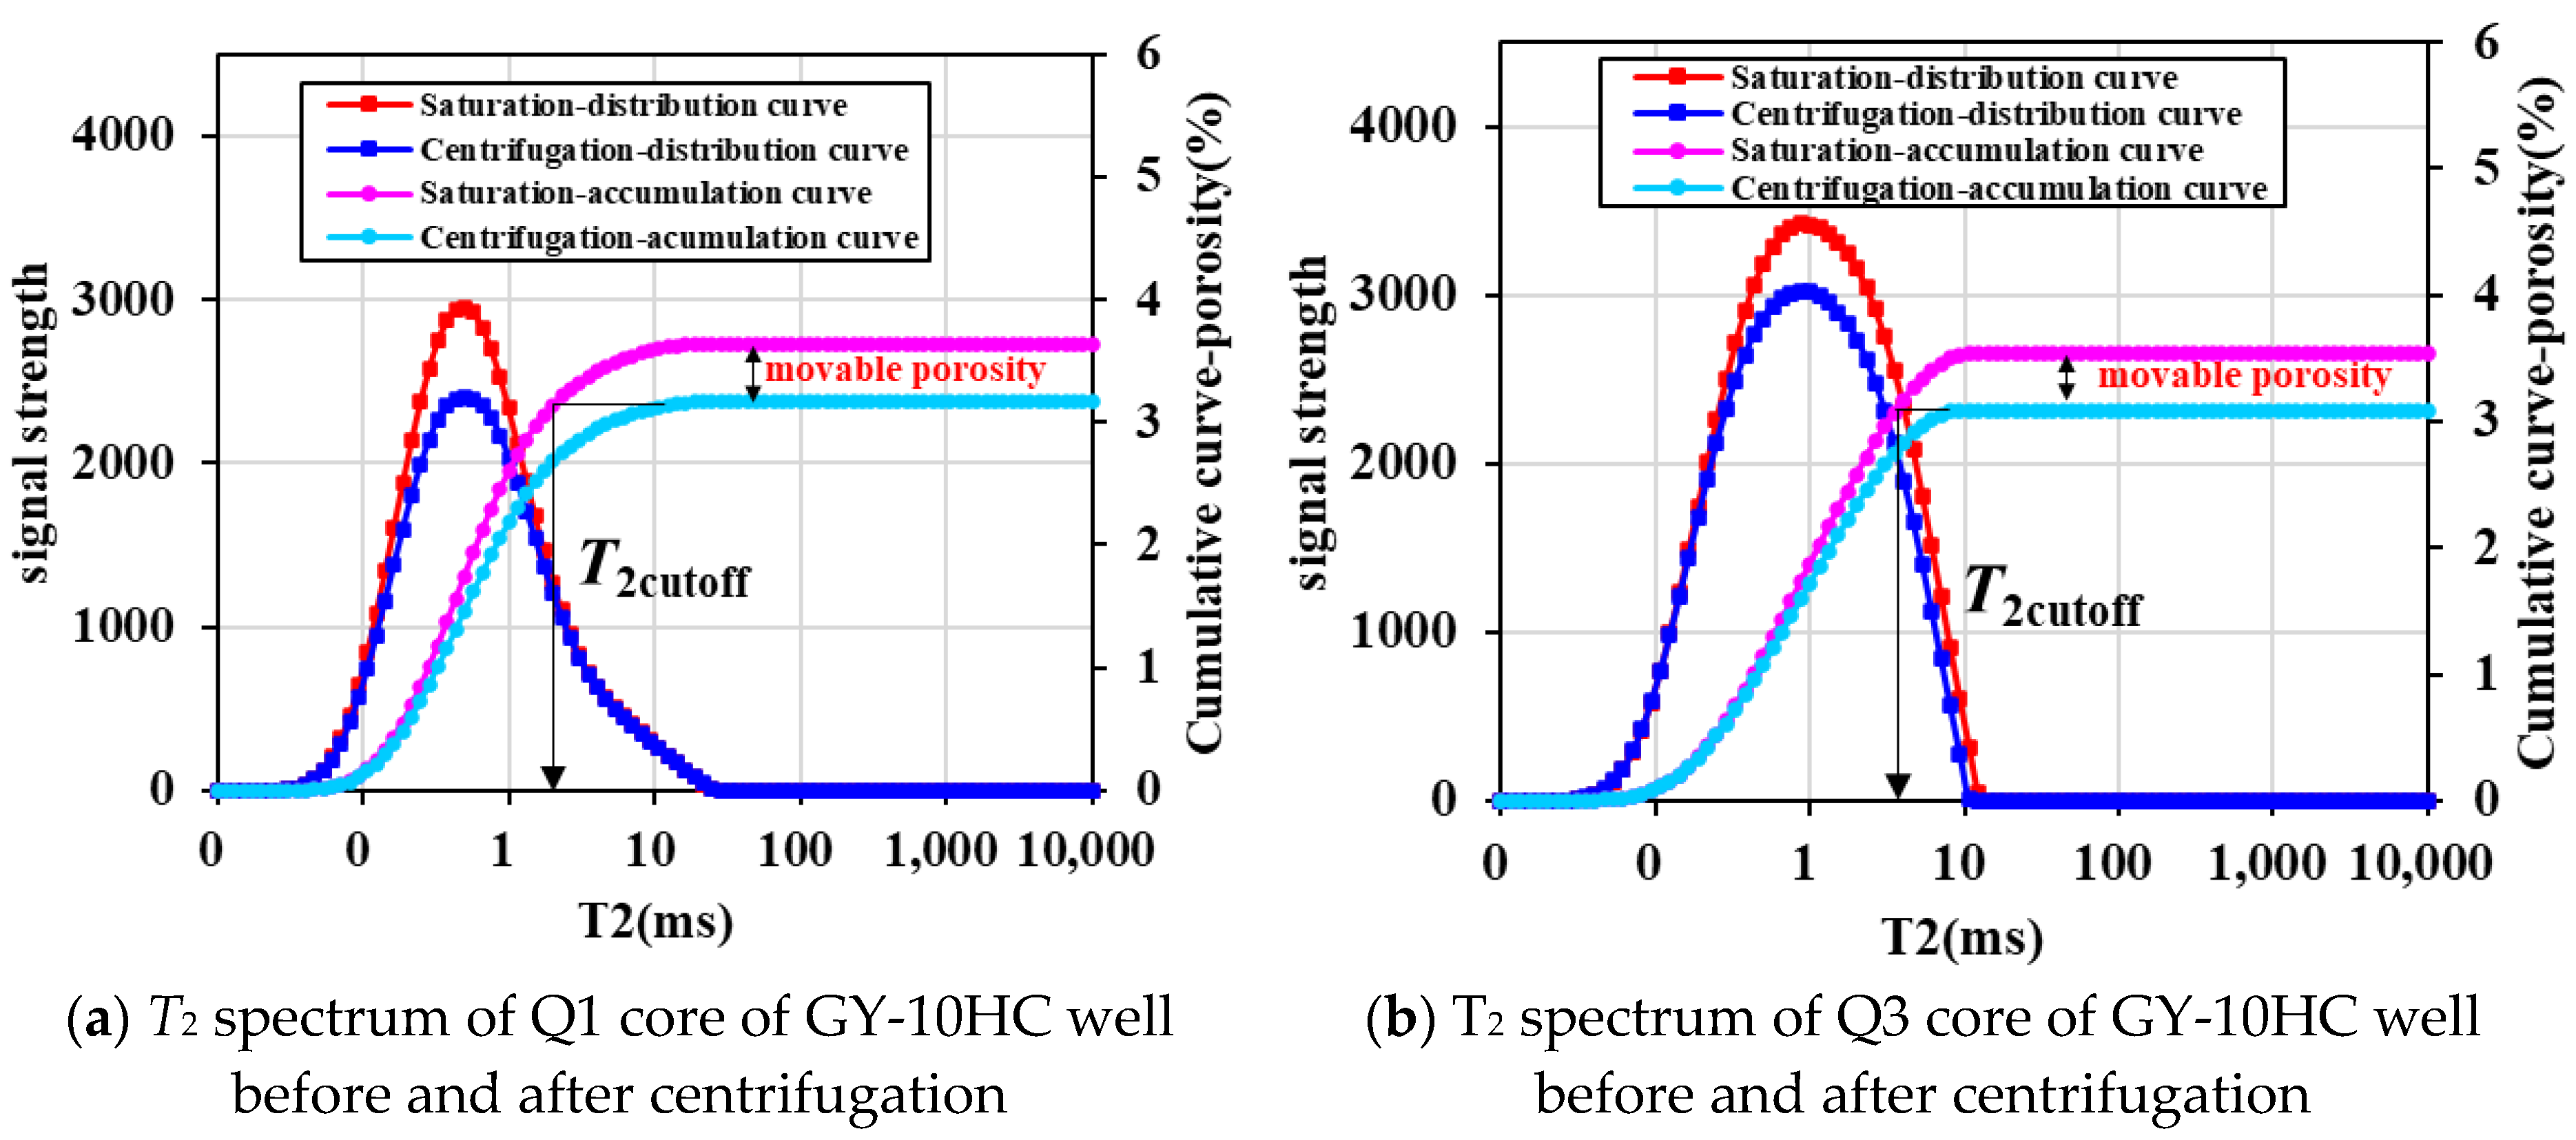
Centrifuge the saturated shale core at 2000 r/min, 6000 r/min, and 10,000 r/min (the maximum speed of the instrument), measure the weight, and obtain the NMR T2 spectrum after centrifugation.

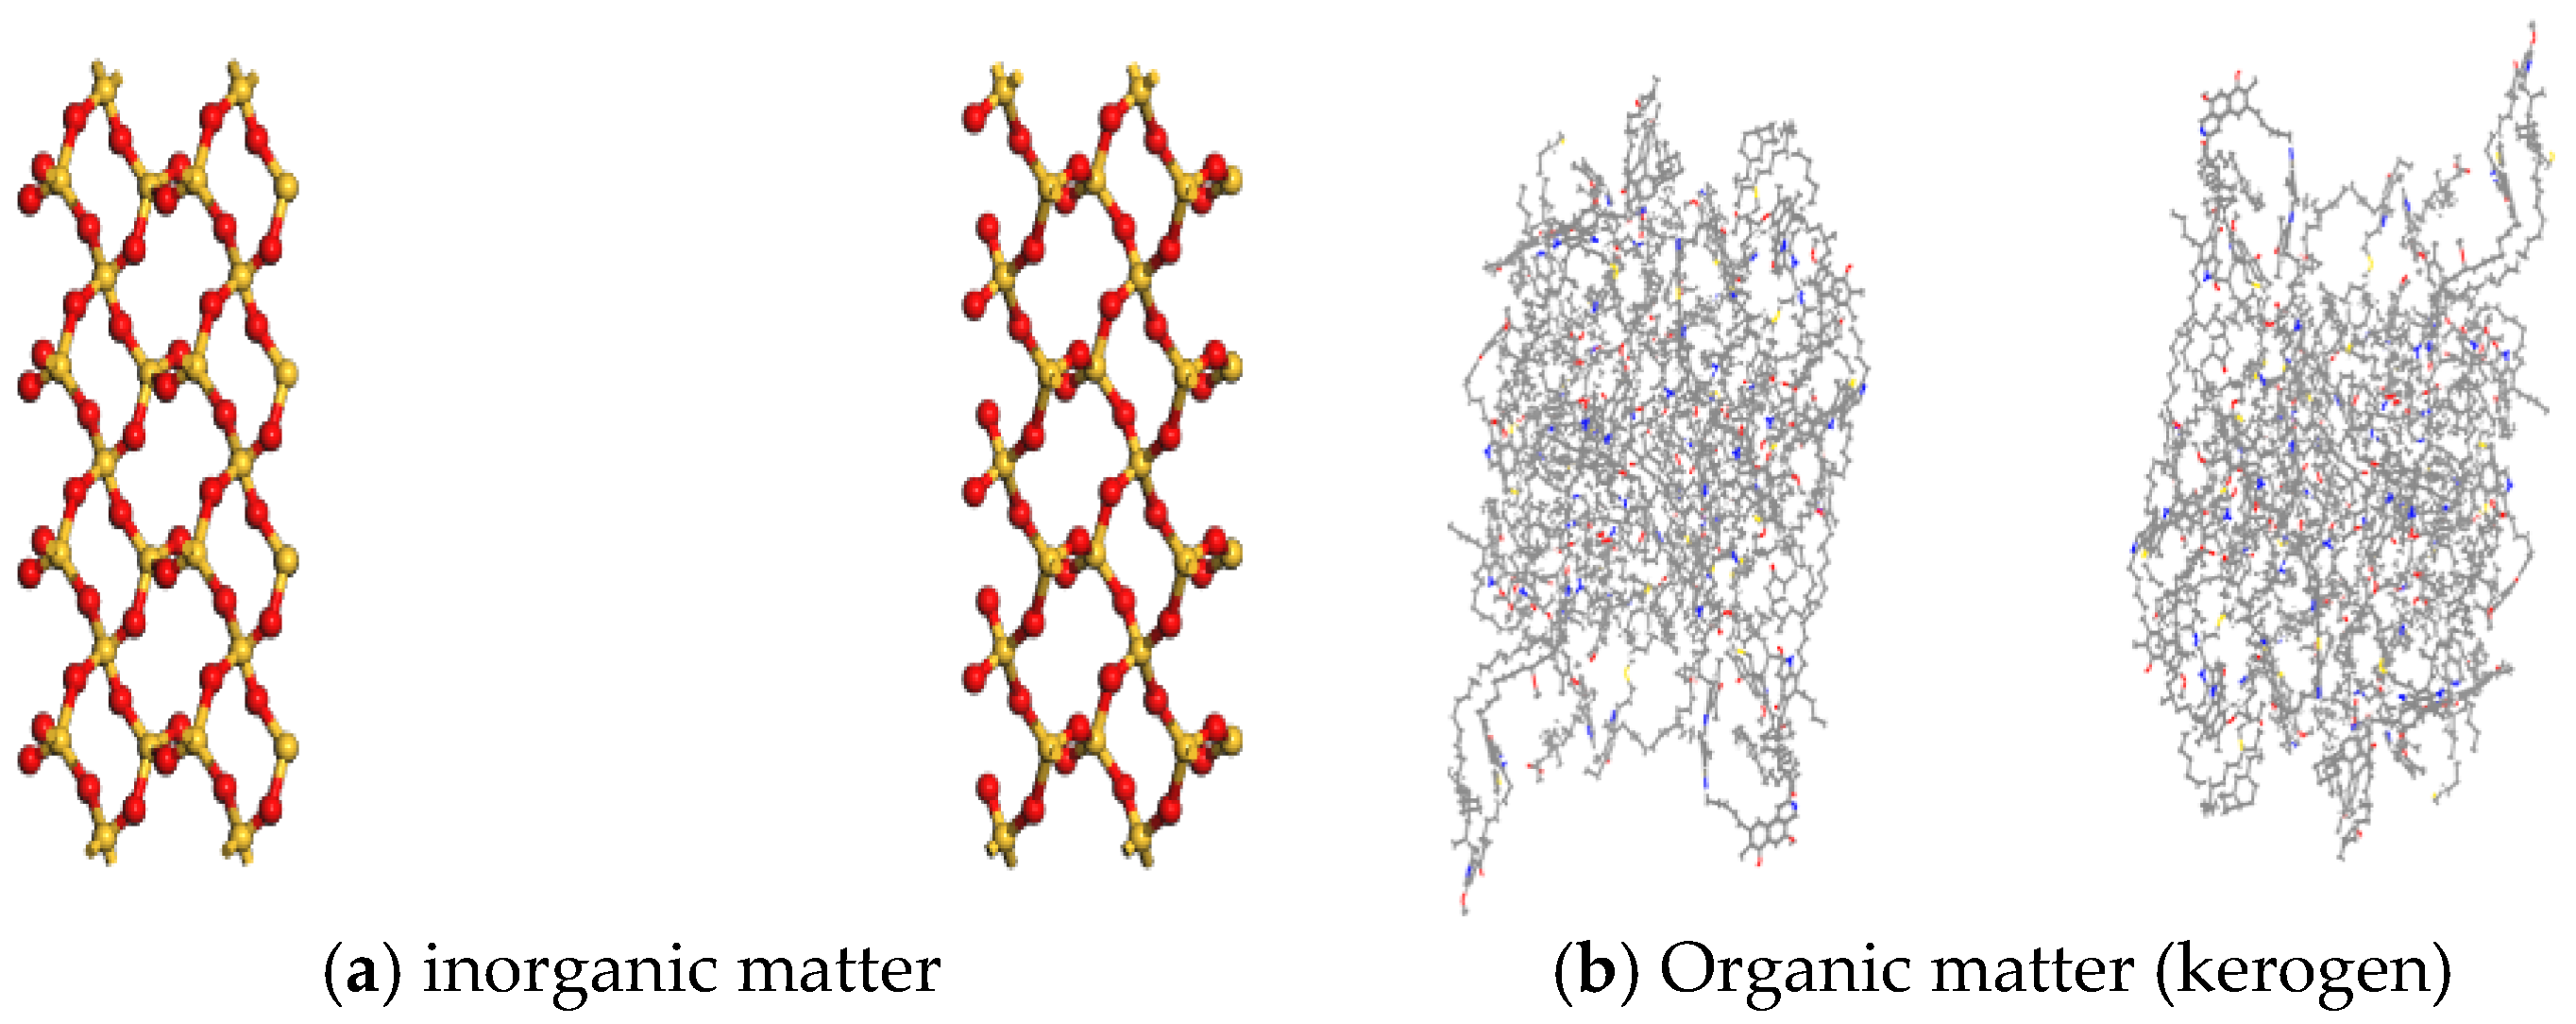
2.3. Molecular Simulation Method

The study of molecular simulation in this study is mainly divided into three steps. The first step is to construct the basic model and the geometric structure. The second step is to use the basic model and geometric structure optimization to calculate the mineral and fluid model. The third step is to use the Forcite module of Materials Studio 2020 software for molecular dynamics simulation and analyze the area where the adsorption phase is located based on the adsorption density distribution curve.
The purpose of geometric optimization is to find the most stable structure of the molecule. The method is to use the optimal force field and algorithm to calculate the potential energy of the whole system and find the structure with the lowest potential energy in the system. The potential energy in the system can be expressed as the sum of valence energy Evalence, crossterm energy Ecrossterm, and non-bond interaction Enon-bond.
Etotal = Evalence + Ecrossterm + Enon-bond
The universal force field (UFF) and the charge equilibrium (Qeq) method are used to calculate the force field of the mineral model and fluid model. The steepest descent iterative algorithm is used to optimize the first 1000 steps, and then the Smart algorithm is used to calculate the optimal structure of 2000 steps. In the iterative process, the convergence threshold of energy is 1 × 10⁻⁴ kcal/mol, the convergence threshold of the external force is 5 × 10⁻² kcal/mol/nm, the convergence threshold of internal stress is 5 × 10⁻³ Gpa, and the convergence threshold of displacement is 5 × 10⁻⁶ nm. In order to calculate the electrostatic potential energy, the Ewald summation method is used, and the accuracy is 1 × 10⁻⁴ kcal/mol. The atom-based algorithm is used to calculate the van der Waals force between molecules, and a truncation radius of 1.55 nm is used.
The Lennard–Jones potential energy model is used to calculate the interaction between van der Waals force and electrostatic force. The calculation formula is:
E = ε i j δ i j r i j 12 δ i j r i j 6 + q i q j 4 π ε 0 r i j
δ i j = δ i + δ j 2 ε i j = ε i ε j
where rij is the distance between the molecule or atom i and j, nm. ε0 is the dielectric constant, 8.854 × 10⁻¹² F/m. εij is L-J potential energy parameters, kJ/mol. δij is the collision diameter of atoms, nm.
The biggest difference between shale oil reservoirs and conventional reservoirs is the in situ reservoir formation. Therefore, in addition to inorganic pores, there are also a large number of organic pores (kerogen) in Gulong shale oil reservoirs. In this study, the inorganic pore model and organic pore model are established based on the mineral distribution of the Qing-1 layer of the Gulong shale oil reservoir, and the fluid model of oil is established based on the fluid components in Table 1. The models are shown in Figure 2 and Figure 3.

3. Results and Analysis

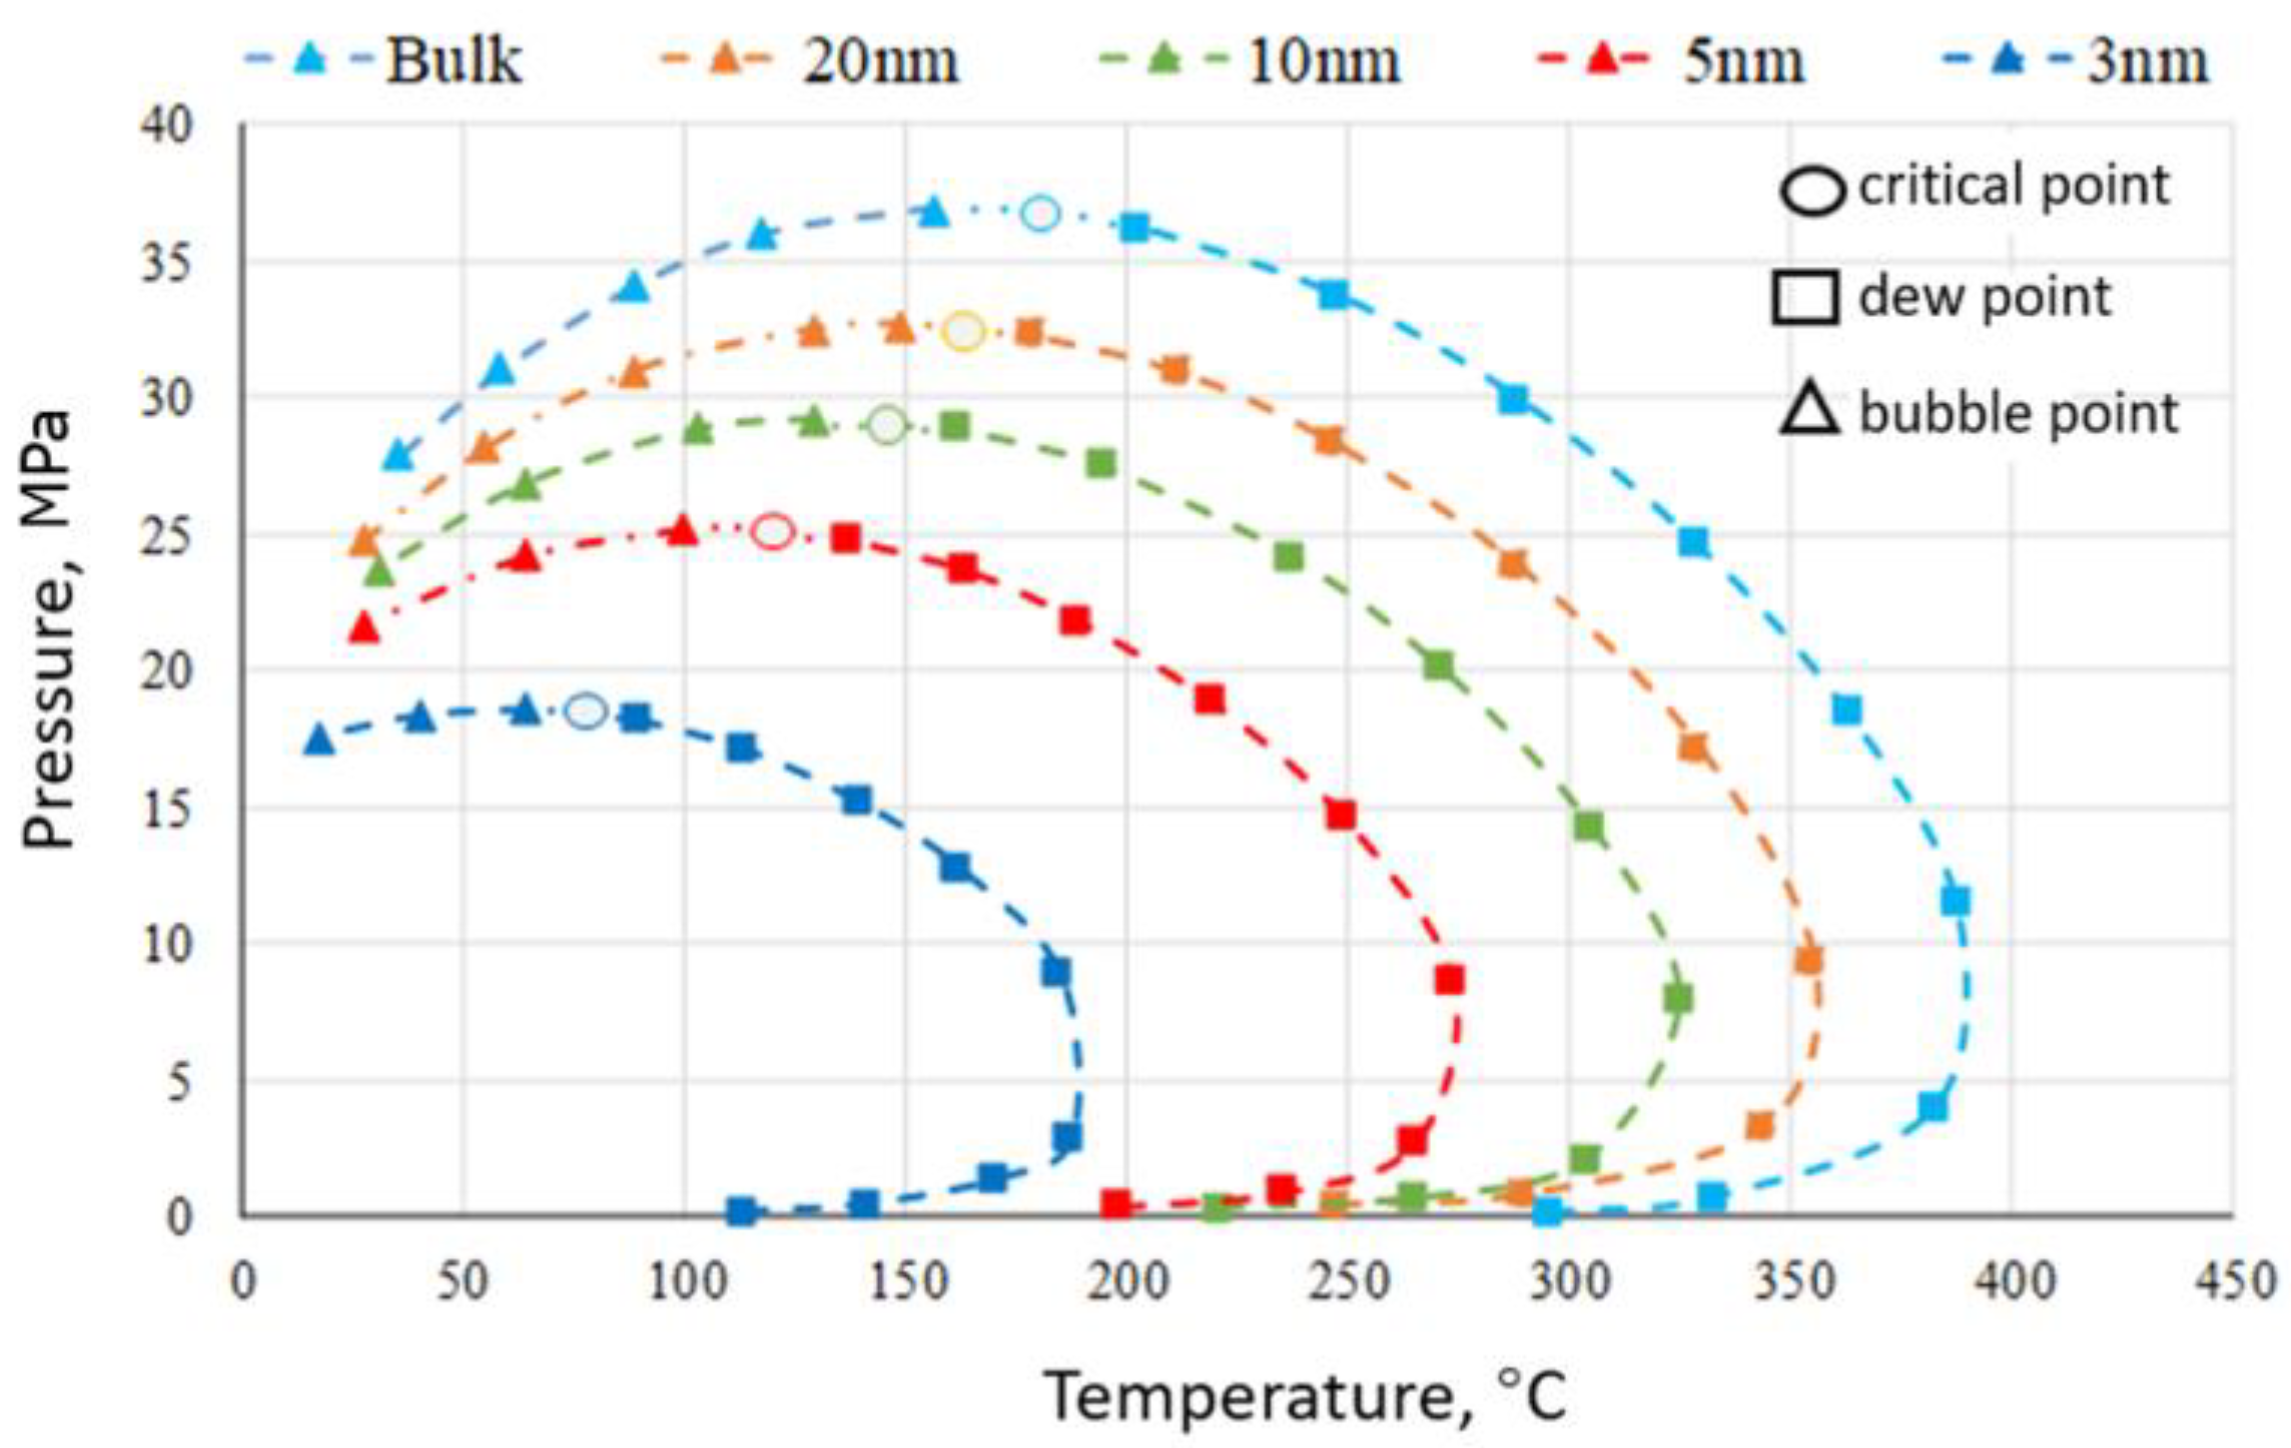
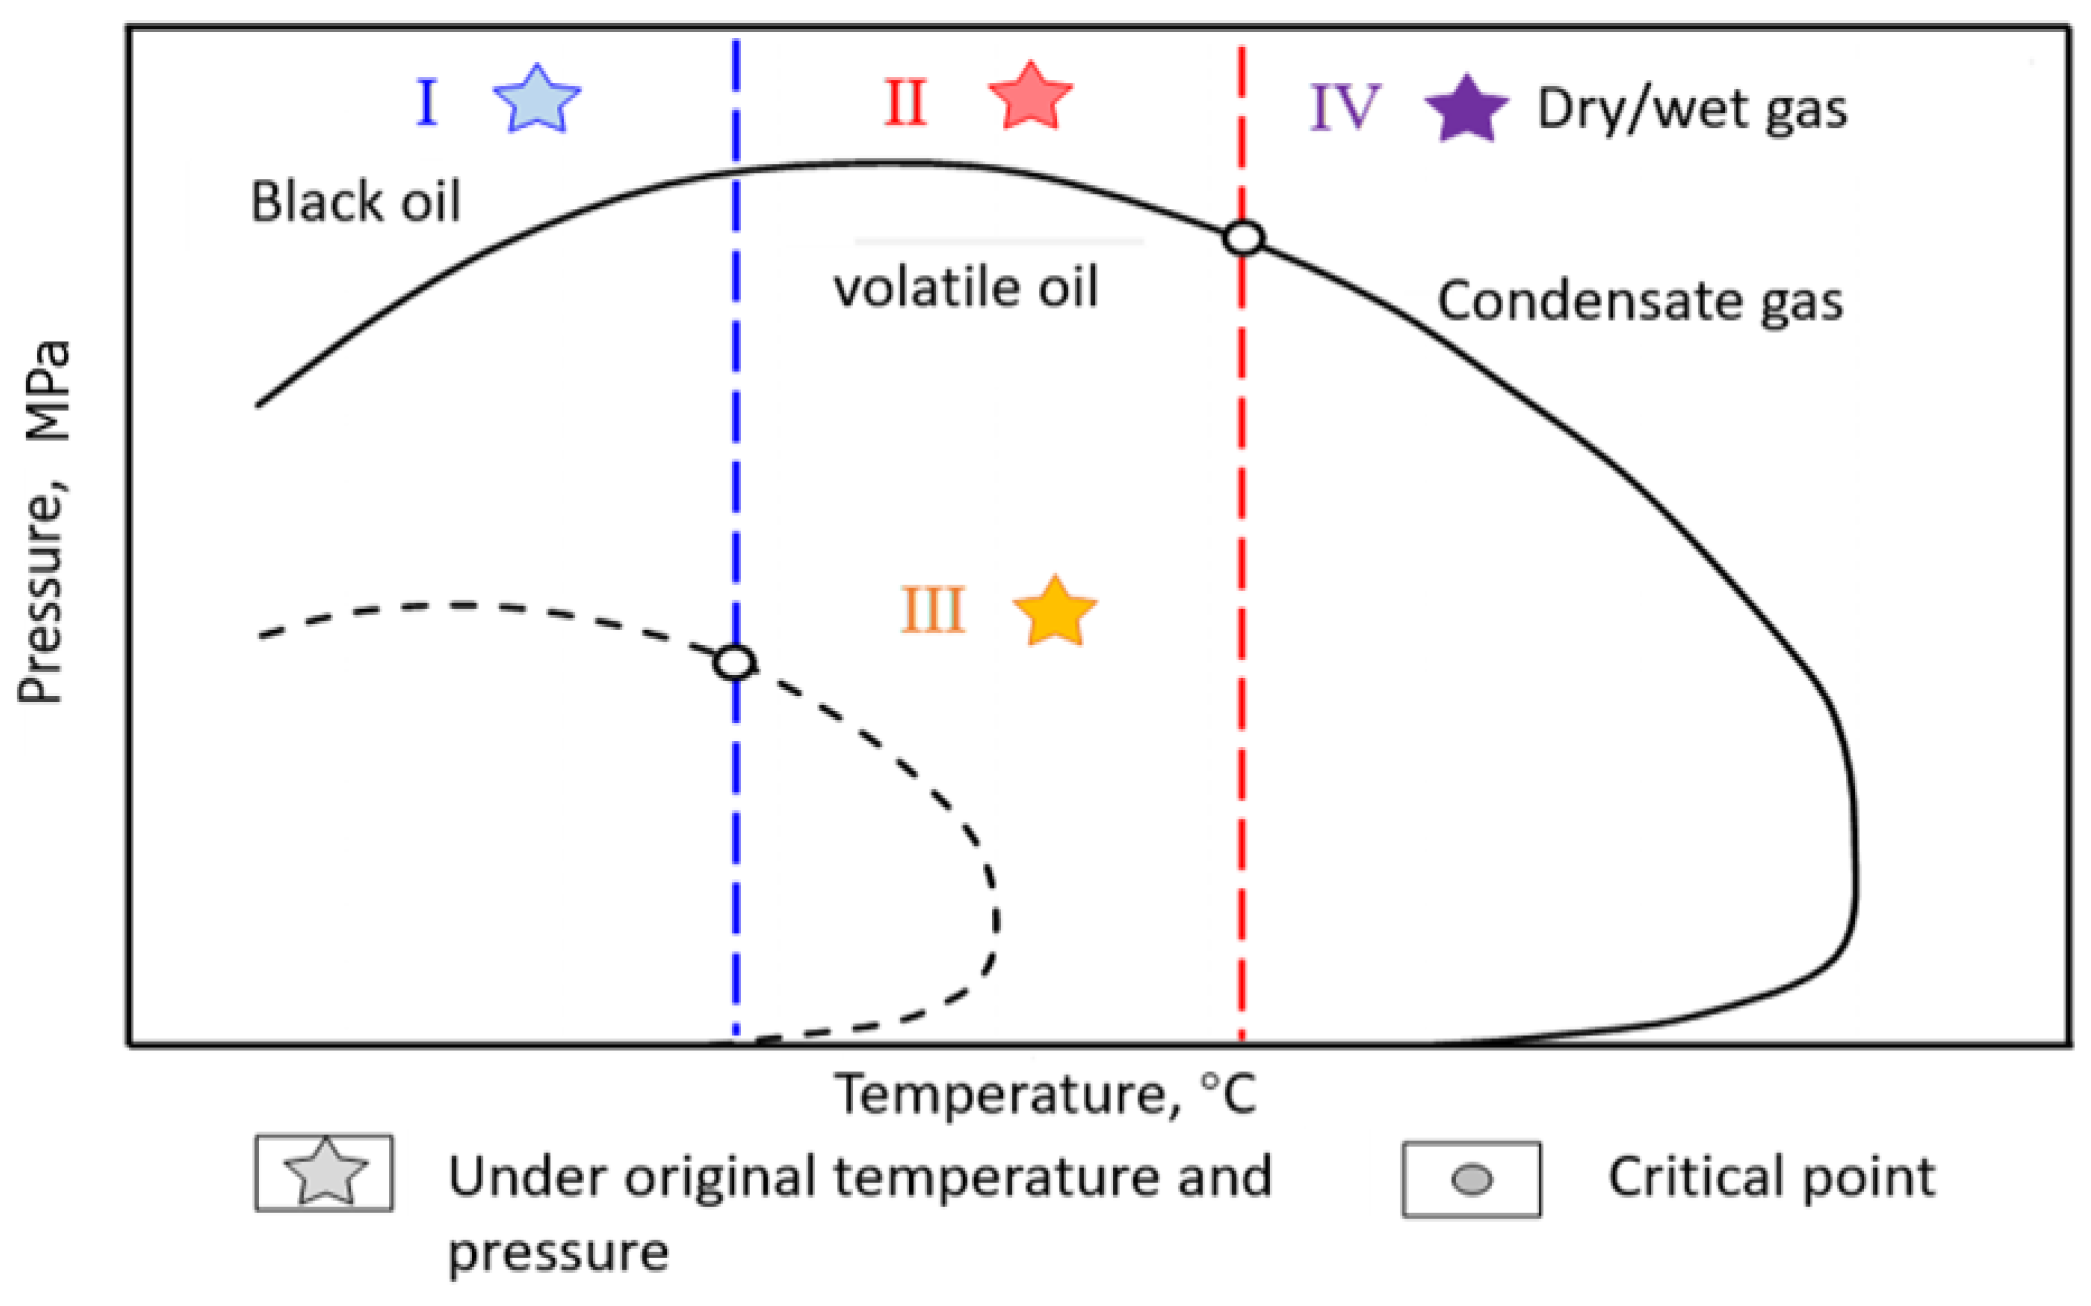
3.1. Phase Behavior in Shale Nanopores

Figure 4 shows the phase envelope of fluid in nanopores (radius: 3 nm, 5 nm, 10 nm, 20 nm) and bulk space. The phase state of fluid in the bulk space can be considered as that in bedding fractures and hydraulic fractures. Under the impact of the nano-confinement effect, the bubble point line and dew point line of the fluid shrink inward, and the area of the two-phase coexistence zone of the fluid is significantly reduced. Moreover, the smaller the pore size, the greater the decrease in the saturation pressure of the hydrocarbon fluid.
For conventional oil reservoirs, the relative position of the initial formation pressure and temperature of the reservoir in the phase diagram are used to determine whether the reservoir type is a black oil reservoir, volatile oil reservoir, condensate gas reservoir, or dry gas reservoir. However, in the shale nanopores, the fluid in different pore sizes shows different phase behaviors, and the heterogeneity of the pore structure distribution aggravates the difference in the phase state in different pores. In this study, the shale nanopores are considered as a ‘supply source’. The phase behavior of the ‘supply source’ is affected by the pore radius. Then, the shale reservoir with a complex pore distribution structure is divided into multiple types of ‘supply sources’ with several phase behavior characteristics. As shown in Figure 5, the black solid line and the imaginary line are the phase envelope curves under weak nano-confinement (50 nm pore radius) and strong nano-confinement (3 nm pore radius), respectively. I–IV are the relative positions of the initial temperature and pressure conditions in the phase diagram. When the initial temperature and pressure of the reservoir are in the relative position I, the hydrocarbon fluid in the pores with weak nano-confinement (50 nm) presents a black oil state, while the hydrocarbon fluid in the pores with strong nano-confinement (3 nm) presents volatile oil state, and the nanopores of this reservoir are the ‘supply source’ of black oil–volatile oil. When the initial temperature and pressure of the reservoir are in the relative position III, the hydrocarbon fluid in the weak nano-confinement (50 nm) pores presents an oil–gas two-phase state, while the hydrocarbon fluid in the strong nano-confinement (3 nm) pores presents a dry/wet gas state; thus, the nanopores in this reservoir are the ‘supply source’ of volatile oil–dry/wet gas. When the initial temperature and pressure of the reservoir are in the relative position IV, the hydrocarbon fluid in the pores with weak nano-confinement (50 nm) presents condensate gas state, and in the pores with strong nano-confinement (3 nm) presents a dry/wet gas state; thus, the nanopores in this reservoir are the ‘supply source’ of condensate gas–dry/wet gas. The initial temperature and pressure conditions of the Gulong shale reservoir are located at position II, so the nanopores of the Gulong shale oil reservoir are the ‘supply source’ of volatile oil–condensate gas.
The effective development of the Gulong shale oil reservoir requires the use of a horizontal well and stimulated reservoir volume technology, so that the multi-scale flow space of nano-matrix–microfractures–hydraulic fractures can be created. So, during the stage of fracturing and shut-in, there are differences in the initial occurrence state of fluid in different pores, as shown in Table 2.

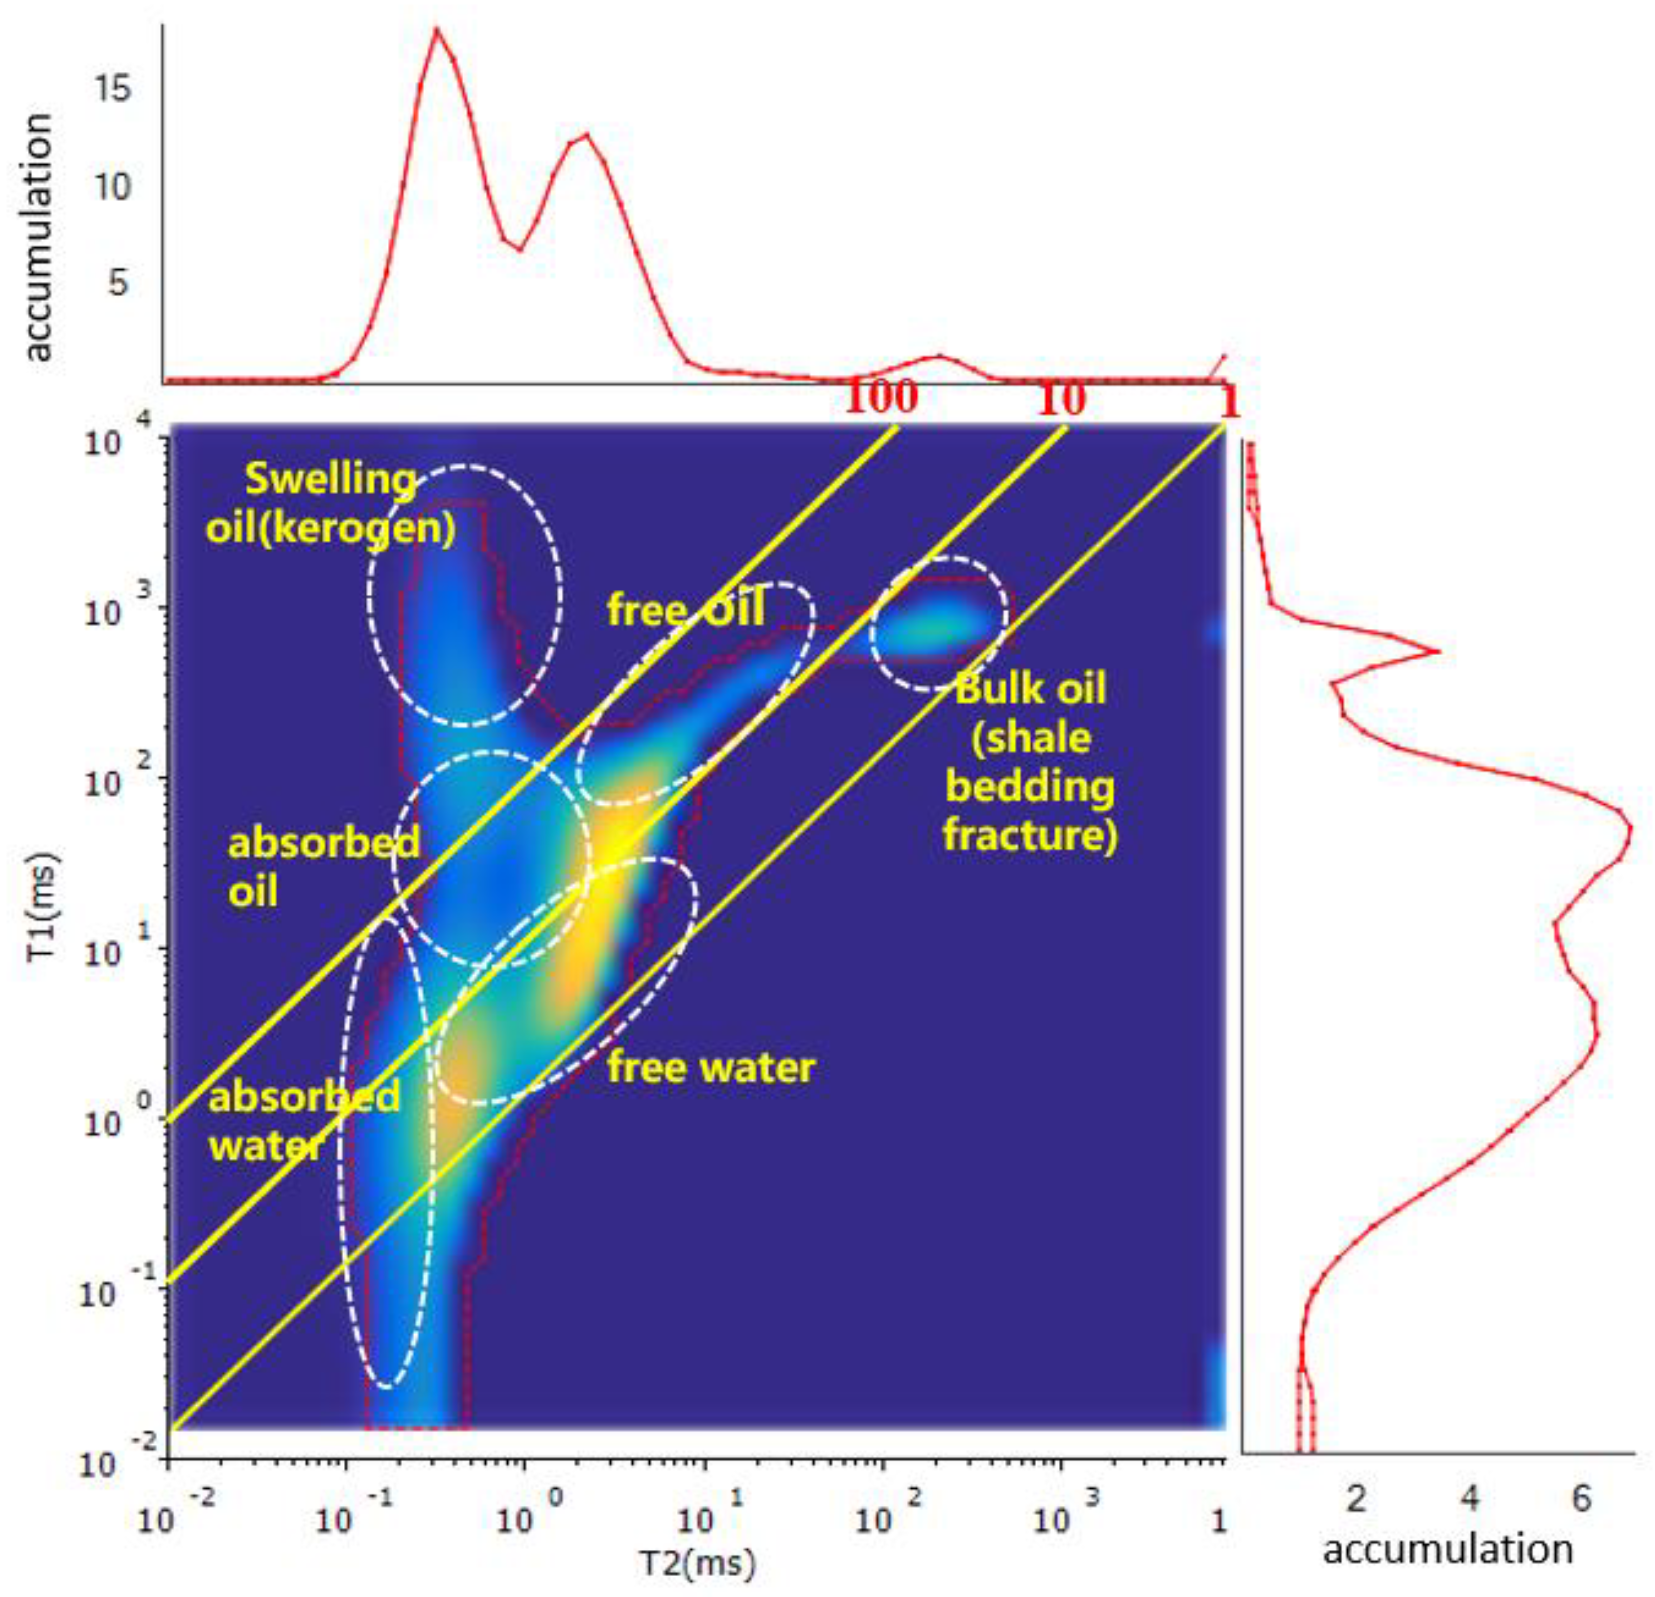
3.2. Analysis of Initial Occurrence State

There are four initial occurrence states of shale oil, which include the adsorption state, free state, swelling state, and dissolved state. However, the water cut of the shale oil reservoir is low, and the solubility of crude oil in water is low, so the content of dissolved shale oil can be ignored. In the two-dimensional NMR monitoring of shale, the T1 value of organic matter (such as kerogen and crude oil) is relatively high, while the T1 value of water is relatively low. In addition, the T2 value of the fluid is related to its viscosity and flow capability. The larger the T2 value, the lower the viscosity of the fluid and the better the flow capability. Therefore, the T1/T2 value of organic matter with high viscosity and dense structure such as kerogen is higher, while the T1/T2 value of light hydrocarbon with low viscosity and good flow capability is lower. Of course, the signal intensity distribution of different types and maturity of organic matter in each interval will also be different. At present, experts and scholars at home and abroad judge the initial occurrence state of the shale reservoir via the two-dimensional nuclear magnetic T1-T2 spectrum, mainly relying on the range of the T2 boundary value and T1/T2 value for interval division. It is generally believed that the distribution interval T1/T2 of the water signal is about 1, the distribution interval T1/T2 of kerogen is greater than 100, the distribution interval of light hydrocarbon is mainly T1/T2 greater than 10, and the T2 value is about 1. Based on this principle, the initial occurrence state of the Gulong shale reservoir is qualitatively analyzed, including kerogen, adsorbed oil, free oil, bulk oil (oil in fractures), and some initial adsorbed water and free water, which is shown in Figure 6.
In order to further clarify the occurrence state of hydrocarbon fluids in inorganic pores and organic pores, the relative density functions of fluids in different types of pores are calculated through molecular simulation. Figure 7a,b show the fluid distribution and relative density curves in inorganic pores and organic pores with a pore diameter of 5 nm, respectively. The occurrence state of fluid is comprehensively judged according to the relative density of skeleton molecules and the relative density of fluid molecules. The hydrocarbon fluids in the inorganic pores are mainly free and adsorbed states, while the hydrocarbon fluids in the organic matter have some swelling crude oil in addition to free and adsorbed states. The swelling crude oil is mainly caused by the dissolution of a part of crude oil by kerogen, which leads to its own volume expansion. The dissolved part of crude oil is called swelling crude oil. However, the content of swelling crude oil is usually low, so the main initial occurrence state of fluid in the nanopores of the Gulong shale oil reservoir is the free state and adsorbed state. For bedding fractures and hydraulic fractures, the main occurrence state is the free state.

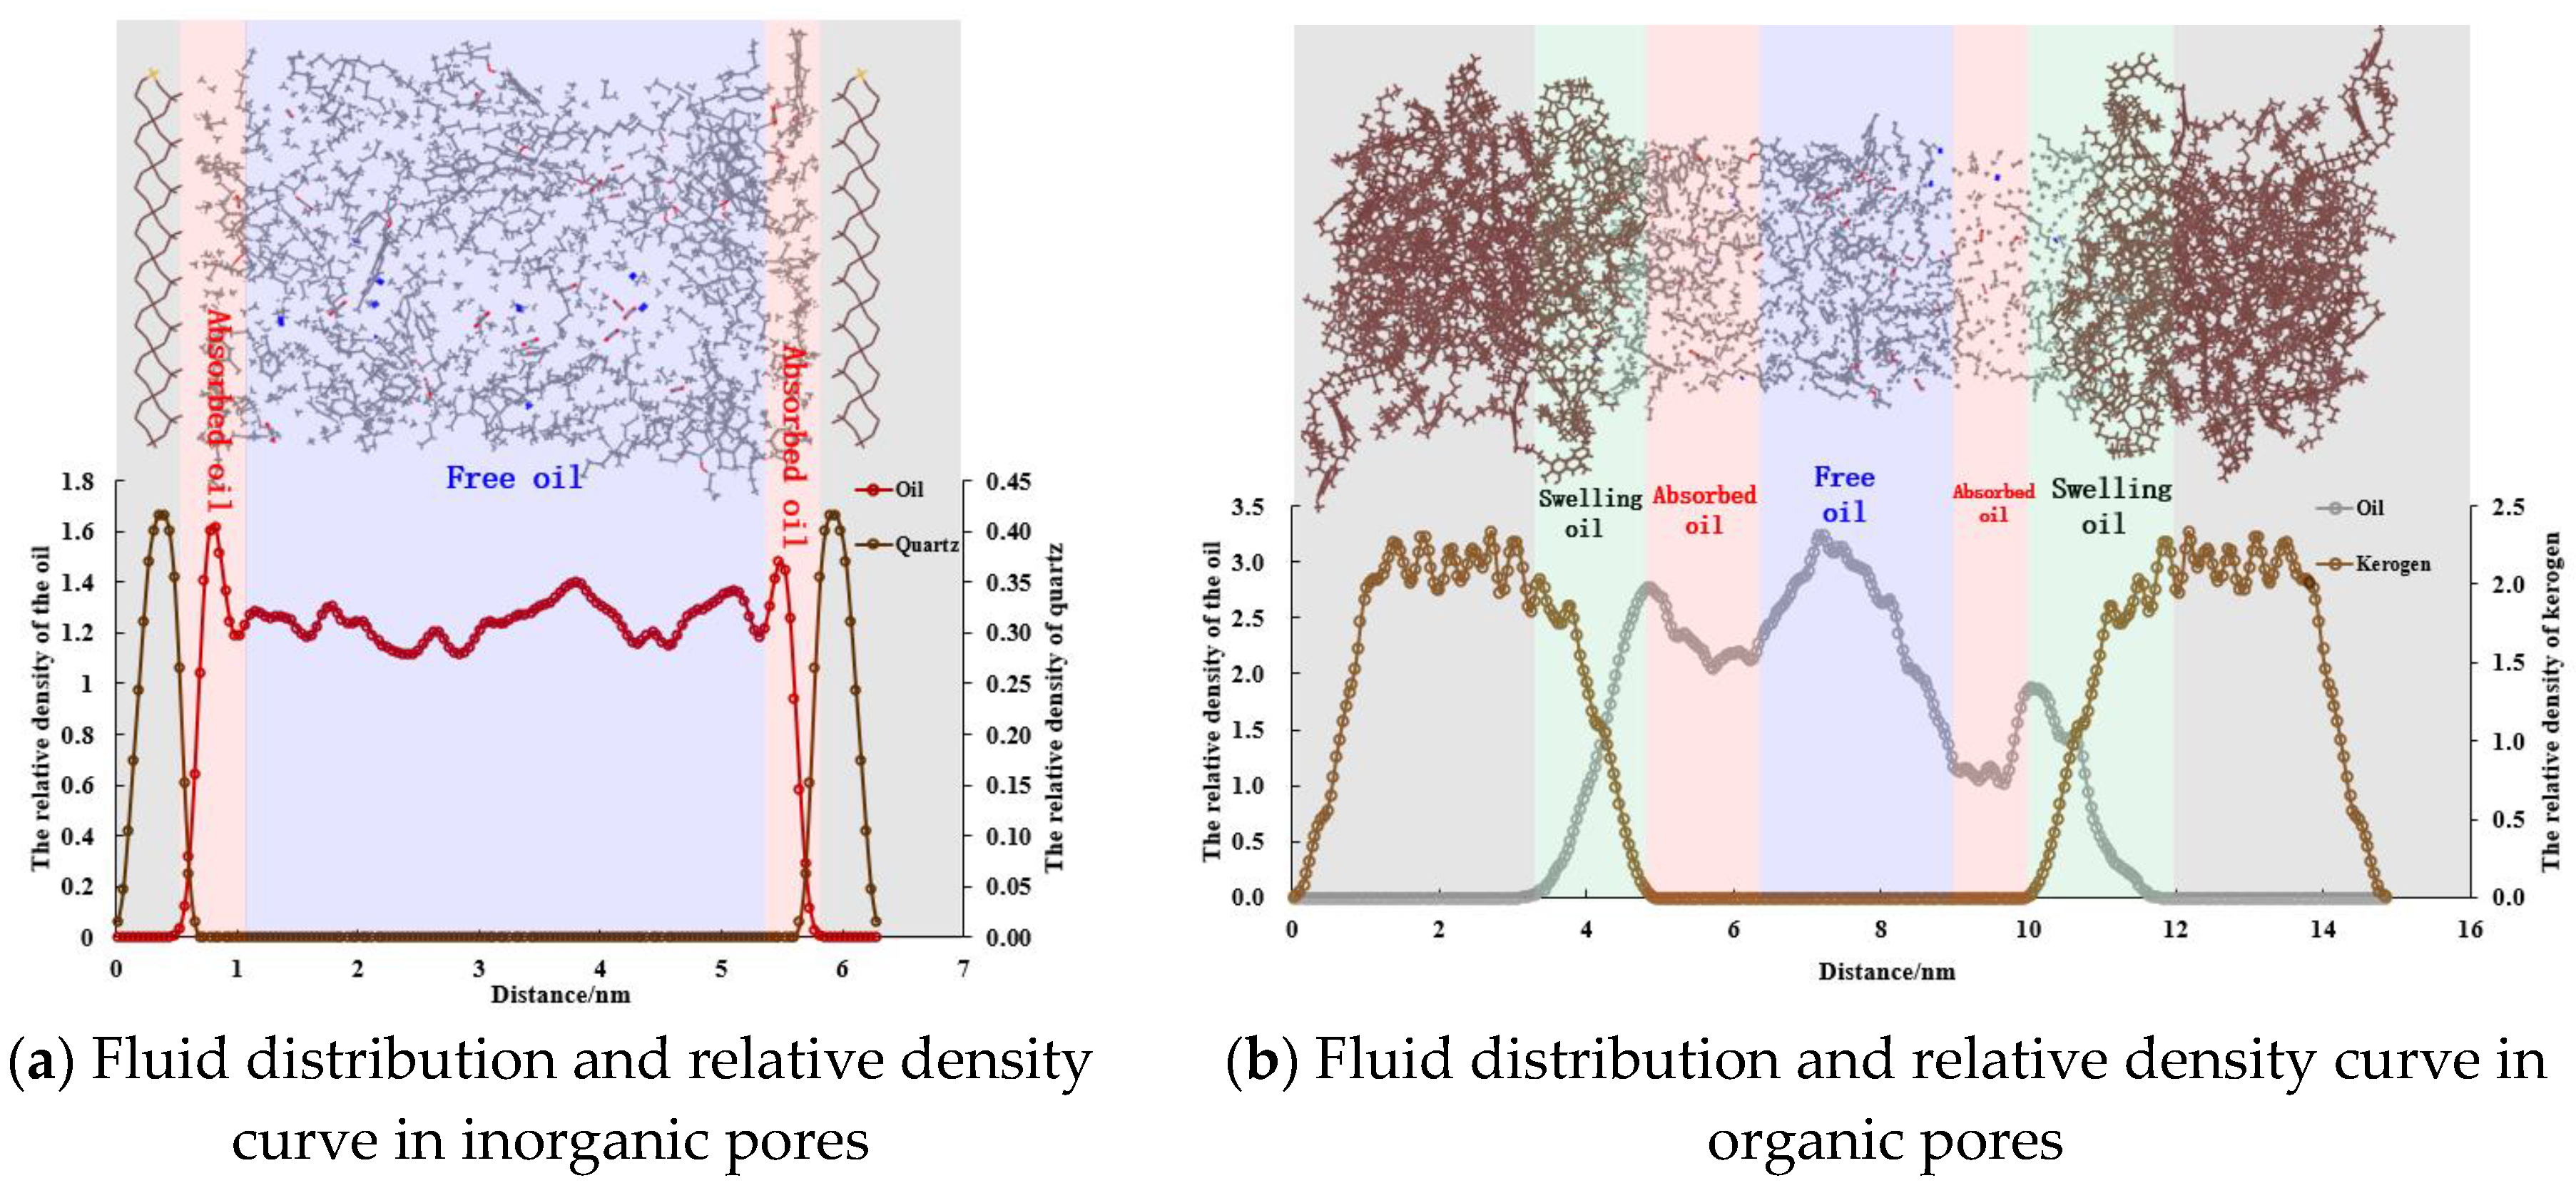
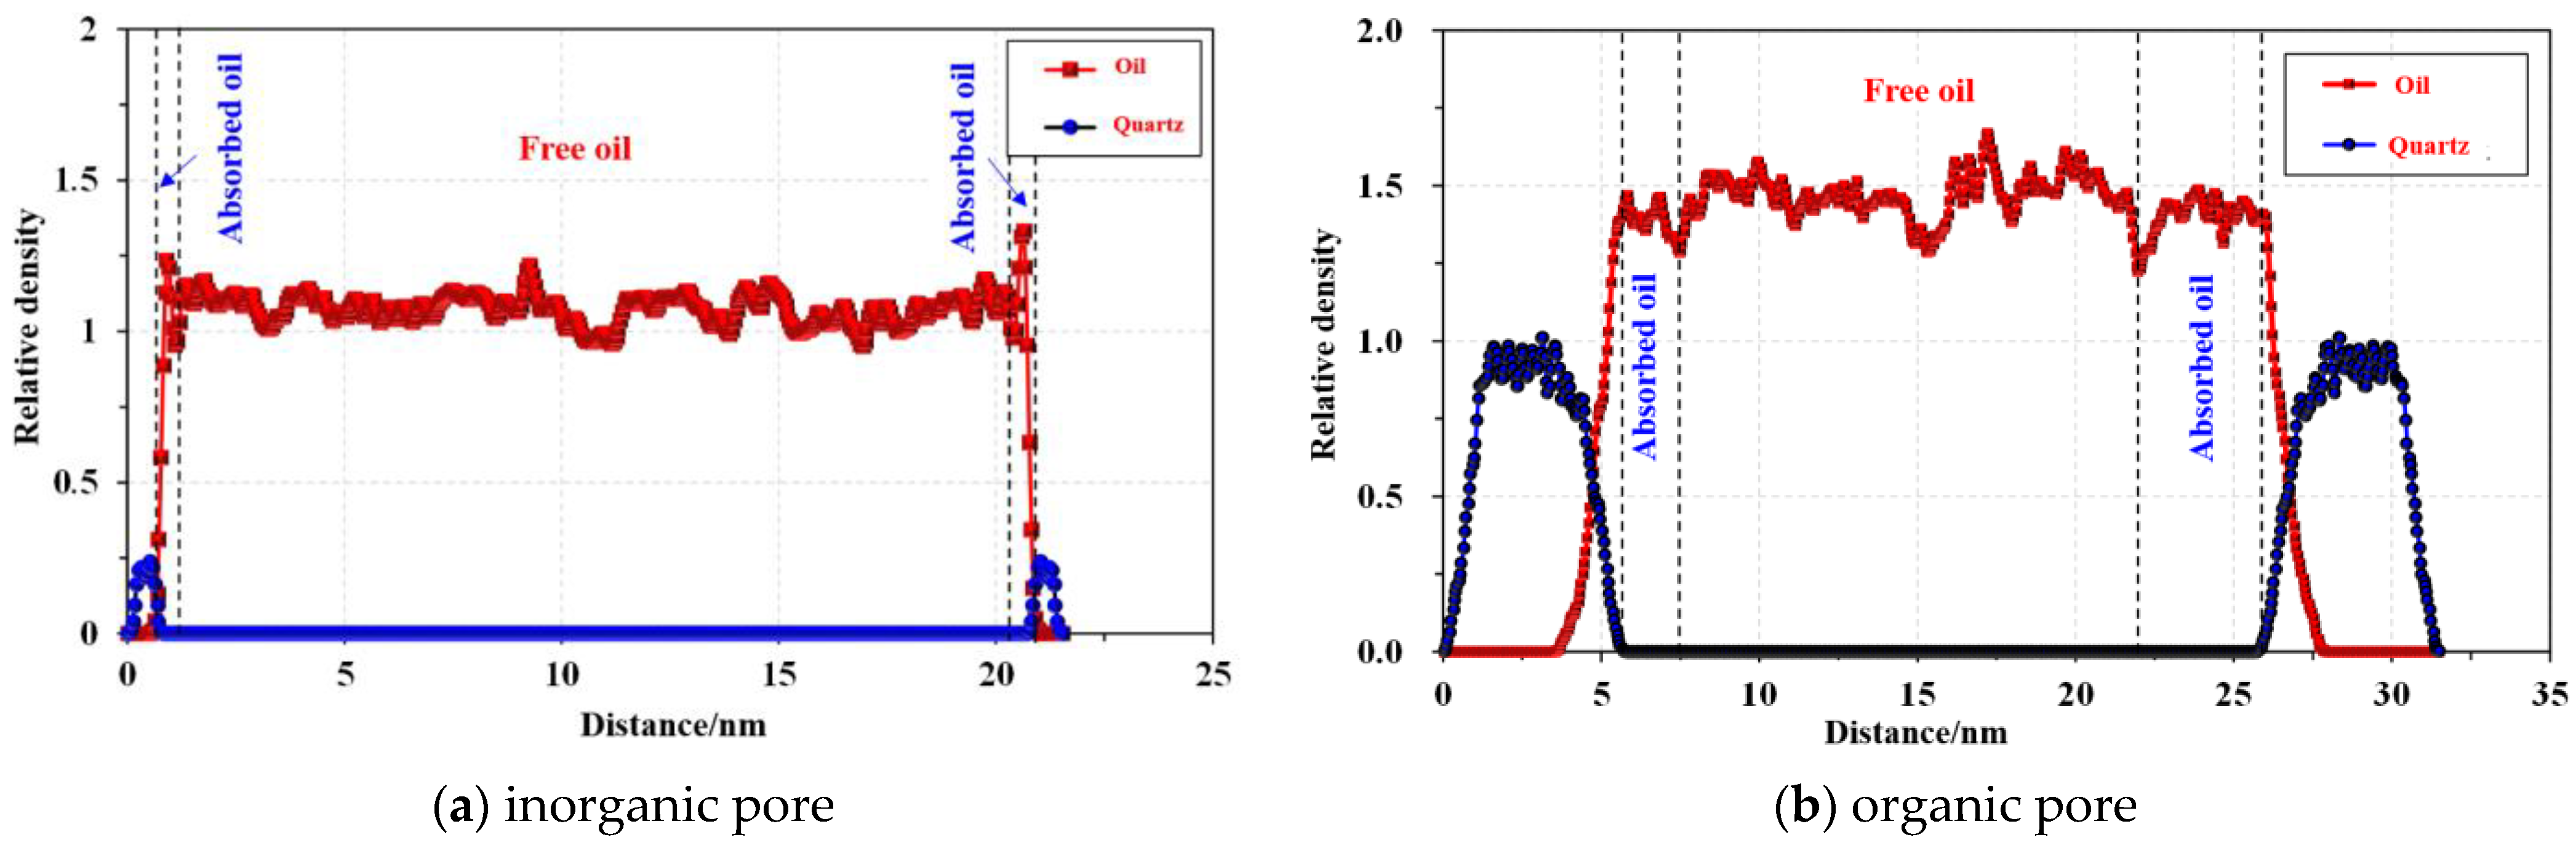
3.3. Analysis of Adsorbed Oil and Free Oil

Under the conditions of an original formation pressure of 37 MPa and original formation temperature of 135 °C, a molecular simulation scheme of different pore types for the initial occurrence state of fluid molecules in nanochannels is formed, and the distribution of crude oil molecules in different nano-matrix channels is quantitatively characterized. Figure 8a,b show the proportion of free oil and adsorbed oil in 10 nm inorganic and organic pores. In the 10 nm organic pores, the proportion of free oil is 61%, while the proportion of adsorbed oil is 39%. In 10 nm inorganic pores, free oil accounts for 96.3%, while inorganic pores account for 73%. This shows that in the original state, the amount of adsorbed oil in organic pores is larger, and the movable oil is mainly distributed in inorganic pores.
By calculating the proportion of free oil and adsorbed oil in a pore radius of 1~30 nm, combined with the mineral content data of Gulong shale oil, it can be calculated that the average volume ratio of adsorbed oil in the inorganic minerals of the Gulong shale reservoir is 24.4%, and the proportion of adsorbed oil in organic pores is about 57.8%.

3.4. Analysis of Movable Fluid Saturation

Two cores from the Q1 and Q3 subzones of the GY-10HC well are selected to carry out centrifugal-NMR monitoring experiments at three points with different rotation speeds. The length and diameter of the cores are measured by vernier calipers, and the mass of the cores before and after centrifugation is measured by balance, as shown in Figure 9a,b.
Figure 10a,b show the T2 spectrum distribution curves and cumulative distribution curves of the two cores before and after centrifugation. Aiming at the limit of movable porosity of Gulong shale, the T2 cutoff value and movable porosity of Q1 and Q3 subzones of the GY-10HC well are calculated based on the cumulative distribution curve of the T2 spectrum before and after centrifugation. The T2 cutoff value of the core in the Q1 subzone is 2.009 ms, and the movable porosity is 0.471%. The T2 cutoff value of the core in the Q3 subzone is 3.511 ms, and the movable porosity is about 0.46%. The movable pore throat limit of conventional reservoirs is usually based on the T2 cutoff value as the standard, but the error of judging the movable limit according to the T2 cutoff value is large. In this study, the difference in T2 equaling 1 is proposed as the movable boundary. After comparison, the minimum movable T2 spectrum of the Gulong shale oil reservoir is about 0.0201~0.0266 ms. Therefore, the movable limit of the pore throat in the Gulong shale reservoir is that the pore throat radius is greater than 4.5 nm, and the movable porosity accounts for about 11% of the total porosity.
For the calculation method of movable fluid saturation, there are mainly the following three categories: ① T2 Cutoff value method–movable fluid saturation S1: the ratio of peak area before cutoff value (movable fluid) and total peak area (total fluid). ② Area method–movable fluid saturation S2: using the NMR results after centrifugation, the ratio of the peak area after centrifugation to the peak area after saturation. ③ Mass method–movable fluid saturation S3: using the weighing results before and after centrifugation, the mass of the centrifuged core and the saturated core mass. In this study, the average value of the calculated results of the latter two methods is taken as the movable fluid saturation. The calculation results are shown in Table 3. Finally, the movable fluid saturation of the Gulong shale oil reservoir is about 12%.

4. Conclusions

This study focuses on the initial occurrence state and movability of the Gulong shale reservoir fluid in the Songliao Basin, and a comprehensive research method, including nano-confined phase state analysis, nuclear magnetic resonance monitoring, and molecular simulation, is established. The following conclusions are obtained:
(1)
Considering the nano-confinement effects, the nanopores of the Gulong shale reservoir present the characteristics of a ‘condensate gas state in small pores and volatile oil state in large pore’.
(2)
The initial occurrence state of the Gulong shale reservoir is mainly the adsorbed state and free state. The adsorbed oil in inorganic pores accounts for about 24.4%, and the adsorbed oil in organic pores accounts for about 57.8%.
(3)
The minimum movable limit of the pore throat in the Gulong shale reservoir is determined by centrifugation and the nuclear magnetic resonance method. The movable porosity accounts for about 11% of the total porosity, and the movable fluid saturation is about 12%.

Author Contributions

Conceptualization, G.Z. and L.C.; methodology, G.Z.; software, P.J.; validation, Y.L. and H.F.; formal analysis, L.C.; investigation, P.J. and Y.L.; data curation, T.K. and Q.W.; writing—original draft preparation, H.F. and T.K.; writing—review and editing, P.J.; supervision, G.Z.; project administration, L.C.; funding acquisition, G.Z. All authors have read and agreed to the published version of the manuscript.

Funding

This research was funded by the CNPC Major Technology Project “Theory and Key Technologies of Exploration and Development of Daqing Gulong Shale Oil”, Topic 2 “Theory and Key Technologies of Beneficial Development of Gulong Shale Oil”, grant number 2021ZZ10-02.

Data Availability Statement

Data are contained within the article.

Conflicts of Interest

Authors Guozhong Zhao, Yong Liu, Tie Kuang and Qingzhen Wang were employed by the Exploration and Development Research Institute of Daqing Oilfield Company Ltd. The remaining authors declare that the research was conducted in the absence of any commercial or financial relationships that could be construed as a potential conflict of interest.

References

  1. Lu, S.; Huang, W.; Chen, F.; Li, J.; Wang, M.; Xue, H.; Wang, W.; Cai, X. Classification and evaluation criteria of shale oil and gas resources: Discussion and application. Pet. Explor. Dev. 2012, 39, 268–276. [Google Scholar] [CrossRef]
  2. Sun, L.; Liu, H.; He, W.; Li, G.; Zhang, S.; Zhu, R.; Jin, X.; Meng, S.; Jiang, H. An analysis of major scientific problems and research paths of Gulong shale oil in Daqing Oilfield, NE China. Pet. Explor. Dev. 2021, 48, 527–540. [Google Scholar] [CrossRef]
  3. Wang, Y.; Liang, J.; Zhang, J.; Zhao, B.; Zhao, Y.; Liu, X.; Xia, D. Resource potential and exploration direction of Gulong shale oil in Songliao Basin. Pet. Geol. Oilfield Dev. Daqing 2020, 39, 20–34. [Google Scholar]
  4. Zou, C.; Yang, Z.; Cui, J.; Zhu, R.; Hou, L.; Tao, S.; Yuan, X.; Wu, S.; Lin, S.; Wang, L.; et al. Formation mechanism, geological characteristics and development strategy of nonmarine shale oil in China. Pet. Explor. Dev. 2013, 40, 15–27. [Google Scholar] [CrossRef]
  5. He, W.; Meng, Q.; Feng, Z.; Zhang, J.; Wang, R. In-situ accumulation theory and exploration & development practice of Gulong shale oil in Songliao Basin. Shiyou Xuebao/Acta Pet. Sin. 2022, 43, 1–14. [Google Scholar] [CrossRef]
  6. Jiang, Z.; Zhang, W.; Liang, C.; Wang, Y.; Liu, H.; Chen, X. Characteristics and evaluation elements of shale oil reservoir. Shiyou Xuebao/Acta Pet. Sin. 2014, 35, 184–196. [Google Scholar] [CrossRef]
  7. Liu, H.; Zhang, S.; Bao, Y.; Fang, Z.; Yao, S.; Wang, Y. Geological characteristics and effectiveness of the shale oil reservoir in Dongying sag. Oil Gas Geol. 2019, 40, 512–523. [Google Scholar] [CrossRef]
  8. Wang, F.; Fu, Z.; Wang, J.; Tang, Z.; Jiang, R. Characteristics and classification evaluation of Gulong shale oil reservoir in Songliao Basin. Pet. Geol. Oilfield Dev. Daqing 2021, 40, 144–156. [Google Scholar]
  9. Tian, S. Microscopic Characteristics of Shale Reservoir Pores and Evaluation of Shale Oil Occurrence and Mobility. Ph.D. Thesis, China University of Petroleum (East China), Qingdao, China, 2019. [Google Scholar]
  10. Zhang, X. Research on New Methods for Characterizing Pore Structure of Shale Oil and Gas Reservoirs. Master’s Thesis, University of Chinese Academy of Sciences (Institute of Seepage Fluid Mechanics, Chinese Academy of Sciences), Beijing, China, 2021. [Google Scholar]
  11. Li, J. Study on the Occurrence Mechanism and Mobility of Shale Oil. Ph.D. Thesis, China University of Petroleum (East China), Qingdao, China, 2020. [Google Scholar]
  12. Lu, S.; Chen, F.; Xiao, H.; Li, J.; He, X. Quantitative evaluation of organic and inorganic pores in shale reservoirs-Taking the Lower Cambrian Niutitang Formation in Qiannan Depression as an example. In Proceedings of the 14th Annual Conference of the Chinese Society of Mineral and Rock Geochemistry, Nanjing, China, 21 April 2013; p. 1. [Google Scholar]
  13. O’Brien, N.R.; Cremer, M.D.; Canales, D.G. The Role of Argillaceous Rock Fabric in Primary Migration of Oil. GCAGS Trans. 2002, 52, 1103–1112. [Google Scholar]
  14. Zhang, W. Characteristics and evaluation factors of shale oil reservoirs in the third member of Paleogene Hetaoyuan Formation in Biyang Sag. Master’s Thesis, China University of Geosciences (Beijing), Beijing, China, 2014. [Google Scholar]
  15. Ke, S. Discussion on occurrence state and mobility of shale oil in Biyang sag. Pet. Geol. Eng. 2017, 31, 80–83. [Google Scholar]
  16. Ning, F.; Wang, X.; Hao, X.; Jiang, X.; Wang, Y.; Zhu, D.; Zhu, D. Study on evaluation method of shale oil sweet spot in Jiyang depression. Sci. Technol. Eng. 2015, 35, 11–16. [Google Scholar]
  17. Jarvie, D. Shale resource systems for oil and gas: Part 2: Shale-oil resource systems. AAPG Mem. 2012, 97, 89–119. [Google Scholar]
  18. Sun, J.; Chen, J.; Yang, Z.; Liu, X.; Liu, Y. Experimental Study of the NMR Characteristics of Shale Reservoir Rock. Sci. Technol. Rev. 2012, 30, 25–30. [Google Scholar]
  19. Zhou, S.; Liu, H.; Yan, G.; Xue, H.; Guo, W. NMR research of movable fluid and T_2 cutoff of marine shale in South China. Oil Gas Geol. 2016, 37, 612–616. [Google Scholar]
  20. Li, Z.; Zou, Y.-R.; Xu, X.-Y.; Sun, J.-N.; Li, M.; Peng, P.a. Adsorption of mudstone source rock for shale oil—Experiments, model and a case study. Org. Geochem. 2016, 92, 55–62. [Google Scholar] [CrossRef]
  21. Cao, H.; Zou, Y.-R.; Lei, Y.; Xi, D.; Wan, X.; Peng, P.A. Shale Oil Assessment for the Songliao Basin, Northeastern China, Using Oil Generation-Sorption Method. Energy Fuels 2017, 31, 4826–4842. [Google Scholar] [CrossRef]
  22. Xu, F.; Jiang, H.Q.; Liu, M.; Jiang, S.; Wang, Y.; Li, J.J. NMR-Based Analysis of Fluid Occurrence Space and Imbibition Oil Recovery in Gulong Shale. Processes 2023, 11, 1678. [Google Scholar] [CrossRef]
  23. Zhu, C.F.; Guo, W.; Li, Y.J.; Gong, H.J.; Sheng, J.J.; Dong, M.Z. Effect of occurrence states of fluid and pore structures on shale oil movability. Fuel 2021, 288, 119847. [Google Scholar] [CrossRef]
  24. Sun, X.; Du, H.; Wang, C.; Du, S.; Liu, G. Characterization of Shale Porosity and Permeability by Nuclear Magnetic Resonance. In Proceedings of the 2nd International Conference on Energy Utilization and Automation, ICEUA 2023, Virtual, Online, China, 10–12 February 2023. [Google Scholar]
  25. Zarragoicoechea, G.J.; Kuz, V.A. Critical shift of a confined fluid in a nanopore. Fluid Phase Equilibria 2004, 220, 7–9. [Google Scholar] [CrossRef]
  26. Guerillot, D.R. EOR Screening with an Expert System. In Proceedings of the Petroleum Computer Conference, San Jose, CA, USA, 27–29 June 1988. Article No. SPE-17791-MS. [Google Scholar] [CrossRef]
  27. Alvarado, V.; Manrique, E. Chapter 8: EOR’s Current Status. In Enhanced Oil Recovery; Alvarado, V., Manrique, E., Eds.; Gulf Professional Publishing: Boston, MA, USA, 2010; pp. 133–156. [Google Scholar] [CrossRef]
  28. Lyons, W. Working Guide to Reservoir Engineering; Gulf Professional Publishing: Houston, TX, USA, 2009. [Google Scholar]
Figure 1. Flow chart of liquid–vapor equilibrium calculation considering nano-confinement effects.
Energies 17 01358 g001
Figure 2. Diagram of rock skeleton model in Gulong shale oil reservoir.
Energies 17 01358 g002
Figure 3. Diagram of fluid model in Gulong shale oil reservoir.
Energies 17 01358 g003
Figure 4. Fluid-phase envelopes in different size of shale nanopores.
Energies 17 01358 g004
Figure 5. The initial phase state under different initial temperature and pressure conditions.
Energies 17 01358 g005
Figure 6. Two-dimensional T1-T2 spectrum and initial occurrence state of Gulong shale oil.
Energies 17 01358 g006
Figure 7. Initial occurrence state of fluid in inorganic and organic pores.
Energies 17 01358 g007
Figure 8. The proportion of free oil and adsorption oil in inorganic and organic pores.
Energies 17 01358 g008
Figure 9. Core mass test results before and after centrifugation.
Energies 17 01358 g009
Figure 10. Core NMR test results before and after centrifugation.
Energies 17 01358 g010
Table 1. Fluid components and thermodynamic properties.
ComponentsMole Fraction, %Critical Temperature, KCritical Pressure, MPaAcentric FactorMolecular Weight, g/molCritical Volume, m3/molRelative Density
N21.86126.203.460.0428.010.090.81
CO23.98304.197.3820.2344.010.090.82
C154.84190.564.5990.0116.040.100.30
C2–C523.55352.094.4520.1440.070.180.44
C6–C104.59582.042.8050.32111.180.430.75
C11–C207.90721.121.790.54204.960.800.83
C21–C302.94833.441.2570.80327.191.310.88
C31+0.32906.970.9180.92428.961.740.92
Table 2. Fluid distribution and phase state in different scale flow spaces.
Type of Porous MediaRange of Pore RadiusFluid DistributionPhase State
Nanopores2–50 nmHydrocarbonCondensate gas state
Shale bedding fracture100 nm–5000 nmHydrocarbon, a small amount of fracturing fluidVolatile oil state
Hydraulic fracture>1 mmFracturing fluid, a small amount of hydrocarbonBlack oil state
Table 3. Movable fluid saturation of GY-10HC in Gulong shale oil reservoir.
Well NameSubzoneT2 Cutoff Value Method—S1T2 Area Method—S2Mass of Cores Method—S3Movable Fluid Saturation S
GY-10HCQ115.87%12.95%10.51%11.73%
Q316.34%12.72%10.32%11.52%
Disclaimer/Publisher’s Note: The statements, opinions and data contained in all publications are solely those of the individual author(s) and contributor(s) and not of MDPI and/or the editor(s). MDPI and/or the editor(s) disclaim responsibility for any injury to people or property resulting from any ideas, methods, instructions or products referred to in the content.

