Article

Numerical Simulation on Two-Phase Ejector with Non-Condensable Gas

1
Science and Technology on Thermal Energy and Power Laboratory, Wuhan 430205, China
2
Wuhan Second Ship Design and Research Institute, Wuhan 430205, China
*
Author to whom correspondence should be addressed.
Energies 2024, 17(6), 1341; https://doi.org/10.3390/en17061341
Submission received: 12 February 2024 / Revised: 3 March 2024 / Accepted: 7 March 2024 / Published: 11 March 2024
(This article belongs to the Special Issue Advances in Numerical Modeling of Multiphase Flow and Heat Transfer)

Abstract

:
The two-phase ejector is a simple and compact pressure boosting device and widely used in ejector steam-generator water feeding systems and core emergency cooling systems. The direct contact condensation of water and steam is the key process of a two-phase ejector. Usually, the high-temperature and high-pressure steam will inevitably induce non-condensable gases. The existence of non-condensable gases will reduce the condensation heat transfer rate between steam and water, and harm the equipment. This study carried out 3D numerical simulations of a two-phase ejector based on an inhomogeneous multiphase model. The steam inlet pressure and the non-condensable gas mass fraction rang in 0.6–2.9 MPa and 1–10%, respectively. The heat and mass transfer characteristics were analyzed under different conditions. The results show that the heat transfer coefficient and plume penetration length increased with the steam inlet pressure. Non-condensable gas prevents direct contact condensation between the steam and water. The non-condensable gas mass fraction rises from 1% to 10%, the heat transfer between steam and water deteriorates, and leads to a lower heat transfer coefficient.

1. Introduction

The vapor–liquid two-phase ejector is a simple and compact pressure-boosting device without moving parts and external energy input. It could be used in reactor steam generator water-feeding systems and core emergency cooling systems. The steam-water direct contact condensation is the core process for the vapor-liquid two-phase ejector. The phenomenon of direct contact condensation between steam and subcooled water is widespread in industry. Understanding the process and mechanism of direct contact condensation is of great importance. Due to problems such as the inability to completely deoxygenate and the leakage of steam supply pipelines, a small amount of non-condensable gas will inevitably be induced into the high-temperature and high-pressure steam. And the non-condensable gas is difficult to completely remove. The existence of non-condensable gas will reduce the condensation rate between steam and water, thus jeopardizing the safe operation of the related equipment. According to the results of numerical simulations and experiments [1,2,3,4,5,6], as low as 1% mass fraction of the non-condensable gas can reduce the heat transfer coefficient by a maximum of 40%. Therefore, evaluating the effects of non-condensable gas on the steamwater direct contact condensation process is of great importance for safety designs and operations.
Past research on the vapor-liquid two-phase ejector mainly focused on the effects of operating conditions and structural parameters, such as steam inlet pressure, temperature, steam nozzle area and mixing chamber area on the performance of the ejector [7,8,9]. There are fewer studies on the effects of non-condensable gas. Two-phase ejector condensation with non-condensable gas has been investigated by researchers through experimental and theoretical methods. Liu et al. [10] conducted experiments for evaluation of the main frequency and intensity of pressure oscillations of steam jets containing non-condensable gases. When the air mass fraction is less than 5%, the main frequency and intensity of pressure oscillations decrease rapidly with the increase in the water temperature and air content. With the air content increasing, the air forms thermal resistance on the steam-water surface, and the heat transfer coefficient decreases. The detachment diameter of the air mass at the nozzle outlet also gradually increases and the growth cycle becomes longer. Cong et al. [10,11] conducted experimental studies on the impact of a submerged steam jet with non-condensable gas. The results show that non-condensable gas has a very important influence on the intensity of condensation pressure oscillation of a submerged steam jet. Non-condensable gas will affect the direct contact condensation heat transfer coefficients, thereby affecting the jet condensation oscillation frequency and flow characteristics. When the steam contains non-condensable gas, the pressure oscillation frequency is significantly smaller than that of pure steam. Based on the data of the NHR-200 reactor, Ma et al. [12] studied the condensation containing non-condensable gas under high pressure. When the steam pressure ranges from 0.21 MPa to 4.12 MPa, the condensation heat transfer coefficient increases with the pressure. Similar to the experimental results under low pressure conditions, adding non-condensable gas will weaken the condensation heat transfer effect. Qu et al. [13] investigated the steam-water direct contact condensation with non-condensable gas and a small steam ejector diameter. The steam mass flow rate was within 250 kg/m2/s, and the air content was less 10%. When the air mass fraction increases, the decreasing trend of the air volume fraction along both the axial and radial directions slows down. The reason may be that the non-condensable gas will worsen the steam-water condensation, and make the steam plume wider and longer. When the non-condensable gas volume is low, the variations in the subcooled water temperature and non-condensable gas mass fraction have more obvious impacts on the gas content distribution.
With the development of computational technology, numerical simulations have been greatly improved, and it has become one of the main methods for two-phase flow ejector research. Zhou et al. [14,15] obtained different steam plume shapes in a sonic and supersonic submerged steam jet in subcooled water. Zhou et al. [16,17] adopted three-dimensional steady-state simulations to investigate the influence of non-condensable gas on condensing jets. A phase change model of non-condensable gas based on thermal equilibrium was proposed, and it has been validated by the experimental results. As the non-condensable gas volume fraction increases, the penetration length of the steam plume becomes longer, and the air volume fraction reaches a maximum at the end of the steam plume due to steam condensation. Tan et al. [18] established a steam–water condensation model with non-condensable gas under high pressure conditions, and the impact of the mass fraction of non-condensable gas on condensation heat transfer under different pressure was studied. The model was corrected to make the results more accurate. This model provides a theoretical basis for steam condensation experiments under high pressure. Geng et al. [19] conducted numerical simulations on steam–water gas convective condensation heat transfer under a pressure of 10 MPa with non-condensable gas, and the influences of different proportions of non-condensable gas on water–steam condensation heat transfer under a pressure of 10 MPa have been obtained. The partial pressure of steam decreases when the non-condensable gas fraction is increased and results in a significant decrease in the saturation temperature of steam. The presence of non-condensable gas has a suppression effect on the steam–water condensation heat transfer. The thermal conductivity of steam and non-condensable gas under high pressure is greater than that at normal pressure. The density of steam is much greater than that at normal pressure. And the condensation rate increases with the steam density. Therefore, the suppression effect of steam–water direct contact condensation with non-condensable gas under high pressure is weakened. At the same time, there are many factors such as boundary conditions, flow parameters and fluid properties that may have effects on the numerical simulation. Two different uncertainty quantification methods are applied to analyze the exhaust gas plume in a crosswind [20]. Xia et al. [21] introduce a non-intrusive polynomial chaos (NIPC) model. Comparing it with the MC methods, the uncertainty quantification results show that the NIPC method is more effective than the MC method.
Although some research on direct contact condensation has been carried out, the research on the non-condensable gas content of steam–water direct contact condensation is not totally comprehensive, and the energy and mass transfer performance has not yet been fully understood. In order to further reveal the heat transfer mechanism and evaluate the influence of the non-condensable gas fraction on steam–water direct contact condensation, this paper developed a steam–water condensation model based on a two-resistance model, and conducted three-dimensional simulation of the steam–water two-phase ejector. The effects of non-condensable gas content on two-phase direct contact condensation were analyzed.

2. Numerical Simulation Model

2.1. Governing Equation

A heterogeneous two-fluid model is adapted; the liquid phase (water) is the continuous phase and the vapor phase (steam) the discrete phase, represented by the subscripts w and s, respectively. And the mass, momentum, and energy interfacial transfers are considered. Since the vapor and liquid phases have the same form in the governing equations, only the liquid phase equations are listed below.
The continuity equation of the liquid phase is shown:
t ( α w ρ w ) + · ( α w ρ w U w ) = m gw
where  α w  represents the volume fraction of water,  ρ w  represents the density of water, Uw represents the velocity of water, and  m gw  is the mass flow rate from phase to phase. There are only two phases in this simulation;  α a  represents the volume fraction of the vapor phase, so the sum of the volume fractions can be expressed as
α w + α s = 1
The liquid phase momentum equation is as follows:
t ( α w ρ w U w ) + · ( α w ( ρ w U w U w ) ) = α w p w + · ( α w μ effw ( U w + ( U w ) T ) ) + ( m gw + U g m wg + U w ) + S Mw + M w
where SMw and  M w  represent the momentum sources due to interfacial interactions,  μ effw  represents the viscosity of water, and  m gw + U g m wg + U w  represents the momentum transfer induced by condensation.
The liquid phase energy equation is as follows:
t ( α w ρ w e w ) + · ( α w ρ w U w e w ) = · ( α w λ w T w ) + α w τ w U w + ( m gw + e gs m wg + e ws ) + S Ew + q w
where ew represents the internal energy of the liquid phase,  τ w  represents the stress tensor, SEw and qw represent the transfer of latent heat and sensible heat from the vapor phase to the liquid phase, and  m gw + e gs m wg + e ws  represents the energy transfer induced by condensation.
Considering the influence of non-condensable gas, the composition equation is adopted in the multiphase model. Assuming that steam and air uniformly mixed and the sum of their mass fraction to be only 1, the relevant equations could be expressed as follows:
t ( α g ρ g w s ) + · ( α g ( ρ g U g w s ρ g D effs ( w s ) ) ) = S s
w s + w a = 1.0
where ws represents the steam mass fraction, wa represents the air mass fraction, Deffs represent the effective motion diffusion coefficient of molecules, and Ss represents the source term due to condensation.

2.2. Interfacial Heat and Mass Transfer Model

The thermal phase change model based on a two-resistance model is adopted in this paper. The steam–water heat transfer is divided into two parts: the heat transfers from the steam to the phase interface, and then to the water. Assuming that the steam is saturated or superheated, the non-condensable gas mainly affects the interfacial area rather than the heat transfer coefficient in the process of the heat transfer between the steam and phase interface. Thus, for the gas side, the heat transfer coefficient is usually large enough that the thermal resistance can be neglected for the steam side. Subcooled water and the non-condensable water component are treated as a mixture.
The heat flux transfers from steam to interfacial could be calculated as follows:
Q s = m sw H s
where  m sw  represents the mass transfer from steam to the interface and Hs represents the steam enthalpy at the saturation point.
Q w = m sw H w + h w A sw ( T sat T w )
where Hw represents the enthalpy of the saturated water, hw represents the heat transfer coefficient on the liquid side, Asw represents the phase interfacial area, and Tsat represents the saturation temperature under local partial pressure.
For the liquid side, the heat transfer coefficient could be calculated by Nuwa through the Hughmark model [22].
N u w a = { 2 + 0.6 R e r 0.5 P r w a 0.33               0 R e r < 776.06 , 0 P r w a < 250 2 + 0.27 R e r 0.62 P r w a 0.33           R e r 776.06 , 0 P r w a < 250
where Prwa represents the Prandtl number and Rer represents the relative Reynolds number considering the momentum transfer between water and air, which could be expressed as:
R e r = ρ wa | U g U wa | d g μ wa
where  U wa  represents the mass-weighted average velocity of water and air:
U wa = α w ρ w U w + α a ρ a U a α w ρ w + α a ρ a
Pr w a = α w Pr w + α a Pr a α w + α a
μ wa = α w μ w + α a μ a α w + α a
λ wa = α w λ w + α a λ a α w + α a
The discrete phases in the two-fluid model can be regarded as spherical particles and the interfacial area can be expressed as:
A sw = 6 α ˜ s d g
where  α ˜ s  represents the corrected gas content:
α ˜ s = { max ( α s , α min ) α s α max max ( 1 α s 1 α max α max , α min ) α s > α max
According to the two-resistance model, the phase interface is at a thermal equilibrium state, so  Q s = Q w . The interfacial mass transfer can be obtained as follows:
m sw = h w A sw ( T sat T w ) γ sat
where  γ sat  represents the latent heat under local partial pressure.

2.3. Interfacial Momentum Transfer Model

The interfacial momentum transfer considers the effects of drag force and turbulent dispersion force. The drag force is calculated as follows:
M Dgw = 0.75 C D d g α g ρ w | U g U w | ( U g U w )
where CD represents the drag coefficient, and can be calculated by the Schiller–Naumann drag model:
C D = max ( R e r 24 ( 1 + 0.15 Re r 0.687 ) , 0.44 )
The turbulent dispersion force is calculated by the Lopez de Bertodano model:
M w TD = M g TD = C TD ρ w k w α w
where  M w TD  and  M g TD  represent the turbulent dispersion force acting on the liquid phase and vapor phase, respectively, and  C TD  represents the turbulent dispersion coefficient, which is taken as 0.3 in this paper.

2.4. Turbulence Model

The RANS model, the standard k-ε model, is used to describe the turbulent flow of steam–water direct contact condensation. This model is the most commonly used two-equation model. It is a semi-empirical formula obtained from experimental results, which is suitable for fully developed complete turbulence and can ensure reasonable accuracy in engineering applications.
The vapor phase is treated as the discrete phase, and the zero-equation model is used. The correlation formula of the turbulent kinematic viscosity of the discrete phase and the continuous phase liquid phase can be expressed as follows:
μ t g = ρ g μ t w ρ w
where  μ t g  represents the turbulent kinetic viscosity of the vapor phase and  μ t w  represents the turbulent kinetic viscosity of the liquid phase.
The standard k-ε model is adopted for the liquid phase.
t ( α w ρ w k w ) + ( α w ( ρ w k w U w ( μ + μ t w σ k ) k w ) ) = α w ( p w ρ w ε w )
t ( α w ρ w ε w ) + ( α w ( ρ w ε w U w ( μ + μ t w σ ε ) ε w ) ) = α w ε w k w ( C ε 1 p w C ε 2 ρ w ε w )
The turbulent kinetic energy of the liquid phase can be expressed as follows:
μ t w = C μ ρ w k w 2 ε w
where kw represents the turbulent kinetic energy,  ε w  represents the turbulent energy dissipation rate, Cμ = 0.09, Cε1 = 1.44, Cε2 = 1.92, σk = 1.0, and σε = 1.3.

2.5. Geometric Structure and Mesh

Figure 1a shows the geometric structure of the simulated ejector, with the steam inlet in the center and water inlet around the circumference. Table 1 shows the boundary conditions and solution settings, the outlet diameter of the ejector steam nozzle is 4 mm, the throat diameter 10 mm, the throat nozzle distance 40 mm, and the outlet diameter 20 mm. For multiphase flow simulations, high-quality meshes are a necessity to ensure convergence. ICEM CFD18.0 is used to generate the structured grids. As the flow field parameters vary drastically due to the mixing of vapor and liquid around the the steam nozzle, which is a key area for flow and condensation, so the grid near the nozzle outlet is locally refined, as shown in Figure 1b. The maximum size of the grid is 2 mm, the minimum size is 0.2 mm, and the grid quality is all higher than 0.65.

2.6. Boundary Conditions and Solution Settings

The inlet boundary of water and steam is set to be the mass flow inlet, the outlet an open boundary, and the pressure 500 kPa. The wall is set to be an adiabatic no-slip wall boundary condition, and the near-wall area uses a scalable wall function. The physical properties of steam and water are selected from IAPWS-IF97. Air is treated as an ideal gas and other thermal-physical properties are taken as fixed values under atmospheric pressure. The interfacial mass transfer is embedded into ANSYS CFX through a user-defined expression (CEL). The first-order upwind scheme is used to discretize the turbulence equations, and the remaining governing equations adopt higher-order discretization schemes. The initial calculation area is all a liquid phase. As the calculation proceeds, steam gradually enters from the nozzle and condenses. The calculation is solved using a double precision steady-state solver.

2.7. Mesh Independence Test and Model Validation

The mesh independence test is carried out firstly. The non-condensation gas content is 3%, the inlet steam mass flow 0.015 kg/s, the inlet water mass flow 0.2 kg/s, and the water temperature 300 K. As shown in Figure 2, when the meshes reach 294,480, the maximum error is less than 3%. Considering the computational cost resources and the accuracy, the mesh number of 294,480 was selected for this paper.
In addition, to evaluate the simulation accuracy, the simulation results would be compared to the experiment results of Qu [23]. As shown in Table 2, the simulation result of the secondary flow inlet pressure is 109.3 kPa, and the experiment result of the secondary flow inlet pressure is 103.04 kPa. The relative error is 6.1%, which proves that the numerical model is reliable and reasonable [24,25].

3. Results and Discussion

3.1. Analysis of Flow Filed Parameters at Different Steam Inlet Pressures

3.1.1. Void Fraction Distribution

At present, there are few visual experimental studies on a vapor-liquid two-phase flow ejector. Through numerical simulation, the distribution of gas content in the vapor-liquid two-phase flow can be more easily studied. The distribution of gas content under different steam inlet pressures is shown in Figure 3. The penetration length of the steam plume of the ejector continues to lengthen with the steam inlet pressure, the expansion width increases slightly, and the gas–liquid phase interface area also increases. As the inlet steam pressure increases, the original condensation surface area is no longer enough to condense all the steam, so the steam plume penetration length also increases to ensure a sufficient condensation surface area to condense all the steam.

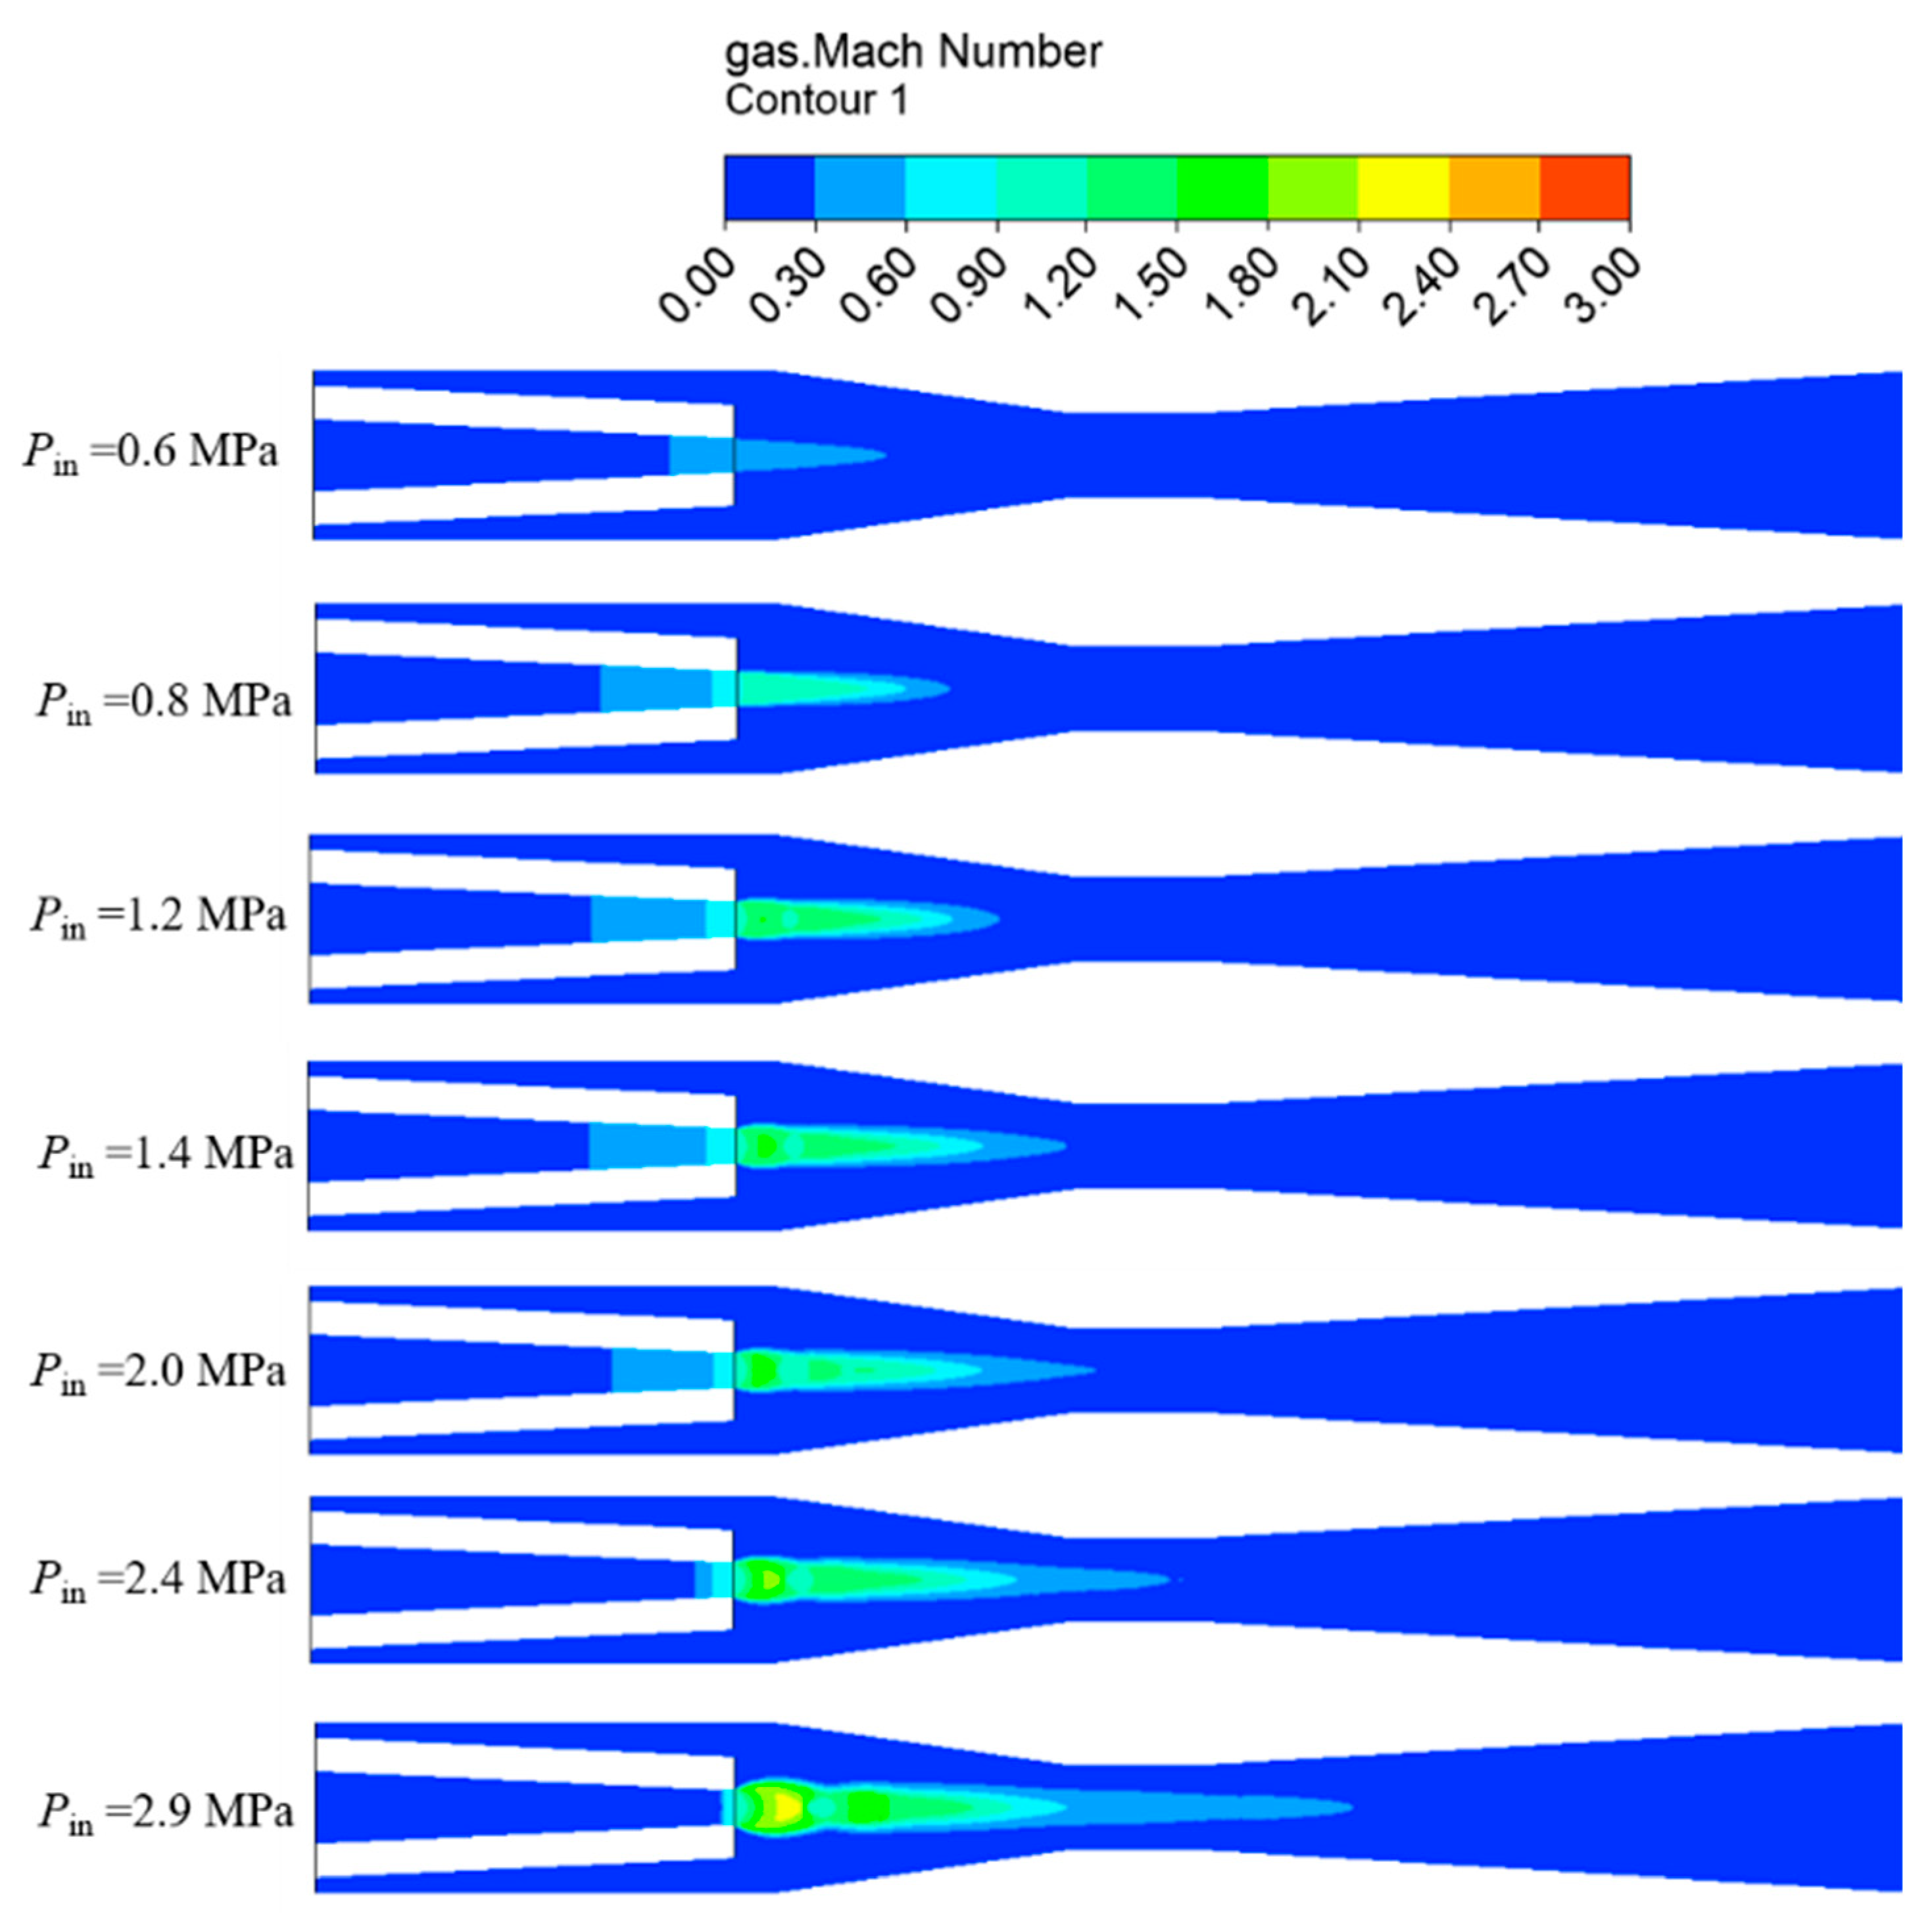
3.1.2. Distribution of Vapor-Liquid Two-Phase at Different Velocity

Since the heterogeneous two-phase flow model is used for calculation, the velocity field distributions of the vapor phase and liquid phase are obtained, respectively. Figure 4 and Figure 5 show the contours of vapor phase velocity distribution and the contours of liquid phase velocity distribution, respectively, under a different non-condensable gas mass fraction. As the inlet steam pressure continues to increase, the length of the jet formed by the velocity of the vapor and liquid phases also continues to increase, and the maximum velocities of the vapor and liquid phases also increase, respectively.
Figure 6 shows the contours of the gas Mach number distribution under different inlet steam pressures. When the inlet steam pressure is low, the flow is in a subsonic state, and the lower-speed steam forms a shrinking steam plume under the condensation of water. As the steam pressure continues to increase, the internal pressure of the steam plume is greater than the pressure of the surrounding subcooled water, so the plume steam will further expand. During the steam expansion process, the pressure decreases rapidly and the speed quickly increases to supersonic speed. When the pressure is further reduced until it is lower than the pressure of the surrounding subcooled water, under the steam condensation and the obstruction of the steam flow by the surrounding subcooled water, a compression wave is generated inside the steam plume. The pressure inside the steam plume increases, the speed decreases, and the temperature increases. As it rises, the flow direction turns inward, the steam plume stops expanding and gradually begins to shrink, and the flow also decreases from supersonic speed to subsonic speed. When the inlet steam pressure continues to increase, the penetration length of the jet formed by the gas Mach number also continues to increase, resulting in an increase in the mass flow rate of the steam in the nozzle. While the temperature of the water remains unchanged, the corresponding condensation capacity of the subcooled water remains unchanged. Therefore, more steam requires a larger condensation surface area, which is consistent with the gas content distribution in Section 3.1.1.

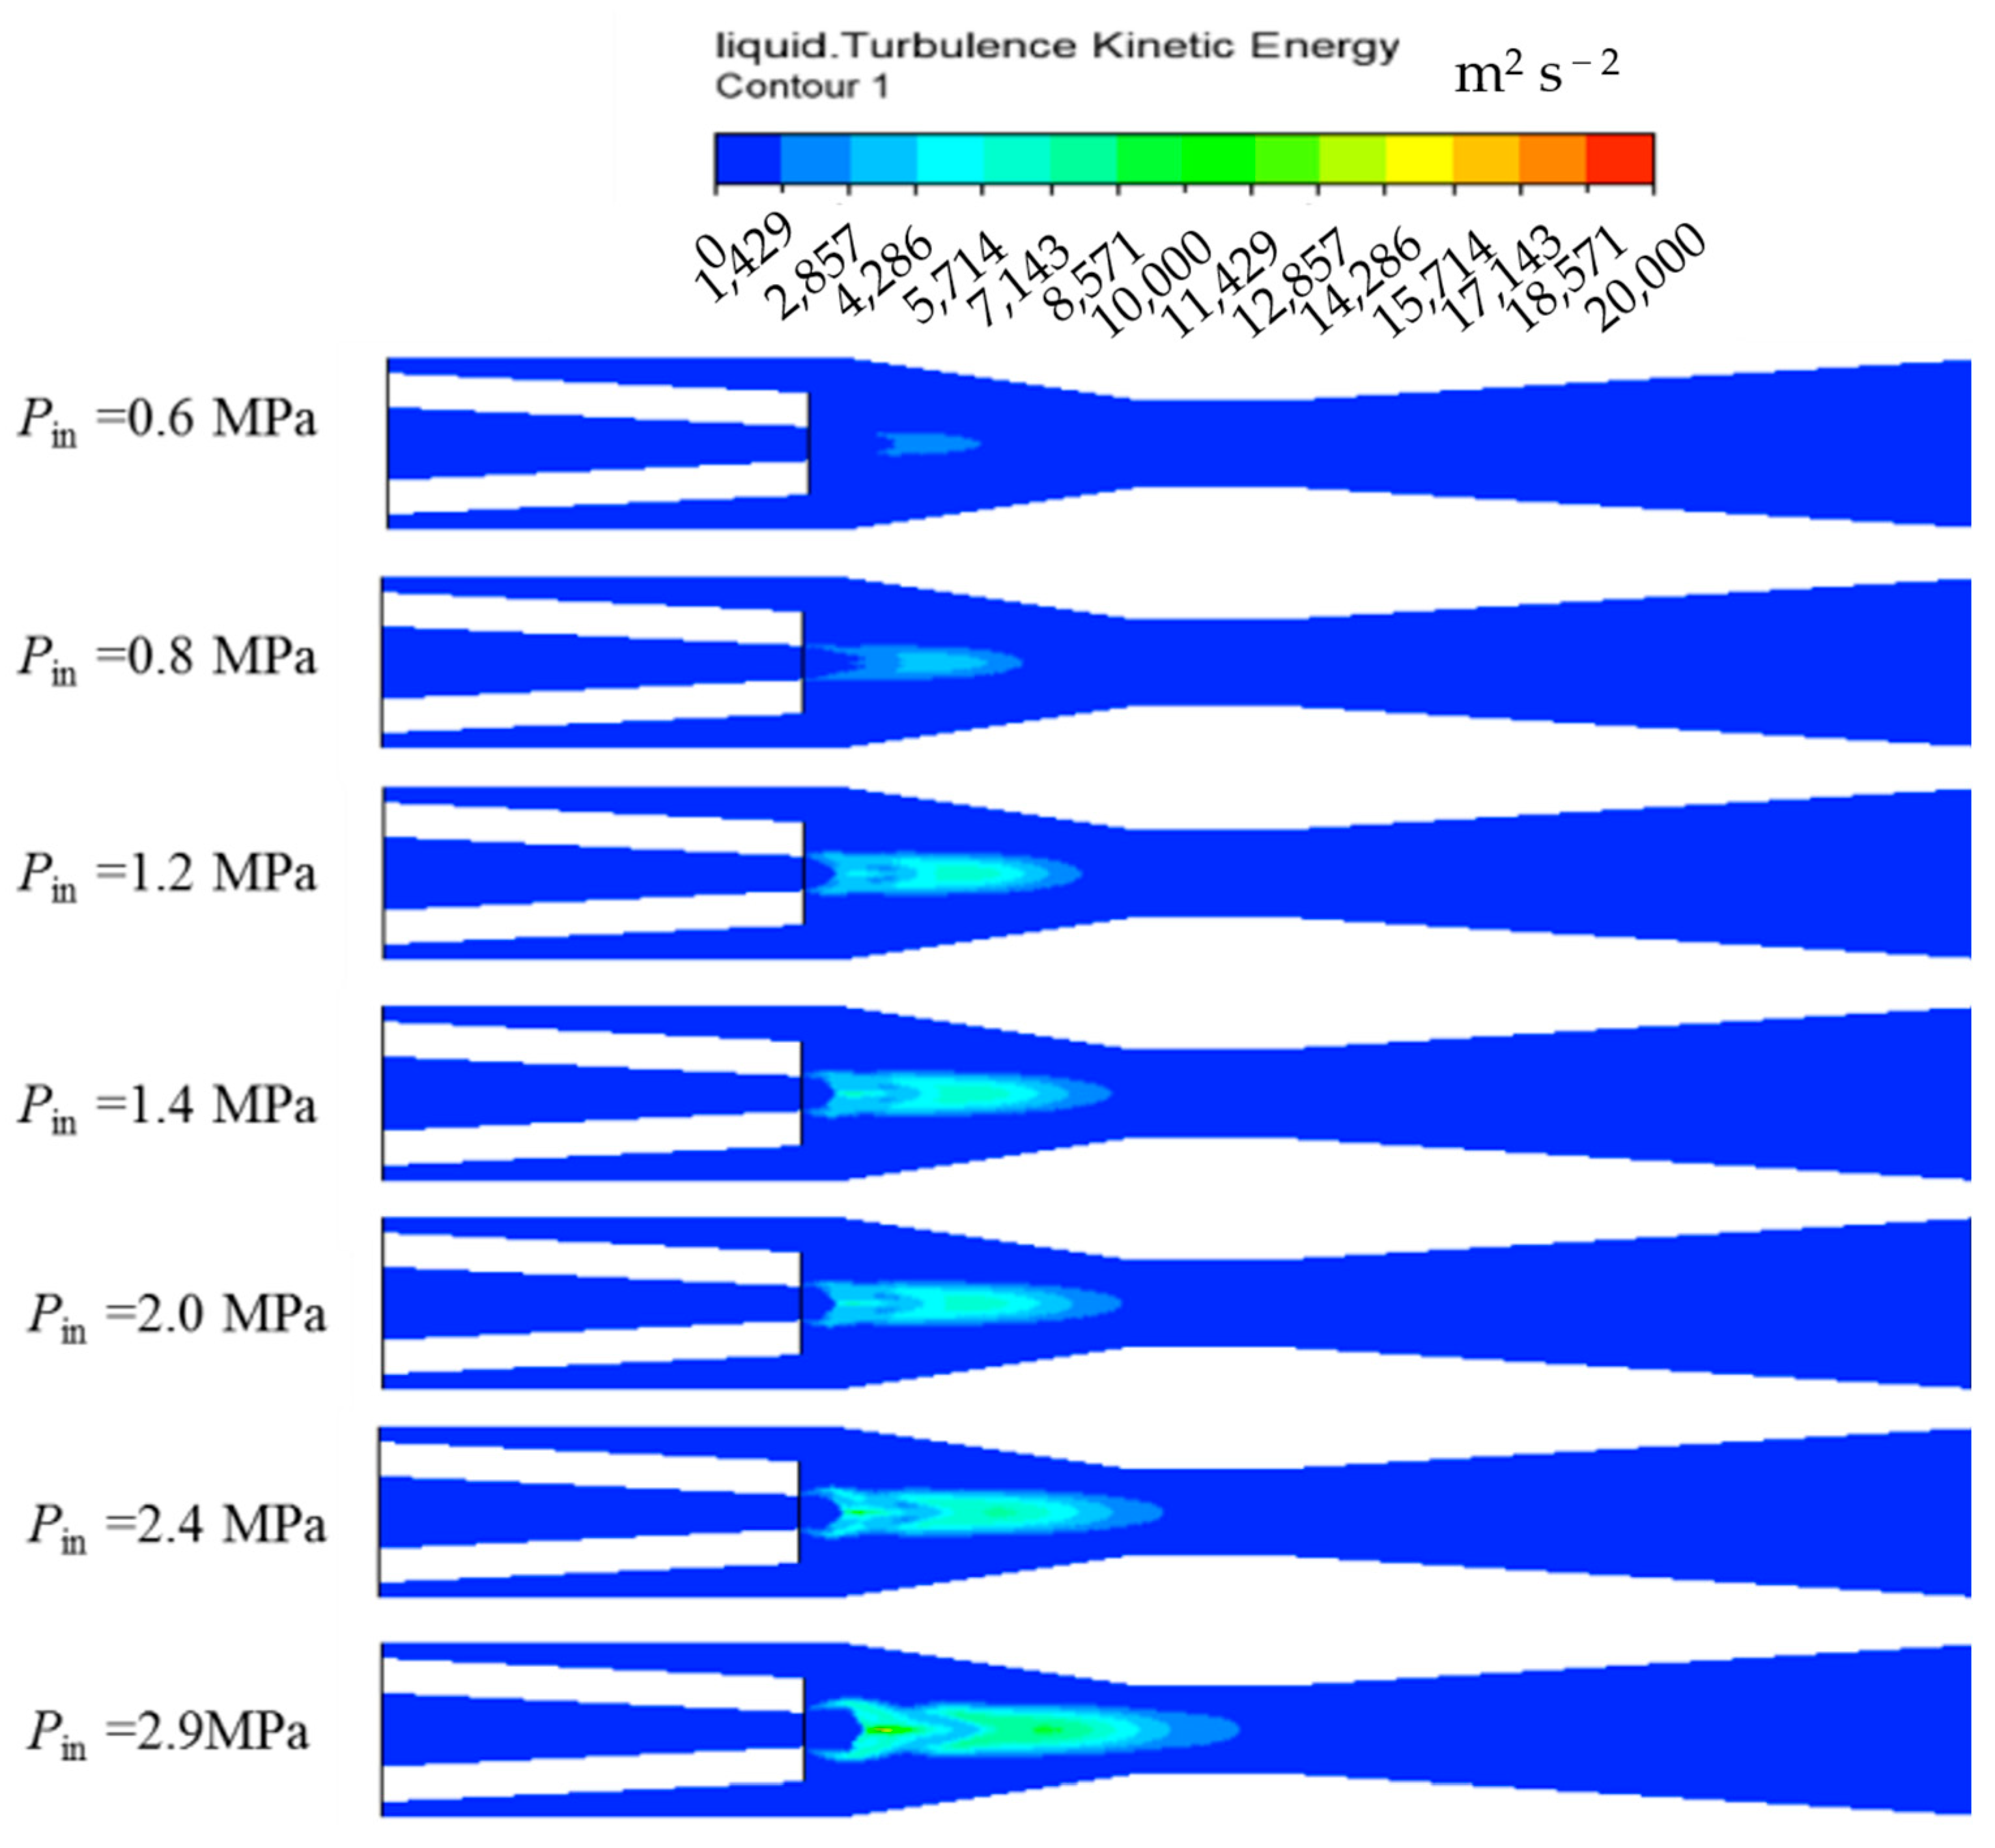
3.1.3. Contours of Turbulent Kinetic Energy

The distribution of liquid phase turbulent kinetic energy under different steam inlet pressures is shown in Figure 7. With the increase in the steam inlet pressure, the steam flow rate also increases, which promotes the condensation heat transfer process between the vapor and liquid phases. The original condensation surface area is no longer enough to completely condense the steam with the increases in the steam inlet pressure, and the length of the steam plume jet increases. At the same time, the maximum turbulent kinetic energy of the liquid phase also increases.

3.2. Analysis of Heat and Mass Transfer Characteristics at Different Steam Inlet Pressures

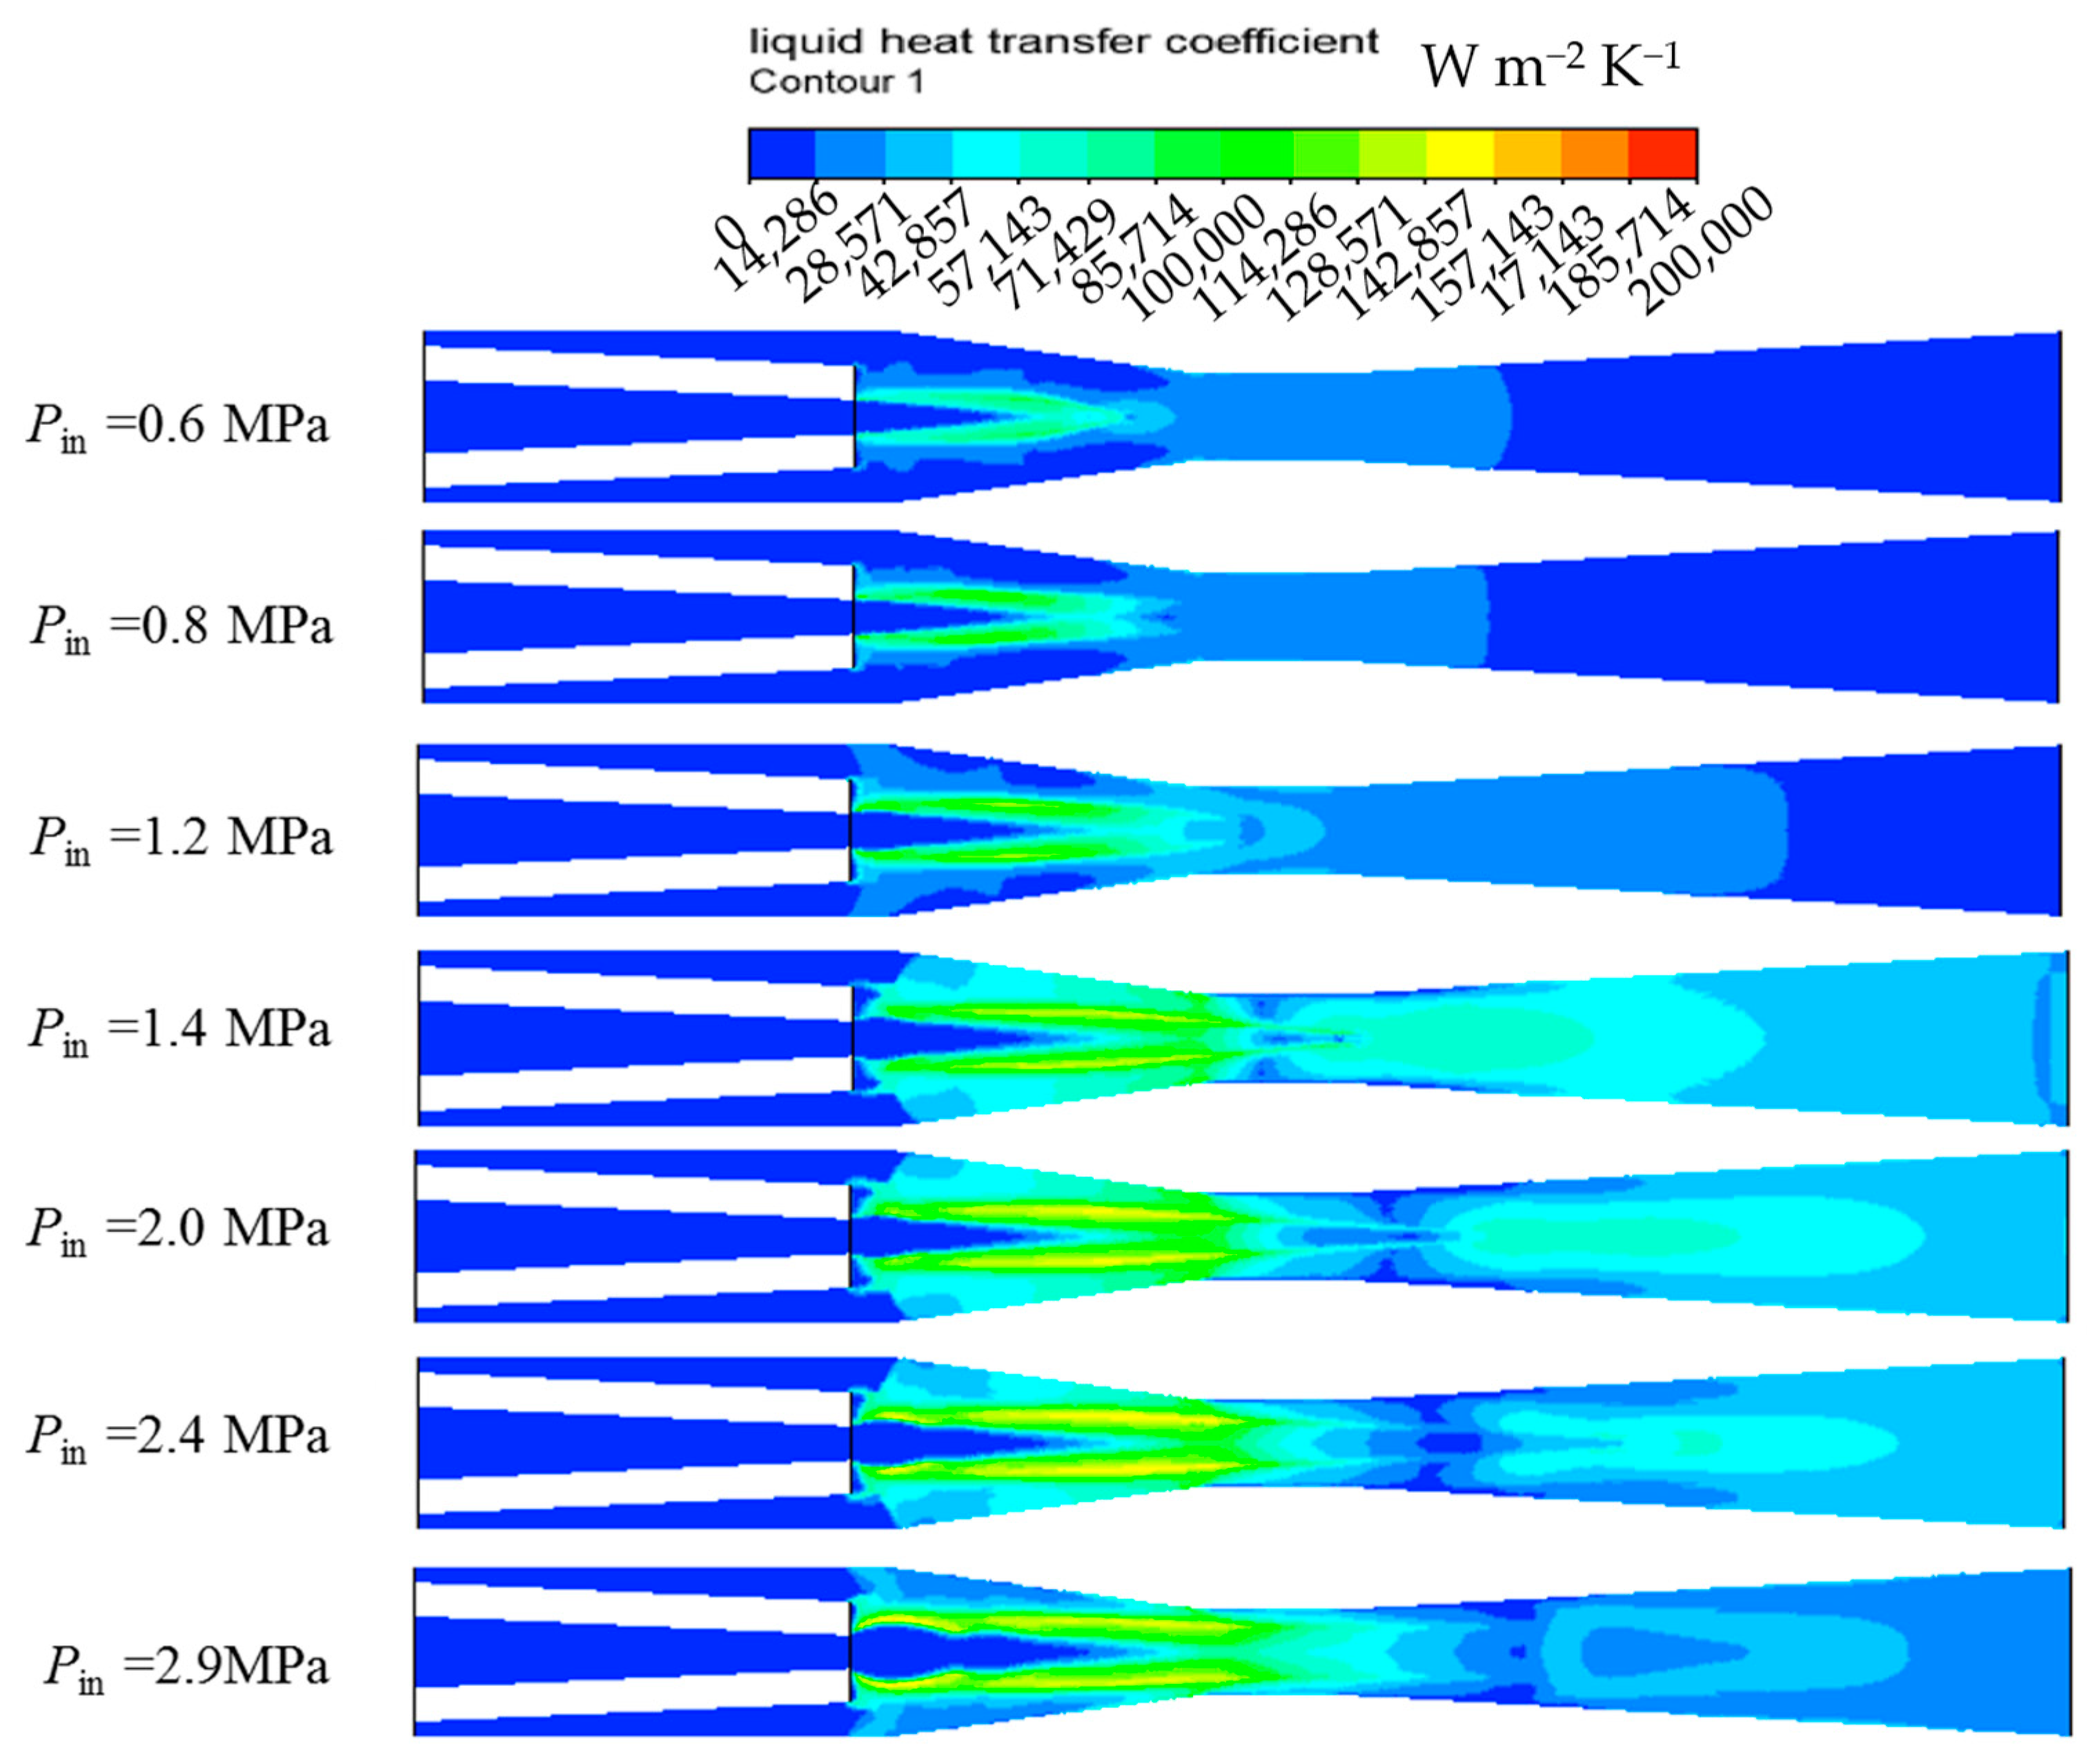
3.2.1. Heat Transfer Characteristics

Figure 8 shows the distribution of local heat transfer coefficient contours under different inlet steam pressures. The local heat transfer coefficients increase with the inlet pressure. Additionally, the steam flow rate also increases, which leads to an increase in the relative Reynolds numbers of the vapor and liquid phases. According to Equations (9) and (10), the Nusselt number on the liquid phase side and the local heat transfer coefficient increase with the relative Reynolds number of the vapor and liquid phases.

3.2.2. Mass Transfer Coefficient

The steam condensation rate is a direct reflection of the interphase mass transfer ability; it is also the fundamental factor affecting the steam plume penetration length and steam plume width. The contour of the steam condensation rate at different steam inlet pressures is shown in Figure 9. The steam condensation rate in the two-phase region increases with the steam inlet pressure. The reason is that when the steam inlet pressure increases, on the one hand, the Nusselt number on the liquid side increases as the steam mass flow rate increases, and the heat transfer coefficient on the liquid side also increases, thereby increasing the mass transfer rate; on the other hand, the saturation of the steam temperature also increases with the inlet steam pressure. When the temperature of the subcooled water remains unchanged, the heat exchange temperature difference and the mass transfer rate increase. As the steam mass flow rate increases, more steam needs to be condensed. The growth rate of the inlet steam mass flow rate is greater than the growth rate of the steam condensation rate. To maintain the equilibrium state, the condensation surface area required for steam condensation increases. As the inlet steam pressure increases, the steam plume penetration length gradually becomes longer, which is consistent with the gas volume fraction distribution in Section 3.1.1.

3.3. Analysis of Flow Filed Parameters with Different Non-Condensable Gas Mass Fractions

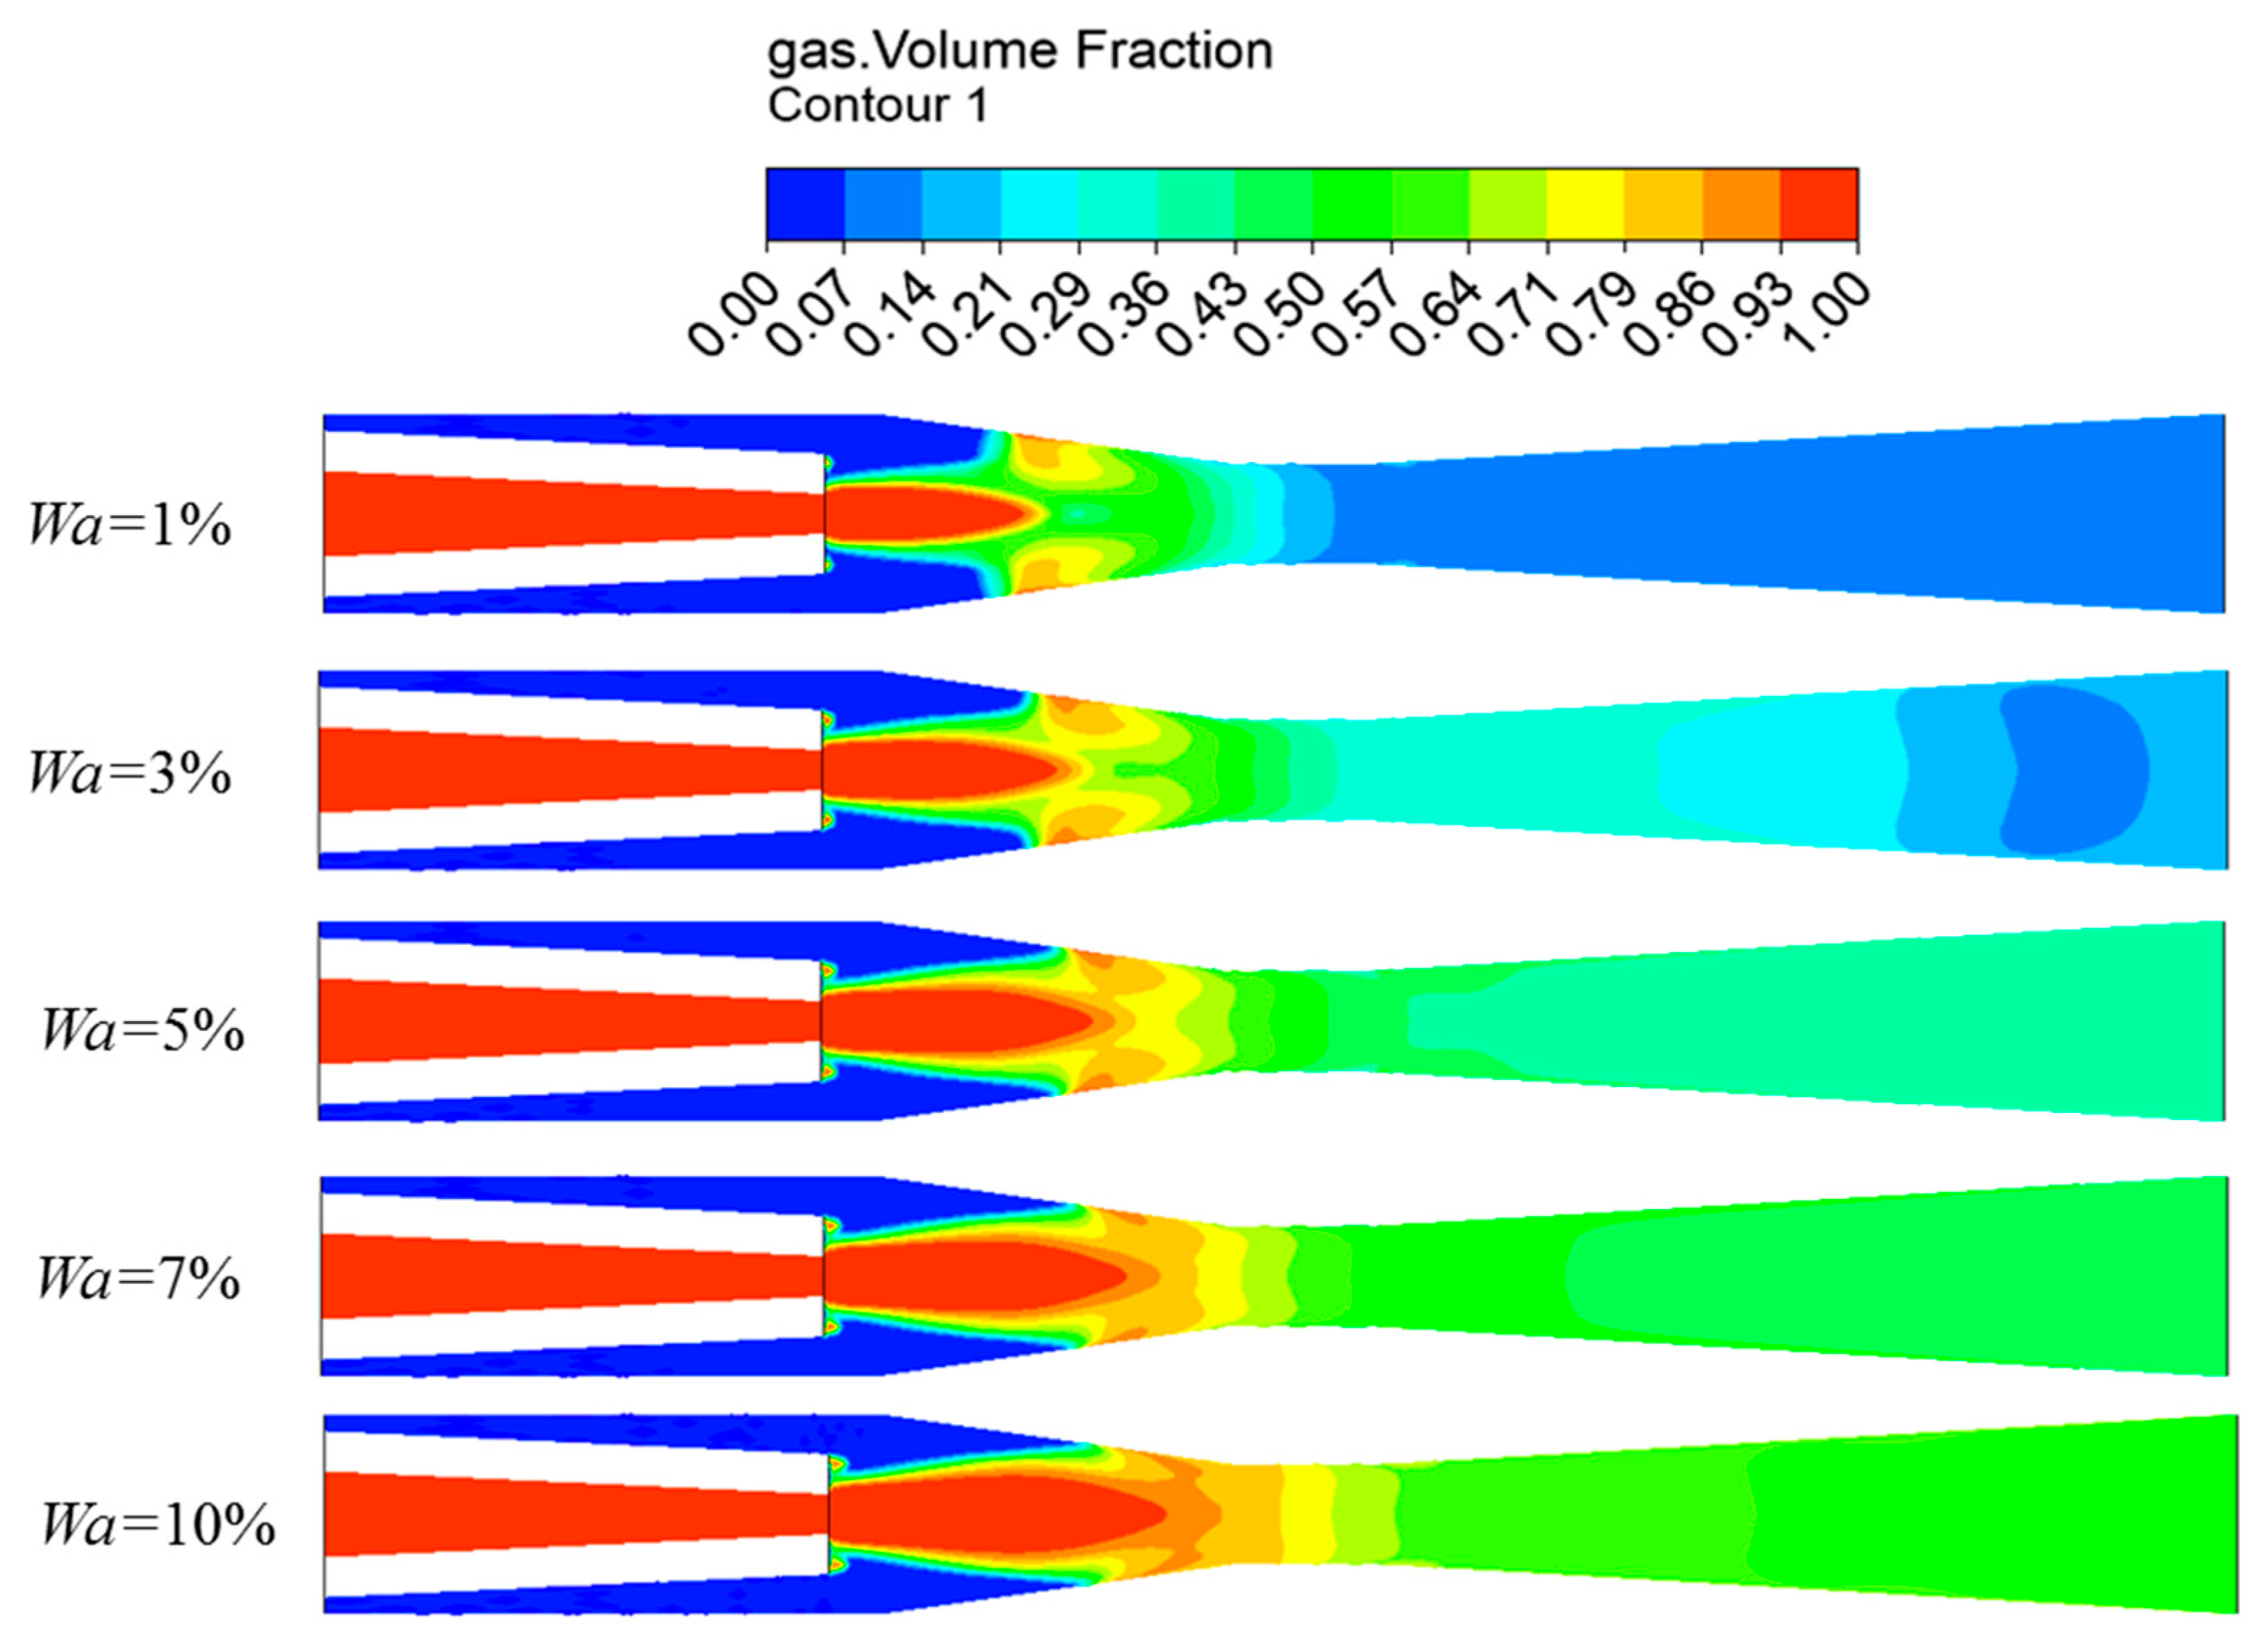
3.3.1. Void Fraction Distributions

When ms = 0.012 kg/s and mw = 0.2 kg/s, the distribution of gas content under different contents of non-condensable gas is shown in Figure 10. The gas volume fraction begins rapidly decreasing after the primary flow leaves the nozzle. As the non-condensable gas content increases, the penetration length of the vapor plume of the ejector continues to become longer and the area of the gas–liquid interface also increases. The existence of non-condensable gas inhibits the exchange of mass, momentum and energy between steam and subcooled water. The condensation rate of steam gradually decreases and the length of the steam plume gradually increases with the volume fraction of non-condensable gas.
When ms = 0.015 kg/s and mw = 0.2 kg/s, the distribution of gas content under different contents of non-condensing gas is shown in Figure 11. It can also be seen that as the volume fraction of non-condensable gas increases, the penetration length of the vapor plume of the ejector continues to become longer, which leads to an increase in the gas–liquid interface area. The increase in the non-condensable gas content further inhibits the heat and mass transfer process between the steam and water in the ejector, the condensation rate of the steam decreases, and the penetration length of the steam plume increases.

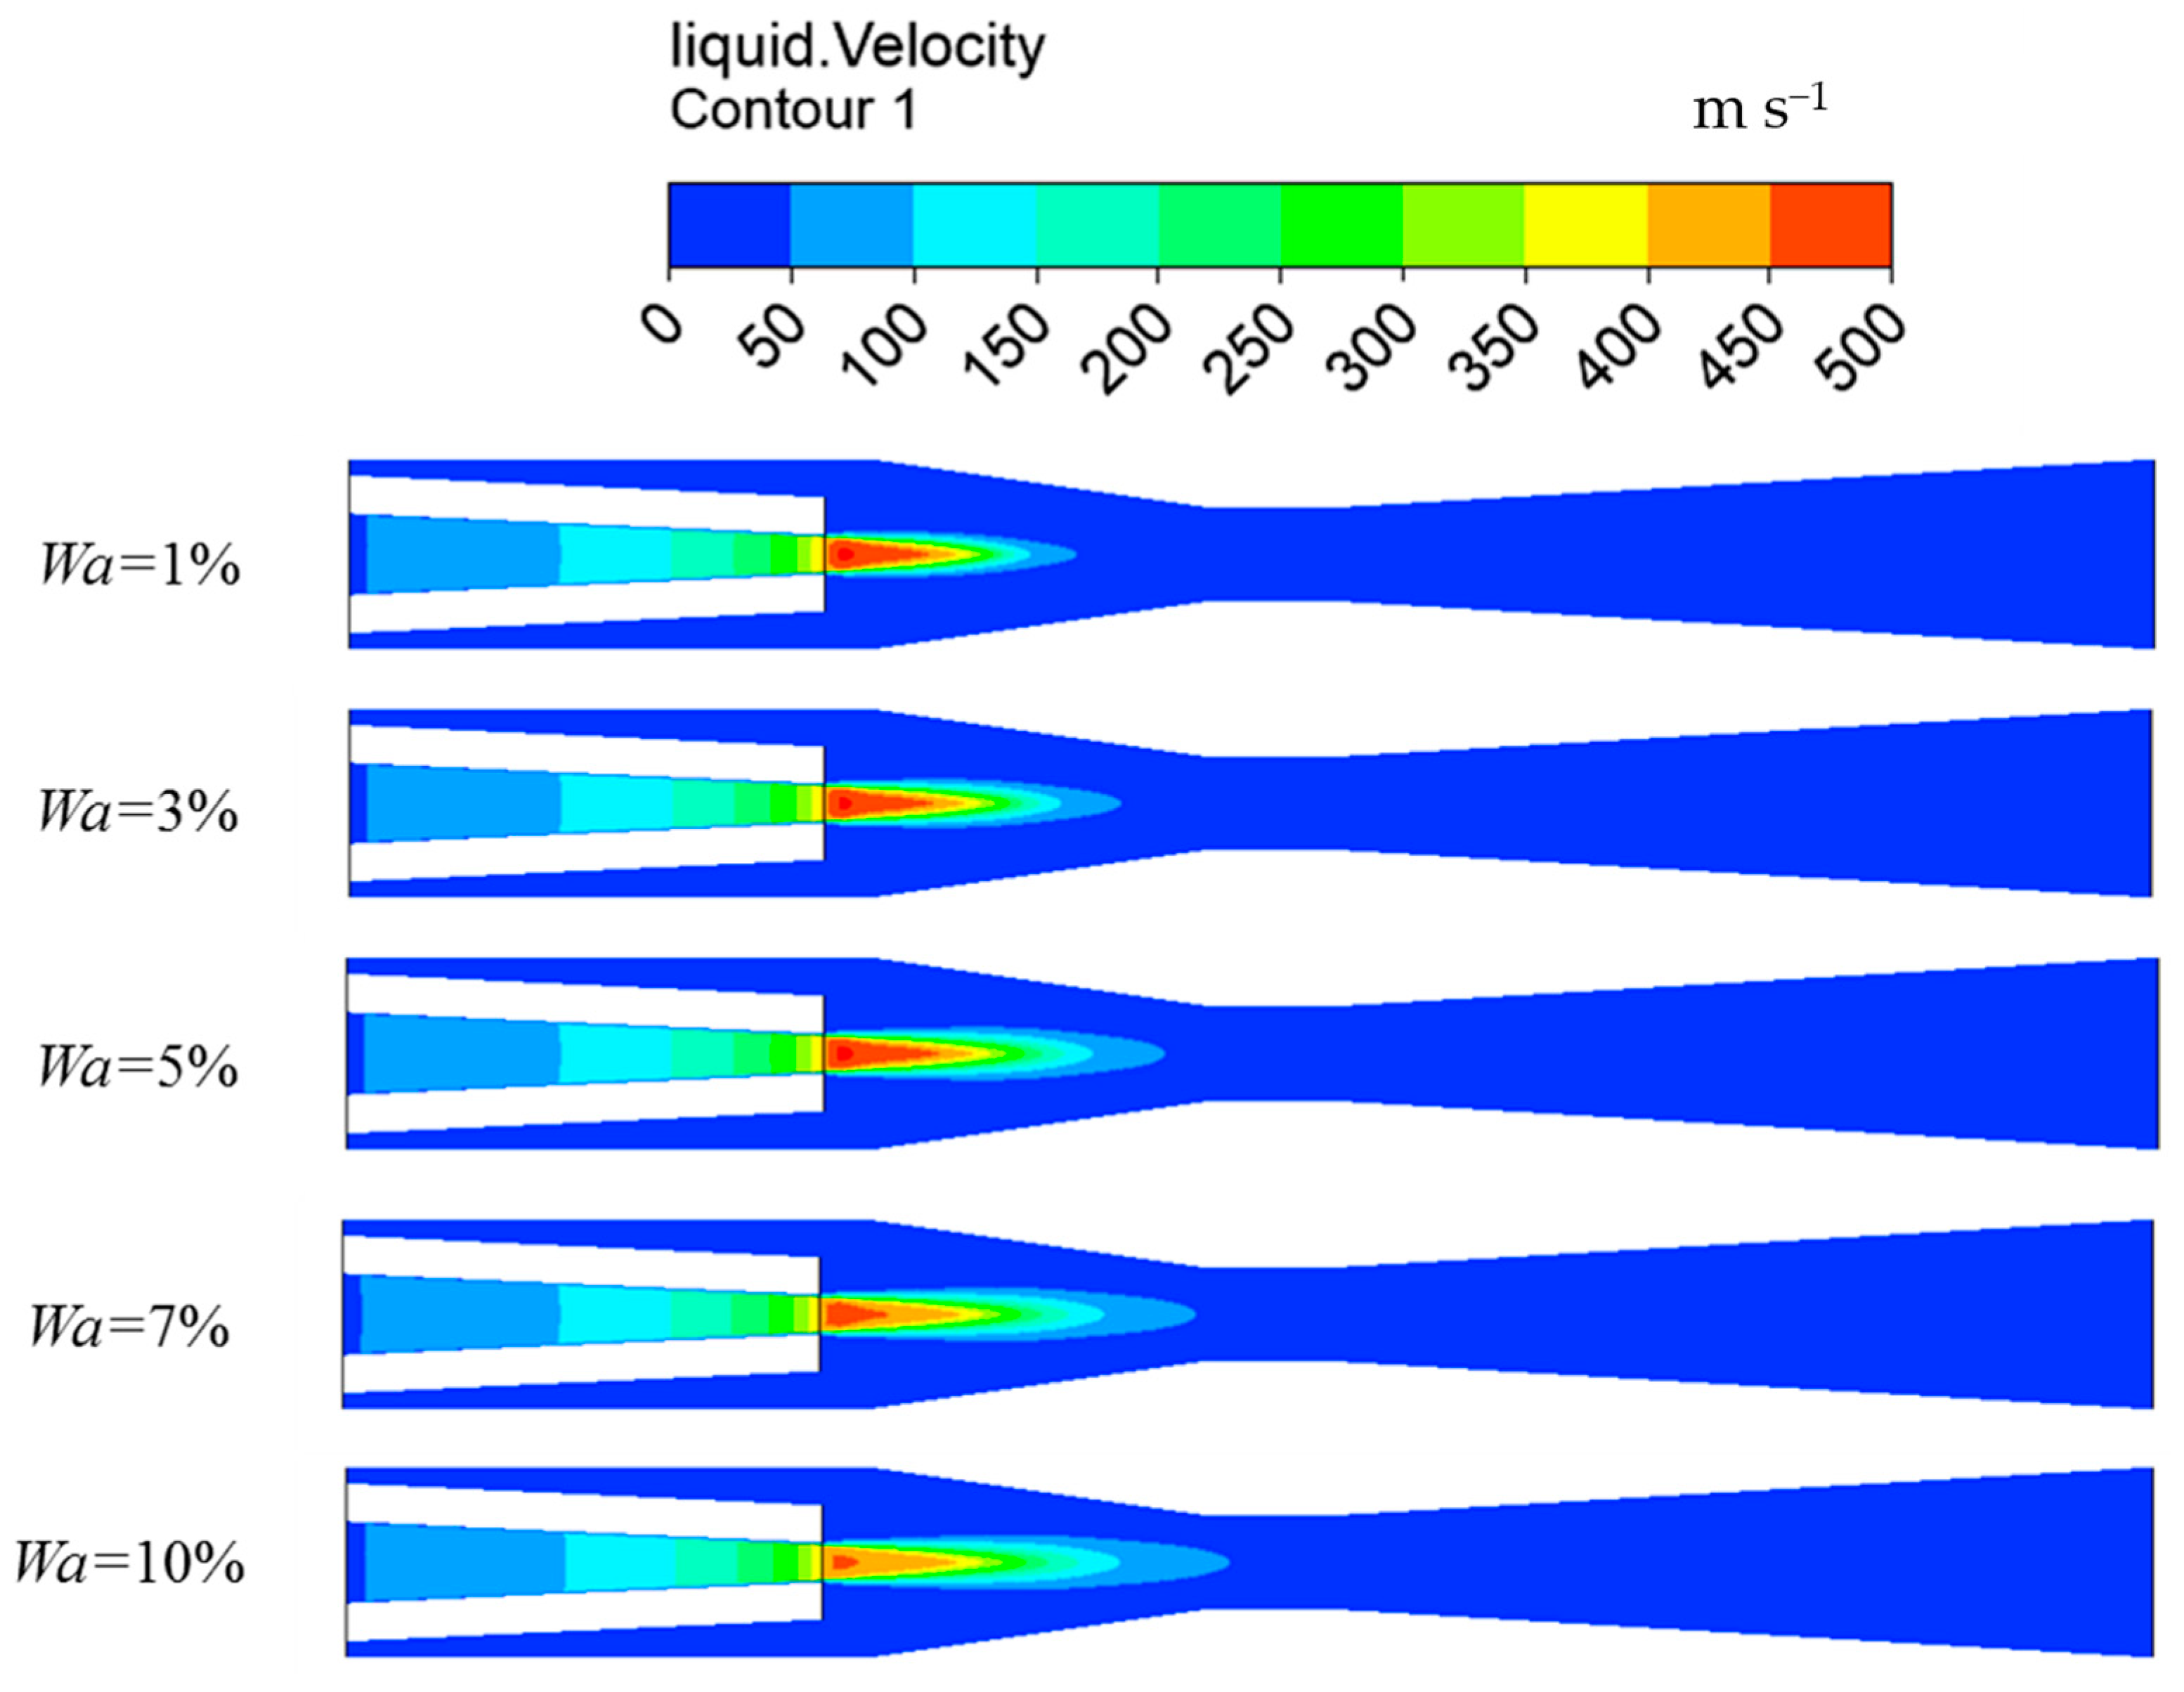
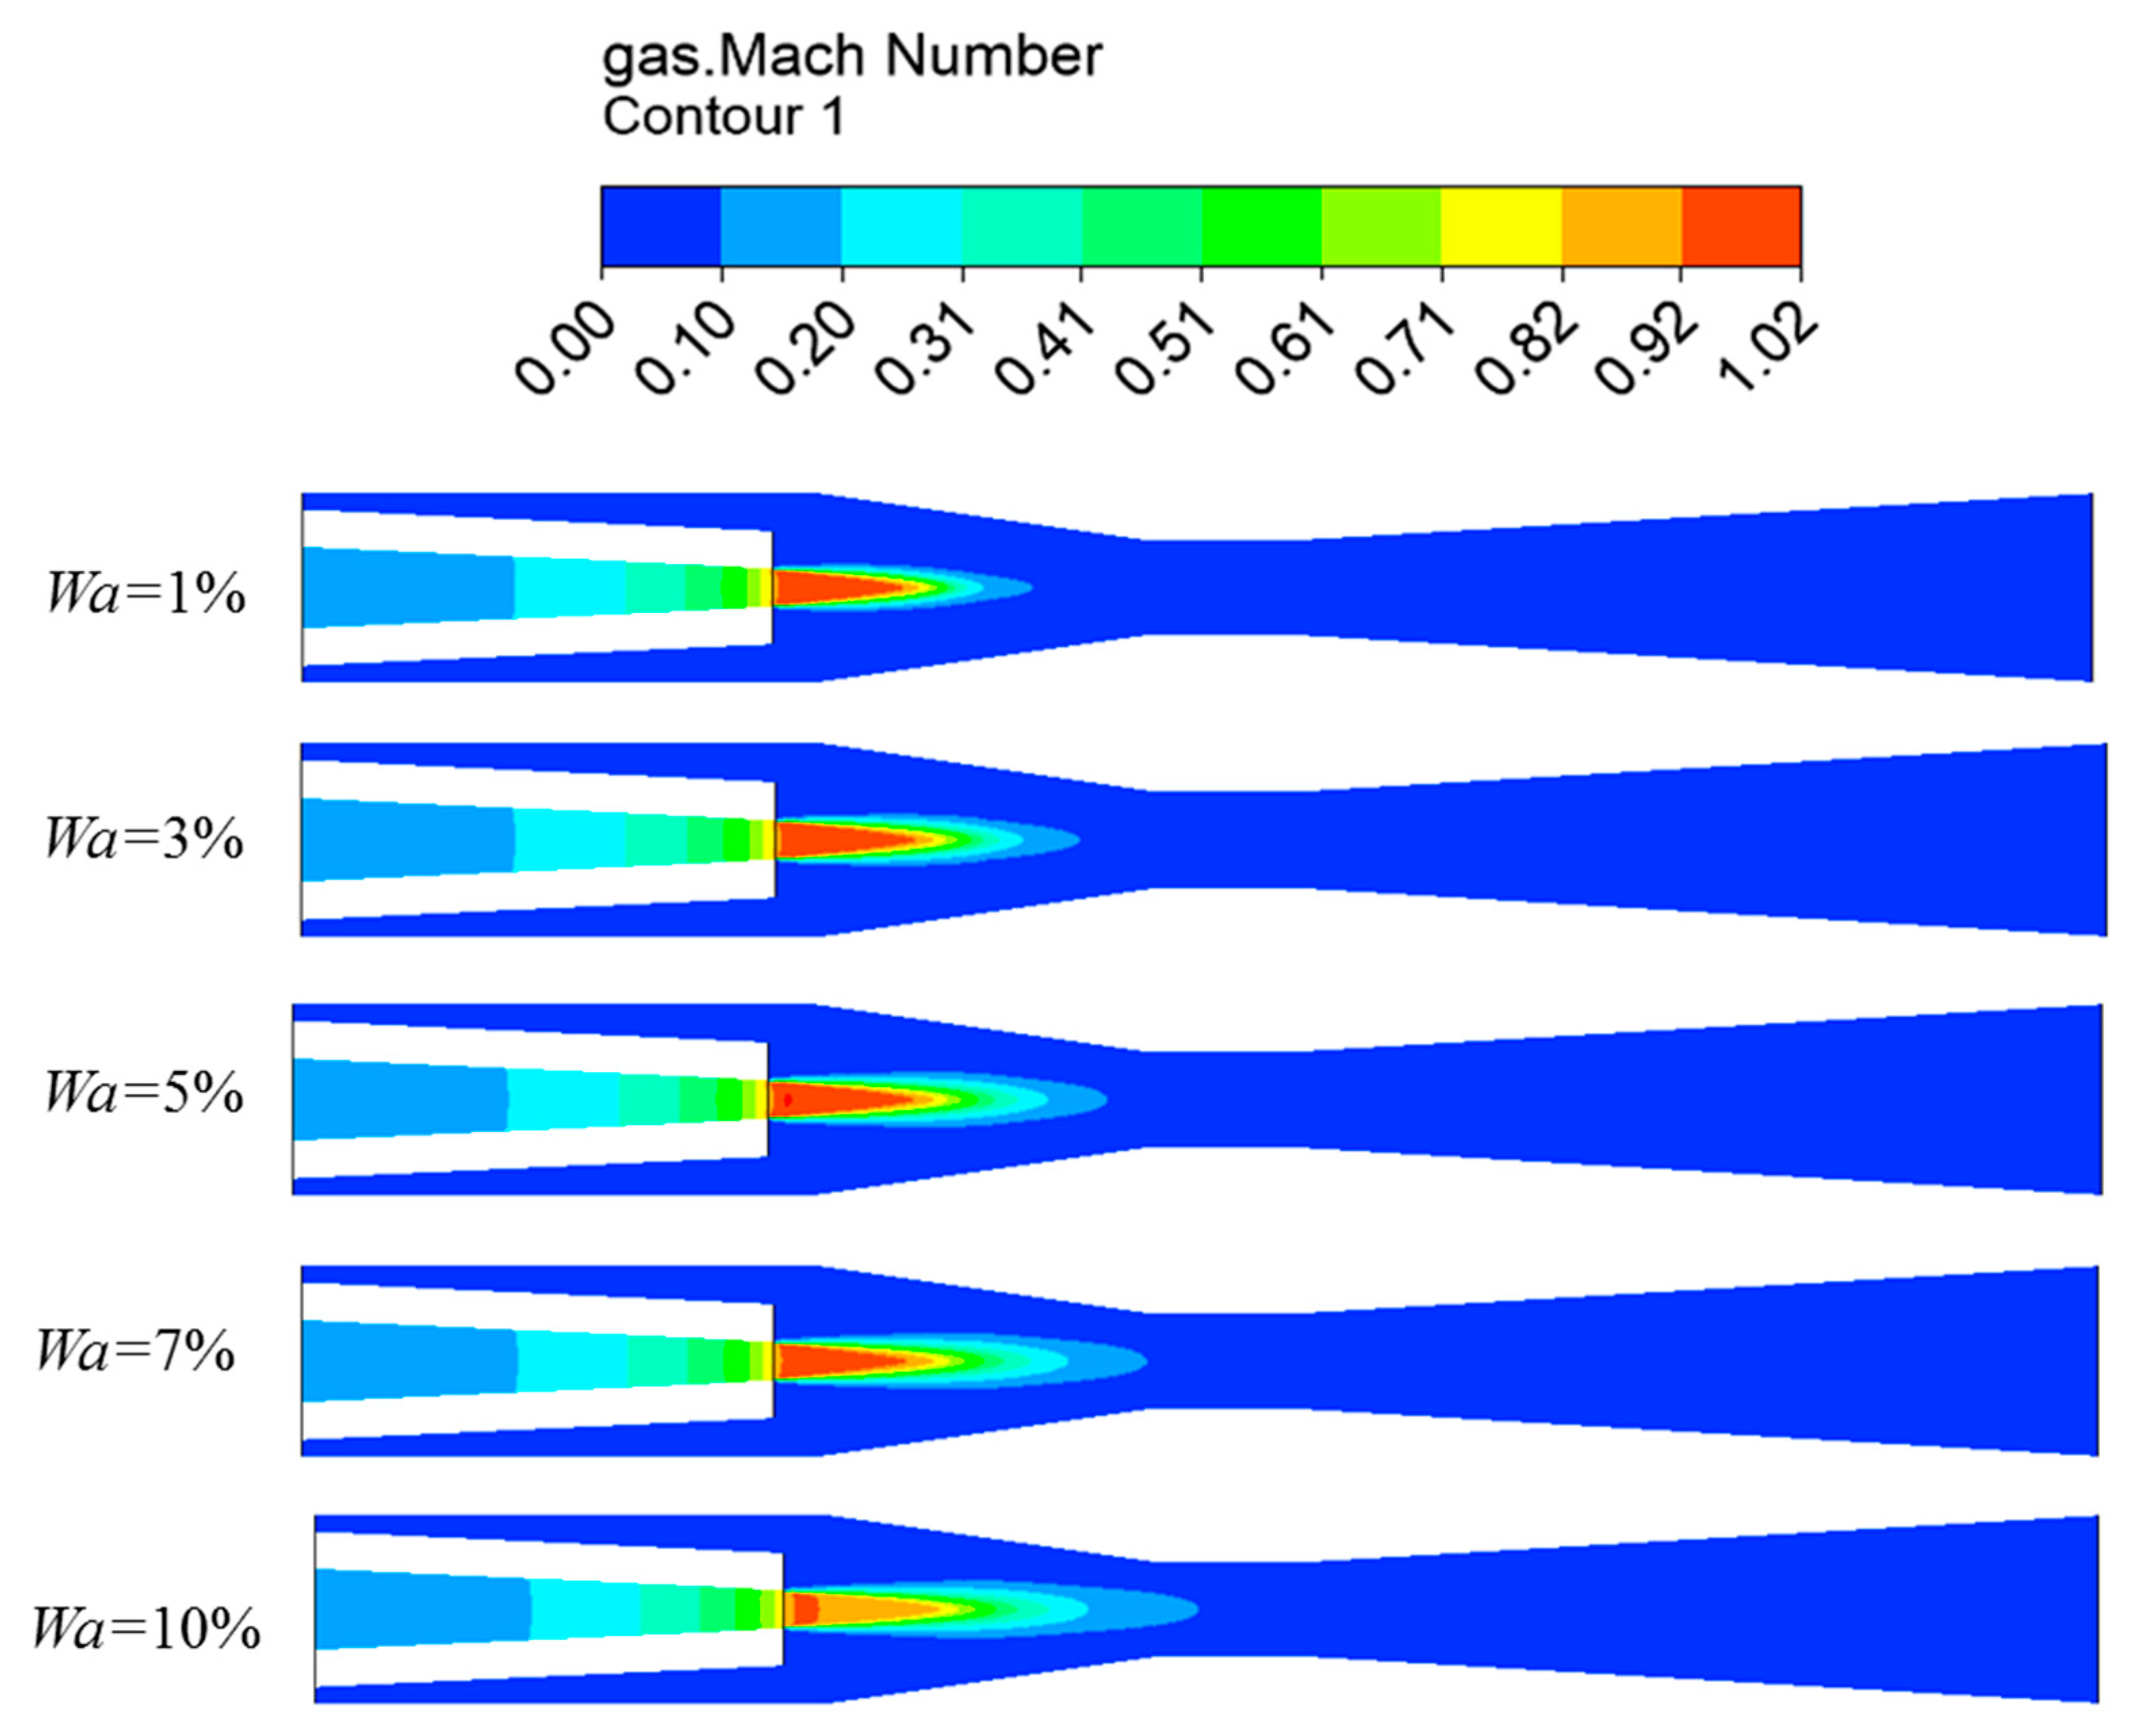
3.3.2. Distribution of Vapor-Liquid Two-Phase at Different Velocities

Figure 12 and Figure 13 show the contours of the vapor phase velocity and contours of the liquid phase velocity, respectively, at different non-condensable gas contents. The change in velocity mainly occurs in the nozzle and mixing chamber. In the case of the same content of non-condensable gas, the velocity of the vapor phase is always greater than the liquid phase. As the non-condensable gas content increases, the condensation rate decreases and the jet penetration length continues to increase. The maximum velocity of the vapor and liquid phases continues to decrease.
Figure 14 shows the gas Mach number distribution under different contents of non-condensable gas. The Mach number is defined as the ratio of local velocity to local sound speed. Similarly, as the non-condensable gas content increases, steam and subcooled water are suppressed. During the water–steam direct contact condensation process, the jet penetration length continues to increase and the maximum Mach number continues to decrease. Combining the contours of the gas volume fraction and the contours of the vapor-liquid two-phase velocity, under the synergy effects between the steam condensation and the obstruction of steam flow by the surrounding subcooled water, the Mach number at the tail of the steam plume is reduced and a compression wave is generated. Therefore, the speed is reduced and the pressure increases.

3.4. Analysis of Heat and Mass Transfer Characteristics at Different Non-Condensable Gas Mass Fractions

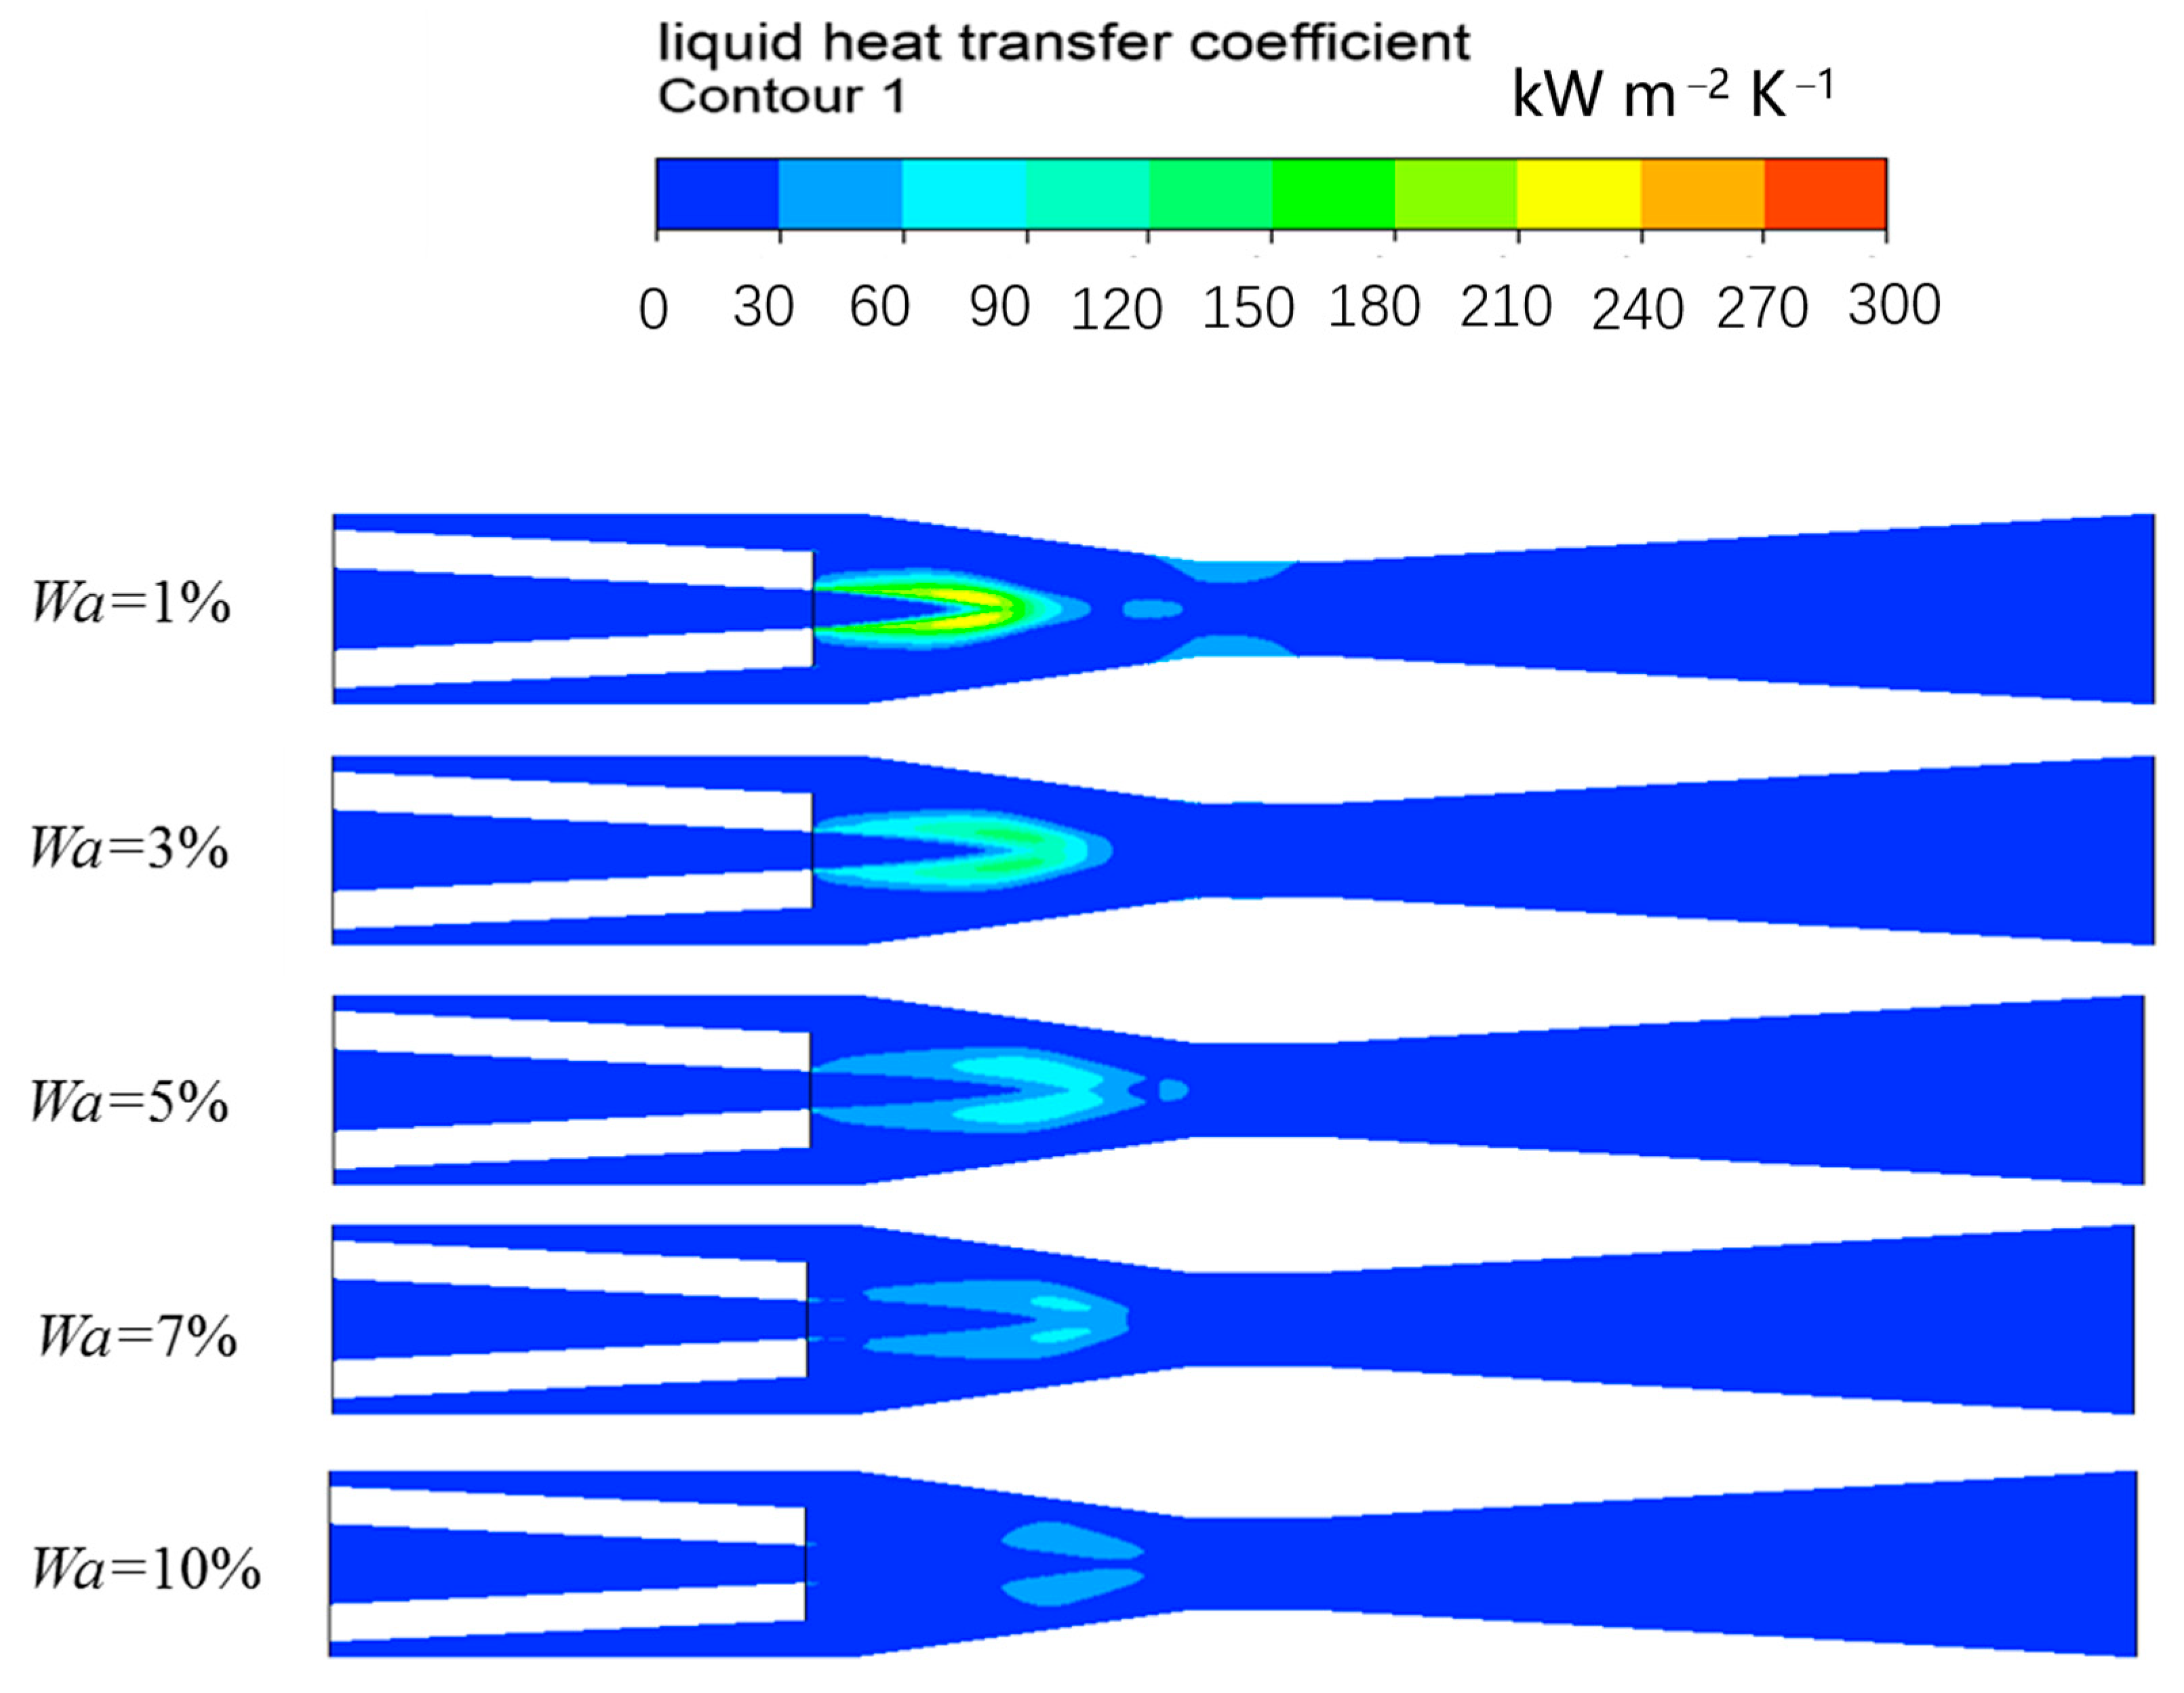
3.4.1. Heat Transfer Characteristics

Figure 15 shows the contours of the local heat transfer coefficient at different non-condensable gas mass fractions. The local heat transfer coefficient continues to decrease with the non-condensable gas content. This shows that non-condensable gas prevents the heat transfer between the steam and subcooled water. The higher the mass fraction of non-condensable gas is, the more serious is the obstruction to the heat transfer capacity between steam and water. The presence of non-condensable gas will form a layer of non-condensable gas between the vapor and liquid phase. The non-condensable layer will form a thermal resistance, which has a strong inhibitory effect on steam condensation. According to Equations (9) to (14), when air is mixed into steam, the viscosity μwa, density ρwa, and thermal conductivity λwa of the mixture of water and air all decrease significantly, and the Prandtl number Prwa also decreases. This causes the heat transfer coefficient hwa on the side of the mixture of water and non-condensable gas to decrease. When the air content increases, the above four physical parameters also decrease, causing hwa to gradually decrease. Therefore, in actual industrial production, to improve the heat transfer capacity between steam and water it is particularly important to reduce the content of non-condensable gases in steam.

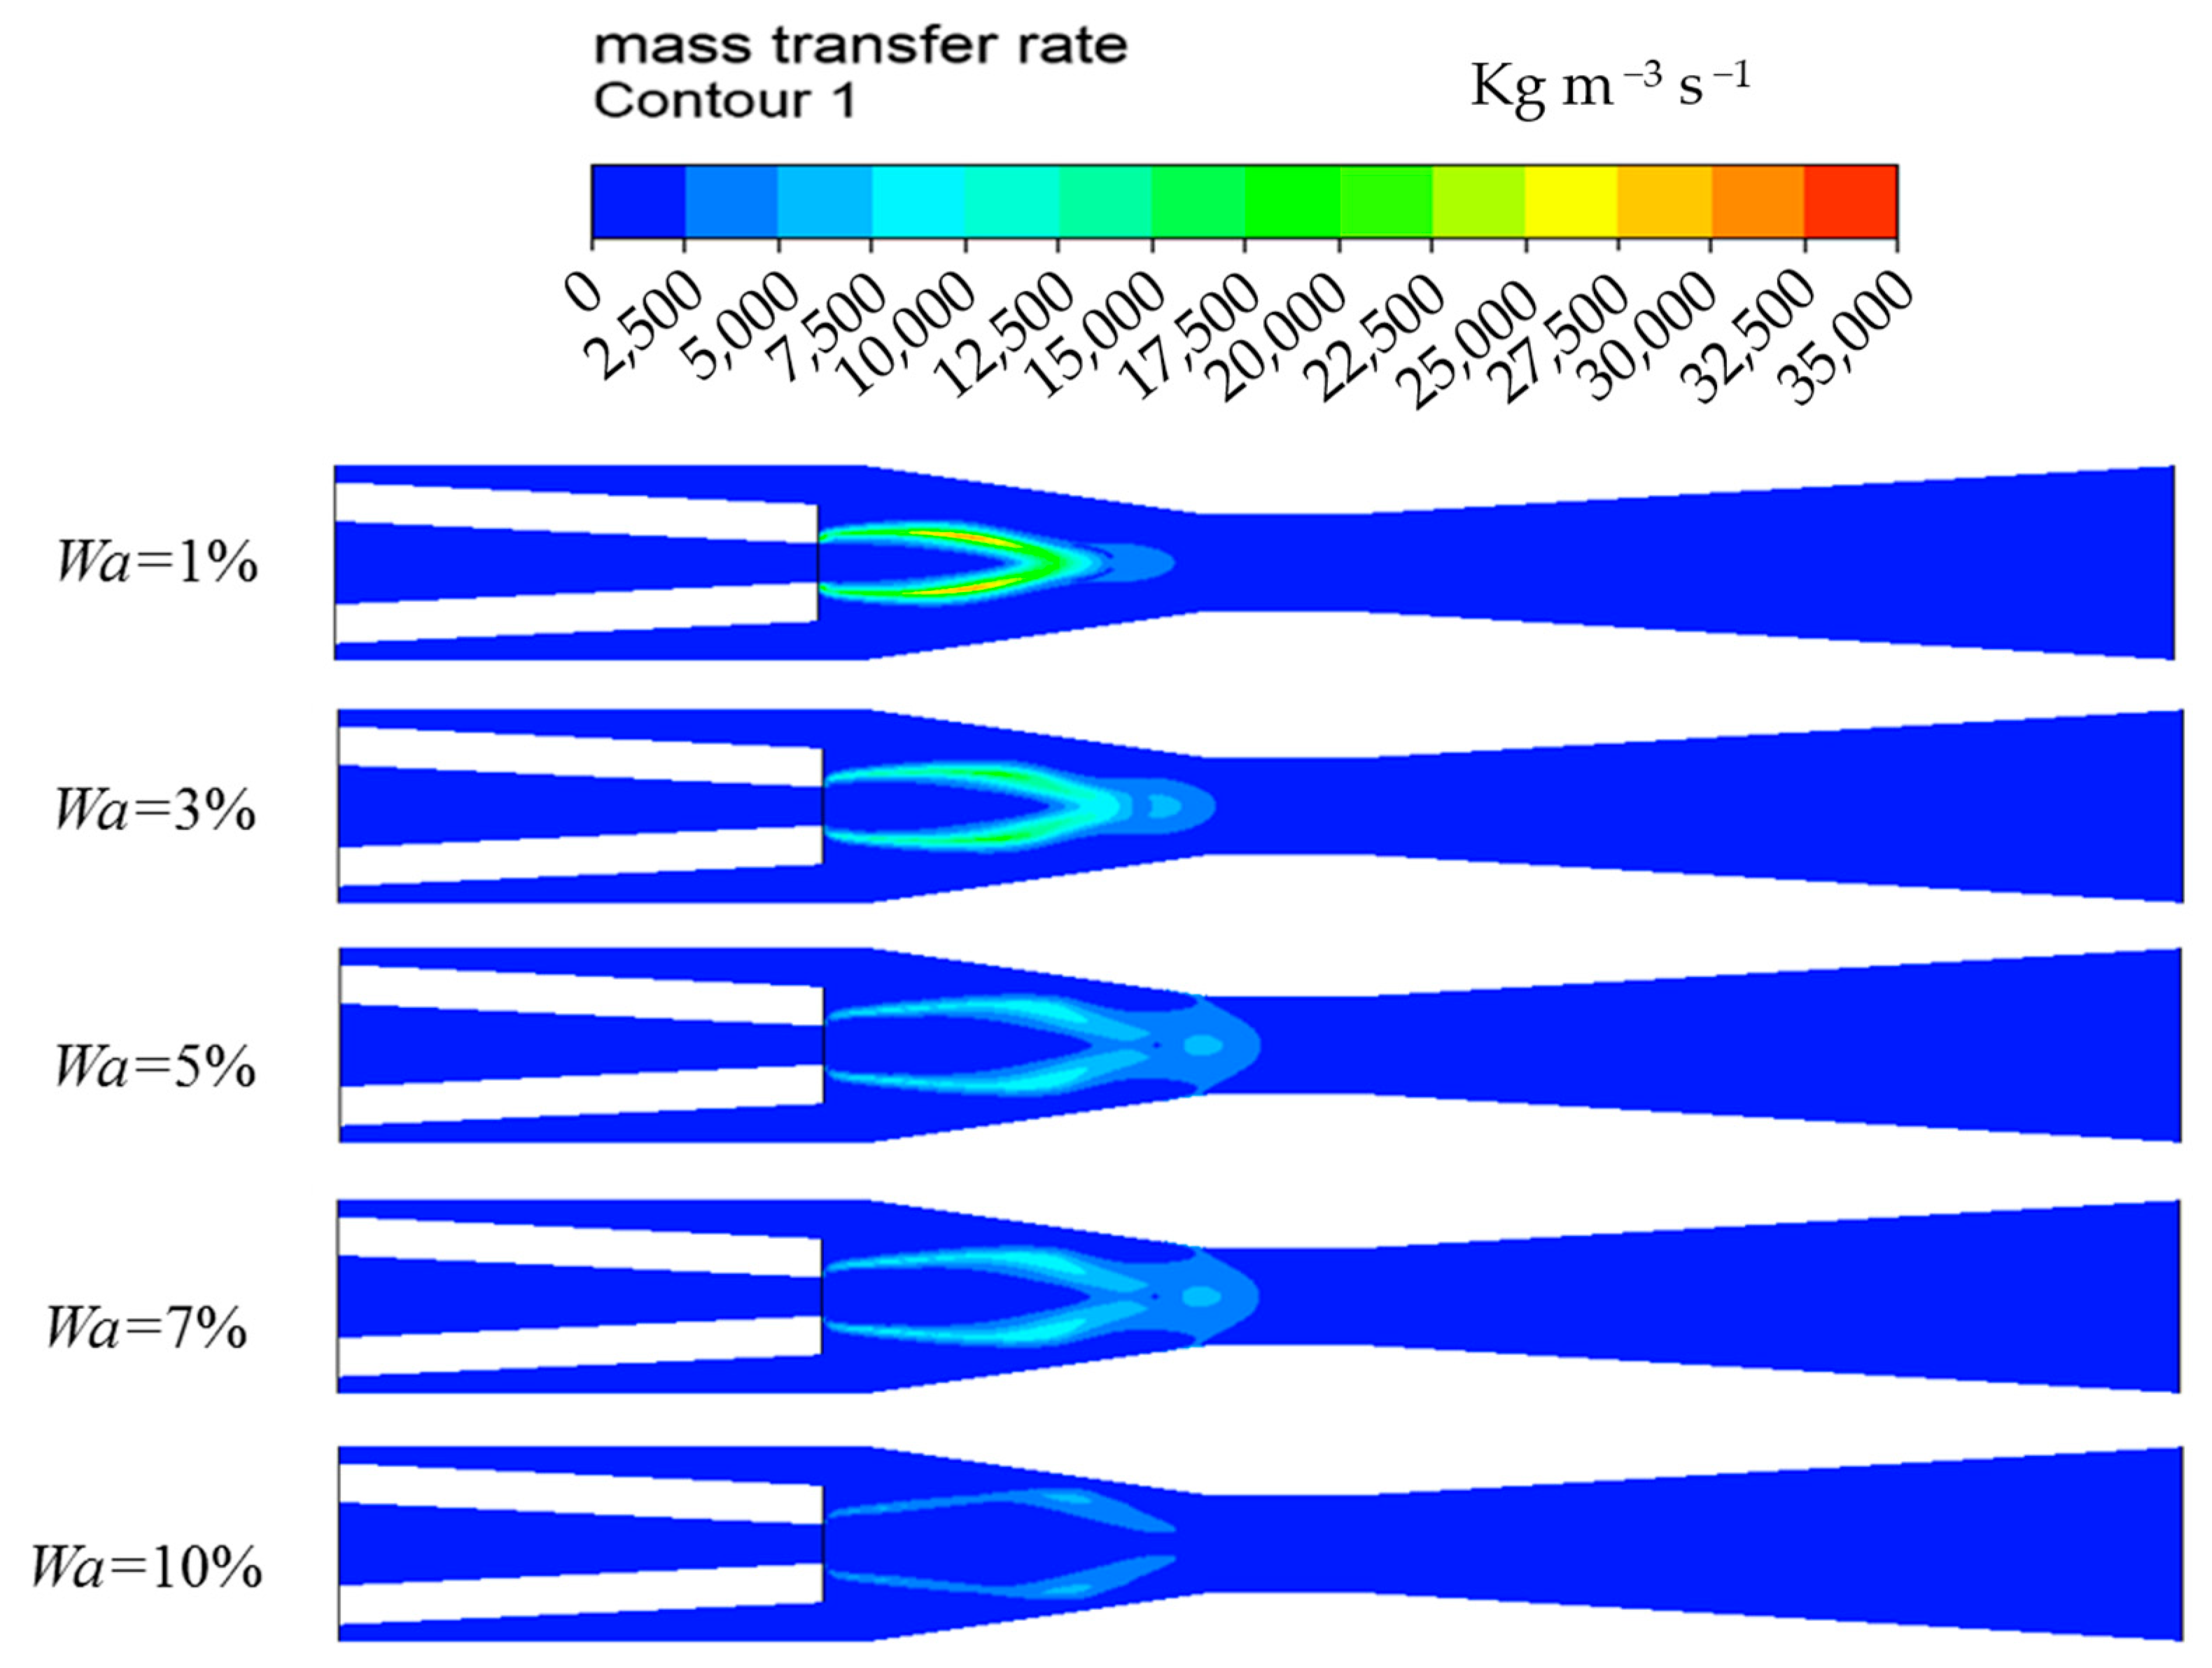
3.4.2. Mass Transfer Characteristics

The steam condensation rate contours under different non-condensable gas contents are shown in Figure 16. The steam condensation mainly occurs in the core steam area, which is consistent with the gas content distribution in Section 3.3.1. When the air mass fraction increases, the local condensation rate in the two-phase region will gradually decrease. The reason is that when the air content in the steam increases, the viscosity μwa, density ρwa, thermal conductivity λwa, and Prandtl number Prwa of the mixture of water and air both decrease, causing the heat transfer coefficient hwa on the mixture side to decrease. In addition, when the air mass fraction increases, the partial pressure of the steam decreases, so the saturation temperature corresponding to the partial pressure of the steam also decreases. The saturation temperature difference decreases, resulting in an impact on the steam condensation rate. There is also a downward trend in the steam condensation rate. Since the inlet steam flow rate is basically unchanged, the steam condensation rate decreases, and steam condensation requires a larger condensation surface area, so the steam plume becomes longer and wider, which is consistent with the gas content distribution in Section 3.3.1.

4. Conclusions

In this paper, a numerical model was established for the steam–water direct contact condensation and applied to the two-phase flow ejector; the inlet steam pressure and non-condensable gas mass fraction range from 0.6 to 2.9 MPa and 1 to 10%, respectively. The influences of the inlet steam pressure and non-condensable gas mass fraction were investigated. And the main conclusions are summarized as follows:
(1)
The steam plume penetration length increases with the inlet steam pressure. The steam mass flow rate increases with the inlet steam pressure, and a greater interfacial area is needed to condensate the steam. Therefore, the steam plume penetration length also increases.
(2)
The maximum velocity of the vapor and liquid phases increases with the inlet steam pressure, resulting in a higher relative Reynolds number, which leads to a higher local heat transfer coefficient. The steam condensation process would be enhanced and the saturation temperature would increase due to higher local pressure.
(3)
Non-condensable gas hinders the steam–water direct contact condensation. Increasing the non-condensable gas mass fraction, the interfacial heat transfer would be prevented, and the steam condensation rate and maximum velocity of the vapor and liquid phases decrease, while the penetration length of the steam plume increases.
(4)
With the non-condensable gas mass fraction rising from 1% to 10%, the viscosity, density, and thermal conductivity of the mixture of water and air all decrease significantly. The Prandtl number also decreases, which leads to a lower heat transfer coefficient and Nusselt number on the liquid side.

Author Contributions

Methodology, Y.L. and Q.X.; Software, C.H.; Formal analysis, B.L.; Writing—original draft, Y.C.; Writing—review & editing, H.K. All authors have read and agreed to the published version of the manuscript.

Funding

This research was funded by the National Natural Science Foundation of China, grant number 12302334.

Data Availability Statement

The data presented in this study are available on request from the corresponding author. The data are not publicly available due to future research.

Conflicts of Interest

The authors declare no conflicts of interest.

Abbreviations

  α Volume fraction
  ρ Density
mMass flow rate
μeffwViscosity of water
ewInternal energy of water
  τ w Stress tensor
wMass fraction
PinSteam inlet pressure
SsSource term due to the condensation
HwEnthalpy of saturated water
hwHeat transfer coefficient on liquid side
AswPhase interface area
TsatSaturation temperature under local partial pressure.
PrwaPrandtl number
RerRelative Reynolds number between two-phase
  U wa Mass-weighted average velocity of water and air
  γ sat Latent heat of saturated steam
  μ t Turbulent kinetic viscosity
  ε w Turbulent energy dissipation rate
kwTurbulent kinetic energy
Subscript
wWater
sSteam
aAir

References

  1. Liang, K.S.; Griffith, P. Experimental and Analytical Study of Direct Contact Condensation of Steam in Water. Nucl. Eng. Des. 1994, 147, 425–435. [Google Scholar] [CrossRef]
  2. Yang, X.P.; Chong, D.T.; Liu, J.P.; Zong, X.; Yan, J.J. Experimental Study on the Direct Contact Condensation of the Steam-Air Mixture in Sub-Cooled Water Flow in a Rectangular Channel. Int. J. Heat Mass Transf. 2015, 88, 424–432. [Google Scholar] [CrossRef]
  3. Qu, X.H.; Tian, M.C. Acoustic and Visual Study on Condensation of Steam-Air Mixture Jet Plume in Subcooled Water. Chem. Eng. Sci. 2016, 144, 216–223. [Google Scholar] [CrossRef]
  4. Zhou, Y.; Yang, X.P.; Fu, P.F.; Liu, J.P.; Yan, J.J. Numerical Investigation on Submerged Steam Jet Condensation in Subcooled Water Flow in a Restricted Channel with the Presence of Non-condensable Gas. Int. J. Therm. Sci. 2021, 170, 107122. [Google Scholar] [CrossRef]
  5. Lewis, M.T.; Hickey, J.P. Conjugate Heat Transfer in High-Speed External Flows: A Review. J. Thermophys. Heat Transf. 2023, 37, 697–712. [Google Scholar] [CrossRef]
  6. Jia, B.; Xian, C.G.; Tsau, J.S.; Zuo, X.; Jia, W.F. Status and outlook of oil field chemistry-assisted analysis during the energy transition period. Energy Fuels 2022, 36, 12917–12945. [Google Scholar] [CrossRef]
  7. Chun, M.H.; Kim, Y.S.; Park, J.W. An Investigation of Direct Condensation of Steam Jet in Subcooled Water. Int. Commun. Heat Mass Transf. 1996, 23, 947–958. [Google Scholar] [CrossRef]
  8. Liu, G.Y.; Yan, J.J.; Pan, D.D.; Li, W.J.; Wu, X.Z.; Xing, T.A. Research on the Steam Plume Shape and Pressure Fields of Supersonic Steam Jet in Subcooled Water. J. Eng. Thermophys. 2010, 31, 781–784. [Google Scholar]
  9. Xu, Q.; Guo, L.J.; Zou, S.F.; Chen, J.W.; Zhang, X.M. Experimental Study on Direct Contact Condensation of Stable Steam Jet in Water Flow in a Vertical Pipe. Int. J. Heat Mass Transf. 2013, 66, 808–817. [Google Scholar] [CrossRef]
  10. Liu, J.Q.; Liu, X.X.; Sun, Z.N.; Ming, Z.M. Experimental Investigation on Pressure Oscillation of Submerged Steam Jet Condensation with Non-condensable Gas. At. Energy Sci. Technol. 2019, 53, 312–318. [Google Scholar]
  11. Cong, Y.L.; Wang, Y.C.; Chen, W.X.; Chong, D.T.; Yan, J.J. Effect of Non-condensable Gas on Pressure Oscillation of Submerged Steam Jet. J. Univ. Chin. Acad. Sci. 2017, 34, 135–140. [Google Scholar]
  12. Cong, Y.L.; Chong, D.T.; Yan, J.J. Effect of Non-condensable Gas on Pressure Oscillation Intensity of Submerged Steam Jet. At. Energy Sci. Technol. 2019, 53, 2389–2397. [Google Scholar]
  13. Ma, X.; Xiao, X.; Jia, H.; Li, J.; Ji, Y.L.; Lian, Z.H.; Guo, Y. Experimental Research on Steam Condensation in Presence of Non- condensable Gas under High Pressure. Ann. Nucl. Energy 2021, 158, 108282. [Google Scholar] [CrossRef]
  14. Qu, X.H.; Tian, M.C.; Zhang, G.M.; Leng, X.L. Effect of Non-condensable Gas on Steam Jet Condensation Characteristics. CIESC J. 2015, 66, 3841–3848. [Google Scholar]
  15. Zhou, L.; Chong, D.T.; Liu, J.P.; Yan, J.J. Numerical Study on Fow Pattern of Sonic Steam Jet Condensed into Subcooled Water. Ann. Nucl. Energy 2016, 99, 206–215. [Google Scholar] [CrossRef]
  16. Zhou, L.; Chen, W.X.; Chong, D.T.; Liu, J.P.; Yan, J.J. Numerical Investigation on Flow Characteristic of Supersonic Steam Jet Condensed into a Water Pool. Int. J. Heat Mass Transf. 2017, 108, 351–361. [Google Scholar] [CrossRef]
  17. Zhou, L.; Wang, L.; Chong, D.T.; Yan, J.J.; Liu, J.P. CFD Analysis to Study the Effect of Non-condensable Gas on Stable Condensation Jet. Prog. Nucl. Energy 2017, 98, 143–152. [Google Scholar] [CrossRef]
  18. Tan, B.; Cai, J.J.; Liu, R.; Chang, J. Research on Condensation Heat Transfer Model with Non-condensable Gas under High Pressure. At. Energy Sci. Technol. 2021, 55, 1047–1053. [Google Scholar]
  19. Geng, S.H.; Dang, J.J.; Zhao, J.; Zhang, J.N.; Sun, J.L.; Qin, K. Numerical Simulation of Convective Condensation of Steam with Large Proportion of Non-Condensable Gas under High Pressure. J. Unmanned Undersea Syst. 2021, 29, 88–96. [Google Scholar]
  20. Cravero, C.; De Domenico, D.; Marsano, D. Uncertainty Quantification Analysis of Exhaust Gas Plume in a Crosswind. Energies 2023, 16, 3549. [Google Scholar] [CrossRef]
  21. Xia, L.; Zou, Z.J.; Wang, Z.H.; Zou, L.; Gao, H. Surrogate model based uncertainty quantification of CFD simulations of the viscous flow around a ship advancing in shallow water. Ocean Eng. 2021, 234, 109206. [Google Scholar] [CrossRef]
  22. Norman, T.L.; Revankar, S.T. Jet-Plume Condensation of Steam-Air Mixtures in Subcooled Water, Part 1: Experiments. Nucl. Eng. Des. 2010, 240, 524–532. [Google Scholar] [CrossRef]
  23. Qu, X.H. Investigation on the Direct Contact Condensation of Steam with Non-Condensable Gas and Its Application in Steam-Water Ejector. Ph.D. Thesis, Shandong University, Qingdao, China, 27 November 2017. [Google Scholar]
  24. Shah, A. Thermal Hydraulic Analysis of Steam Jet Pump. Ph.D. Thesis, Pakistan Institute of Engineering and Applied Sciences, Islamabad, Pakistan, 2012. [Google Scholar]
  25. Chen, X.B.; Tian, M.C.; Zhang, G.M.; Liu, H.K. Numerical simulation on interfacial characteristics in supersonic steam–water injector using particle model method. Energies 2019, 12, 1108. [Google Scholar] [CrossRef]
Figure 1. Geometry structure of ejector and grids distribution. (a) Geometry structure; (b) Grids distribution near the nozzle outlet.
Energies 17 01341 g001
Figure 2. Mesh independence test.
Energies 17 01341 g002
Figure 3. Contours of steam volume fraction at different inlet steam pressures (wa = 3%).
Energies 17 01341 g003
Figure 4. Contours of vapor phase velocity at different inlet steam pressure (wa = 3%).
Energies 17 01341 g004
Figure 5. Contours of liquid phase velocity at different inlet steam pressures (wa = 3%).
Energies 17 01341 g005
Figure 6. Contours of Mach number at different inlet steam pressures (wa = 3%).
Energies 17 01341 g006
Figure 7. Contours of turbulent kinetic energy of the liquid phase at different steam inlet pressures.
Energies 17 01341 g007
Figure 8. Contours of heat transfer coefficient at different steam inlet pressures (wa = 3%).
Energies 17 01341 g008
Figure 9. Contours of mass transfer rate at different steam inlet pressures.
Energies 17 01341 g009
Figure 10. Contours of gas volume fraction at different non-condensable gas mass fractions (ms = 0.012 kg/s, mw = 0.2 kg/s).
Energies 17 01341 g010
Figure 11. Contours of gas volume fraction at different non-condensable gas mass fractions (ms = 0.015 kg/s, mw = 0.2 kg/s).
Energies 17 01341 g011
Figure 12. Contours of vapor phase velocity at different non-condensable gas mass fractions (ms = 0.015 kg/s, mw = 0.2 kg/s).
Energies 17 01341 g012
Figure 13. Contours of liquid phase velocity at different non-condensable gas mass fractions (ms = 0.015 kg/s, mw = 0.2 kg/s).
Energies 17 01341 g013
Figure 14. Contours of gas Mach number at different non-condensable gas mass fractions (ms = 0.015 kg/s, mw = 0.2 kg/s).
Energies 17 01341 g014
Figure 15. Contours of heat transfer coefficient at different non-condensable gas mass fractions (ms = 0.015 kg/s, mw = 0.2 kg/s).
Energies 17 01341 g015
Figure 16. Contours of mass transfer rate at different non-condensable gas mass fractions (ms = 0.015 kg/s, mw = 0.2 kg/s).
Energies 17 01341 g016
Table 1. Geometry dimensions and boundary conditions.
ParametersUnitsValue
Steam nozzle throat diametermm10
Steam nozzle outlet diametermm4
Throat nozzle distancemm40
Outlet diametermm20
Steam inlet pressureMPa0.6–2.9
Outlet pressurekPa500
Mass fraction of non-condensable gas/0–0.1
Table 2. Comparison of secondary flow inlet pressure between simulation and experiment.
Experiment Result (kPa)Simulation Result (kPa)Relative Error (%)
103.04109.366.1%
Disclaimer/Publisher’s Note: The statements, opinions and data contained in all publications are solely those of the individual author(s) and contributor(s) and not of MDPI and/or the editor(s). MDPI and/or the editor(s) disclaim responsibility for any injury to people or property resulting from any ideas, methods, instructions or products referred to in the content.

