1. Introduction
Sustainable development is defined as “development that meets the needs of the present without compromising the ability of future generations to meet their own needs” [
1]. This concept has evolved from environmental and economic domains to cater to institutional, political, societal, and technological needs of the world [
2]. Although electric-power generation is essential for meeting basic needs of the world’s population, it is also responsible for a diverse set of negative environmental impacts associated with resource extraction and processing; manufacturing of gas turbines, solar panels, wind turbines, and other power plant equipment; transportation of minerals, fuels, and equipment; and combustion of fossil fuels at thermal power plants. Nearly all impacts to air, water, and land resources occur locally, where supply chain activities take place, except for greenhouse gas (GHG) emissions that cause global climate change.
The Intergovernmental Panel on Climate Change (IPCC) has identified decarbonization of electricity systems around the world as a significant measure for reducing GHG emissions. The goal is to keep global warming below 1.5 °C to 2 °C [
3]. At the same time, the United Nations Sustainable Development Goals (SDG) (specifically, Goal #7-Affordable and Clean Energy) suggest ensuring access to affordable, reliable, sustainable, and modern energy for all [
4]. This follows directly from SDG #1 (no poverty). Other SDGs aim at enhancing ecosystems and halting biodiversity loss (#15) and ensuring the availability and sustainability of water and sanitation (#6). How electricity is generated touches on these SDGs and others. Sustainable electricity production can improve the quality of life, economy, and social well-being of a nation [
5], but most environmental impacts of electricity, which is supplied locally, are distributed across the globe—because supply chains are global.
Reliability is a critical aspect of sustainable development (in the context of energy availability). Reliability is defined here as the “ability of the power system to withstand instability, uncontrolled events, or unanticipated loss of system components” [
6]. Ensuring reliable and affordable access to electricity while simultaneously mitigating climate change, minimizing local environmental impacts, and realizing other SDGs is a significant challenge. One widely accepted method of assessing most aspects of sustainability is conducting a life-cycle assessment (LCA) [
7]. LCA impact categories, which relate to an array of environmental characteristics, such as climate, water stress, biodiversity, aquatic toxicity, and eutrophication, are linked directly to numerous SDGs (#3, #6, #13–15). Many LCA impact categories address broad targets related to integrated water management and protecting and restoring water-related ecosystems. For example, as presented in [
8], environmental impact pathways such as climate, water stress, toxicity, and eutrophication can impact local communities, users, and small-scale entrepreneurs, which is directly linked to the SDG #6 target of clean water and sanitation.
When comparing electricity-generation facilities at any location, we need to rely on global supply chains. For example, the extraction and processing of mineral resources and manufacturing of equipment, in many cases, occur in developing economies that are working to achieve SDG goals, whereas the deployment and operation of advanced technologies often occur in developed countries on different continents. The electricity system in Texas is an example of this paradox. Although the grid is dominated by natural-gas-fired generation (43% of installed capacity and 42% of generation in 2022;
Figure 1, [
9]) using natural gas sourced in Texas, wind and solar equipment is imported mostly from Asia. Wind energy in Texas has been growing and in 2022, accounted for 29% of installed capacity and 25% of generation. Although Texas leads the U.S. in wind generation (nearly 26% of U.S. capacity), solar has been growing faster and in 2022, accounted for 11% of installed capacity and 6% of generation. The interconnection queue includes mostly solar projects, followed by wind and a few gas-fired power plants. Announced capacities can more than double the installed capacity of solar (~15 GW capacity at end of 2022, [
9]). Texas has also been adding battery storage at a fast pace and may have more than 10 GW of grid-scale battery storage within several years. Since natural gas supplied to the gas-fired plant is produced in Texas, environmental impacts of the whole supply chain are relatively localized. In contrast, the wind, solar, and battery equipment that will be installed in Texas will have environmental impacts across many geographies of the world, given the global supply chains of this equipment, including the mining and processing of minerals needed for their manufacturing.
Many studies have been conducted on sustainable electricity production with different levels of comprehensiveness; technological, temporal, and geographical levels; and in current and future generation scenarios. For decades, minimizing environmental impacts from electricity generation has been the focus, starting with sulfur dioxide (SO
2), particulate-matter formation (PMFP), mercury, and GHG, particularly carbon dioxide (CO2). In 2020, fossil-fuel combustion accounted for 31% of total CO
2 emissions and 24% of GHG emissions in the U.S. [
10], whereas the transportation sector accounted for 33% of CO
2 emissions. Other environmental impacts influence land, water, and air quality, with attendant impacts on human health across the entire supply chain and life cycle of the extraction and processing of natural resources (e.g., natural gas and a long list of minerals, including copper, cobalt, lithium, and nickel); manufacturing materials such as cement, aluminum, and steel used in building power plants; and equipment such as gas turbines, wind turbines, solar PV panels, and batteries.
LCA is an internationally standardized approach used to measure the broader environmental impacts of any product or process in question [
11]. Pertaining to this study, a comparative LCA on impacts from generating electricity using several different technologies could identify environmental hotspots in both time and space and along the full supply chain from raw material sourcing to product end of life (or cradle to grave). LCA identifies the distribution of environmental burden between processing stages, different geographic areas, and different environmental media (air, land, water). For complex, multidimensional problems, such as comparing electricity generation options, detailed modeling of all processes, applied dynamically, can require extensive data and many assumptions. The ability to compare different LCA studies is improved using standardized approaches such as ReCiPe 2016 [
12] and TRACI [
13]. Standardization allows researchers and practitioners to identify limitations, overlaps, gaps, or differences in system boundaries between studies, facilitating a meaningful comparison. Researchers have also studied the environmental impacts extensively—GHG emissions in particular—associated with natural gas production, gathering, boosting, storage, transmission, and processing, all of which are needed before combustion at a combined-cycle gas plant (CCGT). In general, commercially available databases (e.g., Ecoinvent) lack site specificity and, on occasion, the comprehensiveness needed to compare different technologies fully, especially those recently developed and/or without substantial operational experience. Other studies include significant levels of data and detail (e.g., [
14,
15,
16]) on life-cycle impacts of natural gas extraction and power generation and impacts from gas flaring and leakage. Spath and Mann (2000) [
17] discussed basic details such as the land usage and bill of materials for constructing a CCGT plant as they generated their life cycle inventory. Toscano et al. (2019) [
18] focused on environmental impacts due to water-conditioning methods in CCGT plants, as well as impacts on water depletion and freshwater, marine, and terrestrial ecotoxicity. Agrawal et al. (2014) [
19] pointed out that natural gas extraction, treatment, and transmission lead to additional adverse effects such as carcinogenic and respiratory impacts.
For onshore wind generation, Alsaleh and Sattler (2019) [
20] presented a comprehensive LCA of turbines deployed in the U.S., including each turbine life-cycle phase and a consideration of a broad number of environmental impact pathways. They also studied the sensitivity of the impacts to turbine life span. The end of life of wind turbines is generally not well studied, although recent studies [
21,
22] identify a need for broader environmental audits of wind turbine component disposal by landfilling and recycling. McKenna et al. (2016) [
23] reviewed over 300 studies on wind potential assessment and identified geographical and technical limitations of wind energy operation. Jordaan et al. (2021) [
16] conducted a meta-analysis of LCAs on electricity generation, focusing on Europe, Asia, and North America. The authors reviewed 251 studies and concluded that, whereas most studies have historically focused on GHG, an increasing number of studies have begun investigating acidification, eutrophication, and human-health impacts. The authors also recommended the better characterization of spatial and temporal drivers of impacts such as transport needs, local environmental conditions (e.g., hydrology), temporal changes in plant operations (intraday, across seasons, over the years), degradation of equipment, and other characteristics that may be unique to any given location. Guidi et al. (2023) [
24] also conducted a review of LCA studies of power generation systems from around the world published in the past ten years, comparing energy technologies solely by global warming potential. Nuclear and wind had the lowest GHG emissions, followed by hydro, solar, and geothermal. These emissions were 1–2 orders of magnitude lower than the emissions from thermal plants using coal and natural gas. The authors identified the need for reducing the environmental footprint of the PV supply chain for this technology to be truly sustainable.
Many studies have presented LCAs of utility-scale PV generation systems. Krebs et al. (2020) [
25] reported the GHG emissions and cumulative energy demand of a 10 kW
p multicrystalline silicon PV panel with batteries and control systems. They pointed out that environmental burdens vary across battery types and increase proportionally to battery capacity. Differences across PV panel technologies (chemistries, production processes) and how to account for them in LCAs were addressed by the International Energy Agency [
25]. Subsequently, Krebs et al. (2020) [
25] identified only one comprehensive life-cycle inventory (LCI) for manufacturing of five different types of PV modules. They also incorporated the global supply chain for different components based in North America, China, the Asia–Pacific region, and Europe. Established companies focusing on solar energy generation were consulted to provide land-use, operational, and installation guidelines, as well as commercial photovoltaic cell types. Singh et al. (2023) [
26] recently conducted an LCA of end-of-life options for crystalline silicon and cadmium telluride PV modules and concluded that the environmental impacts of crystalline silicon modules are greater than those of cadmium telluride modules. Ali et al. (2022) [
27] conducted an LCA of distributed solar generation in New York based on operational data from 120 facilities. The system starts from raw material extraction and ends with the complete recycling of PV panels at the end of operational life. Results of 10 environmental impacts varied by site location (hence, capacity factor) and system design (panel type, power ratio) were used to estimate all major environmental impacts.
The literature suggests that locations of generation facilities and global supply chains are important for LCA studies, especially for local impacts on air, land, and water. We add to the literature by comparing electricity-generation technology options located in West Texas, a sparsely populated, arid region with natural gas production and high wind and solar resources but a limited capacity to transmit electricity to demand centers in the east. We considered five power plant technologies: combined-cycle gas turbine (CCGT), wind, wind with battery storage, solar photovoltaic (PV), and PV with battery storage. In each option, the comparison assumed equal generation of electricity over the life of the power plant. To approximate equivalency of intermittent and variable wind and solar resources to a thermal plant, which can be dispatched at the request of the electric system operator to ensure real-time balancing of demand and supply, we added battery storage to mimic the dispatchability of the CCGT unit. We are unaware of studies that pursue such generation equivalency, which we consider a key contribution of this paper. In summary, this study focused on addressing the following research questions.
Q1: What is the side-by-side comparison of the life-cycle environmental impacts of five electricity generation options for the facility generating the same amount of electricity annually in West Texas?
Q2: What is the change in environmental impacts, when storage is added to wind and solar plants, to mimic dispatchability of CCGT?
Q3: What is the cradle-to-grave breakdown of environmental impacts at each life-cycle stage across global supply chains?
Q4: What is the sensitivity of environmental impacts to capacity factors for each generation option?
2. Materials and Methods
According to the International Organization for Standardization (ISO) 14040 [
28] and ISO 14044 [
29], the LCA approach consists of four main phases: (1) goal and scope definition, (2) life-cycle inventory, (3) life-cycle impact assessment, and (4) interpretation and inferences. These phases are described next. The LCA model calculations used in this study were carried out using the OpenLCA software package (version 1.10.3, Green Delta, Berlin, Germany).
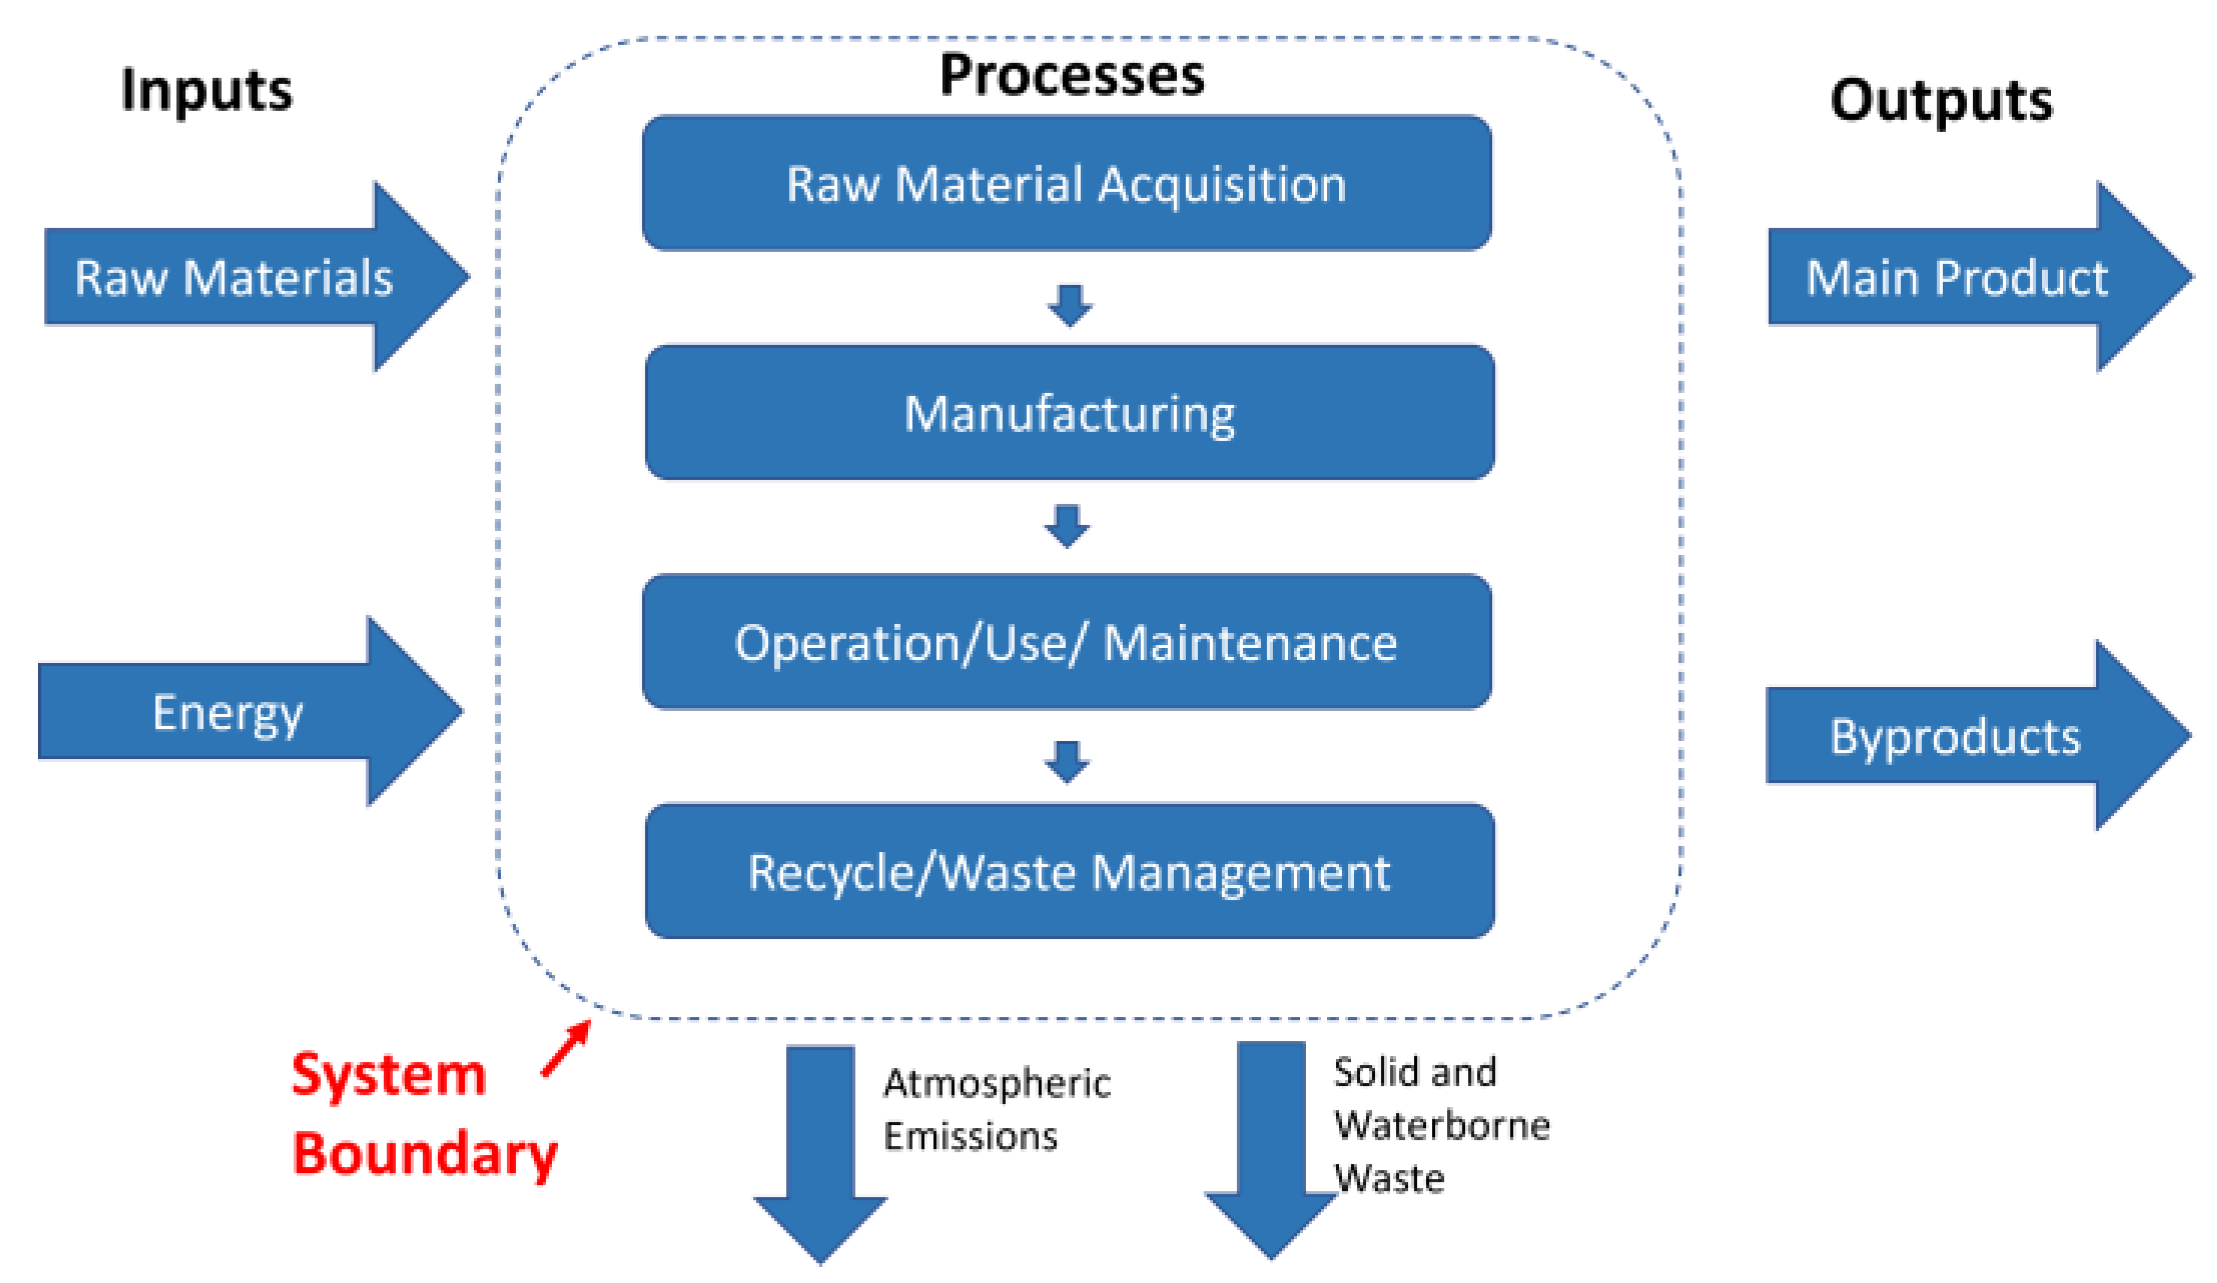
A unit process is represented in
Figure 2.
We define a cradle-to-gate burden vector {
B} for a life-cycle inventory per-unit production as in (1):
where
ctg stands for cradle to gate,
mp is material production stage,
mnf is manufacturing stage,
tr is transportation, and
oper is operation. We further define the material production energy of any process or product
{PEj} as the sum of the input energy of the
jth component, including materials, fuel, and electricity, as in (2):
where
Emp is the material production energy,
j is the number of components in the process or system,
PEj is the production energy of the
jth component,
mj is the number of components, and
Cj is the production efficiency of incorporating an amount
mj of material
j into the unit.
We then sum the cradle-to-grave environmental impact of the system for each step within the system boundary for each generating option, as in (3):
where
EI stands for environmental impact, and
ctgrave stands for cradle to grave.
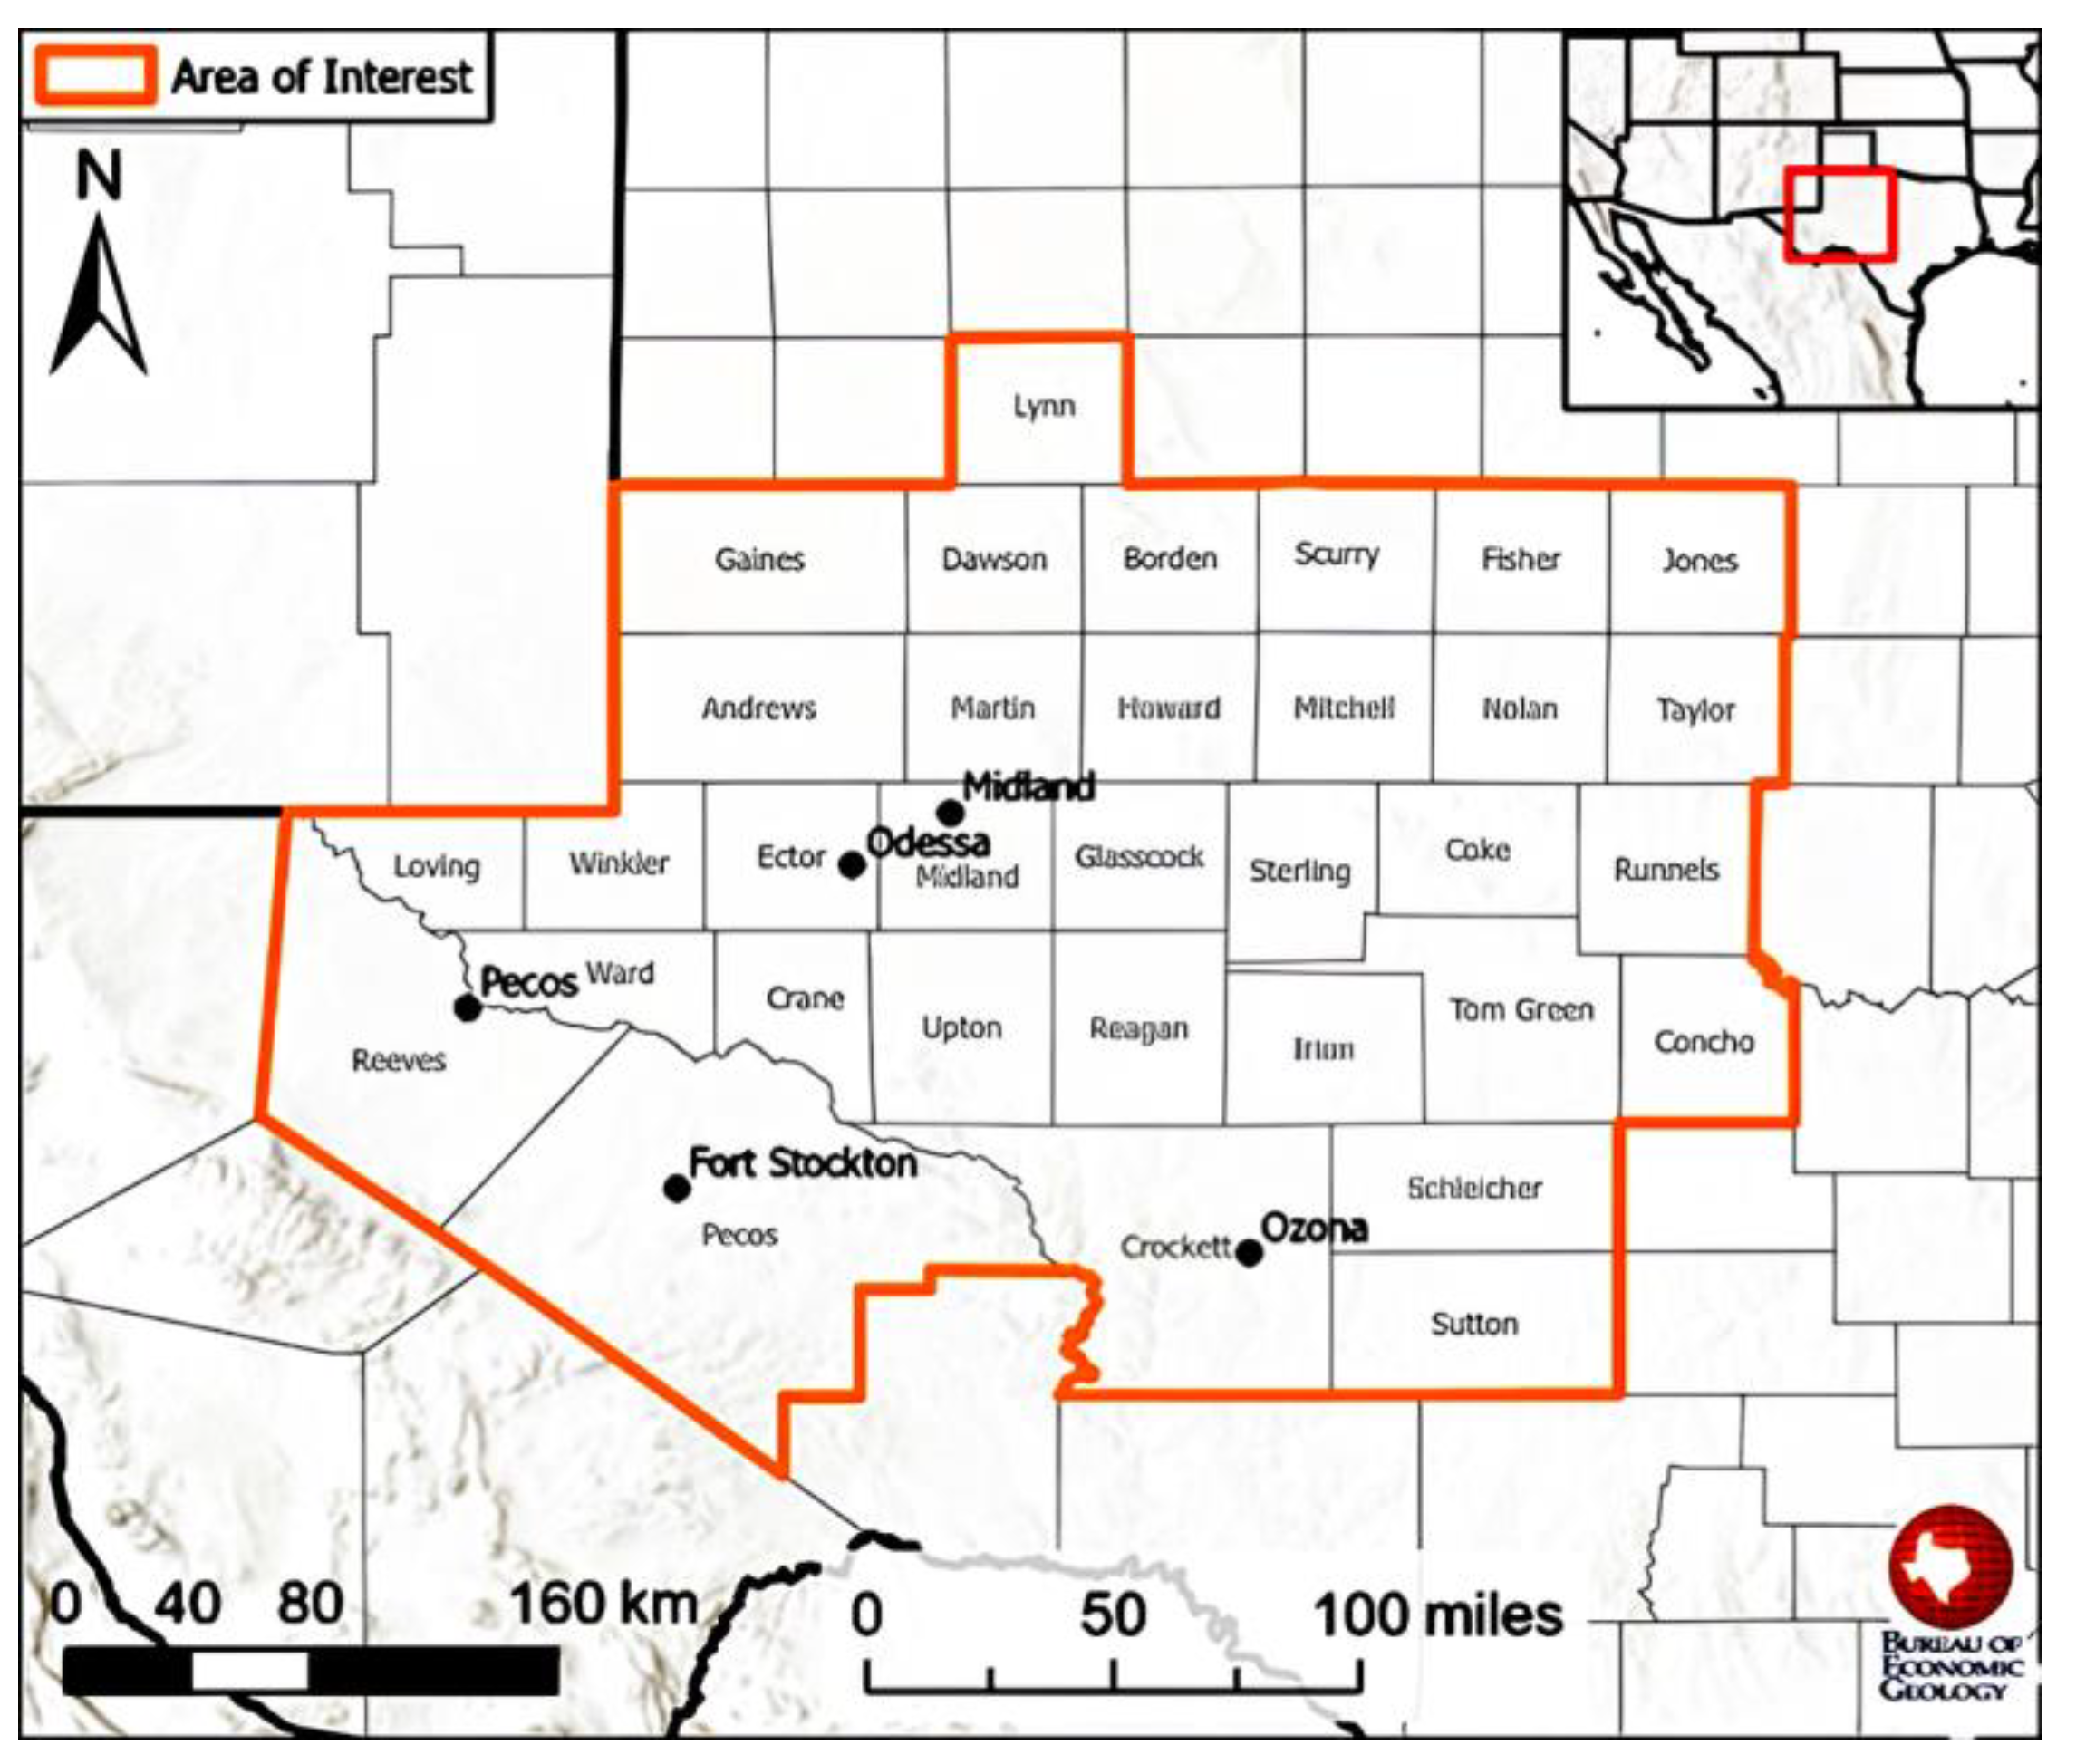
2.1. Area of Interest (AOI)
The area of interest (AOI) lies in the Permian Basin region of West Texas, U.S.A. (
Figure 3), a region with a century-long history of oil and gas development and currently the most prolific hydrocarbon basin in North America. The region, 194,250 km
2 (75,000 mi
2) in area, hosts significant wind and solar resources. The electricity-generation infrastructure is connected to a power grid that is managed by ERCOT (Electricity Reliability Council of Texas), separately from other system operations in the U.S.
2.2. Goal and Scope Definition
The goal of this work was to compare life-cycle environmental impacts of three electricity-generating technologies (CCGT, wind, solar PV), along with the use of a battery energy storage system (BESS) paired with wind and solar. The comparative LCA assumed that each generation technology generates an average of 3 terawatt hours (TWh) per year (
Table 1). To mimic the dispatchability of the CCGT plant, BESS was used to store electricity from wind and solar and to discharge this electricity on demand. The functional unit was 1 MWh of generation from the system under consideration.
The base case was generation from a 500 MW capacity CCGT power plant operating as a baseload facility at a 68% capacity factor for a period of 30 years (~90 TWh). The capacity factor is the average of two CCGT power plants operating as baseload facilities in the AOI over the 2018–2022 (according to EIA, the nationwide average capacity factor for CCGT power plants built between 2010 and 2022 was 64% [
30]) period. Wind and solar-PV power plants are sized for generating 90 TWh of electricity over 30 years at 31% and 26% capacity factors, respectively, again based on the performance of wind and solar facilities in the AOI (see the Sensitivity Analysis Section for details). Plants are oversized to allow for annual degradation of equipment so that the average annual generation would be 3 TWh (described in further detail in
Section 2.3.2 and
Section 2.3.3).
LCA system boundaries encompass the extraction of natural resources (natural gas, mining of minerals needed to manufacture PV panels, wind turbines, and batteries) and processing of extracted resources. Many of these activities, such as separation of hydrocarbon molecules and processing of ore and mixing of chemicals, use heat or other combinations of energy to produce a specific refined product or to obtain a product to help in further processing of a product needed. Manufacturing includes all processes needed to build power plants, including the building of gas turbines, a wind-turbine gearbox, nacelle and blades, solar cells, and panels and batteries. We included a grid mix at the location where the equipment was assembled and different modes of transporting materials to the facility and equipment from the manufacturing facility to the deployment site. After deployment, operations then include those processes involved in the generation of electricity and maintenance of the power plants, including replenishment of the fuel cycle (e.g., new wells needed to produce natural gas) and components (e.g., new battery packs to address degradation of battery capacity).We also captured the environmental impacts associated with transporting ore from source to processing, processed ore to manufacturing, manufactured equipment to the power plant site, and equipment to landfills after end of life. In each segment, detailed processes were considered. We also considered end-of-life disposal of power plant components. Owing to the considerable inconsistency across recycling practices of different technologies and the limited data available on emerging recycling practices, we did not consider the recycling of any component.
2.3. Life-Cycle Inventory
Data for processes and products studied in the life-cycle inventory (LCI) analysis were sourced from the U.S. Department of Energy (DOE), National Energy Technology Laboratory (NETL), and National Renewable Energy Lab (NREL), reports from the United Nations (e.g., United Nations Environment Programme), company reports, and peer-reviewed research. LCIs for secondary processes and their upstream processes were filled in using the Ecoinvent database (v. 3.8, [
31]). Individual elementary flows were verified for all upstream processes to avoid missing an association of impacts for any category. OpenLCA software (v. 1.10.3, GreenDelta, Berlin, Germany) was used for carrying out LCA analysis.
In this study, we built the inventory for the LCA using references and assumptions, as well as Ecoinvent (
Table 2). The following sections details the LCI of the energy-generating options that were studied.
2.3.1. Combined-Cycle Gas Turbine (CCGT)
Inventories associated with plant construction were based on [
17], whereas those of natural gas were based on [
14]. These LCIs target GWP and are comprehensive, with numerous scenarios covering almost all natural-ga- producing regions in the U.S. The area per pad of 15,000 m
2 was taken from [
34,
36,
37,
38], and we assumed a base case of five wells per pad as the midpoint for the Permian region. Along with the pads themselves, we accounted for support infrastructure (e.g., roads, pipelines, ancillary setups) using a multiplier of 2.2 × the pad area for land usage per unit of natural gas produced [
34]. Water needed to hydraulically fracture each natural gas well was estimated using a well-by-well analysis in the Permian Basin and was within the range of Du et al. (2022) [
39]. We used a proportion-weighted, average water volume to extract the gas, assuming an AG–NAG mix in the Permian Basin of 79% to 21%. A detailed LCI system boundary can be found in the
Supplementary Materials (Figure S1). We accounted for the transportation of materials between life-cycle phases. We also assumed that the total weight of the CCGT facility was 381 tons, 90% of which is sourced outside the U.S., mainly low-alloyed steel, aluminum, and cast iron from Canada, South Korea, and Mexico, 31% (106 tons) of which is through sea transport of 11,400 km, and 69% (236 tons) of which is over land spanning 2000 km. The amount of material carried over the land route is almost 2.5 times that of the material carried over the sea.
2.3.2. Wind Turbine (WT)
A 3 MW capacity wind turbine was used in this work, given that the average turbine capacity installed in Texas in 2021 was 2.9 MW, with about 18,552 actively operating turbines in the state ranging in capacity from 2.0 to 4.8 MW [
40]. Using a base case capacity factor of 31% (
Table 1), we assumed construction of 424 3 MW turbines. Staffell and Green (2014) [
41] suggested 1.6% degradation using a UK database, and Hamilton et al. (2020) [
42] suggested 0.5% for older vintages and 0.2% for newer vintages. We overbuilt the facility in year 0 to account for 1% annual degradation (considering earlier references) in turbine performance so that the total generation over 30 years would be about 90 TWh. The base case capacity factor was assumed to be 31%. Inventory was modelled separately, with the quantitative reference being the turbine unit itself, with recently published literature being used (e.g., [
20,
22,
32,
43,
44]). The distance of sea and land transport was assumed to be the same as that of the CCGT. We estimated that 28% of the material for each turbine was sourced from outside the U.S., including chromium steel, aluminum, and cast iron from Canada and Mexico [
45], 39% of which was transported over land and 61% over sea. The weight of material for each turbine to be transported was 1384 tons.
We then estimated the LCI for a single unit and multiplied the values by the total number of units needed in year 0. The concrete used in each tower foundation (125 m
3 of concrete per MW [
46]) was 50 MPa, high-strength material, with an assumed concrete density of 2400 kg/m
3. The operation of wind turbines requires nominal maintenance and repair that includes crew travel; we assumed a 50 km travel distance per year. At the end of 30 years, all parts are decommissioned, with metal parts turned into scrap, concrete into waste concrete, and blades incinerated. A detailed LCI system boundary is included in the
Supplementary Materials (Figure S2).
2.3.3. Solar-Photovoltaic (PV) Systems
Solar-PV system capacity was rated at 1435 MW, accounting for an annual degradation of 0.6% [
47] and a base case capacity factor of 26%. A total of 3,262,117 panels (440 W each) were needed, and major processes were the growing of silicon from mining of quartz to mono- and multicrystalline forms. These were then transformed into wafers and cells and followed by panel and laminate assembly, with monocrystalline and cadmium telluride technologies being considered for power generation. These were the most efficient, commercially viable options being deployed around the world at the time of this analysis. The LCI for these processes was taken from Frischknecht et al. (2016) [
32], and land use was 2.02 hectares (5 acres) per MW of generation capacity [
48]. Each panel area measured around 7.02 km
2, with each panel weighing 18.1 kg (40 lb), and all were imported from China. Most (98%) of the panels were transported by sea, the remaining over rail and road. Based on feedback from solar industry experts, we assumed that five full-time technicians would be needed for site maintenance. Also, a total of 10,000 km of driving per year per technician was assumed as an operational cost, and landscaping in the solar generating plant was the only other maintenance activity considered (i.e., periodic cleaning of solar modules was not considered). At end of life (decommissioning), we assumed that removing one solar module, stacking it on pallets, and loading by forklift would take about 10 min and would be followed by shipping to landfill. A detailed LCI system boundary is included in
Supplementary Materials (Figure S3).
2.3.4. Battery Energy Storage Systems
Lithium-iron phosphate (LFP) batteries with 500 MW capacity were the energy storage system used for this study. BESS delivers energy for 4 h daily for 30 years or about ~22 TWh. To account for battery degradation and maintain the same dispatch capability, the original battery was augmented with additional storage capacity in the 3rd, 7th, and 14th year before a complete replacement in the 21st year (
Table 3). For wind + BESS and solar + BESS systems, we assumed that batteries would be charged from solar and wind sources during excess generation hours (and not from the grid). The battery installed capacity was higher than the required capacity, with cell degradation and efficiency being considered. Augmentation ensured that the usable capacity of the battery would be retained at 100% in each time interval. A detailed LCI system boundary is included in
Supplementary Materials (Figure S4).
2.4. Life-Cycle Impact Assessment
With the LCI established for each process, life-cycle impact assessment (LCIA) then quantifies and groups the effects of LCI throughout the product life cycle into a tractable number of impact categories, which can then be either ranked or weighted based on the relative importance and nature of the specific questions being asked.
We used the characterization factors from ReCiPe 2016 [
12] to quantify the environmental impact relative to a baseline condition per unit of functional unit (in our case, MWh of electricity generation) (
Table S1). The ReCiPe 2016 midpoint H (hierarchist) LCIA method used in this study is based on a scientific consensus of time frame and likelihood of impact mechanisms. Impact categories included in the analysis are shown in
Table 4.
2.5. Sensitivity Analysis
Although a strong rationale or sufficient data were not always available to assess the sensitivities of all inputs, data were available on the capacity factor of power plants in the AOI over the 2018–2022 period. The capacity factor will impact the installed capacity of facilities needed to meet our research design requirement of lifetime generation equivalency. Thus, given the strong connection between facility capacity and the environmental load for sourcing and constructing the facilities themselves, as well as an uncertain capacity factor of our facility in question, we conducted a sensitivity analysis to determine environmental impact. Fluctuations in capacity factor (from year to year and facility to facility) were due to several factors, including changes in electricity load in the region versus export needs, the availability of transmission capacity to export, plant operational issues, and market conditions. In our assessment, the wind capacity factor was based on the average performance of wind power plants in the AOI during the 2018–2022 period and excluded facilities performing below/above two standard deviations of the mean capacity factor. To determine the mean solar-PV capacity factor, with a large sample size, we considered only facilities in the AOI that generated electricity for a full year in 2022 (The number of solar power plants that generated electricity for a full year were 7, 12, 16, 28 and 45 in 2018, 2019, 2020, 2021, and 2022, respectively) and excluded facilities performing below/above two standard deviations of the mean capacity factor. The resulting analyses of all power plants in the AOI led to a mean and upper/lower values of capacity factors of CCGT (mean 68% and range between 56% and 76%), wind (mean 31% and range between 14% and 48%), and solar PV (mean 26% and range between 21% and 31%) (
Table 5).
3. Life-Cycle Assessment Results
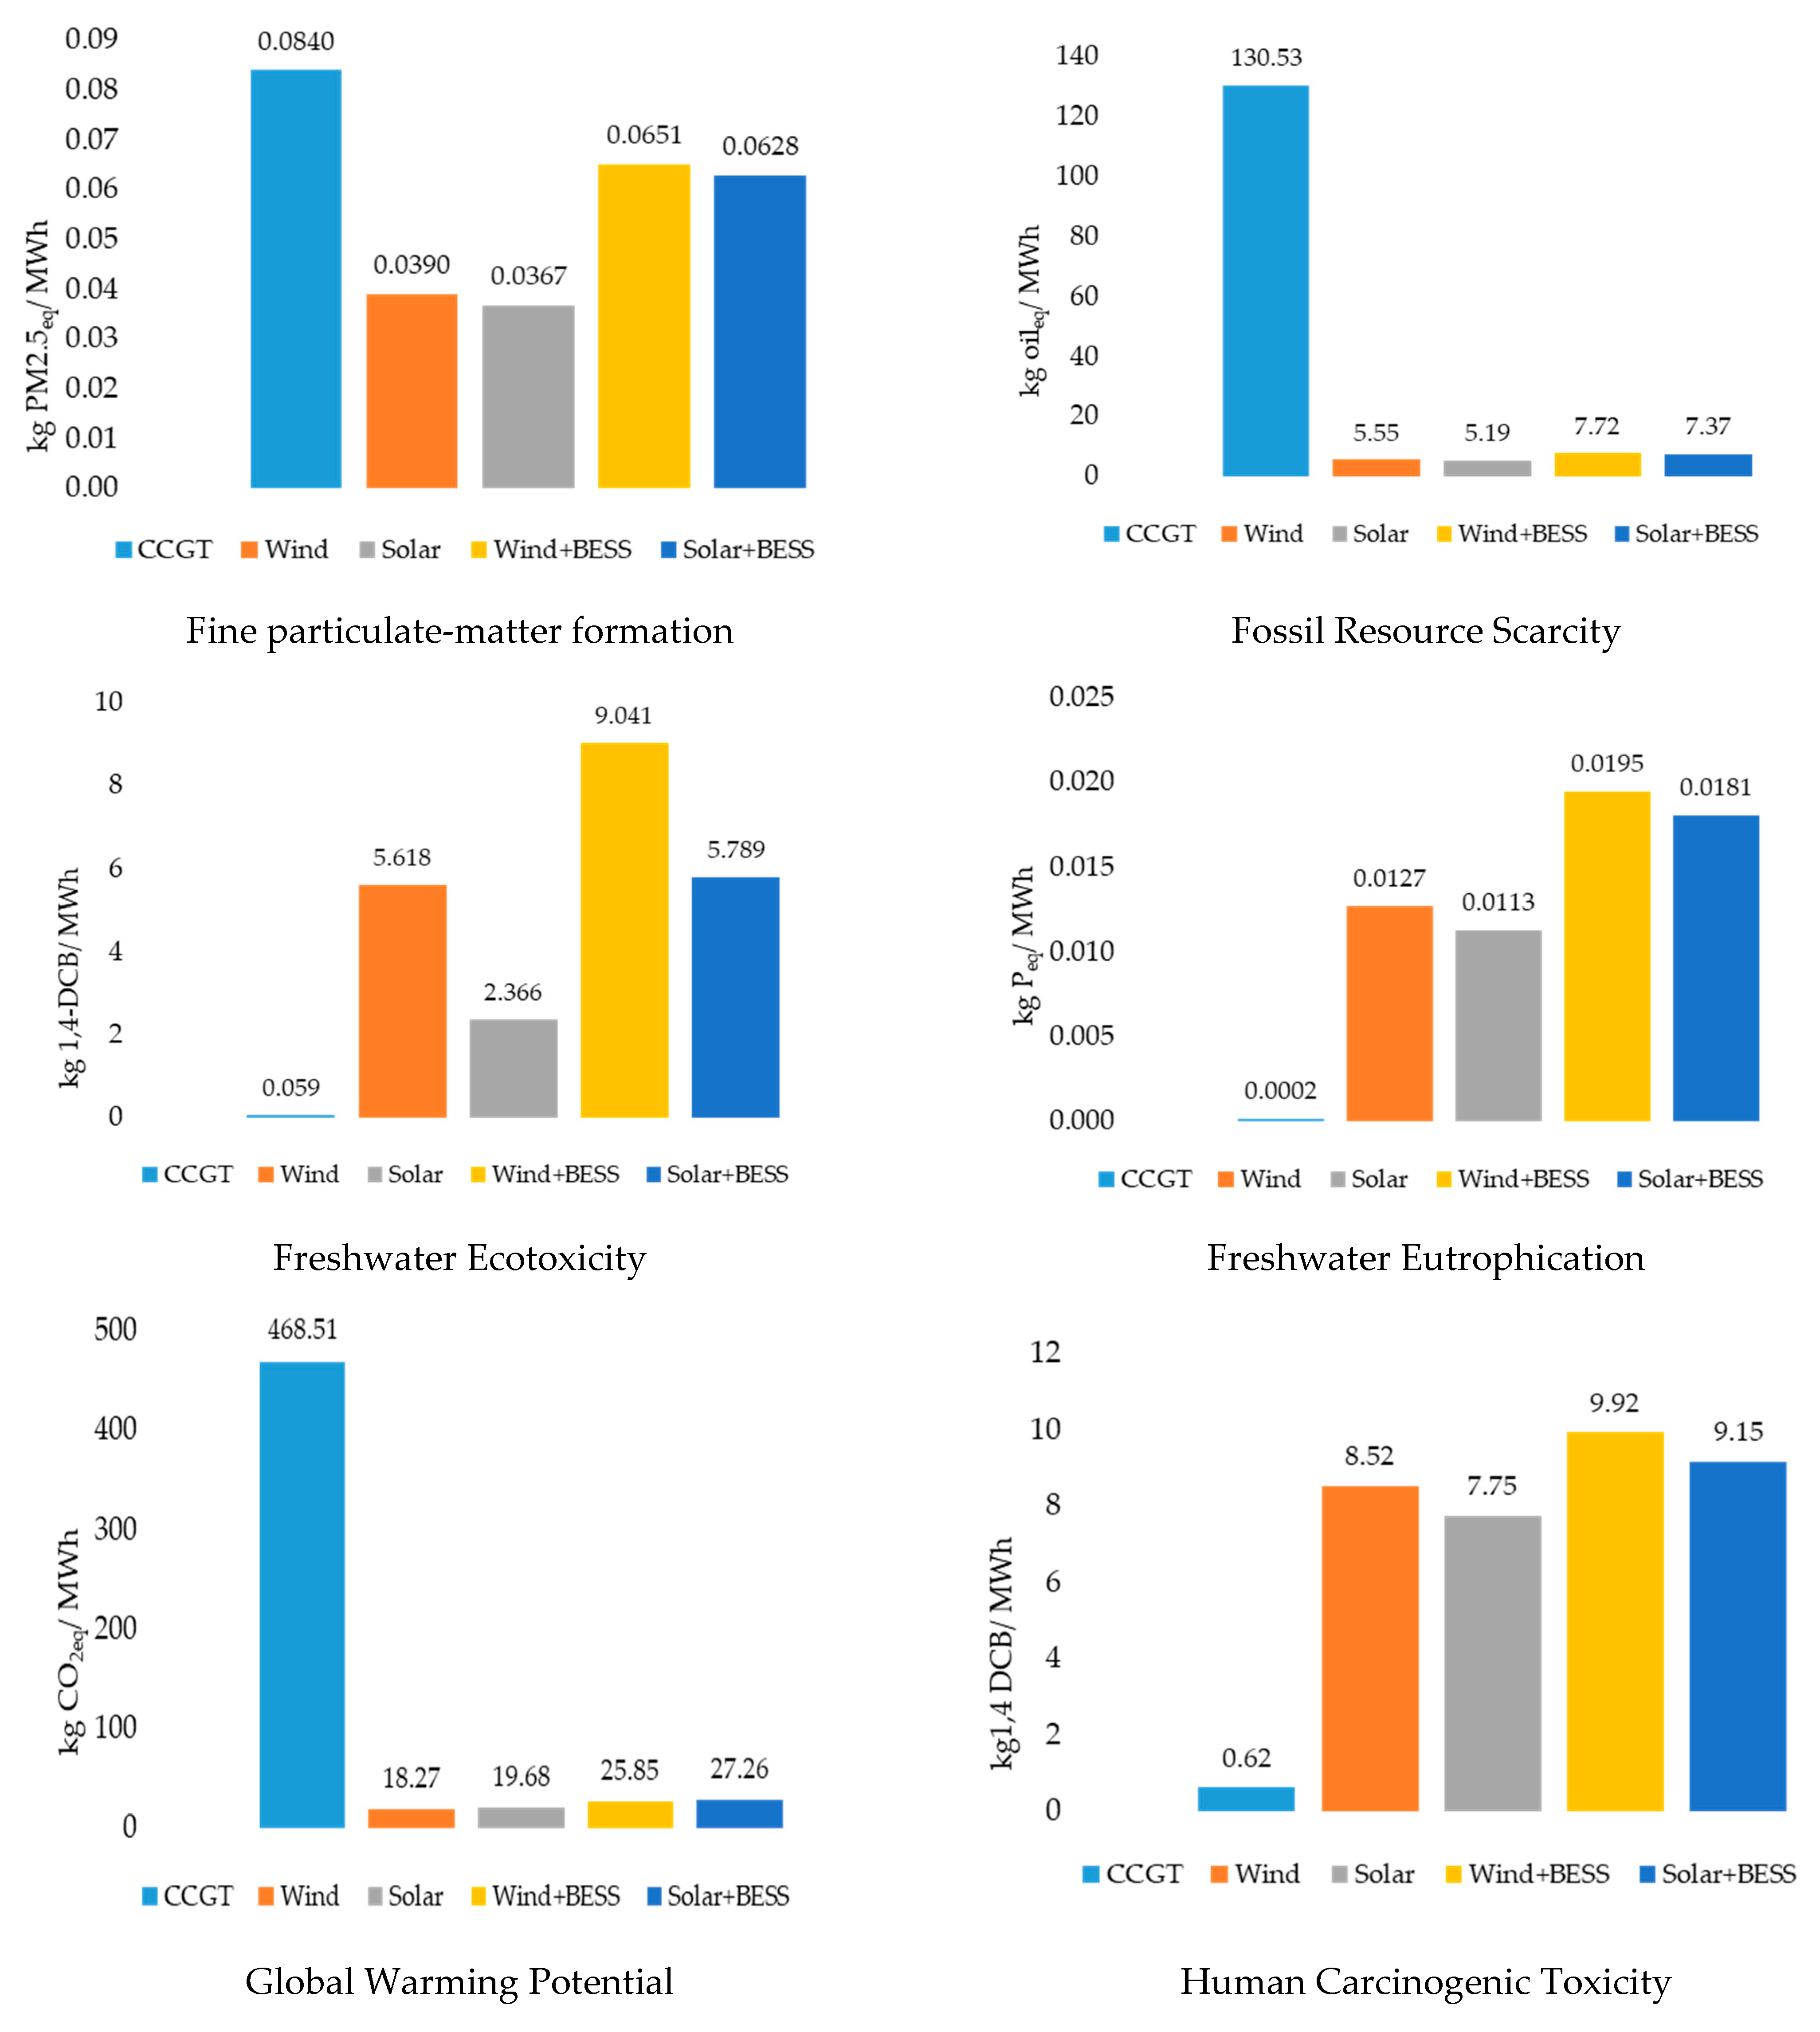
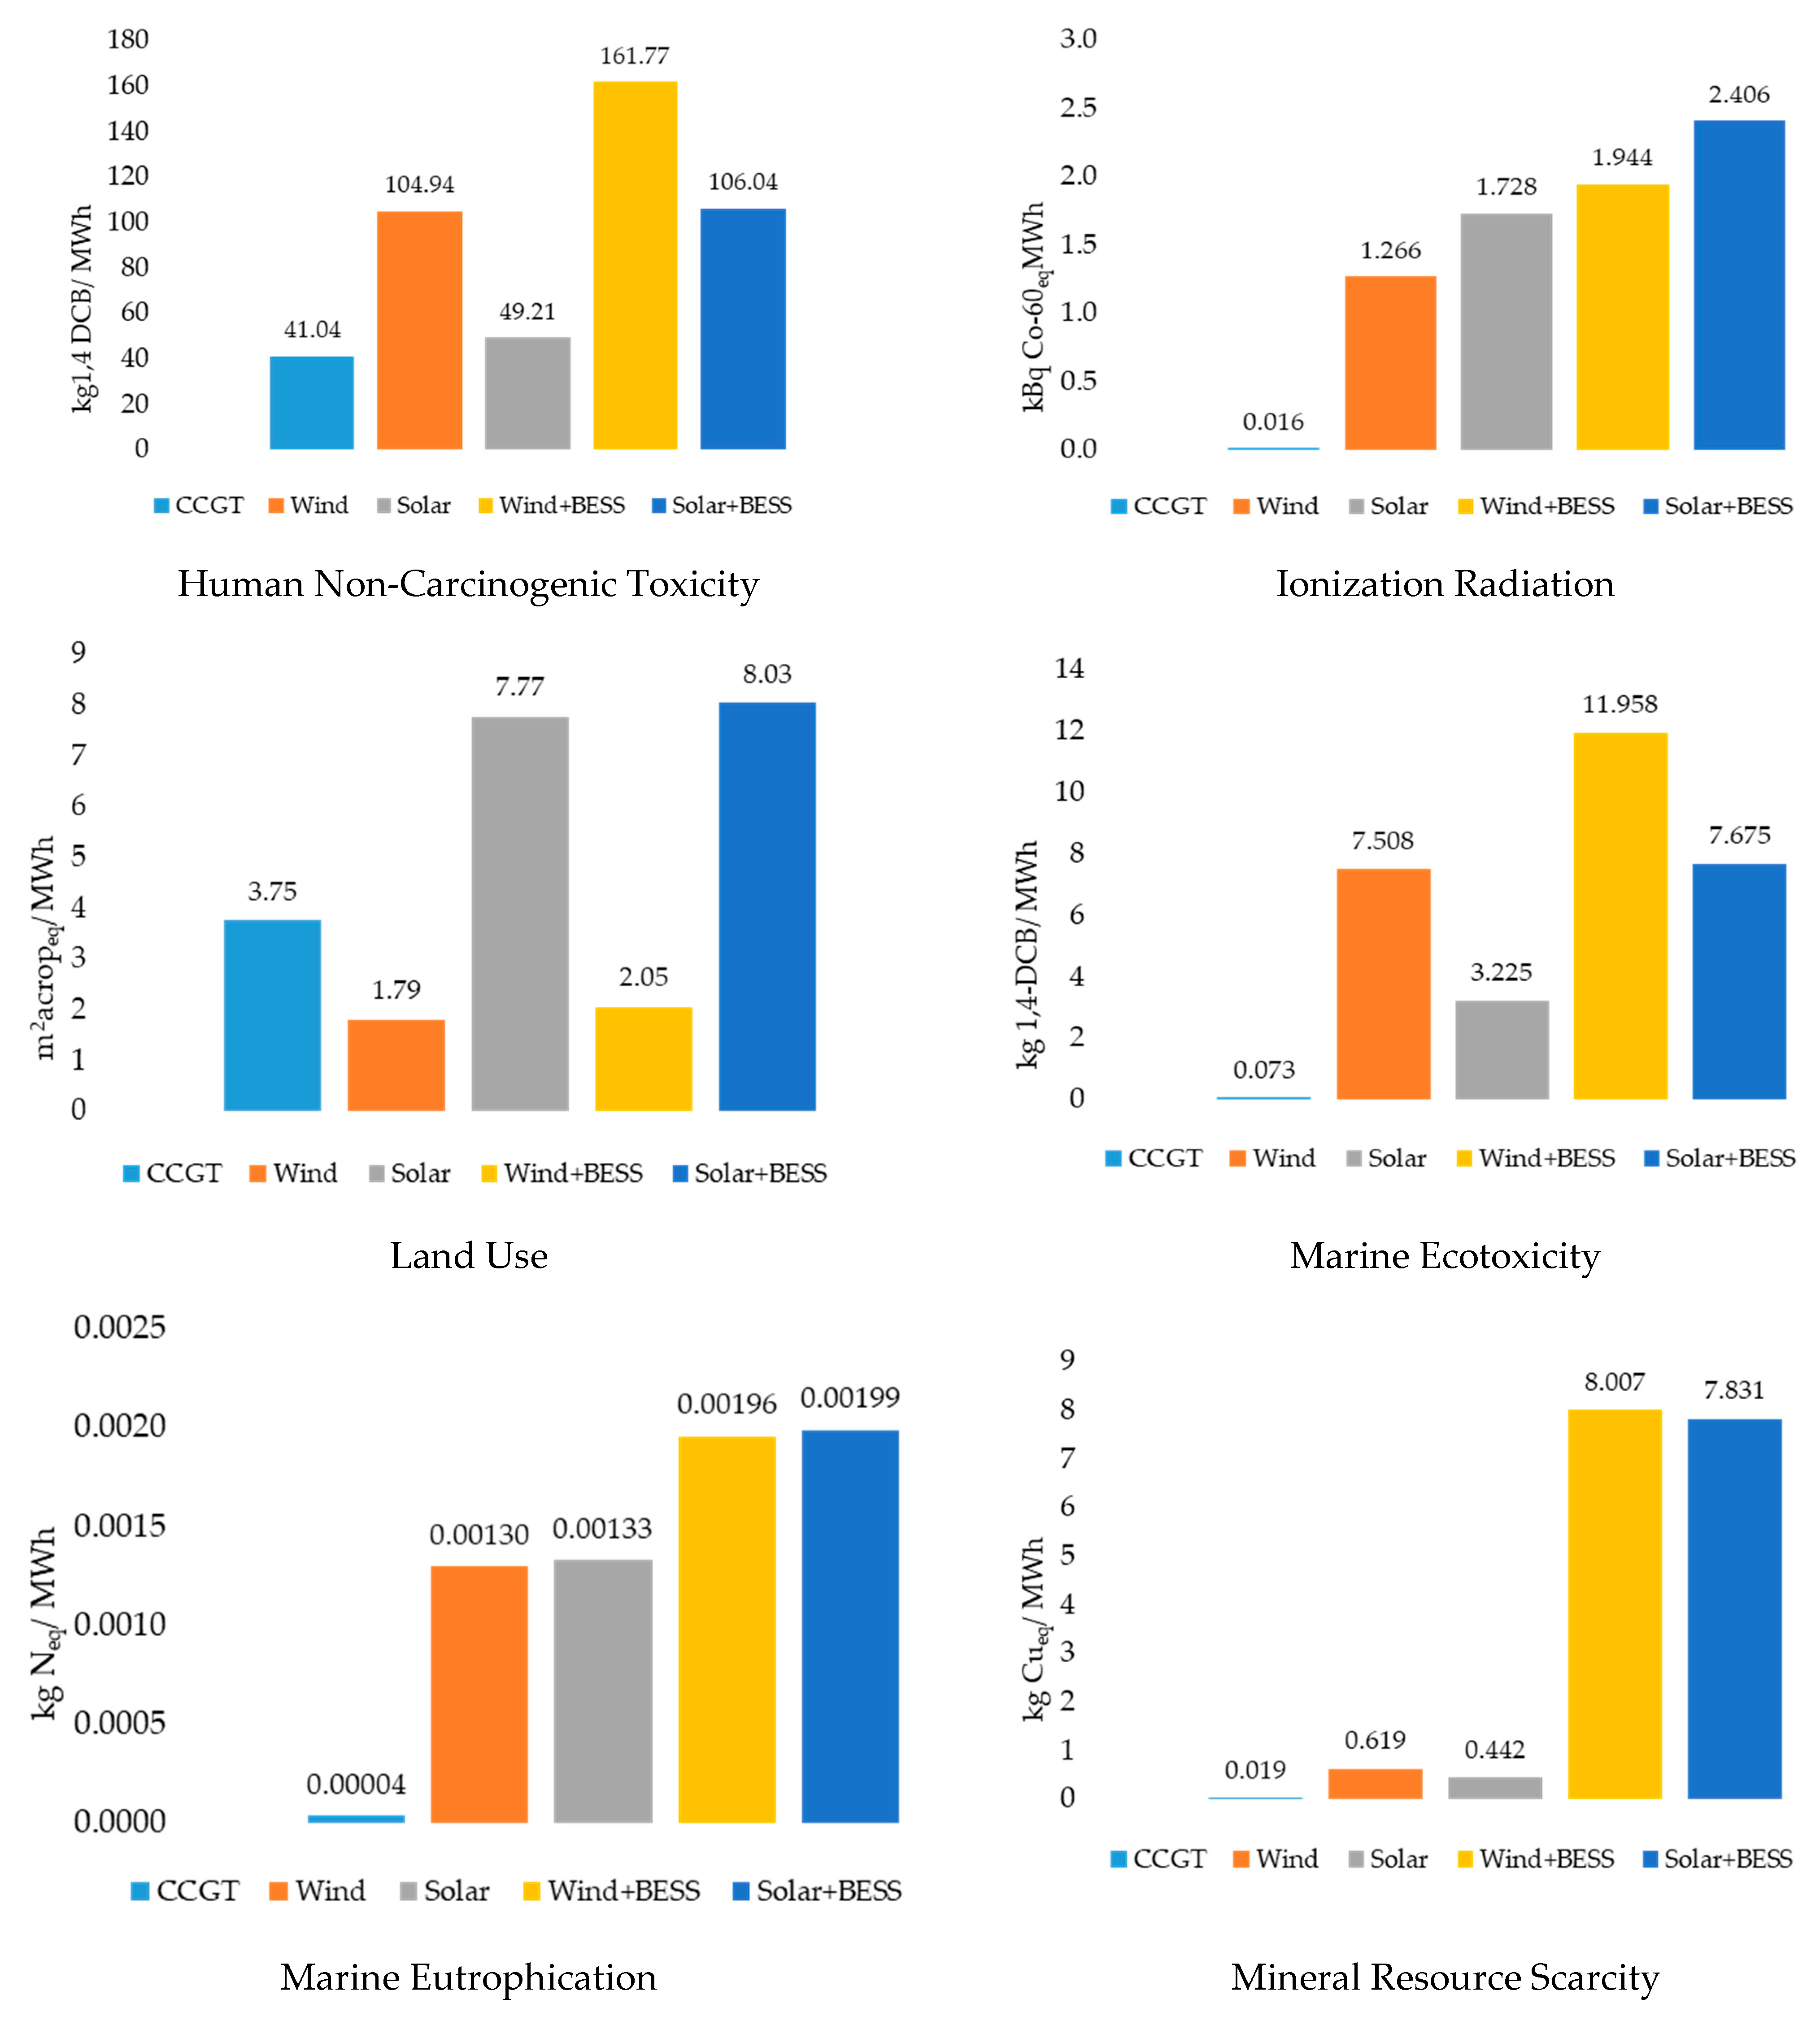
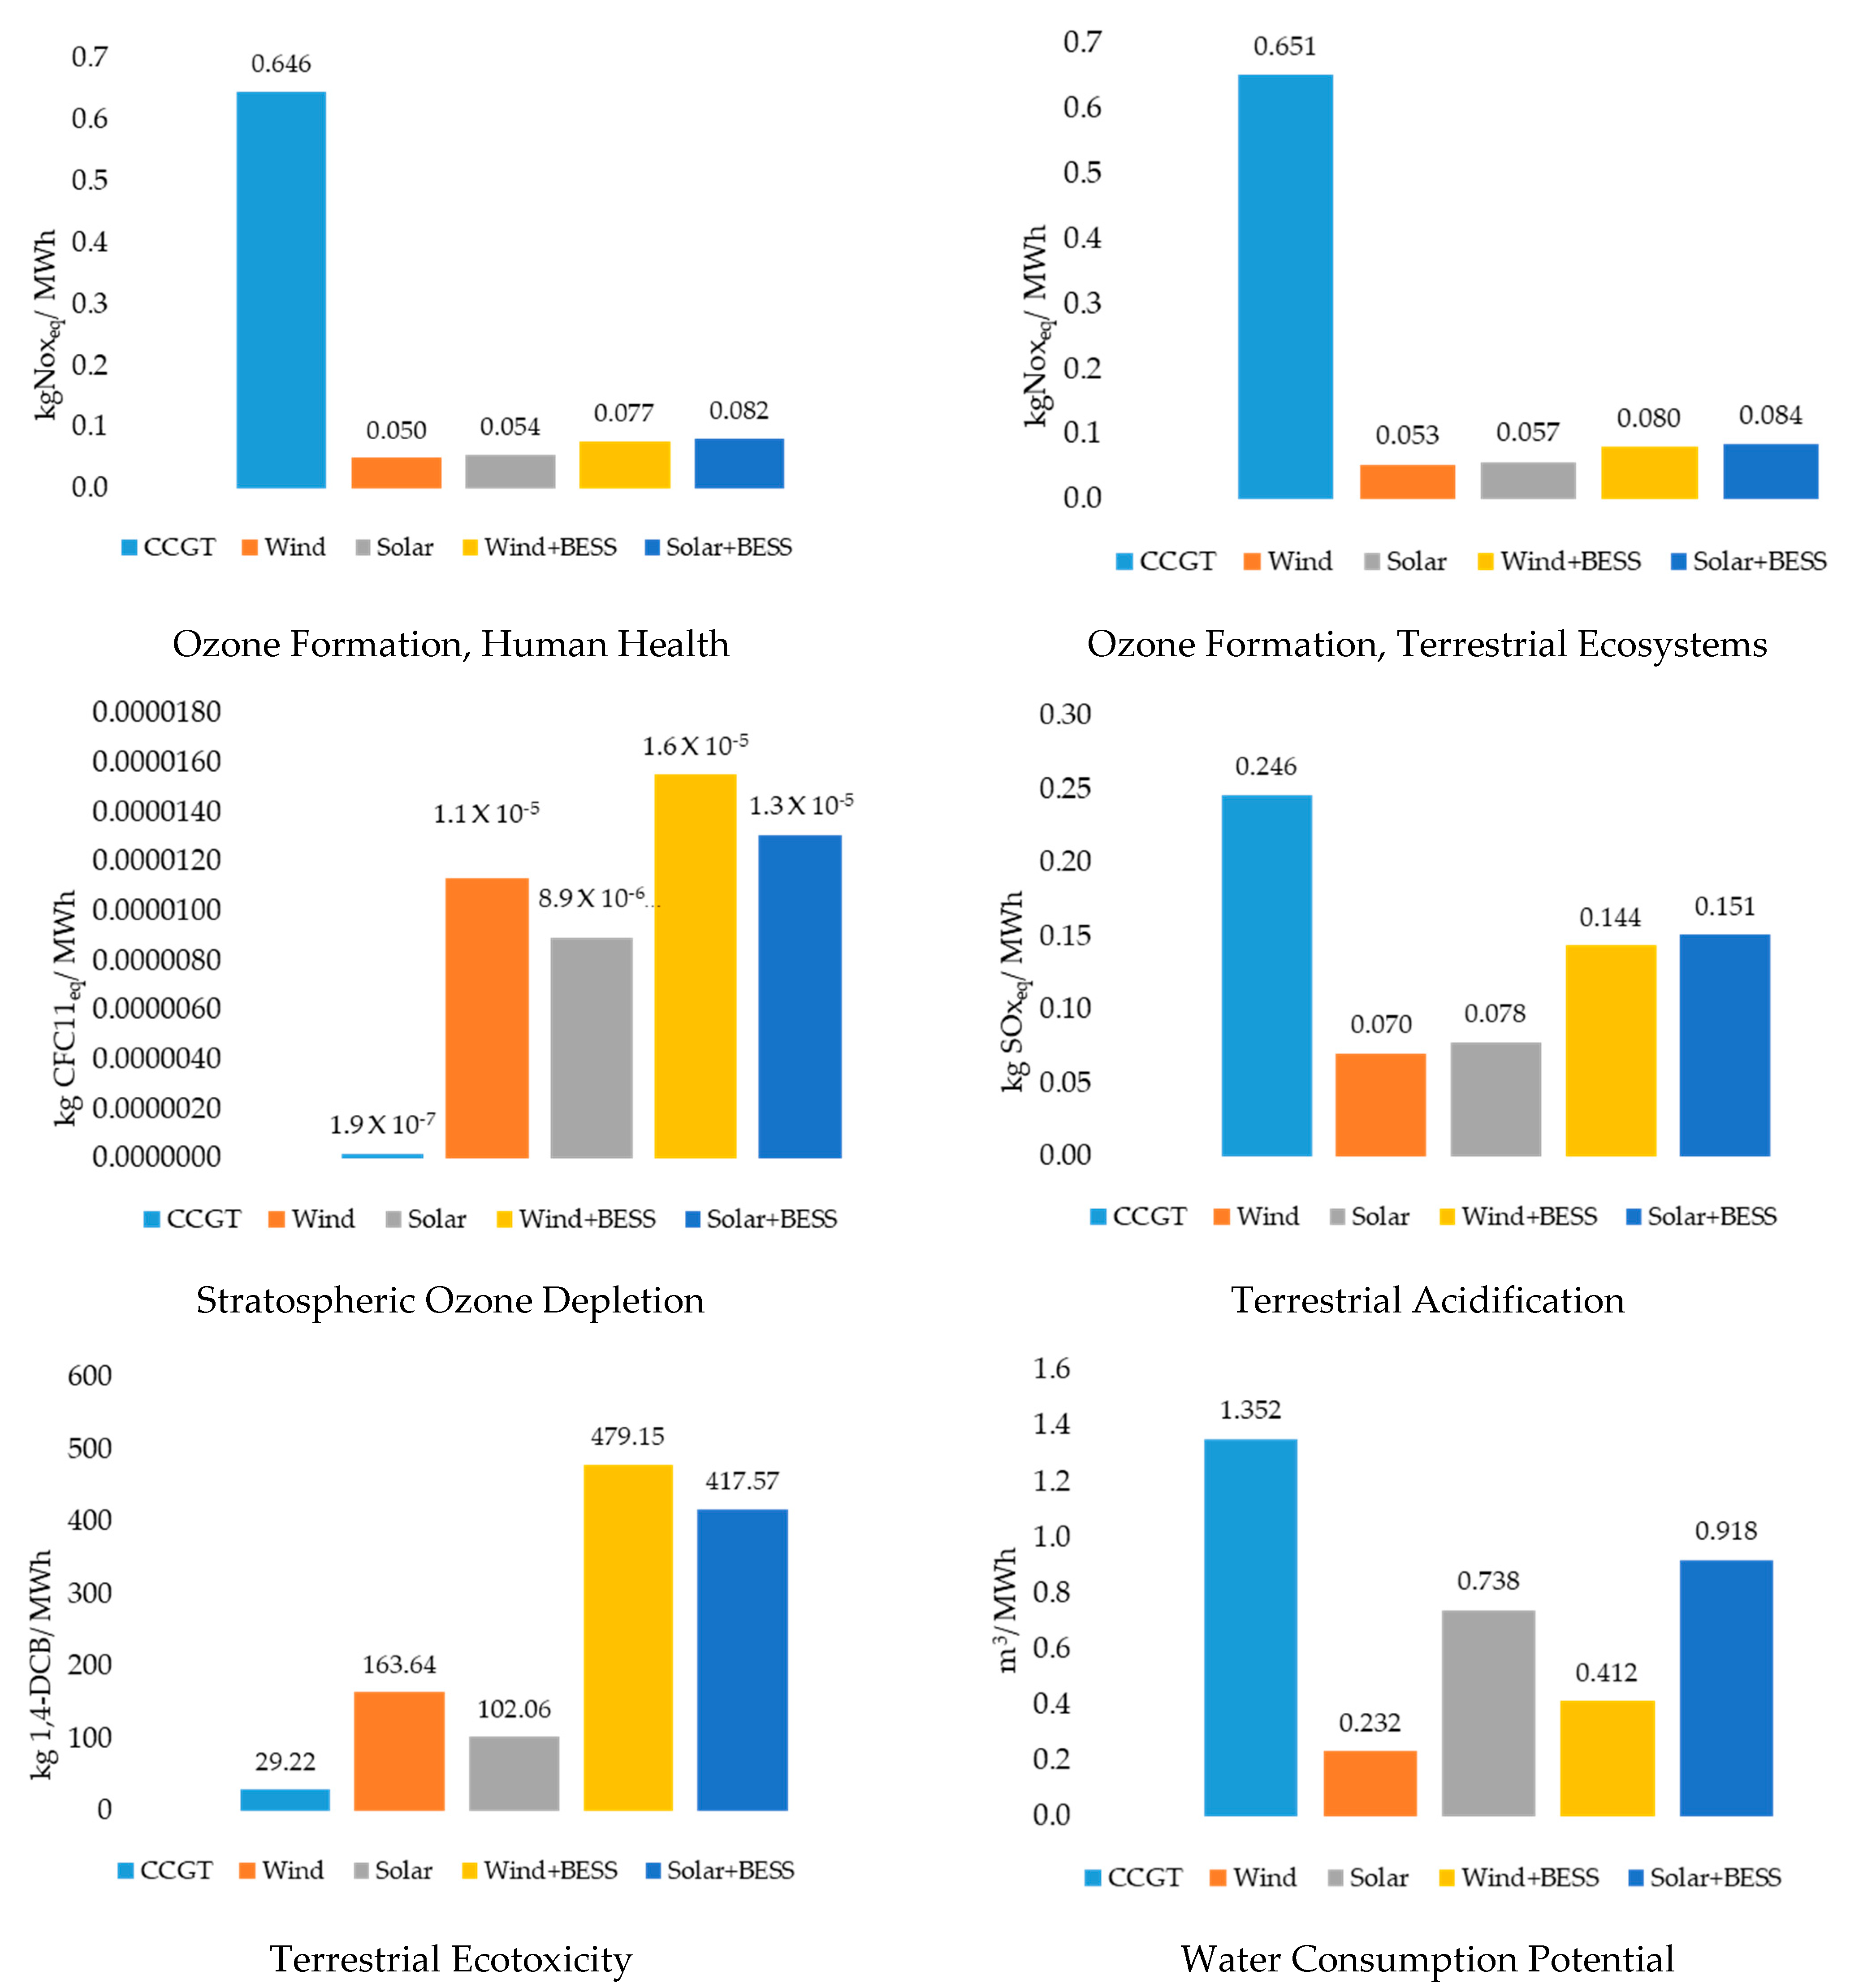
The detailed LCA results with all 18 impacts on each power plant technology can be found in the Supplementary Materials (Figures S5–S12, Table S2). Here, we compare the five power plant options to answer our first three research questions (per MWh impacts tabulated in Table S3) and we compare environmental impacts (
Figure 4) to help answer Q1 and Q2. The results showed that the impacts from CCGT were the highest in fine particulate matter formation, fossil-fuel resource scarcity, global warming potential, ozone formation (both types), terrestrial acidification, and water consumption. Results show that impacts from CCGT were 17–26 times larger for both fossil fuel scarcity and GWP and were 7–13 times larger for ozone formation than those of all other options. Land use for CCGT was double that of wind generation, but about half that of solar, with or without BESS.
In contrast, freshwater ecotoxicity and eutrophication, human carcinogenic toxicity, ionizing radiation, marine ecotoxicity and eutrophication, mineral resource scarcity, and stratospheric ozone depletion from wind and solar facilities (across our system boundaries) were orders of magnitude larger than those of CCGT. The charts for the 18 environmental impacts are shown in
Figure 4.
Battery storage, when added and because of current technology and the global supply chain, increases all impacts associated with wind and solar (Q2). Adding BESS to wind increases most impacts by between 40% and 70%. Exceptions on the low end are human carcinogenic toxicity (16%) and land use (15%) and on the high end, terrestrial ecotoxicity (193%) and terrestrial acidification (106%). However, mineral resource scarcity increases by about 1200% because of the mining needed to extract necessary amounts of lithium. Adding BESS to solar leads to a wider range of increases in impact levels, with more than half of the impacts increasing by between 40% and 70% (as in the case of wind). At the low end, land use increases by only 3% and human carcinogenic toxicity only by 18%. At the high end, we observe increases in freshwater ecotoxicity (145%), human non-carcinogenic toxicity (115%), marine ecotoxicity (138%), and terrestrial ecotoxicity (309%). Again, however, mineral resource scarcity increases by almost 1700%.
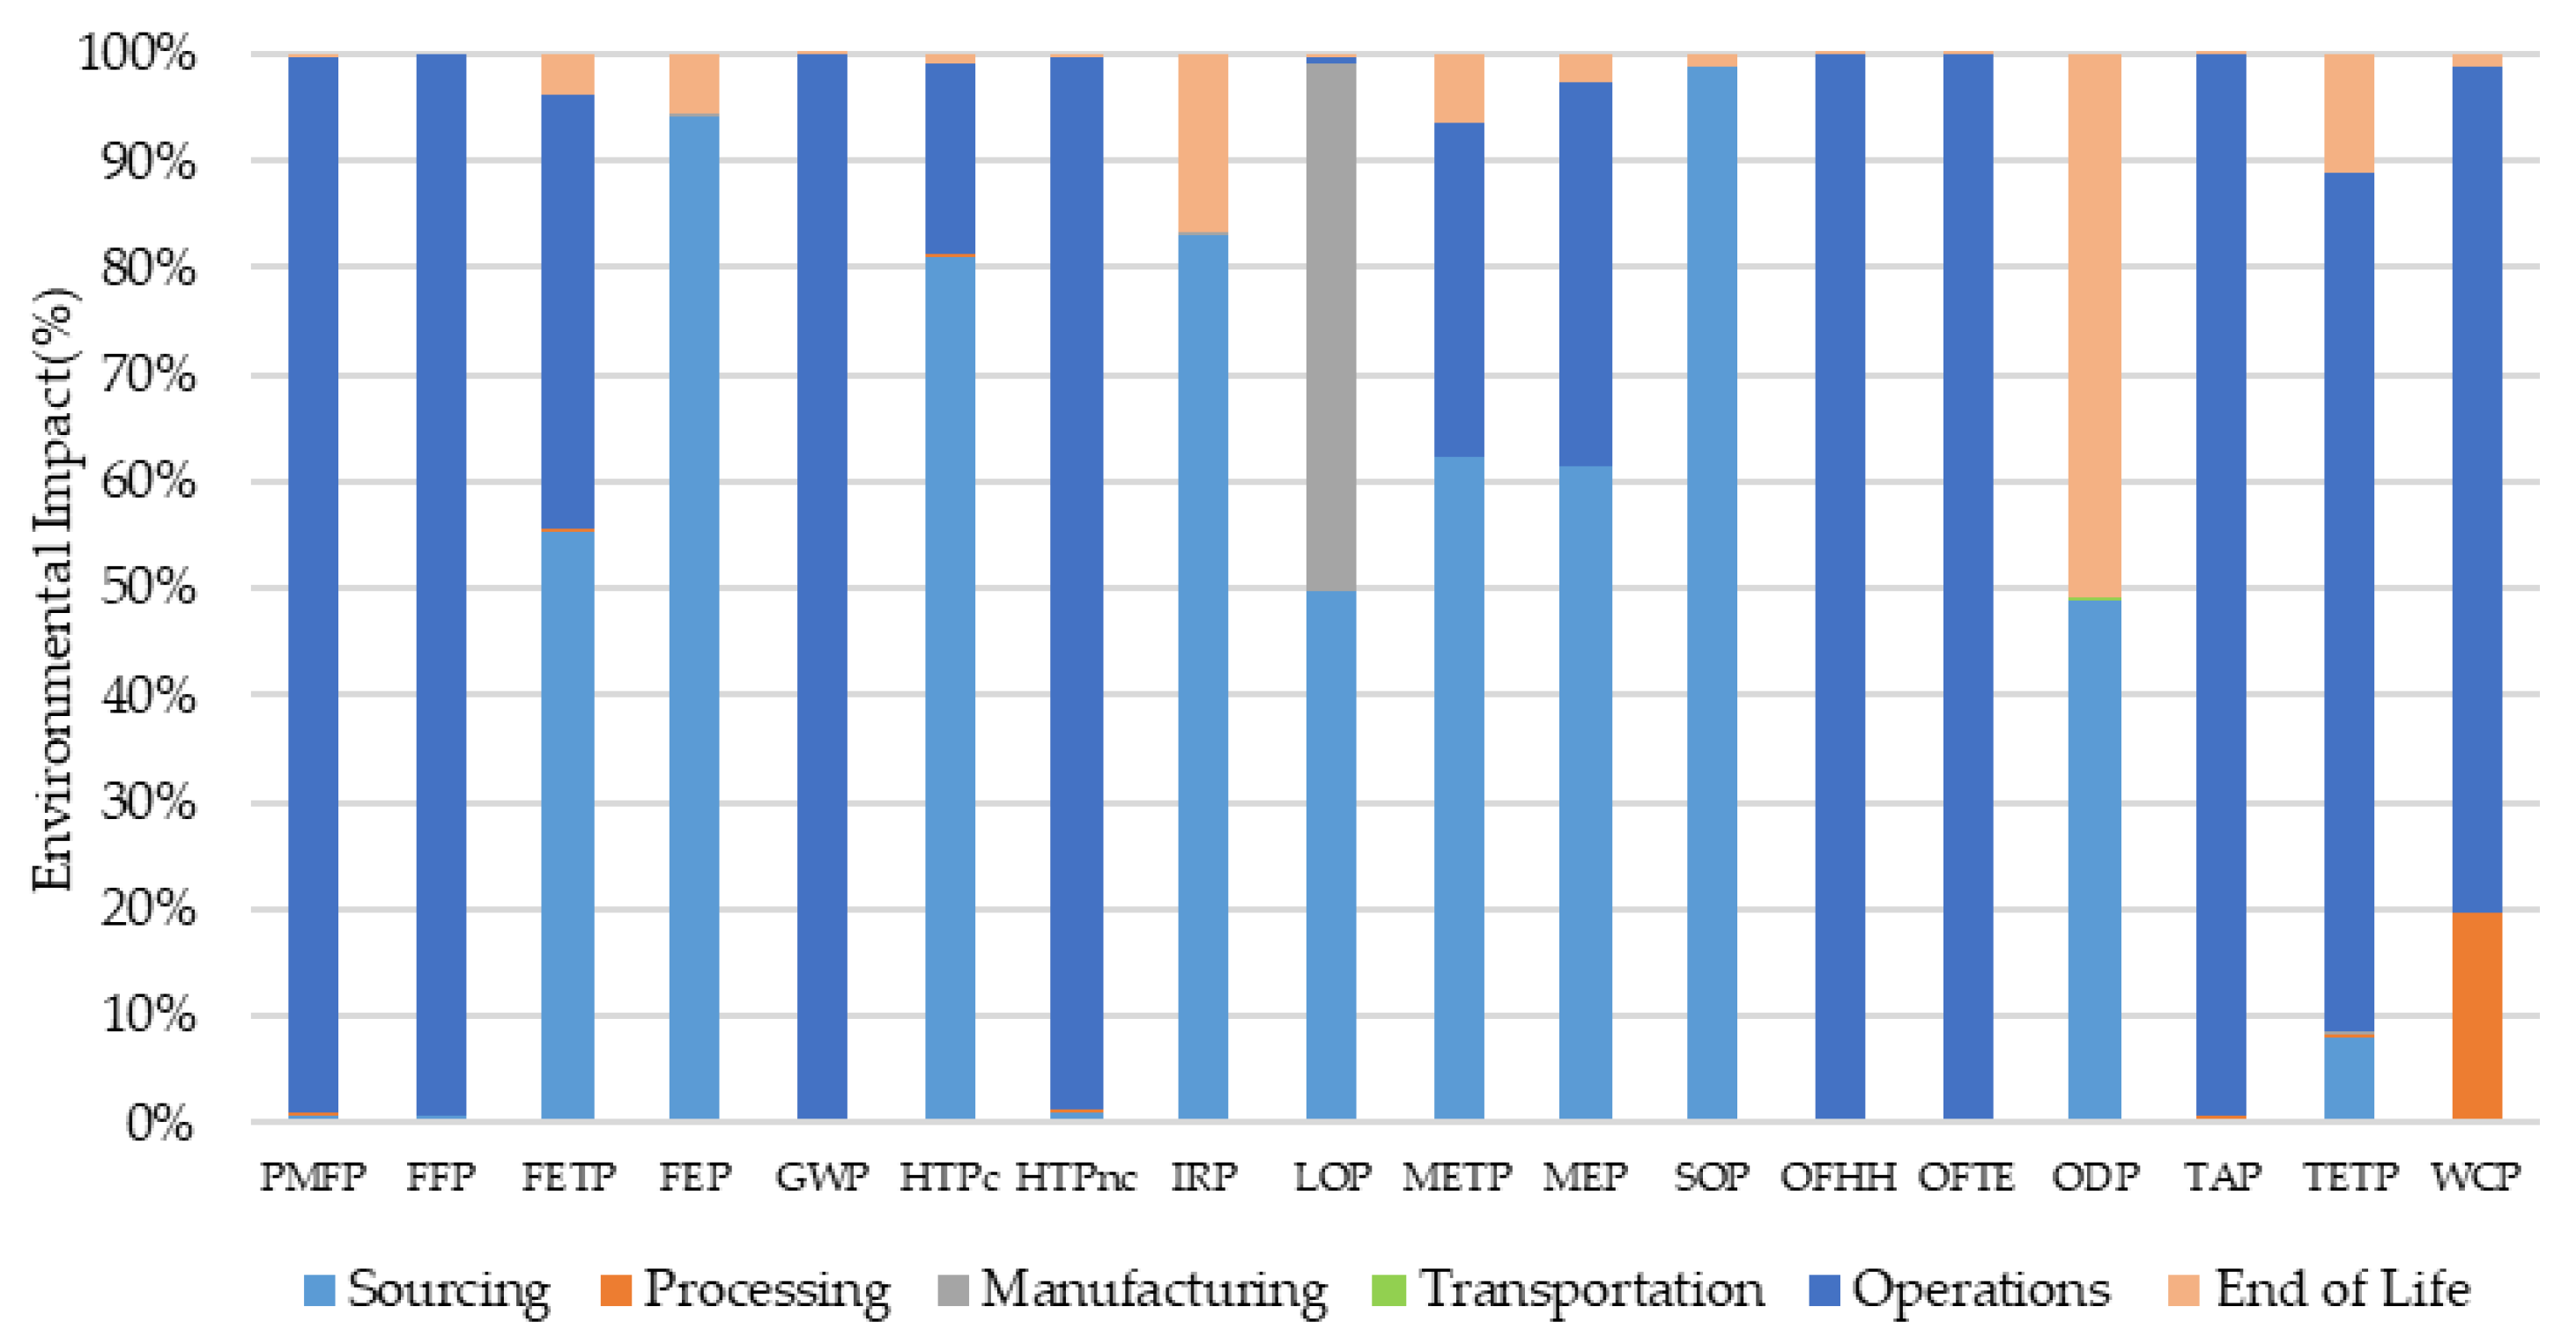
At the same time, opportunities are available for reducing impacts. Comparison of the distribution of impacts across life-cycle phases is a useful step for focusing attention on identifying these opportunities and answering Q3. Note that most of the impacts associated with CCGT occurred during sourcing and operations phases (
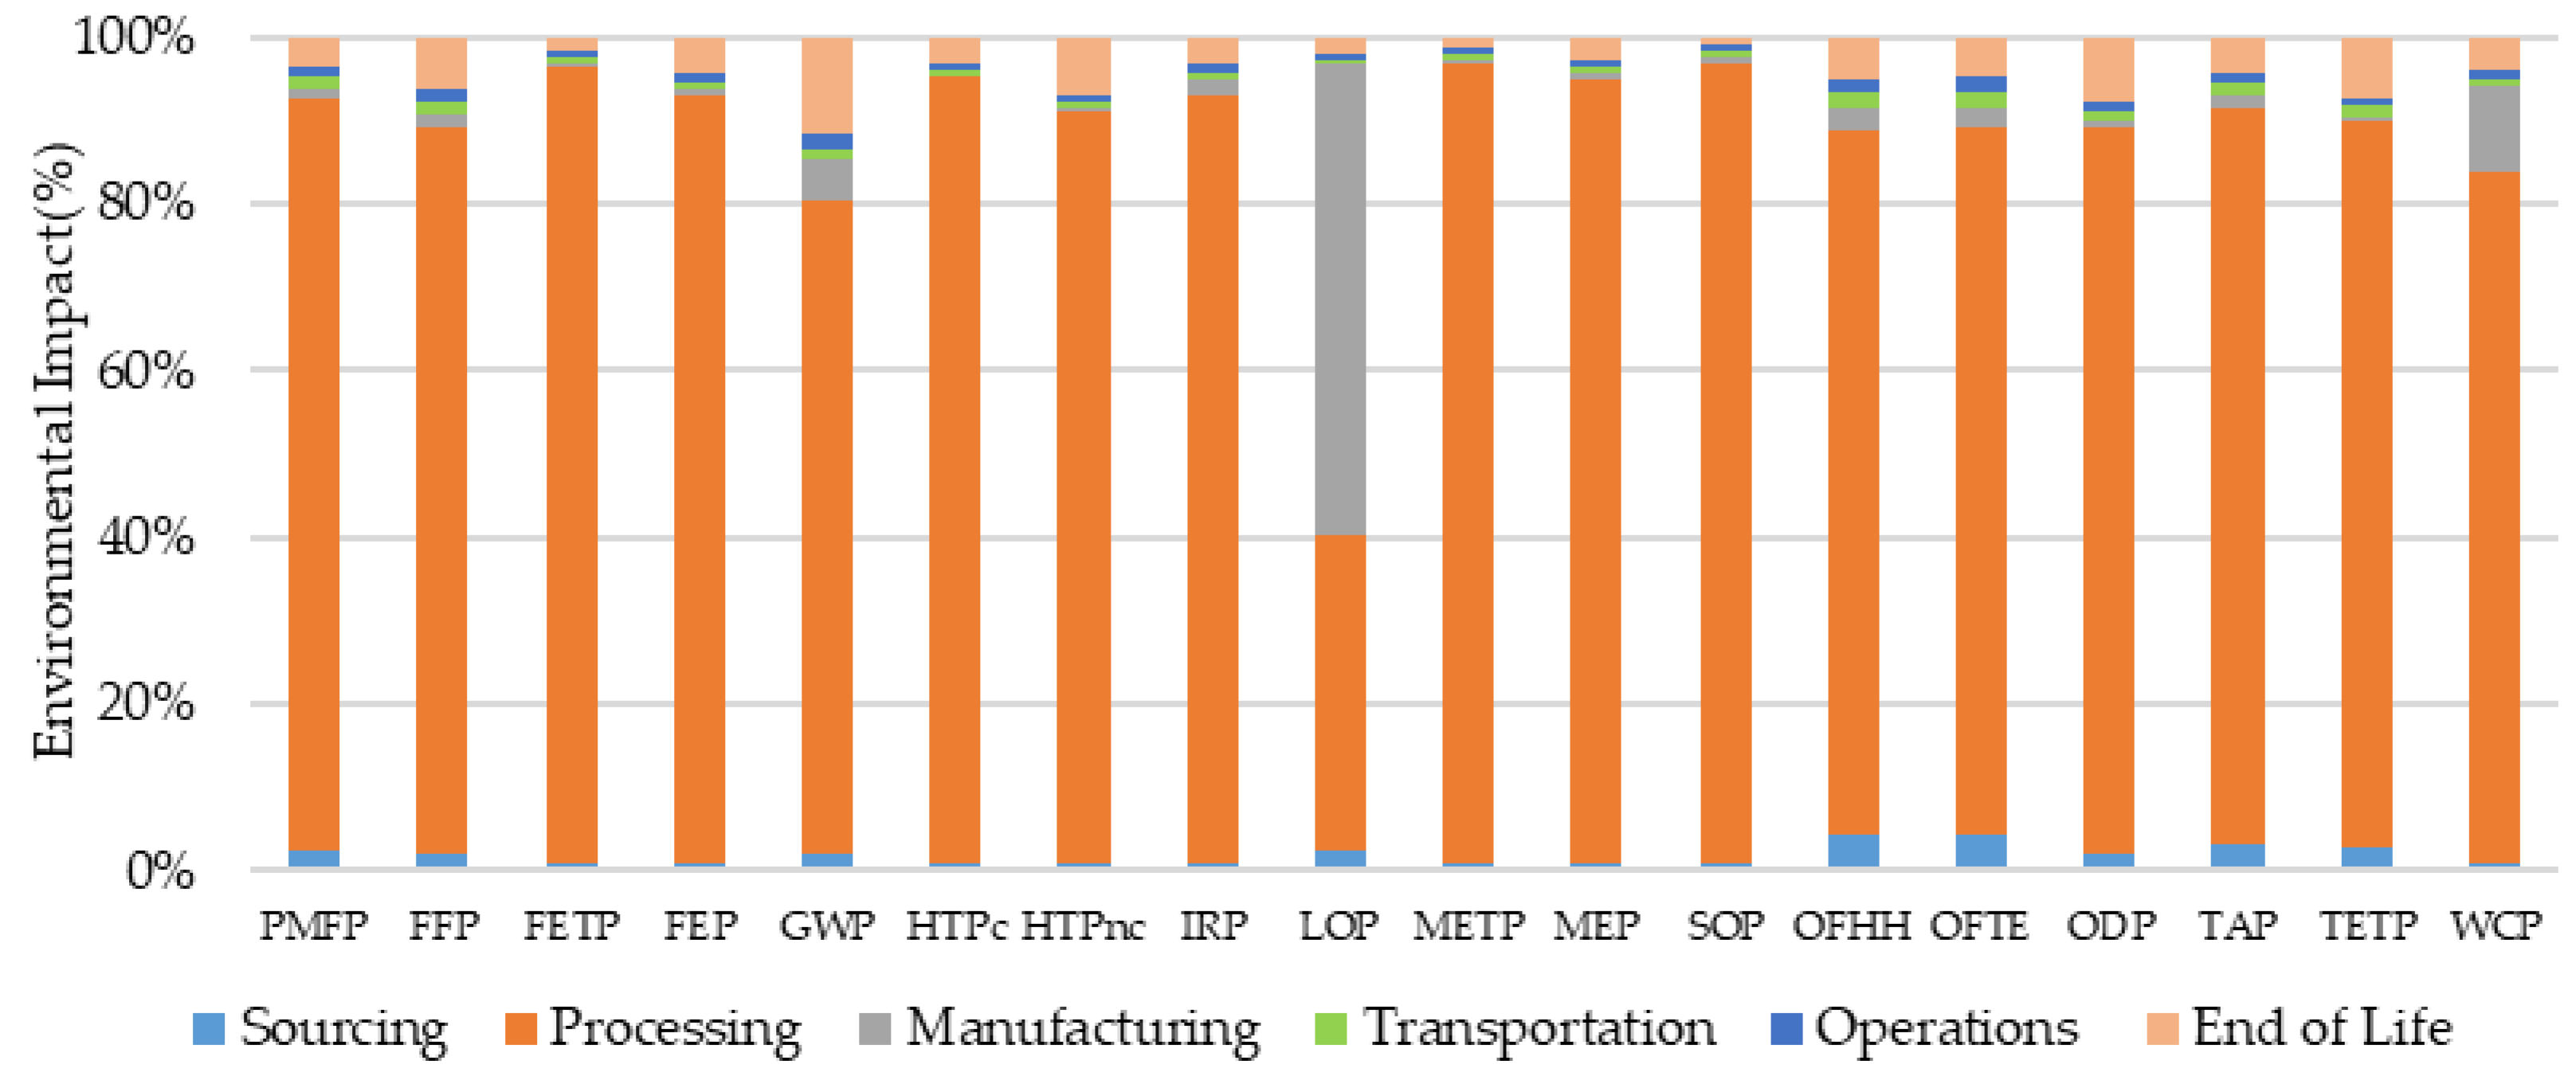
Figure 5). Increasing combustion efficiency and adding carbon capture can reduce many of these impacts. Moreover, increasing flaring efficiency while reducing venting and fugitive methane emissions across the natural gas supply chain will reduce GWP and other air emissions. Note that most impacts associated with wind energy generation occurred during the processing of raw materials needed to manufacture wind turbines, blades, and other equipment (
Figure 6).
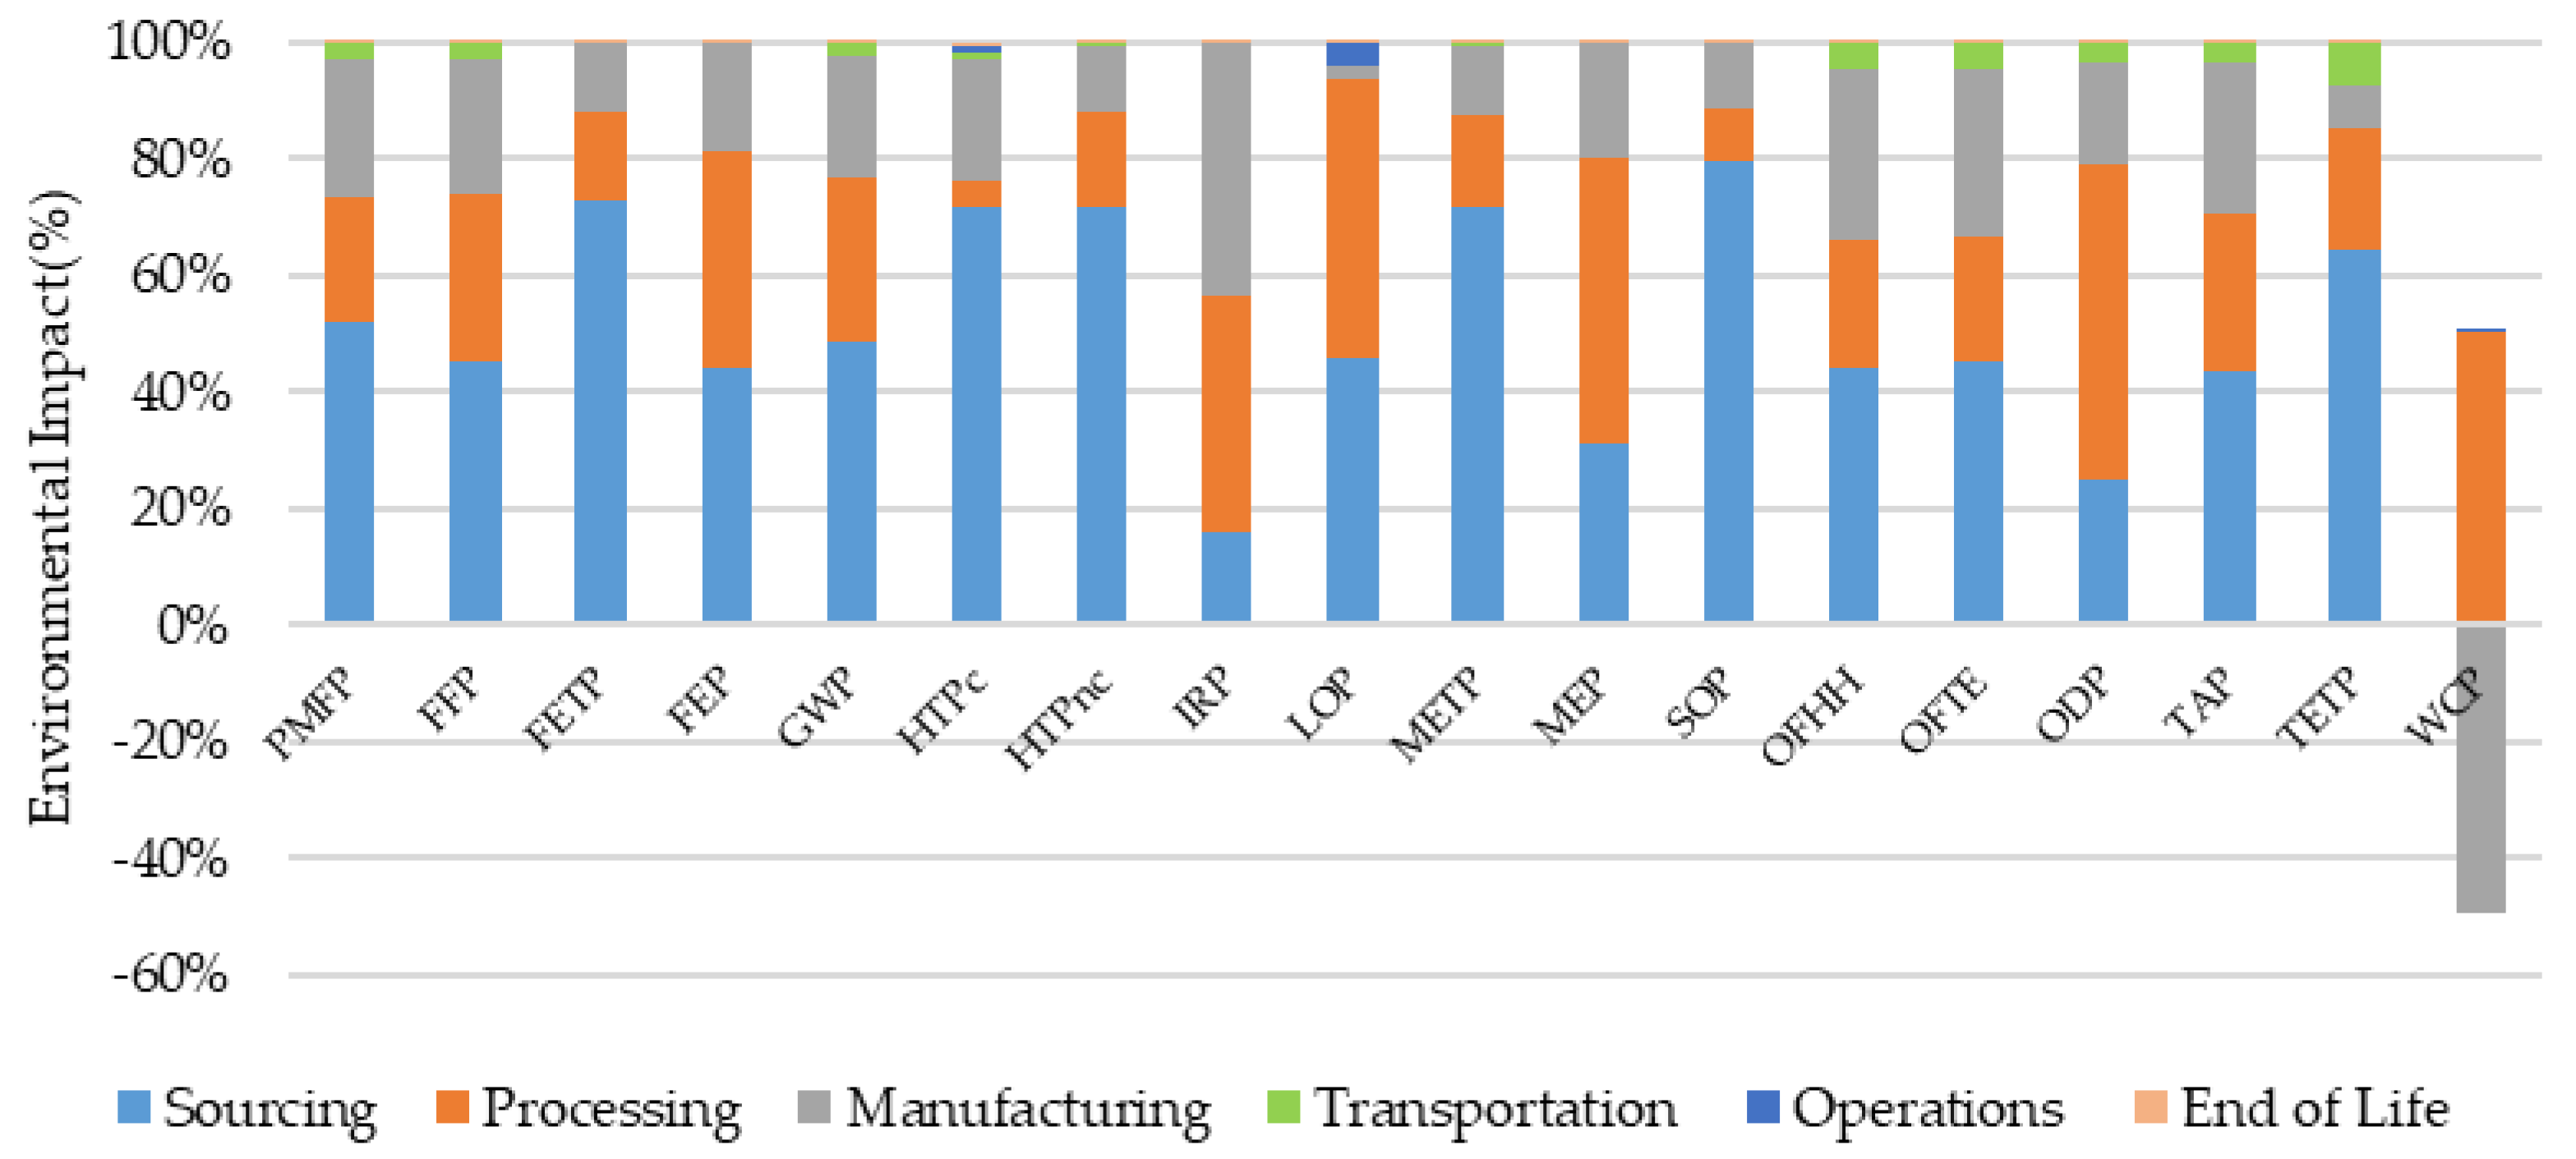
Increasing efficiency of ore processing and switching to lower-emission energy sources at these facilities will reduce many of these impacts. Impacts associated with solar PV facilities (
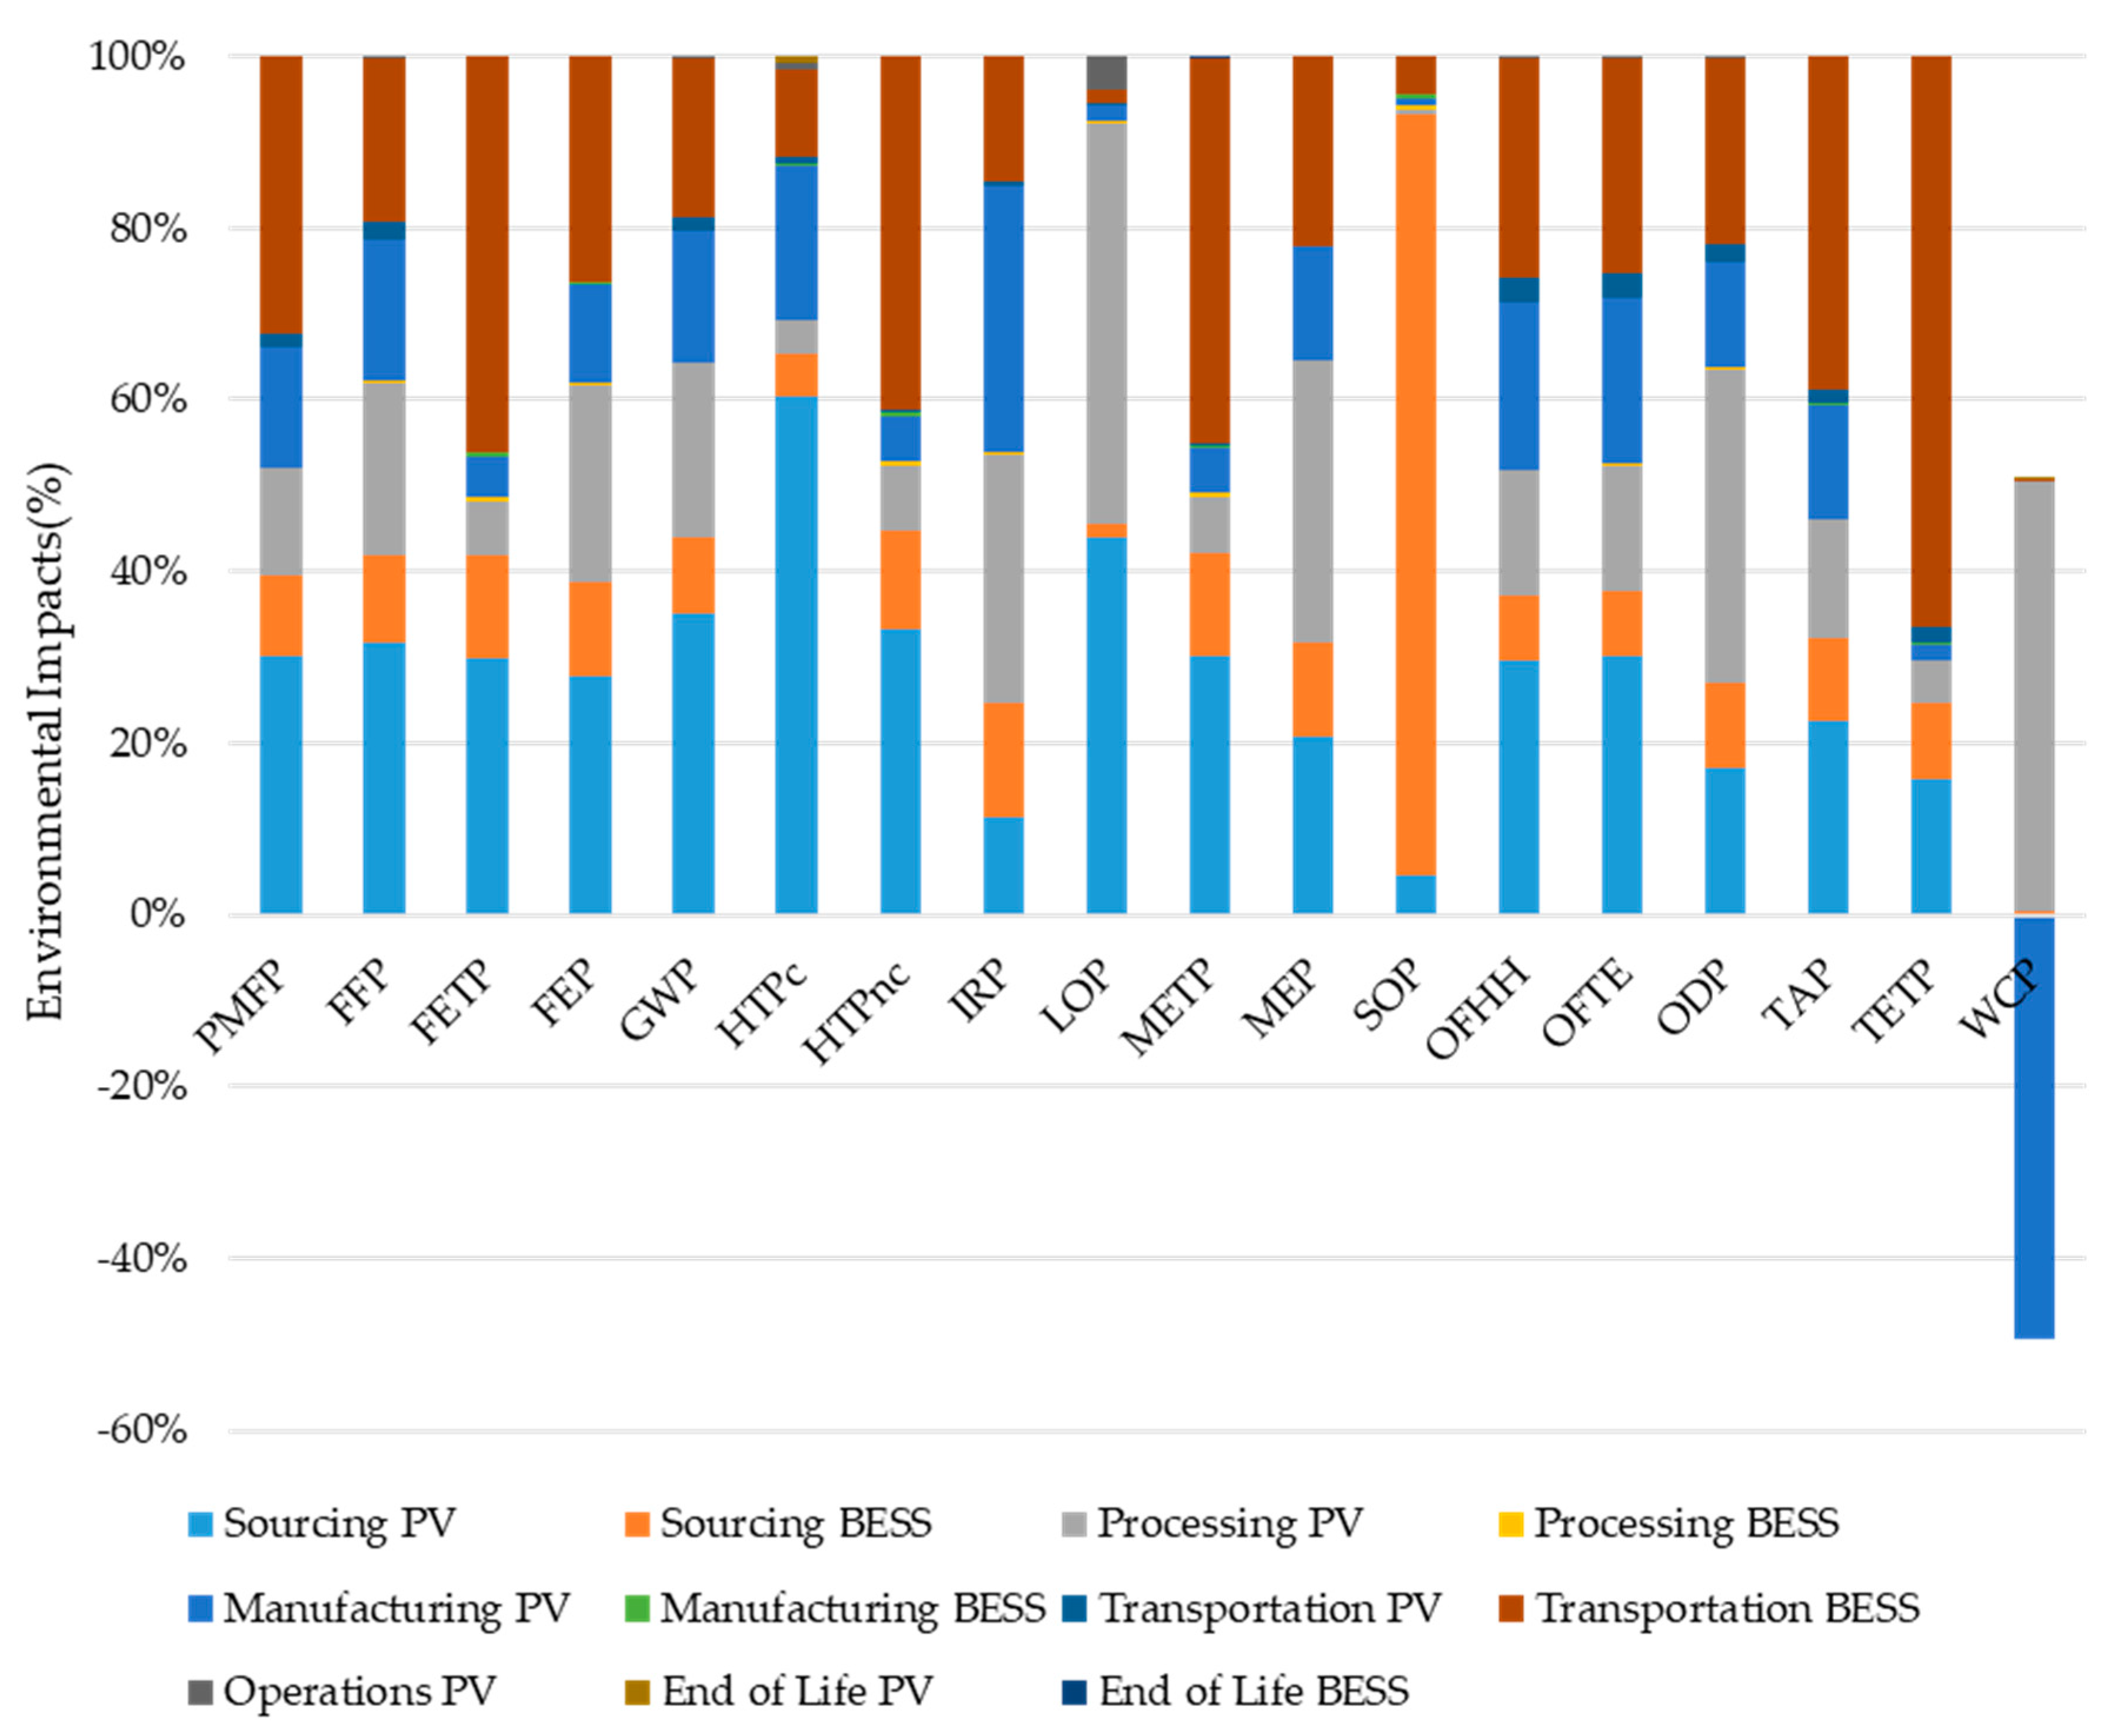
Figure 7) were distributed across three life-cycle phases in a somewhat declining order: sourcing, processing, and manufacturing. This distribution suggests opportunities to reduce the impacts across all three phases and the transportation that connects them with an increase in process efficiencies and a switch to lower-emission fuels where feasible. Sourcing of materials for BESS dominated impacts in wind + BESS and solar + BESS systems (
Figure 8 and
Figure 9). Improving process efficiencies at mining sites and metallurgical processing facilities while switching to lower emissions fuels can offer real solutions, and observations from industry news seem to substantiate these recommendations.
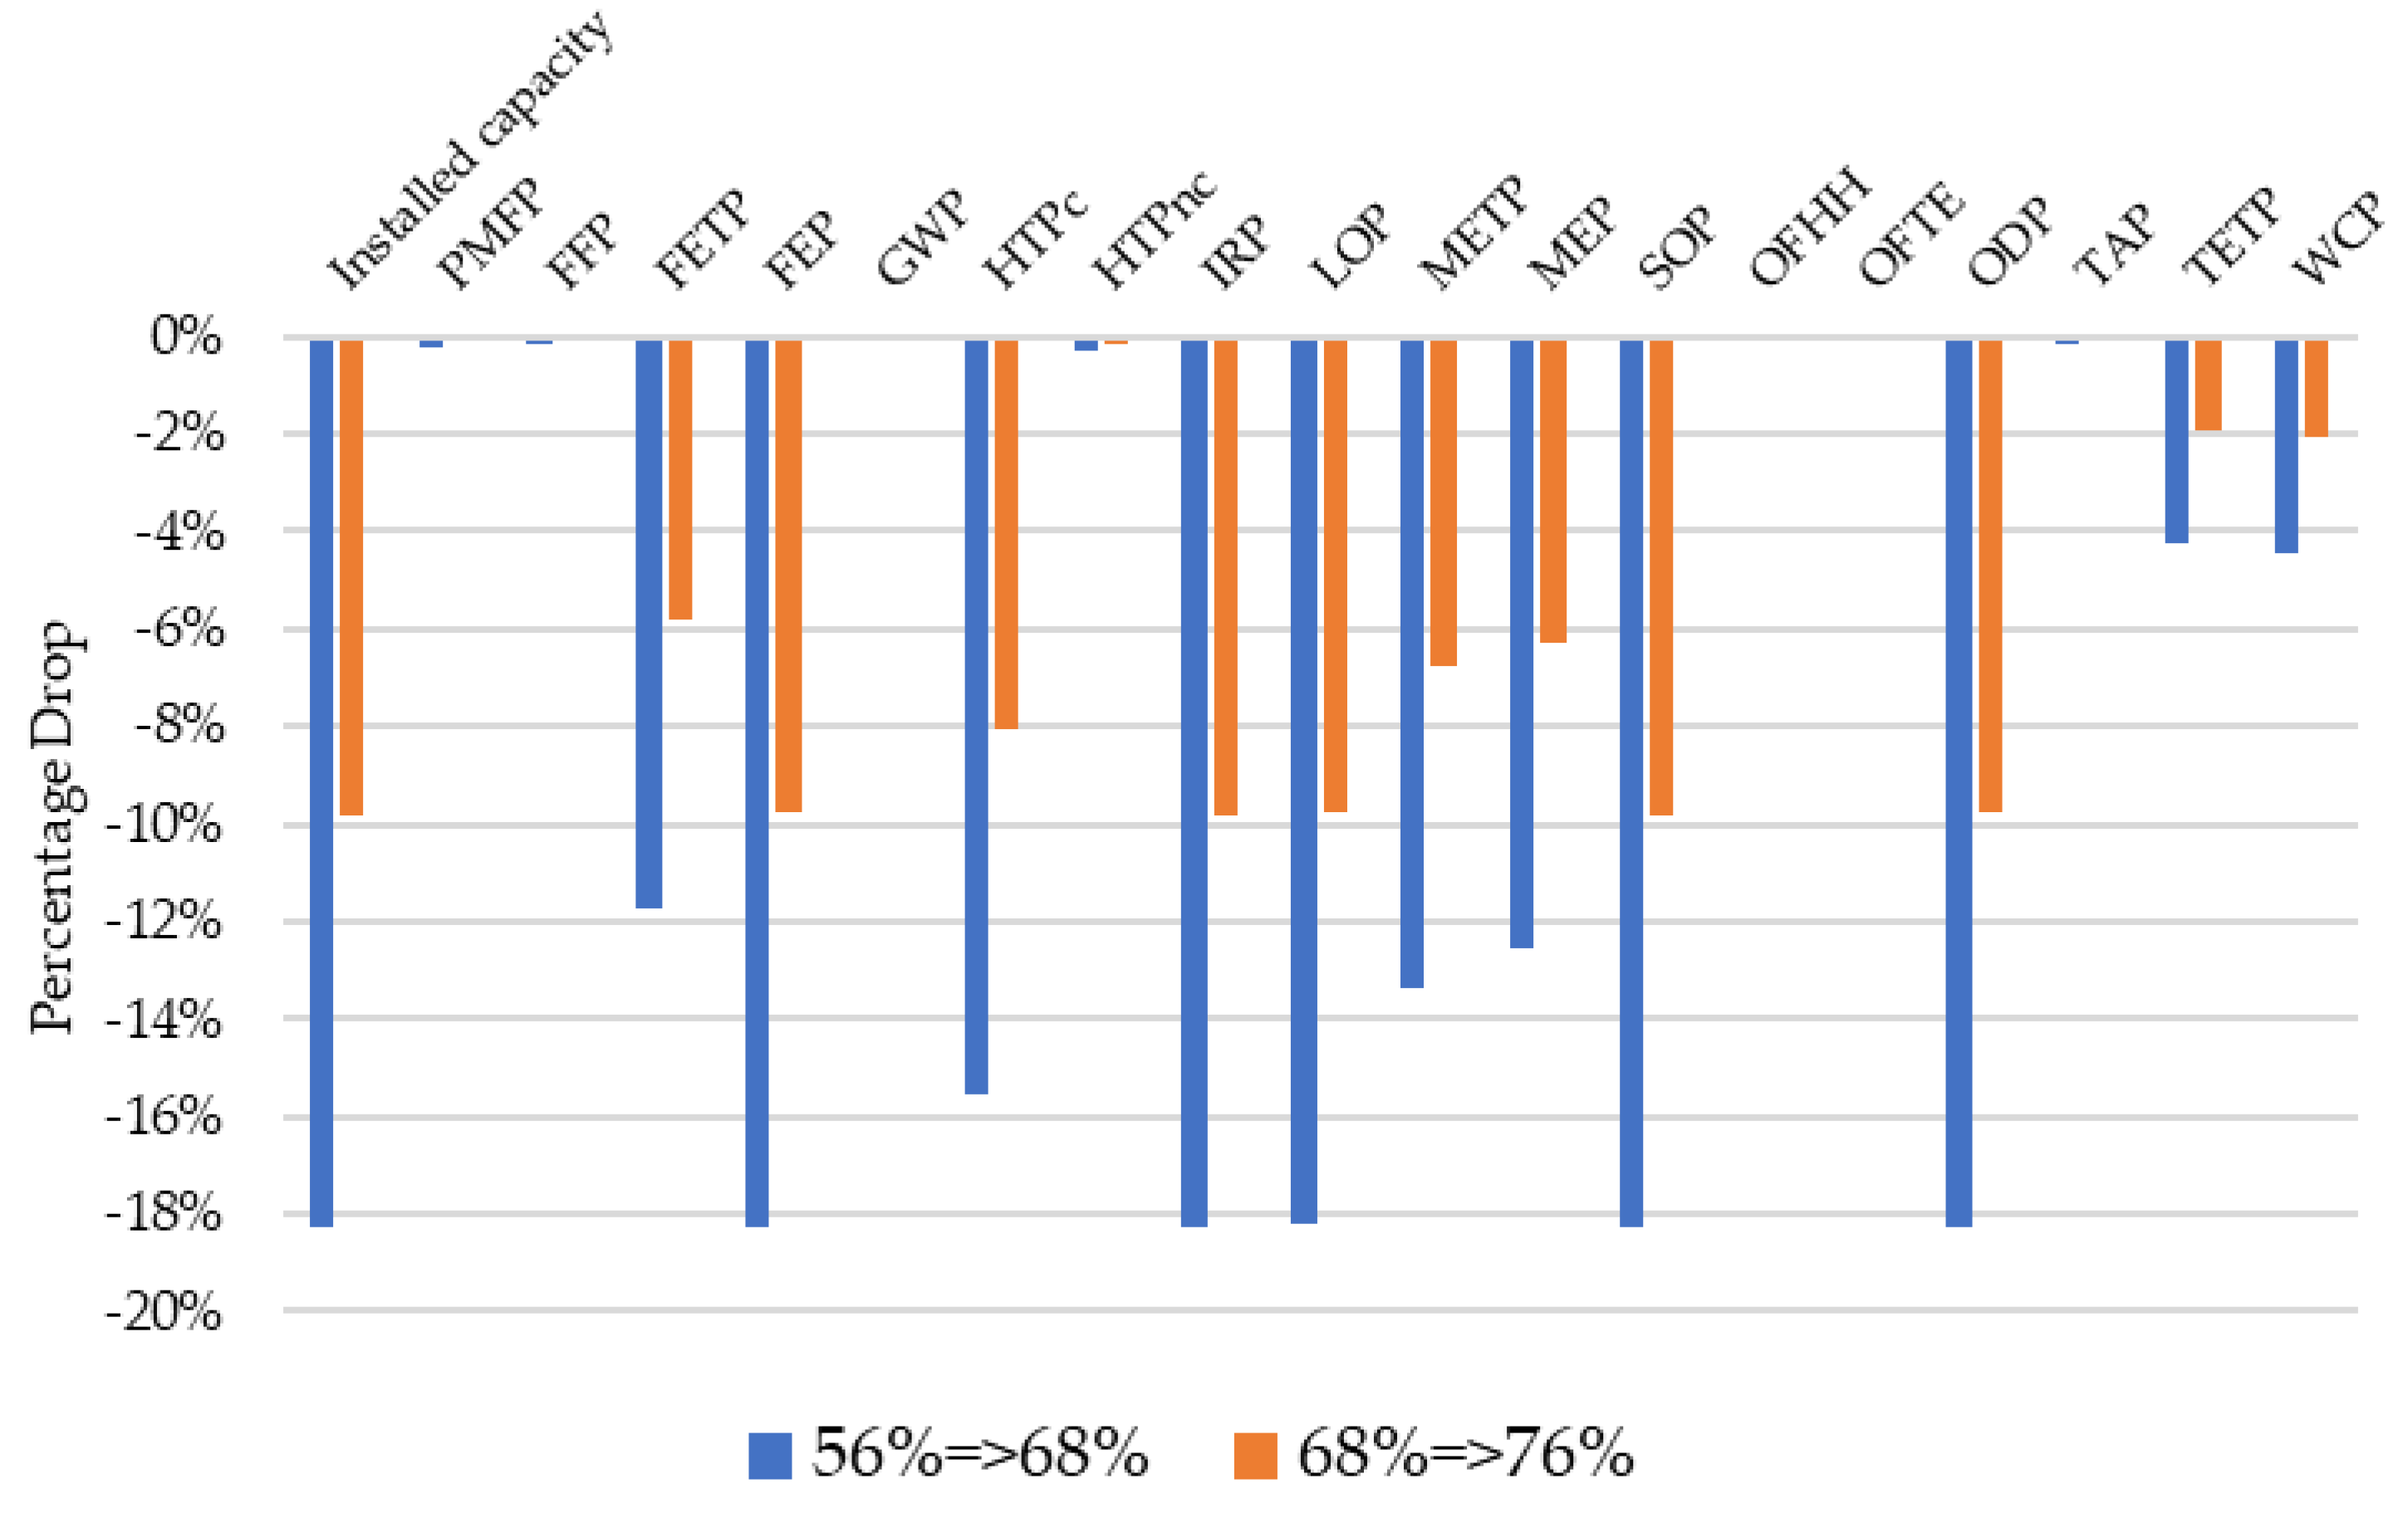
In the sensitivity analysis, we could also answer Q4. As discussed earlier, most environmental impacts associated with a CCGT power plant occurred during sourcing of natural gas and the operation of power plant phases (
Figure 5). Regardless of the installed capacity of the power plant, our requirement of 3 TWh annual generation requires the same supply and combustion of gas across the scenarios and, hence, the same number of wells and other upstream activities. Changes in many emissions (e.g., PMFP, GWP) are therefore due to construction of the facility and differences in the amount of cement, steel, and other materials for finalizing the plant. Results showed a decline in facility capacity of 18.3% when the CF increased from 56% to 68% (a 21.4% increase) and a 9.8% decline in facility capacity when the CF increased further from 68% to 76% (11.7% increase). The decline in facility capacity was directly proportional to the increase in CF, translating to reductions in several, but not all, environmental impacts. For example, PMFP, GWP, FFP, and other emissions directly related to combustion were essentially unchanged. Only those pathways related to facility construction were proportionally reduced (
Figure 10).
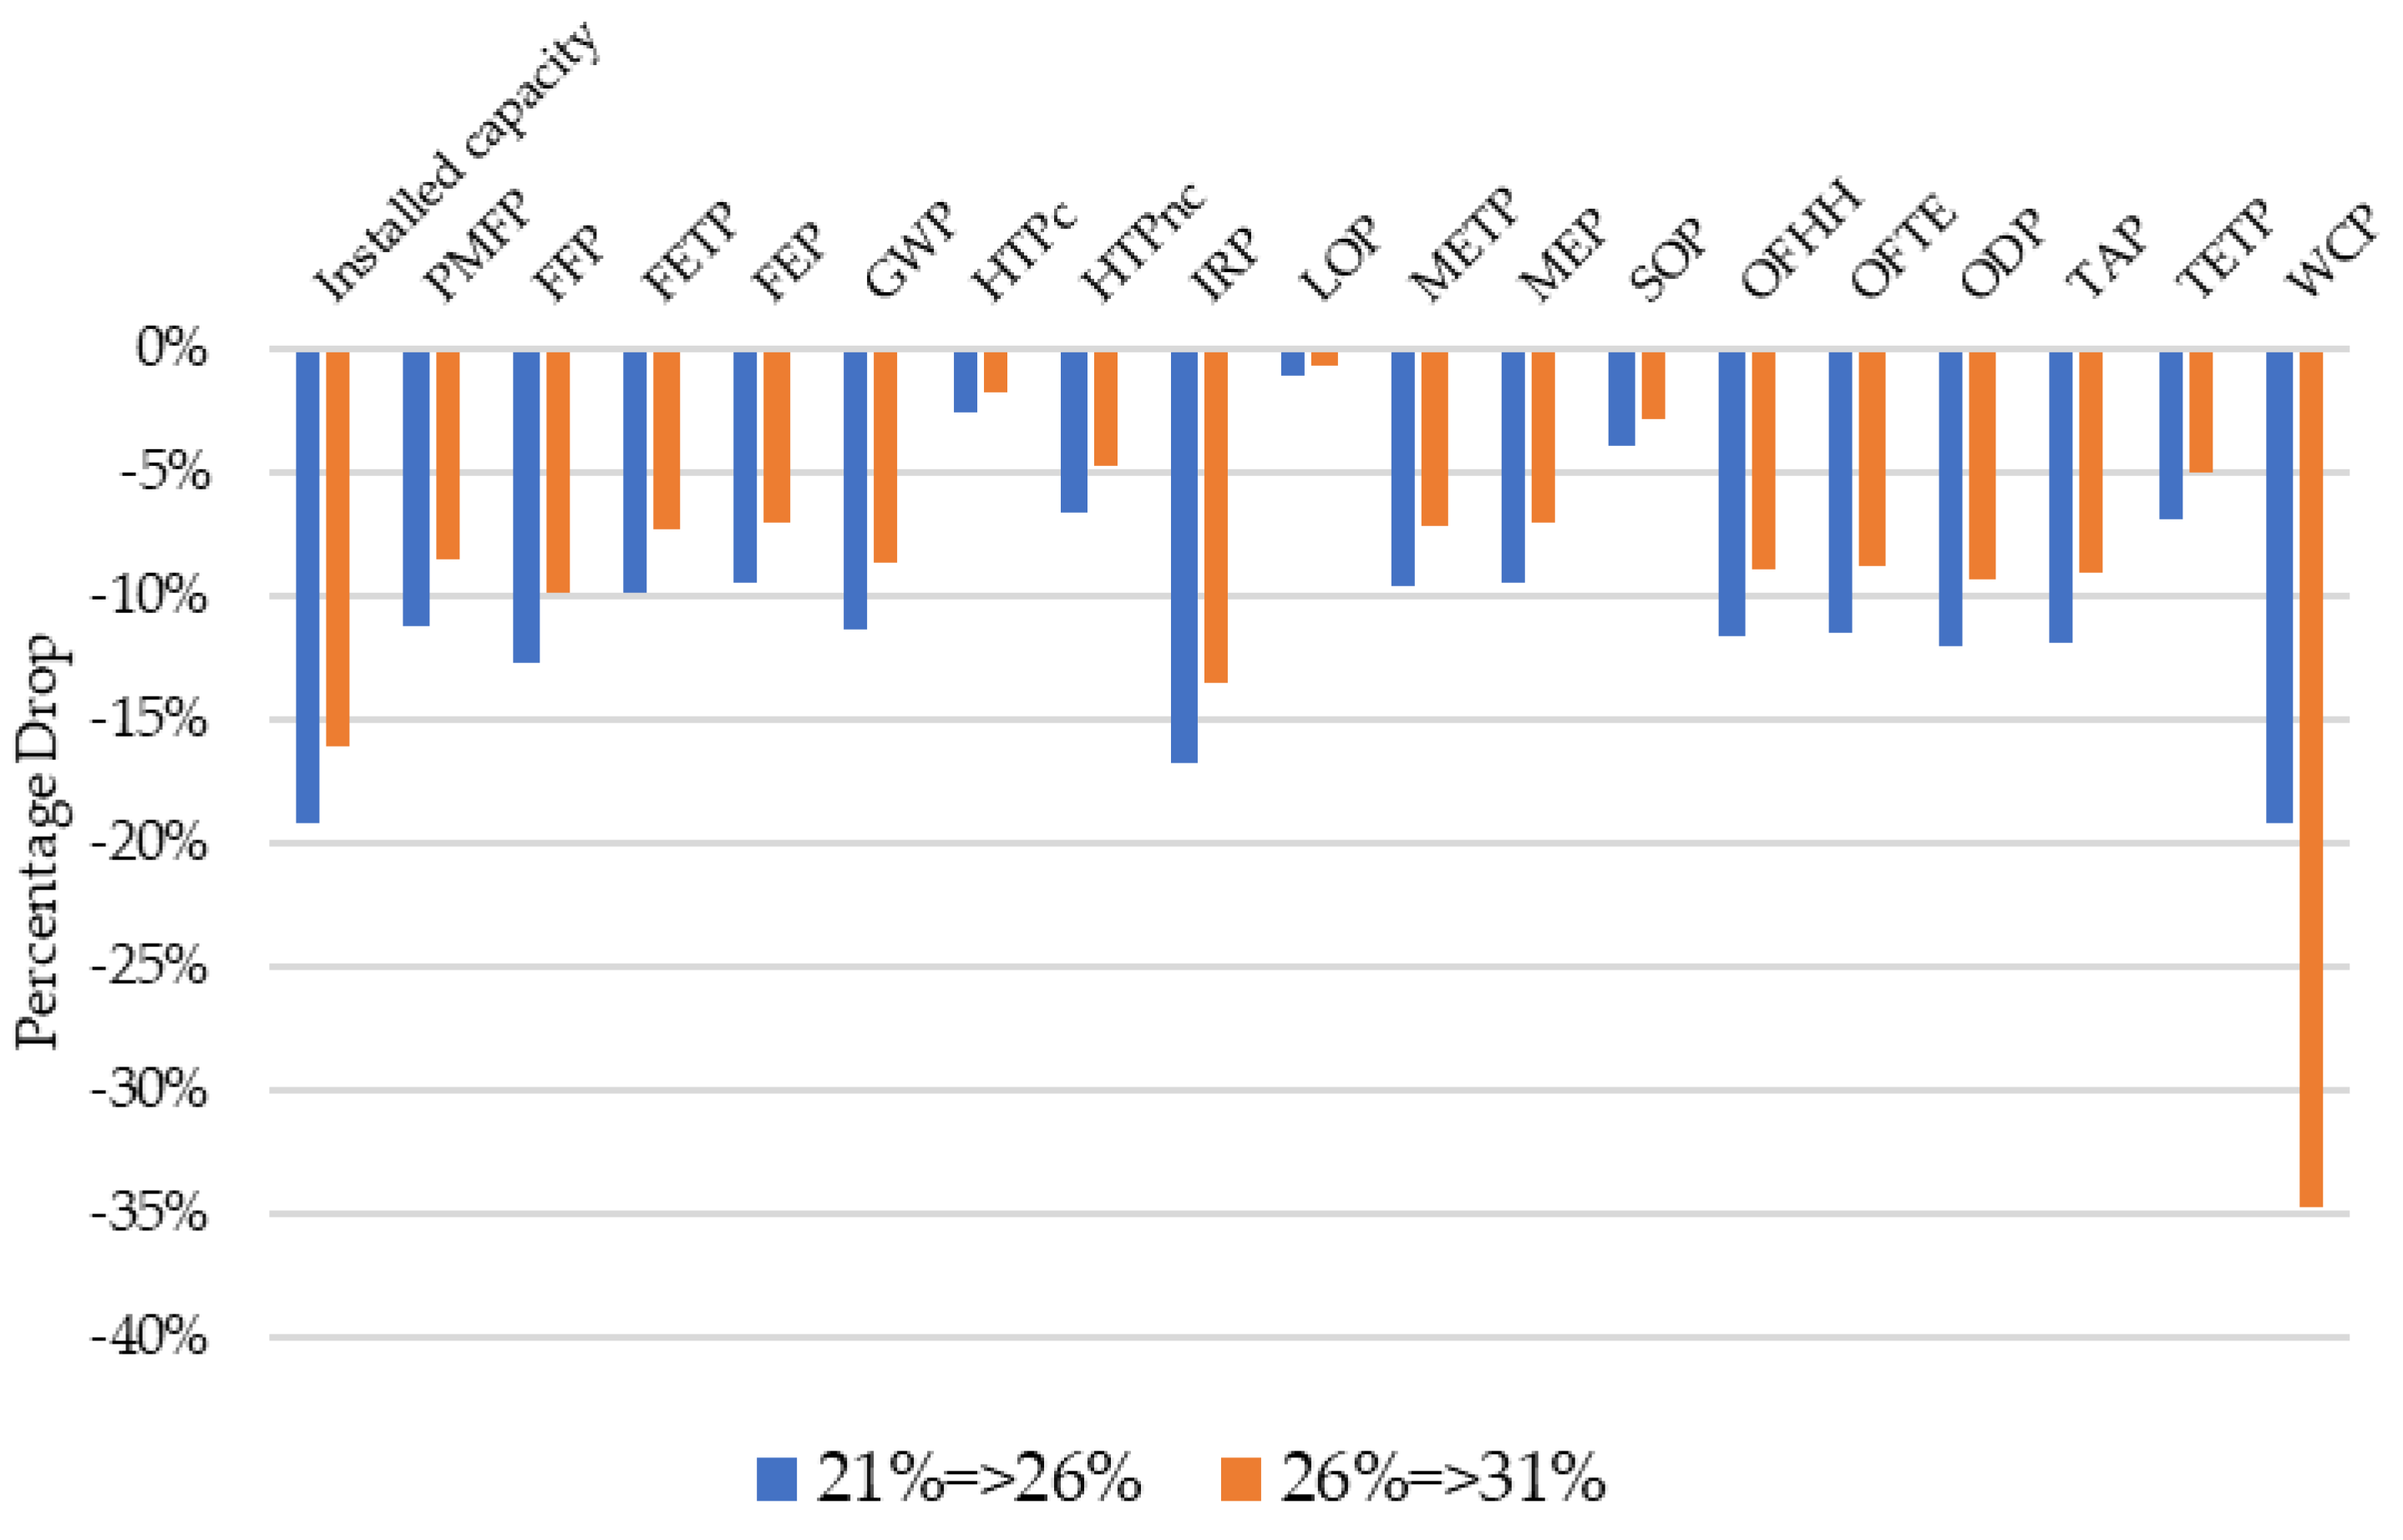
Most environmental impacts associated with the solar-PV power plant occurred during the sourcing and processing of raw materials and equipment manufacturing and facility construction (
Figure 6). As such, reducing the installed capacity because of higher CF led to about a 10% decline in most impacts, except for water consumption, which declined 20% when CF rose from 21% to 26%. These declines were less than the decline in installed capacity (~19%), except for water consumption. A similar pattern emerged when CF increases from 26% to 31%, and installed capacity needed declined by about 16%. Strikingly, water consumption declined by 35% (
Figure 11). The detailed numbers are shown in
Supplementary Materials (Tables S4–S8).
The processing phase dominated impacts of the wind power plant, accounting for 80% to 95% of all impacts, except for land use (
Figure 6). As a result, impacts declined proportionally to the decline in the installed number of turbines as we tested higher CFs. As an artifact of our modelling of an individual 3 MW turbine, proportionality was the same: results showed a 55% decline in the installed number of turbines and all impacts when CF increased from 14% to 31% and 35% decline in all impacts when CF increased from 31% to 48%. Hence, we do not provide a graphic analogous to
Figure 10 and
Figure 11. Our approach to this analysis probably missed the economies of scale associated with building larger numbers of turbines, but the higher-level conclusion that environmental impacts associated with wind power plants are more sensitive to CF changes than CCGT and solar-PV plants seems justified.
4. Interpretation and Inferences
The results suggest that different generation technologies impose various environmental burdens across their life cycles and associated global supply chains. Trade-offs across geographies and over time were identified: these are weak points because mining, drilling, processing, transportation, manufacturing, and generation facilities needed to supply future electricity depend on procuring a social license to operate from host communities. A focus on environmental, social, and governance (ESG) factors are growing among the financial community, who may become increasingly reticent to fund projects that lack host community approval [
49]. Increasingly, companies are expected to disclose nature-related impacts in financial or other reporting [
50]. The cradle-to-grave LCAs of our energy options allow us to identify, albeit at a high level, weak points across global supply chains. These weak points can help direct resources toward in-depth environmental and social impact assessments of individual projects based on location- and project-specific data. In particular, the tolerance of host communities to any of the impacts need to be surveyed. In fact, early engagement with host communities has become a best practice for most energy and extractive companies, especially where civil society and regulatory frameworks are well established. Fortunately, trade-offs often suggest opportunities to reduce or even mitigate impacts where they occur while also ensuring that progress toward achieving most SDGs is maintained for communities around the world.
In this section, we want to focus on these opportunities and offer a selection of possible mitigation options across the global supply chains of the five power plants we analyzed. Several developments present opportunities to reduce emissions along the natural gas supply chain and during gas combustion in a CCGT facility for power generation. Many countries now pursue regulations to reduce flaring, venting, and fugitive methane emissions [
51]. For example, the U.S. Inflation Reduction Act imposes large fines on fugitive methane emissions that do not comply with new regulations from the U. S. EPA. A Global Methane Pledge was signed by 155 countries as of early 2024 [
52]. Several other initiatives, including those by the U.N. and large oil and gas companies, intend to reduce emissions from their operations. Some technologies that reduce methane emissions are already available, and others are under development [
53]. Reduced flaring, venting, and fugitive methane emissions from the Permian Basin would, in turn, reduce our GWP and PM calculations. However, most emissions stemming from the full life cycle of a CCGT plant occur during the combustion of natural gas for power generation not from the upstream production side. Modern gas turbines and combined-cycle designs have lower heat rates (higher efficiency in converting fuel to electricity) [
54], which reduce per-MWh emissions commensurately with decline in heat rate.
A much larger reduction in GWP emissions can be achieved by including carbon-capture technologies and sequestering the carbon below ground (known as CCS). However, geologic storage may not be available near a CCGT plant, adding a CO
2 transportation cost. Also, alternative uses of captured CO
2 are under development and if they can be scaled up, offer a revenue stream that could support CCS investment (see Cameron Hepburn et al. (2019) [
55] for a review of CO
2 utilization options). For our CCGT case, geologic storage opportunities were easier to identify in the Permian Basin than elsewhere. On the other hand, CCS added a parasitic load to the power plant (~30%), which needs to be considered for CCGT economics and for reliable operation of the electricity grid.
As reported above, most environmental impacts associated with wind, solar, and BESS facilities occur during sourcing of raw materials, their processing and refining, and, to a lesser extent, the manufacturing of equipment. Many of these impacts are associated directly with local air emissions of particulate matter, NOx, and SOx but also the use of water resources and discharges to land and waterways. Mitigation or reduction of these impacts is possible by following best resource extraction and processing practices, including using new technologies to increase resource recovery, reduce energy and water use for mining and processing, and mitigate impacts to host community environments. Transportation of resources between life-cycle phases could also add significantly to certain impacts because of the large distances and dominant use of diesel fuel.
Mitigation opportunities can therefore be found by increasing the efficiency of energy-dense mining and processing operations and switching to lower-emission fuels for processing, manufacturing, and transportation. For example, in New Caledonia, efforts are under way to increase the share of solar electricity to power nickel-mining operations [
56]. Changes to lithium-ion battery (LIB) chemistries and alternatives to LIBs [
57] are being pursued, partly to reduce the environmental impacts associated with some inputs, such as cobalt [
58]. The shipping industry is pursuing LNG, methanol, ammonia, and other fuels to reduce emissions, but all options include trade-offs across cost, performance, and environmental impact dimensions (e.g., see Chin Law et al. (2021) [
59]).
Environmental impacts from mining, processing, and manufacturing are often larger when these activities occur in locations with weak regulations or coal-heavy electric power generation and/or by private or partly or fully state-owned companies that are not publicly traded in major exchanges around the world (hence, not subject to as much public or financier scrutiny as publicly traded companies) [
60]. As such, onshoring or friend-shoring some of these supply chains has become a strategy, especially in the U.S. [
61].
This work adds to the discussion of technological developments that will continue to change the technological landscape and supply chains for power-generation alternatives. Future LCAs will continue to be needed to account for these changes and, thus, to identify and shed light on weak links and opportunities that further reduce impacts on all host communities involved.
5. Conclusions and Recommendations
Sustainable development of electricity-generating options should be effectively assessed for present and future systems, at both global and local spatial scales. To meet this need, the LCA method has been applied in accordance with ISO standards to quantify and compare environmental impact profiles for electricity-generating options. We used facilities located in West Texas as a case study site. The novelty and contributions of this study to address the research gaps are the following:
Comprehensive LCA of five electricity generating options for West Texas: CCGT, wind, solar PV, wind + BESS, and solar PV + BESS. To approximate equal grid value for all options, our work did the following:
- ◦
Compared environmental impacts on systems that generate approximately equal lifetime amounts of electricity;
- ◦
Added electricity storage to wind and solar generation facilities, rendering them nearly as dispatchable as CCGTs.
Detailed cradle-to-grave analysis of 18 environmental impacts of each option for discrete comparative assessment of different options across life-cycle phases, excluding recycling.
Throughout the study, our results highlight the importance of location when determining the level of each of the 18 impacts across each segment of the supply chains. We considered and recognized the difference among communities bearing different environmental impacts (addressing Q1). Each technology led to the highest impacts in several categories, with differences being very large. For example, GWP from CCGT was orders of magnitude larger than the GWP of all the four other options. CCGT also had the highest impacts in fossil-fuel resource scarcity, ozone formation, terrestrial acidification, and water consumption. On the other hand, impacts from wind and solar technologies were orders of magnitude larger for human carcinogenic toxicity, ionizing radiation, marine ecotoxicity, marine eutrophication, mineral resource scarcity, and stratospheric ozone depletion when compared to CCGT. Adding battery storage increased impacts of wind and solar facilities; some impacts increased multifold (addressing Q2).
For answering Q3, a key distinction emerges between CCGT and other technologies. For CCGT, most impacts occurred during the sourcing of natural gas and electricity generation (operations). In contrast, operations of wind and solar technologies contributed little, with or without BESS. Sourcing and processing minerals, and, to a lesser extent, equipment manufacturing, dominated the environmental footprint of wind, solar, and BESS.
This contrast caused the divergence we observed when we assessed the sensitivity of impacts to the capacity factor of the power plants (addressing Q4). With CCGT, impacts that are almost exclusively caused by combustion of gas for power generation (GWP and other air emissions) did not change much with capacity factor because we assumed the same level of generation. Lower capacity factors for wind and solar led to mostly proportional increases in almost all impacts because they were caused by an increase in sourcing and processing of materials and equipment manufacturing. Naturally, higher capacity factors for wind and solar reduce impacts because less capacity is needed to generate the same amount of electricity. Hence, it is highly desirable to site wind and solar facilities where wind speeds and solar irradiance are high quality, grid interconnection is seamless, and transmission congestion is unlikely to lead to curtailment.
Finally, we recognize that the absolute levels of impacts and relative ranking of technologies may become secondary considerations to community acceptance. The ability to develop mining, drilling, processing, transportation, manufacturing, and generation facilities needed to supply future electricity needs depend on procuring and maintaining the social license to operate from communities hosting these facilities. Local opposition can deter investment from private and public lenders who use ESG criteria to allocate their capital funds. Furthermore, delays in one segment of global supply chains may create costly bottlenecks and alter environmental outcomes, especially when resources and equipment are procured from locations with weaker regulatory infrastructure. The cradle-to-grave LCAs of our energy options allowed us to identify, albeit at a high level, weak points across global supply chains. Policy and investment decision makers, although not explicitly addressed here, can target their efforts to these weak points.


