1. Introduction
The scientific literature related to economics and business evolution has recently shown a renewed interest in transforming traditional agritourism into wellness centres capable of attracting a broader range of users beyond those solely interested in dining. Sedita and Orsi affirm that the drivers supporting this process are (1) the evolution of consumer demand; (2) the intensification of competition in the sector; (3) the availability of wellness solutions that do not require high investment and can be developed in small environments (similar to home wellness and home fitness services). It is, therefore, an emerging phenomenon arising from a combination of enabling factors that make agri-spas an appealing entrepreneurial investment [
1].
By agri-spa, we refer to agritourism facilities that have invested in offering their guests wellness services, complementing the more traditional services typically provided by this type of accommodation.
This investment opportunity, stemming from the actual opportunities associated with the structural transformation of rural buildings well-suited to accommodate materials typical of wellness centres, mostly arises from the change in the lifestyles of the Italian population, mainly due to improved socioeconomic conditions [
2]. A direct consequence of this has been a considerable increase in the demand for services, products, structures, and new consumption patterns related to using natural environments. The so-called wellness tourism, born from the meeting between the wellness and tourism markets, offers various services [
3,
4,
5]. These, incorporated into tourist accommodation facilities known as spas, combine thermal tradition with providing new services focused on personal care and the pursuit and maintenance of psycho–physical balance [
6,
7,
8].
Consolidated research on this point concurs in determining that the evolution of agri-spas and the tourism sector they are part of can peacefully fit into a broader context of sustainable modernity [
9]. Here, the economic development hinges on generating use contexts and meanings that can sell themselves as much as the product they are connected to, creating, in relation, a context of use that meets the multidimensionality of expressed and latent consumer needs [
1].
This summary overview seems to overlook the energy-consuming effects that the transformation of the accommodation structure into an agri-spa implies. Indeed, the needs associated with new functions, such as Turkish baths, saunas, and continuously heated pools, add to substantial dining requirements. While the distributive spaces of typical rural dwellings lend themselves well to accommodate this possibility, the necessary system of facilities requires significant efforts in terms of design, requiring passive and active strategies aimed at making the transformation mentioned above less impactful. In this sense, it appears necessary to investigate these buildings today in terms of architectural and engineering experimentation to monitor consumption and identify useful practices and approaches for containing the consumption of the structures, effectively aligning the buildings’ functioning with the environmental concerns that users, increasingly environmentally conscious, genuinely propose [
10].
The ambition for genuine sustainability in building practices includes implementing a series of rules and practices to make a building fully compliant, in terms of performance, with the current requirements [
11]. This interpretation heralds the concluding phase of the design activity, focusing, through adequate pragmatic analyses and experimental verifications, on the outcome and the future management of the already constructed or soon-to-be-constructed product. These operations follow an analytical moment of contextualisation and environmental determinants, requiring available technology only in a previously conducted design activity’s updating (or even executive) phase [
12].
Within the framework of the proposed research activities, a recently transformed agri-spa (2018) has been selected to assess the energy outcomes that the transformation requires the company to sustain and, therefore, deduce some retrofitting scenarios useful for envisioning a significant reduction in current consumptions.
Energy audits are one of the key elements of policies aimed at efficiency and reducing consumption for industrial and accommodation facilities [
13]. In the literature, there are many studies of energy audits of industrial activities [
14,
15,
16], where reducing energy consumption can lead to considerable cost savings and a reduction in environmental impacts. Conversely, studies on hotel activities [
17,
18] appear less frequent, particularly for agritourism and agri-spas, as analysed in this study. In these cases, the building exhibits characteristics similar to a rural dwelling but is equipped with heating systems and very high-consumption appliances typical of a small production activity. Energy consumption for space heating/cooling in accommodation facilities is highly climate-dependent, varying from around 30% to over 50%; therefore, the specific climatic data of the assessed season also become particularly influential [
19].
Indeed, while the scientific literature has shown substantial interest in the phenomenon of agri-spas as an emerging economic reality in the last decade, there still appears to be a gap concerning the analysis of the actual energy costs that accommodation structures must face. The agri-spa function identifies a particularly energy-intensive type, not yet adequately explored in the relevant literature, except for economic and marketing aspects. The literature within agricultural engineering, and more broadly in architecture, has often focused on assessments of buildings with traditional use functions (residence, livestock shelters, as better indicated in the references). The emergence of wellness-related aspects has profoundly altered the concept of agritourism, which, like the briefly mentioned structures, requires an energy analysis to guide the design from an energy sustainability perspective. This is due to the multitude of services that effectively impact these buildings, following the necessary construction transformations required to meet the emerging consumer demand.
Another aspect to consider is the particular nature of the site, subject to multiple landscape-related constraints that impose significant limitations on the transformations possible for the structures. Therefore, it becomes necessary to clear the ground from any ambition that might be realistically feasible, given the research’s objectives that require broader experimentation than the actual permissible use according to the supervisory authority.
The procedure outlined for energy audits, evaluated by the EN 16247-2 Standard [
20] and detailed in
Section 2.1, does not provide for a mandatory assessment of the reduction in environmental impacts resulting from the interventions proposed in the analysis. The reduction in environmental impacts is therefore assessed solely as arising from the reduced use of energy during the operational phase, without a more specific life cycle assessment (LCA) that considers the type of materials used, their maintenance, and end-of-life considerations. On the other hand, the LCA methodology, assessed following the EN 15798 Standard [
21] and detailed in
Section 2.2, allows for evaluating environmental impacts during all phases of a building’s life. However, these assessments are often conducted under standard operational conditions without being referenced to analyses based on the actual profiles of users or facilities, a crucial factor in the case of industrial or accommodation structures characterised by specific appliances and systems with unique operating schedules. Economic assessment throughout the life cycle is generally carried out using the EN 15459 Standard [
22], both in the case of energy audits and life cycle assessment (LCAs), aiming to analyse the economic benefits of reducing the operational costs of buildings following energy-consumption-reduction interventions. This methodology is described in
Section 2.3.
Taking into consideration the potentials and limitations of the described standards, this article aims to introduce a methodological approach that combines the three types of analyses to obtain the most comprehensive evaluation based on the specific energy consumption of the case study (energy audit) and consequently evaluates the environmental and economic impacts (LCA and LCC) of the intervention scenarios about them.
3. Materials and Methods
The energy audit workflow provided by the EN 16247-2 Standard [
20] is aimed at suggesting a series of intervention measures to reduce the actual energy consumption of a building, starting from energy bills. The cost-effectiveness of such measures is assessed in terms of the reduction in energy consumption and the consequent reduction in associated costs, as suggested by EN 15459 [
22]. However, environmental impacts in the life cycle due to the materials used to produce, transport, install, and eventually decommission such measures (systems, insulation, etc.) are not considered. For these reasons, this article presents a combined approach that links an energy audit following the guidelines provided by the EN 16247-2 Standard [
20], an LCA in compliance with the EN 15978 Standard [
21], and an economic evaluation through EN 15459 [
22] in order to obtain a comprehensive assessment of energy-saving measures. The purpose of this methodology is to identify, through the energy audit procedure, the most impactful energy services and determine the most suitable intervention measures to mitigate them. The LCA allows recognising measures that ensure lower environmental impacts throughout the life cycle while maintaining an equivalent reduction in energy consumption in the operational life. Lastly, economic evaluation provides an overall cost–benefit assessment, enabling prioritisation and identification of the most efficient interventions.
The process consists of the following main phases (
Figure 1): (i) data collection of systems, material parameters, and energy bills; (ii) creation and calibration of the building energy model; (iii) selection of a set of energy-efficiency measures feasible for a significant renovation; (iv) identification of the most cost-effective package of energy-efficiency measures; and (v) evaluation of solutions with the least environmental impact. This paper is divided into four distinct sections. The first section examines the current environmental and landscape constraints on the site; the second analyses the actual energy consumption of buildings based on energy bills; the third proposes a series of strategies to reduce energy consumption; and finally, the fourth section examines the proposed strategies using life cycle assessment (LCA) and life cycle costing (LCC).
Figure 1.
Workflow of the energy audit procedure employed in the research—© Authors.
Figure 1.
Workflow of the energy audit procedure employed in the research—© Authors.
3.1. Description of the Specific Site
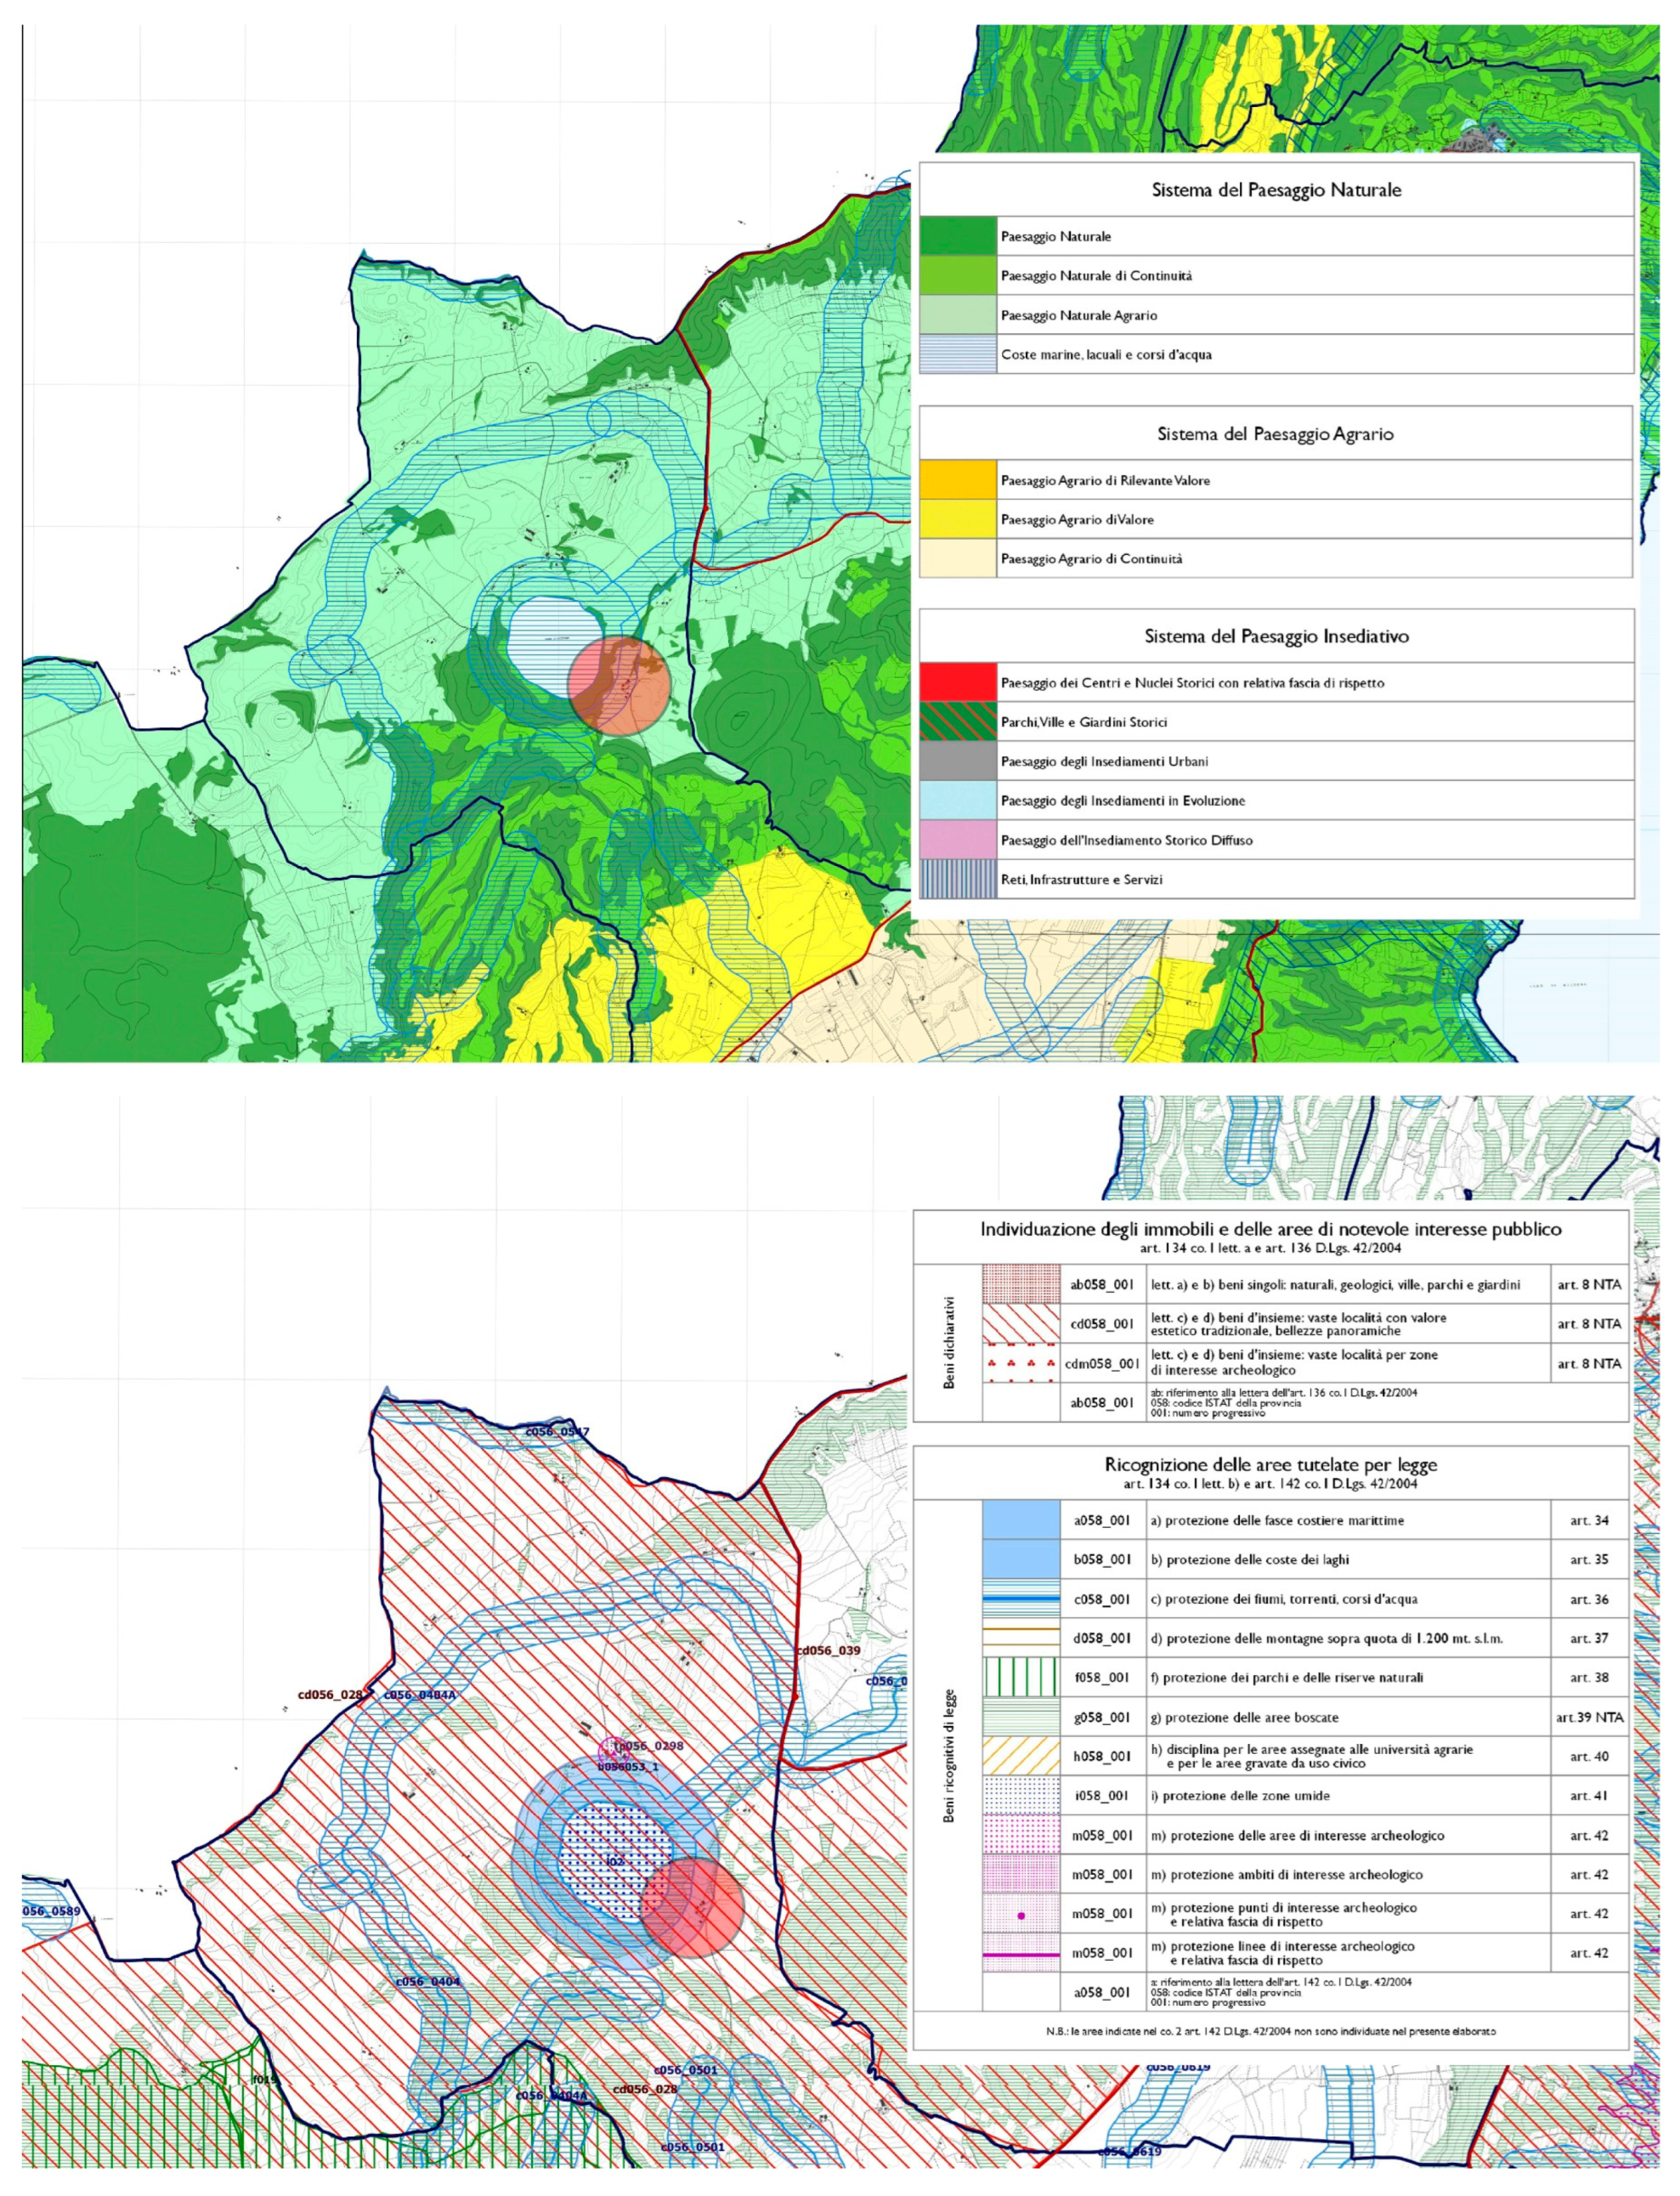
The centre of reflection underpinning the experimentation is provided by the Frà Viaco Agritourism, located in the northern area of Tuscia Viterbese (Italy), specifically in the municipality of Valentano, situated at the border between the Lazio and Tuscany regions. The farm in question comprises multiple manufacturing structures dating back to 1935, exhibiting typical characteristics of rural dwellings. It also includes two livestock buildings of recent construction (post-1967) for the company’s service and a last construction, longitudinally developed and resulting from the merging of two originally distinct bodies, currently employed as an agri-spa. These latter structures, subject to more recent building renovation, still date back to the first half of the twentieth century, at least for the residual parts that have been subsequently restored. More precisely, this agritourism complex is situated on the shores of Lake Mezzano, a volcanic basin of particular environmental value, already declared an area of notable public interest according to the Ministerial Decree of 22 May 1976 and consequently placed under protection (
Figure 2).
The discussed landscape portion encompasses a section of the Viterbo countryside near Lake Bolsena, bordering the Tuscany region, situated within the calderic enclosure of Latera. This area is marked by the coexistence of significant natural and agricultural features, coupled with notable historical evidence spanning from pre-Roman times to the present. The panoramic views of these locations, highlighted as a defining characteristic, are extensively documented in historical sources, including some of the oldest printed guides. The intertwining of natural elements with human presence, exemplified by structures dedicated to land management, has defined this part of the Upper Lazio Maremma countryside for centuries. Despite the passage of time, these features maintain high integrity, creating a distinctive and deserving landscape ensemble that warrants comprehensive conservation efforts.
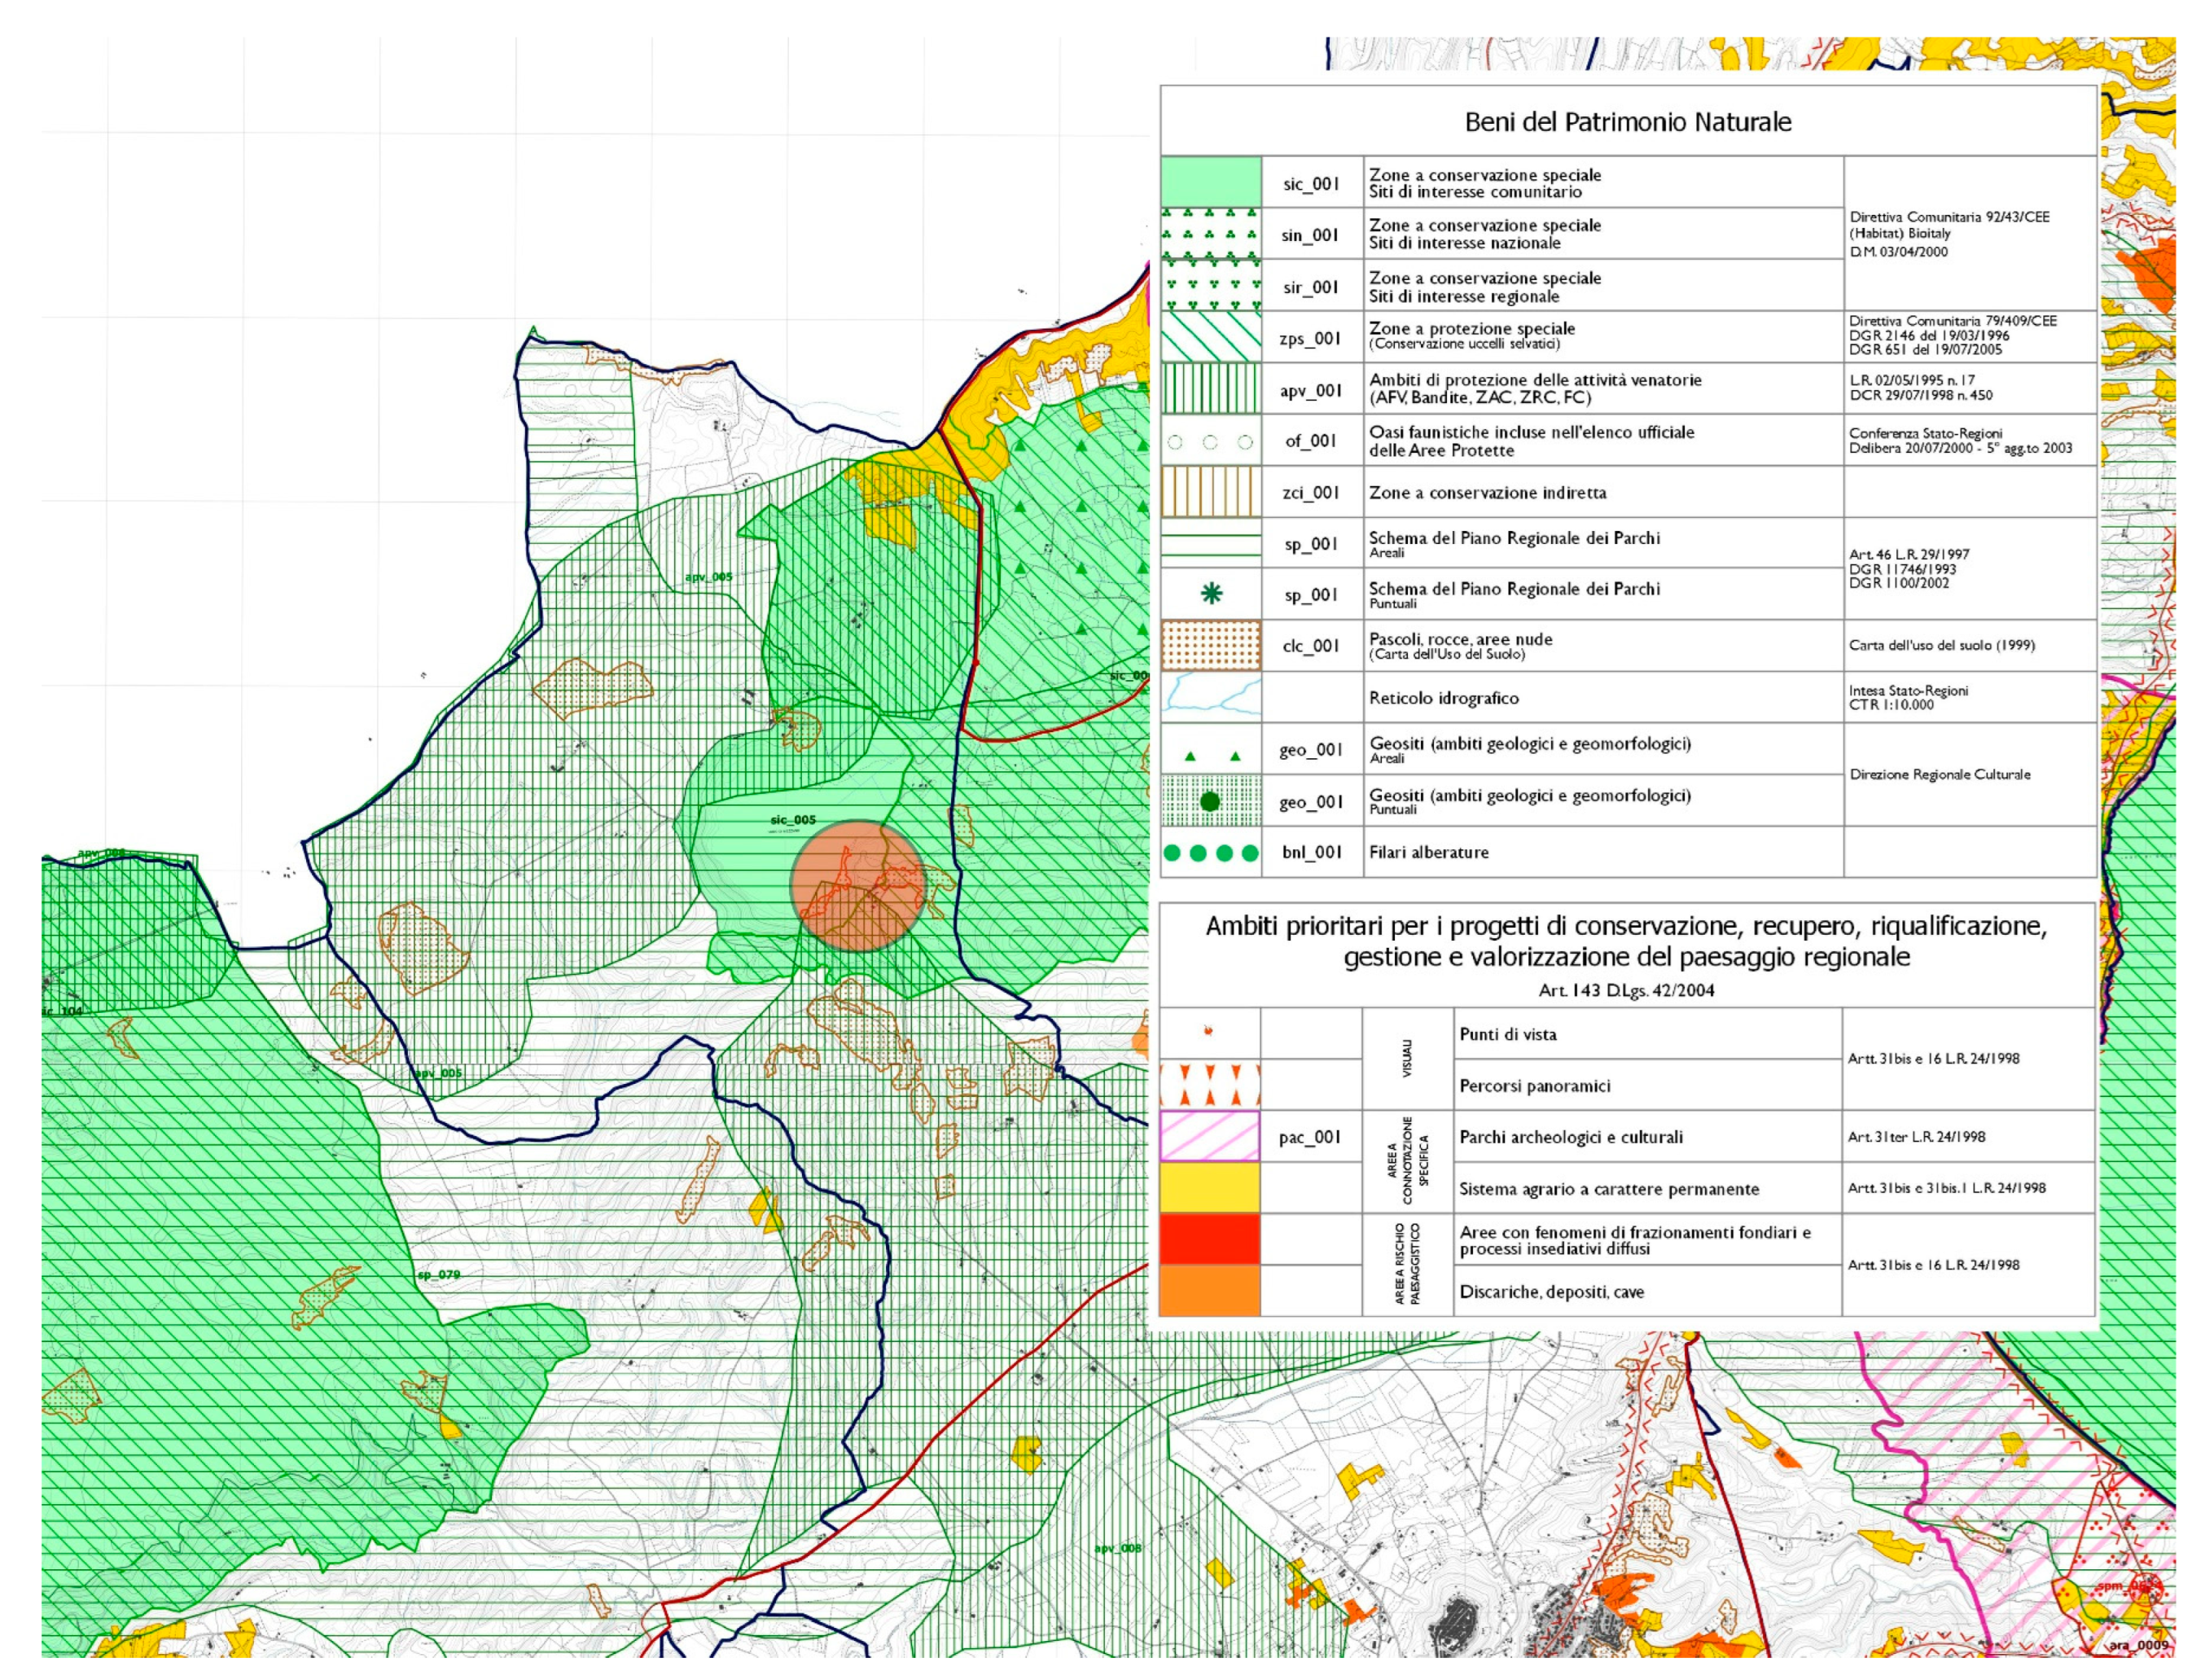
Alongside an already significant protection regime, more recently, the same area has been subject to an additional declaration of notable public interest, as issued by the competent superintendence under Articles 136 co. 1 lett. (c) and (d), 138 co. 3, and 141 of Legislative Decree no. 42 of 22 January 2004, and subsequent amendments, better known as the ‘Landscape, Geological, and Geomorphological Scope of the Rim of the Latera Caldera and its slopes affected by peripheral eruptive centres’ [
32] (
Figure 3).
The comprehensive report attached to the same provision identifies the area subject to the new perpetration as a “strongly unitary and coherent territorial and landscape reality of the Vulsinian chain, specifically: the scope of the so-called Latera caldera, the smaller Vepe caldera nested within the former (nested calderas), the entire calderic rim with its slopes, and the area of the peripheral eruptive centres of the Latera volcano system” (Descriptive report already integrated into the Declaration of significant public interest issued by Mibact and published in the online register of the competent superintendence and relevant local authorities, pending the final approval of the constraint) [
32].
The reference is made to a newly designated landscape area that falls between two areas of notable public interest, namely, the constraints of the Lake Bolsena basin [
33] to the east and the constraints of the Lake Mezzano basin [
34] and the Selva del Lamone [
35] to the west. This new designation recognises an autonomous, cohesive landscape and territorial reality, seamlessly connecting and stitching together four directly interconnected landscape contexts through geomorphological processes and the history that has shaped them. The proposal for the declaration of notable public interest, named the “Landscape, Geological, and Geomorphological Scope of the Rim of the Latera Caldera and its slopes affected by peripheral eruptive centres”, essentially concerns the territory occupied by the rim of the caldera generated by the Latera volcano.
It includes its slopes running from north to southeast, the peripheral eruptive centres generated by the same volcano in the southeast and south areas, as well as the plain located between these orographic margins. This described context is positioned between other areas of notable public interest, namely, the Lake Bolsena basin [
33] to the east and those of the Lake Mezzano basin [
34] and the Selva del Lamone [
35] to the west.
3.2. Places Subject to a Declaration of Significant Public Interest
The reasons behind the renewed ministerial interest are manifold. The same report linked to the definition of the most recent declaration of public interest for the area under examination clarifies that “among the main characteristics distinguishing these places is the substantial integrity of the natural, floral, and faunal environment” [
32].
Furthermore, the set of motivations that support the measure issued by the superintendence is also based on extensive literature, often referring to the Valentano area. As a mere illustrative example, there is a reference dating back to 1871 in the Bulletin of the Royal Geological Committee: “The most beautiful profile of scoria in the entire district is found near Valentano, exposed to a height of approximately 16 m on Monte Nero along the road heading towards Montalto. Colossal blocks of leucitic lava are visible on the mountain’s eastern slope, most likely covering and deriving from a powerful flow of said lava”.
The framework mentioned above was derived from urban planning sources and consequently from the coexistence of rules derived from the Law of 17 August 1942, no. 1150 and Legislative Decree of 6 June 2001, no. 380, along with those outlined by the Legislative Decree of 22 January 2004, no. 42, and Legislative Decree of 3 April 2006, no. 152, subsequently with legislation distinctively produced at the regional level and planning enacted at the local level, necessitating a necessary shift in the evolutionary perspective.
However, it is important to highlight that according to the legislation of the Cultural Heritage and Landscape Code, the safeguarding of landscape values does not necessarily imply the unalterable conservation of protected areas. Transformations are indeed allowed as long as they fall within the limits deemed compatible with established protection. This should consider the dynamics of territorial evolution and the prescriptions intended to outline urban and building development guidelines. Among the key features characterising these areas is the substantial integrity of the natural, floristic, and faunal composition. It is pertinent to note that almost the entire area situated in the northern extremity, between the Olpeta stream and the town of Latera, with Mount Calveglio of Latera in the middle, falls within the Site of Community Importance (SCI) and Special Protection Area (SPA) IT 6010011 ‘Caldera di Latera’. This section boasts a dense network of wooded areas (over 50% of the soil) and agricultural lands extending up to the shores of Lake Mezzano.
This legal framework primarily affects the feasible transformations concerning structures whose external aspects cannot be altered, even considering the energy-related reasons highlighted here, making the admissible retrofitting actions particularly complex.
3.3. Description of Buildings
The agri-spa (
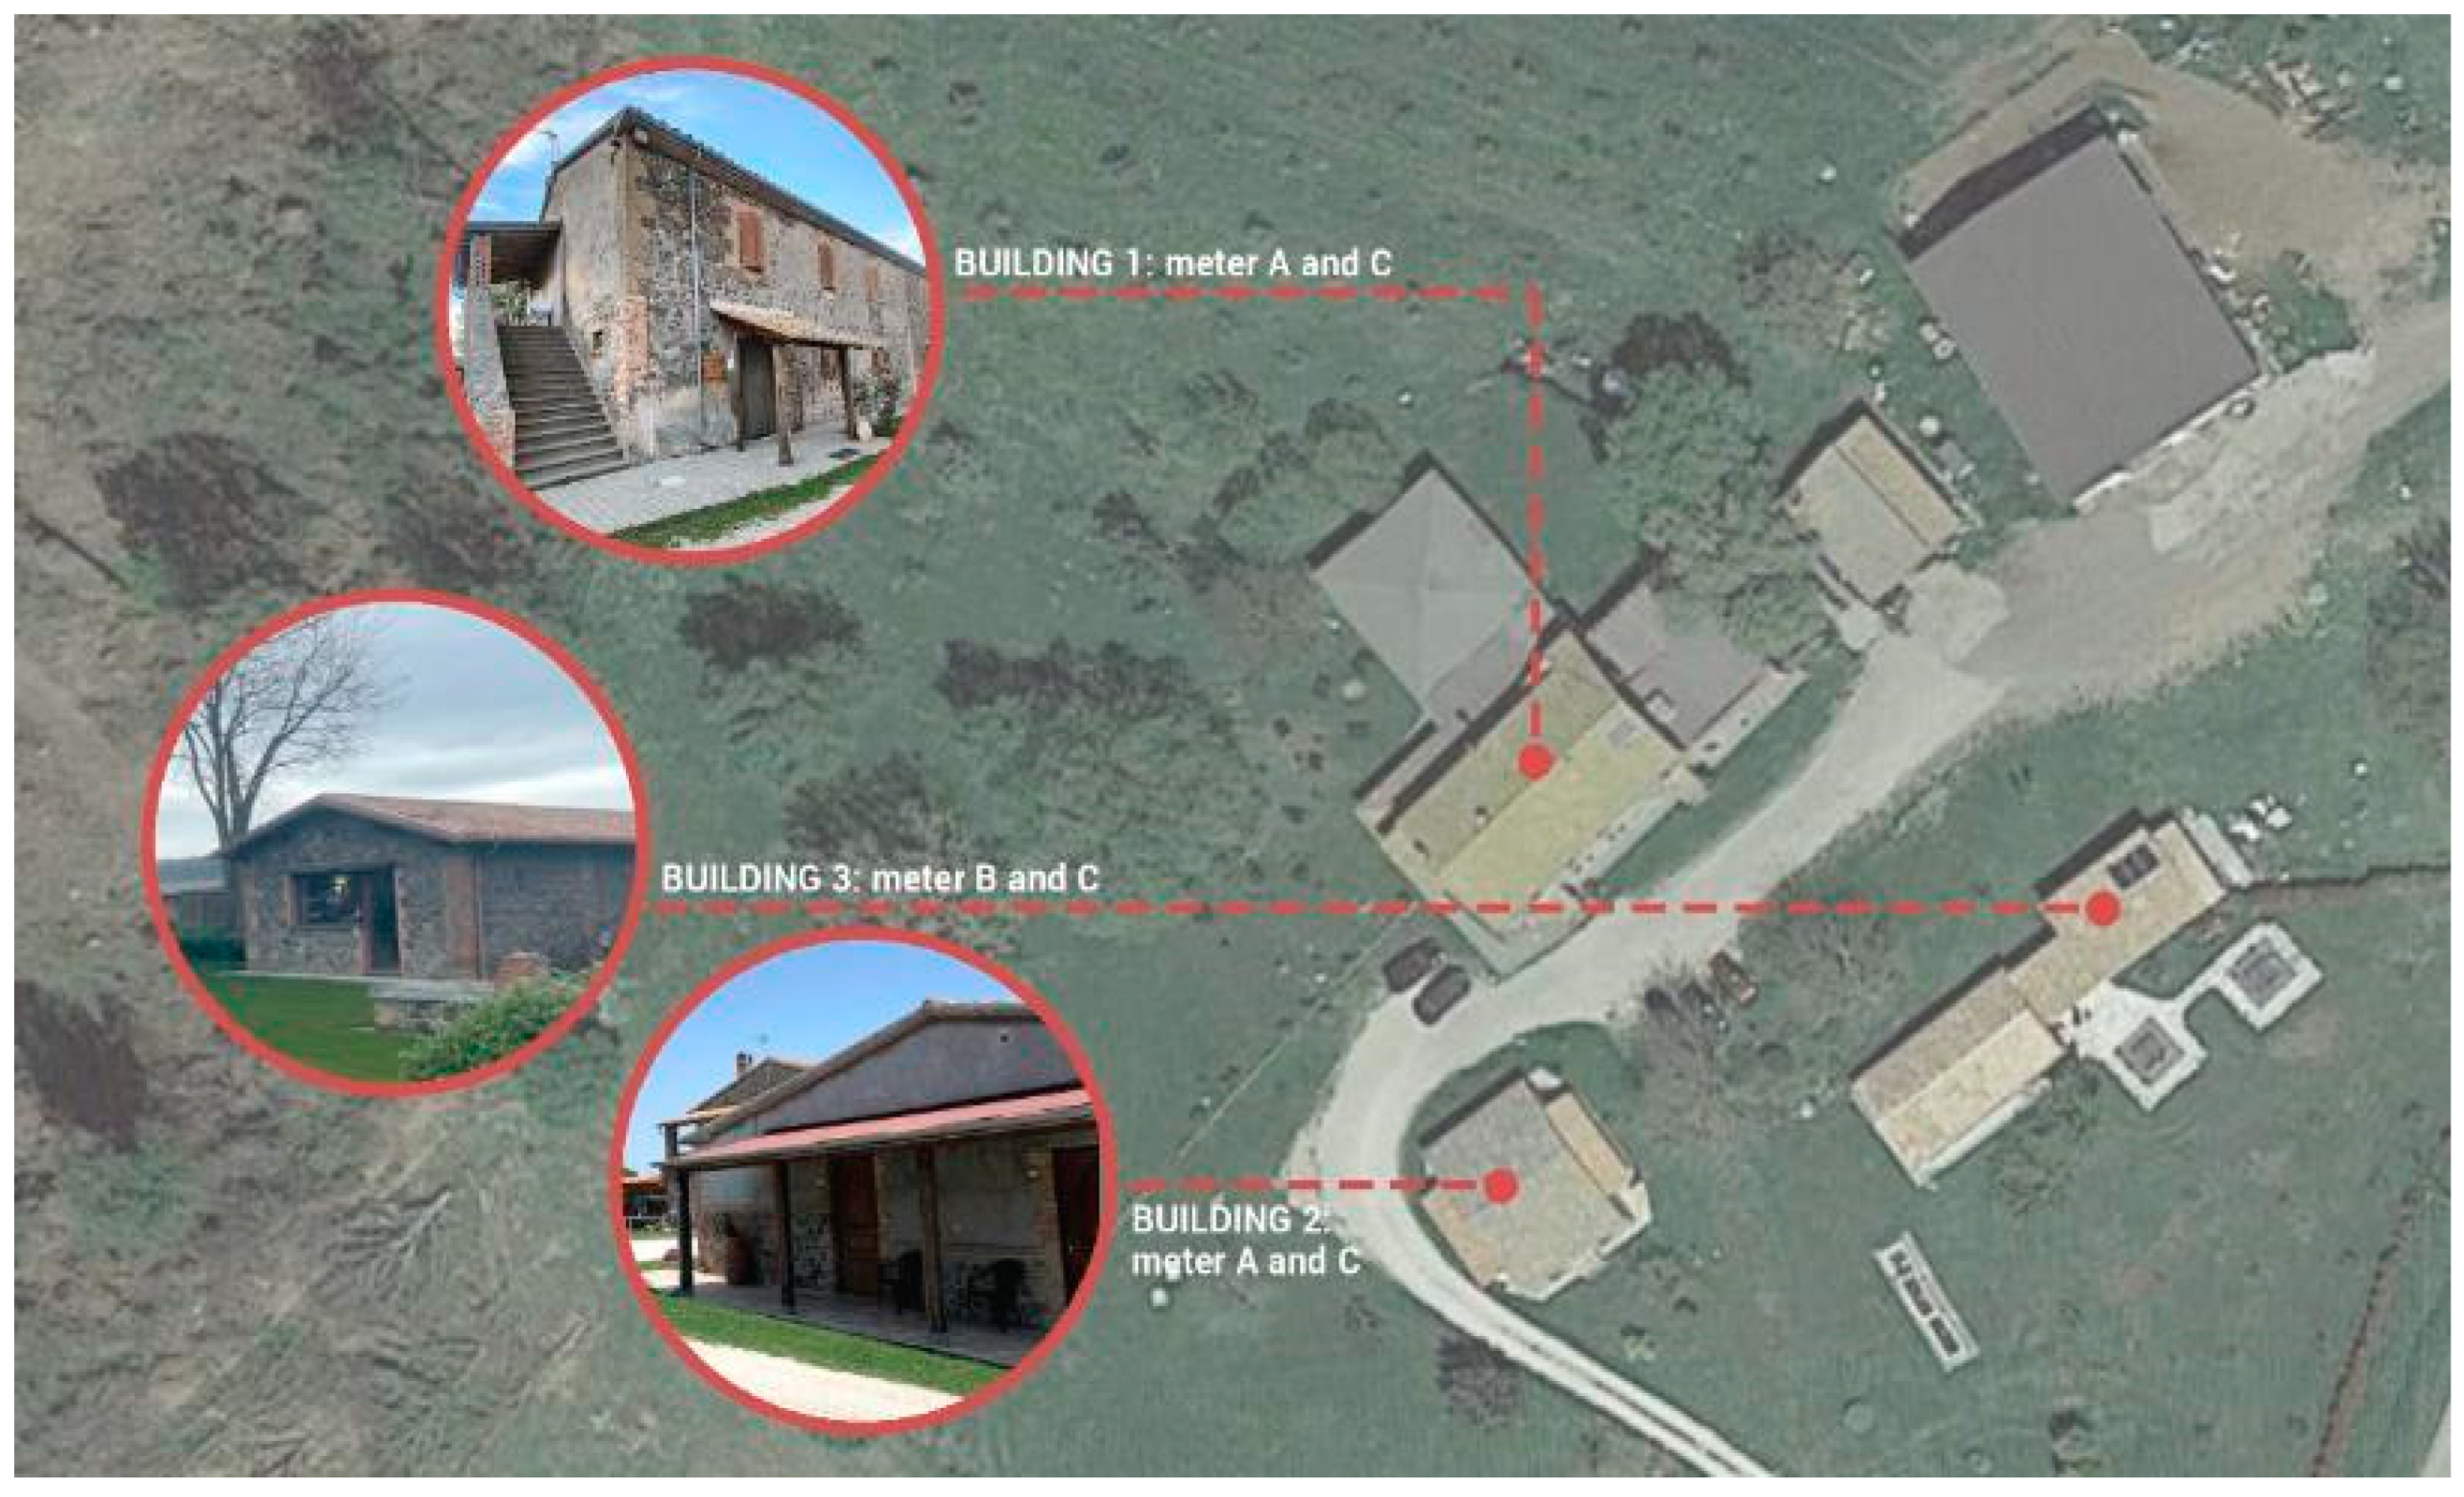
Figure 4) analysed in this article is also located in the climatic zone E (2101 ≤ HDD ≤ 3000). The twentieth-century complex consists of several buildings with different functions: agritourism, a dependence with rooms, agri-spa, agricultural equipment storage, sheep stables, hayloft, chicken coop, warehouse, and a shed of farming vehicles. This research analyses the three main buildings where thermal and electrical systems are located, representing almost all energy consumption. These buildings (
Figure 5) are agritourism (Building 1), dependence with guest rooms (Building 2), and the agri-spa (Building 3). The rural complex has two identical heating and domestic hot water systems, consisting of a condensing LPG boiler connected to a tank supplied by three thermal solar panels. Each system is connected to its meter: gas meter A supplies Buildings 1 and 2; gas meter B supplies Building 3. The complex has a single meter for electricity (meter C) that supplies all the buildings.
The primary geometric data and U-values of the envelope components of the three buildings are shown in
Table 1. The opaque envelope is composed of stone masonry, with a thickness ranging from 40 to 60 cm, and is internally plastered. The windows feature double-glazed wooden frames with an operational lifespan of approximately 30 years. Most of the windows have external wood shutters and internal solar shading devices. The floor slabs are constructed with steel beams and brick vaults; similarly, the uninsulated roofing of the first building was implemented. The roofs of Buildings 2 and 3 are made of wood and insulated with recently installed 10 cm thick PIR panels.
Two 30 kW LPG condensing boilers, supported by three solar thermal panels, supply the buildings with heating and domestic hot water. The heat distribution subsystem comprises two independent circuits, each with its heat control system. The heat emitters are radiators located on the walls facing outdoors in the agritourism and the dependence, while radiant floor panels are in the agri-spa. The buildings are not provided with cooling systems and mechanical ventilation. The most used lighting devices are LED lamps.
3.4. Data Collection on Occupancy, Climate, and Actual Energy Consumption
In order to carry out an accurate energy audit, it is crucial to understand the correlation between the building envelope elements and the system and model of the building system and construct an energy model that accurately simulates the energy behaviour under varying climatic conditions and user presence. Specifically, this paragraph outlines the collection of energy consumption data attributed to the following energy vectors: liquefied petroleum gas (LPG) and electricity. Energy consumption has been deduced through the acquisition and subsequent study of electricity and fuel supply bills. The following factors have been taken into consideration: (i) the sharing of a single meter that supplies numerous buildings or different functions, following DPR 412 [
36]; (ii) the use of fuel for different energy services (heating, domestic hot water (DHW), etc.); (iii) hourly profiles for energy-intensive appliances, systems, and user presence; (iv) climatic data, analysed according to conventional parameters based on the average season, following UNI 10349 [
37]; and (v) the variability of the billing period.
Questionnaires were employed to estimate how and when the heating system is used, the most energy-consuming appliances, and when the buildings are open to the public. Specifically, different schedules were defined for the summer months, during which the complex is utilised at full capacity; the intermediate months, during which the buildings are predominantly used on weekends; and the winter months, when it is open only a few days per month. Further differentiation among schedules was achieved by distinguishing the agri-spa, which is open to the public with different operating hours and possesses a separate meter and heating system compared to the rest of the complex. According to the users’ presence, an intermittent schedule was assumed for the space heating system. The set-point temperature is 20 °C in all conditioned spaces. Particularly energy-intensive appliances within the productive activity have been identified: a professional oven with a power of 11 kW; 3 professional refrigerators with 0.9 kW each; 2 cold rooms with 1 kW each; and a blast chiller with 0.6 kW. These appliances significantly impact the overall electricity consumption. Lighting, mainly LED, has been estimated using a literature value of 6 W m
−2 [
38].
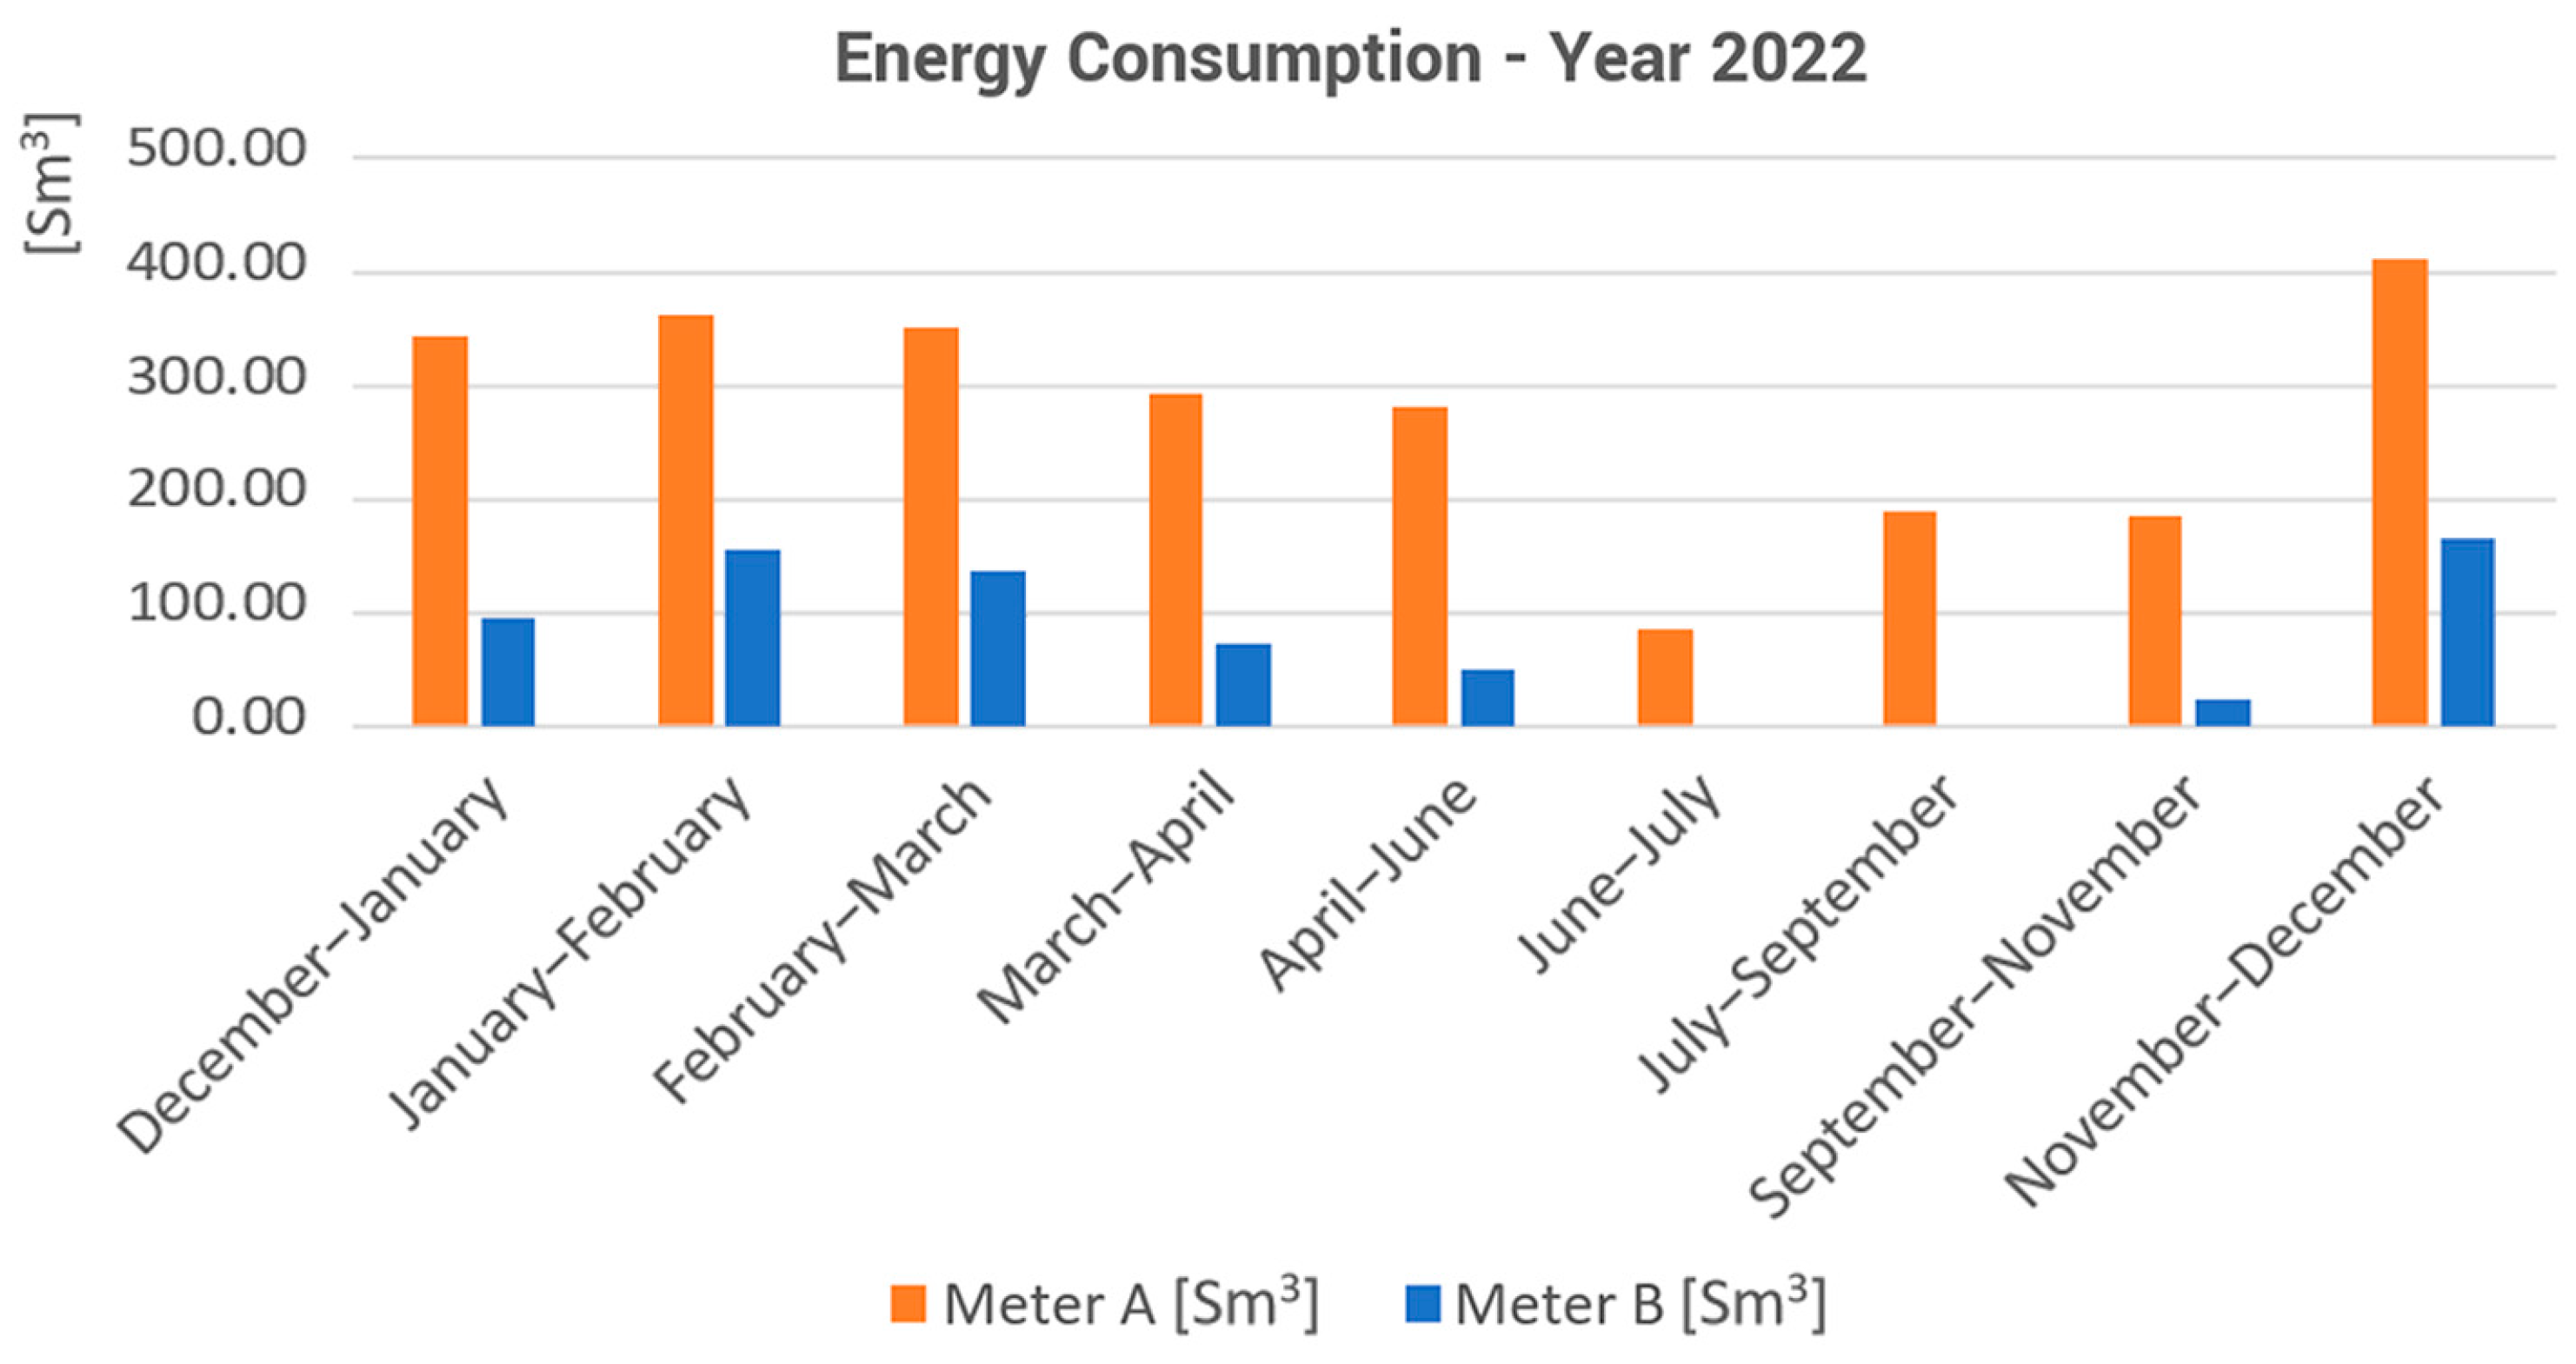
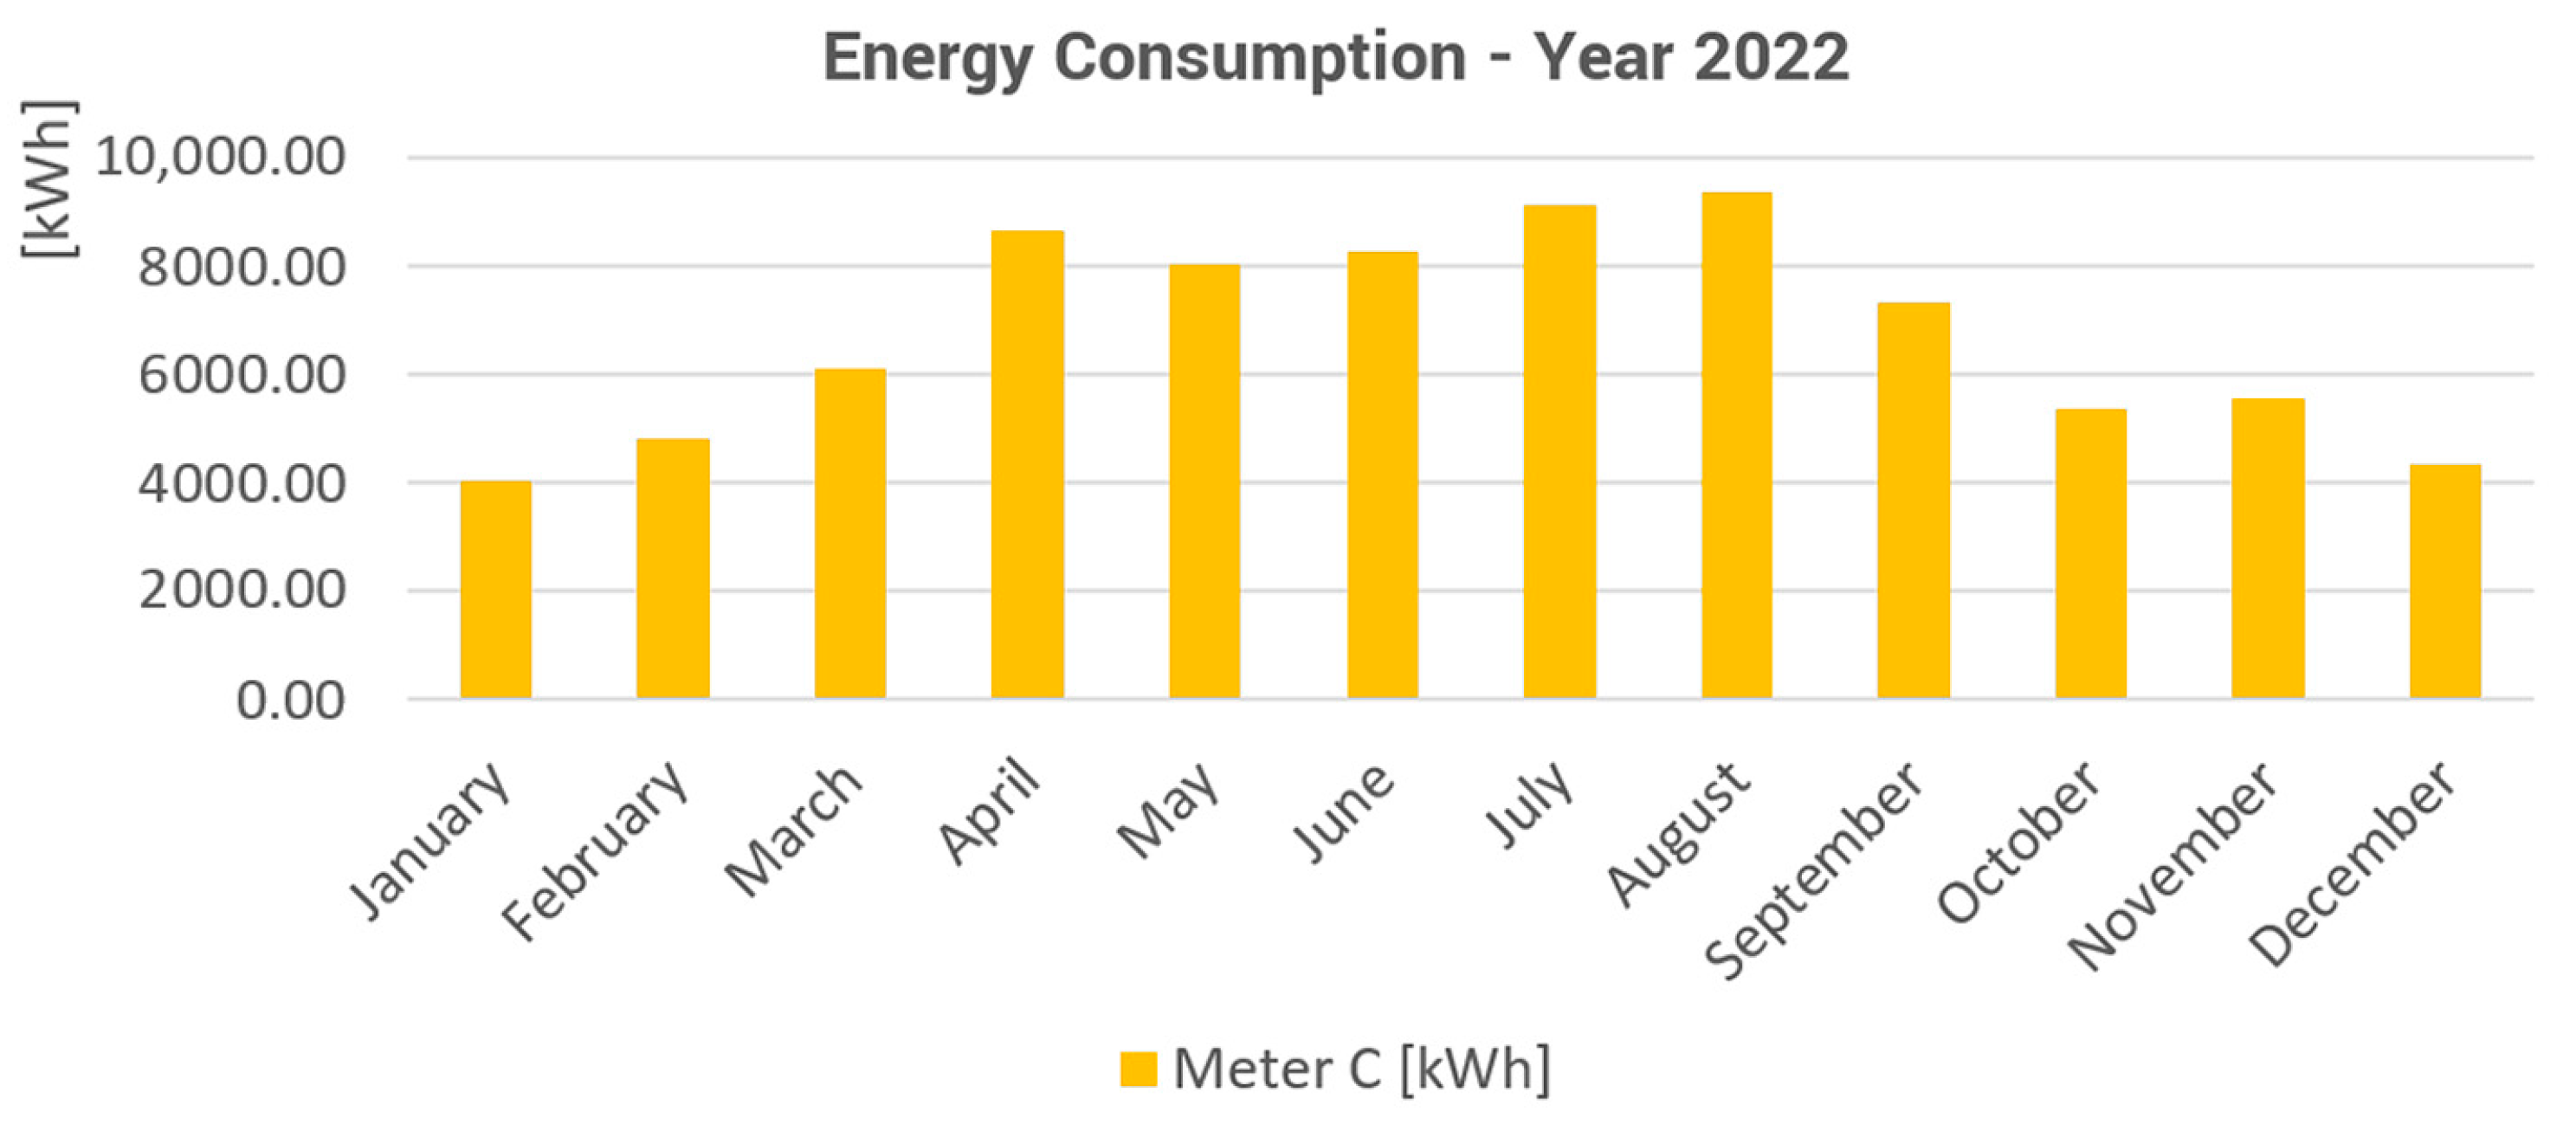
In the present paper, it was possible to assess energy consumption only for 2022 by examining invoices and payments related to electricity and liquefied petroleum gas (LPG) supply meters. The data are presented in the following figures:
Figure 6 and
Table 2 show the consumption related to the LPG used by the two heating systems for heating and domestic hot water production;
Figure 7 and
Table 3 illustrate electricity consumption primarily attributed to lighting, appliances, and auxiliary components of the heating systems.
3.5. Energy Simulation and Energy Model Calibration
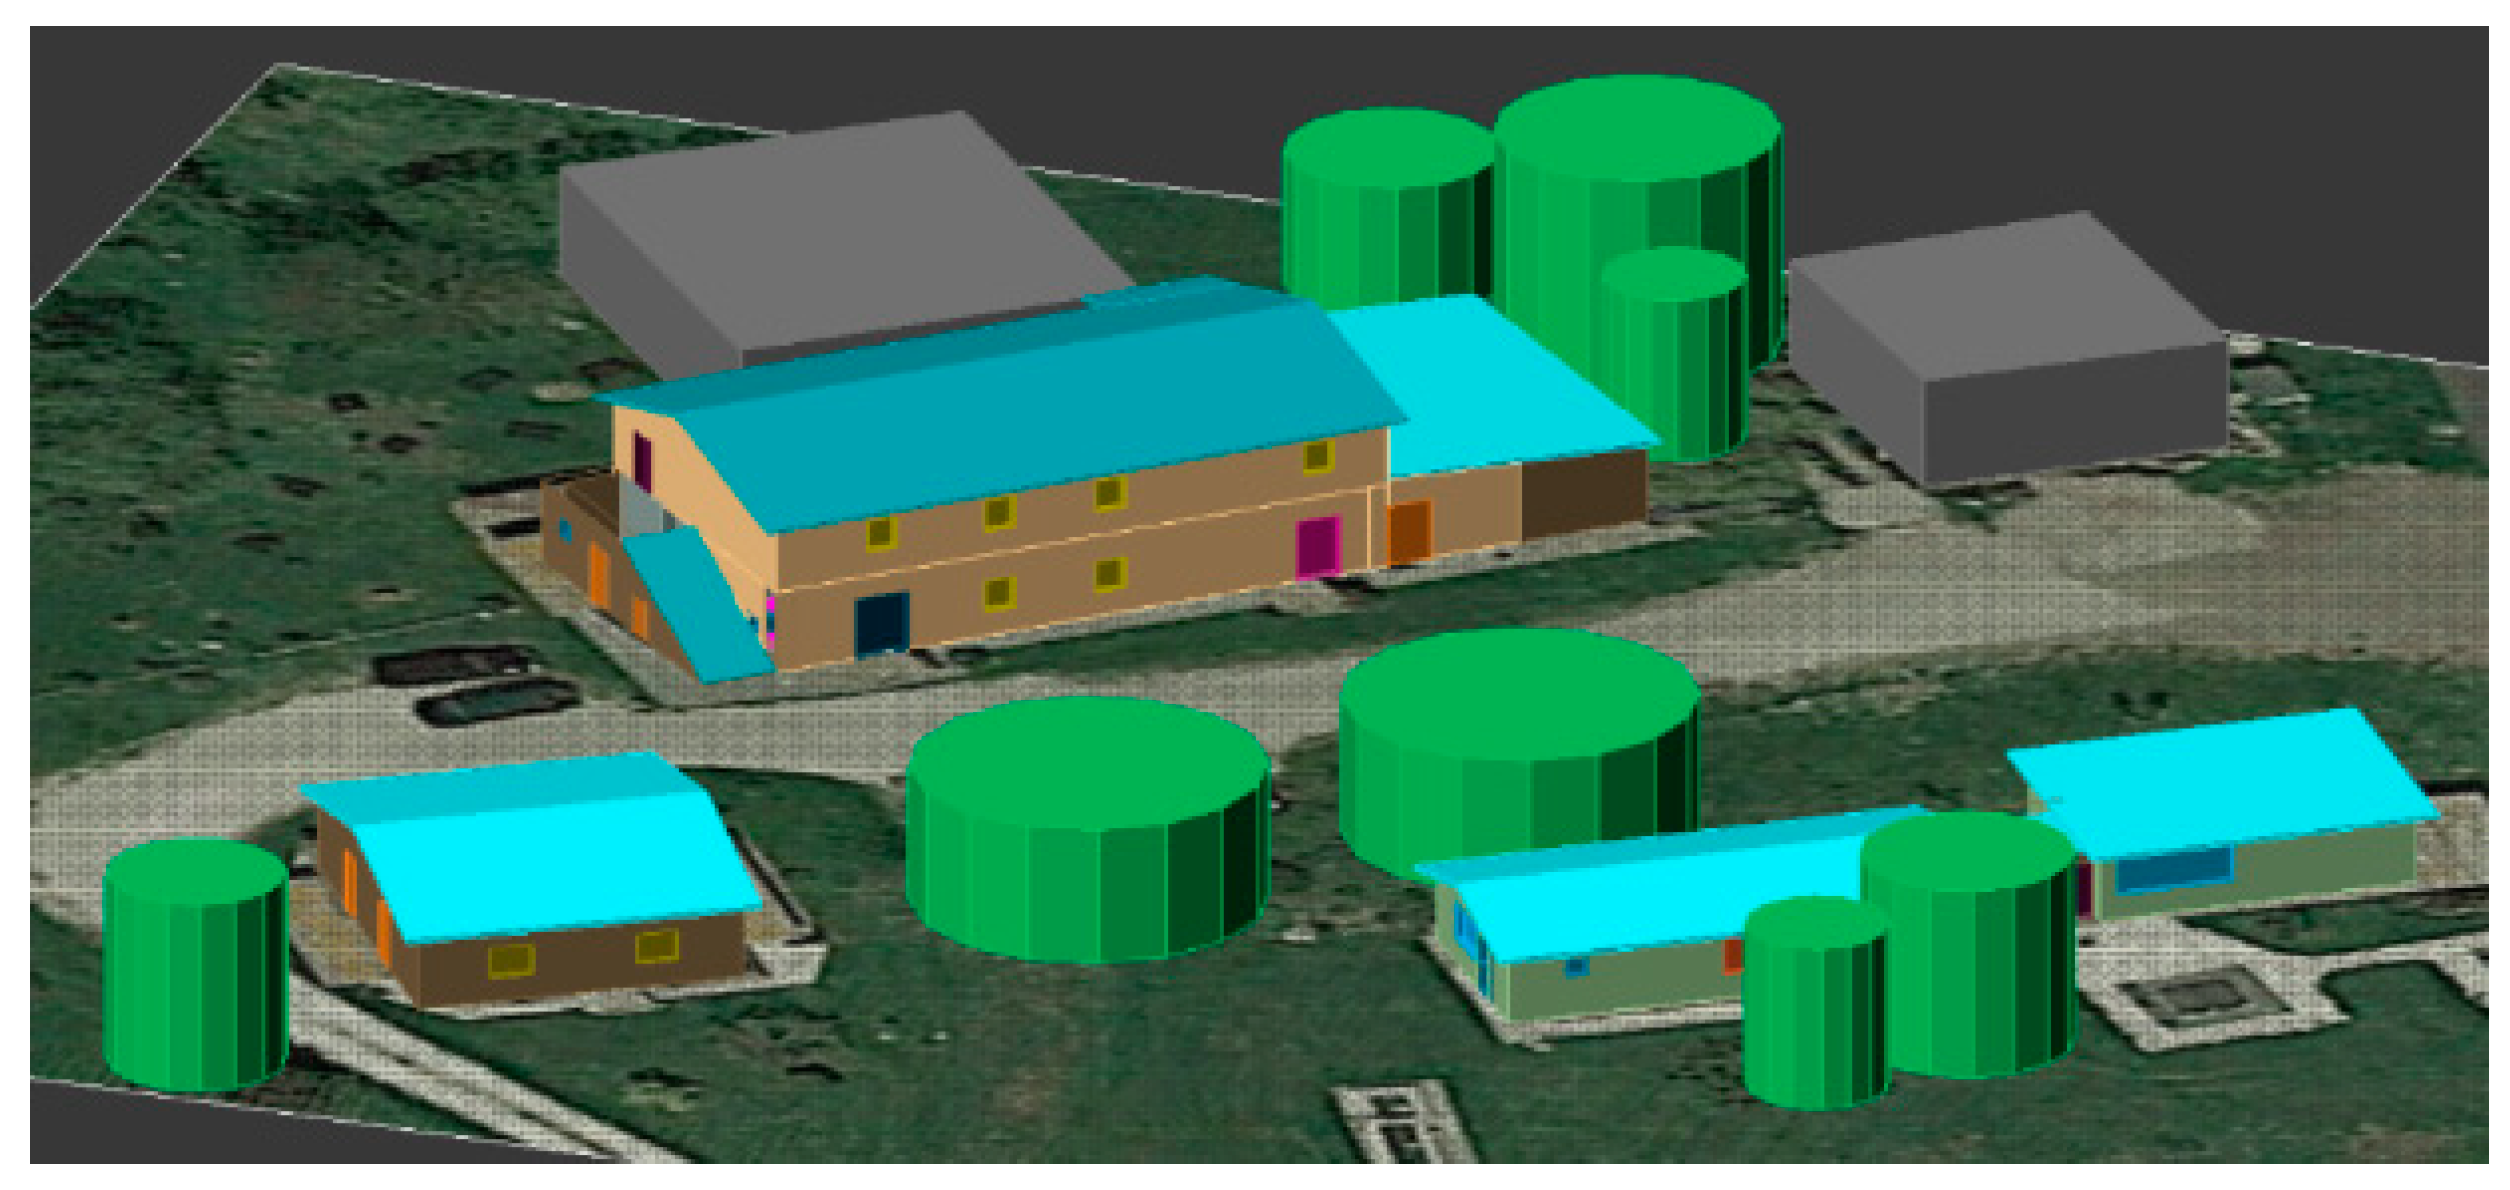
The energy model of the rural complex (
Figure 8) was divided into 46 thermal zones, modelled according to the different functions of each room. In total, 37 are part of the first heating circuit and 9 of the second one concerning the agri-spa. Each thermal zone was modelled according to UNI/TS 11300-1 [
39]:
Table 4 and
Figure 9 compare energy consumption measured under standard conditions [
39] and consumption derived from analysing energy bills. The energy model is calibrated by incorporating the actual period during which buildings were utilised, the operational time of systems, and actual climatic data. This calibration is expressed through the correction factor. The difference between the initial energy model and the corrected one should be less than 5% to deem the analysis accurate [
20].
By comparing the data in
Table 4, it is evident that the primary energy consumptions estimated during the asset rating evaluation are often higher than those acquired using a tailored rating evaluation. Consequently, the correction factor values are very high for heating. In the case of an industrial site or function with high energy consumption, the difference can be significant because the actual condition of use of the buildings can be considerably different from the standard conditions adopted during the asset rating evaluation [
44]. The main reasons for this significant difference are due to (i) the evaluation of the internal gains, which can be very large in the presence of appliances within the production zones, and (ii) the assumption that the heating system works in continuous use (24 h/24 h), imposed by the normative for an asset rating evaluation, is generally far from the actual management of the heating system. In this case study, the heating systems are usually switched on for a few days during the winter, when heating consumption is by far the highest, especially for poorly insulated buildings as in this case.
3.6. Energy-Saving Measures and Parametric Costs
The proposed energy-saving measures are listed in
Table 5 and
Table 6 and are divided into two groups: actions related to improving the energy performance of the building envelope elements and interventions to retrofit the thermal systems.
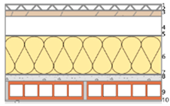
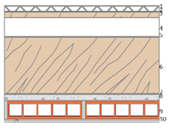
In particular, seven different intervention scenarios have been proposed (
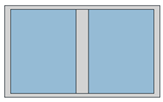
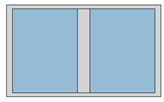
Table 5): the first three involve internal insulation of the building envelope, as the external coating is not feasible in this rural context. Different materials are considered while maintaining the same transmittance value (functional unit for the LCA). In this way, adding an extra layer of thermal insulation, with an average thickness of 8–15 cm, can decrease the U-value of walls and roofs by about 80–90% [
45]. These scenarios also include the insulation of the leading building roofing and replacing existing windows with new double glass with a low emissivity value to improve the thermal characteristics. Scenario 4 involves installing a photovoltaic panel system with 50.40 kW peak power. Scenarios 5, 6, and 7 foresee the same interventions on the building envelope: the installation of a photovoltaic system and the replacement of the condensing boiler with an air-to-water heat pump and related secondary system works (replacement of radiators with fan coils, water treatment, etc.) in order to take full advantage of the installation of renewable energy sources. In particular, the characteristics of each energy-efficiency measure intervention are listed below: (i) Scenario 1: installation of an internal coat of 5 cm of rigid PIR and 5 cm of glass wool for the passage of cables, 12 cm of PIR in the roof, replacement of windows; (ii) Scenario 2: installation of an internal coat of 10 cm rigid wood fibre panel and 5 cm wood fibre for the passage of cables, 18 cm wood fibre in the roof, replacement of windows; (iii) Scenario 3: installation of an internal coat of 3.5 cm rigid aerogel panel and 5 cm of glass wool for the passage of cables, 8 cm aerogel in the roof, replacement of windows; (iv) Scenario 4: installation of 50.40 kW peak power photovoltaic system; (v) Scenario 5: same insulation as in Scenario 1, photovoltaics as in Scenario 4 and replacement of the two condensing boilers with two air-to-water heat pumps of 17 and 10 kW, replacement of radiators with fan coils, water treatment; (vi) Scenario 6: same insulation as in Scenario 2, photovoltaics as in Scenario 4 and same system work as in Scenario 5; (vii) Scenario 7: same insulation as in Scenario 3, photovoltaics as in Scenario 4 and same system work as in Scenario 5.
The associated investment costs are detailed in
Table 6. These figures originate from a market survey that includes products, installation, and commissioning, excluding design costs and VAT. The maintenance costs refer to literature studies. The in-depth analysis of parametric costs is detailed in the
Supplementary Materials and has been developed by the authors concerning the 2023 Italian market prices, which have been affected by the significant inflation in construction material costs following the substantial fiscal incentives granted between 2020 and 2022.
Table 5.
Main stratigraphies and relevant energy-saving interventions on the building envelope in each scenario—© Authors.
Table 6.
Relevant operating and intervention costs for each scenario—© Authors.
Table 6.
Relevant operating and intervention costs for each scenario—© Authors.
| Element | Parametric Cost [€] | Quantity | Scenario | Source of Data |
|---|
| Installation of PUR (5 cm) and glass wool (5 cm) internal insulation with plasterboard (1.25 cm) | EUR 165.00 m−2 | 778.30 | S1/S5 | “DEI recupero, ristrutturazione, manutenzione, I semestre 2023” [46] |
| Installation of wood fibre (15 cm) internal insulation with clayboard (2 cm) | EUR 210.00 m−2 | 778.30 | S2/S6 | “DEI recupero, ristrutturazione, manutenzione, I semestre 2023” [46] |
| Aerogel (3.5cm) and glass wool (5 cm) internal insulation with plasterboard (1.25 cm) | EUR 440.00 m−2 | 778.30 | S3/S7 | “DEI recupero, ristrutturazione, manutenzione, I semestre 2023” [46] |
| Installation of 12 cm PUR insulation on the roof | EUR 160.00 m−2 | 250.50 | S1/S5 | “DEI recupero, ristrutturazione, manutenzione, I semestre 2023” [46] |
| Installation of 18 cm wood fibre insulation on the roof | EUR 275.00 m−2 | 250.50 | S2/S6 | “DEI recupero, ristrutturazione, manutenzione, I semestre 2023” [46] |
| Installation of 8 cm aerogel insulation on the roof | EUR 825.00 m−2 | 250.50 | S3/S7 | “DEI recupero, ristrutturazione, manutenzione, I semestre 2023” [46] |
| Installation of new windows (U < 1.30 W m−2 K−1) | EUR 1250.00 m−2 | 81.85 | S1/S2/S3/S5/S6/S7 | “DEI recupero, ristrutturazione, manutenzione, I semestre 2023” [46] |
| Installation of a photovoltaic system | EUR 2400.00 kWp−1 | 50.40 | S4/S5/S6/S7 | (Fregonara et al., 2018) [47] |
| Installation of heat pumps (17.00 kW and 10.00 kW) and fan coils | EUR 60,000.00 | 1 | S5/S6/S7 | “DEI impianti tecnologici, I semestre 2023” [48] |
| Electricity supply | EUR 0.25 kWh−1 | variable | S0/S1/S2/S3/S4/S5/S6/S7/S8 | Edilclima EC700 v.12.23.14 and EC720 v.7.23.14 |
| LPG supply for heating | EUR 3.50 Sm−3 | variable | S0/S1/S2/S3/S4 | Edilclima EC700 v.12.23.14 and EC720 v.7.23.14 |
| Maintenance of the photovoltaic system | EUR 40.00 kWp−1 | 50.40 | S4/S5/S6/S7 | (Fregonara et al., 2018) [47] |
| Maintenance of the conventional gas boiler | EUR 100.00 (pcs y)−1 | 2 | S1/S2/S3/S4 | (Costantino et al., 2023) [49] |
| Maintenance of the heat pump | EUR 150.00 (pcs y)−1 | 2 | S5/S6/S7 | (Paiho et al., 2017) [50] |
Table 7 shows the potential annual economic savings resulting from the proposed measures to reduce energy consumption, along with the deductible initial investments at 50% or 65%, in accordance with current Italian laws [
51]. The annual energy savings (m
3 or kWh) were calculated using the results obtained from the energy simulation for each scenario and comparing them with the baseline values reported in
Table 4. The savings from reduced energy consumption were calculated by multiplying these values by the unit cost in
Table 6. The investment cost was derived by summing and multiplying the unit costs by the quantities associated with the planned interventions in each scenario, as listed in
Table 6. Tax deductions have been assessed following current Italian regulations, which provide the following: for thermal insulation interventions through the use of external coating, a deduction of 65%, in 10 annual instalments, with a maximum deduction of EUR 60,000 (maximum deductible expense EUR 92,307.69); for the replacement of fixtures, a deduction of 50%, in 10 annual instalments, with a maximum deduction of EUR 60,000 (maximum deductible expense EUR 120,000.00); for photovoltaic systems, a deduction of 50%, in 10 annual instalments, with a maximum deduction of EUR 48,000.00 (maximum deductible expense EUR 96,000.00); for the installation of heat pump systems, a deduction of 50%, in 10 annual instalments, with a maximum deduction of EUR 30,000 (maximum deductible expense EUR 60,000.00).
Assuming the same transmittance values, this study shows that Scenarios 1, 2, and 3 have the same energy savings (44.60%) and significantly lower GPL needs (72.40%). However, there is a significant difference in the initial investment amount arising from using different materials: the scenario with polyurethane and glass wool is cheaper. At the same time, the one with wood fibre entails an increase of approximately 23%, and that with aerogel and glass wool exceeds 240%. A similar pattern is shown for Scenarios 5, 6, and 7, where the annual energy savings are identical in all three cases, allowing a significant reduction in operating costs of more than 80%. However, also in this case, the initial cost varies considerably: the scenario with wood fibre incurs an approximate 15% higher cost, whereas the one employing aerogel and glass wool presents an 84% increment. Scenario 4, entailing the installation of a 50.40 kWp photovoltaic system, emerges as the most cost-effective option and is predominantly eligible for tax incentives, yielding an annual energy cost reduction of approximately 27.30%.
4. Results
4.1. Interpretation of Life Cycle Assessment (LCA) Results
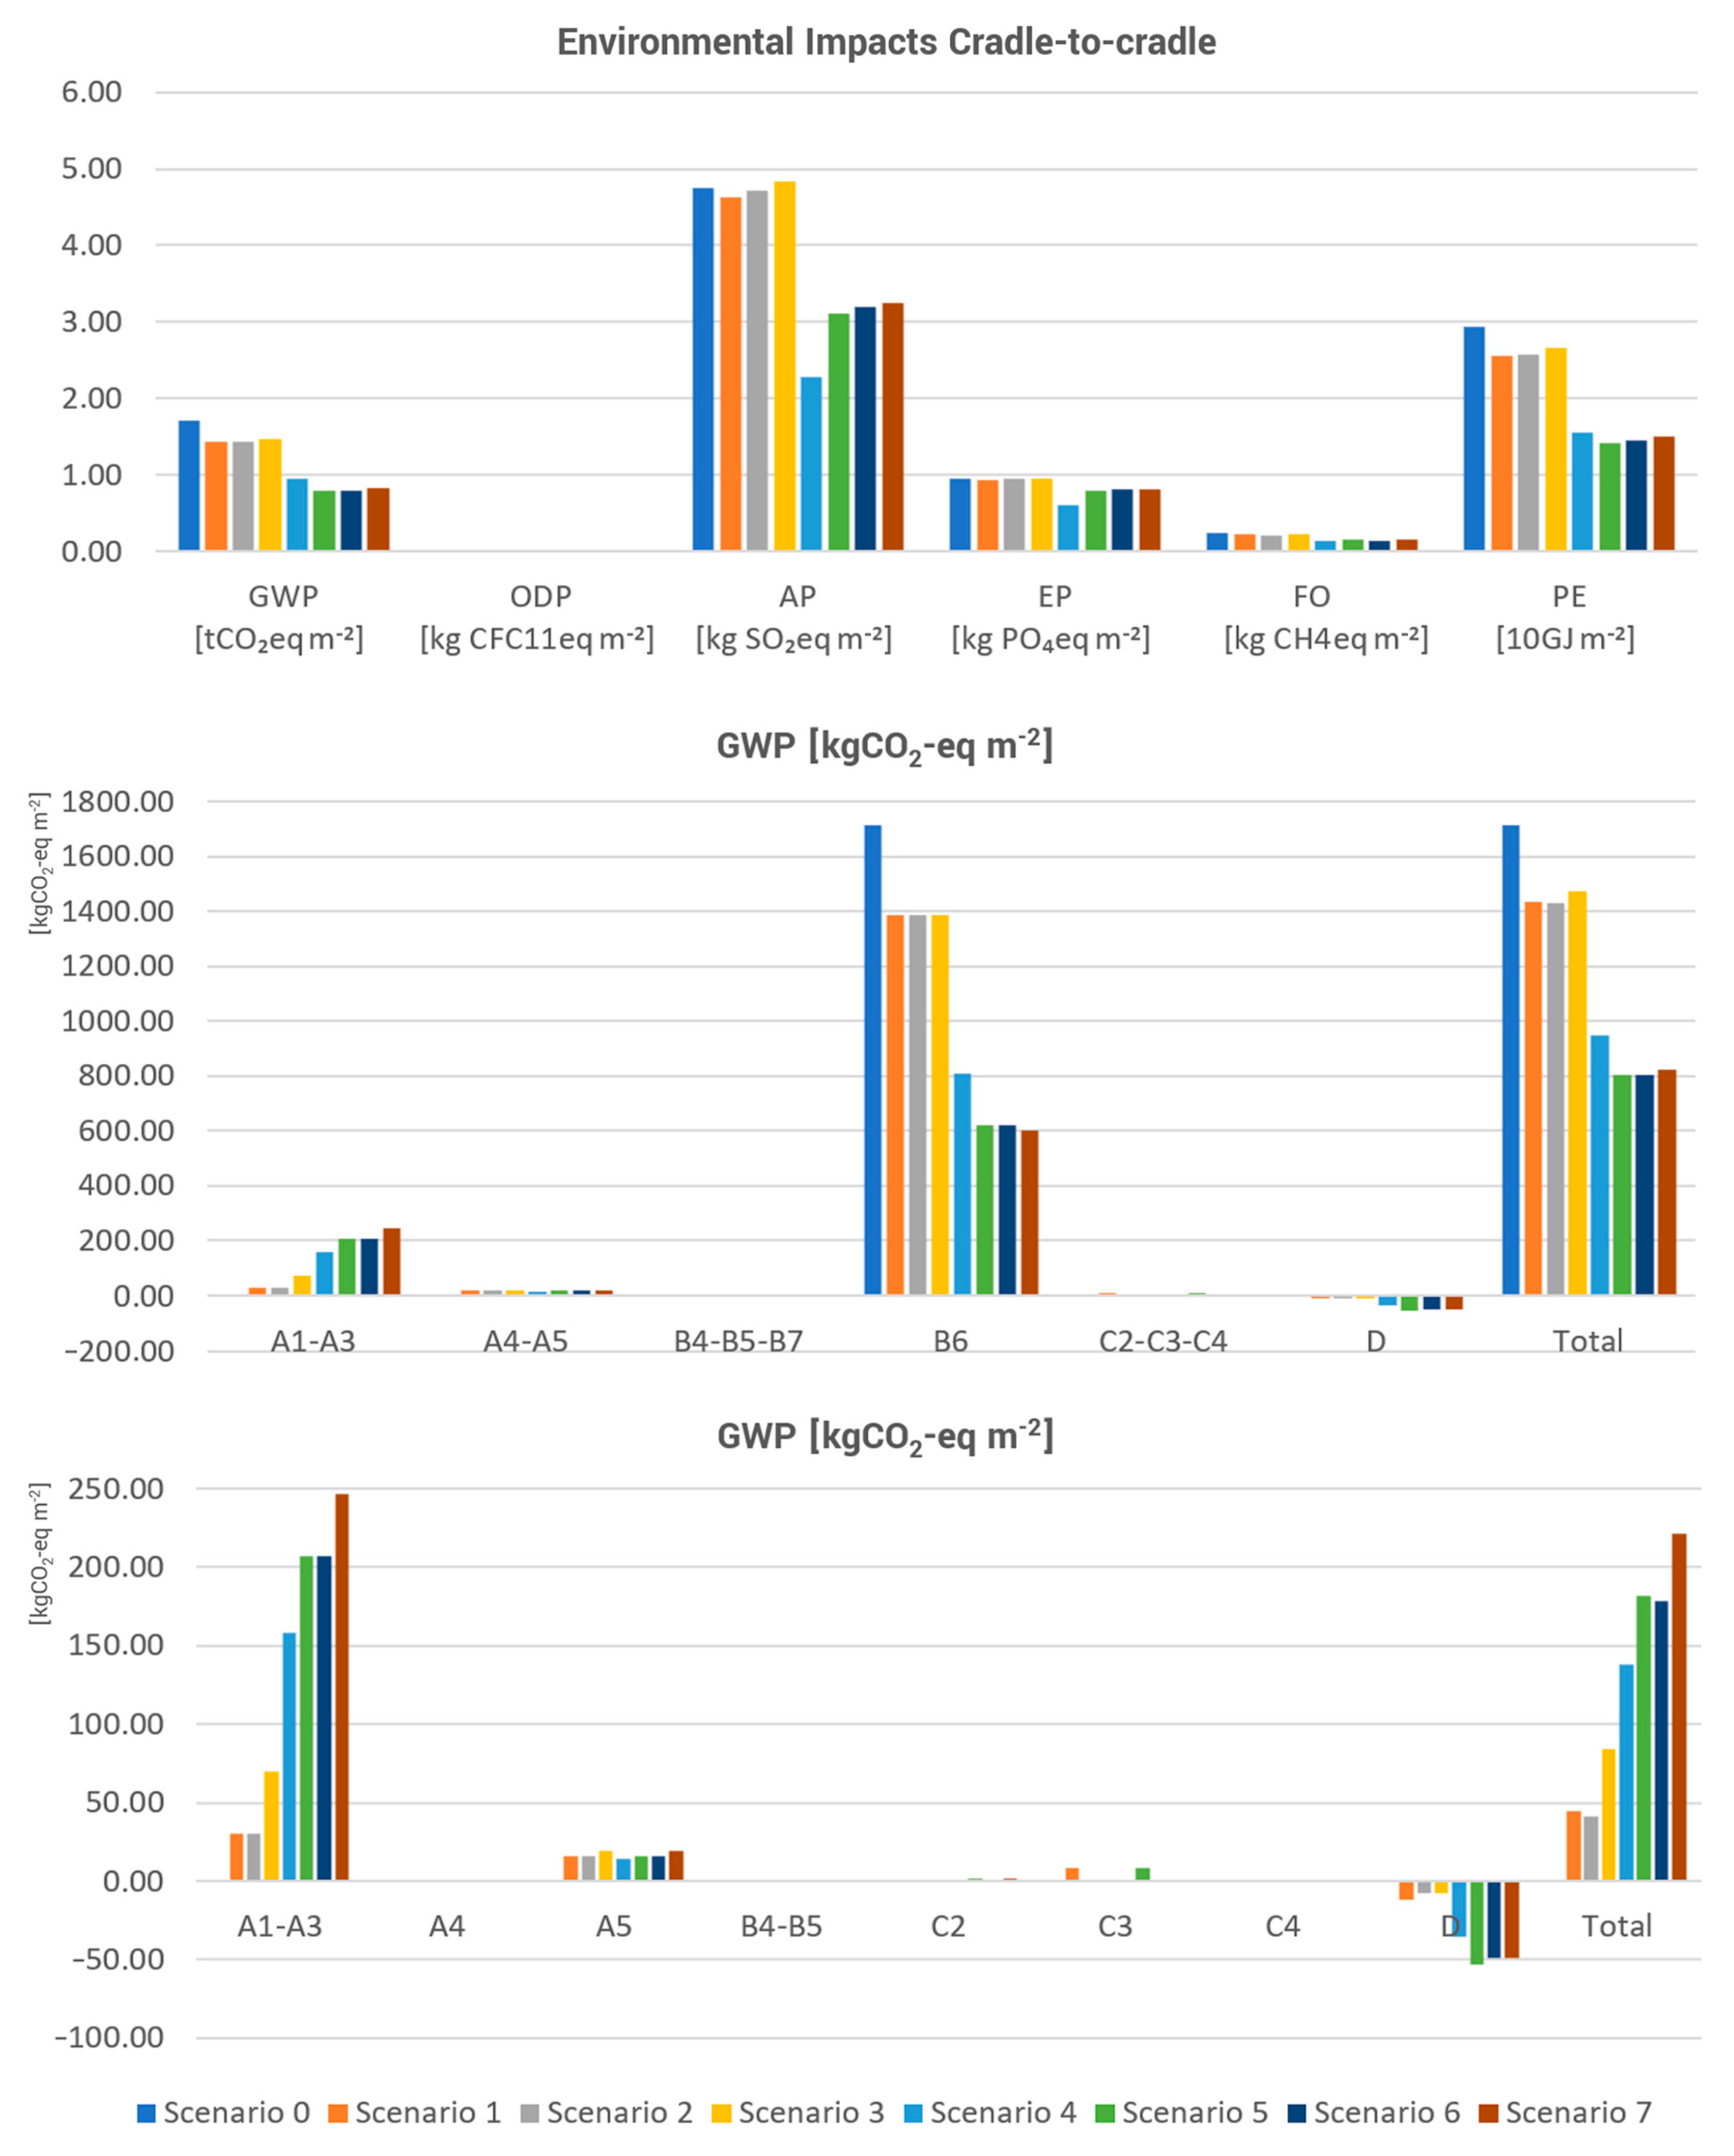
Figure 10 shows the LCA results for each of the evaluated scenarios over a 20-year analysis period, per square meter of gross floor area (GFA), to assess the cost-effectiveness of energy-efficiency measures in the short/medium term. Scenario 0, the Baseline, represents existing buildings and has been analysed concerning the operational phase (energy and water consumption, B6–B7), using data on the Italian energy mix for electricity and emissions for LPG consumption. For energy retrofit scenarios, on the other hand, the evaluation covered the production phases of the materials installed in each intervention (A1–A3) according to
Section 3.6, their on-site installation (A4–A5), the use phase (B1–B5), energy and water consumption (B6–B7), and the end of life of the materials, assuming their decommissioning at the end of the assessment period (C1–C4 and D). This assumption is conservative, given that the materials generally have a longer lifespan. The production phase was calculated using average data referring to Italy or Europe where available and using environmental product declarations (EPDs) of specific products for insulation materials. Transportation from production facilities to the construction site (A4) was calculated using the higher value between the default value provided by the OneClick LCA (1.10.0) software and the value commonly found in the literature for material type: 50 km for bulk materials [
52] and 100 km for all other materials [
53]. Estimating the environmental impacts related to on-site construction (A5) is more complex, as data on energy consumption are often not readily available. Many studies suggest calculating this phase by assuming it as a small percentage of the impacts associated with the production phase, typically ranging between 4 and 5% [
52,
53,
54]. For this reason, it was chosen to use values calculated with the OneClick LCA on-site module specific to a Mediterranean climate, which employs average consumption data per gross floor area, considering the production of 5 kg/m
2 of construction waste, the use of 25 kWh/m
2 of electrical energy, and the consumption of 3.5 L/m
2 of diesel. The impacts related to decommissioning and end-of-life material treatment were assessed using the data provided by OneClick LCA, referencing either average data or EPD, depending on the materials.
The analysis results have been presented in three graphs (
Figure 10): (i) the first illustrates the impacts of each scenario over the 20-year period in terms of global warming potential (GWP), ozone depletion (OD), acidification potential (AP), eutrophication potential (EP), formation of ozone of lower atmosphere (FO), and total use of primary energy (PE); (ii) the second depicts the contribution in terms of GWP from each analysed phase; (iii) the third illustrates the contribution in terms of GWP from each phase, excluding the operational phase.
Analysing the total of each phase in terms of GWP, which constitutes the central part of the graph, it emerges that operational phase B6 is overwhelmingly predominant and significantly influences the total outcomes in a building with high energy consumption. From this perspective, all energy-efficiency measures effectively reduce environmental impacts in the short/medium term. Specifically, interventions on the building envelope, Scenarios 1, 2, and 3, result in a reduction ranging from 14% to 17% in GWP; the installation of a photovoltaic system, Scenario 4, leads to a reduction of approximately 45%; and addressing both the building envelope and heating systems results in a total emission reduction ranging from 52% to 53%.
In particular, this analysis shows that heating and domestic hot water consumption are marginal compared to electricity consumption due to very energy-intensive appliances. Consequently, an additional increase in renewable energy sources or storage batteries would be necessary to further reduce emissions and consumption beyond the assumed 50.40 kW peak capacity.
From the third graph, concerning GWP excluding the operational phase, several considerations can be drawn regarding the proposed materials. Specifically, the insulation scenario with lower environmental impacts is achieved using wood fibre. However, the difference compared to using polyurethane and glass wool is only 0.35%. On the other hand, the scenario employing aerogel and glass wool results in a significant increase of 56.87% despite an equivalent reduction in energy consumption. Additionally, it is important to note that this analysis does not account for biogenic carbon storage, which would further favour scenarios utilising wood fibre.
Regarding overall impacts, considering other indicators, it is evident that insulation and system interventions (Scenarios 5, 6, and 7) result in lower emissions compared to those involving only the insulation of the building envelope. However, the scenario that ensures the least impact in terms of acidification potential (AP), eutrophication potential (EP), and formation of ozone of lower atmosphere (FO) is the installation of a photovoltaic system (Scenario 4).
This result highlights that high electricity consumption is the most significant factor in determining the environmental impacts. Consequently, directly addressing this critical issue is the absolute priority. In contrast, energy consumption arising from heating and domestic hot water (DHW) is currently of secondary importance, given the limited use of the building during winter months. A different, continuous use of the building would have yielded markedly different results, potentially favouring interventions that reduce energy consumption through building envelope insulation.
4.2. Interpretation of Life Cycle Cost (LCC) Results
The economic evaluation of the scenarios has been conducted using the equations from
Section 2.2 and has been summarised in
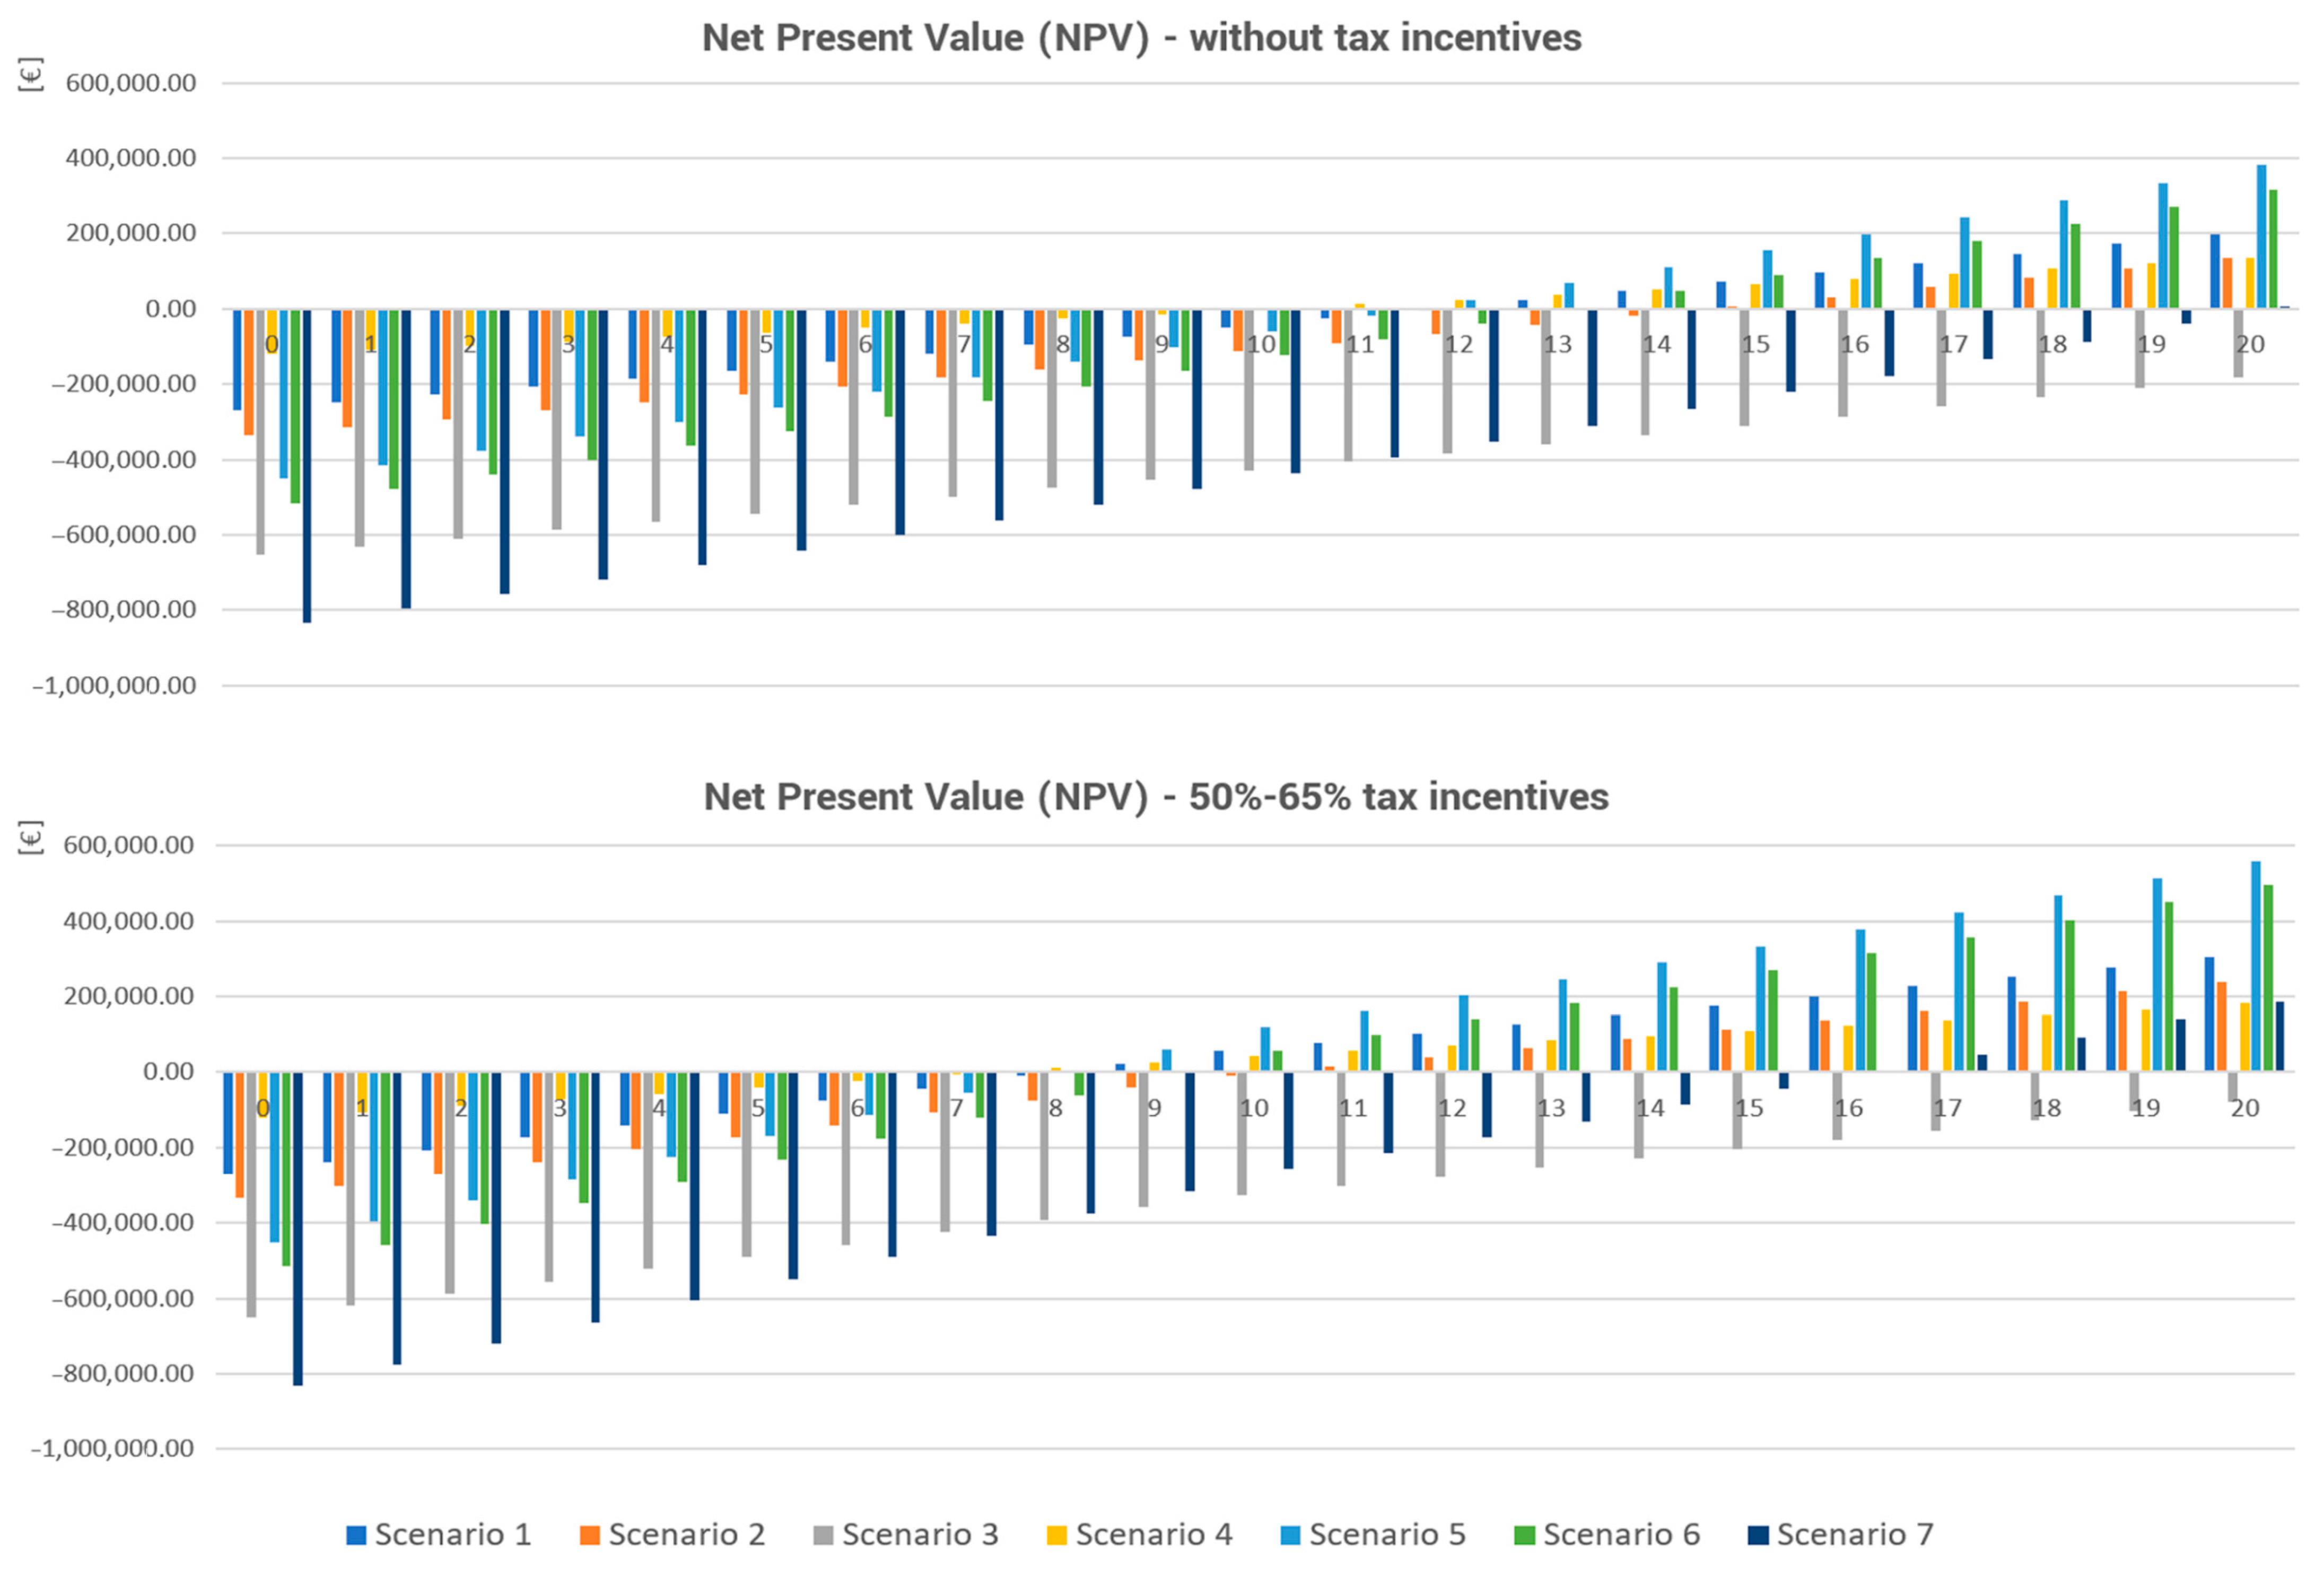
Figure 11, which compares the net present value (NPV) calculated without tax incentives and using currently available tax incentives (50% and 65%) in Italy for each scenario. In addition,
Table 8 expresses the correlation between the NPV, profitability index (PI), and payback period (PBP), whether tax incentives are assessed or not. Like LCA, the analysis is conducted over a 20-year period to evaluate the economic feasibility of the interventions in the short/medium term. Before discussing the results obtained in the economic evaluation, it is important to reiterate what was mentioned in
Section 3.6: the significant inflation in the price of construction materials in Italy in recent years has a profound impact on the analysis results, resulting in particularly long payback periods and making some energy retrofit scenarios less cost-effective.
Analysing interventions involving the insulation of the building envelope shows that Scenario 3, involving the installation of aerogel and glass wool panels, is not economically sustainable even with tax incentives; and Scenario 2, which utilises wood fibre panels, achieves a positive NPV and payback periods of 11 and 15 years with and without tax incentives, respectively. However, the profitability index is below 1 in both cases, emphasising that investment costs have an unprofitably high level; Scenario 1, involving the use of PIR and glass wool panels, achieves the best results and is the only one among the three to achieve a payback period of less than 10 years, with a positive NPV and a profitability index greater than 1.
The table shows similar results regarding interventions that involve both insulation and new heating systems: in this case, the intervention with aerogel (Scenario 7) has a positive NPV, but the payback periods are very long, and the PI values tend toward zero. The scenario with wood fibre insulation achieves positive NPV values both with and without incentives, with payback periods of 10 and 13 years, respectively. In this case as well, the PI is less than 1, but with tax incentives, the parameter is 0.96, very close to the threshold. Scenario 5, involving PIR and glass wool, appears to be the most cost-effective in terms of NPV, with payback periods of 8 and 12 years, and a PI value of 1.24 when utilising tax incentives.
Scenario 4, which involves installing a 50.40 kWp photovoltaic system, appears to be the most cost-effective, even without tax incentives. It exhibits a positive NPV, a short payback period of 8 and 11 years, respectively, and is the only scenario with a profitability index greater than 1 even without tax incentives (1.12 and 1.50, respectively).
5. Discussion
5.1. Perspectives and Evaluation Related to Potential Scenarios
This research involved an energy audit of an agritourism and agri-spa in the Viterbo countryside. This article aims to analyse a significant case study of a rural building characterised by very high energy consumption, propose a series of energy-saving measures, and assess the economic feasibility. The workflow followed starts from the data collection of energy service bills and the calibration of the tailored energy model with the outcomes of an operational rating. Subsequently, the energy model was used to evaluate some energy-reduction measures concerning the building envelope and systems regarding life cycle assessment and costing.
Based on studies of farms and accommodation buildings, the key approaches to achieve the NZEB (nearly zero energy building) status can typically be classified into two broad categories: reducing energy consumption through passive design strategies and lowering operational energy by implementing energy-efficient technological systems. In accordance with findings from other studies [
55,
56,
57], as operational-phase energy consumption increases, it becomes a key aspect to take action by installing renewable energy sources and efficient systems to partially or entirely offset energy consumption during the usage phase.
The analysis shows the feasibility of the renovation interventions, particularly those concerning the adoption of cheap insulation materials and advanced thermal systems such as air-to-water heat pumps and photovoltaic systems. In order to ensure an acceptable payback period, the economic analysis through NPV allows the selection of the most cost-effective interventions among those proposed. Among the cases analysed, the scenario with the least environmental impact is the one using wood fibre for the insulation of the building envelope. However, this scenario is the one that consumes more internal surface area, requiring greater thicknesses for the same thermal transmittance; the adoption of aerogel panels is a valid solution in terms of energy efficiency and the saving of interior surface area, but the costs are still too high, and this suggests that use should only be reserved in certain circumstances. The adoption of PIR and glass wool panels and air-to-water heat pumps associated with the photovoltaic system is the most affordable and gives the most benefits in terms of reducing energy consumption; the overall environmental impacts are slightly higher than with wood fibre, and the internal surface consumption is similar to that of aerogel as an insulation material, due to the very low thermal conductivity value of polyurethane. In accordance with numerous studies in the literature [
58,
59,
60], the scenario involving the installation of photovoltaic panels appears cost-effective, with payback periods approximately equal to or less than 10 years, despite inflation.
5.2. The Reasons for Protection and Those for Sustainability
The presented results can be valuable support and reference for analyses of other similar rural buildings characterised by very high energy consumption. However, this framework, abstractly analysed for the research purposes pursued, must find a particular coherence within the legal framework of the discipline governed by the Code of Cultural Heritage, which pertains to the specific area.
Undertaking an energy upgrade of buildings situated within an already outlined planning framework necessitates a comprehensive reconsideration of the traditional tools used in energy auditing cases as implemented in less privileged urban contexts. This re-evaluation aims to reconcile the necessary enhancement and preservation efforts with the need to reduce energy costs. It seeks to pursue actions within a unified framework of interventions to ensure the environmental matrix of places and constructed structures. In light of an initial and unavoidable analytical phase of the status quo, selecting improvement interventions that align with ministerial, regional, and municipal directives primarily focused on preserving collective assets becomes essential.
The energy-related issue associated with the transformation of rural buildings into agricultural spas, to be effectively addressed in urban planning practice, thus requires a refinement of the investigative tools hitherto employed. This necessitates evaluating the landscape value of the heritage beforehand concerning its typological significance. This initial assessment immediately defines the admissible and unfeasible interventions, recognising the importance of landscape protection, irrespective of the transformative action’s multiple interests—entrepreneurial, economic, or purely architectural. This evaluation is necessary regardless of the intervention’s coherence with the typological characteristics of the structure and established retrofitting practices for densely urbanised contexts, which often receive less attention from preservation systems that predominantly concern almost all agricultural landscapes. Therefore, it becomes crucial to prioritise reflections on the territorial entirety and the context of rural construction. The enforcement of the Code of Cultural Heritage and Landscape, as per Legislative Decree No. 42 of 22 January 2004, and subsequent amendments, marked a semantic transformation in the landscape concept. This shift occurred following the cultural modification subsequent to the ratification of the European Landscape Convention, as per Law No. 14 of 9 January 2006. The intrinsic legal nature of landscape protection significantly altered the polysemic perspective that interdisciplinary debates and the scientific literature have long nourished, relocating the subject within urban planning, falling under concurrent competencies between the state and regions due to the reformed Title V of the Italian Constitution.
The European Convention aimed to elevate the recognition of landscape value throughout the territory, substantiating a substantive convergence between landscape and context. Meanwhile, by reiterating the mandatory nature of landscape planning within regional assemblies, state regulations stipulated that landscape plan elaboration should occur in agreements between the Ministry and regions, particularly concerning the so-called landscape assets, which become integral and substantive components of Territorial Landscape Plans.
However, this obligatory nature conflicts with theoretical practices inherent in retrofitting activities, where the installation authorisation of certain materials is hindered, even when abstractly meeting energy-upgrading interests. For instance, although the implementation of aerogel may be economically inefficient, its insulating thickness might insignificantly alter the original building’s dimensions from a landscape perspective. Similarly, photovoltaic integration, while essential to reduce substantial operational costs for the agri-spa, might face considerable disapproval from heritage authorities due to insurmountable regulatory obstacles imposed by Territorial Plans and declarations of significant public interest, as described on the site, extending to local authorities’ site suitability statements.
6. Conclusions
The application of “reverse engineering” practices, aiming to align an architectural structure initially conceived through established compositional processes with current regulatory objectives regarding comfort and energy efficiency, appears challenging. Hence, it seems pertinent to advocate for a paradigm shift in building transformations that consider sustainability objectives within a dynamic and procedural framework. Leveraging the exact interpretative moment of the “work and environment” relationships inherent in energy audits, the proposal is to provide “deductive” solutions through a sequence of choices and modifications broadly impacting the entire design process. This operative mode implies translating the contextually explored conditions into specific design directions to meet human needs and identify control aspects and project transformations, whether quantitative or qualitative. This new understanding modifies the logical process towards building realisation, potentially uncovering the influence of environmental and energy aspects resulting from theories, methods, and practices operating at all design stages [
61].
The examined case study represents a distinctive element in the field of agricultural engineering. While livestock buildings, in general, have been extensively studied in the scientific literature, the recently transformed agri-spa properties appear as entirely new elements for the referenced discipline, given the functional innovation introduced to agritourism only recently. Although this assessment must be considered specific to the particular case, the results may be useful for evaluating interventions in other urban or agricultural settings characterised by similar functions or energy-intensive equipment.
The analysis presented in this paper started with measuring the actual energy consumption of the rural complex. Through the proposed methodology, which integrates an energy audit, life cycle assessment, and life cycle cost, a range of energy-saving measures was evaluated in order to establish the most effective for this typology of the case study. Due to the very high energy consumption resulting from energy-intensive equipment within the complex, measures involving the installation or replacement of systems have proven to be more effective than passive insulation measures. In particular, the integration of LCA analysis has highlighted how the impacts resulting from the choice among various categories of insulation materials are marginal in comparison to the equal benefit they generate in terms of reducing energy consumption. This result would not have emerged from the standard energy audit procedure. Furthermore, this result suggests that the choice of insulation material can be made primarily considering economic feasibility, assessed in terms of the investment payback period, and specific architectural requirements that necessitate reduced thicknesses for insulation materials. This has highlighted how the scenario involving installing a photovoltaic system appropriately sized for energy consumption and the one considering polyurethane insulation and the replacement of the gas boiler with an efficient heat pump system are the ones that best combine these aspects. They maximise the reduction in environmental impacts with lower costs while minimising the thicknesses of internal insulation materials.
This article, moreover, serve as evidence of a shifted sensitivity towards transformations affecting the built heritage and, consequently, the tangible and intangible culture. These practices can influence design choices from the conceptual phase of architectural composition. Despite acknowledging numerous exceptions, it is observed that measures aimed at reducing energy consumption through insulation or adding specific system solutions can lead to the loss of the original architectural significance, both in terms of landscape and perception. Nonetheless, they might represent a harmonious integration between adopted solutions and the project. Integrating these architectural aspects will need to be considered concerning new possibilities for study and research.


