Article

Experimental Study on Gas-Liquid Two-Phase Stratified Flow at High Pressure in a Horizontal Pipe

1
School of Thermal Engineering, Shandong Jianzhu University, Jinan 250101, China
2
Shandong Technology Innovation Center of Carbon Neutrality, Shandong Jianzhu University, Jinan 250101, China
3
State Key Laboratory of Multiphase Flow in Power Engineering, Xi’an Jiaotong University, Xi’an 710049, China
4
Shaanxi Key Laboratory of New Transportation Energy and Automotive Energy Saving, Chang’an University, Xi’an 710064, China
5
Weihai Haihe Technology Co., Ltd., Weihai 264200, China
*
Author to whom correspondence should be addressed.
Energies 2024, 17(5), 1056; https://doi.org/10.3390/en17051056
Submission received: 30 December 2023 / Revised: 29 January 2024 / Accepted: 29 January 2024 / Published: 23 February 2024
(This article belongs to the Section J1: Heat and Mass Transfer)

Abstract

:
This study investigates wave-stratified flow in a horizontal pipe at high pressure, and flow characteristics are obtained, such as flow pattern map, liquid film thickness, and pressure drop. Compared with a flow pattern map of a gas-liquid two-phase flow carried out at atmosphere, stratified flow zone is depressed with increasing system pressure and the critical gas superficial velocity decreases for smooth-wave-stratified flow transition, while the critical liquid superficial velocity increases for stratified-intermittent transition. On one hand, the compressed air results in an increase in momentum transfer between gas and liquid phases, which accounts for the smaller gas superficial velocity that is encountered in both smooth-wave and stratified-annular flow transition at higher pressure. One the other hand, it slows down the liquid below the crest, and it makes the interface wave crest unstable and split for the vortex shedding behind the wave crest, which accounts for flow regime transition in gas-liquid two-phase flows in pipelines. As a result, stratified-intermittent flow transition is depressed and delayed. The pressure influence on the liquid film profile is analyzed, and relationships between film thickness and dimensionless numbers are studied, such as liquid Weber number and gas Weber number. Friction factors on different interfaces at high pressure are studied, and new empirical formulas are deduced.

1. Introduction

A gas-liquid two-phase flow is a common phenomenon in oil pipelines [1,2,3], especially for the oil transportation under oil wells and offshore. Fluid flow patterns change with increasing of the mass flow rates of both phases, and different flow regimes are defined successively, such as smooth-stratified flow, wave-stratified flow, annular flow, mist flow, slug flow, plug flow, and bubble flow. With 1178 flow pattern observations of air-water two-phase flows in horizontal pipes, Mandhane et al. [1] proposed a classical flow pattern map that plotted, in coordinate system, both air and liquid superficial velocities.
Taitel et al. [4] theoretically studied the gas-liquid two-phase flow characteristics, such as pressure drop and void fraction, and a two-fluid model was applied to deduce flow regime transition models; well prediction was achieved, and a critical liquid superficial velocity of about 0.15 m/s was obtained to accomplish stratified-plug flow transition. However, they still encountered considerable error in precious prediction for flow pattern transition; the smooth-wave-stratified flow transition boundary that was determined by the theoretical model was much steeper than the experimental data, and a much smaller critical gas superficial velocity was obtained. Instead, wave-annular flow transition was delayed, and a greater critical gas superficial velocity was needed to achieve it.
It was tested that fluid physical properties influence flow regime transition. Agrawal et al. [5] studied a gas-liquid two-phase flow in a flow loop and incorporated a 30.8 m length of 25.8 mm I.D. acrylic tube. Light oil with density of 814.7 kg/m3 was used to simulate a gas-oil two-phase flow in a pipeline, and different flow regimes were obtained. Compared with air-water two-phase flow, critical liquid superficial velocity was about 0.074 m/s for stratified-intermittent flow transition, which was only half of that illustrated in the Mandhane flow pattern map.
Sulfur hexafluoride (SF6) is a kind of inorganic compound with molecular weight of 146 that is much greater than air, and its density is five times more than that of air at atmosphere. Johnson [6] used compressed SF6 as gas phase, and tested the stratified flow with roll waves in a 25 m long horizontal pipe of 10 cm I.D. Finally, a dimensionless liquid level was obtained with both experimental and theoretical methods, and the proposed model achieved better performance than OLGA [7]. However, there was still considerable error of about −10~+40%, which represented that the precise calculation of shear stress was too difficult to finish. Rodrigues et al. [8,9] carried out gas-oil two-phase flow experiments in a long pipeline with inclination of 2°, where the compressed air was used instead of atmosphere air and the pressure varied from 1.48 MPa to 2.86 MPa. For the fluids flow with the same gas and liquid superficial velocities, stratified flow transferred to annular flow with increasing pressure from 200 psig to 400 psig. Further analysis of the dimensionless liquid level was made for the fluid flow cases mentioned above, and its value increased with increasing pressure. Comparison was made for different models; the TUFFP’S unified model overestimated the gas superficial velocity of stratified-annular flow transition and underestimated the stratified-pseudo/slug flow transition with liquid superficial velocity greater than 0.03 m/s [7]. Instead, OLGA version 7.3.5 conservatively predicted the transition from stratified to pseudo-slug flow, which was much lower than that predicted by the TUFFP’S unified model. The onset model for the pseudo-slug flow transition proposed by Fan et al. [10] was compared with experimental data, and a good prediction could be proved. In conclusion, the ratio between air and water densities is significantly impacted by pressure. For the compressed air at 2 MPa, the ratio is about 18 times greater than that at atmosphere. As a result, it is much more appropriate to use compressed air rather than air at atmosphere to simulate the gas-liquid two-phase flow in submarine pipelines, where both fluid flow characteristics could be approximately simulated.
Generally, fluid flow can be described with governing equations composed of the continuity equation and Navier-Stokes (N-S) equations, and then the numerical solution can be obtained by solving the equations mentioned above [11]. Even though mass and energy transfer between fluids can be neglected for most conditions, it is difficult for pipe flow direct numerical simulation (DNS). As a result, velocity gradients of both phases are simplified and formulated as functions of shear stresses working on the fluid-wall interface between the two phases. Then, the two-fluid model was deduced to solve the gas-liquid two-phase flow, which was much quicker than DNS to deal with the problem. For the gas-liquid two-phase flow in inclined and complex pipes, gravity and pipeline structure play an important role in accumulating liquid to obtain the slug growth. Fundamentally, it was proven by experiments that the flow regime stability was impacted by fluid properties. Theoretically, Kelvin-Helmholtz (KH) instability, entrainment-deposition [12], and secondary flow [13] reveal the interface wave propagation, which is accompanied by flow regime transition. Considering most models mentioned above are deduced or correlated with the two-fluid model, accurate friction factor equations for the two-fluid model are necessary to give the precise calculation of shear stress, which accounts for the errors in flow pattern transition predictions.
For the fluid flow over the plate, shear stress can be deduced and modeled as a function of local velocity and Reynolds number. Agrawal et al. [5] and Taitel and Dukler [14] experimentally studied air-wall and liquid-wall friction factors in laminar and turbulent flow, and different empirical correlations were deduced as functions of local Reynolds numbers. Kowalski [15] tested freon gas/air-water two-phase flow in a 3.67 m long and 50.8 mm I.D. horizontal Lexan pipe; liquid fraction increased and evolved to accomplish air-wall friction factor prediction, and a new pattern for interfacial friction factor was studied with gas Reynolds number involved. Further investigation of air-water two-phase flow in different pipelines was carried out by Spedding and Hand [16] with pipes ranging from 25.15 mm to 93.5 mm, and a new formula for liquid-wall friction factor was deduced with liquid fraction and liquid superficial Reynolds number. Haland [17] studied the influence of relative roughness K/D on the calculation of friction factors, and accurate explicit formulas were obtained, where K was the equivalent sand roughness while D represented the diameter of the pipe. Kim and Kim [18] conducted fluid flow in a circle tube at atmospheric pressure, where air and low viscosity mineral oil were used as working fluids, and a flow pattern map was obtained finally. For the reason that oil lubricated the inner wall of tube, relative roughness K/D was neglected and a simple formula for fluid-wall friction factor was deduced.
Generally, waves in stratified flow can be treated as 2D waves and 3D waves, which are usually impacted by gas superficial velocity. Basing on this theory, Spedding and Hand [16] proposed a formula for the interfacial friction factor, where a critical gas superficial velocity of 6 m/s was adapted. However, different from shear stresses working on the inner wall of tubes, it is much more complicated to describe interfacial shear stress. Ayati et al. [19] studied the velocity field in an air-water two-phase flow using PIV technology, and found that vortex shedding was captured downstream of the wave crest, which explained the strong disturbance of air velocity over the interface. As a result, it is difficult to deduce and formulate interfacial friction factor with fluids Reynolds numbers simply. Mascarenhas et al. [20] theoretically investigated the shear stress on wavy interface by solving unsteady N-S equations, and the shear stress was found to vary periodically for different phase angles along the wave. Belt et al. [21] proved the relationship between the interfacial friction factor and film thickness, which was more easily obtainable than the function of film profile. Ju et al. [22,23,24] and Aliyu et al. [25] studied the relations between the average film thickness and dimensionless numbers, such as the liquid Weber number WeL, modified gas Weber number WeG and liquid viscosity number Nμf, and a much more accurate formula was derived for interfacial friction factor, with error ranging by ±20%. The equations deduced in the studies above are illustrated in Table 1.
In the present study, an experimental program was carried out to simulate the gas-liquid two-phase flow in a horizontal pipe at system pressure up to 2 MPa, which was much closer to the pressure on the offshore seabed. Wide flow rate ranges of both phases were used to simulate different flow regimes. In addition, friction factors were analyzed, and different parameters were studied to give new empirical formulas for precise prediction.

2. Theoretical Basis of Experiments

Neglecting energy transfer, a two-fluid model can be simplified to be a composition of mass and momentum conservation equations, which provides the basis for hydrodynamic calculation of gas-liquid two-phase flow and is much more convenient than N-S equations. In the two-fluid model, fluid particle velocity gradients are formulated as functions of shear stresses working on different interfaces. As shown in Figure 1, gas density is much smaller than that of the liquid phase, and it usually occupies the upper space in the tube. The equations are written as follows [6]:
t ρ k α k + x ρ k α k V k = 0   k = G ,   L
t ρ G α G V G + x ρ G α G V G 2 = α G P G x τ G S G A τ i S i A
t ρ L α L V L + x ρ L α L V L 2 = α L P L x τ L S L A + τ i S i A
The shear stresses are computed by conventional correlations:
τ k = 1 2 ρ k f k V k 2 ,   k = G ,   L
τ i = 1 2 ρ G f i V G V L V G V L
Similar to the shear stress in the laminar boundary layer over the plate, the fluid-wall friction factor in a pipe flow is usually modeled as a function of local Reynolds number, which is correlated with fluid effective hydraulic diameter and bulk velocity at the site.
R e k = ρ k V k D k μ k   k = G ,   L
D G = 4 α G A S G + S i ,   D L = 4 α L A S L

3. Experimental Facility

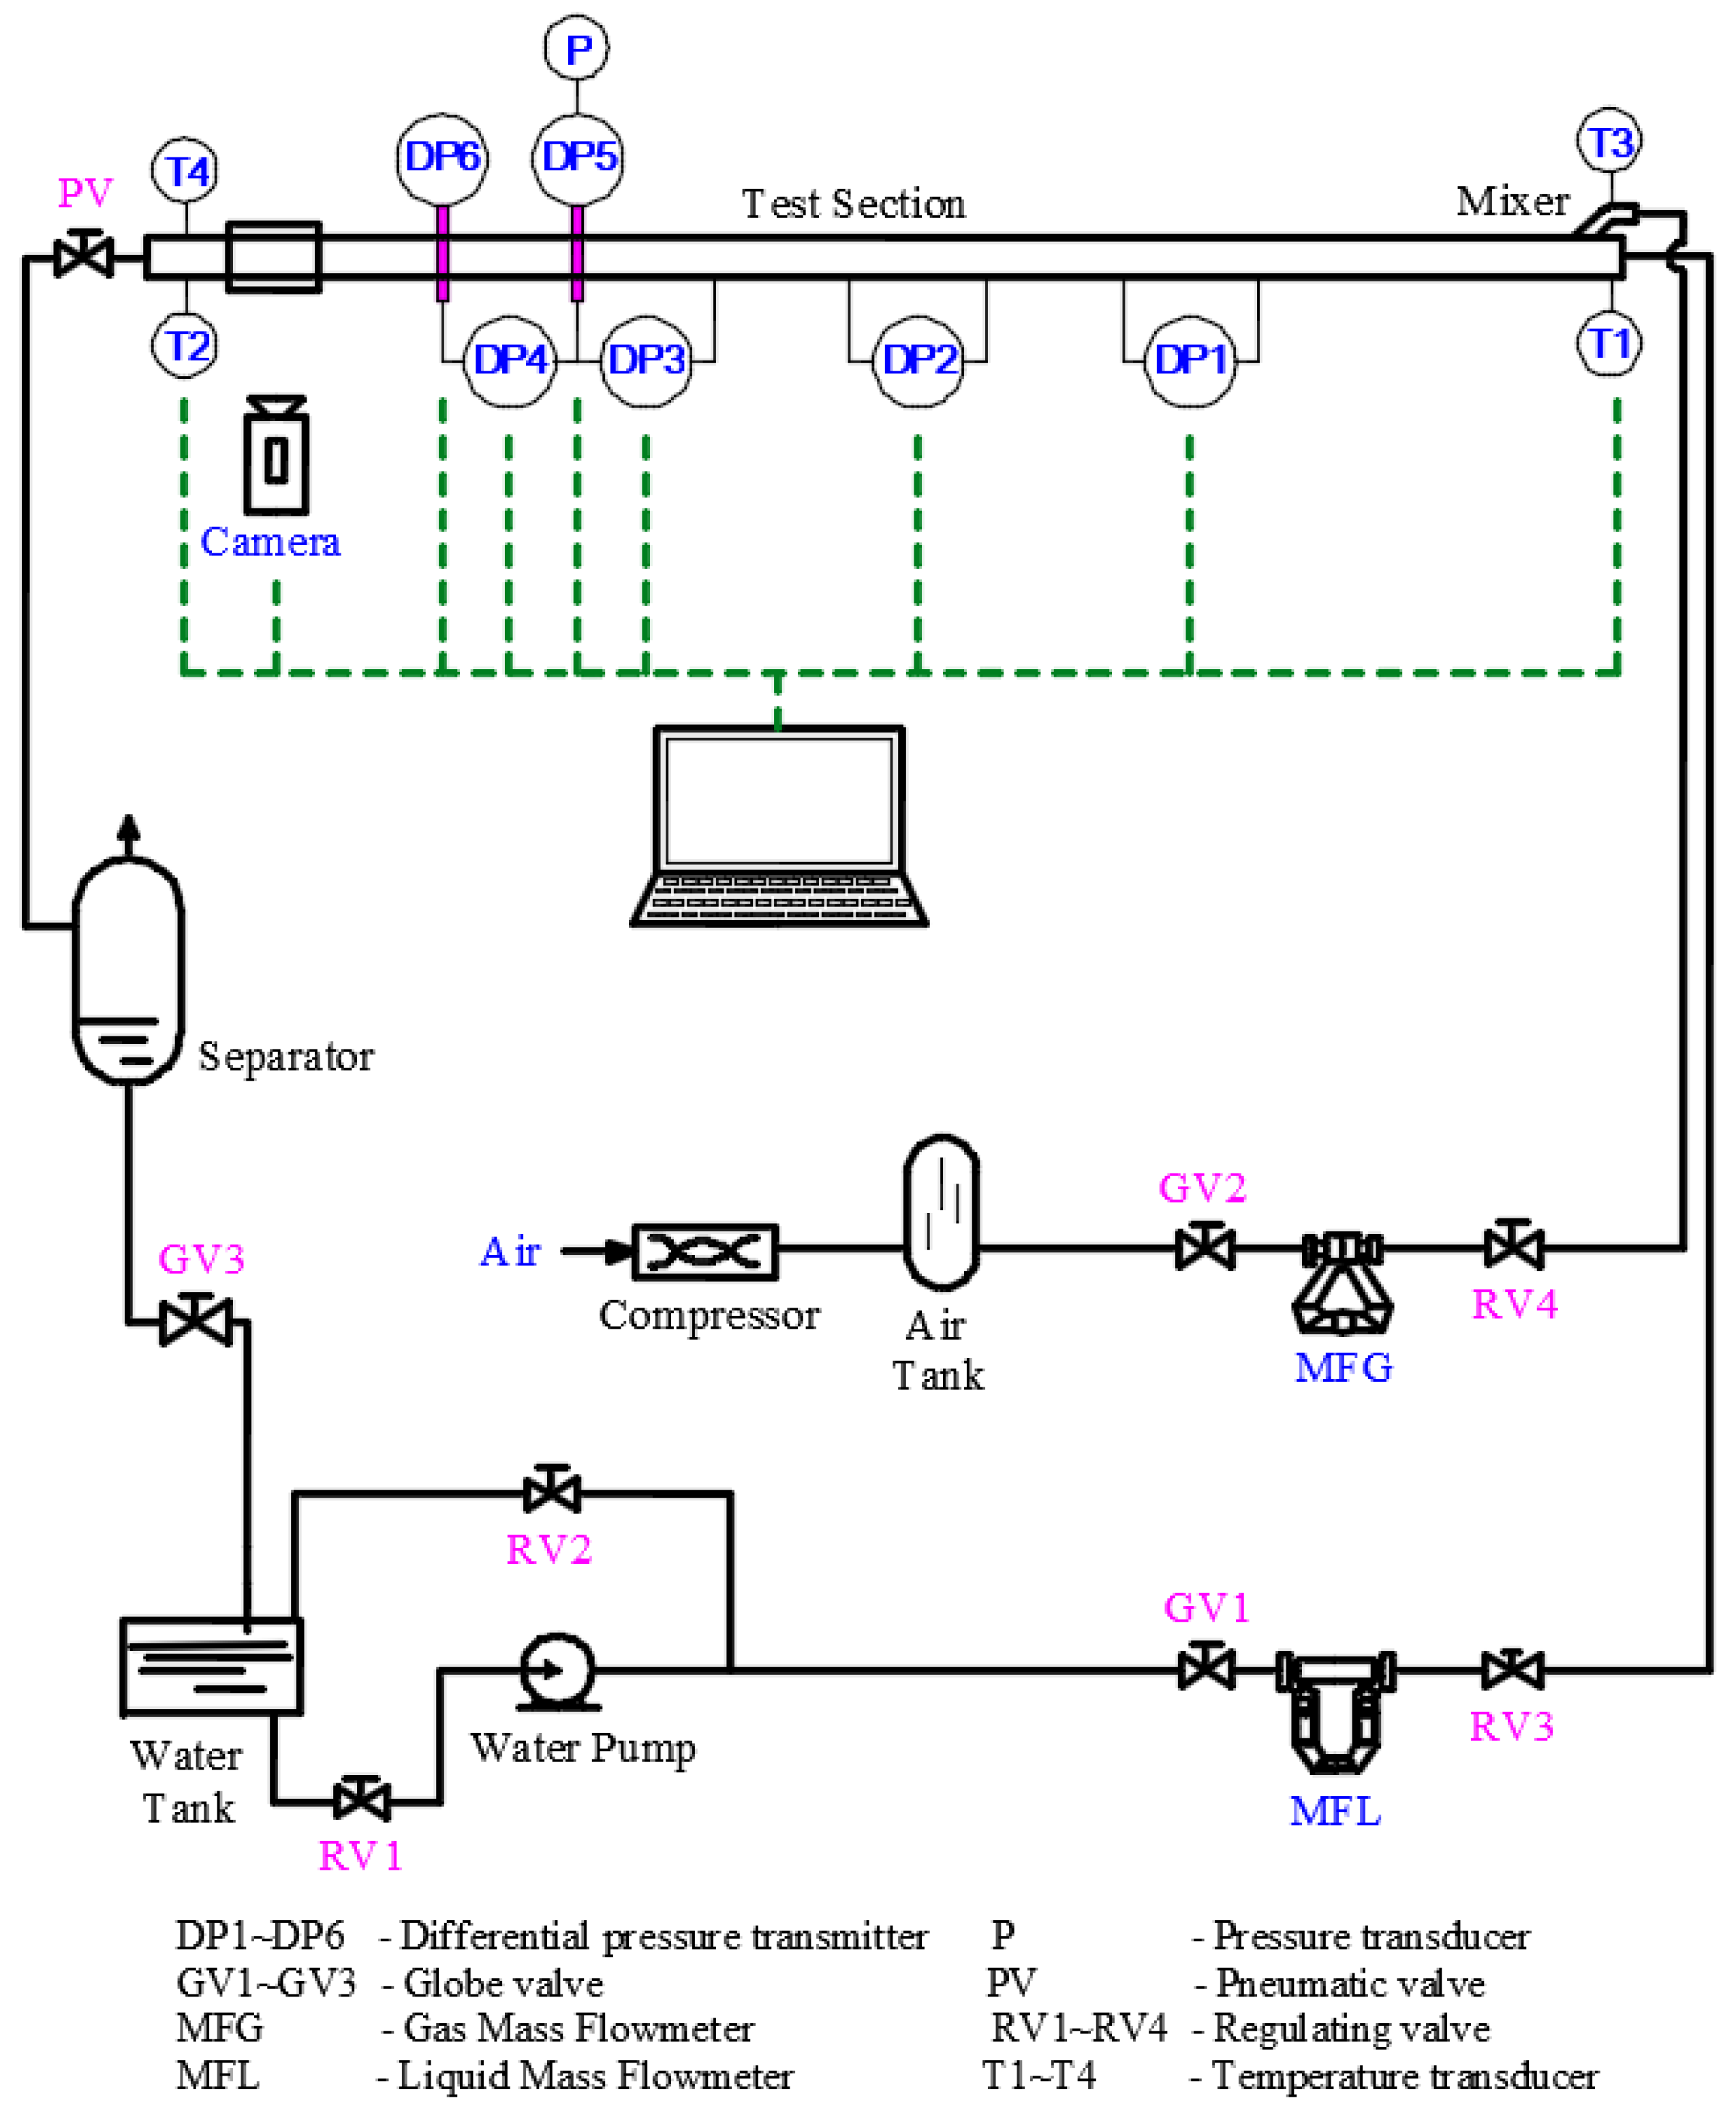
Figure 2 represents the high-pressure gas-liquid two-phase flow test loop used in this study, which was constructed at the State Key Laboratory of Multiphase Flow in Power Engineering (MPFL) in Xi’an Jiaotong University. Experiments were conducted using air and water as working fluids, and different system pressures were achieved. Water stored in the stainless steel water tank was supplied by a high-pressure pump and was mixed with air in the V-shaped mixer. Then, an air-water mixture flowed into the test section, which was 11.6 m long with 50 mm I.D. A polycarbonate tube was used to observe and record the flow regime and interface profile with camera, which was packaged with a rectangular water jacket and connected to the test section with flanges 8.85 m downstream from the mixer. A Nikon D2700 CMOS camera was used to capture the fluid flow figures in experiment. Its maximum resolution was 6000 × 4000 with a video shooting speed of 30 pictures per seconds. The pressure in the test section was adjusted with a pneumatic valve, and its opening was fixed till the pressure became stable, and then the flow parameter measurement would begin ten minutes later. A separator was designed for gas-liquid separation; the separated air was discharged into the atmosphere and the water was returned to the water tank.
The inner walls of both the stainless steel pipe and polycarbonate pipe were smooth, and the roughnesses of different pipes were neglected. Both air and water properties, such as density and viscosity, were determined with pressure and temperature measured with pressure transmitters and temperature transmitters. The first differential pressure transmitter was located at 5.5 m downstream from the test section inlet, and temperatures of fluids were measured on both inlet and outlet sides of the test section. The operating ranges of both fluids and measuring instruments with relative uncertainties are given in Table 2.

4. Results

4.1. Flow Pattern Map

Different flow regimes were obtained, coupled with analysis of interface profile, and both pressure and differential pressure were supplemented to distinguish the flow regime. A flow pattern map at high pressure was sketched, and the pressure influence on the flow regime distribution was analyzed and is illustrated in Figure 3.
As is illustrated in Figure 3, there are significant differences between flow regime distributions at higher pressure. Firstly, the stratified flow zone is depressed while intermittent and annular flow cover much more map percentages; a much smaller critical gas superficial velocity is obtained to achieve stratified-annular flow transition, while a greater critical liquid superficial velocity is obtained to achieve the stratified-intermittent flow transition. Secondly, the interface becomes much more unstable at high pressure, and the value of critical liquid superficial velocity regarding the smooth-wave-stratified flow transition decreases with increasing pressure, which reveals a much greater momentum transfer impacted on the interface. Thirdly, the stratified-intermittent flow transition boundary becomes much flatter, and the low-frequency slug with liquid superficial velocity of about 0.08 m/s at atmosphere causes delays with intensive density gas at high pressure.
Mascarenhas et al. [20] theoretically investigated a gas-liquid two-phase flow in a horizontal channel, and vortex shedding after wave crest was proved with the computational results of that gas flow field over a wavy interface. Compared with a gas-liquid two-phase flow in a horizontal pipe at atmosphere, the gas phase density at high pressure in this study is amplified to be ten times greater than that of air at atmosphere; the vortex shedding after the wave crest becomes much more strong and it accounts for the liquid film splitting, which delays the transition from wave-stratified flow to intermittent flow.

4.2. Pressure Influence on Interface Profile

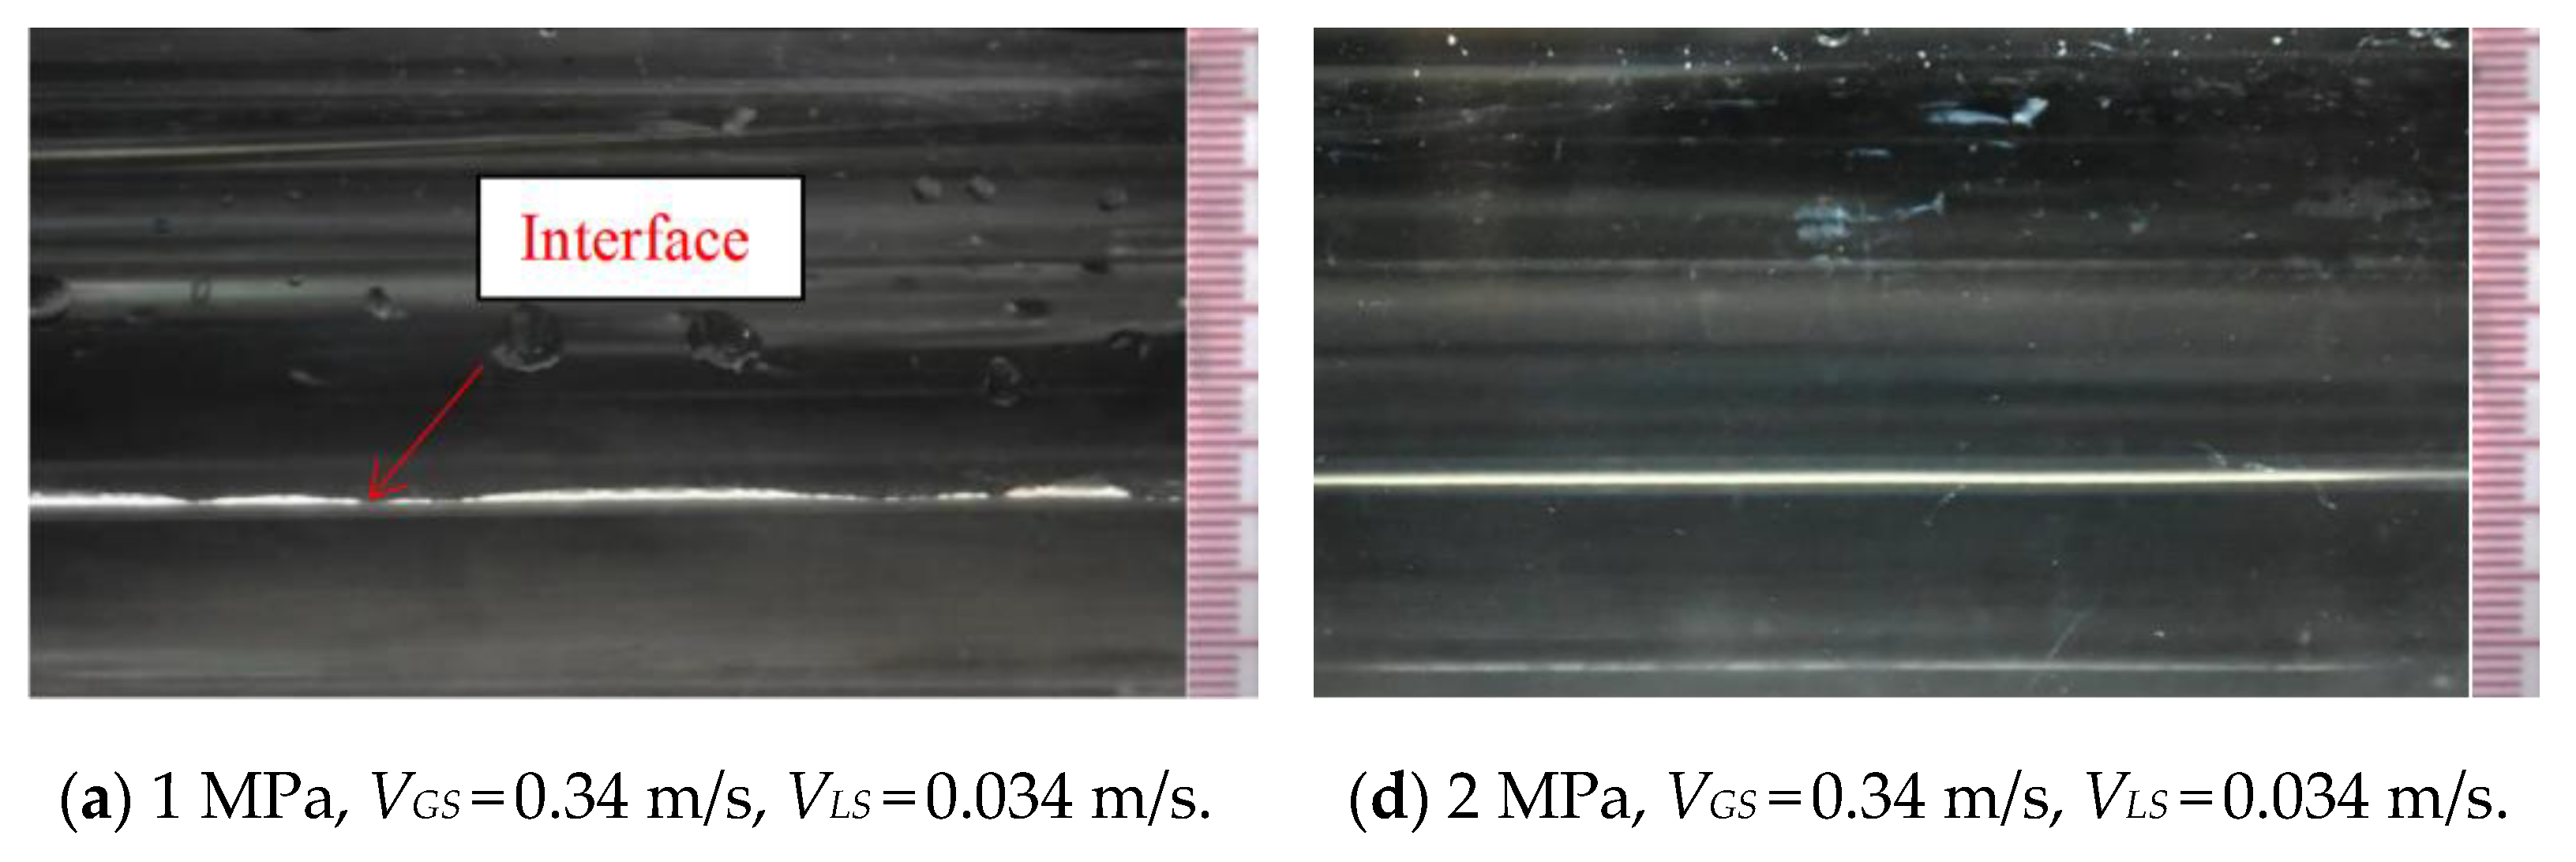
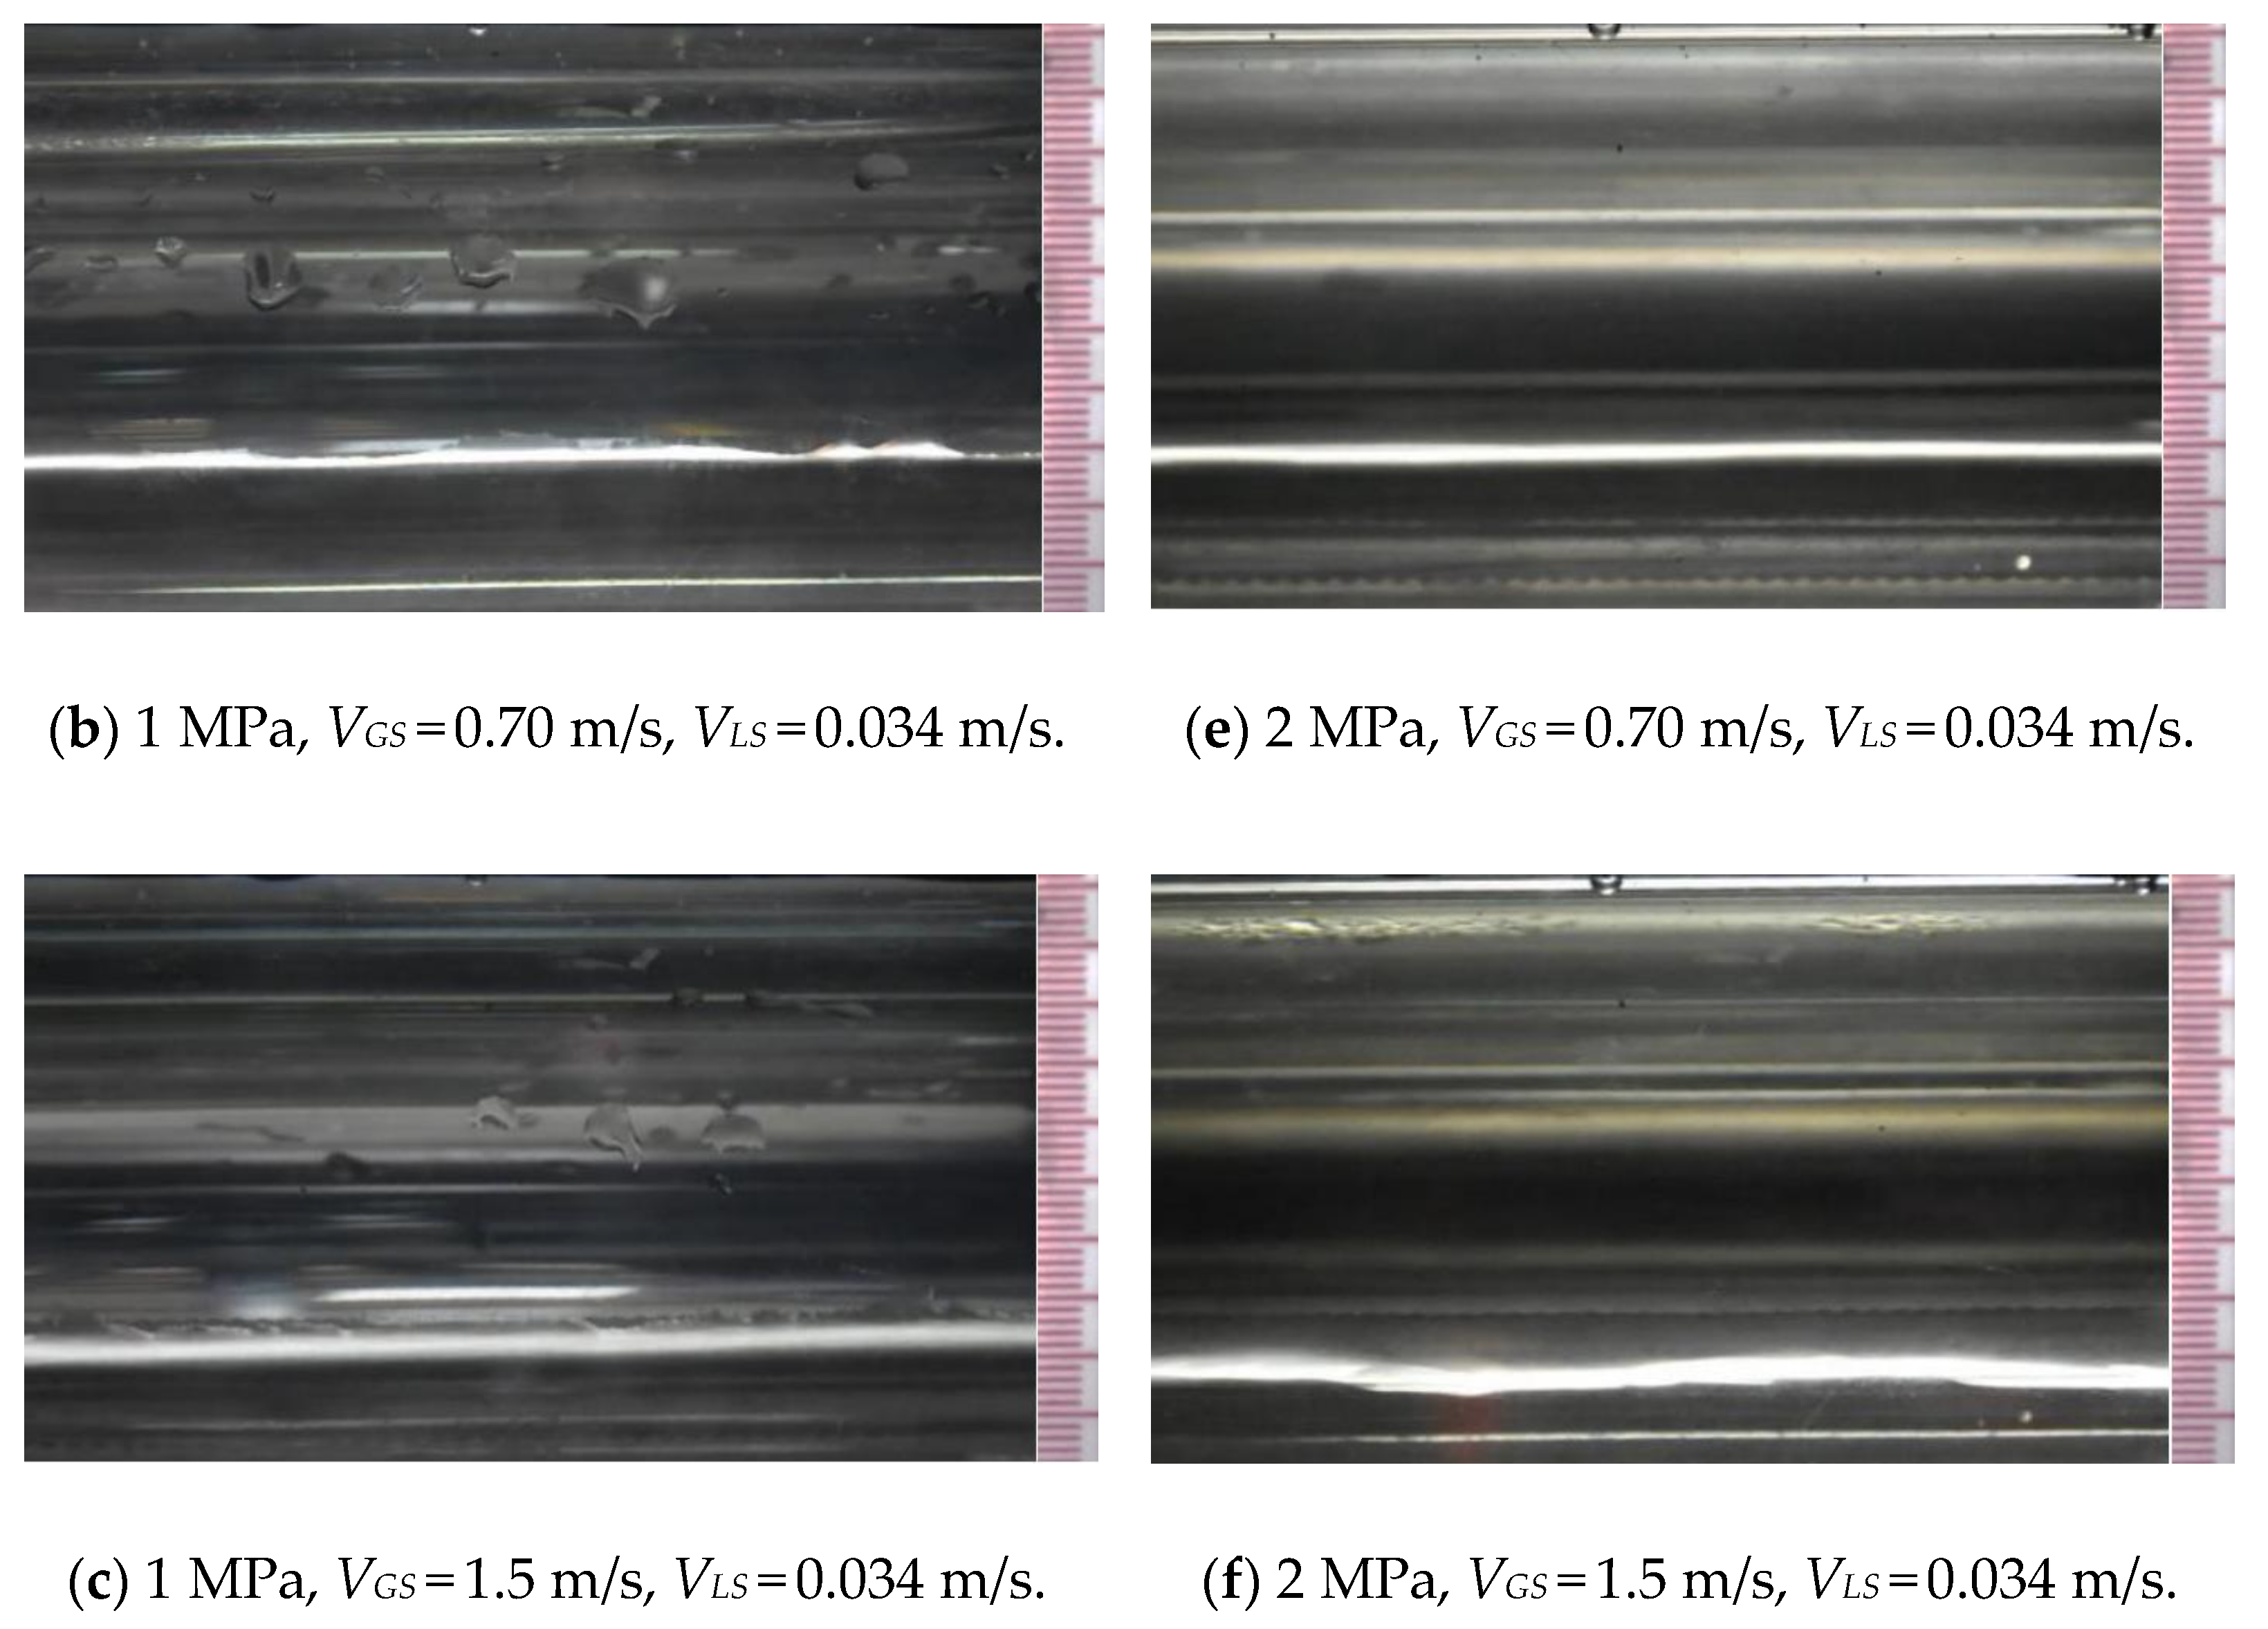
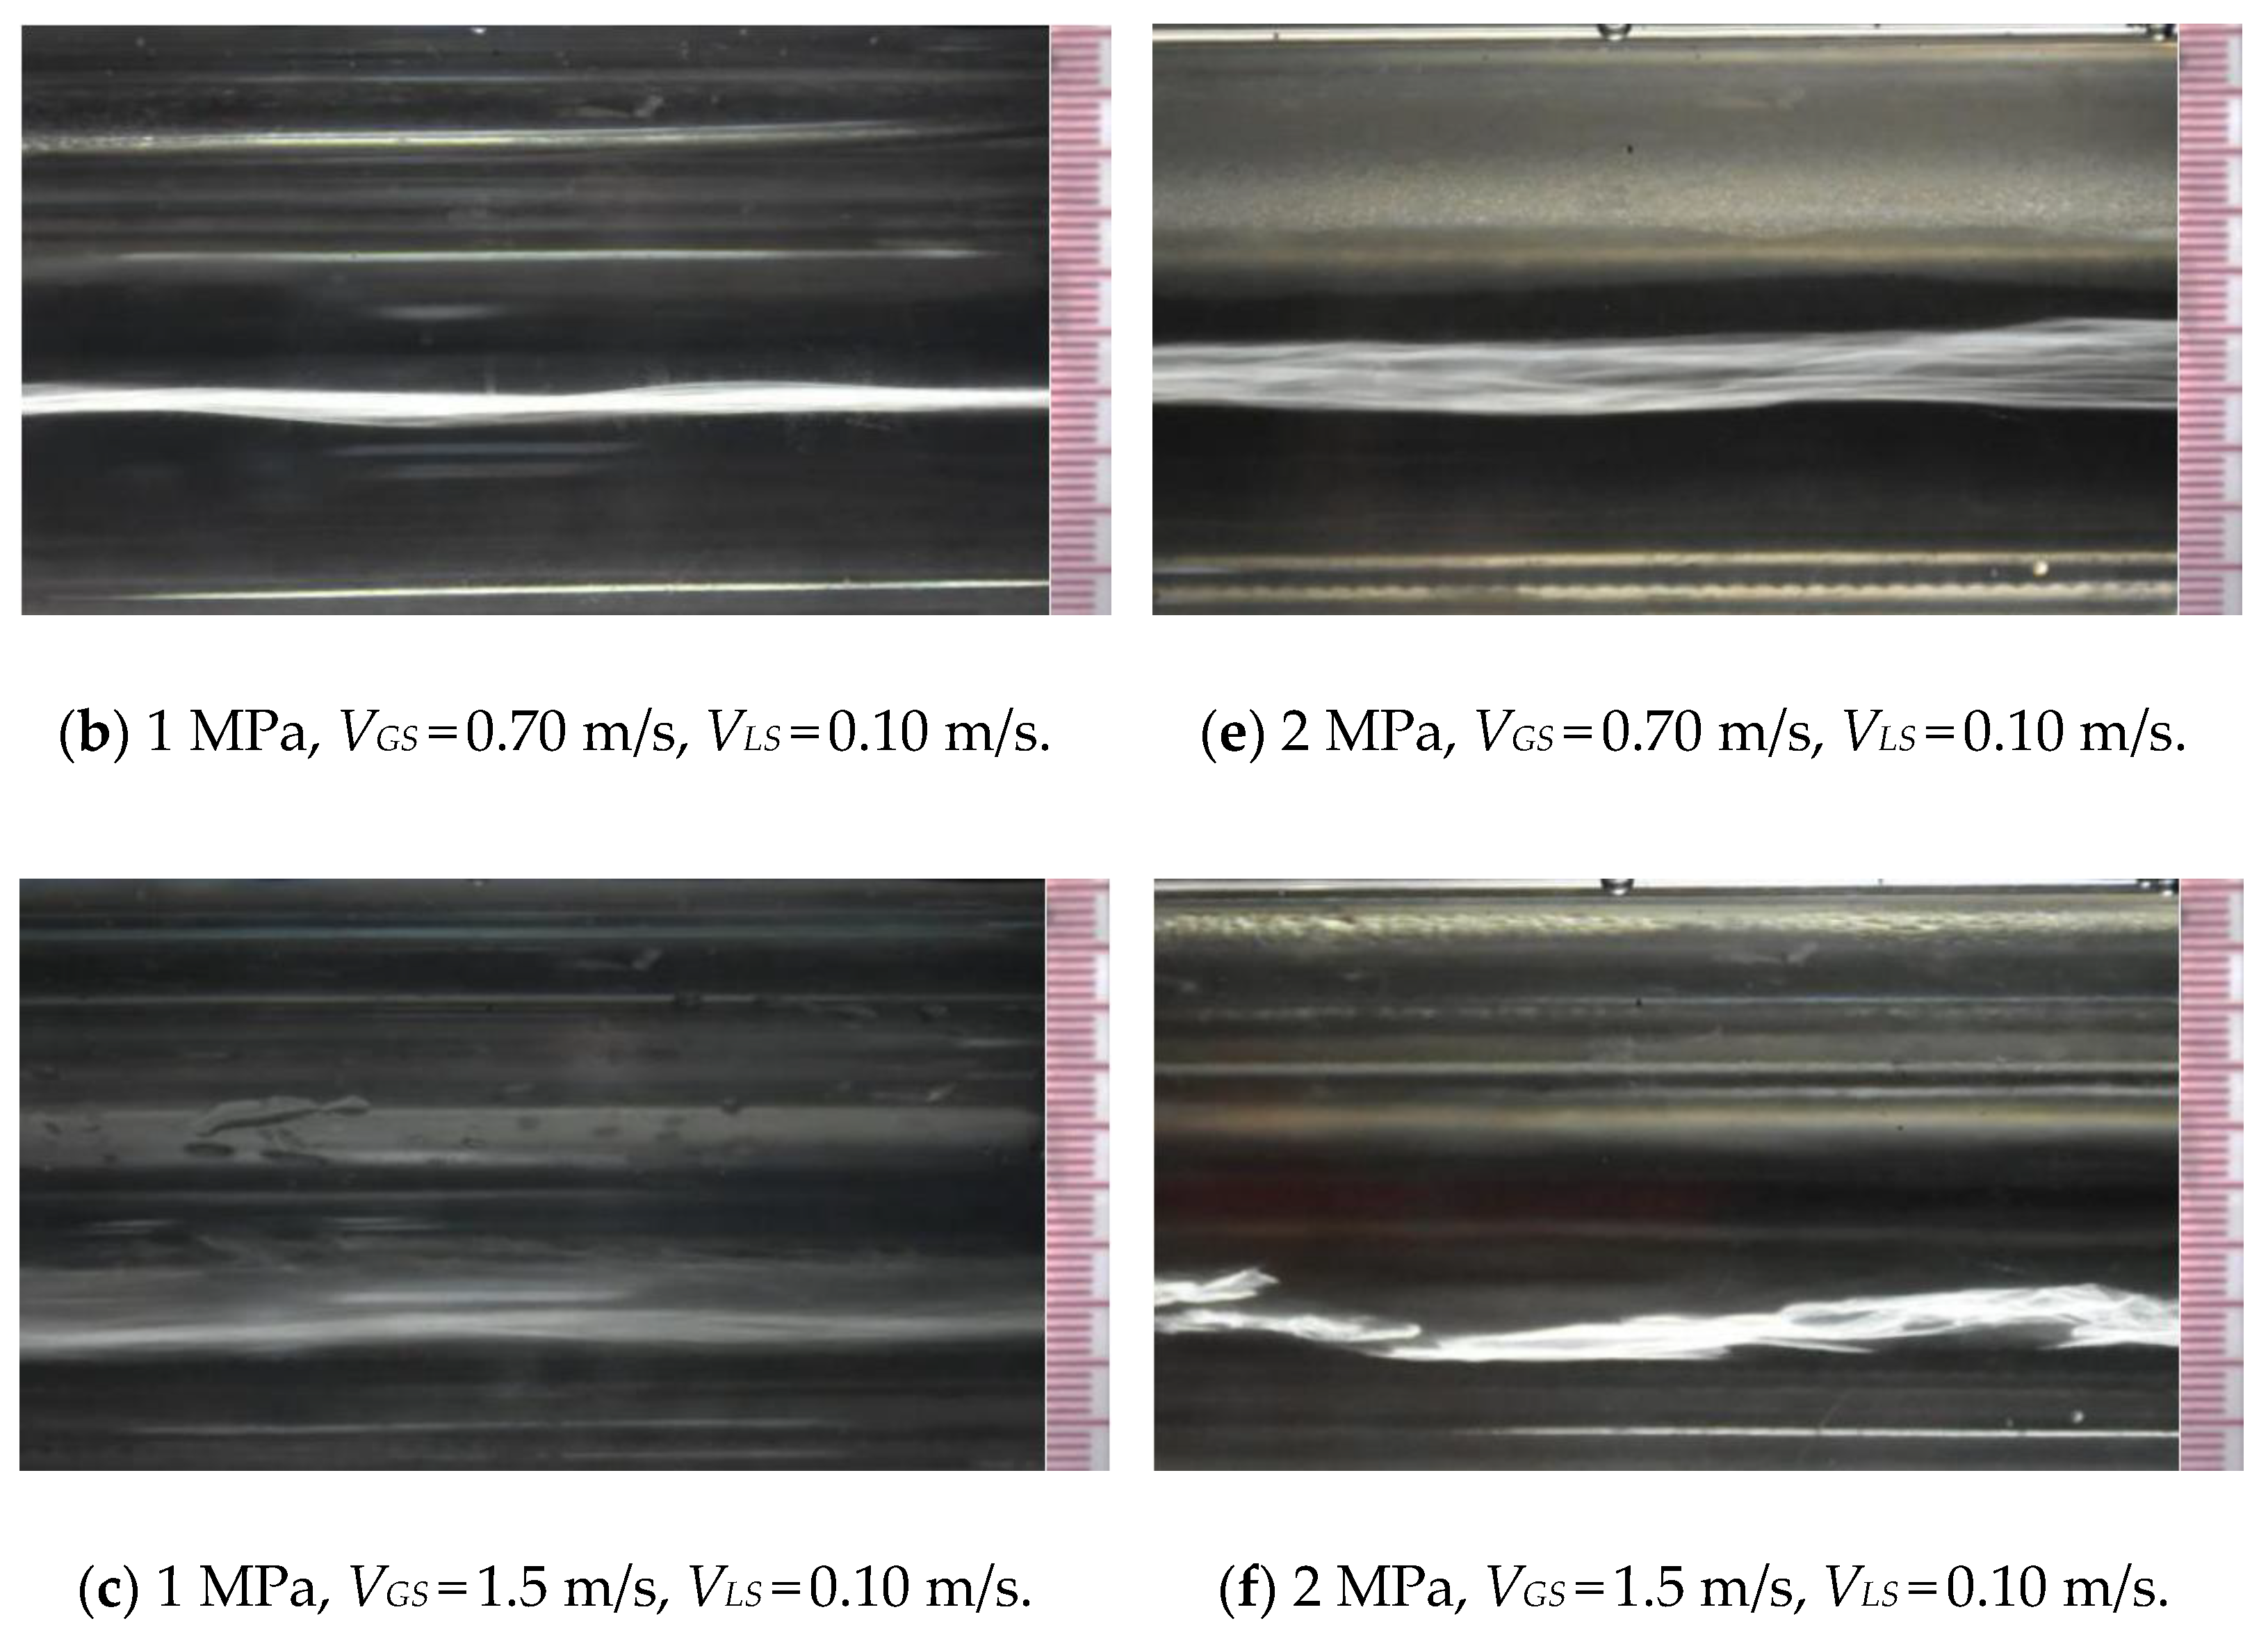
Both fluids’ superficial velocities and pressure influences on the interface profile in stratified flow and different wave profiles were experimentally obtained. As shown in Figure 4, the length of the dividing rule is 5 cm, with master scale of 1 cm, and subscale of 1 mm.
For the flow with gas and liquid superficial velocity of 0.34 m/s and 0.034 m/s, respectively, at 1 MPa pressure, the interface is smooth and flat, which is shown in Figure 4a. When increasing the gas superficial velocity, a small disturbance emerges on the interface, and a small wave with an amplitude of about 0.12 mm could be observed in Figure 4b. A much more visible wave with an amplitude of about 0.20 mm could be found, while gas superficial velocity increased to 1.5 m/s in Figure 4c. As pressure increased to 2 MPa, for the cases with the same gas and liquid superficial velocities, interface waves become much more frequent and wave amplitude are amplified, which are 0.11 mm, 0.33 mm, and 0.63 mm, respectively.
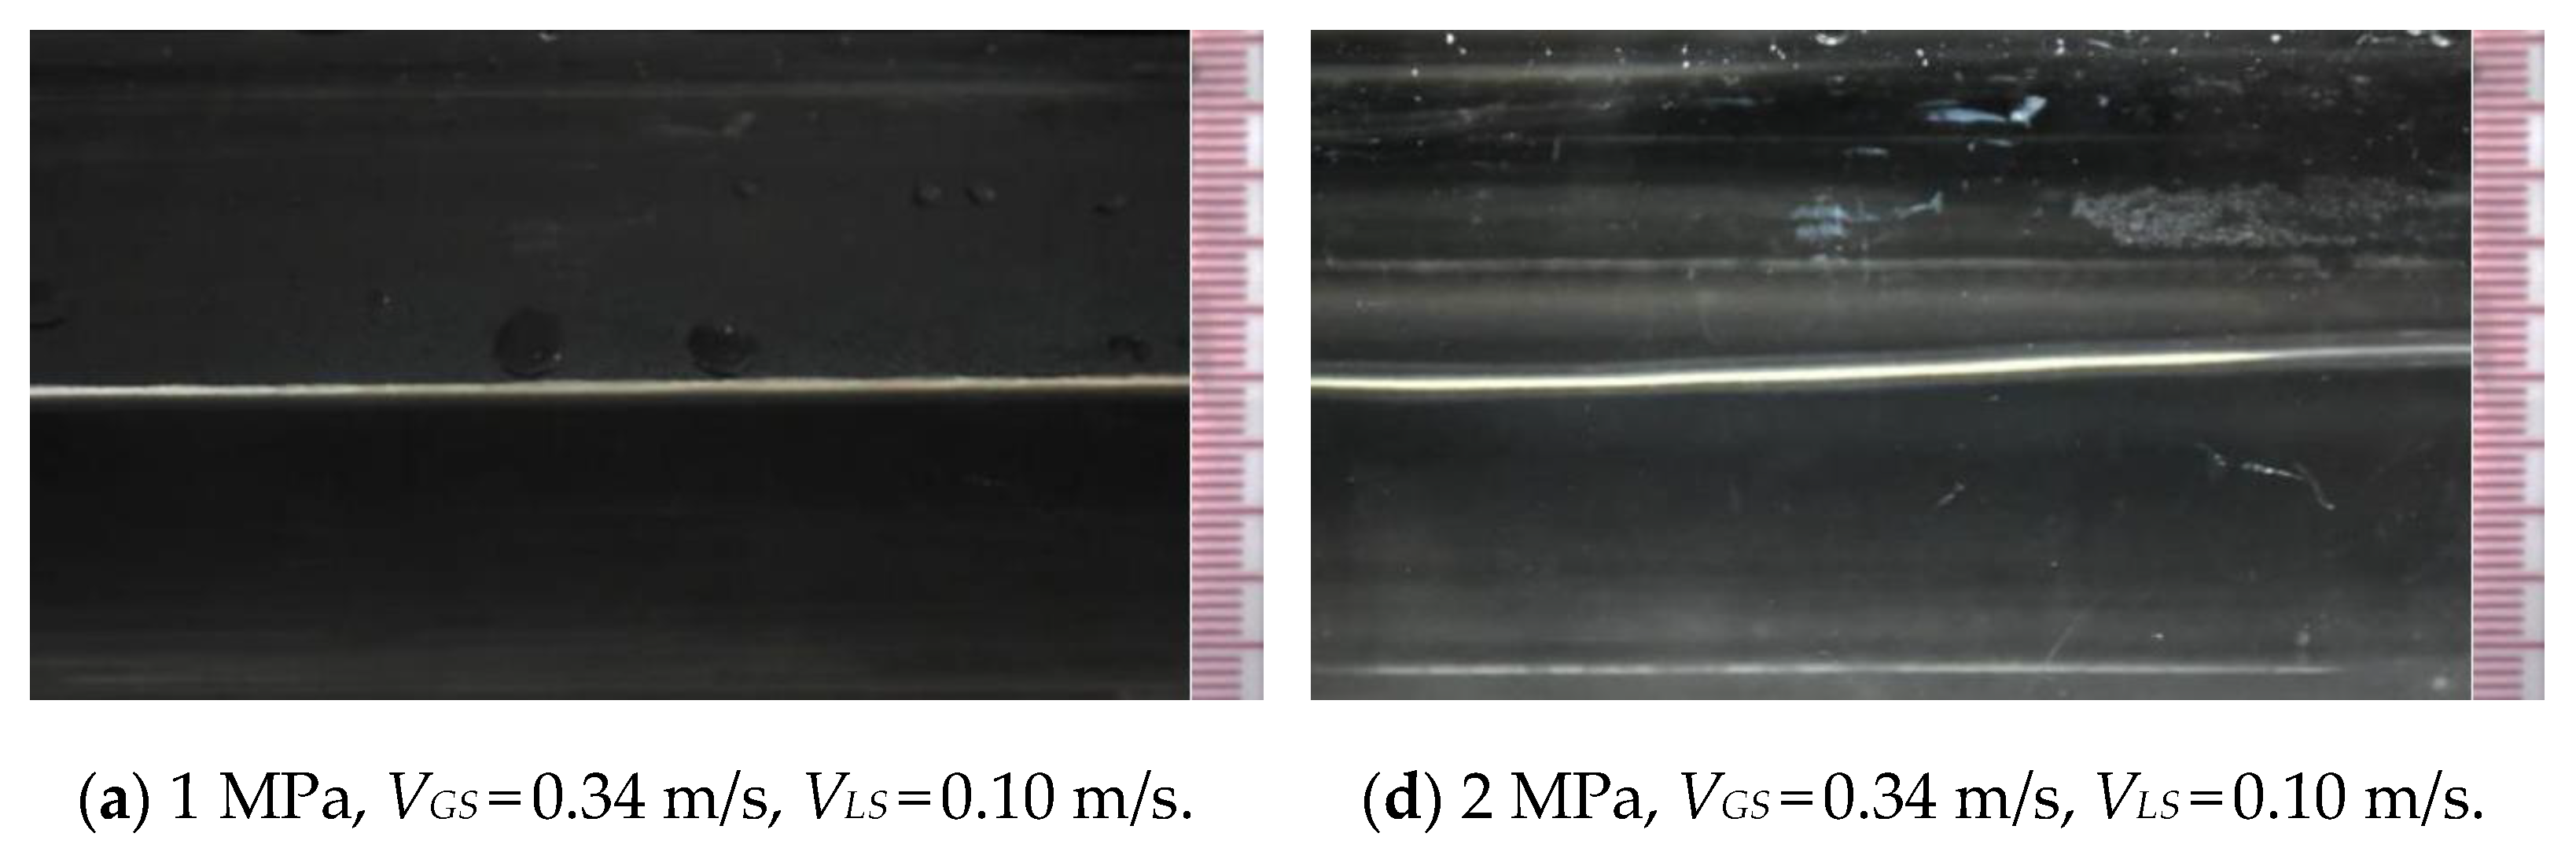
It is positive that pressure has an influence on wave propagation; for the interface wave with small amplitude, both wave amplitude and wave frequency become intensive with pressure increasing from 1 MPa to 2 MPa. For the interface wave with a large amplitude, the influence of pressure on wave profile is much more significant. As is shown in Figure 5a–c, the interface profiles are 2D waves, and their cross-section areas are flat at 1 MPa. With pressure increased to 2 MPa, wave amplitude is intensively magnified, the wave profile in cross-section area becomes curved, and a 3D wave emerges on the interface. For the fluid flow with greater gas superficial velocity of 1.5 m/s, the interface wave becomes much more rough, and circumferential interface wave propagation can be observed.

4.3. Liquid Film Thickness

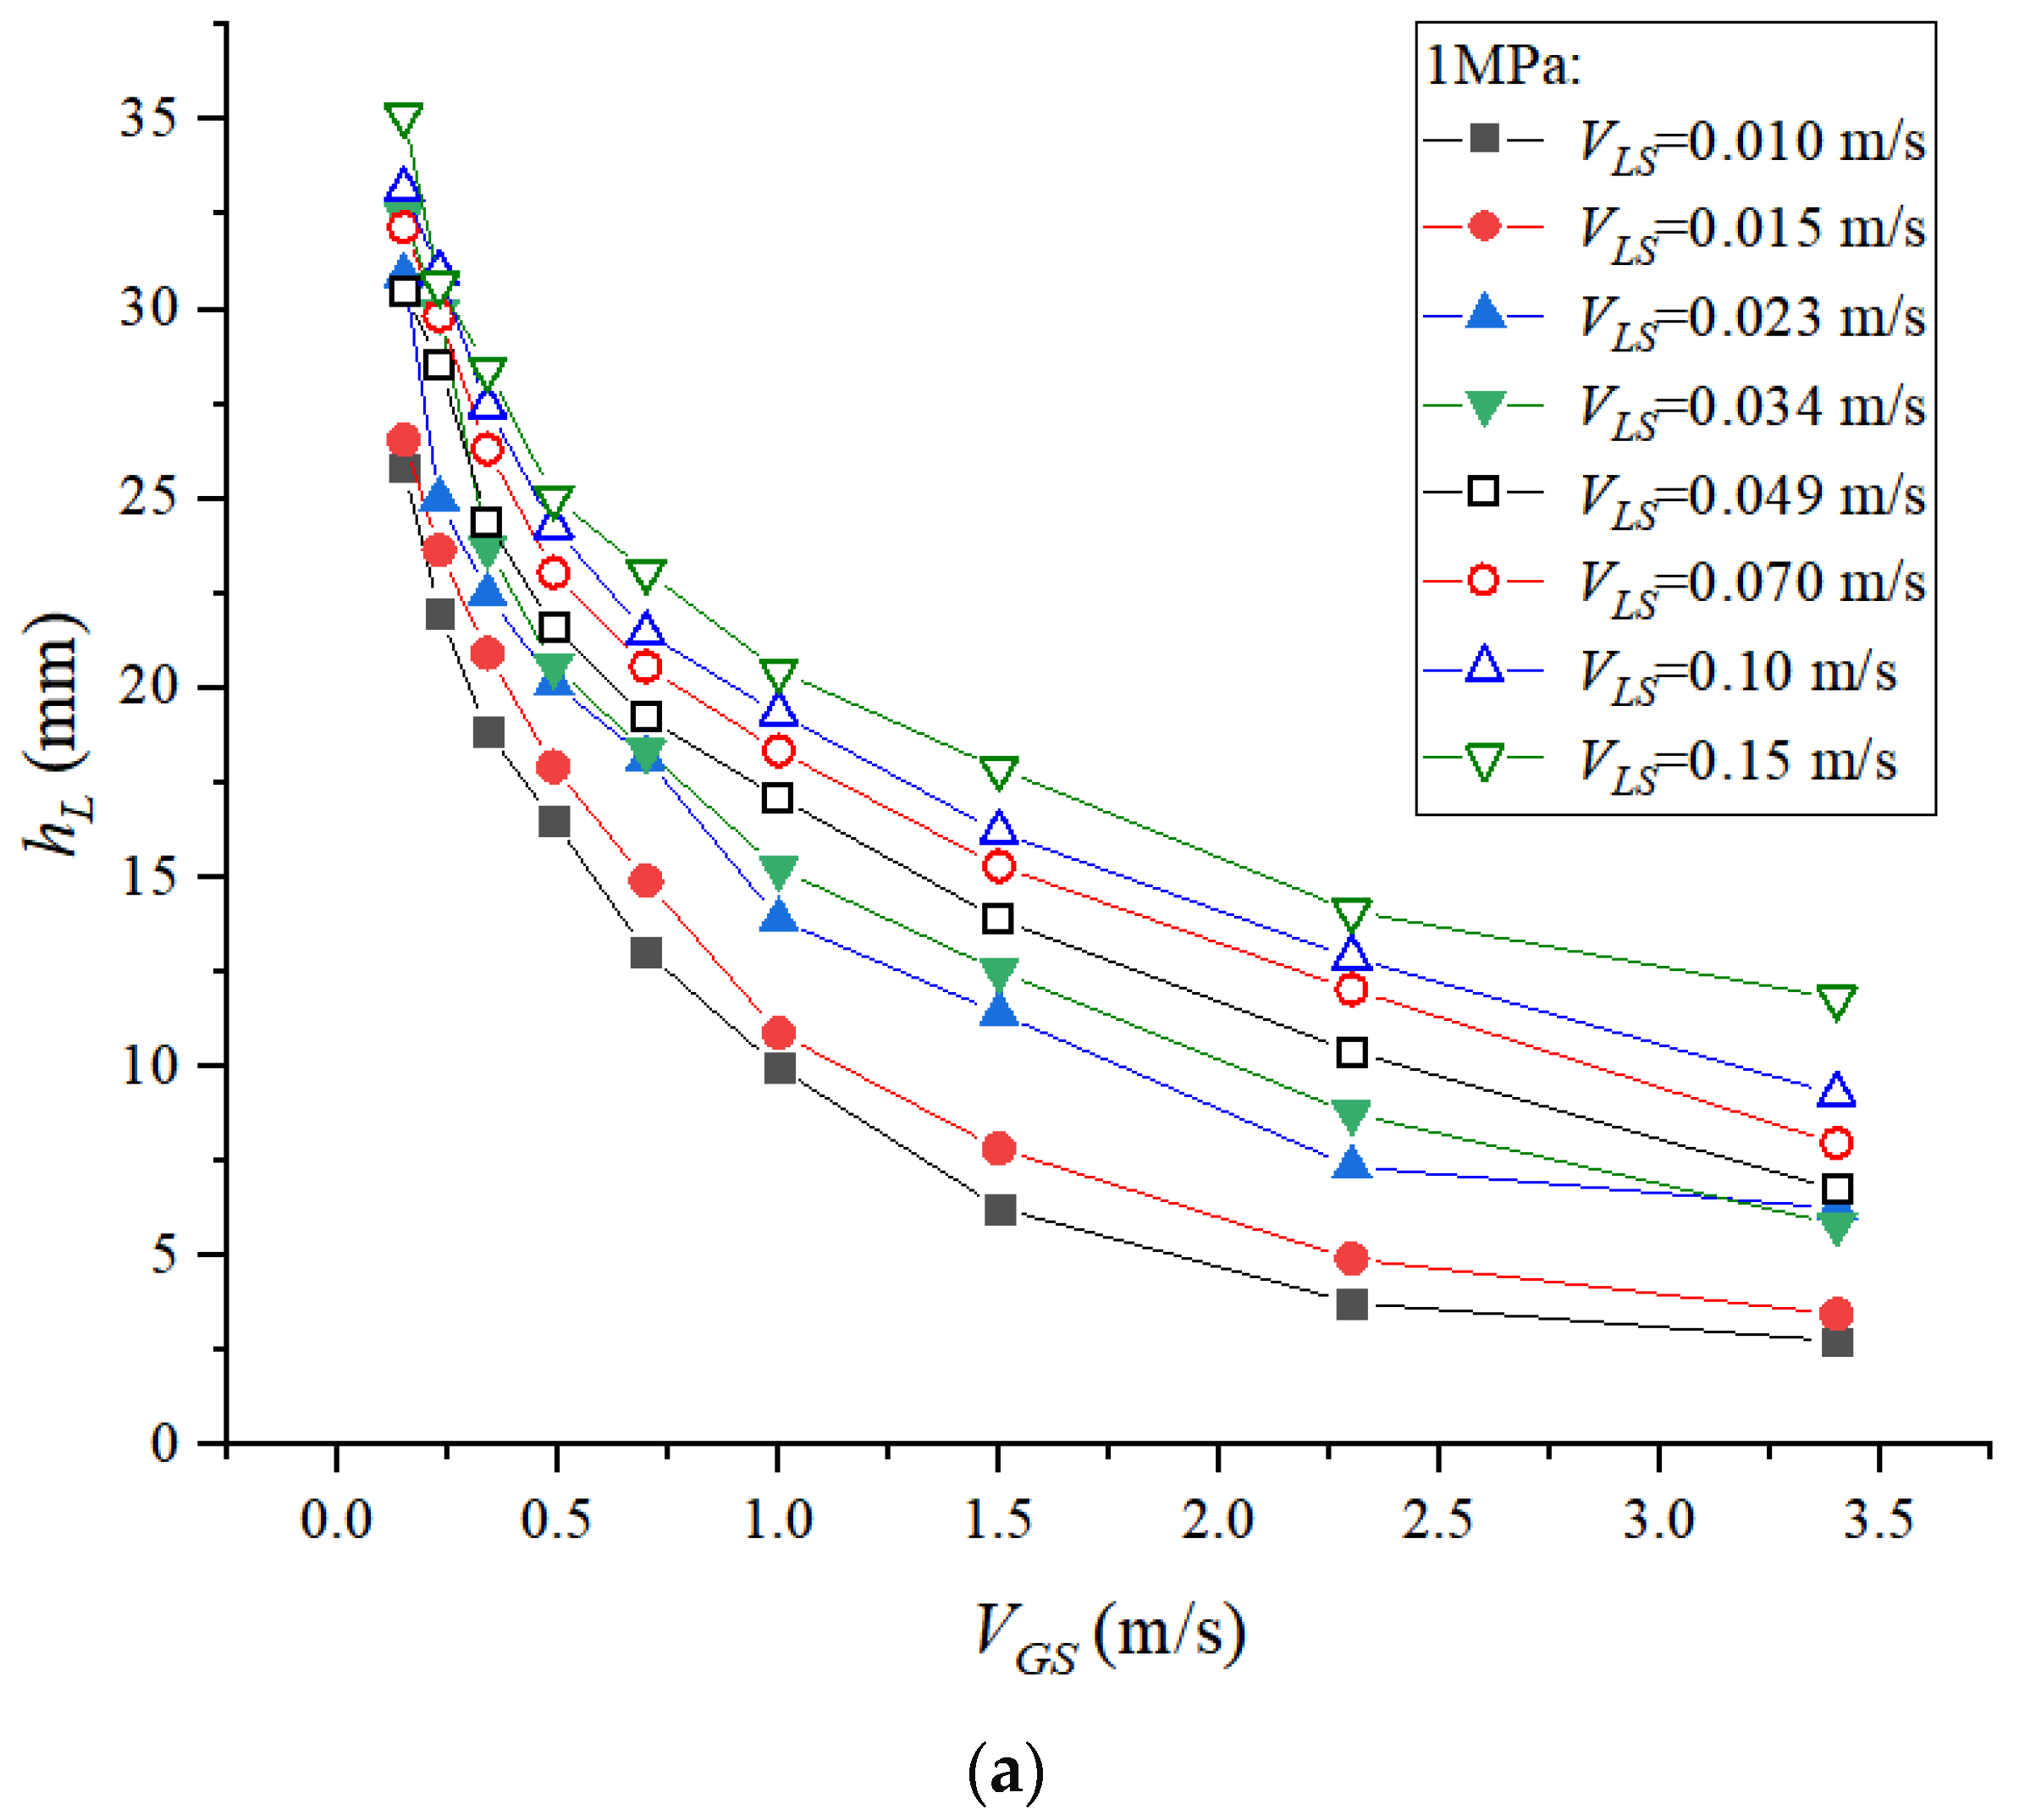
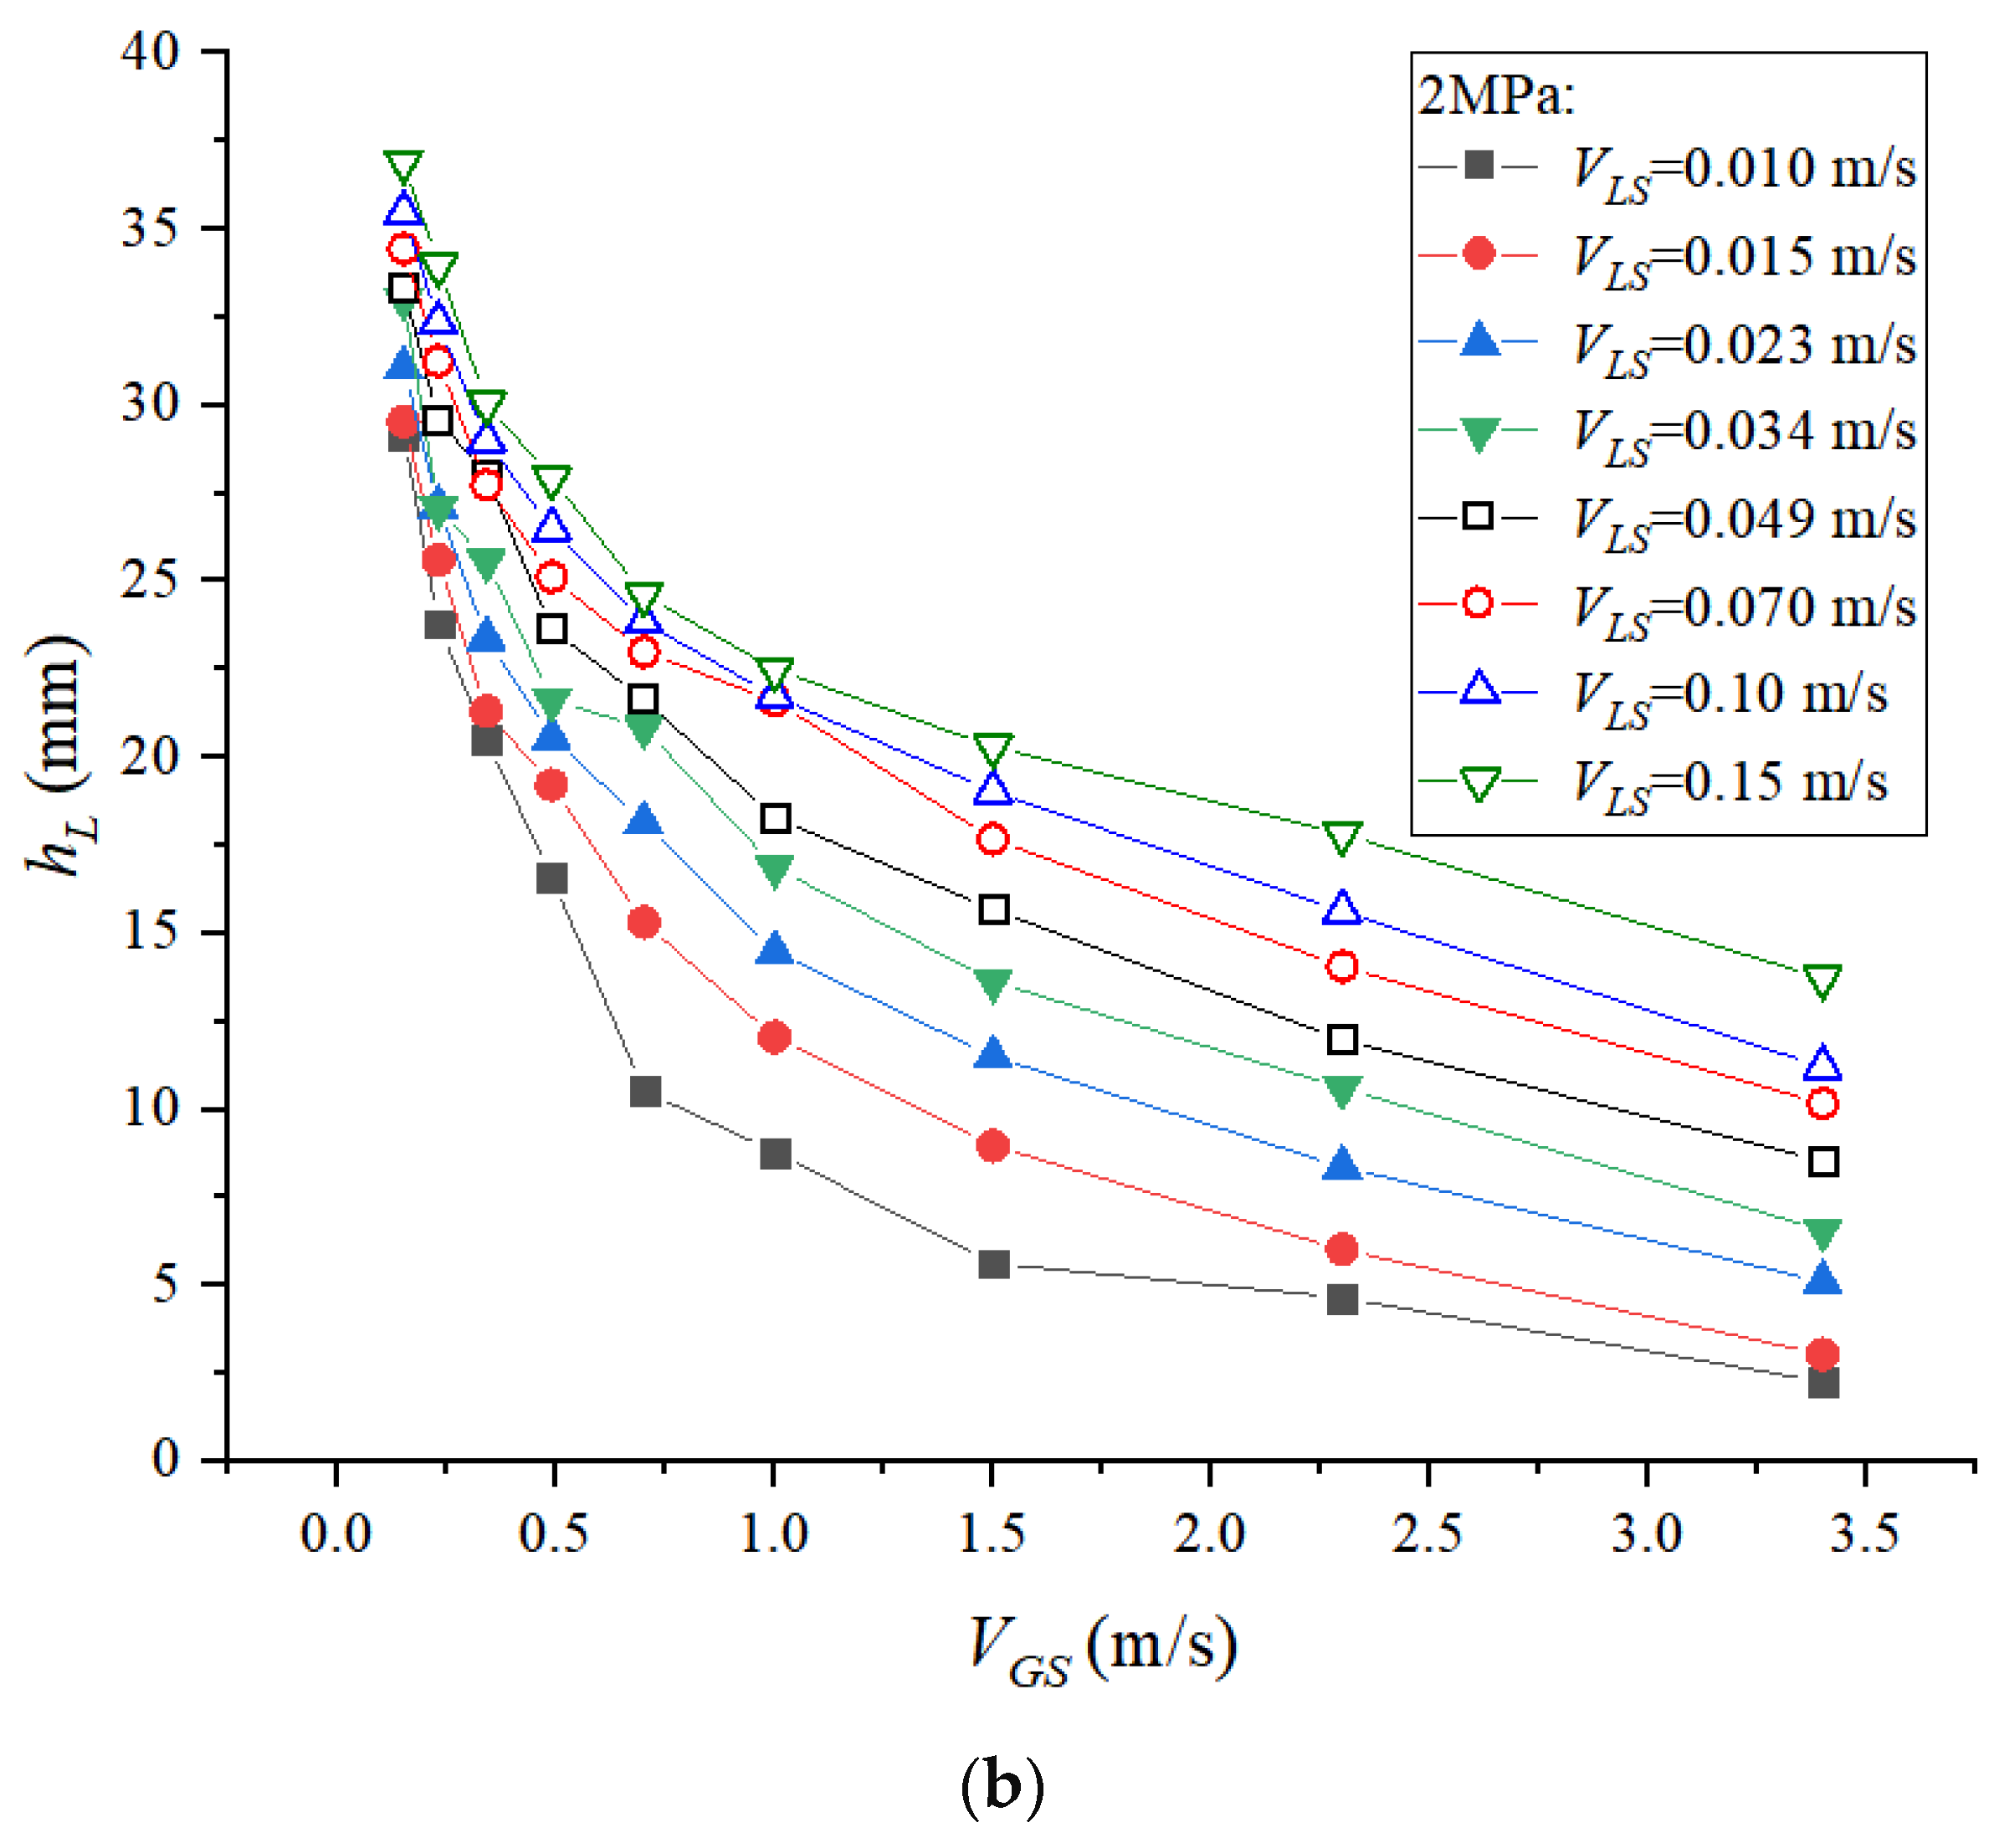
Fluid flow with large ranges of both phases’ superficial velocities were tested, and liquid film thicknesses of stratified flow were obtained accordingly. As shown in Figure 6, liquid film thickness increases with increasing liquid superficial velocity and decreases with increasing gas superficial velocity.
For the stratified flow in a horizontal pipe, it is usually assumed that the interface profile in tube cross-section is flat, which has been verified to be of appropriate accuracy. In this way, it could be deduced from the two-fluid model that the liquid film thickness should be correlated with both phases’ parameters, such as local velocity and viscosity. Considering the difference between the two fluids, the difference in density might also impact the momentum transfer. As a result, both the liquid Weber number and modified gas Weber number [26] are involved, and their influence on film thickness is analyzed accordingly.
W e L = ρ L V L 2 D σ
W e G = ρ G V G 2 D σ ρ L ρ G ρ G 0.25
The Weber number represents the ratio between fluids inertial force and surface tension force; in actuality, momentum transfer between gas and liquid phases might be affected by liquid viscosity and gas flux. As a result, viscosity number NμL and gas Froude number FrG were analyzed, and their influences on liquid film thickness were studied. Both of the two dimensionless numbers are defined in Equation (7).
N μ L = μ L / ρ L σ ρ / g ρ L ρ G
F r G = V G S g D
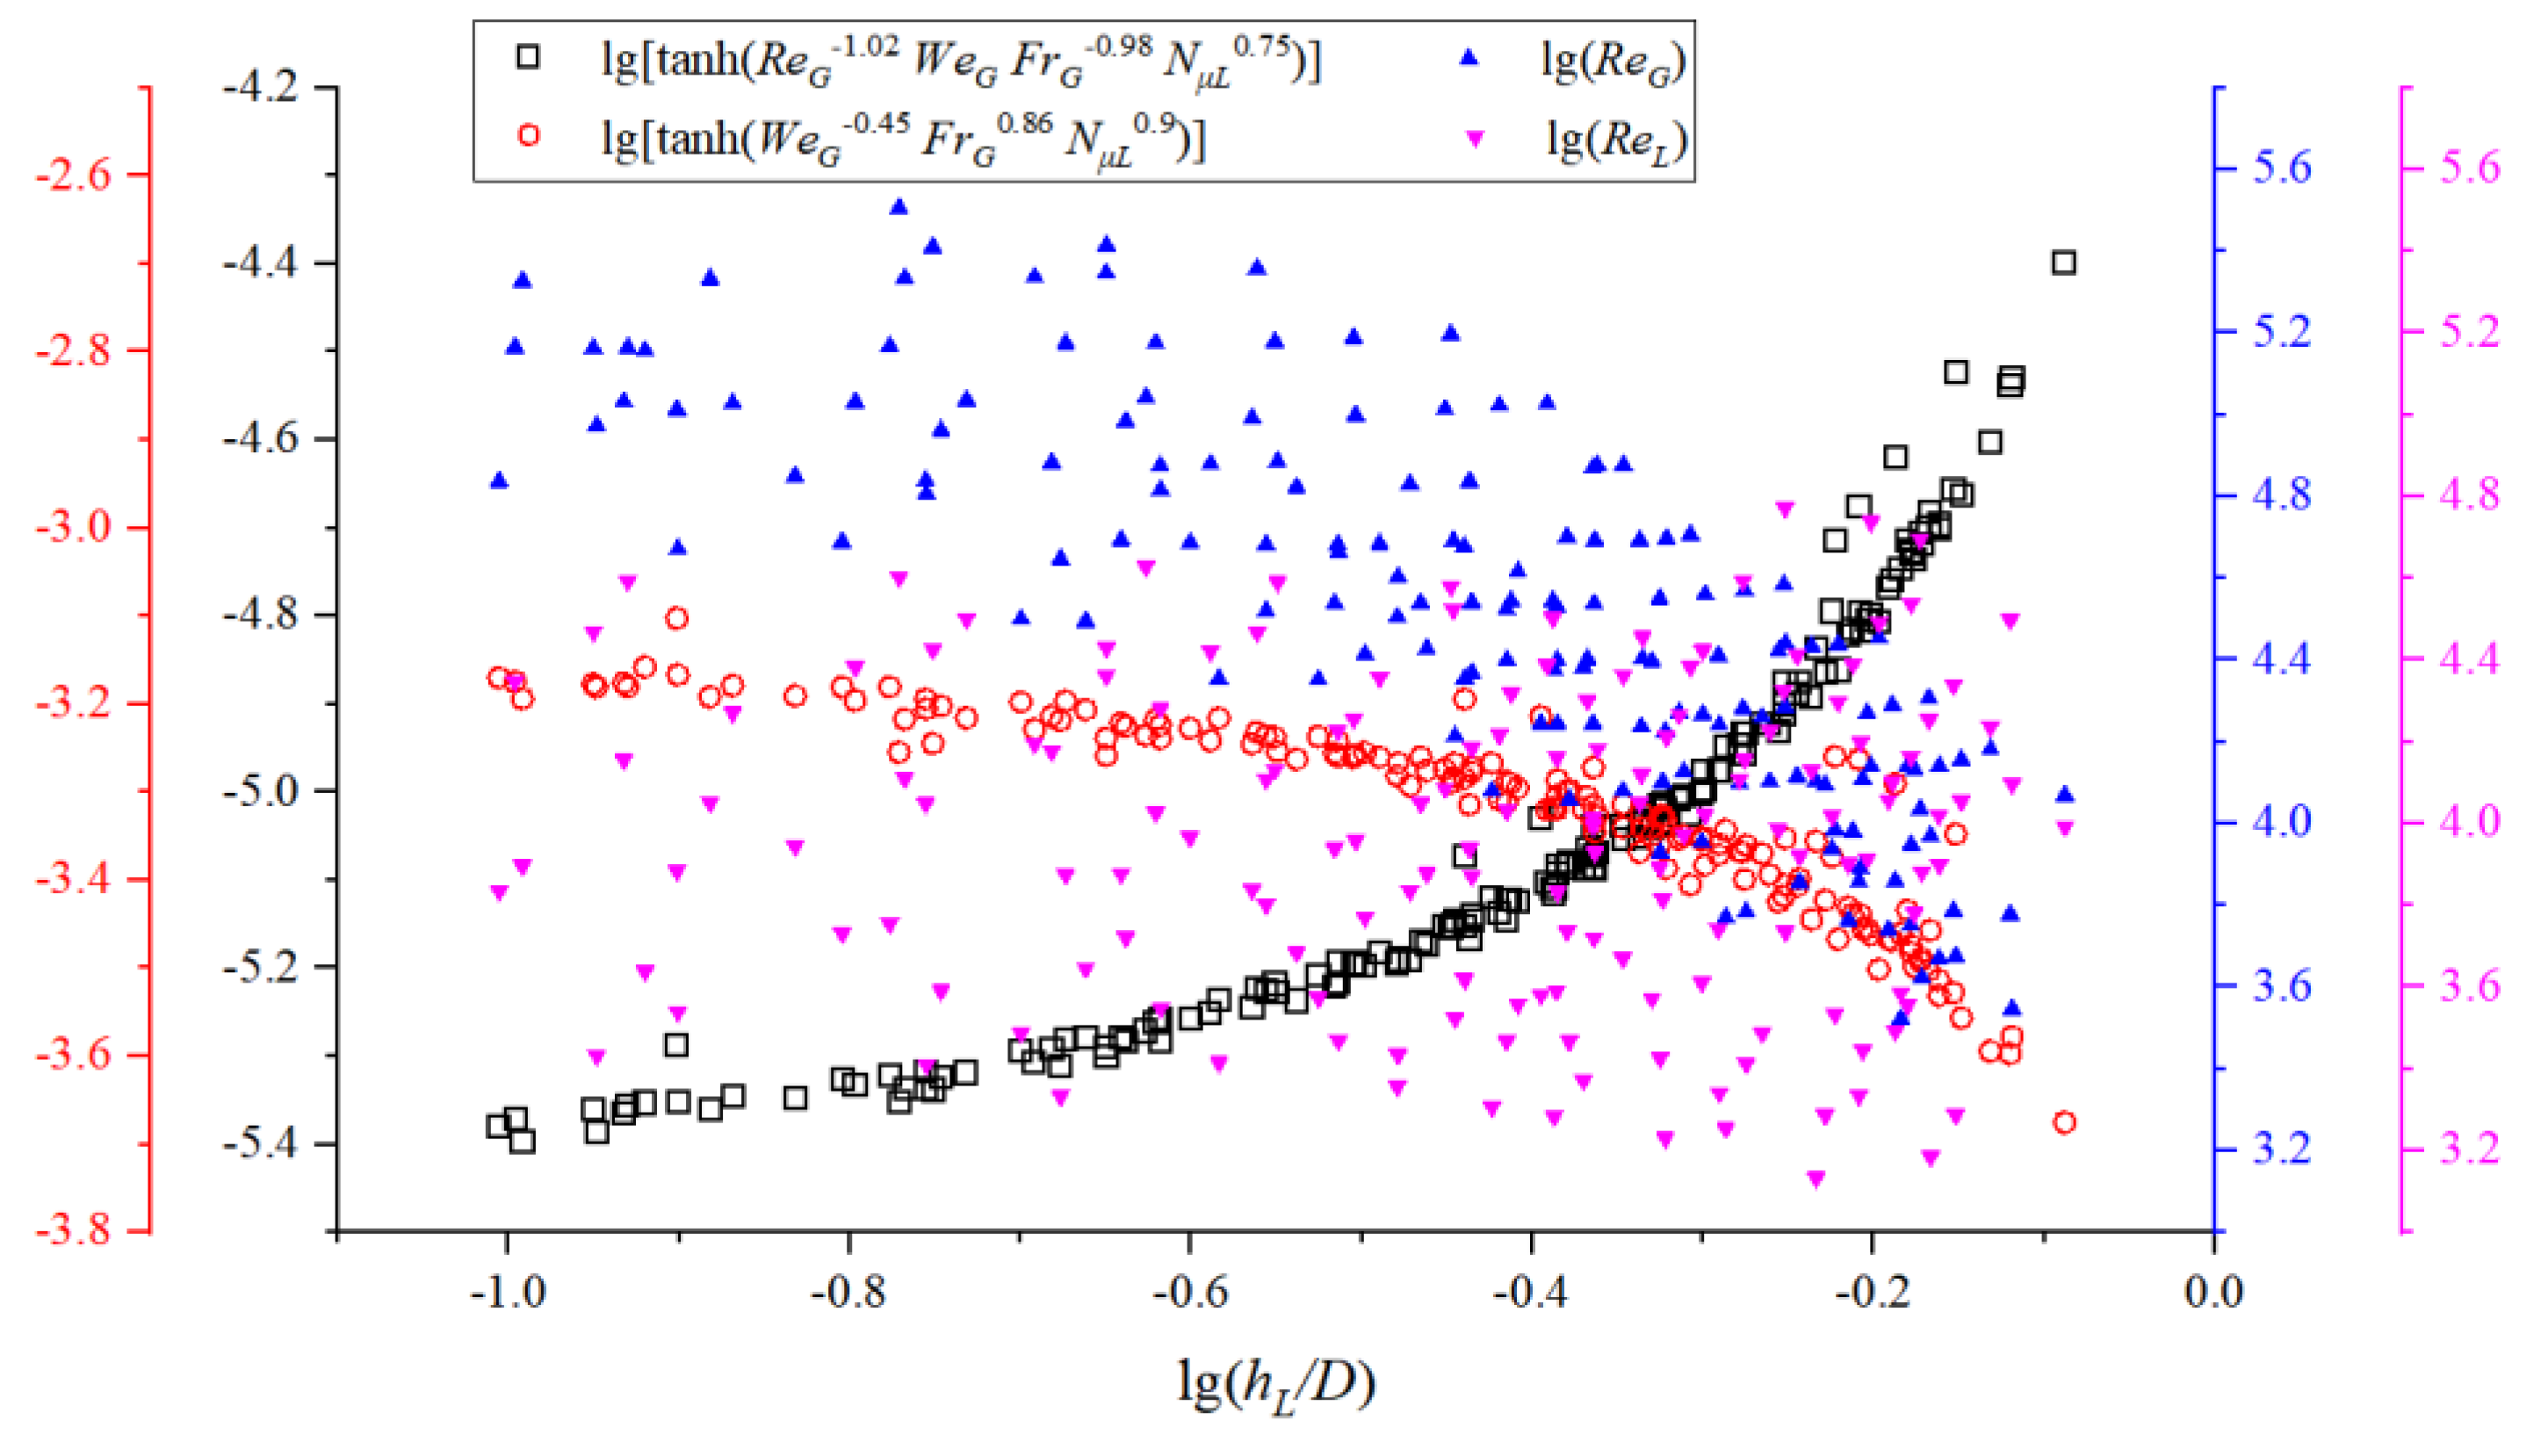
The relationship between dimensionless film thickness and fluid Reynolds numbers was researched. However, it is dispersed and no significant correlation could be fitted to achieve an empirical formula. Other dimensionless numbers were researched also, and similar distributions were encountered. As a result, we studied new composite dimensionless numbers composed of the dimensionless numbers above, and significant correlations are illustrated in Figure 7. Both the new composite dimensionless numbers hLD and hLR are defined in Equation (8).
h L D = t a n h R e G 1.02 W e G F r G 0.98 N μ L 0.75  
h L R = t a n h W e G 0.45 F r G 0.86 N μ L 0.9
It is easy to find that good monotonousness is achieved for both the new composite dimensionless numbers hLD and hLR with increasing dimensionless number lg(hL/D), which gives proof that the liquid film thickness can be described with the newly proposed dimensionless numbers hLD and hLR. As shown in Figure 7, the dimensionless number lg(hL/D) is accompanied by the increase in the new dimensionless numbers hLD. Conversely, the dimensionless number hLR decreases with increase of the dimensionless number lg(hL/D). As defined in Equation (8a,b), the dimensionless number hLD increases with increasing gas Weber number and decreasing gas Froude number, and the reverse principle exists for dimensionless number hLR. Generally, the new dimensionless number hLD represents the gas phase’s driving effects on the liquid film, while the new dimensionless number hLR represents the liquid phase’s drag impact on the gas phase.
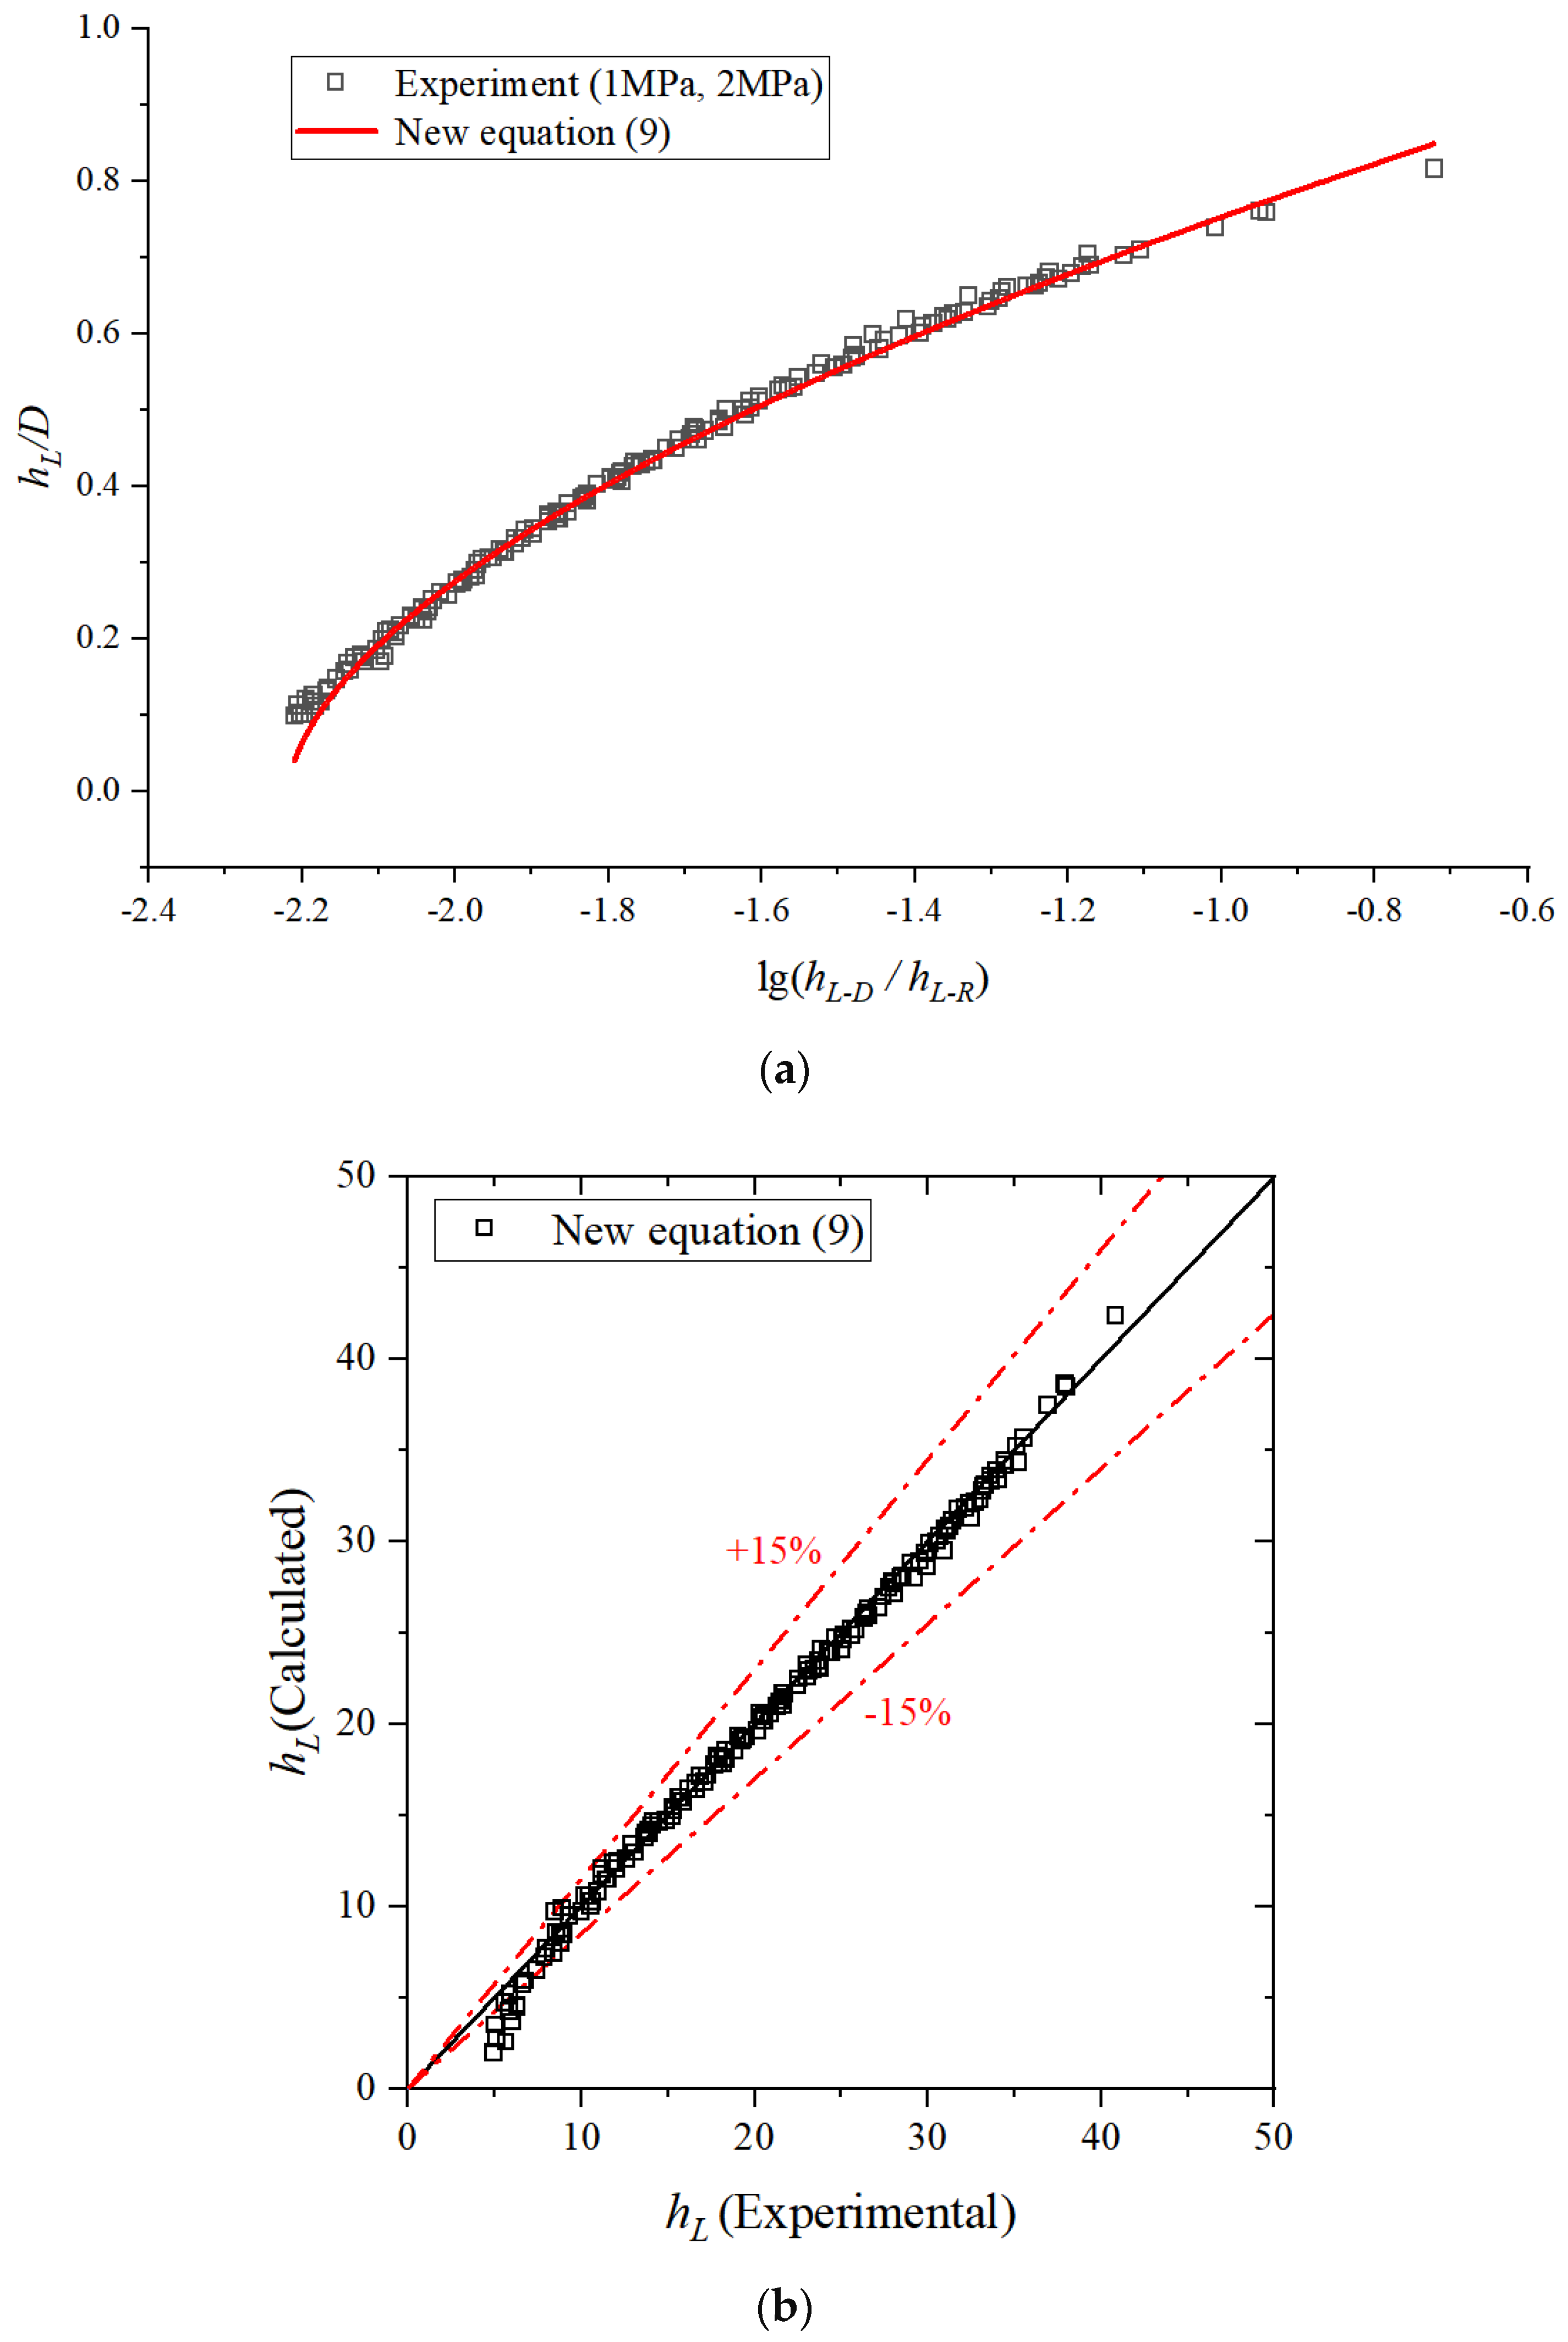
Further analysis on the dimensionless film thickness was executed, and the newly defined dimensionless variables hLD and hLR were used to describe the principle of film thickness. A comparison between the experimental and calculated film thickness was made and is illustrated in Figure 8, and a new formula for dimensionless film thickness was deduced and is written as Equation (9).
lg h L D = 0.254 ln 0.505 l g h L D h L R + 1.12  
As illustrated in Figure 8a, for the dimensionless film thickness greater than 0.15, the newly proposed equation gives a good prediction of dimensionless film thickness. Comparisons between experimental film thicknesses and calculated ones are illustrated in Figure 8b; most predictions are within ±15% with a standard deviation error of 9.42%. A study on film thickness was carried out and proved that the flows with small film thickness are all located in the wave-stratified-annular flow transition band, where the interface profile in the cross-section area is not flat and accounts for overestimating of film thickness.

4.4. Gas-Wall Friction Factor

A gas single-phase flow test was executed in this setup to study the pipe drag effect on compressed air. Most experiments in the references used air at atmosphere as gas fluid, Freon 12 and other gases at low pressure were used in a few studies, and gas phase influence on gas-wall was proven. As a result, the effect of pressure on compressed air-wall drag force was studied. In addition, gas single-phase flow tests at atmosphere and 4.5 MPa were supplemented and investigated.
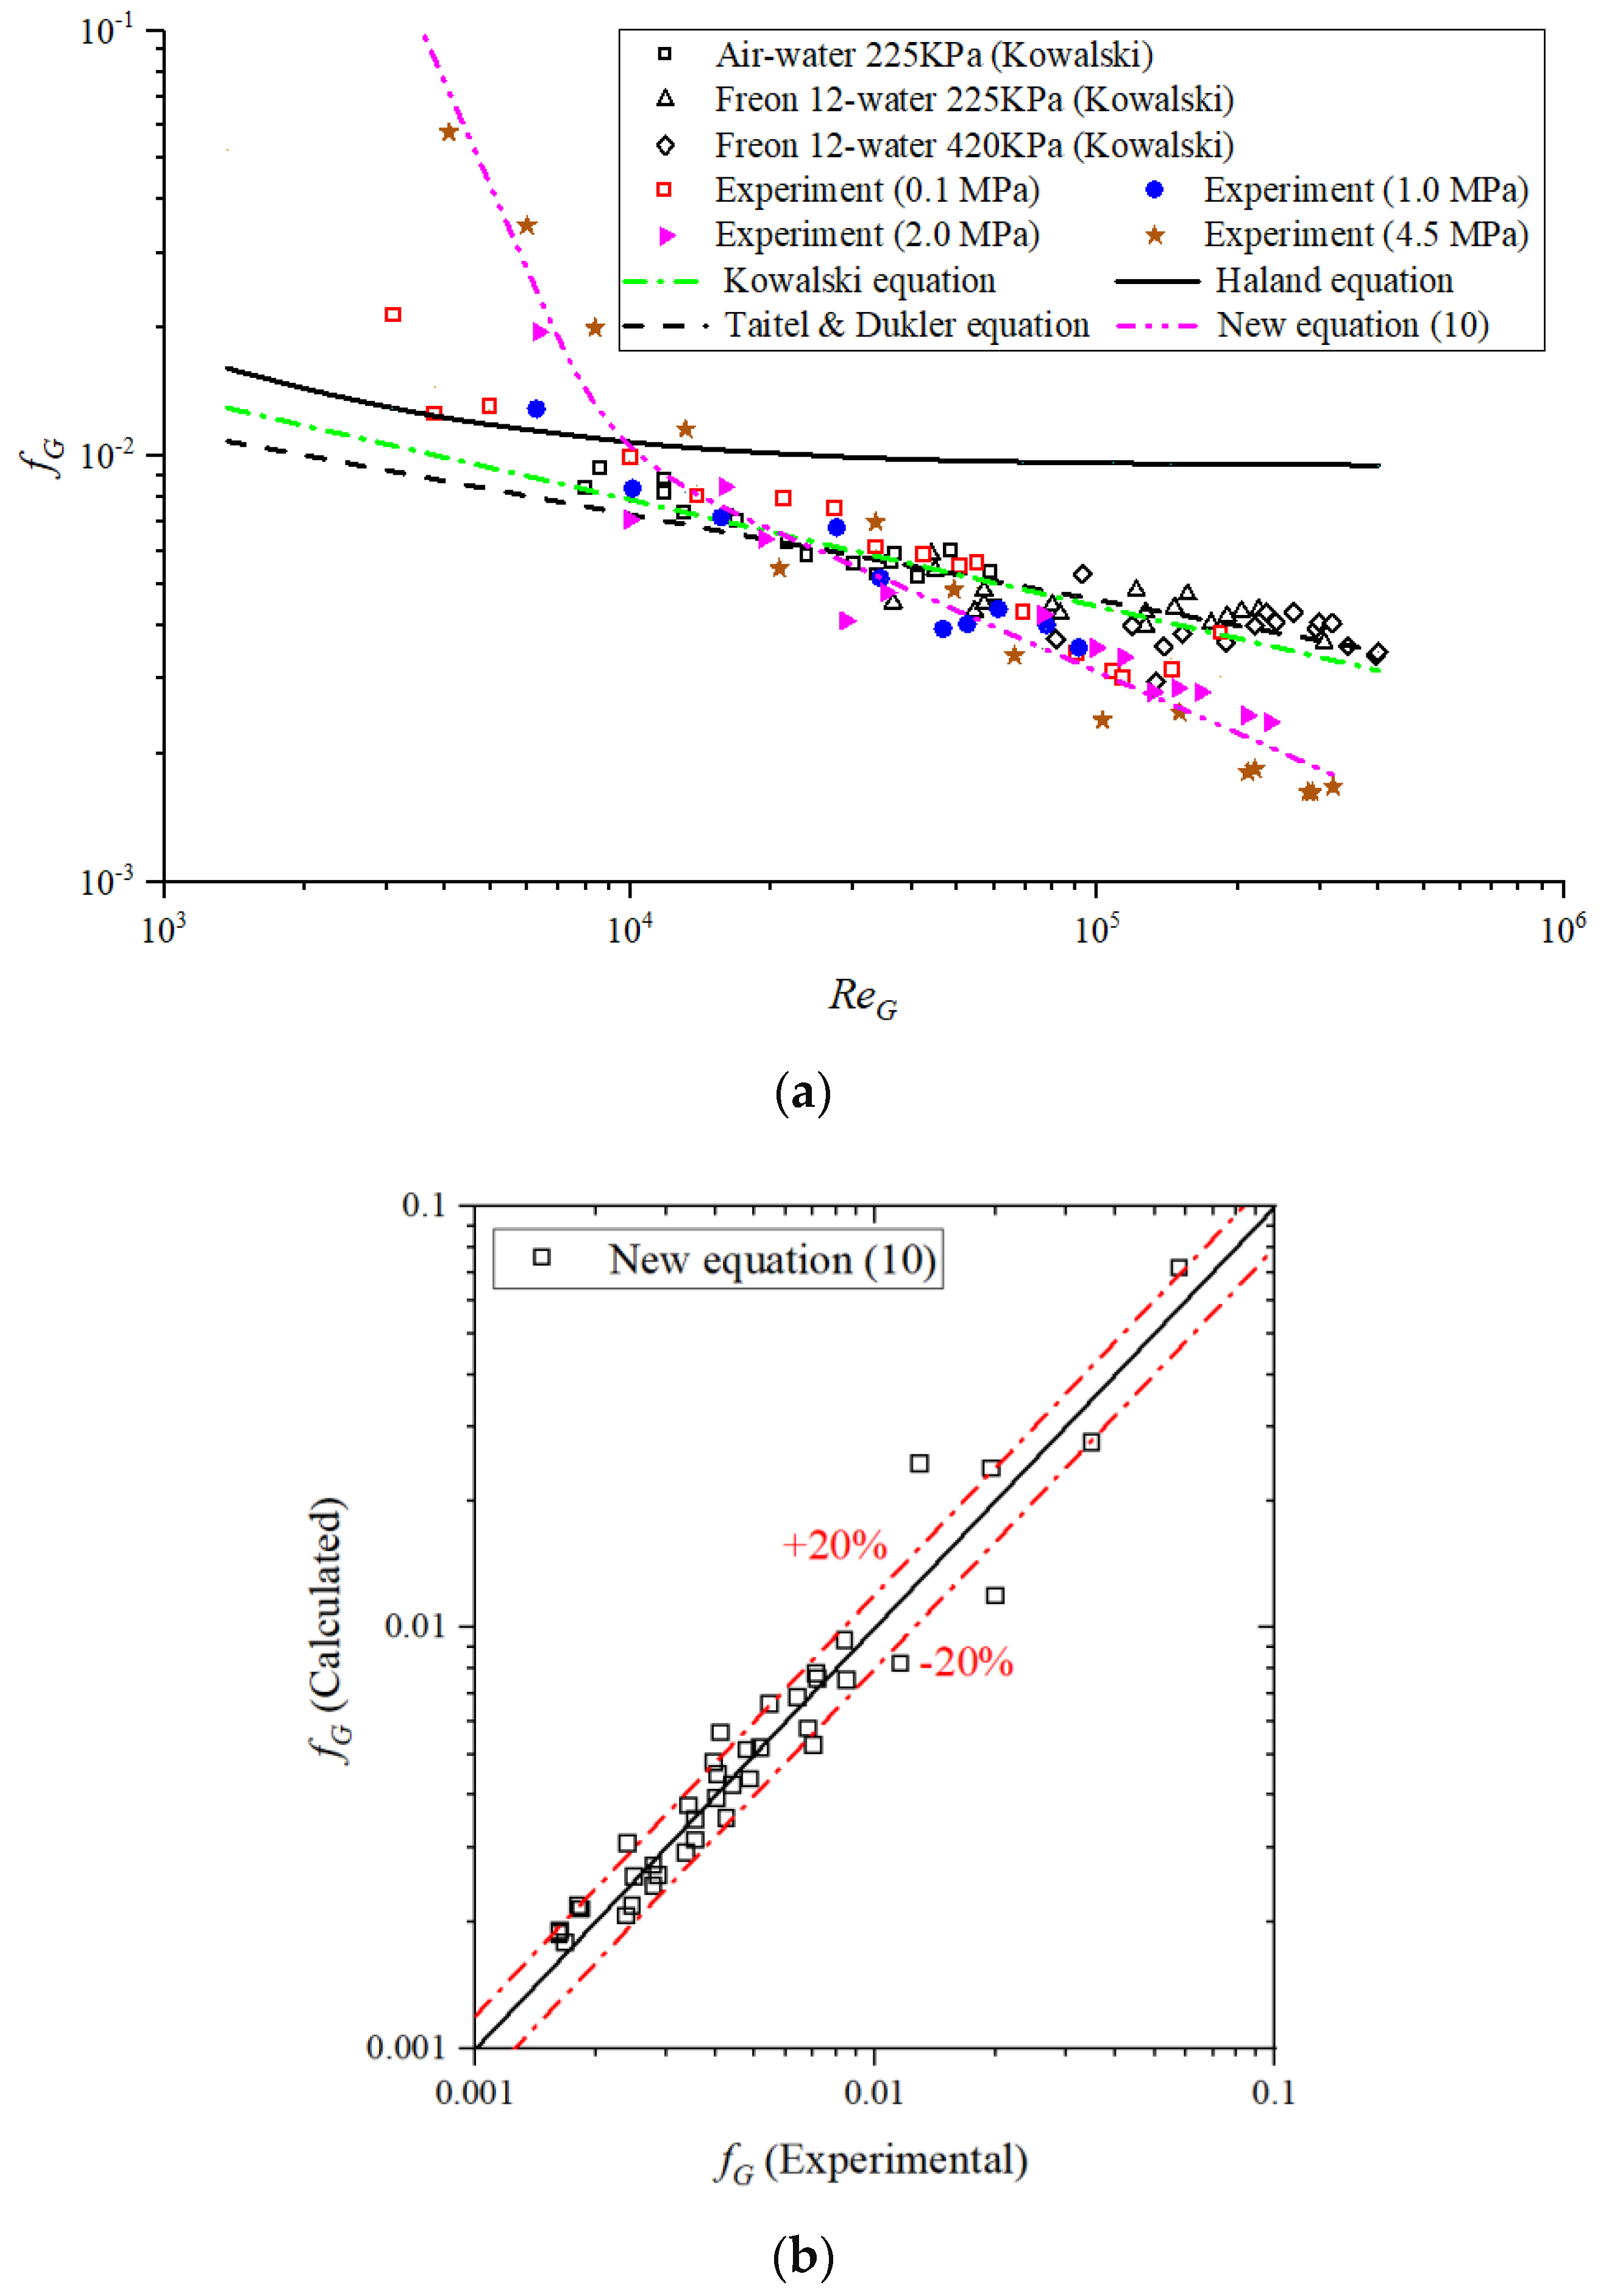
Gas-wall friction factors at different pressures were obtained, and a comparison between them and experimental data in references is illustrated in Figure 9a. For the cases at atmosphere, the gas-wall friction factor generally decreases with increasing gas Reynolds number, and its distribution is in accordance with the gas-water two-phase flow executed by Kowalski [15]. For the cases that are executed at high pressure, gas-wall friction factor decreases much more steeply, and different regularities can be found where both sides of the critical Reynolds number are about 15,000. Especially for the cases with gas Reynolds number greater than 15,000, accordance with cited experimental data could be tested. However, the gas-wall friction factor at high pressure is smaller than that at atmosphere. Finally, a new empirical correlation was deduced and is written as Equation (10).
f G =   7.02 × 10 7 R e G 2.49   R e G 15,000   0.765 R e G 0.48   15,000 < R e G < 500,000
We compared the calculated gas-wall friction factors between Equation (10) and experimental data, and the comparisons are illustrated in Figure 9b. As shown in Figure 9b, it is easy to see that most predictions are within ±20%, and the calculated values are uniformly scattered on two sides of the experimental data, which proves the good accuracy of the newly proposed Equation (10).

4.5. Interfacial Friction Factor

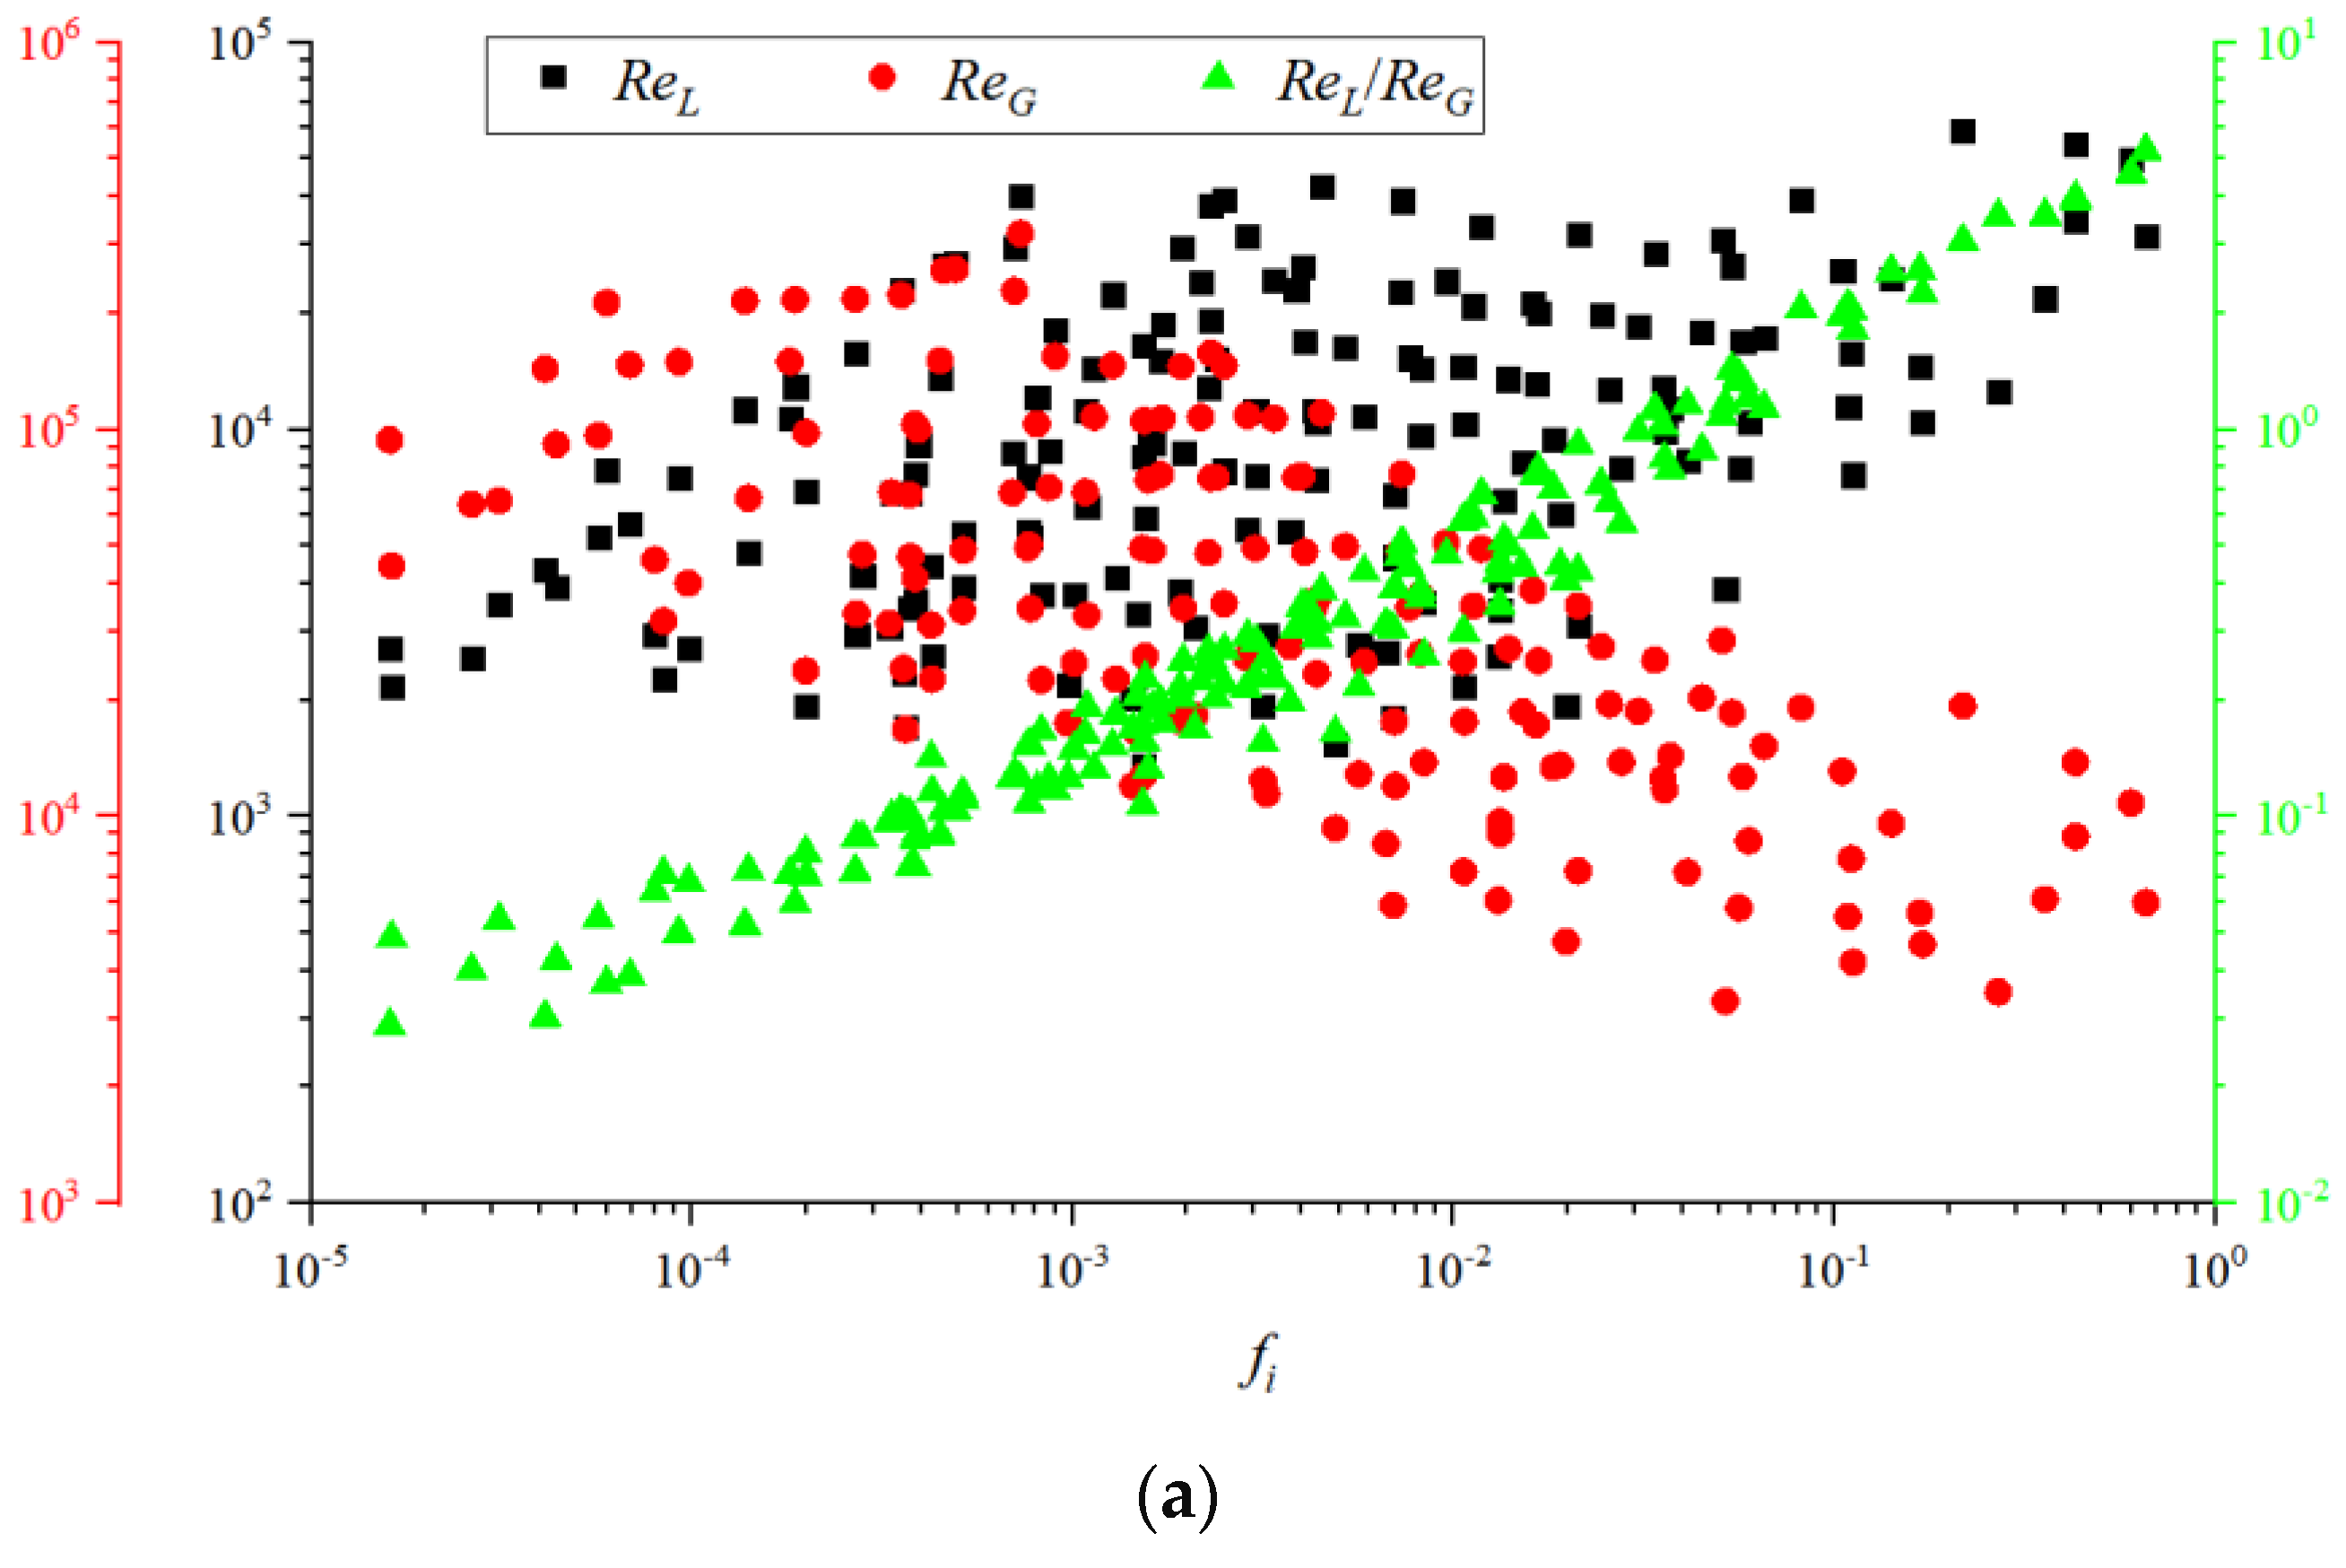
Based on the measurement of pressure drop signals and coupled with other parameters, interfacial shear stress and friction factor are determined by applying flow momentum balance to both fluids. As theoretically deduced, drag friction coefficient is a function of Reynolds number of the fluid flow on the plate. For the wave-stratified flow in pipelines, interfacial shear stress interacts with interface wave profile and the periodical characteristic is proven, which accounts for the complicated relationship between interfacial friction factor and fluid Reynolds numbers.
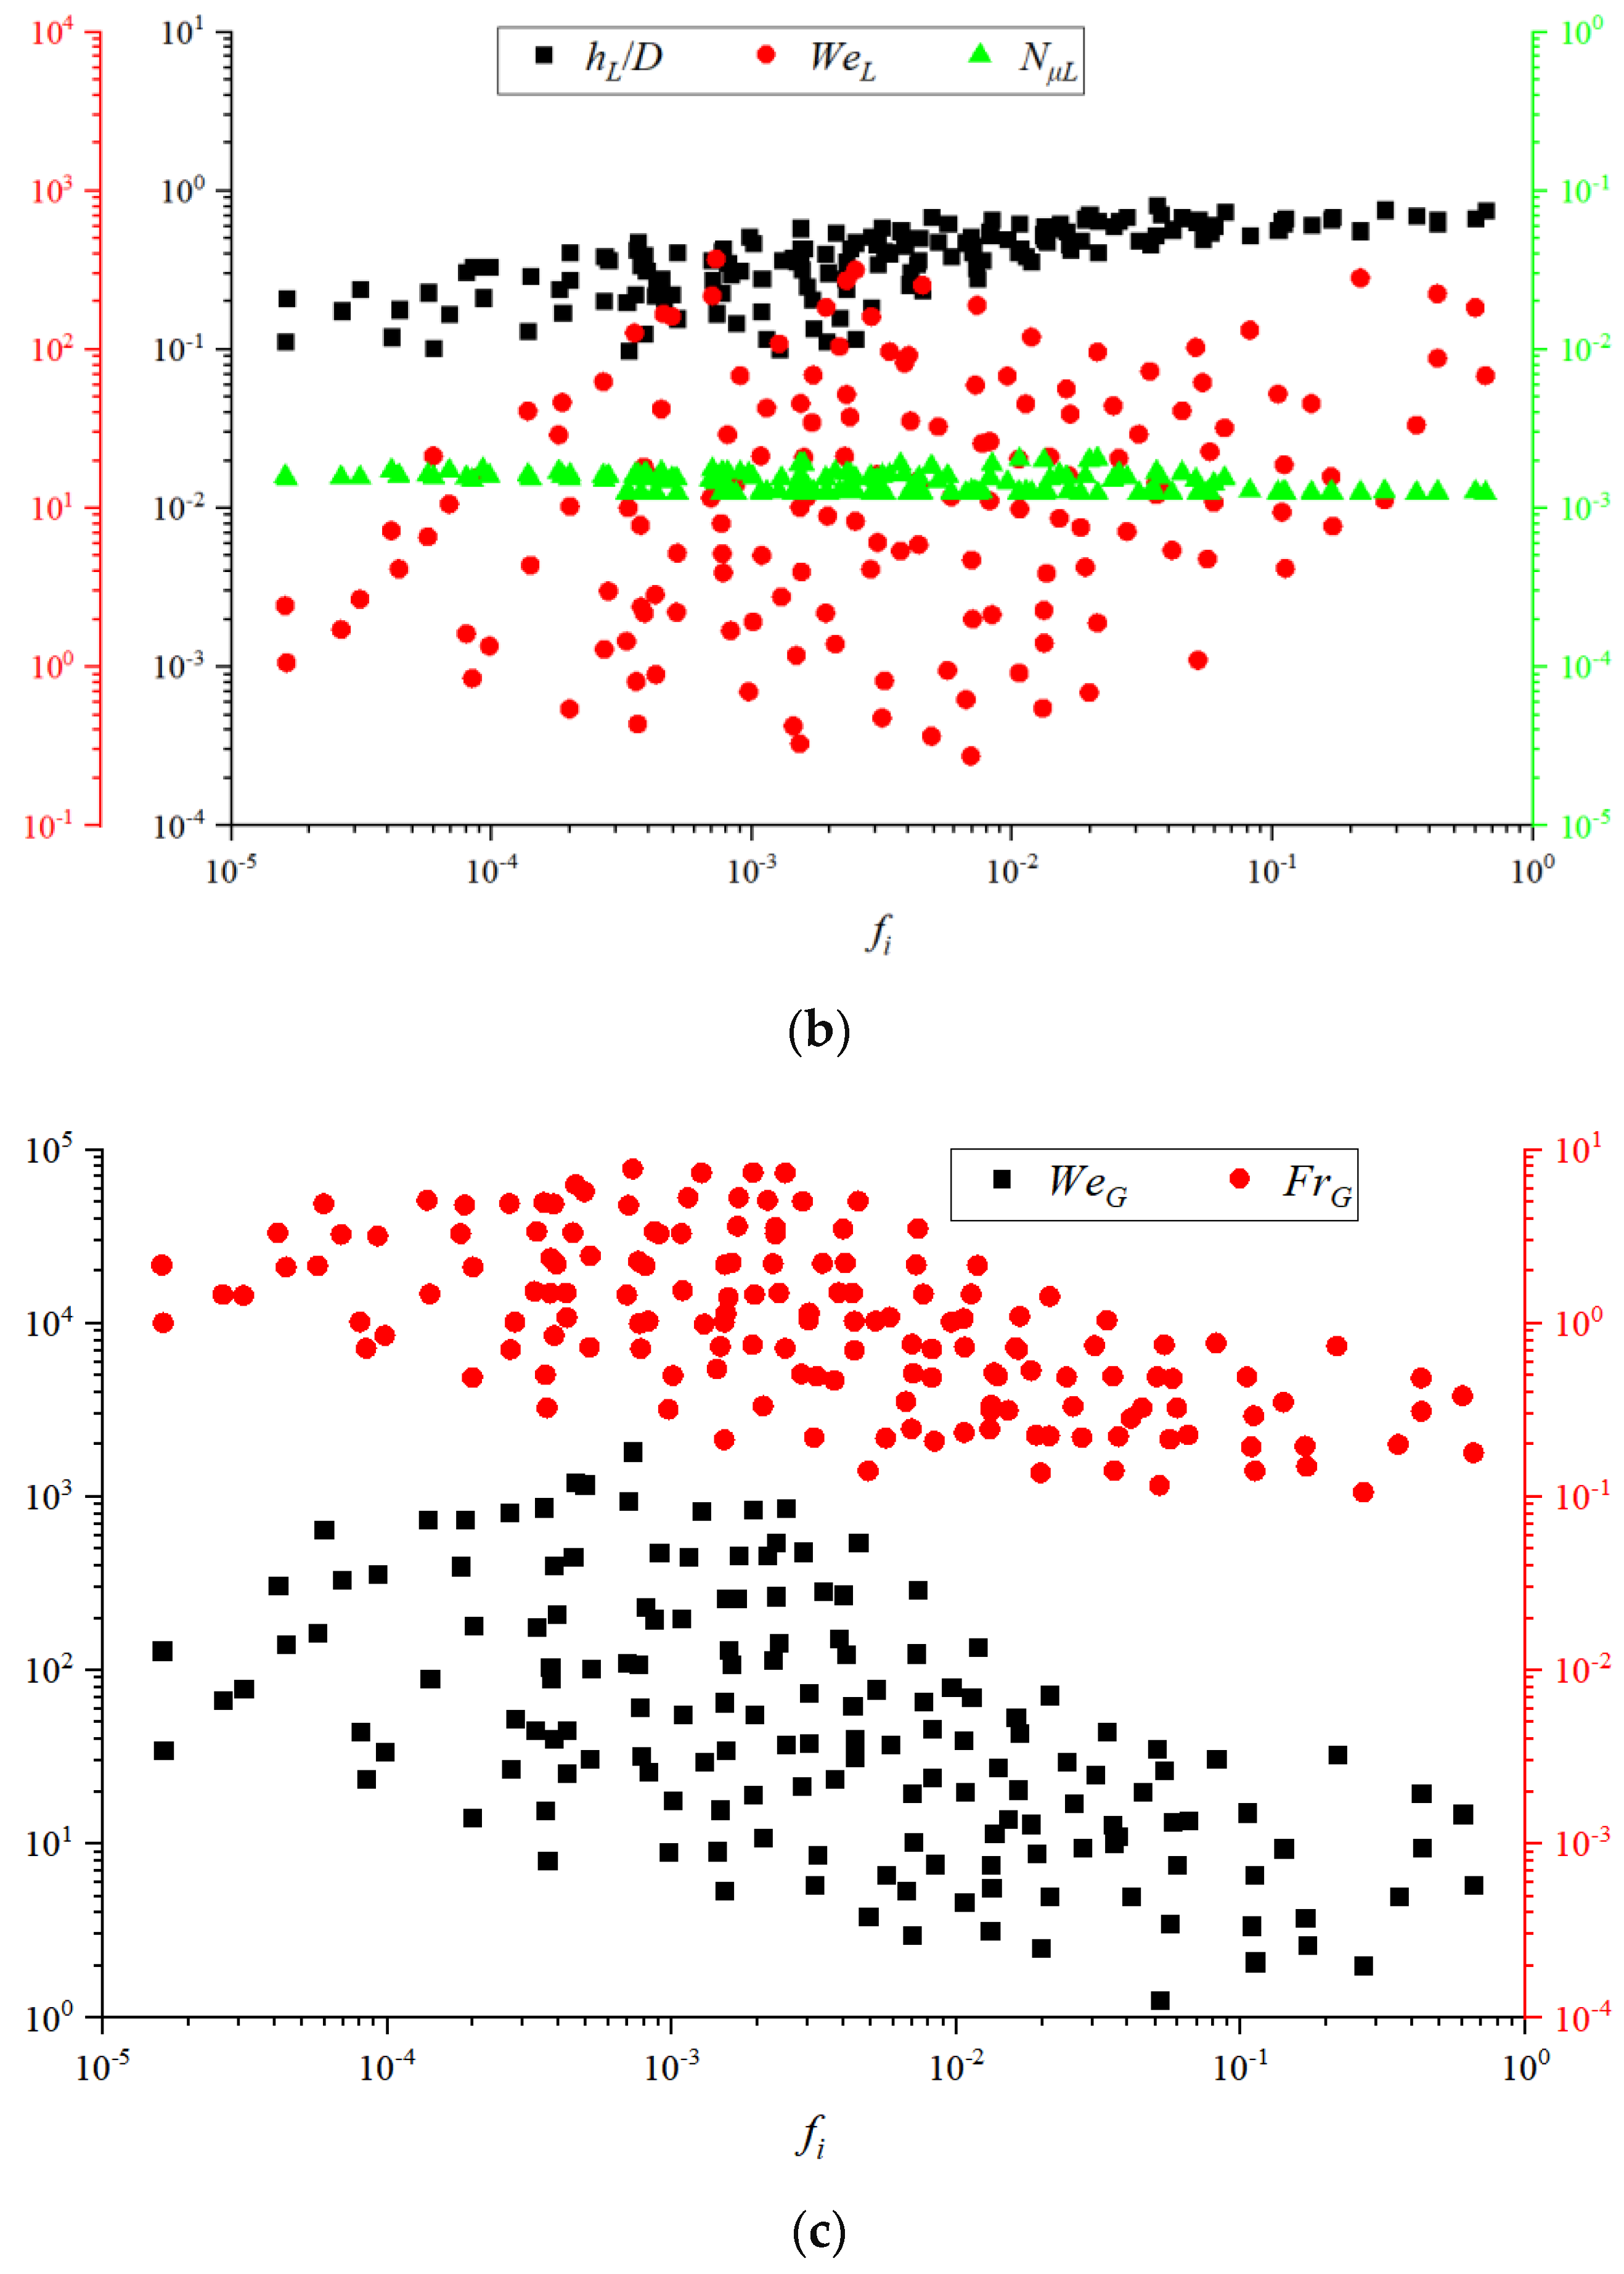
As shown in Figure 10a, monotonic trends of both liquid and gas Reynolds numbers are visible. However, significant fluctuation and uncertainty make interfacial friction factor prediction difficult. The ratios between liquid and gas Reynolds numbers are calculated, and show a significant monotonic trend, which makes it possible to precisely calculate the interfacial friction factor.
Shown in Figure 10b, compared with the liquid Reynolds number, a similar distribution of liquid Weber number is plotted while the viscosity number fluctuates little, which is only affected by gas and liquid properties. As it is defined, gas dimensionless numbers, such as gas Reynolds number, gas Weber number, and gas Froude number, are all mainly affected by gas flux rate.
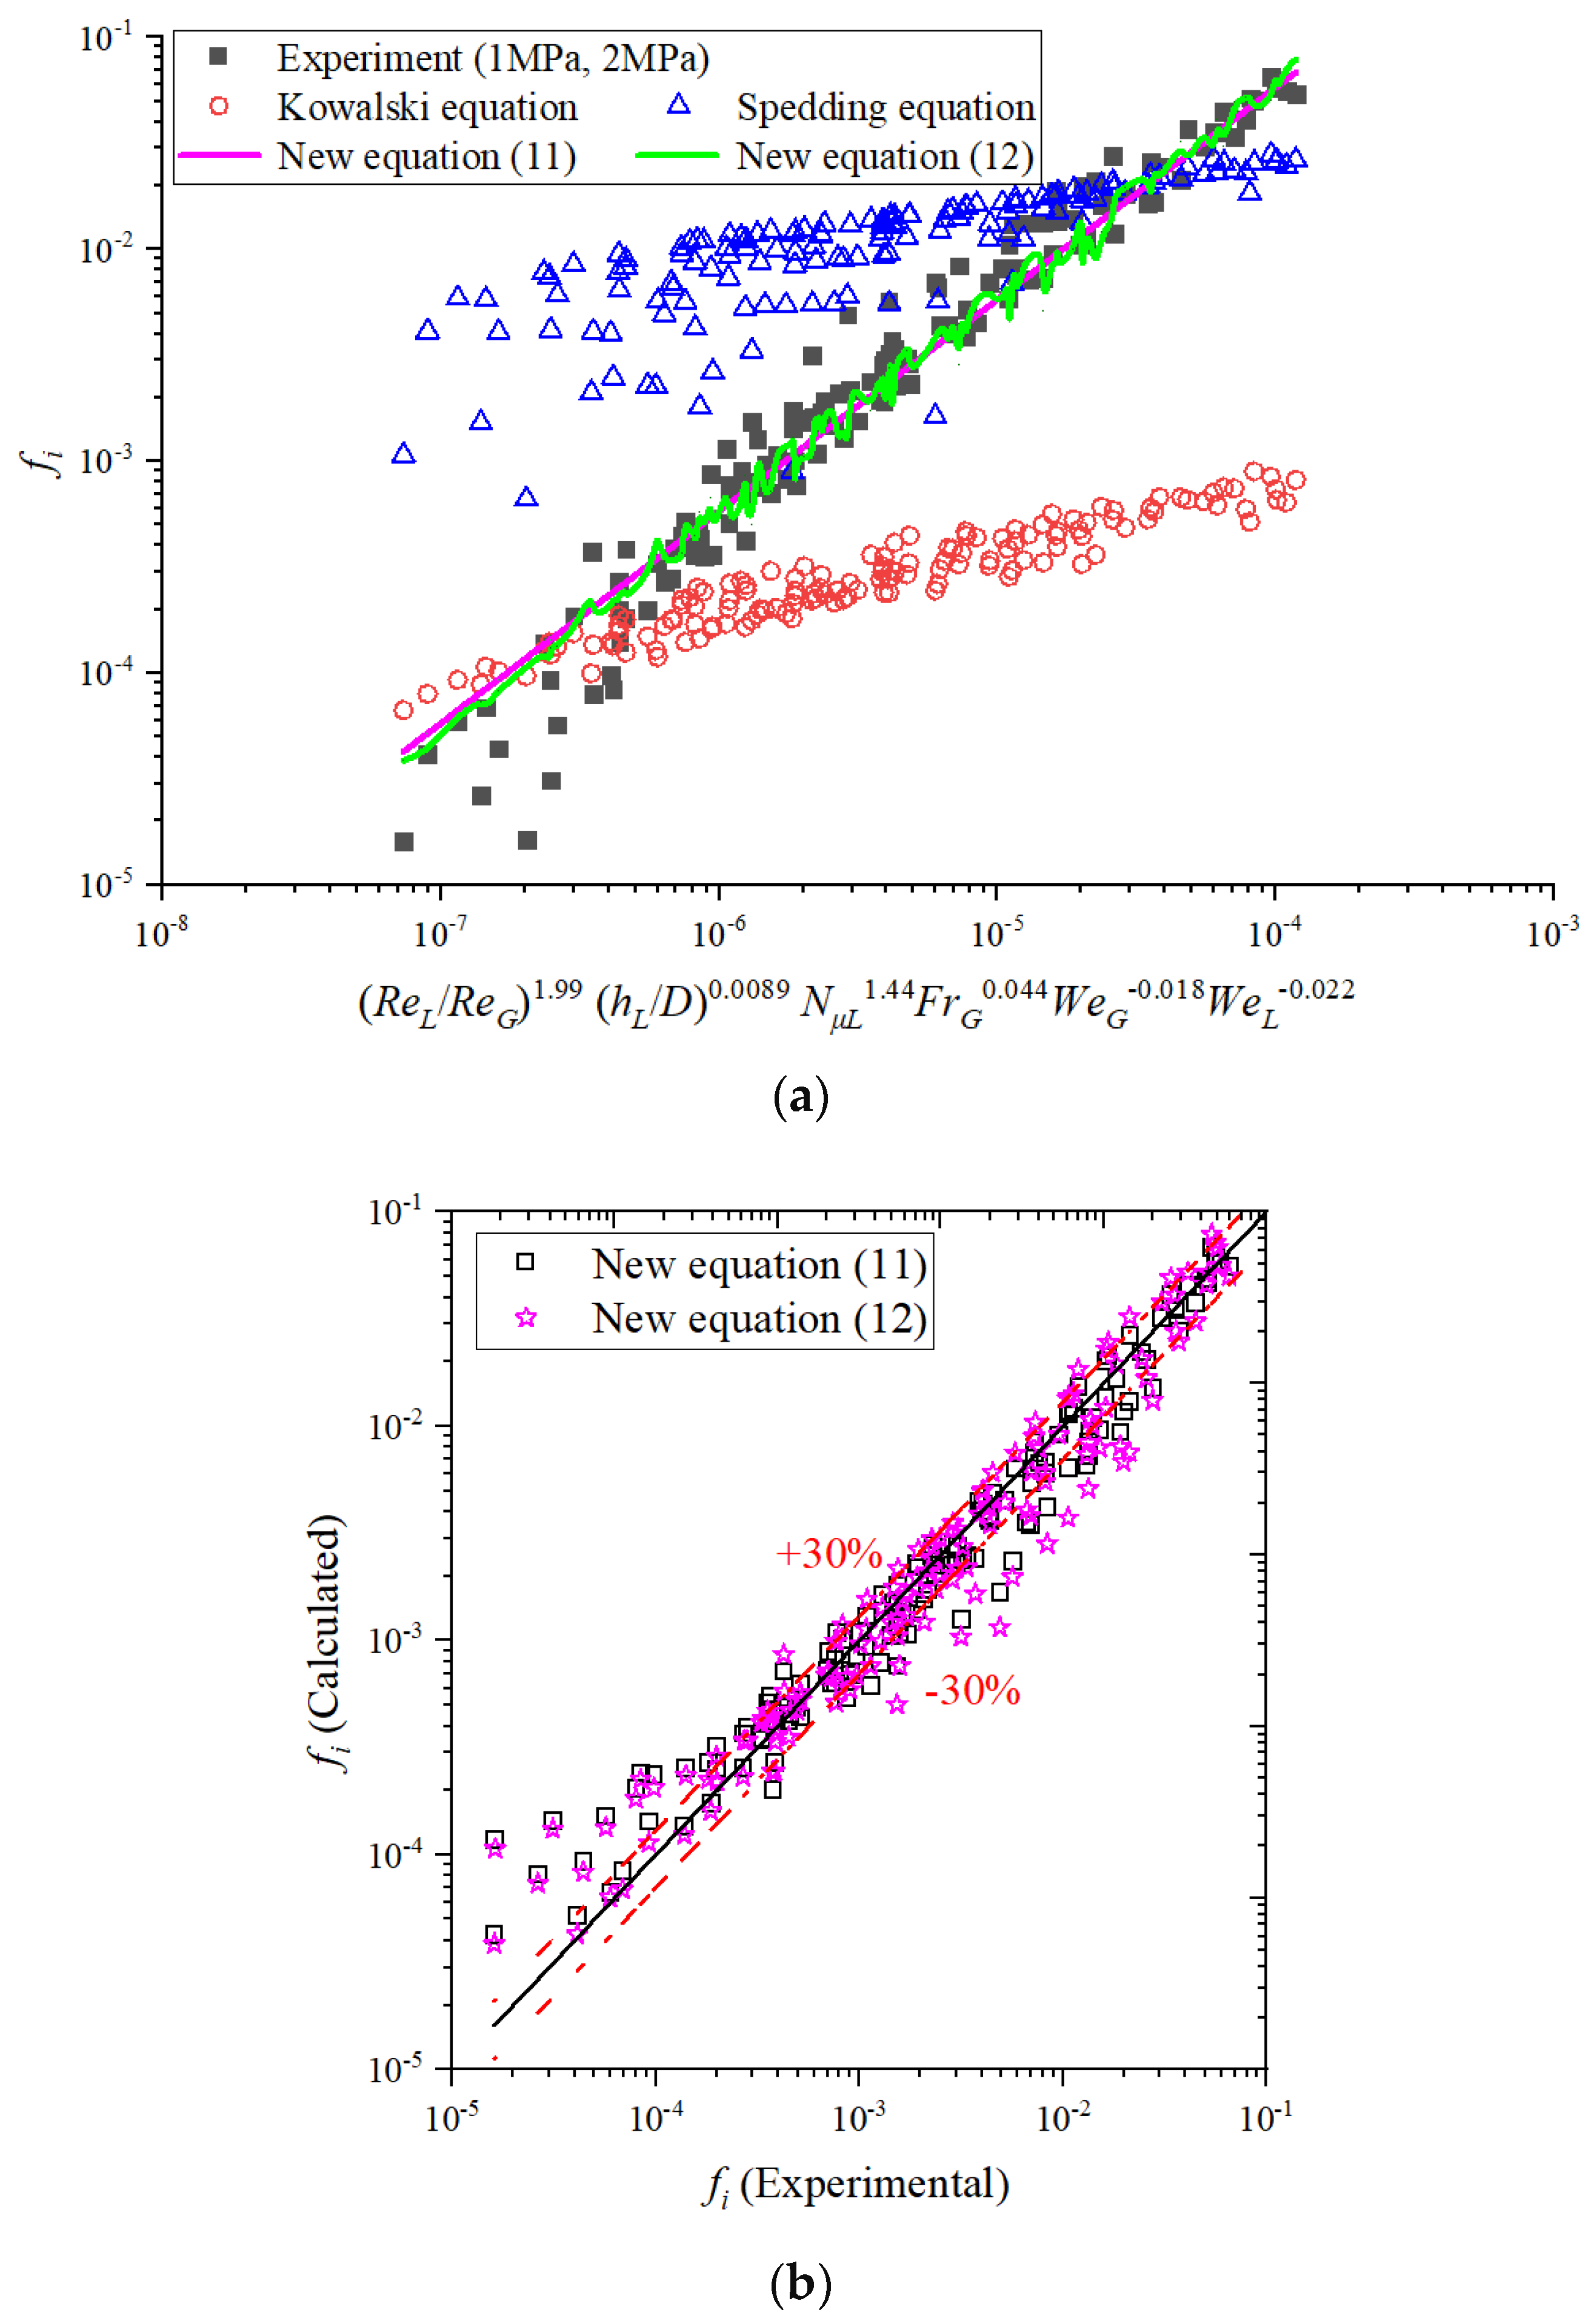
Firstly, the inner relationships between dimensionless numbers mentioned above are analyzed. Considering the interface wave impact on the gas velocity field, liquid film thickness should be helpful for precise prediction of interfacial friction factor. Secondly, Reynolds numbers and void fractions of both phases are analyzed, and a simplified formula is also deduced, which releases the prediction of liquid film thickness and makes the interfacial friction factor prediction much simple. As a result, both the newly proposed formulas are written as Equation (11) and Equation (12), respectively.
f i = R e G 0.041 × R e L 1.99 h L D 0.0089 N μ L 1.44 F r G 0.044 W e G 0.018 W e L 0.022  
f i = 0.039 R e G R e L 1.95  
Comparisons between different models were made and are illustrated in Figure 11a. Both the two referenced equations fail to precisely predict the interfacial friction factor of a gas-liquid two-phase flow in a horizontal pipe at high pressure. Both the two newly proposed equations were tested, and the predictions were proven by experimental data and are shown in Figure 11b. Firstly, both Equations (11) and (12) can give an accurate prediction of interfacial friction factor, and most predictions are within ±30%. Secondly, Equation (11) gives a better prediction than Equation (12): the standard deviation errors are 30.8% and 36.0%, respectively, which account for the interaction between interface wave and shear stresses.

4.6. Liquid-Wall Friction Factor

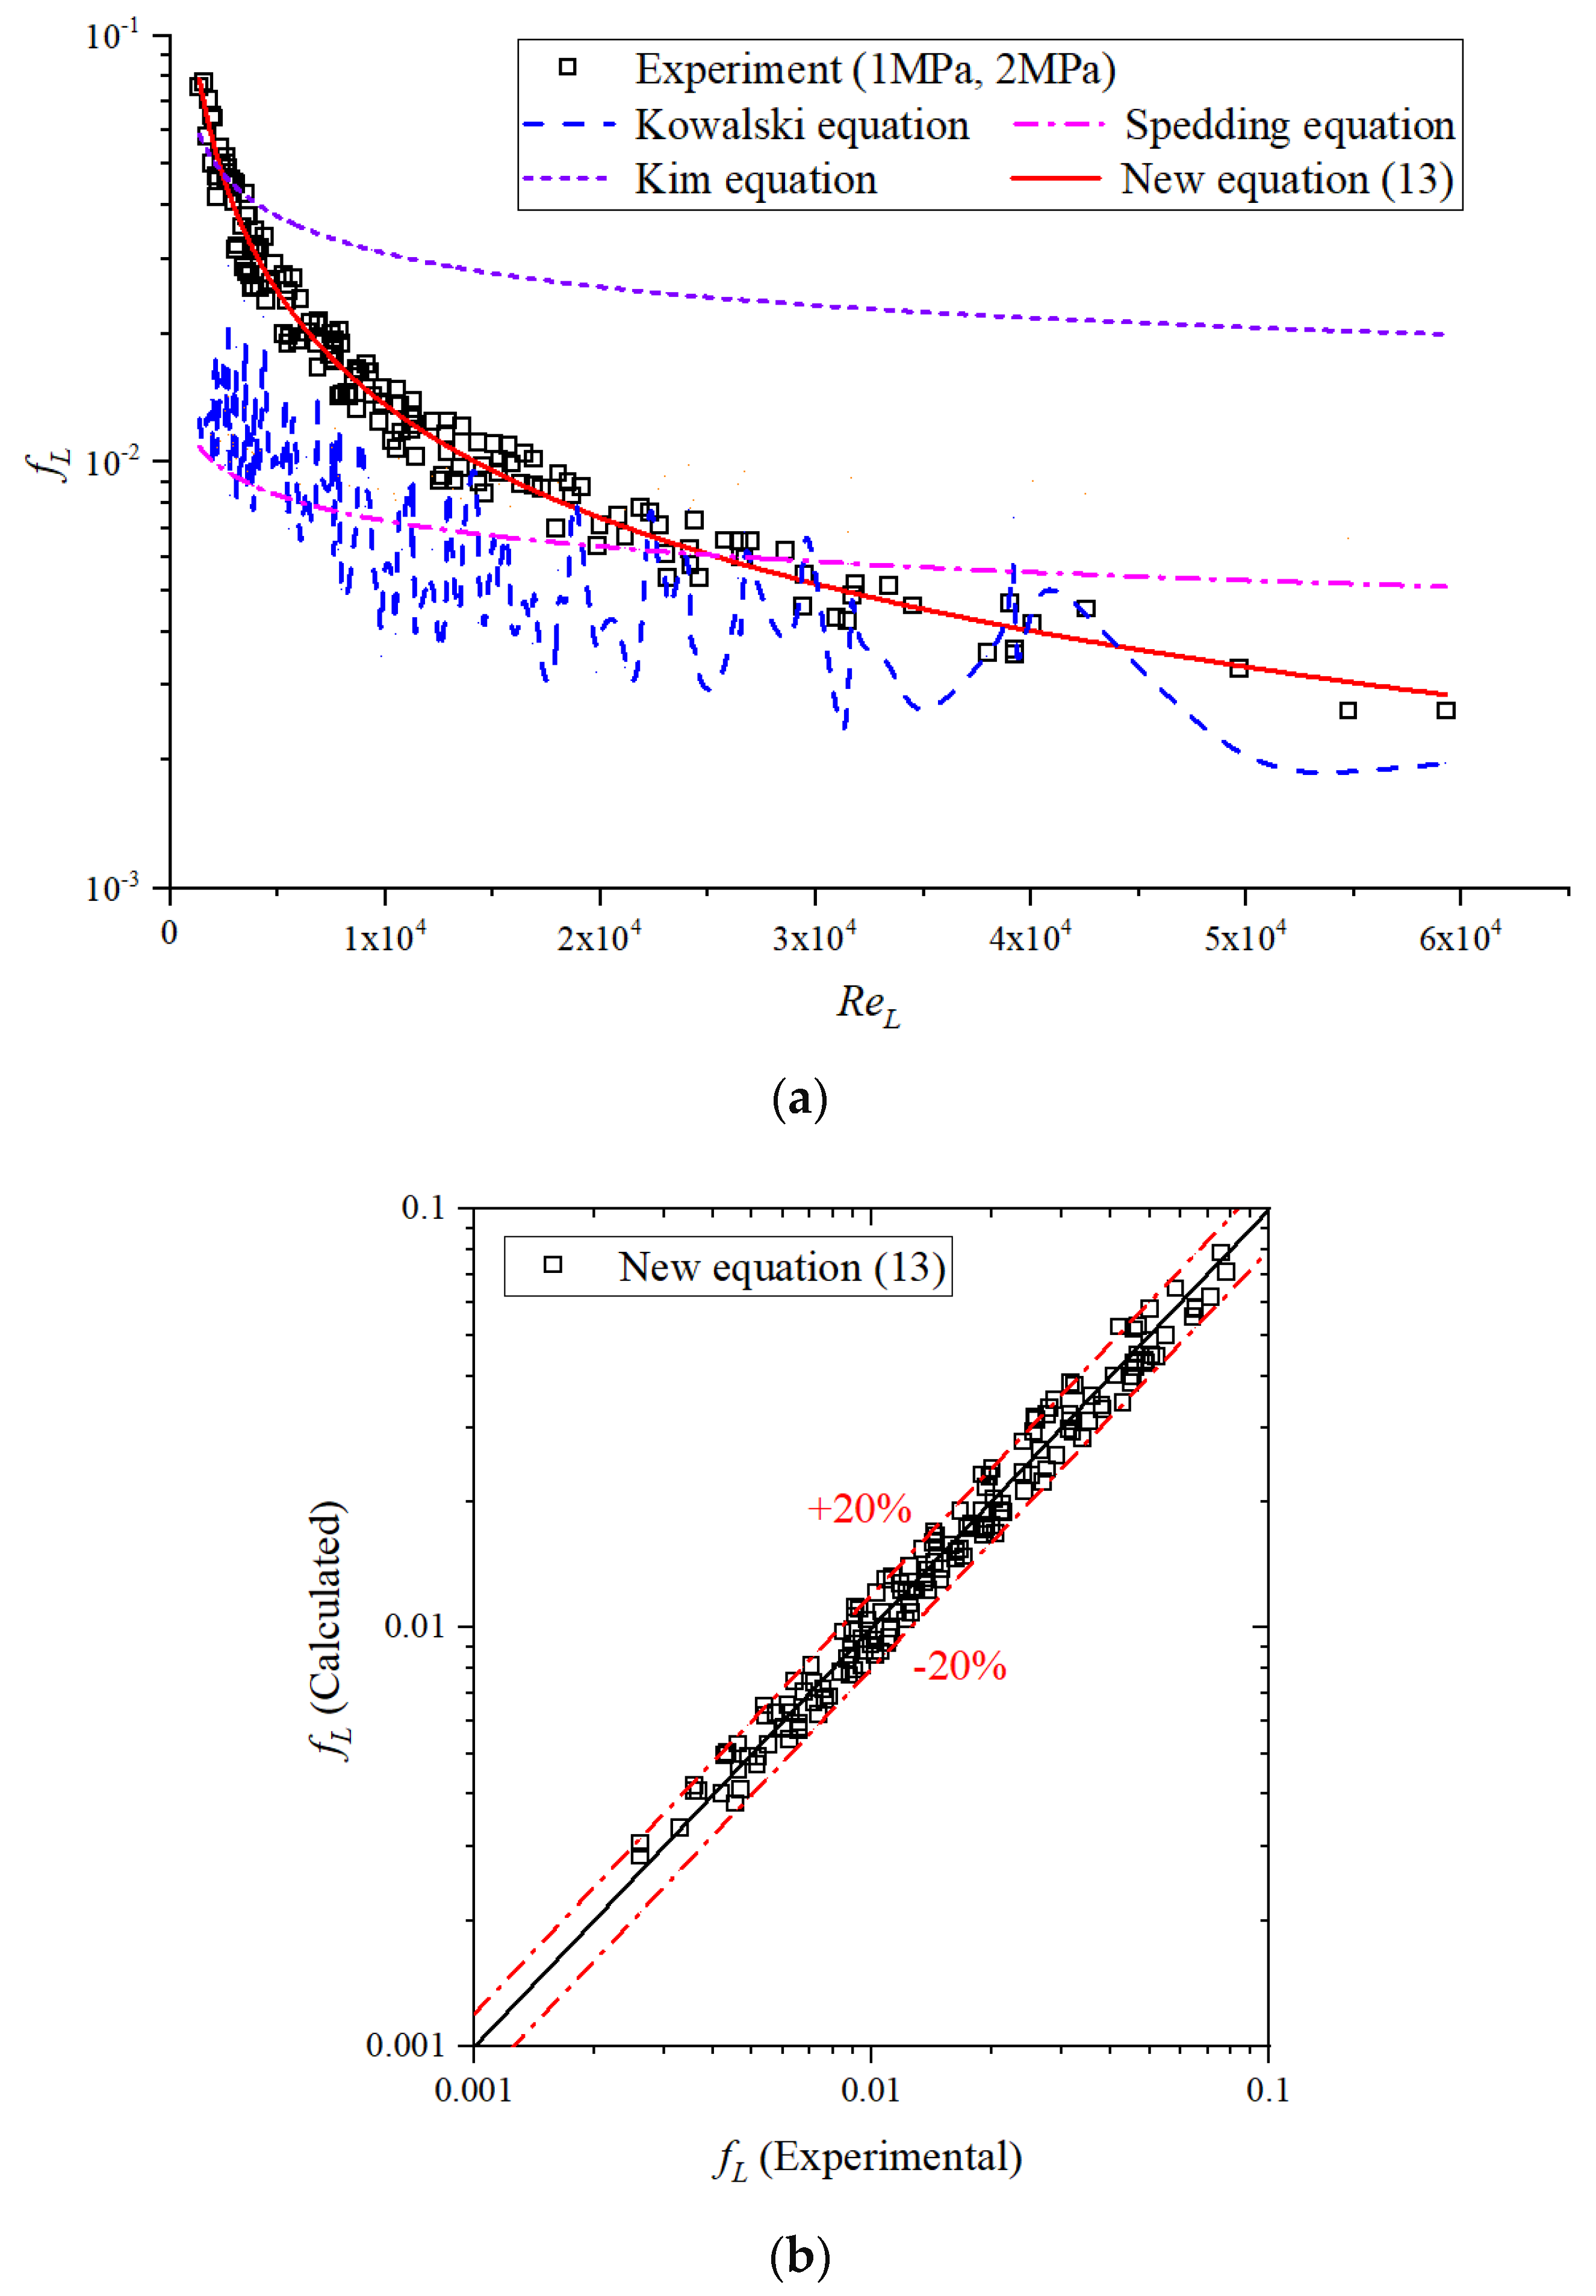
The liquid-wall friction factor is calculated by solving the liquid momentum equation. Just like fluid flow on the plate, it decreases monotonically with increasing liquid Reynolds number. Finally, a new formula is deduced and written as Equation (13).
f L = 45.1 × R e L 0.88
Different models were compared for liquid-wall friction factor predictions, which are illustrated in Figure 12a. For the cases where liquid Reynolds number is smaller than 2000, the Kim model gives the best prediction. However, the Kim model fails to predict liquid-wall friction factor values in a turbulent gas-liquid two-phase flow at high pressure. Compared with the referenced models, the Kowalski model gives the best prediction, especially for the fluid flow with liquid Reynolds number greater than 20,000.
The accuracy of the newly proposed Equation (13) was tested with experimental data, and most predictions were within ±20% with standard deviation error of 12.1%.

5. Conclusions

Air-water two-phase flows in a horizontal pipe at high pressures of 1 MPa and 2 MPa were experimentally studied. Great ranges of both gas and liquid superficial velocities were achieved, and different flow regimes were observed through a polycarbonate pipe. The characteristics of interface profile in stratified flow were acquired by analyzing the differential pressure signal and processing images of the interface profile.
We studied the pressure effect on an air-water two-phase flow in a horizontal pipe. For the air-water two-phase flow in a horizontal pipe with a liquid superficial velocity of 0.15 m/s, an interface wave appears on the interface with gas superficial velocities of 4.0 m/s, 0.7 m/s, and 0.5 m/s for pressures of 0.1 MPa, 1.0 MPa, and 2.0 MPa, respectively. Consequently, both smooth-wave and stratified-annular flow transitions emerge with smaller gas superficial velocity at higher pressure. It was found that the interface profile becomes much more unsteady with increasing pressure, which could be attributed to the magnitude increase in gas phase density and momentum transfer between both phases. In addition, greater liquid superficial velocity was acquired to accomplish stratified-intermittent flow transition, and the transition boundary became much more flat. Accompanied by the density increase in the compressed air, gas phase compressibility depressed with increasing pressure, and the liquid phase acquired much more momentum to counteract the wave crest effect where the gas vortex shedding depressed the liquid phase movement.
A new equation was deduced for liquid film thickness, and better predictions were achieved. Compared with referenced models, the best accuracies were achieved, with error of ±30%. Considering that the dimensionless numbers, such as the gas Weber number and viscosity number, are functions of gas phase properties determined by pressure and temperature, we proved that the new equation can give good predictions of liquid film thickness over a great range of pressures.
The pressure influence on gas-wall friction factor was studied. For the air fluid flow at atmosphere, the test results were in accordance with referenced experiments. For the compressed air fluid flow in a horizontal pipe, a new equation for gas-wall friction factor was deduced and good prediction was achieved. New equations for interfacial friction factor were proposed and good predictions were tested. Compared with fluid Reynolds numbers’ influence on interfacial friction factor, dimensionless numbers and film thickness play a much more important role in its precise prediction. A new equation for liquid-wall friction factor was deduced, and good prediction was verified finally.

Author Contributions

Methodology, Y.W.; writing—original draft preparation, Y.W.; writing—review and editing, Y.Y., Z.L., Y.C. and X.Z.; project administration, Q.W. All authors have read and agreed to the published version of the manuscript.

Funding

This research was funded by Shandong Provincial Science and Technology Plan Project (No.2023TSGC0625) and Natural Resources Defense Council (NRDC, K94).

Data Availability Statement

Data are contained within the article.

Acknowledgments

The authors wish to acknowledge the reviewers for the helpful remarks in improving this paper.

Conflicts of Interest

Author Qiming Wang was employed by the Weihai Haihe Technology Co., Ltd. The remaining authors declare that the research was conducted in the absence of any commercial or financial relationships that could be construed as a potential conflict of interest.

Abbreviations

NomenclatureVGSGas superficial velocity
ACross-sectional areaVLSLiquid superficial velocity
DPipe inner diameter
fFriction factorGreek symbols
PPressureρDensity
SPerimeterαVoid fraction
tTimeμViscosity
UAverage velocity in x directionσSurface tension
xX-axis of Cartesian coordinate systemτShear stress
hLLiquid film thickness
FrFroude numberSubscripts
NμViscosity numberGGas phase
ReReynolds numberiInterface
WeWeber numberLLiquid phase

References

  1. Mandhane, J.M.; Gregory, G.A.; Aziz, K. A flow pattern map for gas-liquid flow in horizontal pipes. Int. J. Multiph. Flow 1974, 1, 537–553. [Google Scholar] [CrossRef]
  2. Zou, S.; Guo, L.; Yao, T. Upstream-flow-based mechanisms for global flow regime transition of gas/liquid two-phase flow in pipeline-riser systems. Chem. Eng. Sci. 2021, 240, 116542. [Google Scholar] [CrossRef]
  3. Zou, S.; Guo, L.; Yao, T.; Li, W.; Wu, Q.; Zhou, H.; Xie, C.; Liu, W.; Kuang, S. NonUniformity of Gas/Liquid Flow in a Riser and Impacts of Pipe Configuration and Operation on Slugging Characteristics. Exp. Therm. Fluid Sci. 2018, 96, 329–346. [Google Scholar] [CrossRef]
  4. Taitel, Y.; Dukler, A.E. A model for predicting flow regime transitions in horizontal and near horizontal gas liquid flow. AIChE J. 1976, 22, 47–55. [Google Scholar] [CrossRef]
  5. Agrawal, S.S.; Gregory, G.A.; Govier, G.W. An analysis of horizontal stratified two-phase flow in pipes. Can. J. Chem. Eng. 1973, 51, 280–287. [Google Scholar] [CrossRef]
  6. Johnson, G.W.; Bertelsen, A.F.; Nossen, J. A Mechanistic Model for Roll Waves for Two-Phase Pipe Flow. AIChE J. 2009, 55, 2788–2795. [Google Scholar] [CrossRef]
  7. Shi, S.; Wu, X.; Han, G.; Zhong, Z.; Li, Z.; Sun, K. Numerical slug flow model of curved pipes with experimental validation. ACS Omega 2019, 4, 14831–14840. [Google Scholar] [CrossRef]
  8. Rodrigues, H.T.; Pereyra, E.; Saricai, C. Pressure Effects on Low-Liquid-Loading Oil/Gas Flow in Slightly Upward Inclined Pipes: Flow Pattern, Pressure Gradient, and Liquid Holdup. SPE J. 2019, 24, 191543. [Google Scholar] [CrossRef]
  9. Rodrigues, H.T.; Pereyra, E.; Sarica, C. A model for the thin film friction factor in near-horizontal stratified-annular. Int. J. Multiph. Flow 2018, 102, 29–37. [Google Scholar] [CrossRef]
  10. Fan, Y.; Sarica, C. Onset of Liquid-Film Reversal in Upward-Inclined Pipes. SPE J. 2018, 23, 1630–1647. [Google Scholar] [CrossRef]
  11. Wu, X.; Moin, P. A direct numerical simulation study on the mean velocity characteristics in turbulent pipe flow. J. Fluid Mech. 2008, 608, 81–112. [Google Scholar] [CrossRef]
  12. Baea, B.; Kima, H.; Kimb, K.; Jeong, J.J.; Yun, B. Force balance droplet entrainment model for the horizontal stratified flow condition. Int. J. Heat Mass Transf. 2021, 165, 120726. [Google Scholar] [CrossRef]
  13. Vollestad, P.; Angheluta, L.; Jensena, A. Experimental study of secondary flows above rough and flat interfaces in horizontal gas-liquid pipe flow. Int. J. Multiph. Flow 2020, 125, 103235. [Google Scholar] [CrossRef]
  14. Taitel, Y.; Dukler, A.E. A theoretical approach to the Lockhart Martinelli correlation for stratified flow. Int. J. Multiph. Flow 1976, 2, 477–485. [Google Scholar] [CrossRef]
  15. Kowalski, J.E. Wall and interfacial shear stress in stratified flow in a horizontal pipe. AIChE J. 1987, 33, 274–281. [Google Scholar] [CrossRef]
  16. Spedding, P.L.; Hand, N.P. Prediction in stratified gas-liquid co-current flow in horizontal pipelines. Int. J. Heat Mass Transf. 1997, 40, 1923–1935. [Google Scholar] [CrossRef]
  17. Haland, S.E. Simple and explicit formulas for the friction factor in turbulent pipe flow. J. Fluids Eng. 1983, 105, 89–90. [Google Scholar] [CrossRef]
  18. Kim, H.G.; Kim, S.M. Experimental investigation of flow and pressure drop characteristics of air-oil slug flow in a horizontal tube. Int. J. Heat Mass Transf. 2022, 183, 122063. [Google Scholar] [CrossRef]
  19. Ayati, A.A.; Kolaas, J.; Jensen, A.; Johnson, G.W. A PIV investigation of stratified gas-liquid flow in a horizontal pipe. Int. J. Multiph. Flow 2014, 55, 129–143. [Google Scholar] [CrossRef]
  20. Mascarenhas, N.; Lee, H.; Mudawar, I. Experimental and computational investigation of interfacial shear along a wavy two-phase interface. Int. J. Heat Mass Transf. 2015, 85, 265–280. [Google Scholar] [CrossRef]
  21. Belt, R.J.; Van’tWestende, J.M.C.; Portela, L.M. Prediction of the interfacial shear stress in vertical annular flow. Int. J. Multiph. Flow 2009, 35, 689–697. [Google Scholar] [CrossRef]
  22. Ju, P.; Brooks, C.S.; Ishii, M.; Liu, Y.; Hibiki, T. Film Thickness of vertical upward cocurrent adiabatic flow in pipes. Int. J. Heat Mass Transf. 2015, 85, 985–995. [Google Scholar] [CrossRef]
  23. Ju, P.; Liu, Y.; Brooks, C.S.; Ishii, M. Prediction of interfacial shear stress of vertical upward adiabatic annular flow in pipes. Int. J. Heat Mass Transf. 2019, 133, 500–509. [Google Scholar] [CrossRef]
  24. Ju, P.; Liu, Y.; Yang, X.; Ishii, M. Wave characteristics of vertical upward adiabatic annular flow in pipes. Int. J. Heat Mass Transf. 2019, 145, 118701. [Google Scholar] [CrossRef]
  25. Aliyu, A.M.; Baba, Y.D.; Lao, L.; Yeung, H.; Kim, K.C. Interfacial friction in upward annular gas-liquid two-phase flow in pipes. Exp. Therm. Fluid Sci. 2017, 84, 90–109. [Google Scholar] [CrossRef]
  26. Sawant, P.; Ishii, M.; Mori, M. Droplet entrainment correlation in vertical upward co-current annular two-phase flow. Nucl. Eng. Des. 2008, 238, 1342–1352. [Google Scholar] [CrossRef]
Figure 1. Sketch of gas-liquid stratified flow in a horizontal pipe.
Energies 17 01056 g001
Figure 2. Schematic of high-pressure gas-liquid two-phase flow test loop.
Energies 17 01056 g002
Figure 3. Flow pattern map of gas-liquid two-phase flow in horizontal pipe at different pressure. (a) 0.1 MPa, (b)1.0 MPa, (c) 2.0 MPa.
Energies 17 01056 g003
Figure 4. Stratified flow with a small wave in horizontal pipe at high pressure.
Energies 17 01056 g004aEnergies 17 01056 g004b
Figure 5. Stratified flow with large wave in horizontal pipe at high pressure.
Energies 17 01056 g005aEnergies 17 01056 g005b
Figure 6. Liquid film thickness distribution at different pressures. (a) 1.0 MPa, (b) 2.0 MPa.
Energies 17 01056 g006aEnergies 17 01056 g006b
Figure 7. Different variables following dimensionless film thickness.
Energies 17 01056 g007
Figure 8. Film thickness in air-water two-phase flow at high pressure. (a) Dimensionless film thickness following dimensionless variables. (b) Comparison between experimental and calculated film thickness.
Energies 17 01056 g008
Figure 9. Gas-wall friction factor in horizontal pipe at different pressures. (a) Comparison of gas-wall friction factor between different models: Kowalski, 1987 [15], Haland, 1983 [17], Taitel and Dukler, 1976 [14]. (b) Comparison of gas-wall friction factor at high pressure between experimental data and new model.
Energies 17 01056 g009
Figure 10. Dimensionless number distribution with interfacial friction factor. (a) Both fluid Reynolds numbers vs. interfacial friction factor. (b) Liquid phase dimensionless numbers vs. interfacial friction factor. (c) Gas phase dimensionless numbers vs. interfacial friction factor.
Energies 17 01056 g010aEnergies 17 01056 g010b
Figure 11. Interfacial friction factor in air-water two-phase flow at high pressure. (a) Comparison of interfacial friction factor between different models: Kowalski, 1987 [15], Spedding, 1997 [16]. (b) Comparison of interfacial friction factor between experimental data and newly proposed models.
Energies 17 01056 g011
Figure 12. Liquid-wall friction factor in air-water two-phase flow at high pressure. (a) Comparison of liquid-wall friction factor between different models: Kowalski, 1987 [15], Spedding, 1997 [16], Kim, 2022 [18]. (b) Comparison of liquid-wall friction factor between experimental data and newly proposed model.
Energies 17 01056 g012
Table 1. Reported friction factors’ correlations in references.
Author(s)Equation
Agrawal et al. [5] f G = 0.079 R e G 0.25 , R e G > 2100
Taitel & Dukler [14] f k = 16 R e k 1 ,   R e k < 2100 , k = G, L
f k = 0.046 R e k 0.2 , R e k > 2100 , k = G, L
Haland [17] 1 f k = 1.8 log 10 6.9 R e k + K 3.7 D 1.11 , k = G, L
Kowalski [15] f L = 0.263 α L R e L S 0.5
f i = 7.5 × 10 5 α L 0.25 R e G 0.3 R e L 0.83
Spedding & Hand [16] f L = 0.0262 α L R e L S 0.139
f i = f G S 1.76 V G S 6 + k i , k i = 2.7847 log 10 V L S V L S + 6 + 7.8035
Aliyu et al. [25] f i = f s 1 + 0.3 h L D 0.12 R e G 0.54 F r G 1.2 1.5 ,   f s = 0.046 R e G 0.2
Ju et al. [24] f i = 0.0028 + 4.28 N μ L 1.44 F r G 0.25 W e G 0.53 W e L 0.28
Kim & Kim [18] f k = 16 R e k 1 ,   R e k < 2100
1 f k = 1.8 log 10 6.9 R e k   , R e k > 2100
Table 2. Overview of the operating ranges and parameters of fluids.
MeasurementOperating RangeMeasurement DeviceRelative Uncertainty
Liquid mass flow1.18–17.74 kg/minRHEONIK RHE 080.68%
Gas mass flow0.41–9.26 kg/minRHEONIK RHE 081.02%
Pressure0–2 MPaRosemount 3051TG Transmitter1.02%
Temperature0–50 °CT-type armored thermocouple3.22%
Pressure drop−200–200 PaHoneywell STD 820 Transmitter0.31%
Disclaimer/Publisher’s Note: The statements, opinions and data contained in all publications are solely those of the individual author(s) and contributor(s) and not of MDPI and/or the editor(s). MDPI and/or the editor(s) disclaim responsibility for any injury to people or property resulting from any ideas, methods, instructions or products referred to in the content.