Article

Development of Shift Map for Electric Commercial Vehicle and Comparison Verification of Pneumatic 4-Speed AMT and 4-Speed Transmission with Synchronizer in Simulation

1
Platform Safety Technology R&D Department, Korea Automotive Technology Institute, 303 Pungse-ro, Cheonan-si 31214, Republic of Korea
2
Department of Mechanical Engineering, Sungkyunkwan University, 2066 Seobu-ro, Suwon-si 16419, Republic of Korea
3
Vehicle Platform Team, Jeonbuk Institute of Automotive Convergence Technology, 6 Dongjangsan 2-gil, Gunsan-si 54158, Republic of Korea
*
Authors to whom correspondence should be addressed.
Energies 2024, 17(5), 1038; https://doi.org/10.3390/en17051038
Submission received: 30 January 2024 / Revised: 16 February 2024 / Accepted: 17 February 2024 / Published: 22 February 2024
(This article belongs to the Special Issue Performance Analysis and Simulation of Electric Vehicles)

Abstract

:
As the automotive industry transitions from internal combustion engine vehicles to the era of electric cars, extensive research is being conducted in the field of electric vehicles. While a significant portion of this research focuses on the electrification of passenger cars, commercial vehicles have experienced relatively modest changes towards electric propulsion. Particularly, challenges related to power and efficiency have prompted a concentrated effort in addressing these issues. However, improvements in the efficiency of motors and inverters are reaching their limits, necessitating the development of multi-speed transmissions for electric commercial vehicles to enhance overall system efficiency. In this paper, the development of a 4-speed transmission with a synchronizer designed for electric commercial vehicles is presented as part of a project. A transmission shift map was developed, and verification of increased power and efficiency was conducted through a comparison with the existing product (a pneumatic 4-speed internal combustion engine transmission) installed in the target commercial vehicle. The study utilized vehicle dynamics, component modeling, and simulation environments to assess the improvements in performance.

1. Introduction

The automotive industry is currently undergoing a transition from the era of internal combustion engines to the electric vehicle era [1,2,3]. This shift towards electrification is not limited to passenger cars: it extends to commercial vehicles as well [4,5,6]. In line with this trend, extensive research and development have been conducted on motors, inverters, reducers, etc. resulting in significant improvements in power and efficiency [7,8]. Particularly, there is a considerable focus on efficiency studies related to motors and inverters [9,10,11].
However, the unique characteristics of commercial vehicles, which require high torque at low speeds, pose challenges when using a combination of a motor and a single-speed reducer [12,13]. Increasing the reduction ratio for high torque results in reduced efficiency and torque at high speeds, while increasing the size of the motor to enhance torque leads to decreased efficiency and the disadvantages of increased weight and cost [14,15]. For these reasons, research on multi-speed transmissions for commercial electric vehicles, including optimization of gear ratios, modeling, validation of transmission and simulation, is also underway [16,17,18].
Additionally, beyond the simple design of multi-speed transmissions, there is concurrent research and design of transmission logic and shift maps, taking into account the motor’s efficiency and torque–speed (T-N) curves [19]. When developing vehicles with a sports-oriented character, shift maps are crafted based on performance objectives. In contrast, for vehicles emphasizing efficiency, shift maps are developed with an efficiency-centric focus. Alternatively, there is ongoing development of shift maps and transmission logic that optimally consider both performance and efficiency [20,21,22]. Diverse research initiatives are currently underway to validate transmission logic and shift maps tailored to the specific objectives of the vehicle [23].
The pneumatic 4-speed AMT installed in the target vehicle of this paper was equipped with an internal combustion engine transmission, so the shift map was not optimized for the motor’s T-N curve and the gearbox only met the vehicle’s climbing torque requirements. Additionally, it consisted of dog clutches and pneumatics, resulting in a shifting time that was approximately 1.5 s longer.
The 4-speed transmission presented in this paper was developed to overcome the limitations mentioned above. Specifically, the 4-speed transmission with a synchronizer developed in the project enhances shifting time, the overall torque and power of commercial vehicles equipped with low-torque and low-power motors, aiming to improve the efficiency of the vehicle. Through simulation and performance comparison between the existing pneumatic 4-speed automated manual transmission (AMT) used in commercial vehicles with internal combustion engines and the newly developed 4-speed transmission with synchronizer, the efficiency and performance of the 4-speed transmission with synchronizer were validated.
In this paper, we verify the design feasibility of the newly developed 4-speed gearbox with synchronizer applied through comparative simulations with the existing gearbox, and assess the efficiency improvement from a vehicle perspective.
Prior to simulation, various tests were conducted to understand the performance and logic of the existing pneumatic 4-speed AMT and new 4-speed transmission with synchronizer, obtaining reduction ratios, shift maps and shifting time. Longitudinal dynamic modeling of the vehicle, modeling of other electric vehicle components (motor, battery), vehicle control unit (VCU), and driver inputs were emulated using Matlab/Simulink 2021a for simulation. Figure 1a shows a pneumatic 4-speed AMT and Figure 1b a 4-speed transmission with synchronizer that is newly developed. Each transmission’s specifications are listed in Table 1.
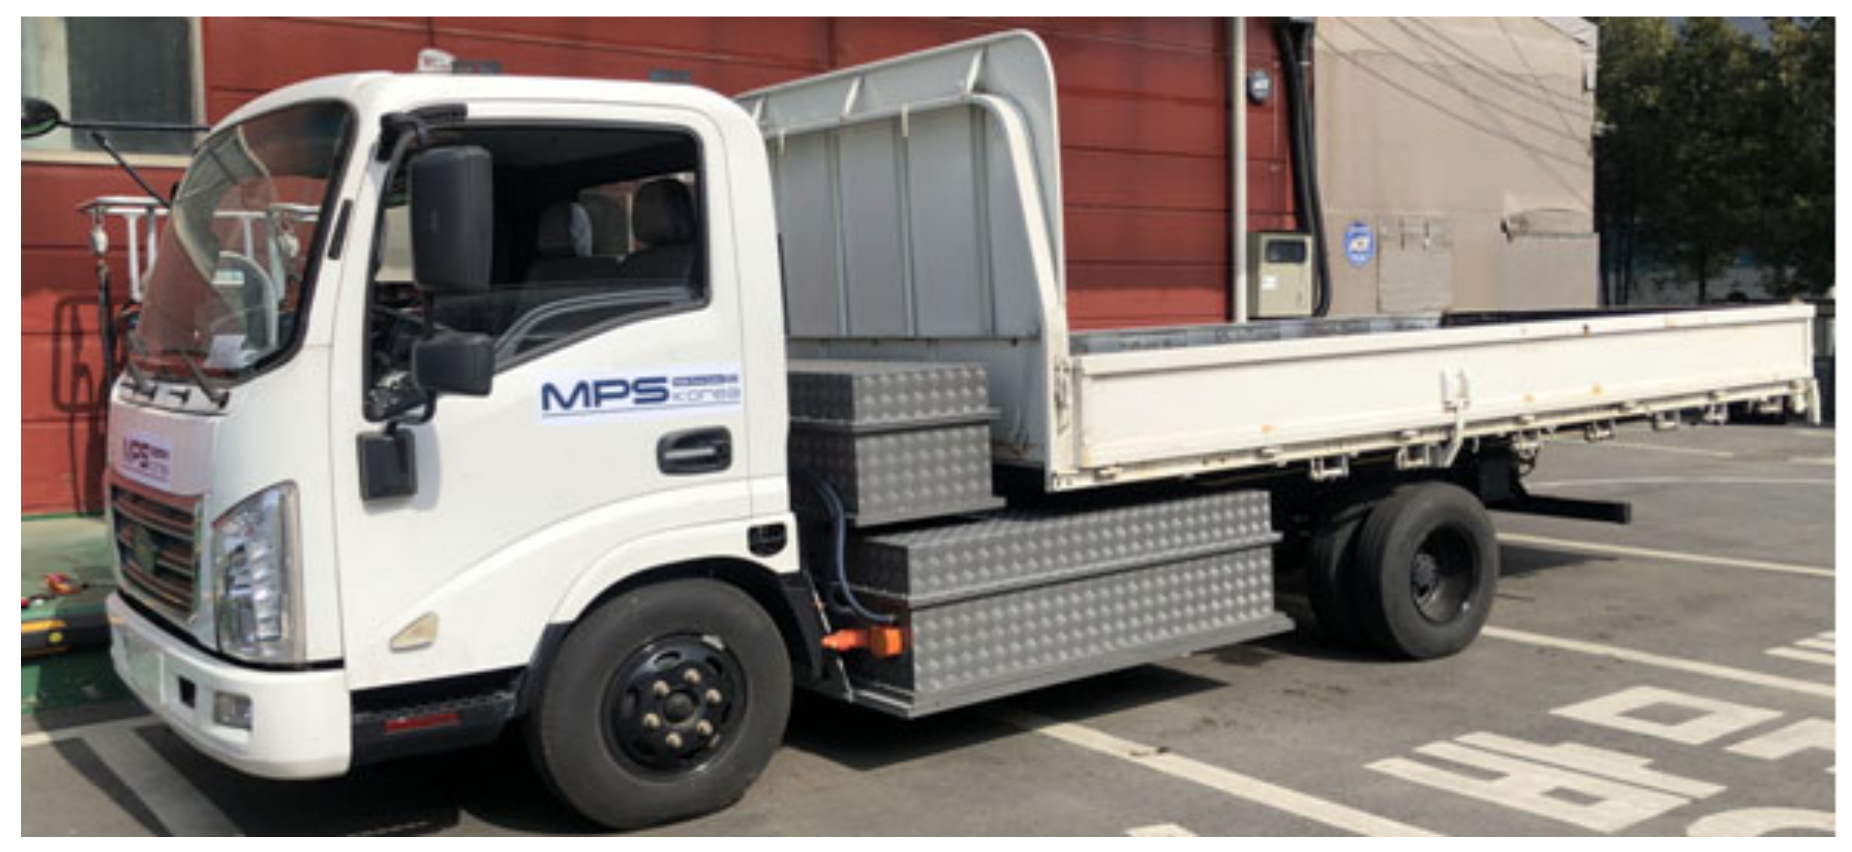
The target vehicle for the developed transmission is a compact electric truck, which has been transformed from a conventional internal combustion engine commercial vehicle platform into an electric commercial vehicle, as shown in Figure 2. This vehicle is designed for medium-duty applications with a payload capacity of approximately 2.5 tons. The dimensions of the vehicle are as follows: width (b) 2080 mm, height (h) 2345 mm, and length (L) 5370 mm. Table 2 lists the specifications of the target vehicle.

2. Vehicle Experiment and Modeling

2.1. Experiments of Target Vehicle and Unit Tests

To facilitate a comparison between the newly developed 4-speed transmission with synchronizer and the existing pneumatic 4-speed AMT, real-world driving data were utilized to understand the shift map of the pneumatic 4-speed AMT and vehicle longitudinal dynamic characteristics such as resistance.
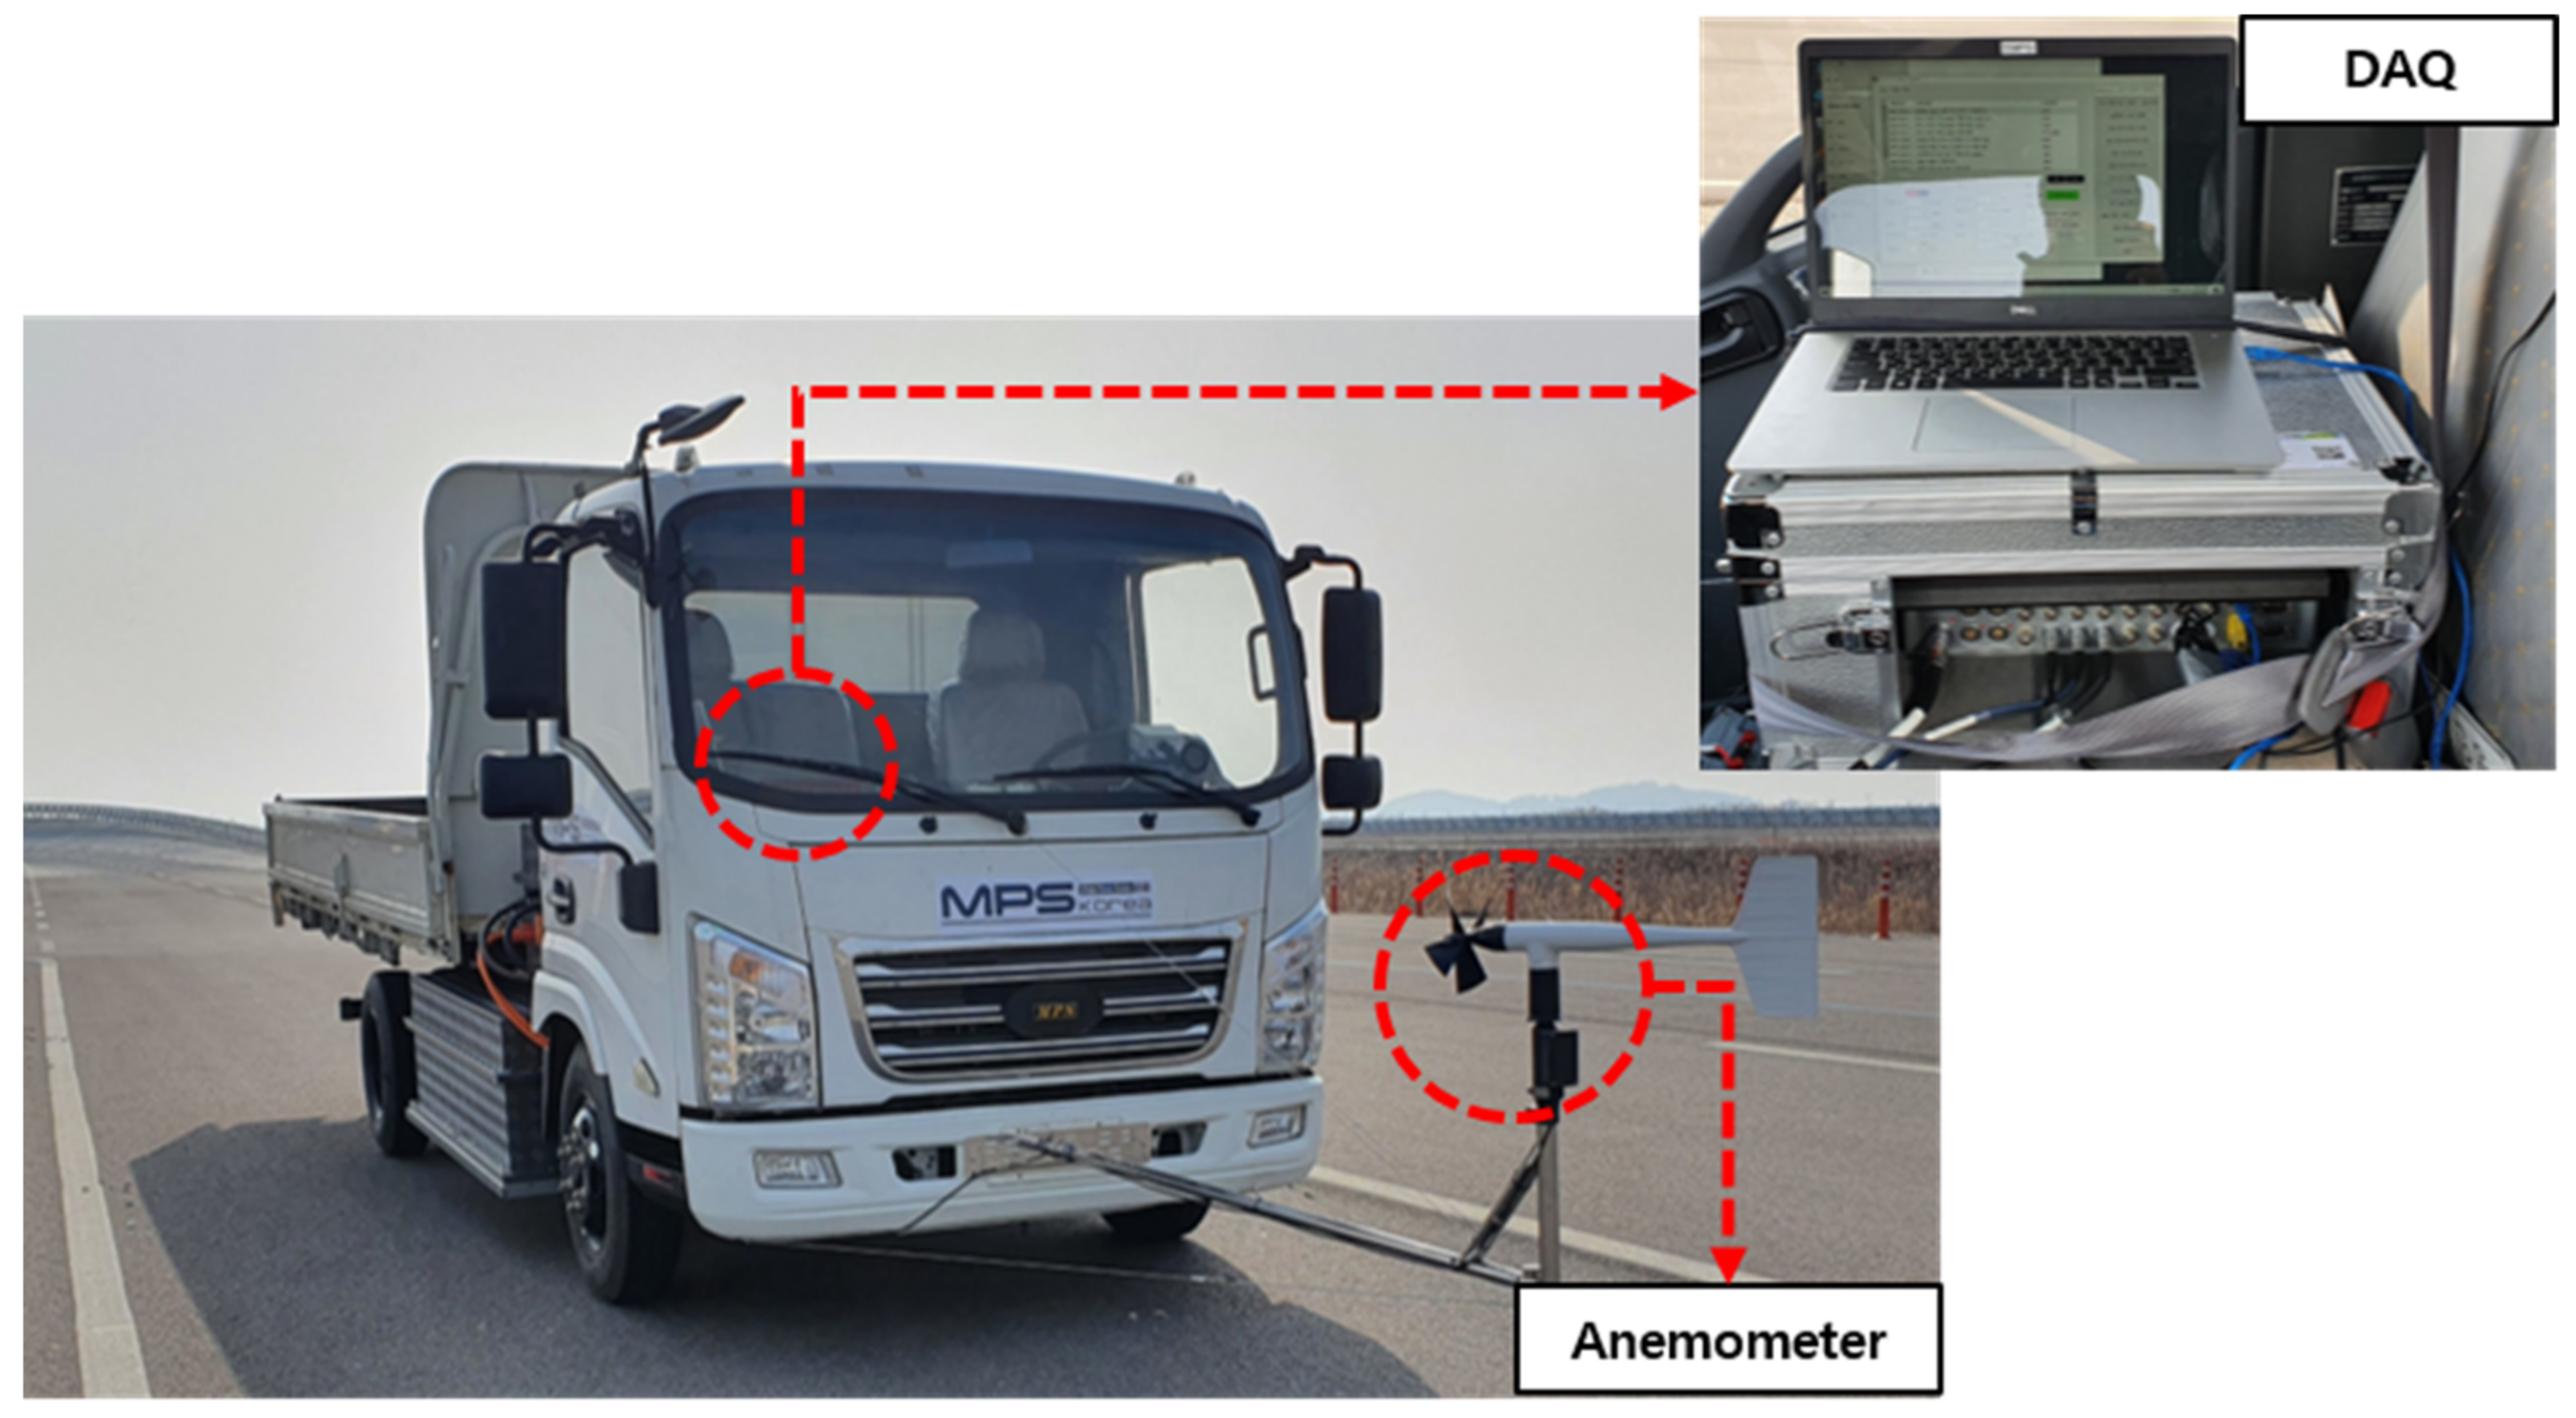
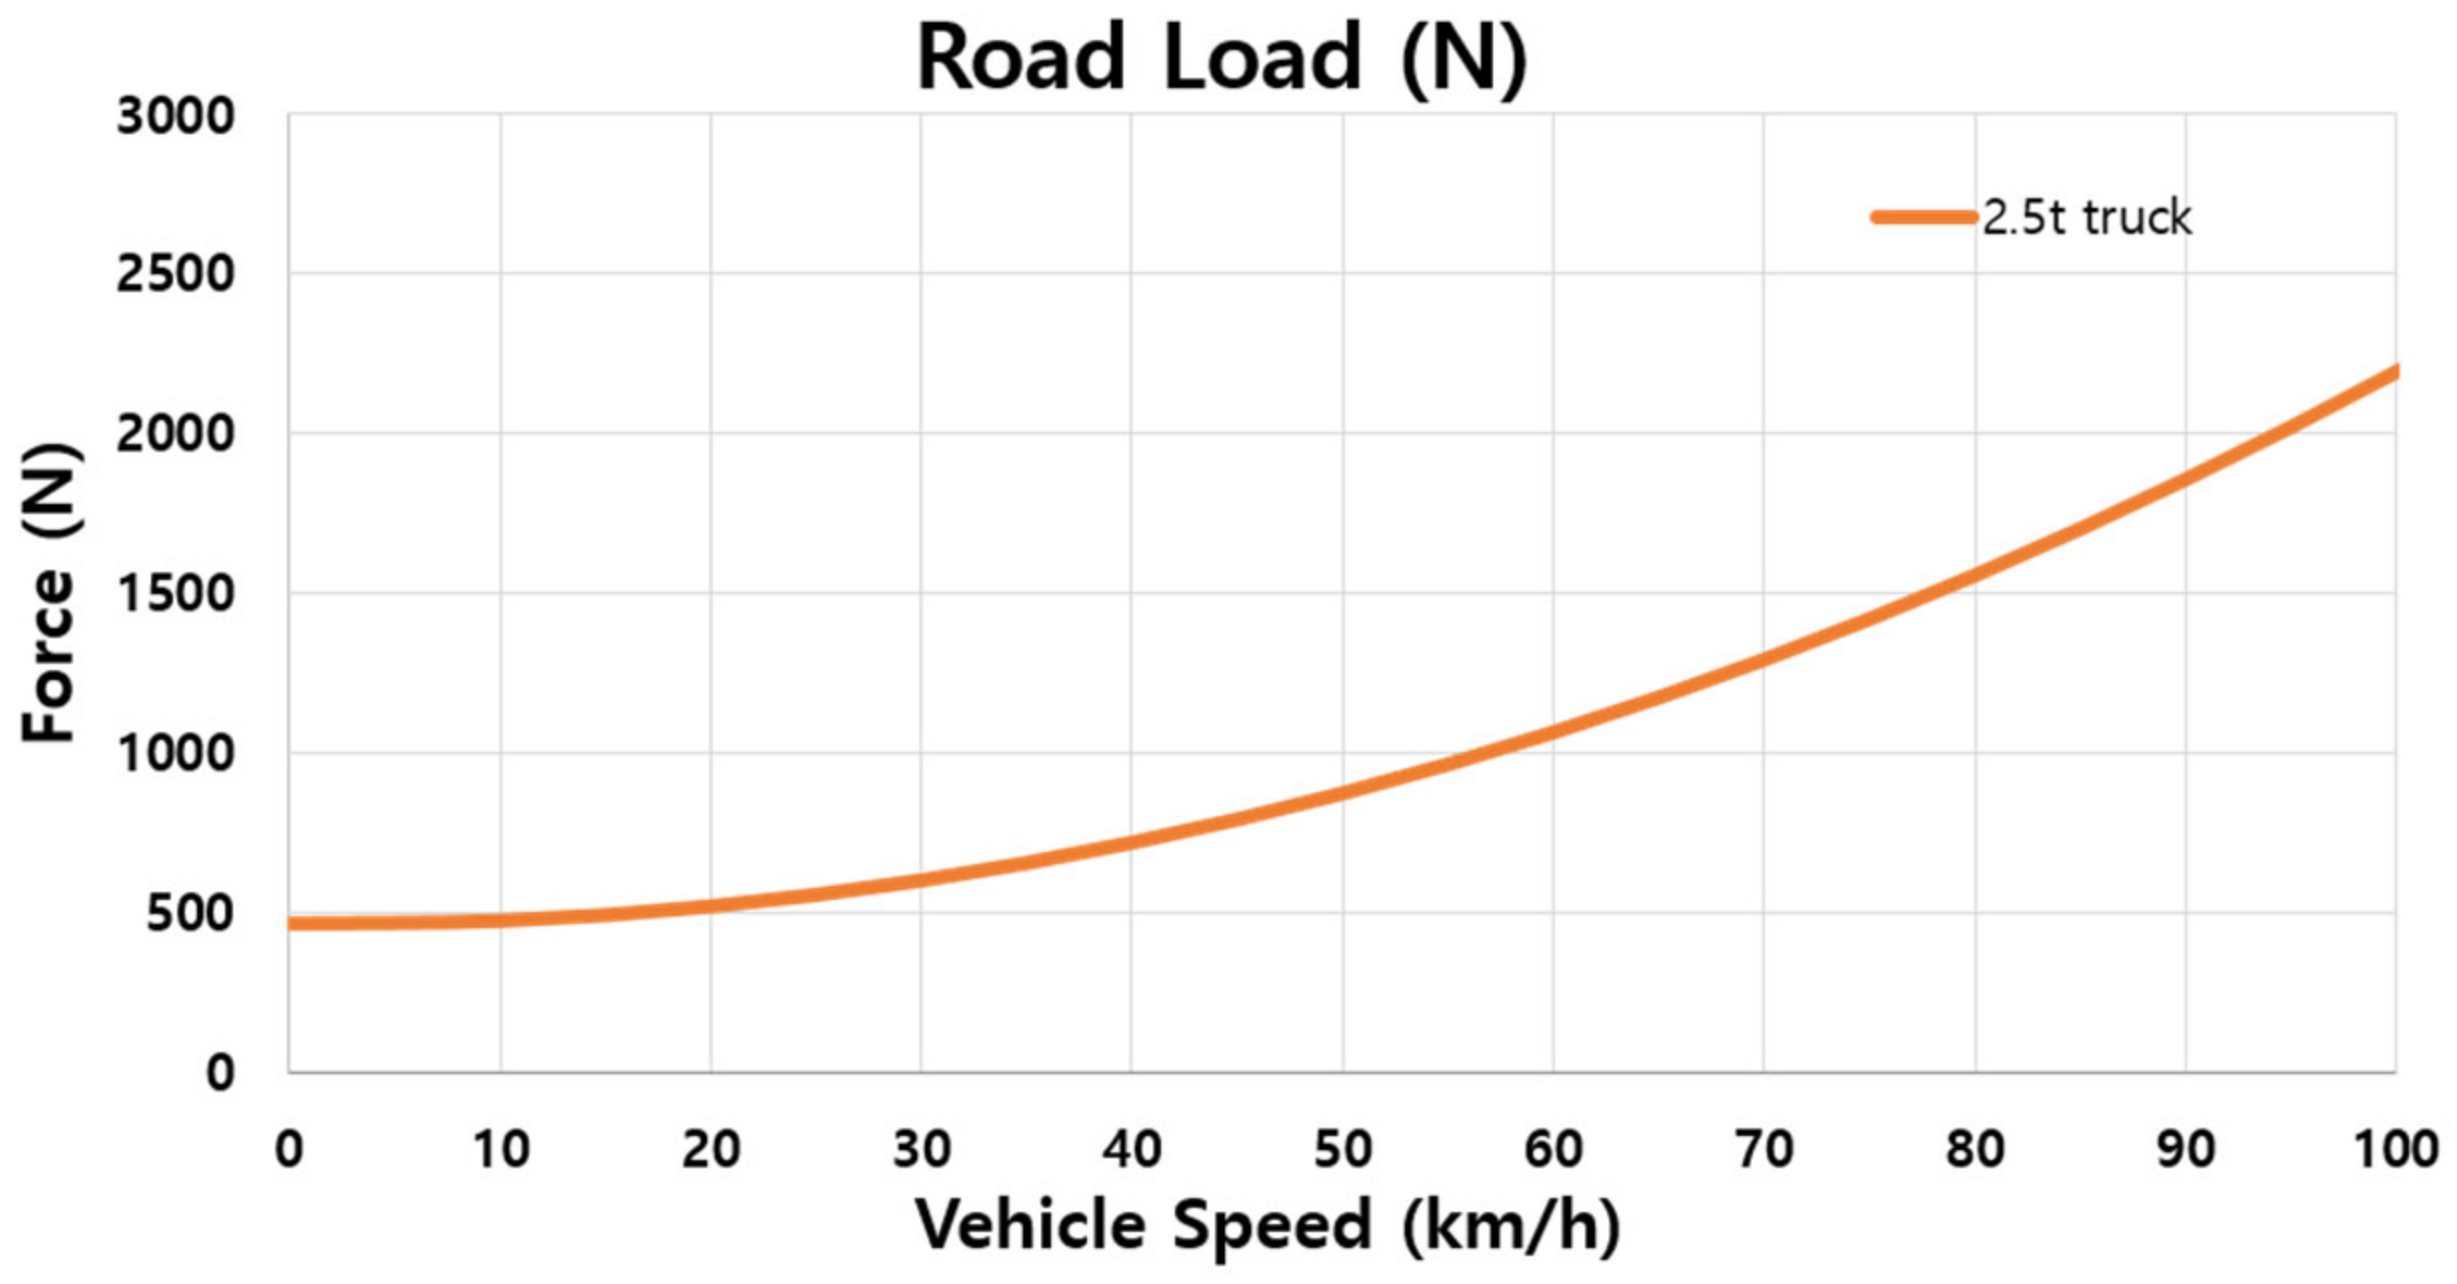
For the measurement of data related to longitudinal dynamic modeling of driving resistance, inertial driving tests were conducted. Using vehicle speed sensors and wind direction/speed sensors, vehicle speed and wind conditions were measured. The test was conducted on a straight road with a round trip distance of 2.46 km, including approximately 1 km of inertial driving to collect data for measuring driving resistance coefficients. The test conditions are as shown in Table 3, and the test environment setup involved attaching sensors, as depicted in Figure 3. Based on the test data, the calculated driving resistance coefficients, as shown in Table 4, confirmed that the air resistance coefficient of resistance equation, C a e r o for the cross section area (3.9021 m 2 ), is 0.1534402 and the mechanical friction resistance coefficients A m e c h , B m e c h , C m e c h are 468.271, −0.95447, and 0.0286332. Road load is shown as Figure 4.
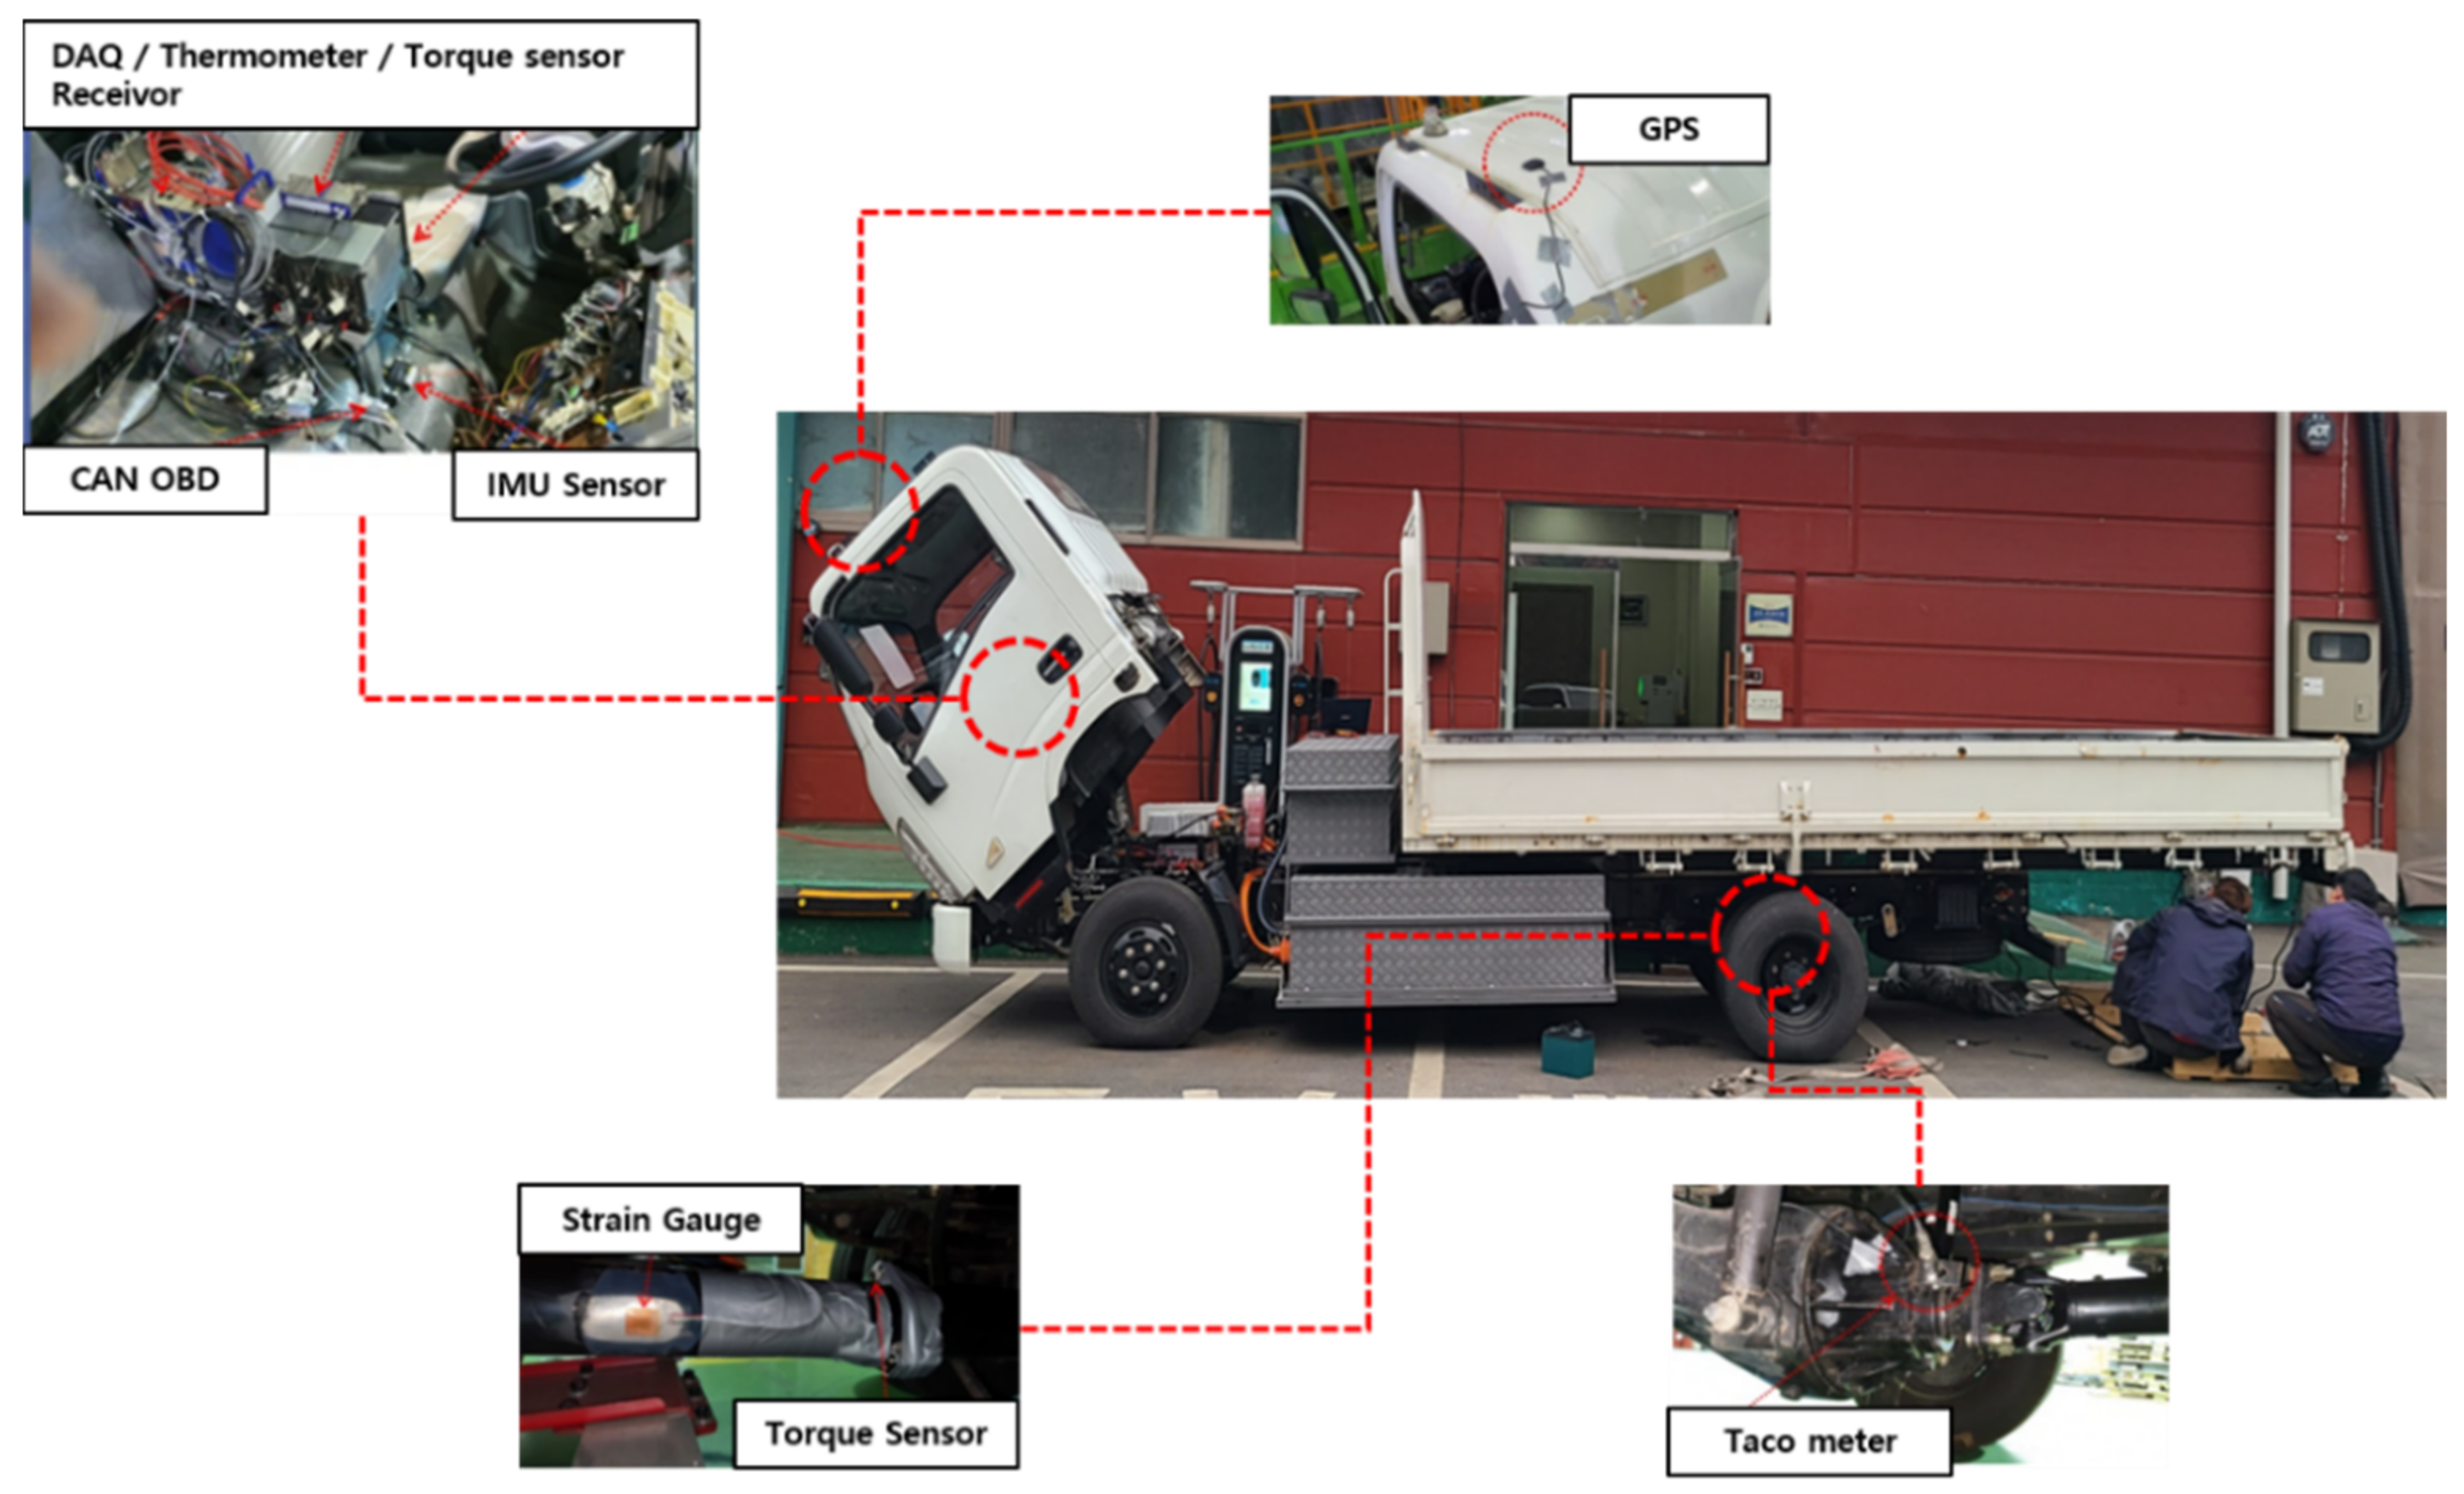
Furthermore, to determine the shift map and shifting time of the existing 4-speed AMT, tests were conducted by setting up the test environment as shown in Figure 5. Vehicle data were measured using a thermometer, torque sensor, IMU sensor, and GPS. Tests for extracting the shift map and determining the shifting time were conducted under various speed and driving conditions, as specified in Table 5. Used sensors list are shown in Table 6.
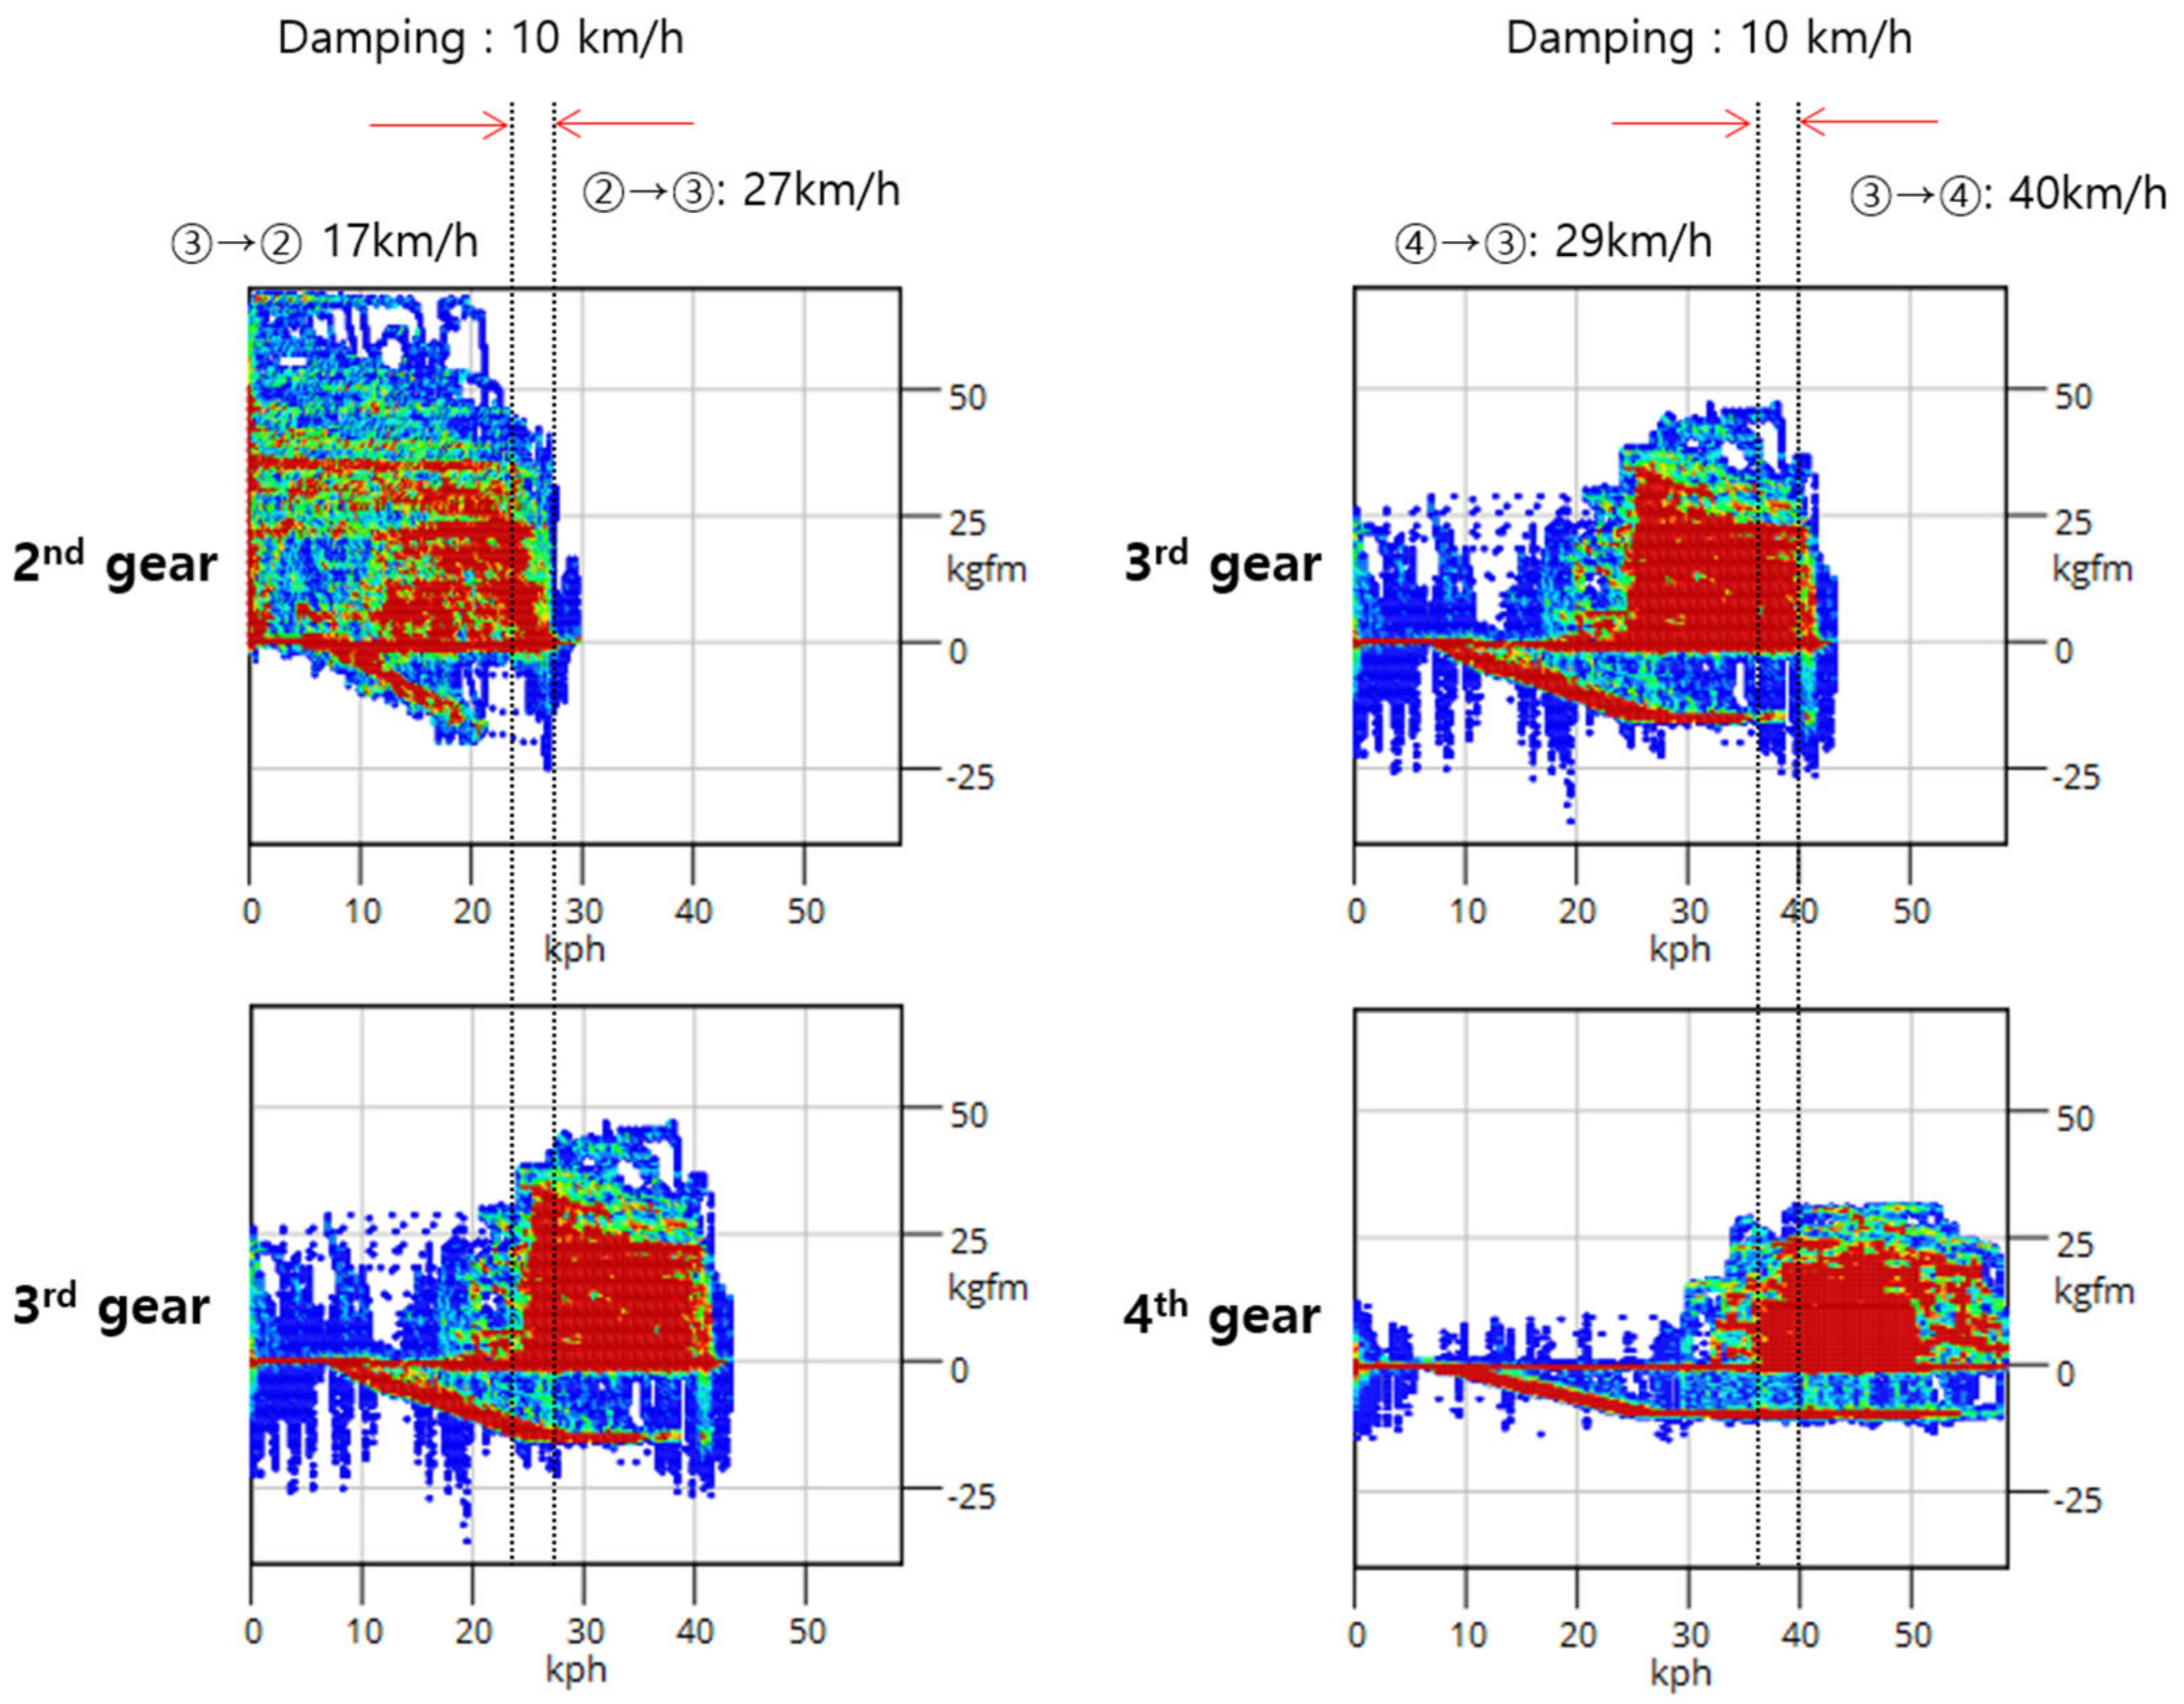
According to the analysis of the test data, the existing pneumatic 4-speed AMT exhibited a shift pattern confirmation based on the motor speed reaching a specific RPM, irrespective of the input accelerator pedal sensor (APS). Low-speed shifts were observed at a damping zone of 10 kph during high-speed shifts, as shown in Figure 6.
Additionally, the pneumatic 4-speed AMT with a dog clutch mechanism indicated a shifting time of approximately 1.5 s, as shown in Figure 7. The relatively longer shifting time was observed to result in a decrease in vehicle speed during the shifting interval. In Figure 7, the vehicle speed was examined with APS input at 100%, revealing a reduction of approximately 2 kph at the moment of shifting. This observation underscores the impact of the shifting process on the vehicle’s dynamic behavior, showcasing how the longer shifting time can lead to a temporary decrease in speed during the gear transition.
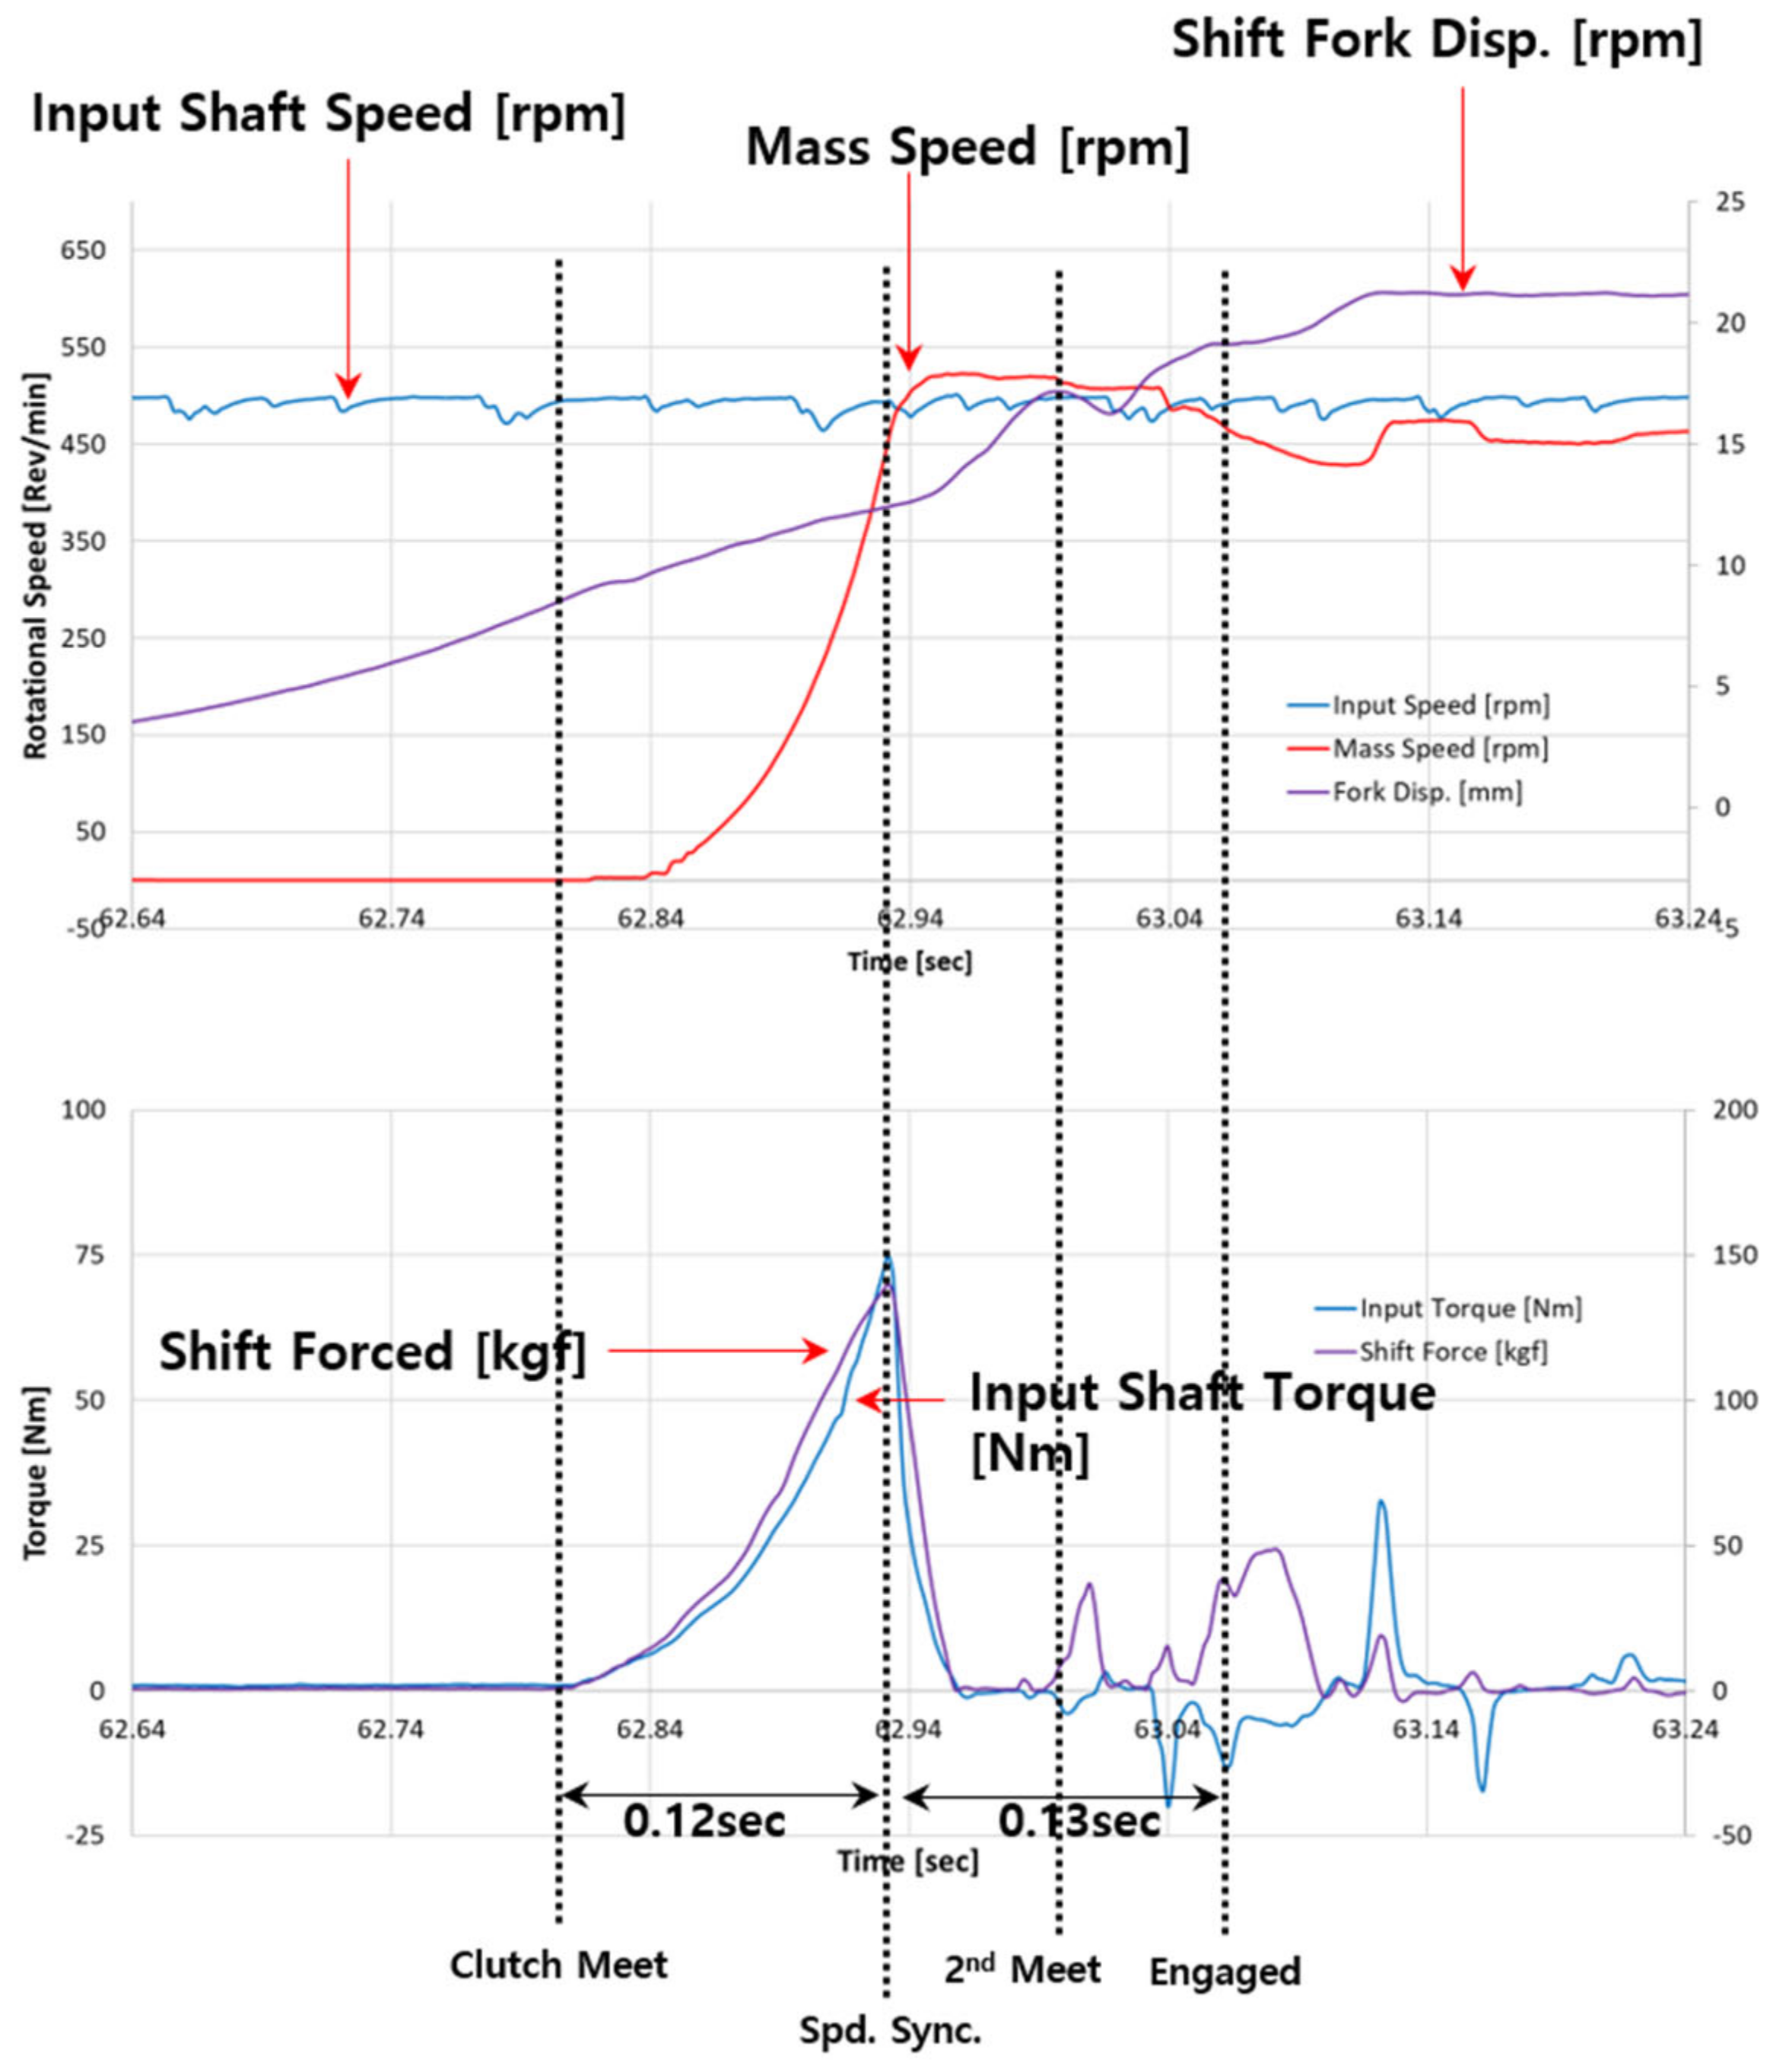
Moreover, in order to determine the shifting time of the 4-speed gearbox with synchronizers, prototype testing was conducted, as shown in Figure 8. The prototype was connected to a test bench to simulate input and load conditions, and experiments were carried out. Shifting occurred through the synchronizer-connected shift fork, and the determination of shift completion was based on the control of the shift fork’s displacement. Figure 9 presents the data on shift fork displacement, input RPM, and output RPM at a motor input of 500 RPM. It can be confirmed that the shifting process began around 62.8 s and completed at 63.08 s when the synchronizer was engaged. Through this testing environment, it was observed that the shifting time took a maximum of 0.3 s at each input speed.
Based on these findings, a comparative validation simulation environment was established.

2.2. Modeling of Longitudinal Vehicle Dynamics

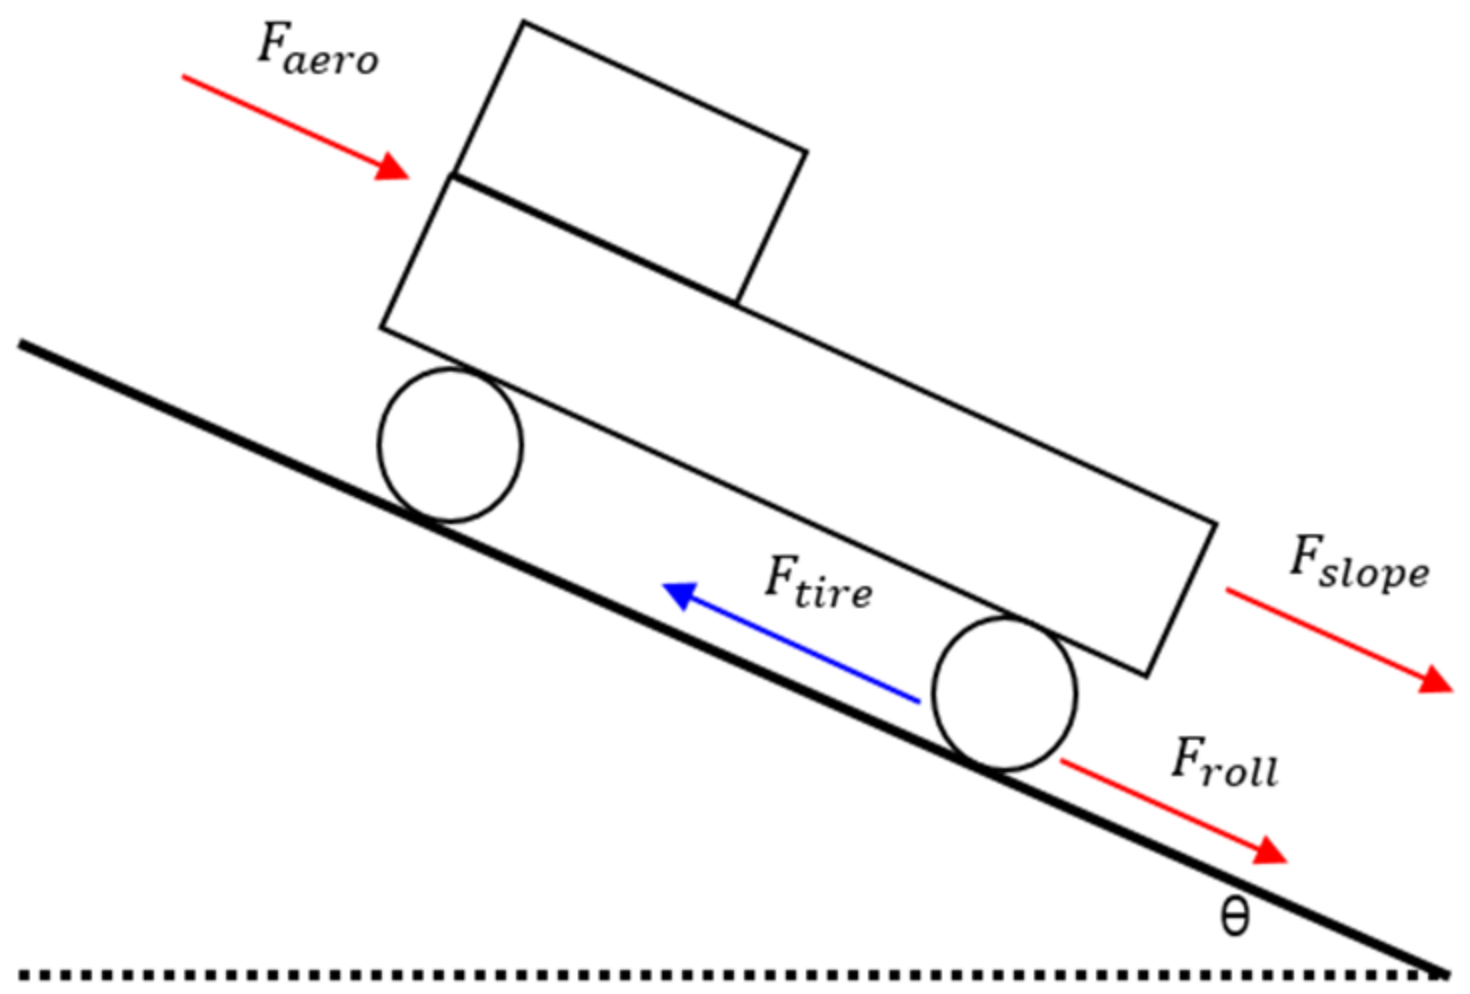
For the purpose of simulation, a longitudinal vehicle model was created, with the slip in the longitudinal direction being disregarded during the modeling process, as shown in Figure 10.
The vehicle’s acceleration used in Equation (1) is calculated as the sum of forces from tire forces, aerodynamic resistance, gradient resistance, and rolling resistance. Additionally, the tire forces are calculated considering longitudinal deceleration, tire effective rolling radius, drive torque, regenerative braking torque, and friction braking torque, used in Equation (2). Equations (3)–(5) are used to calculate aerodynamic resistance, rolling resistance and gradient resistance with vehicle parameters and driving conditions such as gradient degree, frontier projection area, coefficient of aerodynamic drag and air density. The vehicle constants involved in the vehicle dynamics equations are as shown in Table 7.
a = F t i r e F a e r o F r o l l F s l o p e M v e h
F t i r e = G f i n a l R t i r e × ( T p r o p T r e g e n T f r i c )
F a e r o = 1 2 × C d × ρ × A F × v 2
F r o l l = f r o l l × M v e h × g × cos θ
F s l o p e = M v e h × g × sin θ

2.3. Modeling of Battery, Motor, VCU, and Driver Input

2.3.1. Battery

In this study, we conducted simulations through simple battery modeling, with a focus on the longitudinal behavior and efficiency of the vehicle. Constants related to the battery were modeled using data applied in real vehicles as shown in Table 8. Equations (6) and (7) present the simple modeling of the battery to calculate voltage and SOC.
The charging and discharging currents of the battery were calculated by multiplying the power required by the motor by the efficiency of the motor. It is worth noting that the efficiency of the inverter was assumed to be 100% throughout the calculations.
V t represents the current battery output voltage. It is obtained by multiplying the total internal resistance of the battery by the current required by the motor and subtracting it from the battery’s internal voltage based on the current SOC. Additionally, the SOC of the battery is calculated by integrating the power used from the initially set SOC and dividing it by the total battery capacity, Q b a t .
V t = V o c ( t ) I R b a t
SOC ( t ) = S O C i n i t I ( t ) V o c ( t ) d t Q b a t

2.3.2. Motor

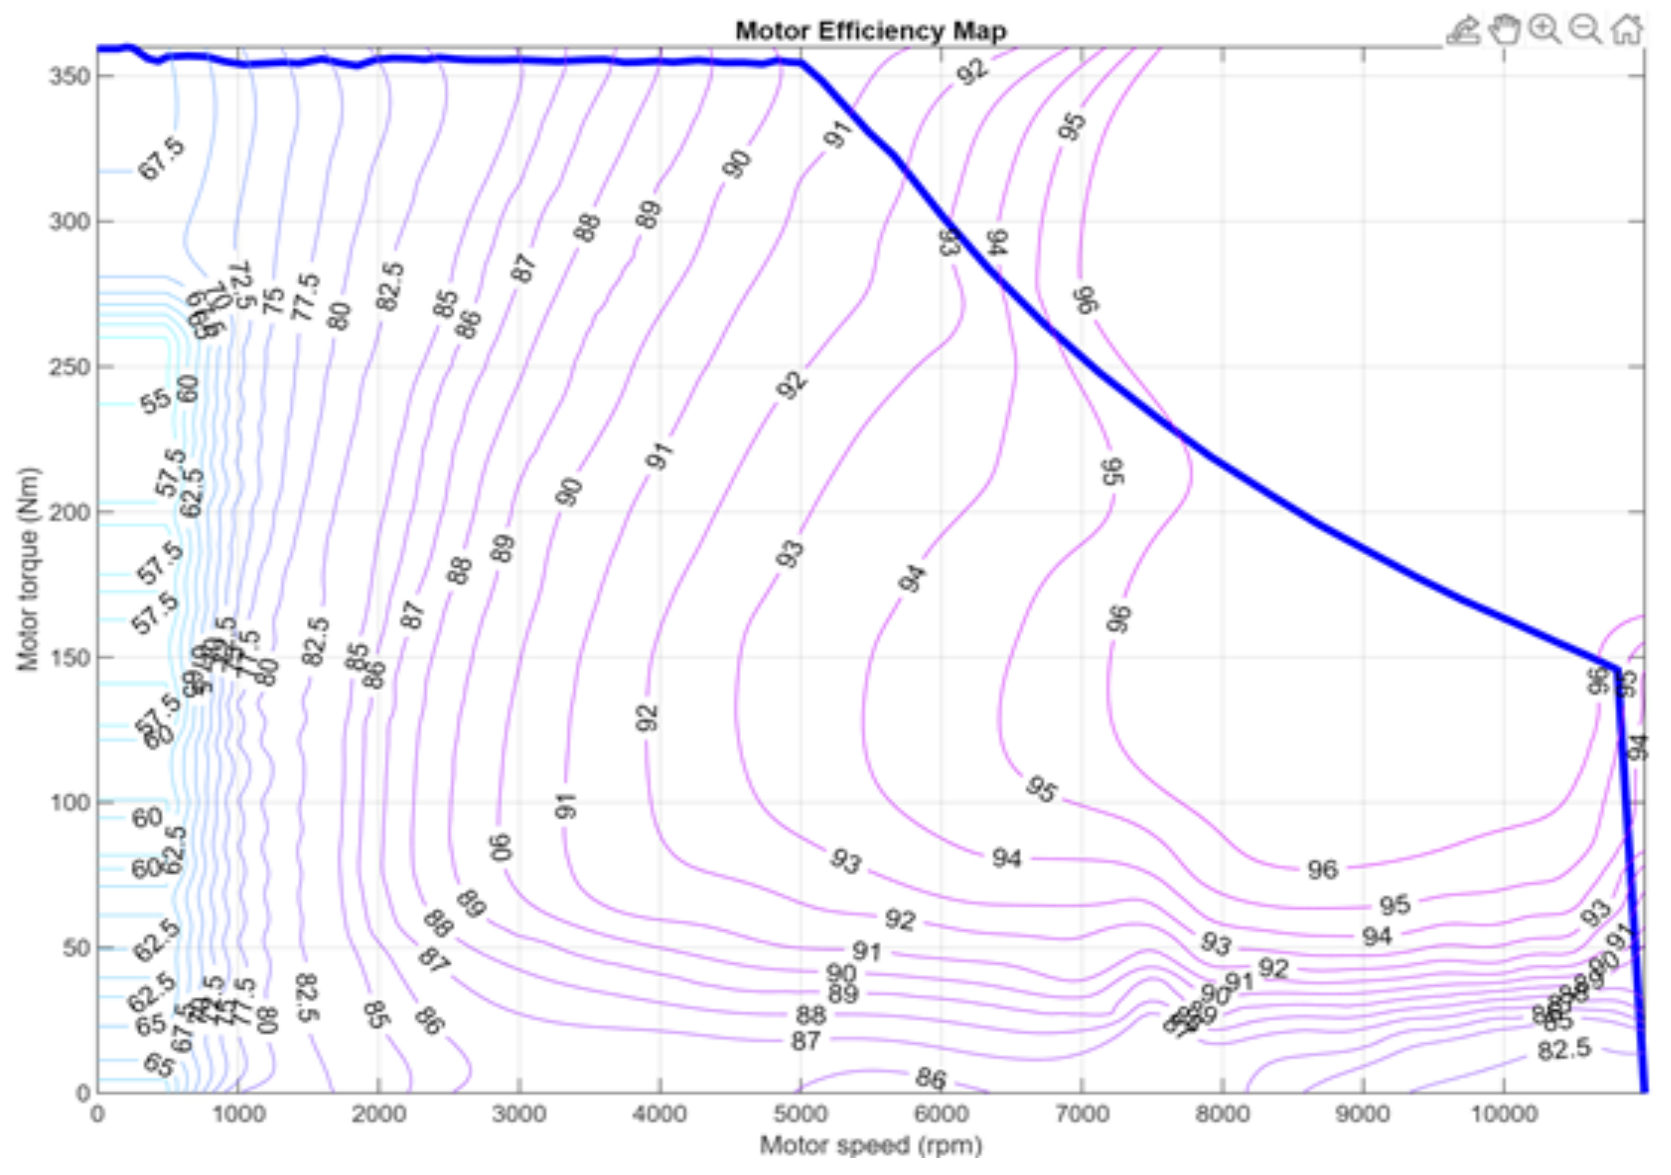
The motor applied to the target vehicle in this paper is a 100 kW motor with a maximum torque of 320 Nm. To model the motor, the T-N map and efficiency map of the motor in Figure 11 were utilized. The dynamic modeling of the motor was replaced with a first-order time-delay system in Equation (8) that receives torque commands and outputs torque based on the motor’s characteristics. Specifications of the drive motor are in Table 9.
G ( s ) = C ( s ) R ( s ) = 1 1 + T s

2.3.3. VCU

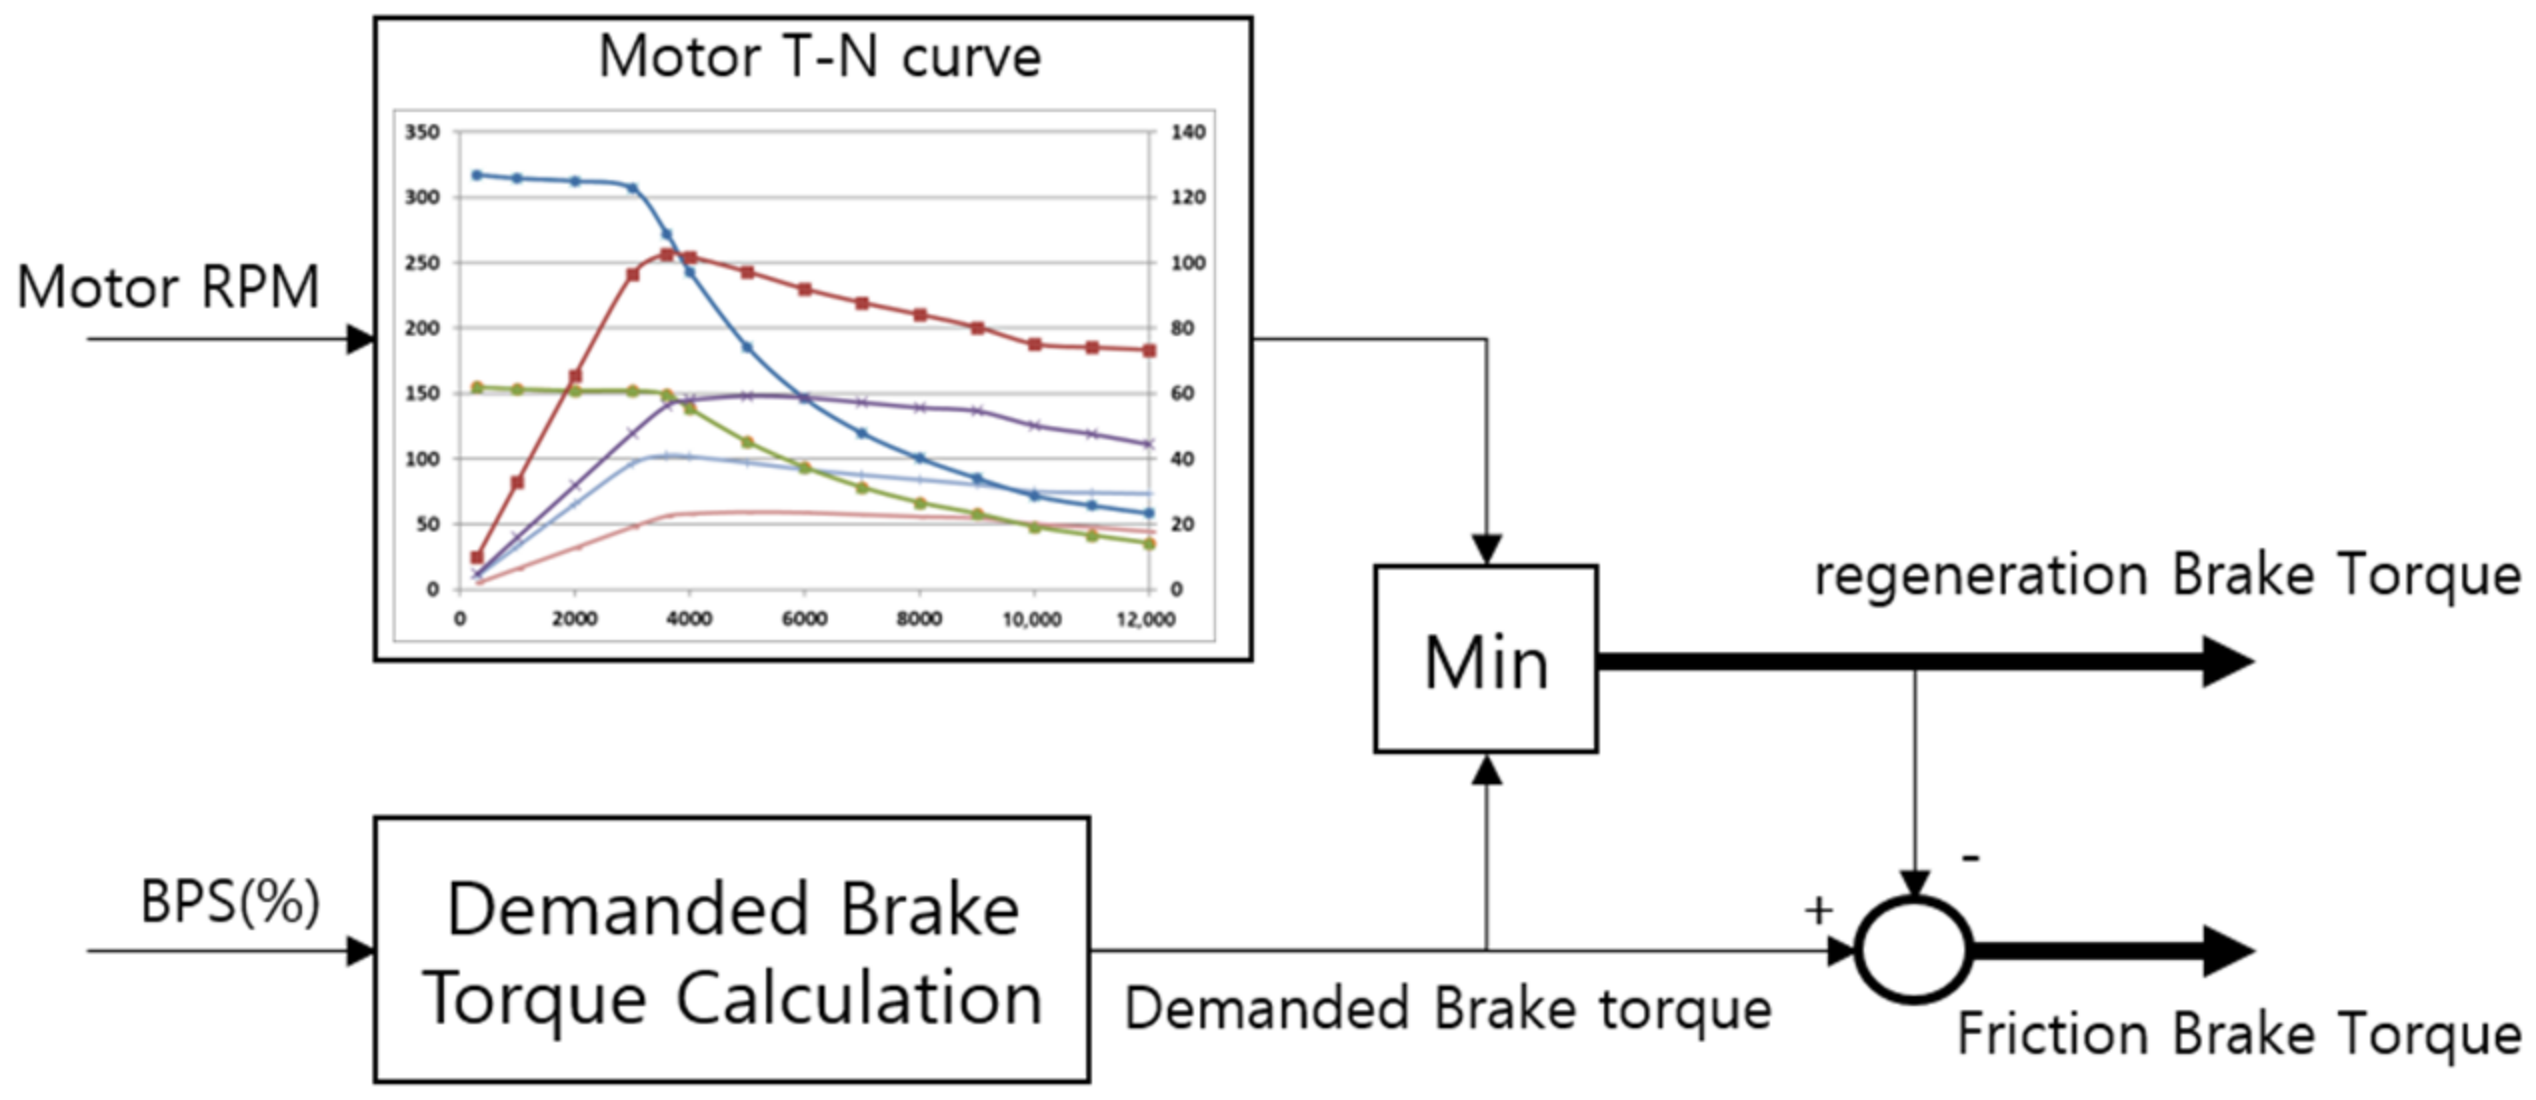
By driver inputs, we determined the target motor torque and calculated the power consumed by the motor using the efficiency map. The current motor’s available output torque was feedback-controlled based on the motor RPM to determine the regenerative braking torque of the motor. The shortfall in braking torque compared to braking input was converted into mechanical friction torque. Through this approach, we implemented the combination of regenerative braking and mechanical friction torque, as shown in Figure 12.
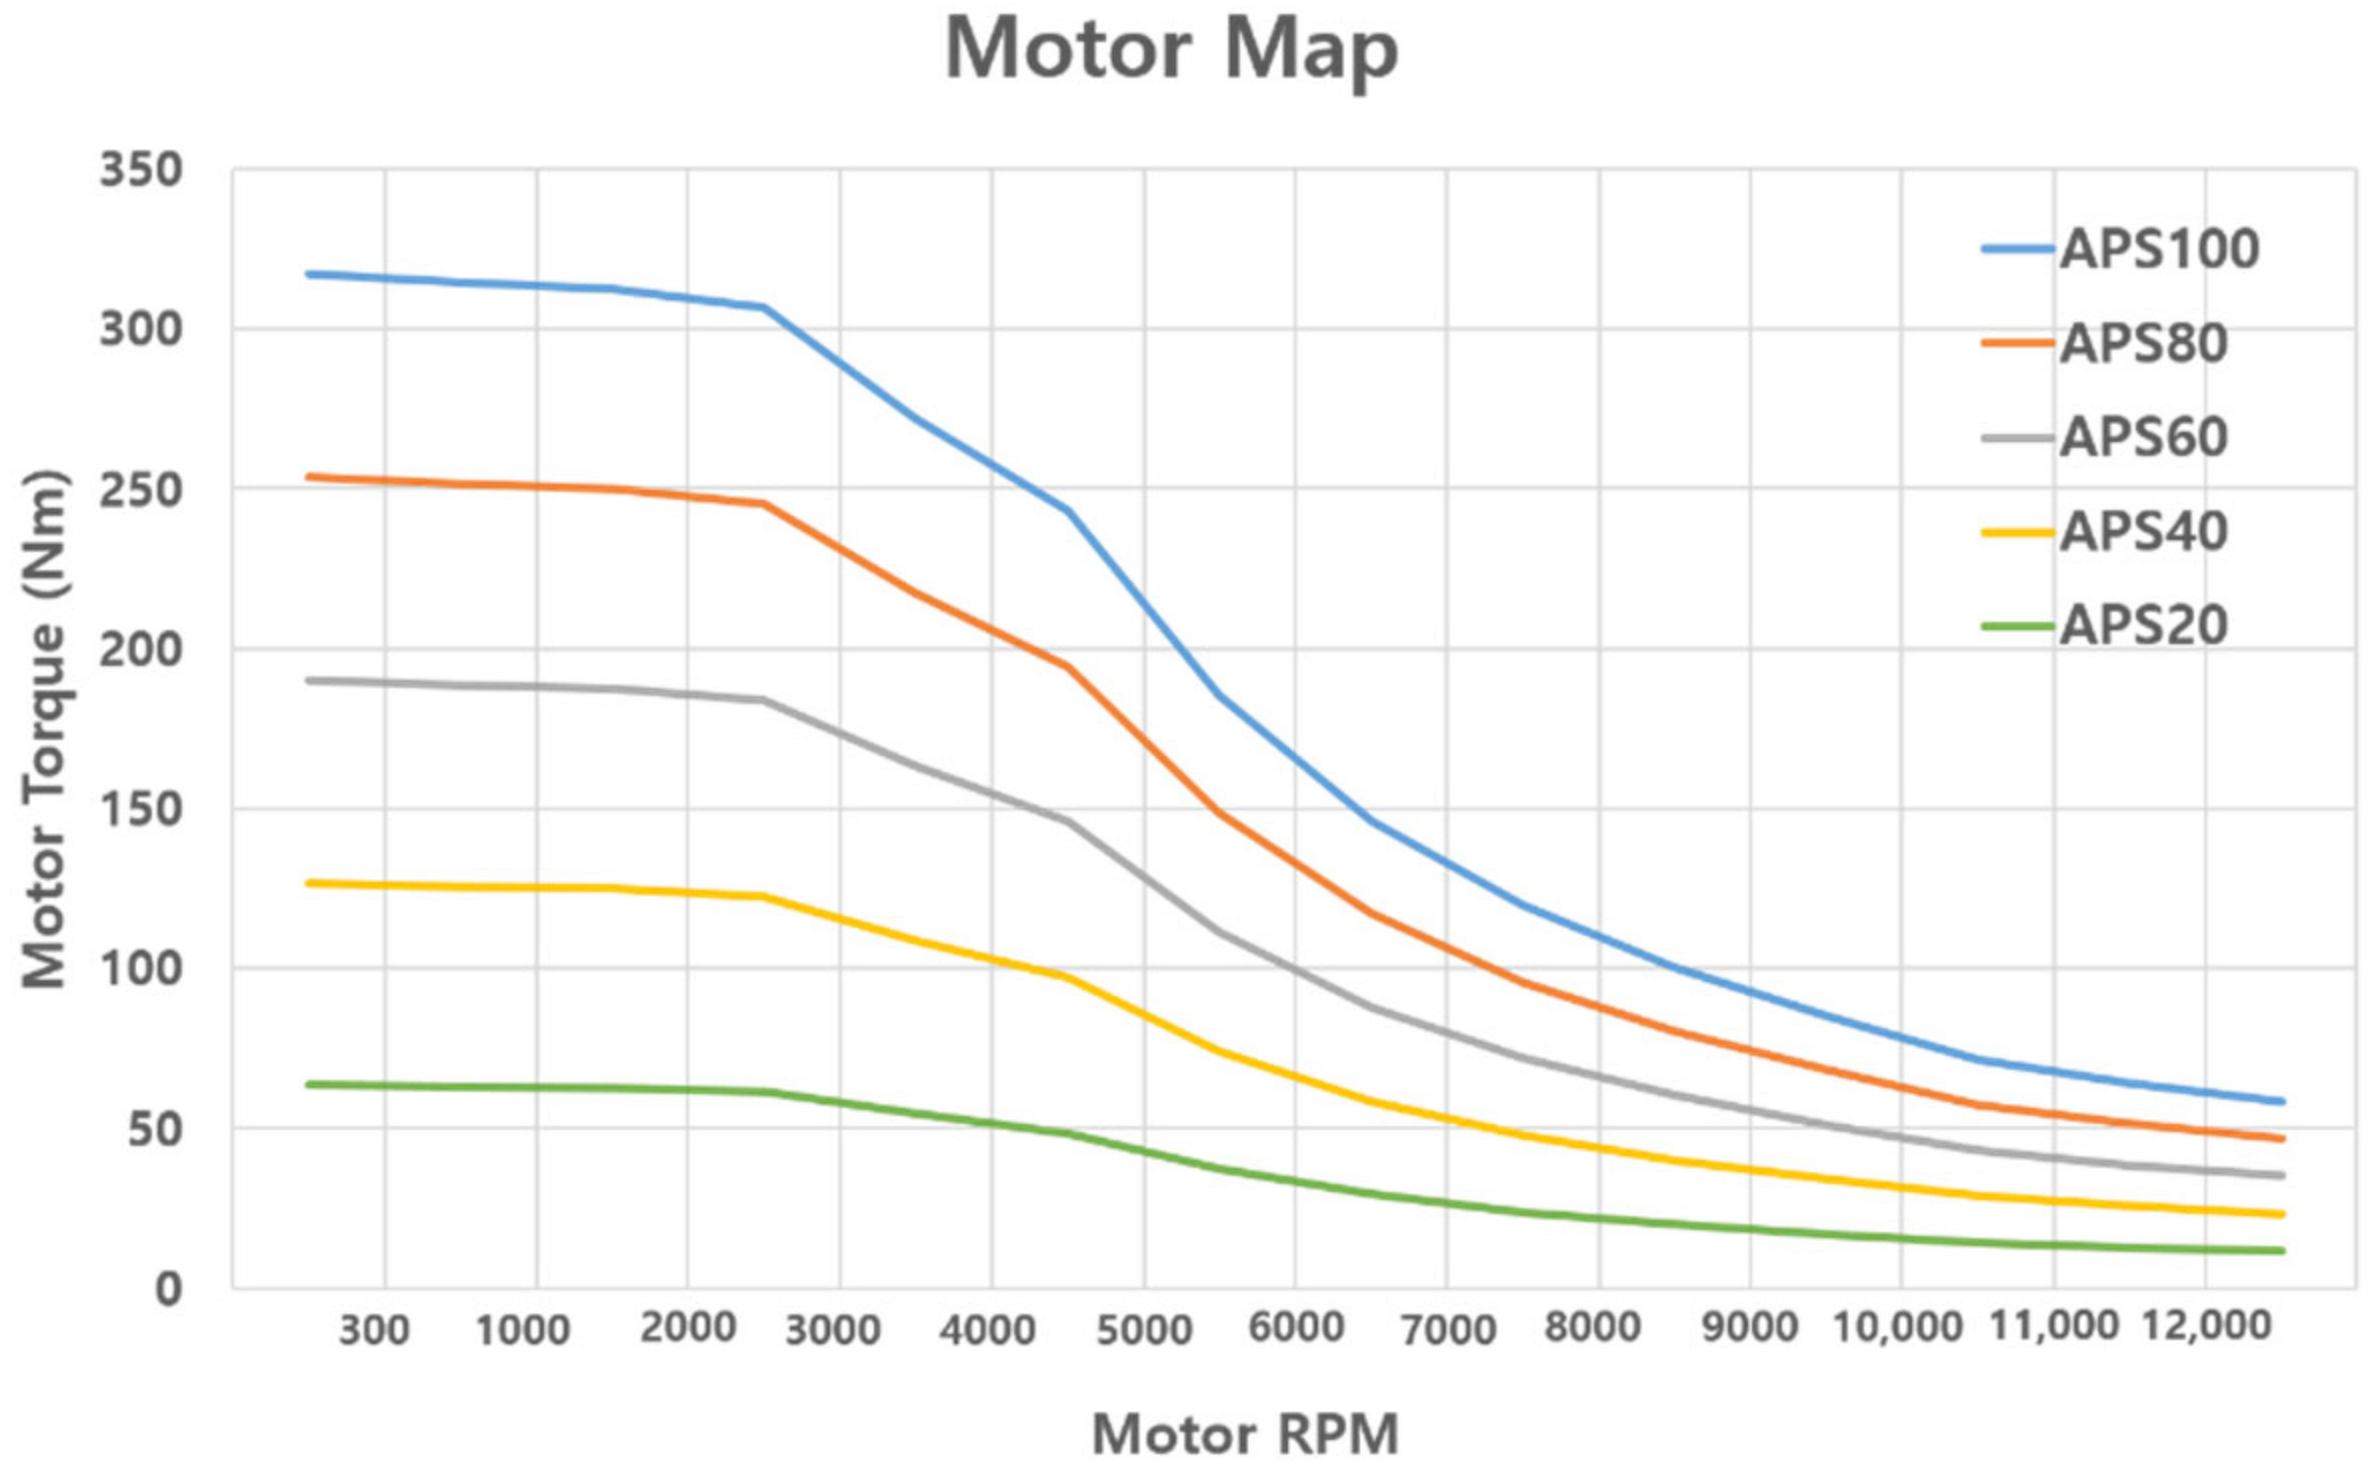
Furthermore, to generate the required motor torque output according to the driver’s input, we utilized an APS-motor map, depicted in Figure 13, which outputs the maximum torque proportionally based on the motor speed from the motor’s T-N curve map.

2.3.4. Driver Input

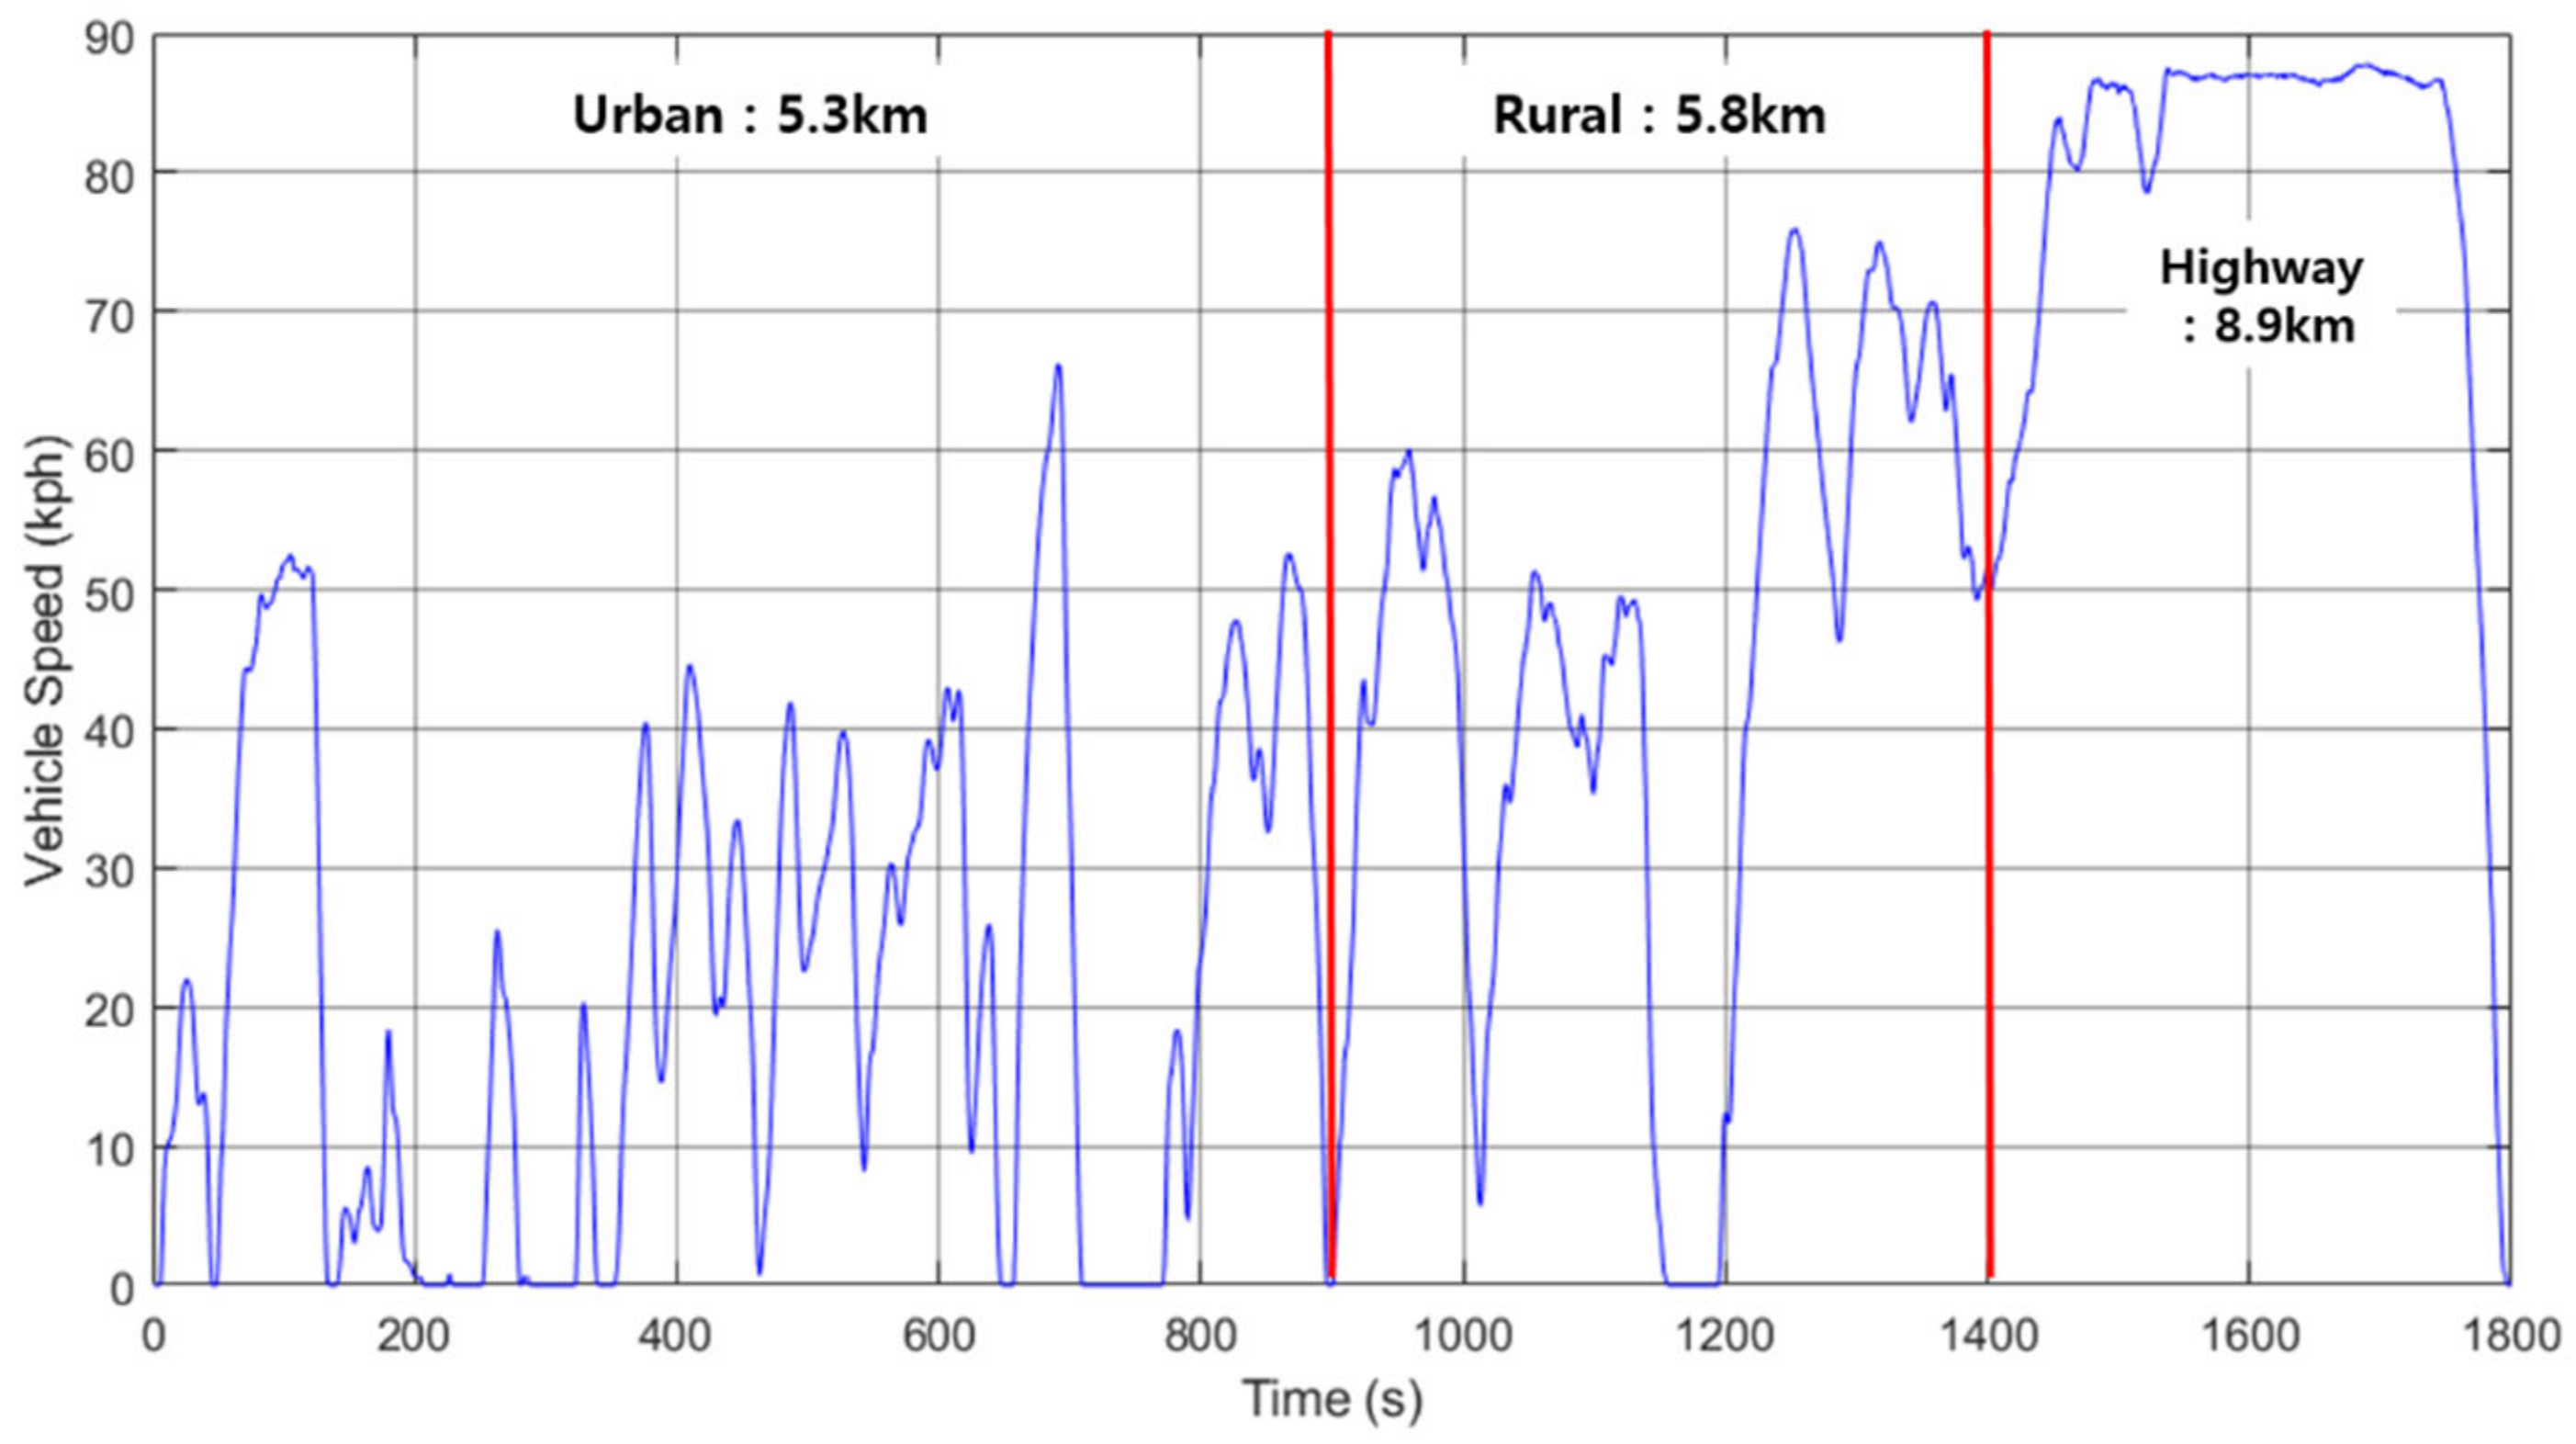
A driving simulation was conducted using the speed profile of the worldwide harmonized vehicle cycle (WHVC) for fuel efficiency testing of a compact commercial vehicle. In Figure 14, the driving mode of the WHVC encompasses a total of 30 min, consisting of 5.3 km in urban areas, 5.8 km in suburban areas, and 8.9 km on the highway. The speed profile, along with the error between the current vehicle speed and the profile, was used as feedback to control APS and BPS through a PID controller, as shown in Figure 15.

2.4. Development of Shift Map for 4-Speed Transmission with Synchronizer

In this project, the motor utilized has lower torque and power characteristics. Therefore, the development focus for the shift map was aligned with optimizing for maximum torque operation. Taking inputs from the driver’s APS and the vehicle’s speed, the transmission determines and executes the gear ratio.
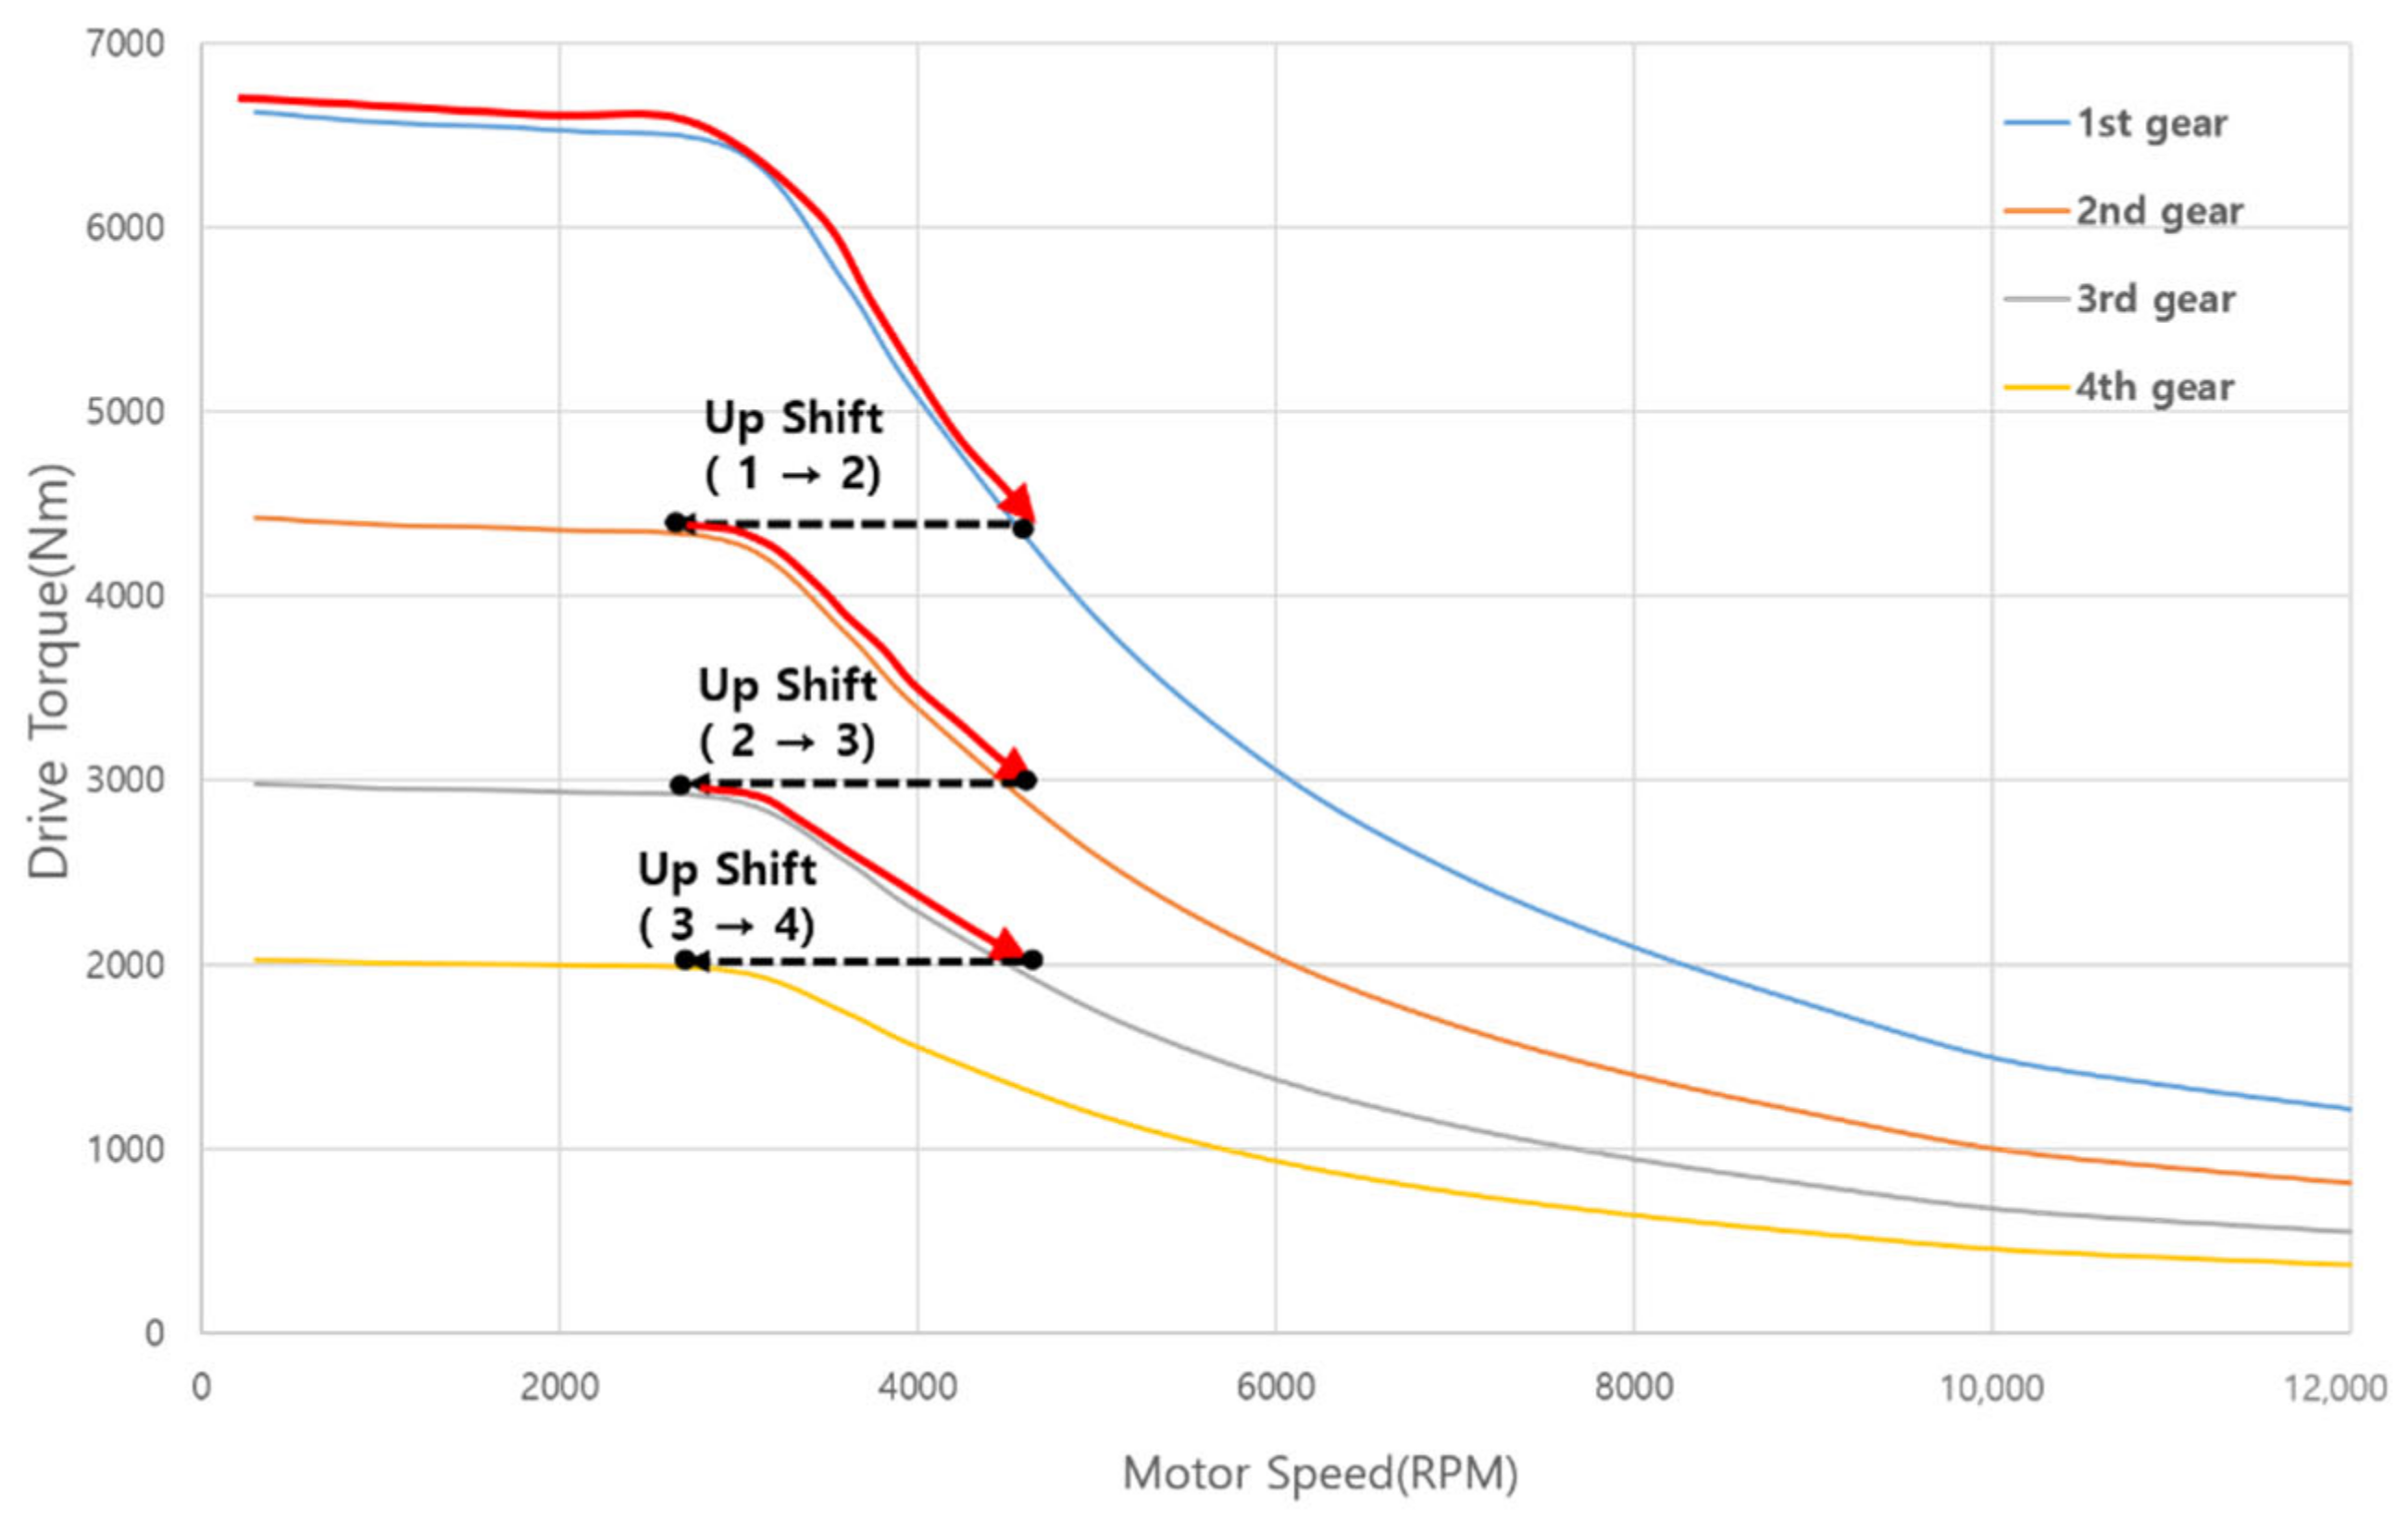
The torque output from the motor, based on motor RPM and APS, is proportionally determined relative to the maximum torque. For upshifting, the shift criteria were established based on the drive torque multiplied by the gear ratio to maintain maximum torque when transitioning from a lower gear to a higher gear.
The torque applied by the motor in the vehicle decreases gradually beyond a certain RPM. As the speed increases, the motor’s RPM also increases, and at this point, the maximum torque that can be delivered in (n)th gear gradually decreases. Similarly, at the same speed, the motor speed in (n + 1)th gear is lower than in gear n due to the gear ratio. When the vehicle is at the same speed, it employs a strategy where it compares the output torque available in (n)th gear and (n + 1)th gear, and shifts gears at the point where the output torque in (n) gear becomes lower than in (n + 1) gear. The shifting point from the (n)th gear to the (n + 1)th gear is lower than the maximum torque in the nth gear, and it occurs when the maximum torque of the (n + 1)th gear can be achieved as shown in Figure 16. With this shifting map strategy, a shift map was developed, as shown in Figure 17.
For downshifting, a damping zone of approximately 5 kph was introduced in the shift map of high-speed shifts.

2.5. Development of Simulation Configuration

The simulation environment undergoes a comprehensive process, traversing through driving mode input, VCU logic modeling, motor modeling, battery modeling, shift map integration, and longitudinal vehicle dynamics modeling, ultimately yielding the final vehicle speed and acceleration, as shown in Figure 18. Notably, each modeling phase involves receiving feedback for the required variables.

2.5.1. Pneumatic 4-Speed AMT Shift Logic Modeling

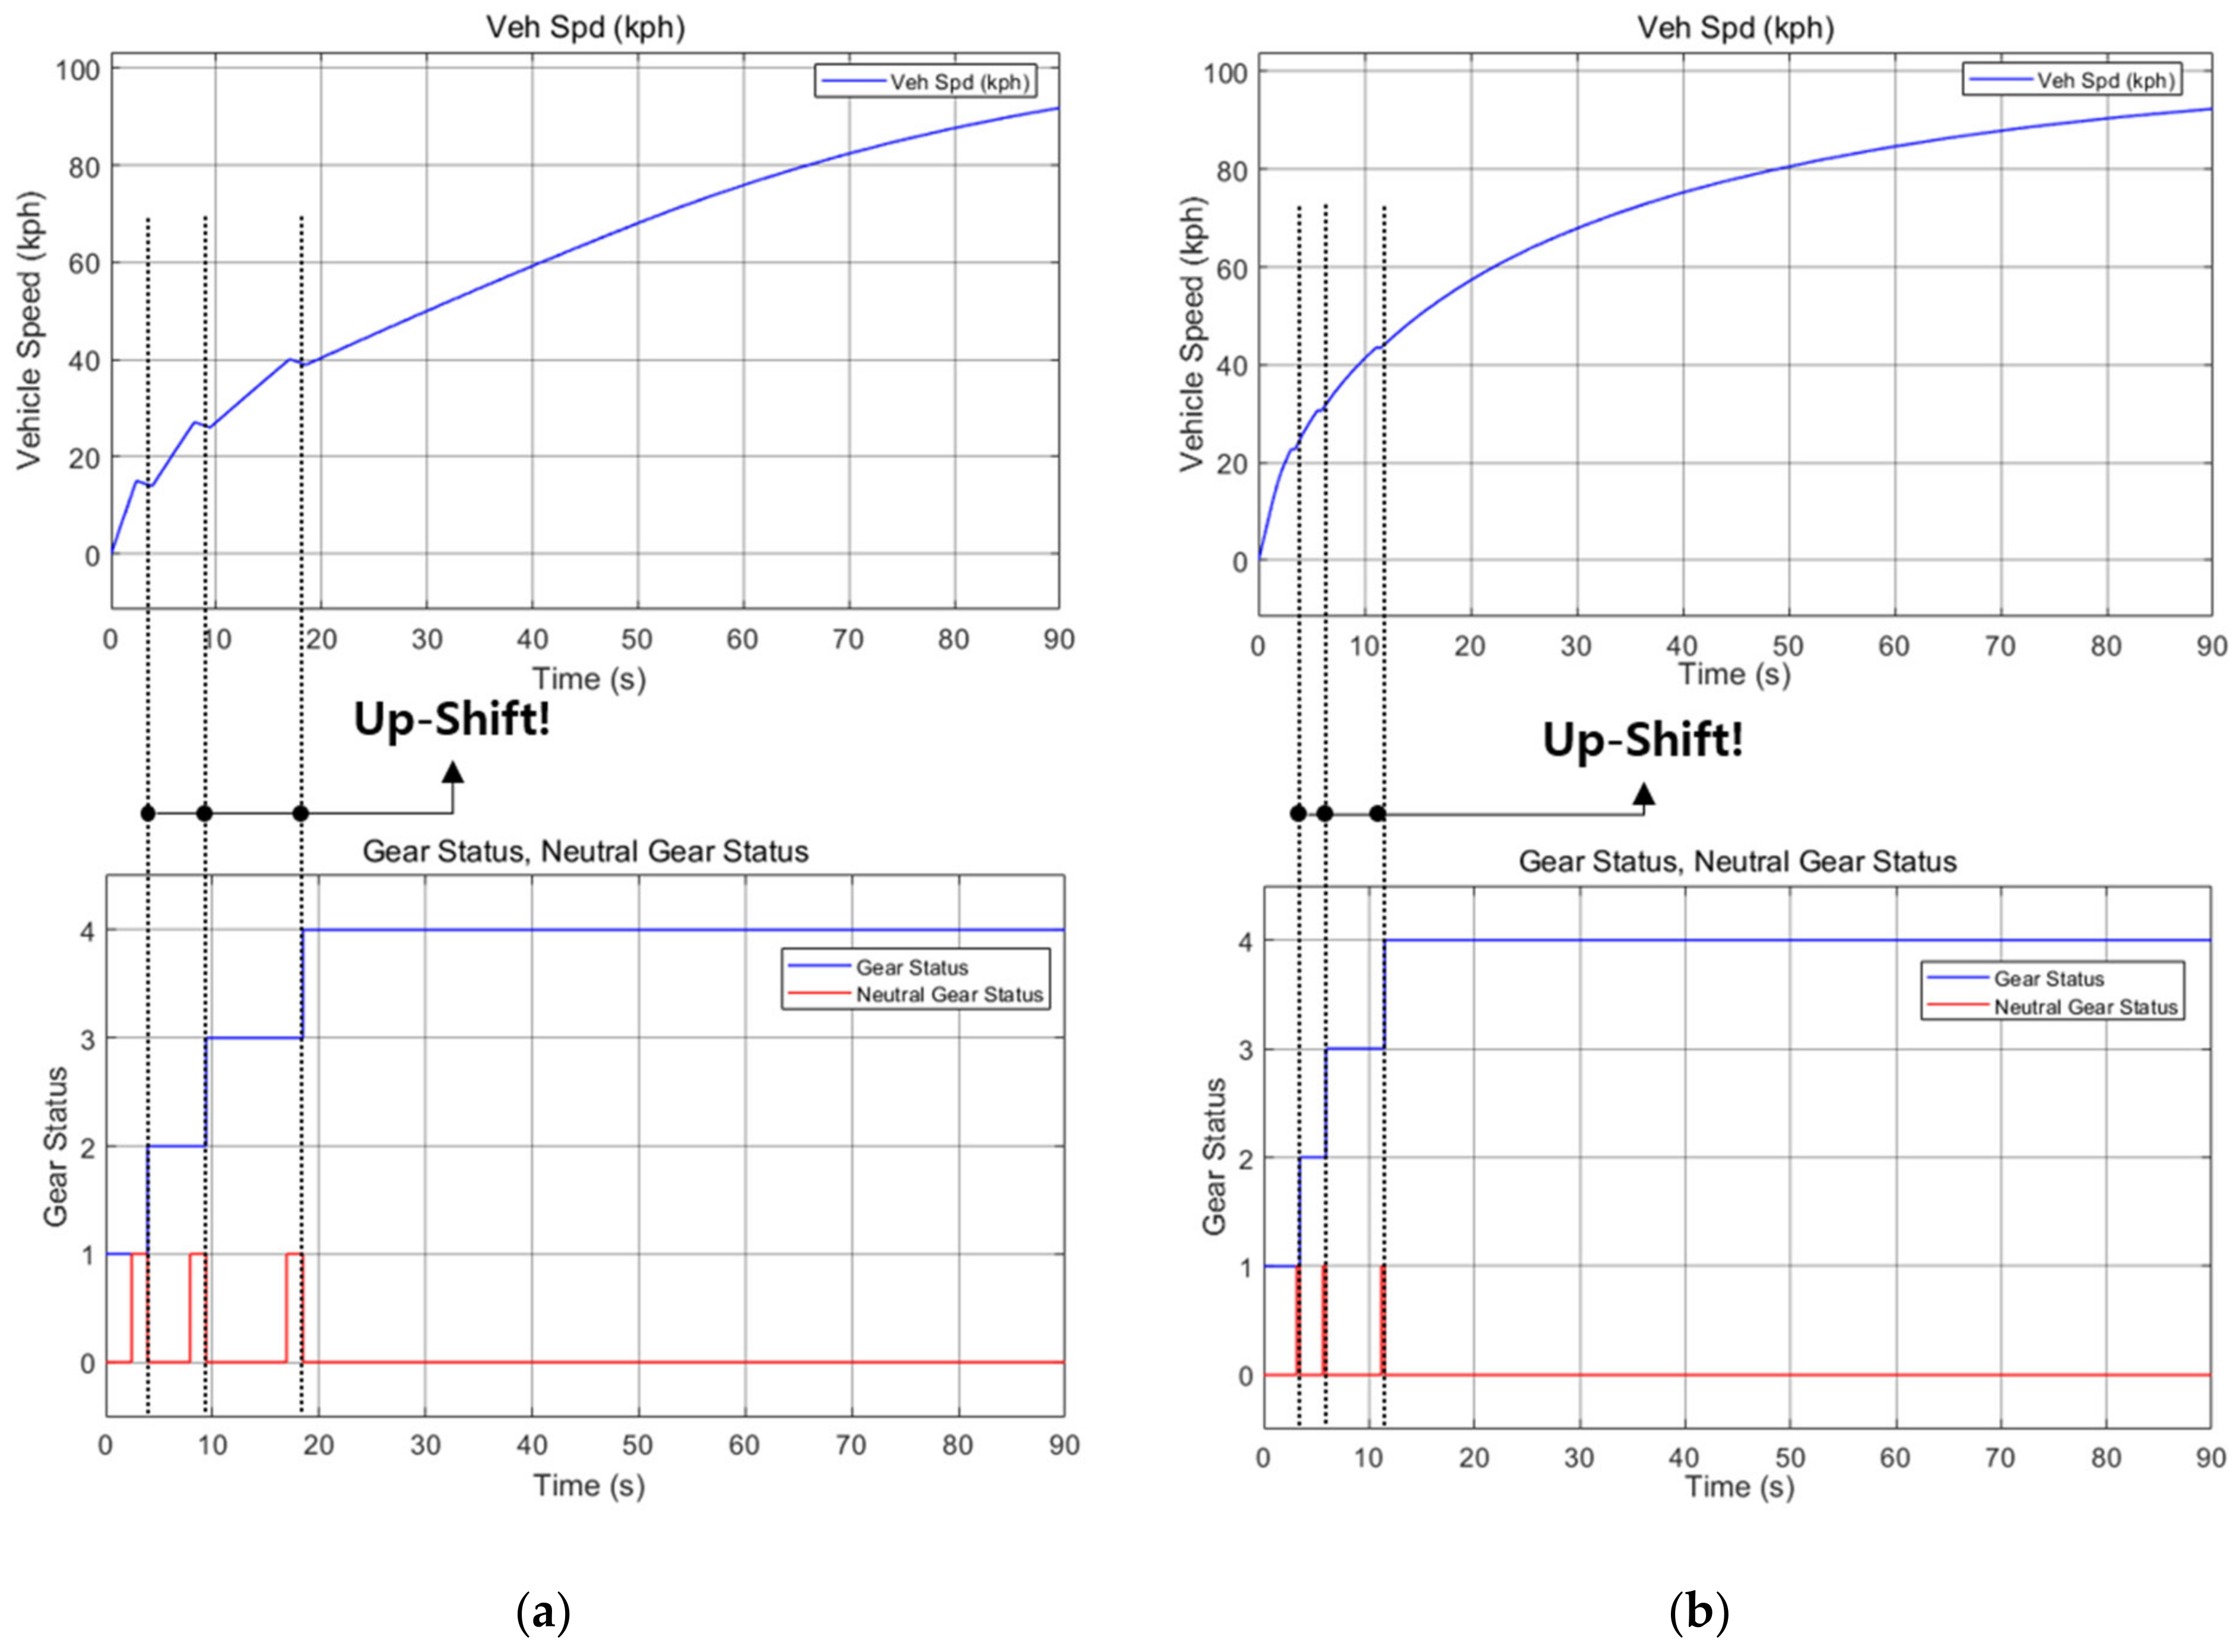
The modeling process incorporated pneumatic 4-speed AMT logic, where shifts occur when the motor speed reaches a certain constant RPM. Additionally, considering the typical shift duration of around 1.5 s, the modeling accounted for this time delay by controlling the system to neutral during the 1.5 s of the shifting process, as shown in Figure 19. This approach ensures a realistic representation of the shifting behavior, taking into consideration the inherent characteristics of pneumatic 4-speed AMT, where shifts occur at specific motor speeds and involve a finite transition time.

2.5.2. 4-Speed Transmission with Synchronizer Shift Logic Modeling

The modeling process included the development of logic to determine the appropriate gear ratio based on vehicle speed and APS input. This logic facilitates the shifting between high and low gears, as shown in Figure 20. The shift map utilized in this modeling process was the one described in Section 2.4.

3. Results

3.1. Shifting Delay Results in Simulation

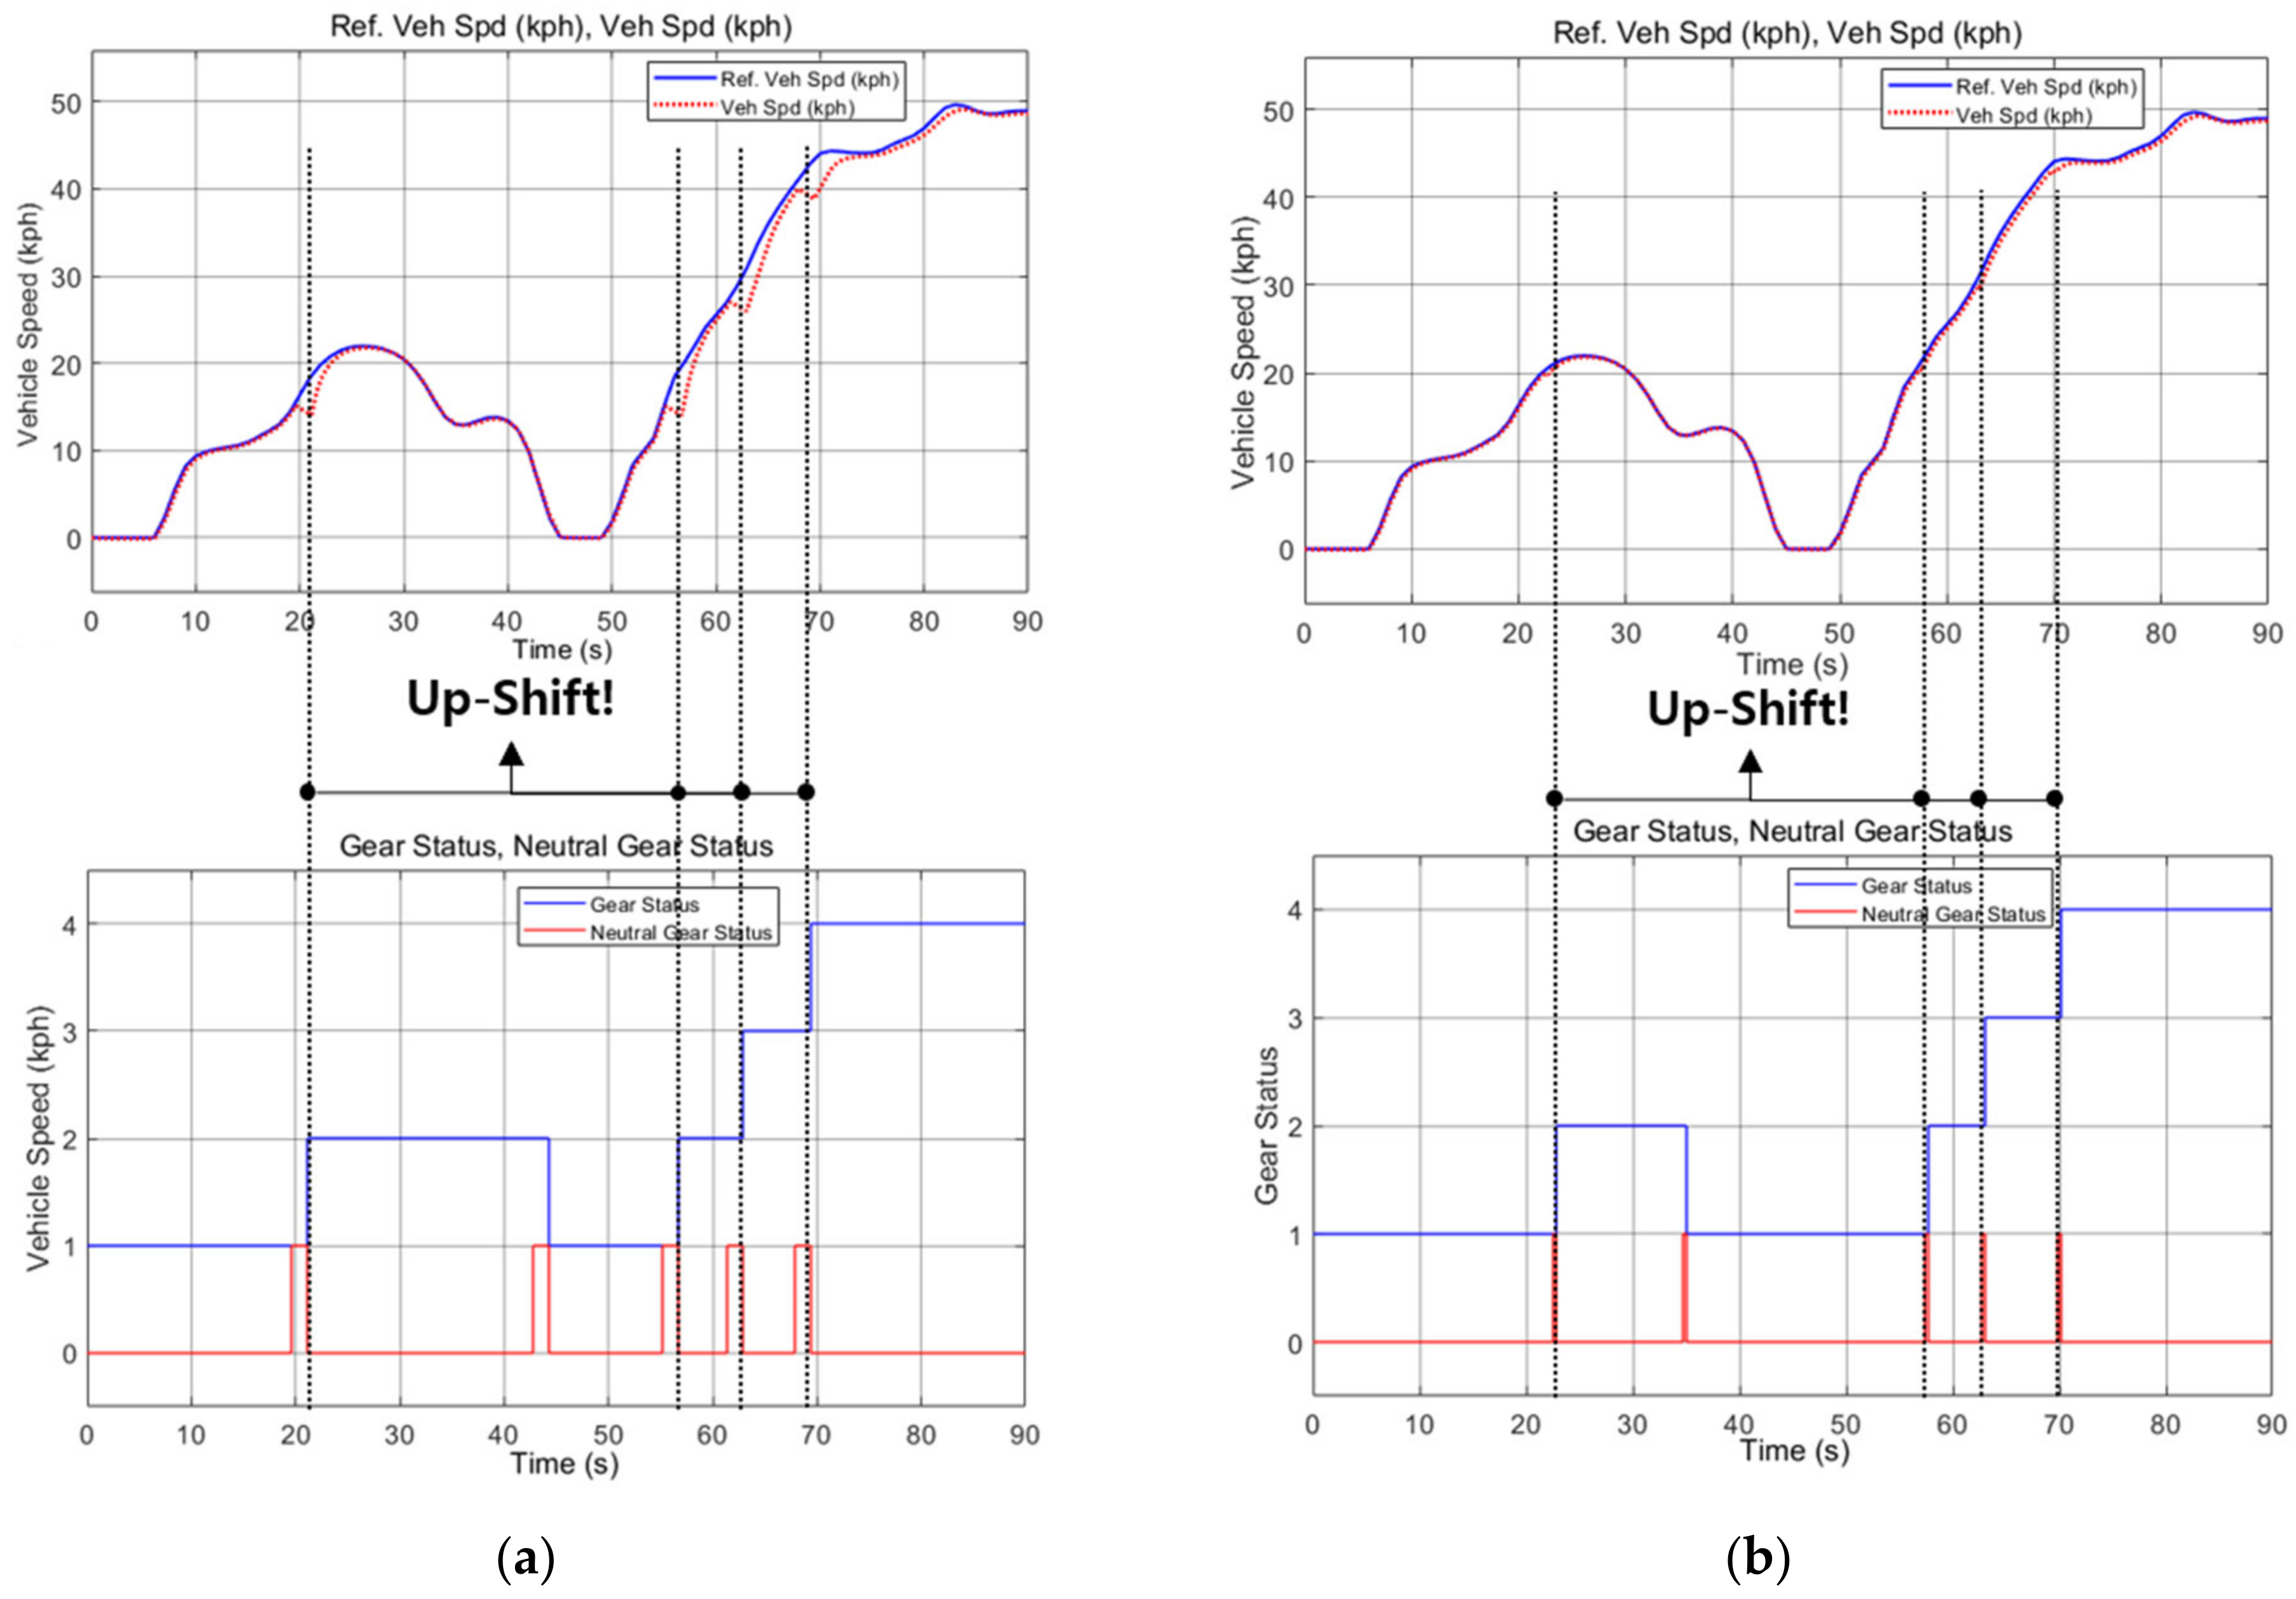
The simulation results with the application of the conventional pneumatic 4-speed AMT and its shifting delay are depicted in Figure 21a and Figure 22a. Under APS 60% input conditions and during the acceleration phase of the WHVC, the simulation confirmed a decrease in speed in the high-speed shifting zone due to the extended shifting time, as mentioned in Section 2.1. As the shift mode entered neutral, the driving torque became zero, resulting in a reduction in speed due to rolling resistance, aerodynamic resistance, and gradient resistance, as illustrated in Figure 21a and Figure 22a.
In contrast, as mentioned in Section 2.1, the newly developed 4-speed transmission with synchronizer exhibited minimal shifting time in 0.3 s, as it incorporates two synchronizers. Applying this to the simulation revealed that under conditions similar to the pneumatic 4-speed AMT, there was a decrease in speed but negligible, as shown in Figure 21b and Figure 22b.

3.2. Comparison Verification of Efficiency and Performance

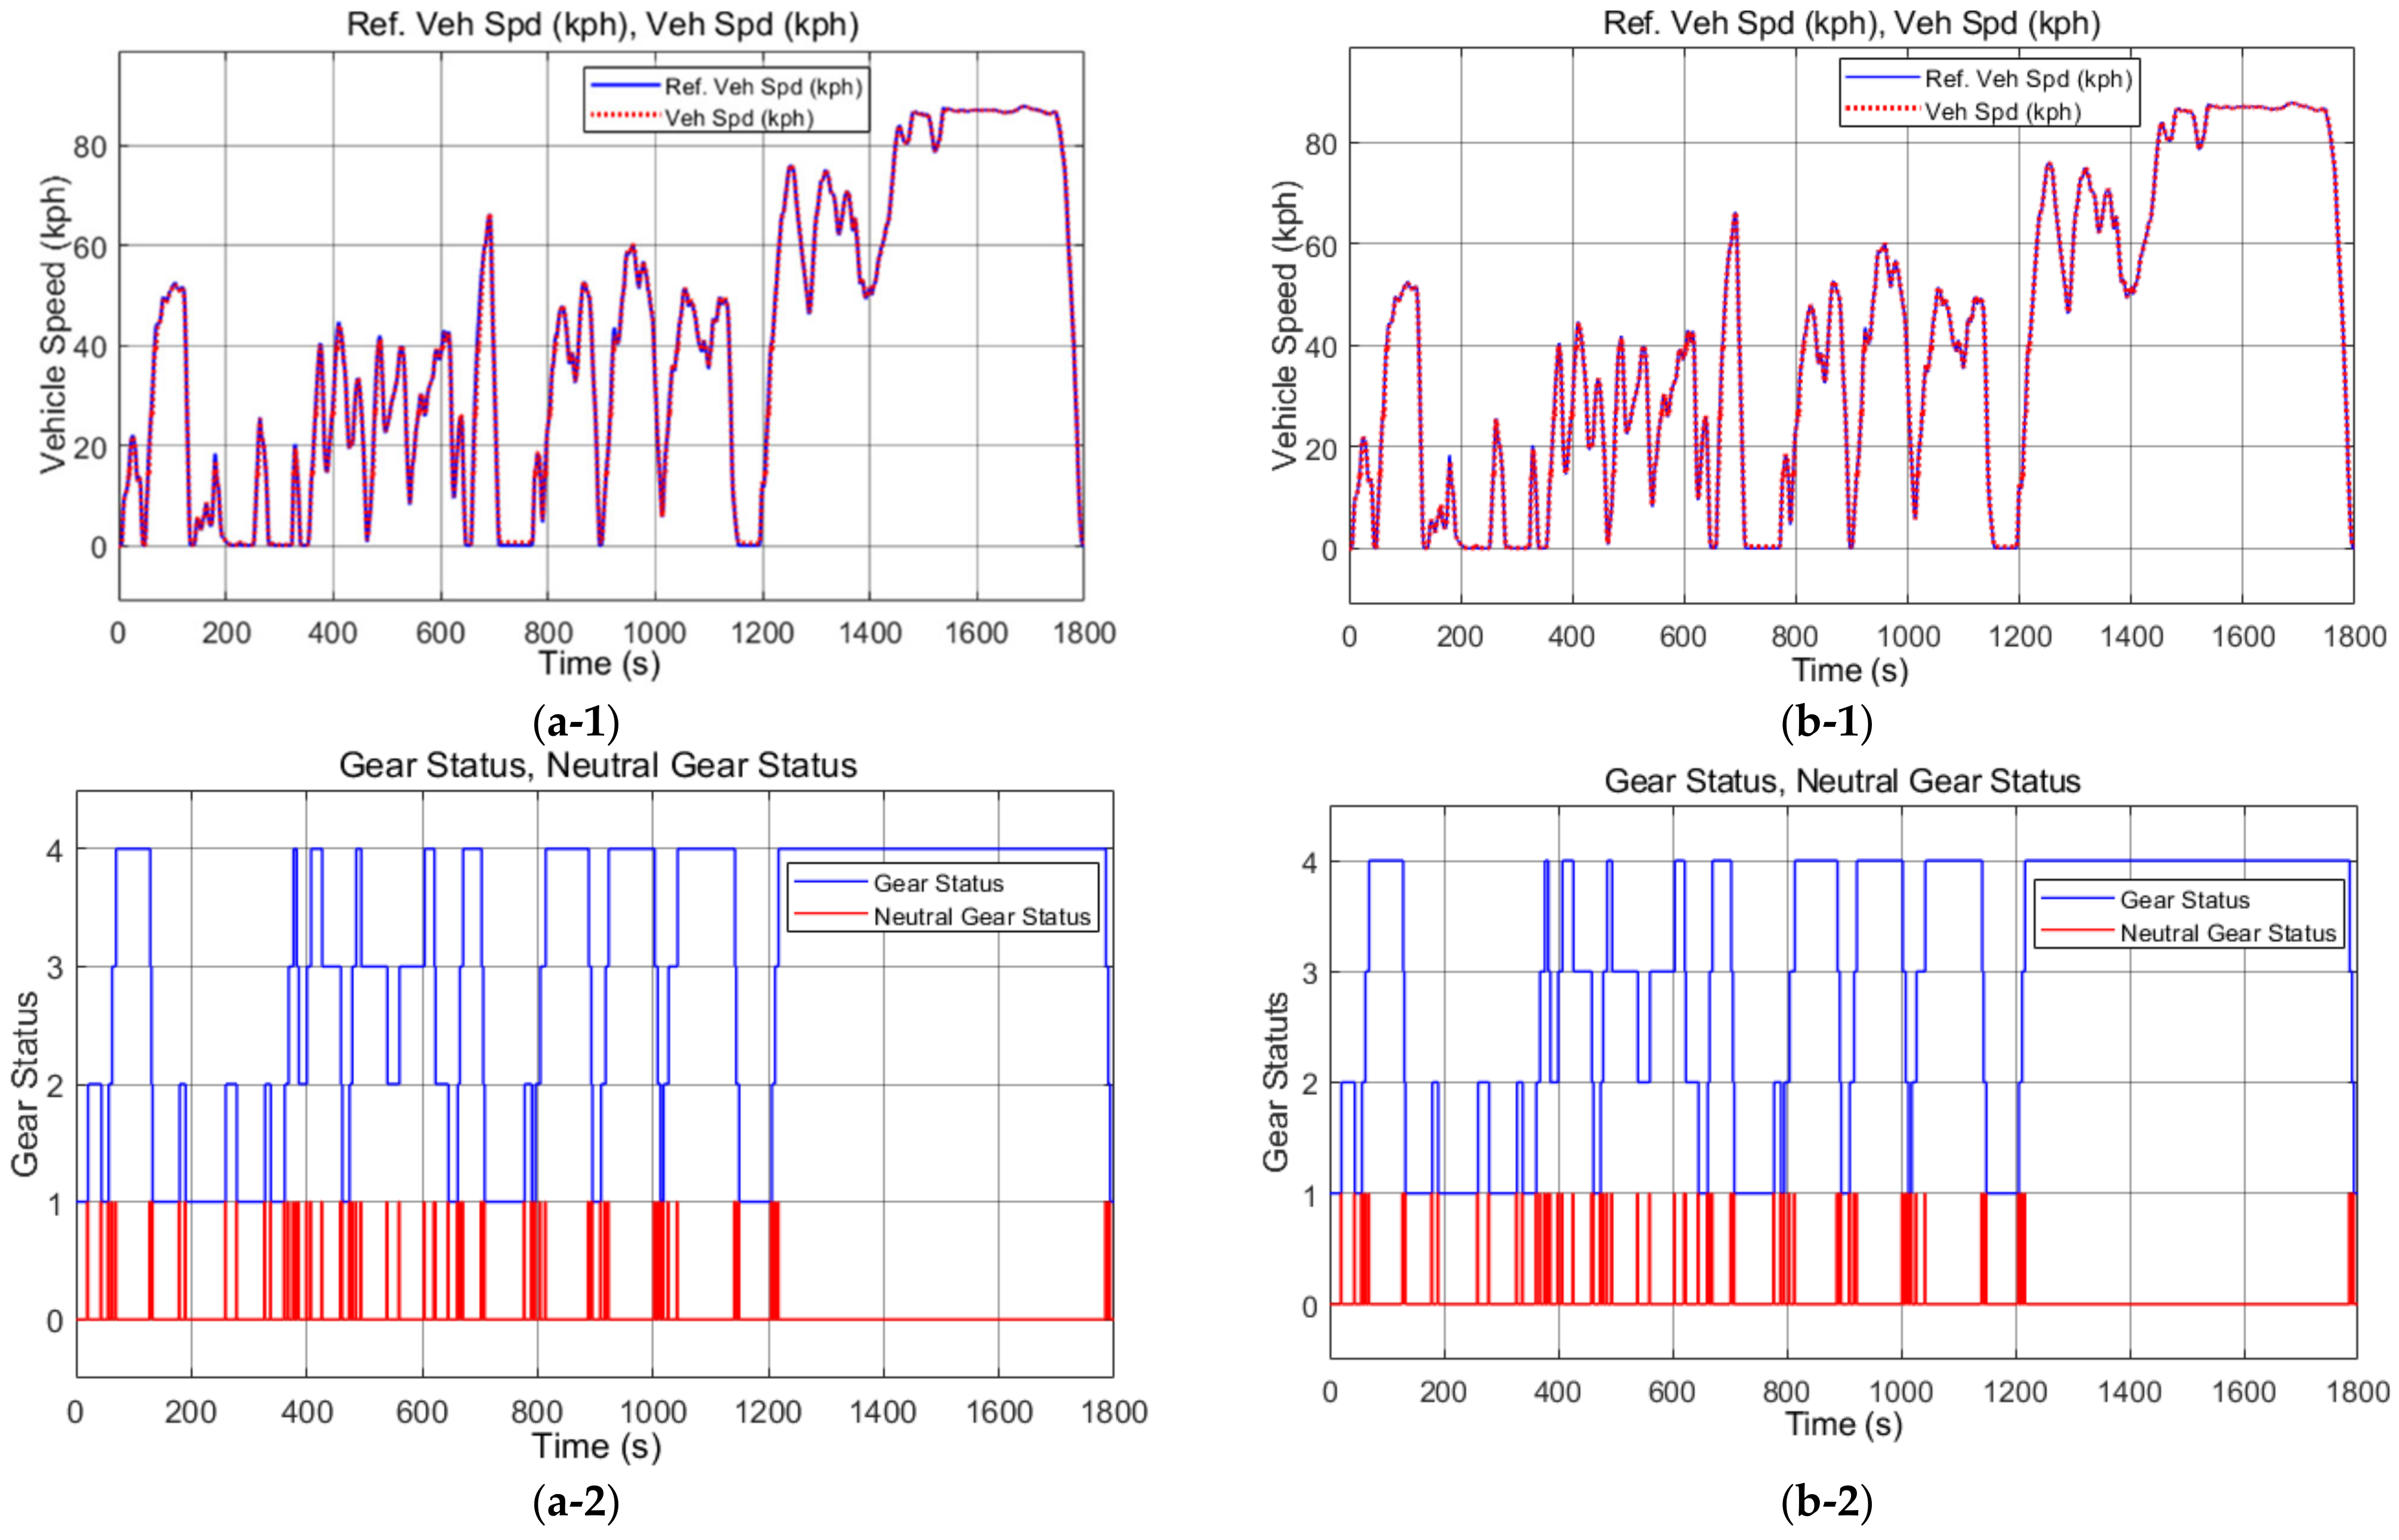
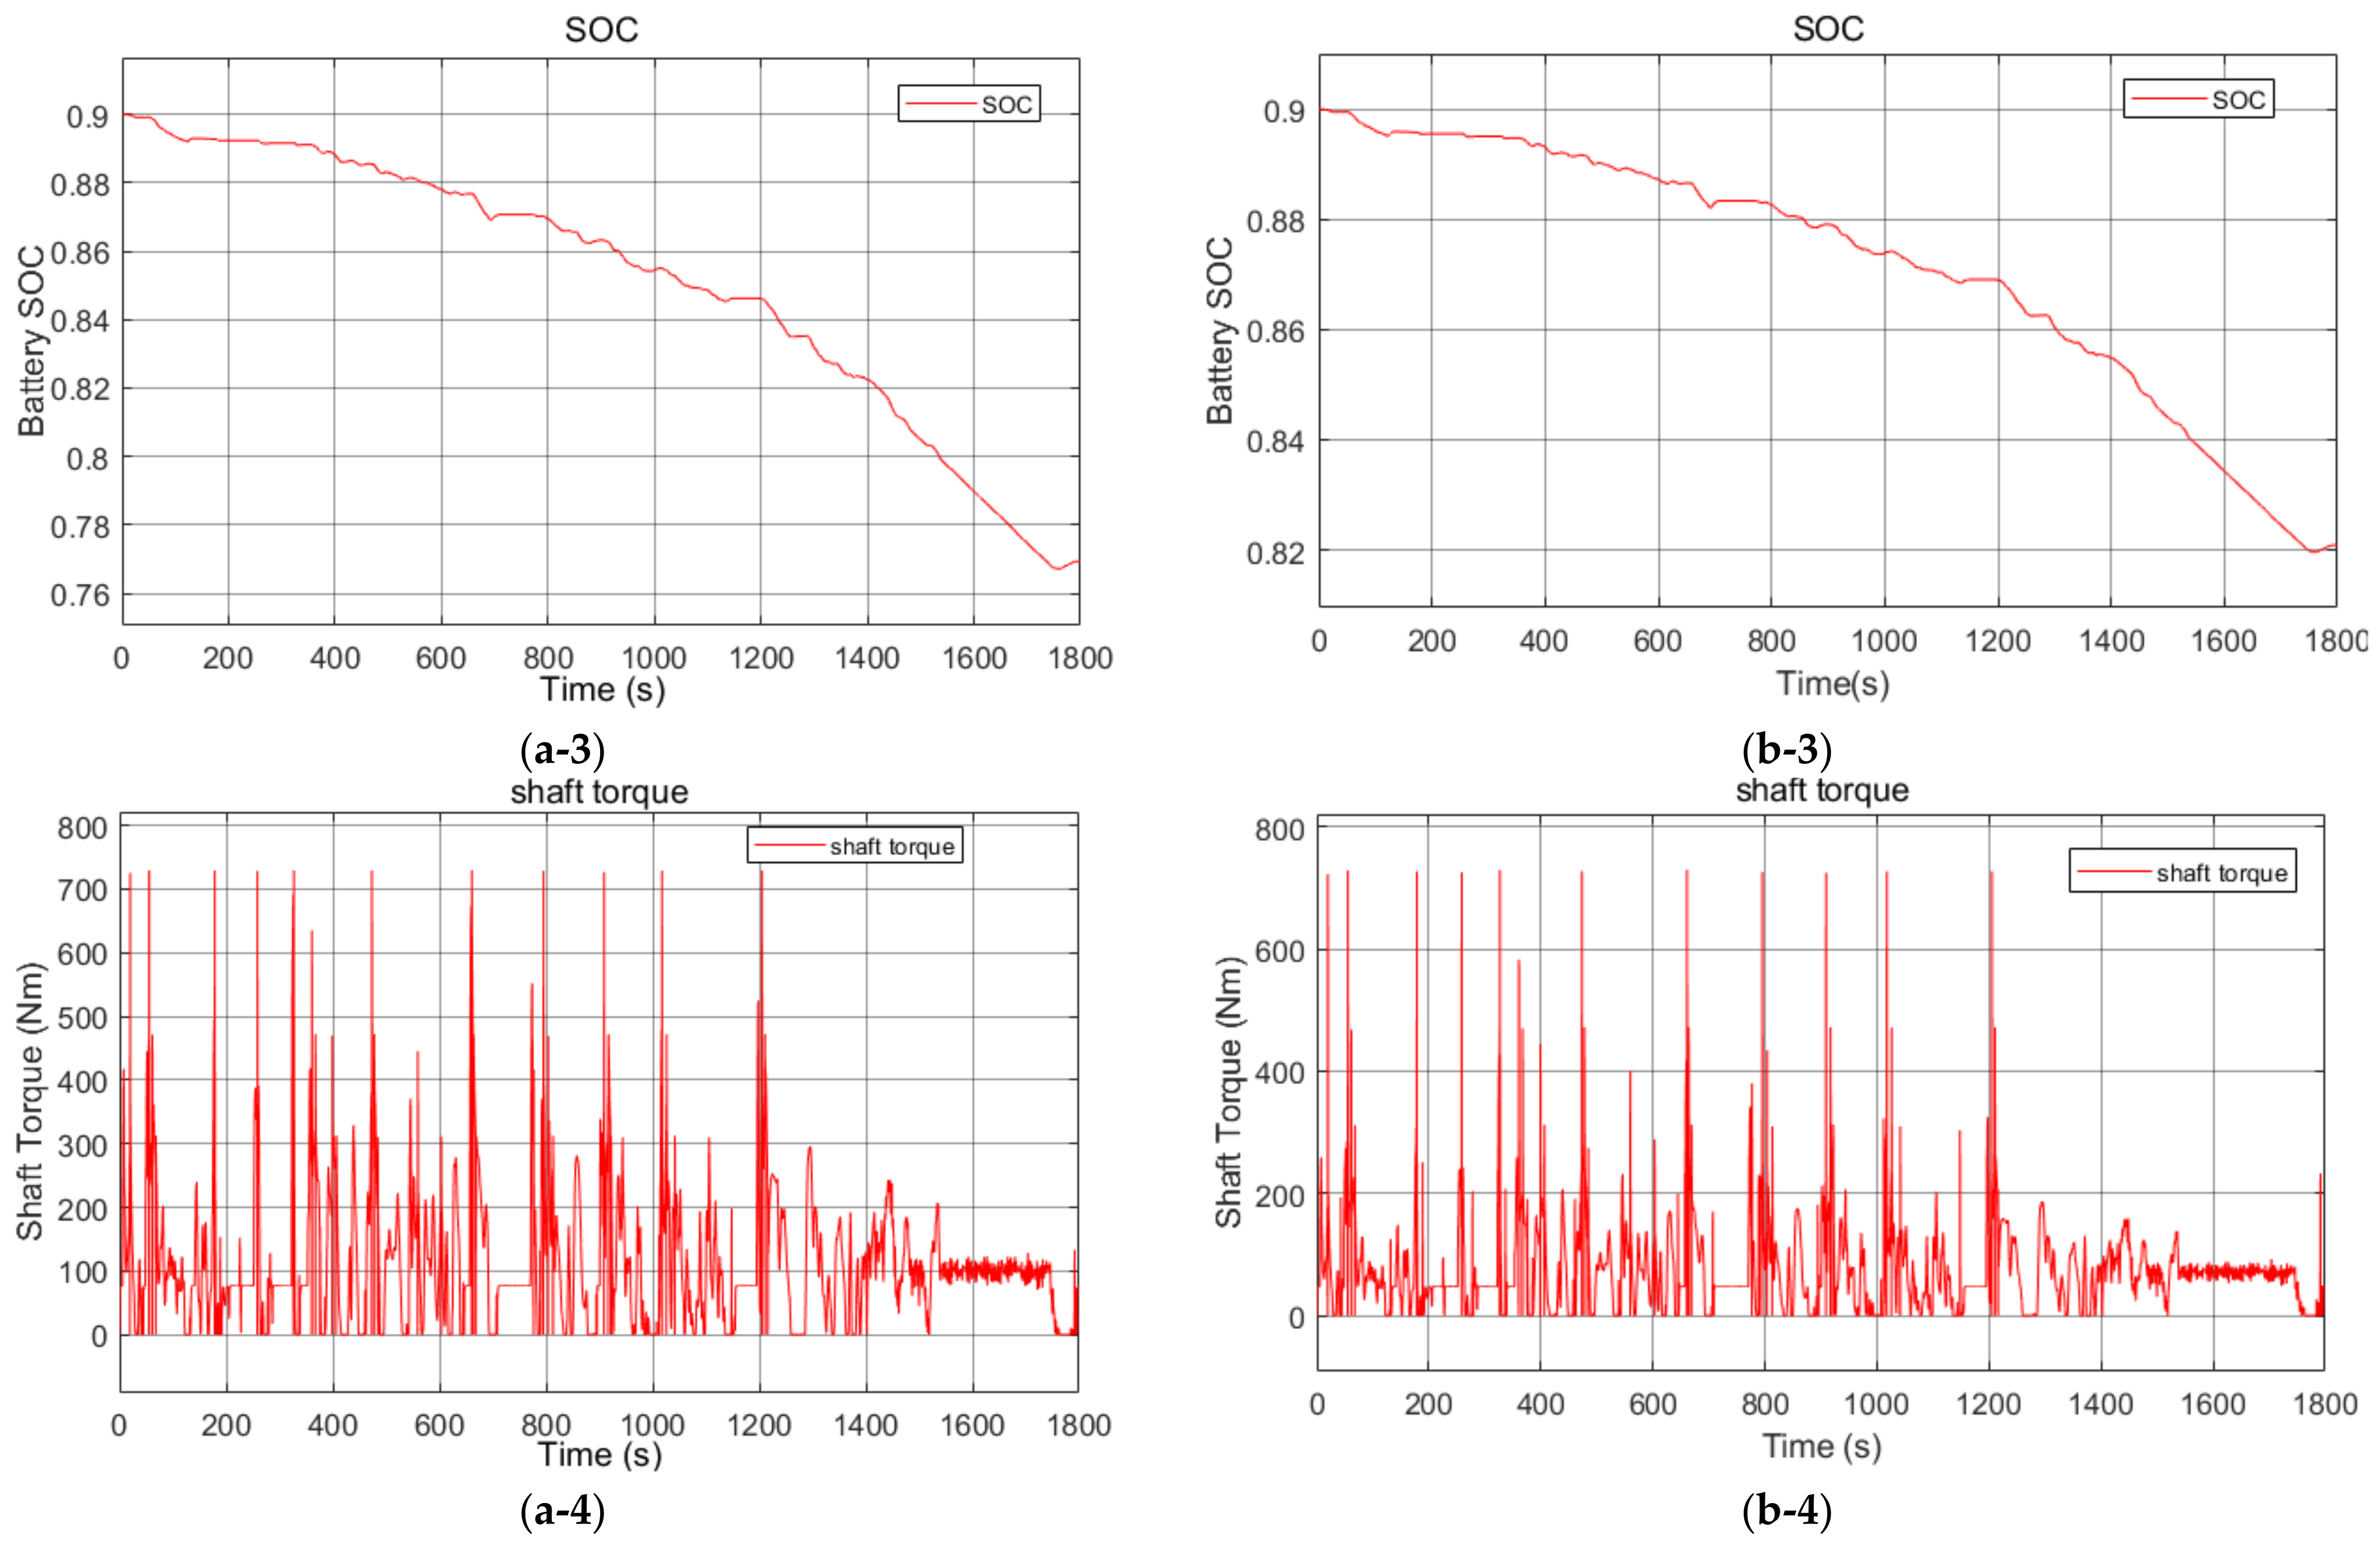
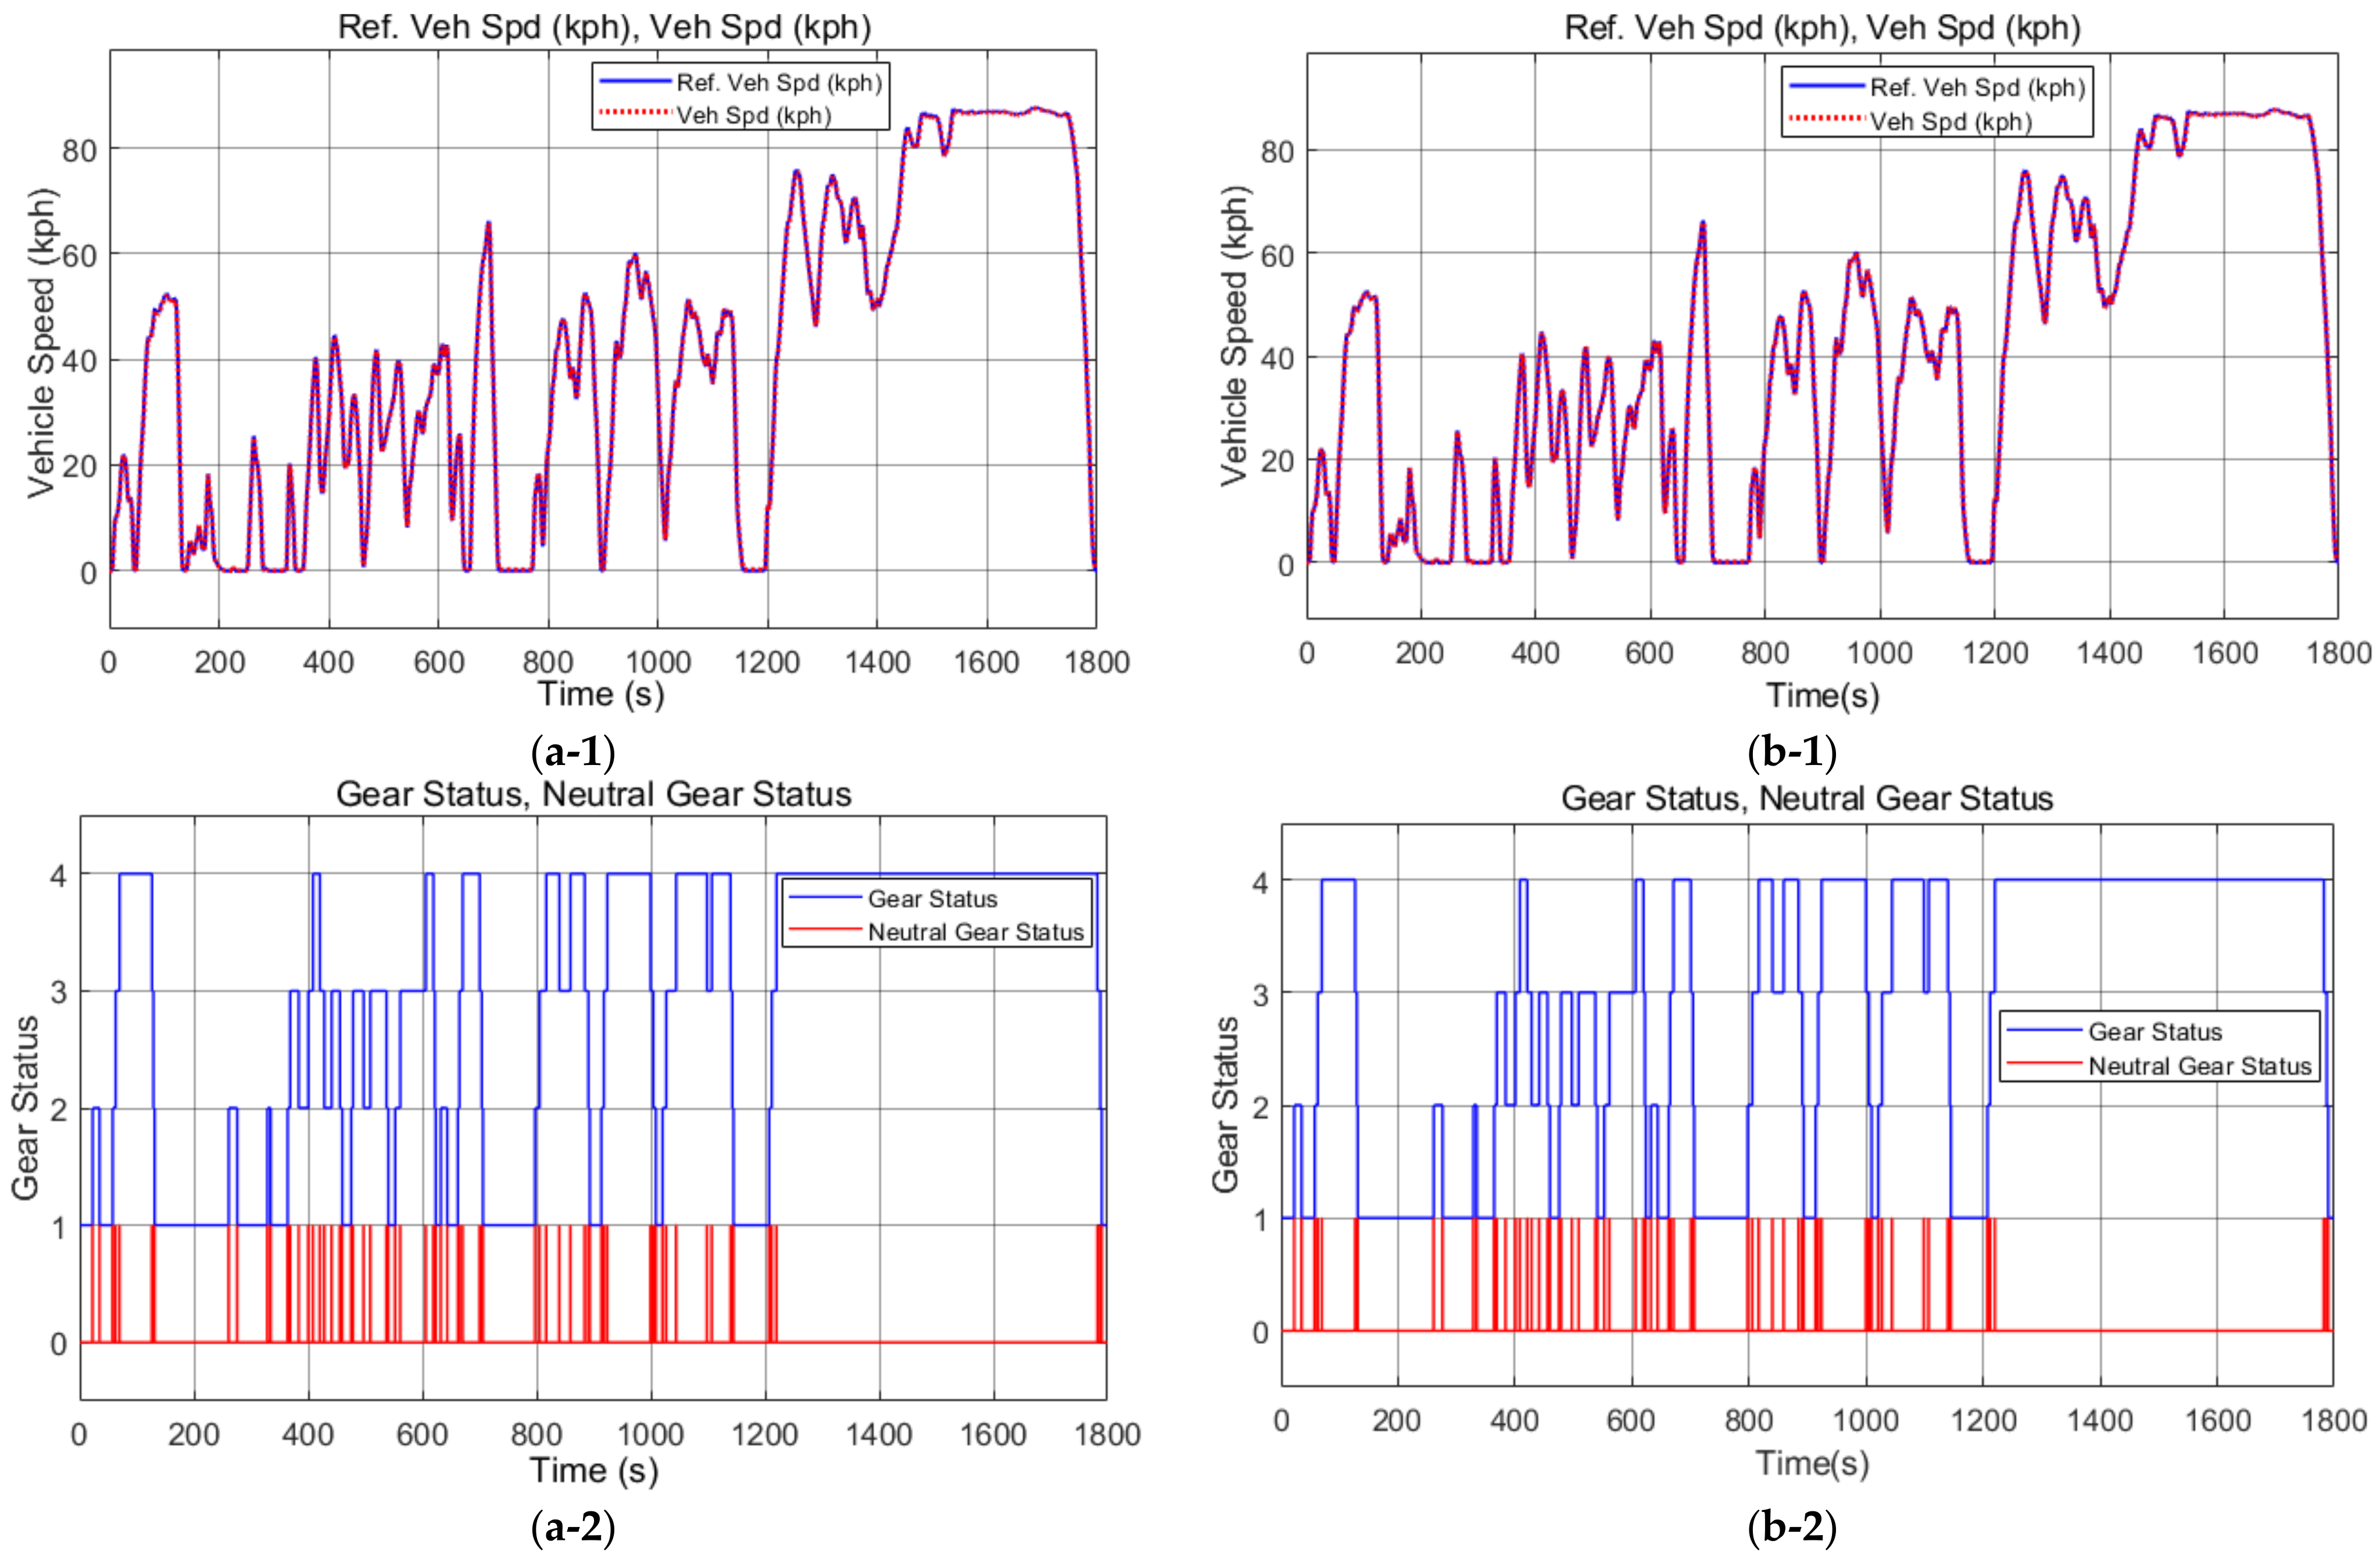
For efficiency and performance comparison, the speed profile of the WHVC’s driving mode, as mentioned in Section 2.3, was input as the driver’s input for the simulation. Figure 23(a-1,a-2,b-1,b-2) presents the speed and gear status of a vehicle with the application of the pneumatic 4-speed AMT in WHVC’s driving mode. As mentioned in Section 2.1, the simulation was conducted using the logic with a shifting time of 1.5 s. Consistent with the test results, it shows a reduction in speed during upshift situations. Additionally, a decrease in state of charge from 90% to 75.46% is observed, as shown in Figure 23(a-3), with a 2500 kg payload. Additionally, as shown in Figure 23(b-3), the SOC decreased from 90% to 80.65% when the vehicle had no payload. The average fuel efficiency over the 1800 s of driving were 1.378 km/kWh with 2500 kg payload and 2.143 km/kWh without payload, and the root mean square of the speed error relative to the target speed was 0.09841 with 2500 kg payload and 0.06918 without payload.
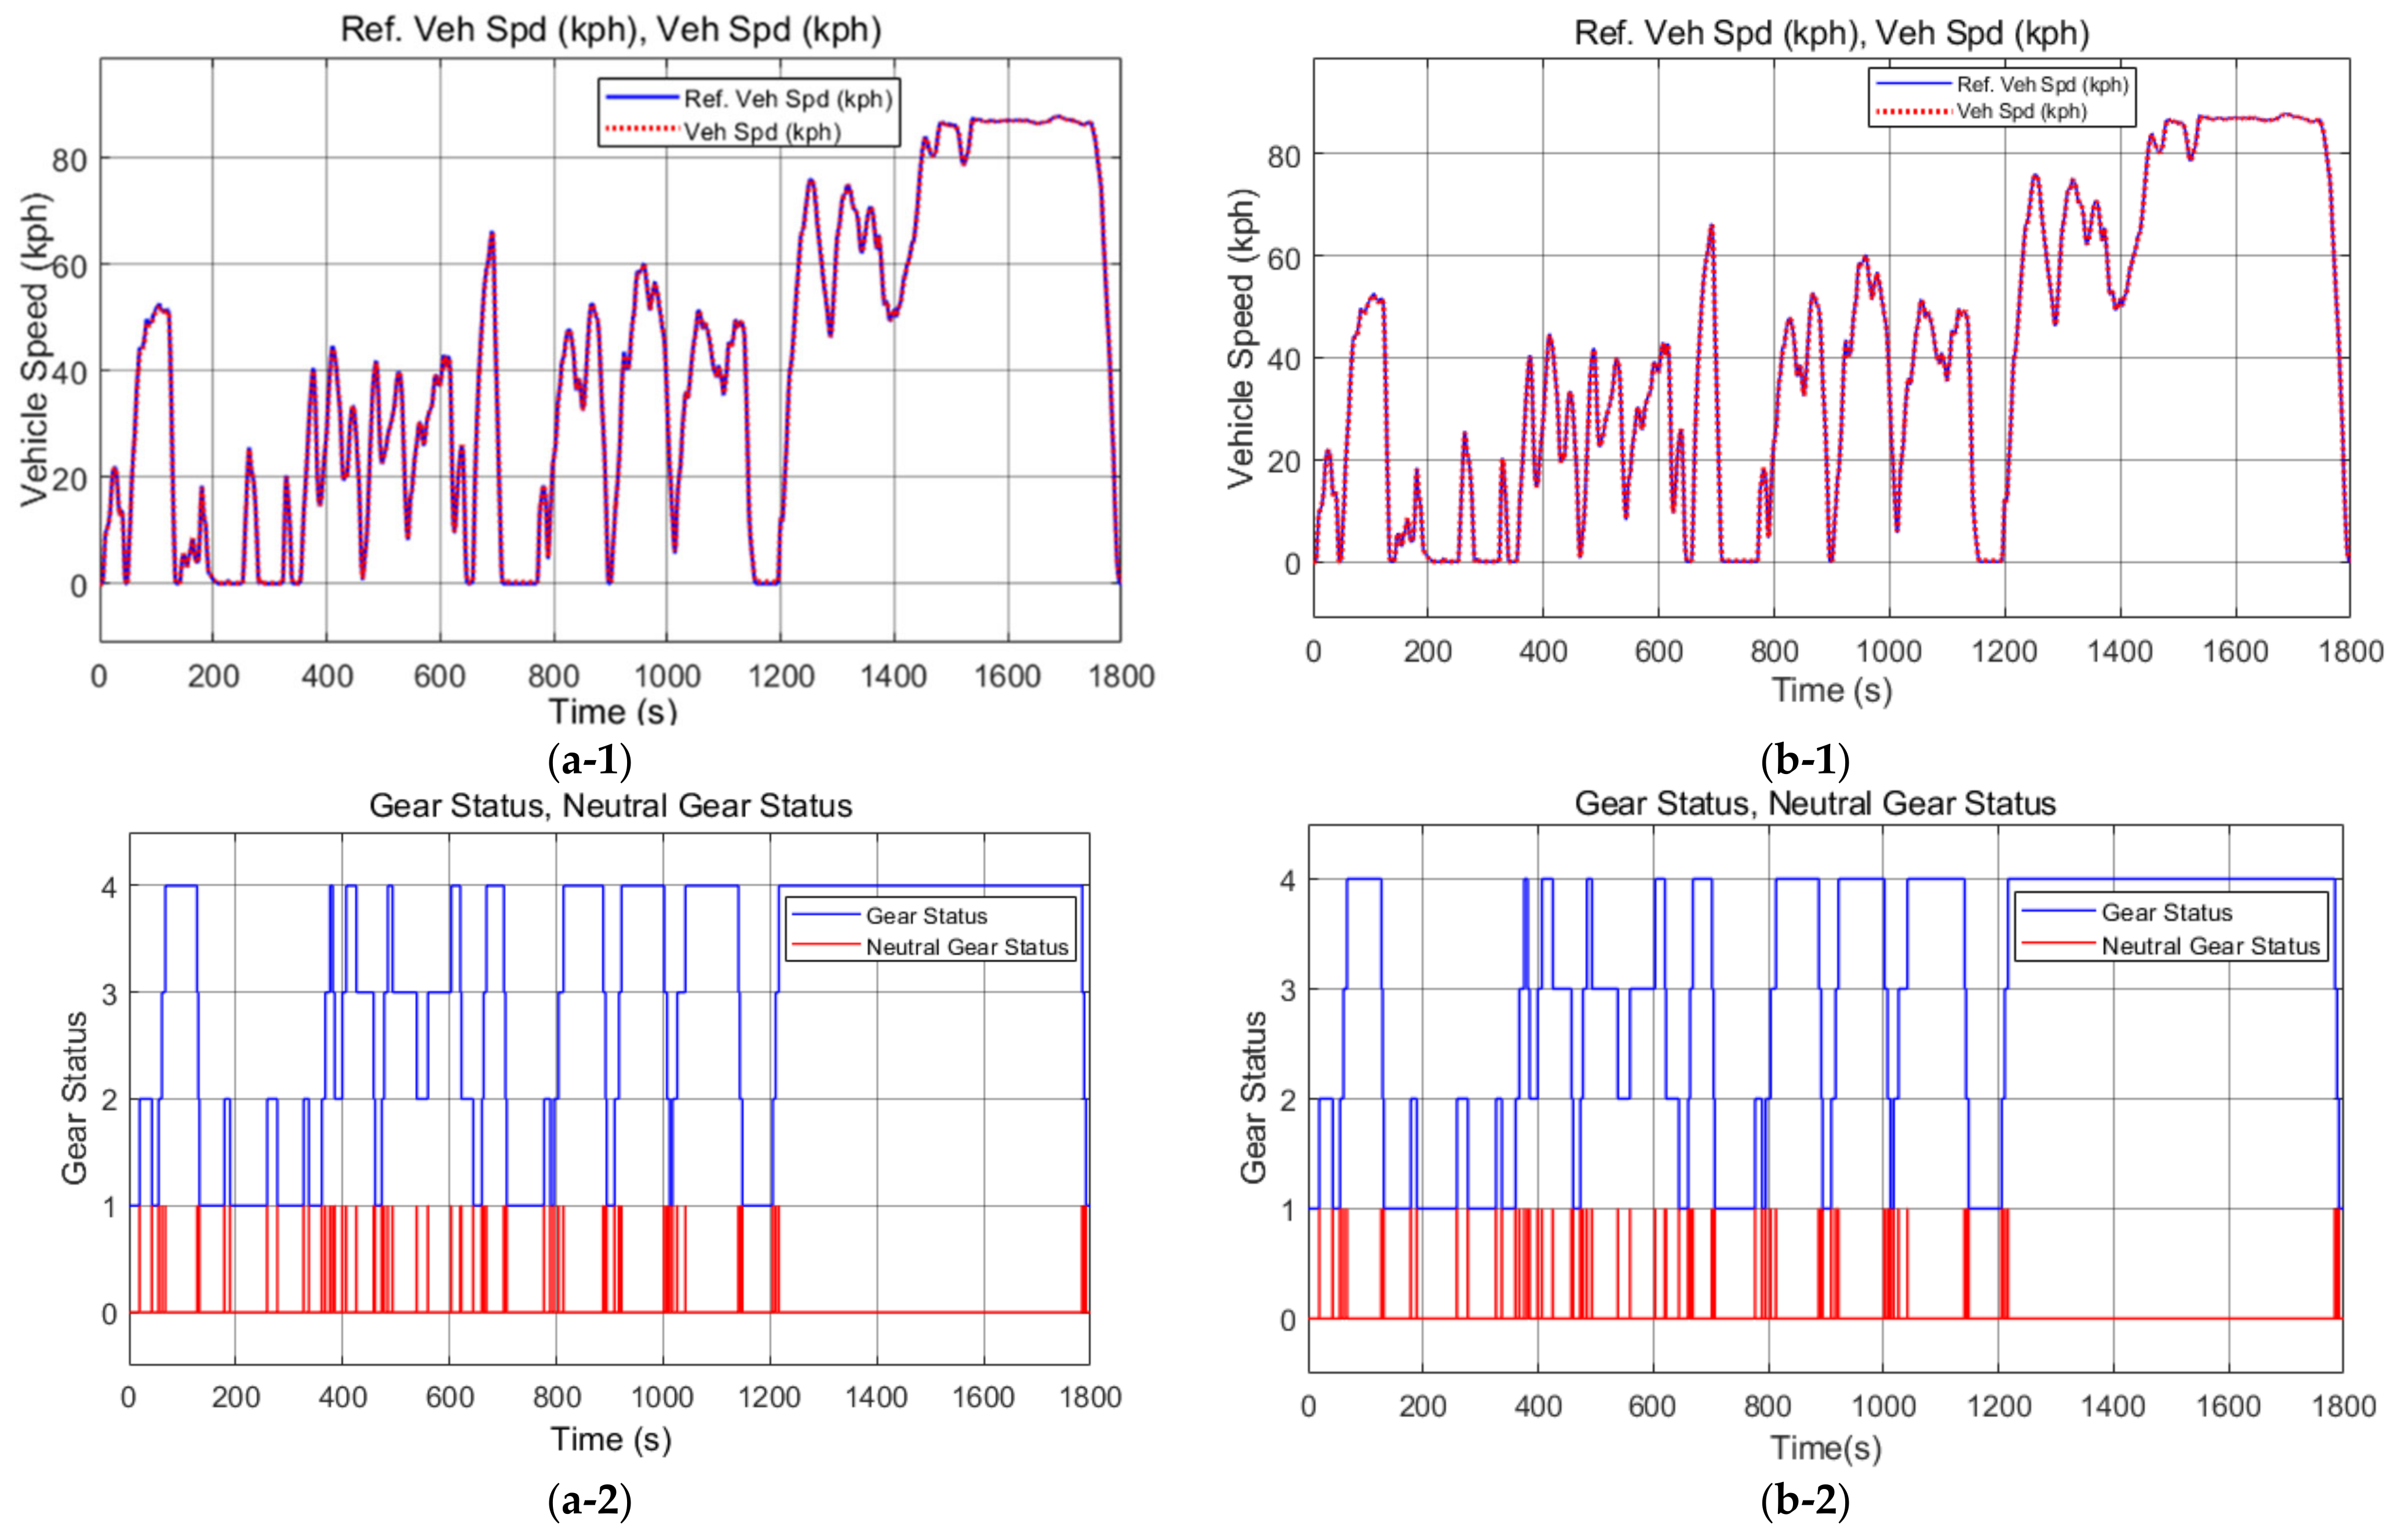
Furthermore, to understand the impact of the shifting time, the simulation was conducted with a reduced shifting time of 0.3 s, as applied in the 4-speed transmission with synchronizers. As depicted in Figure 24(a-3,b-3), the decrease in shifting time resulted in improved average fuel efficiency and reduced SOC consumption. The relatively small decrease in driving speed during the shifting period also contributed to a better RMS speed error.
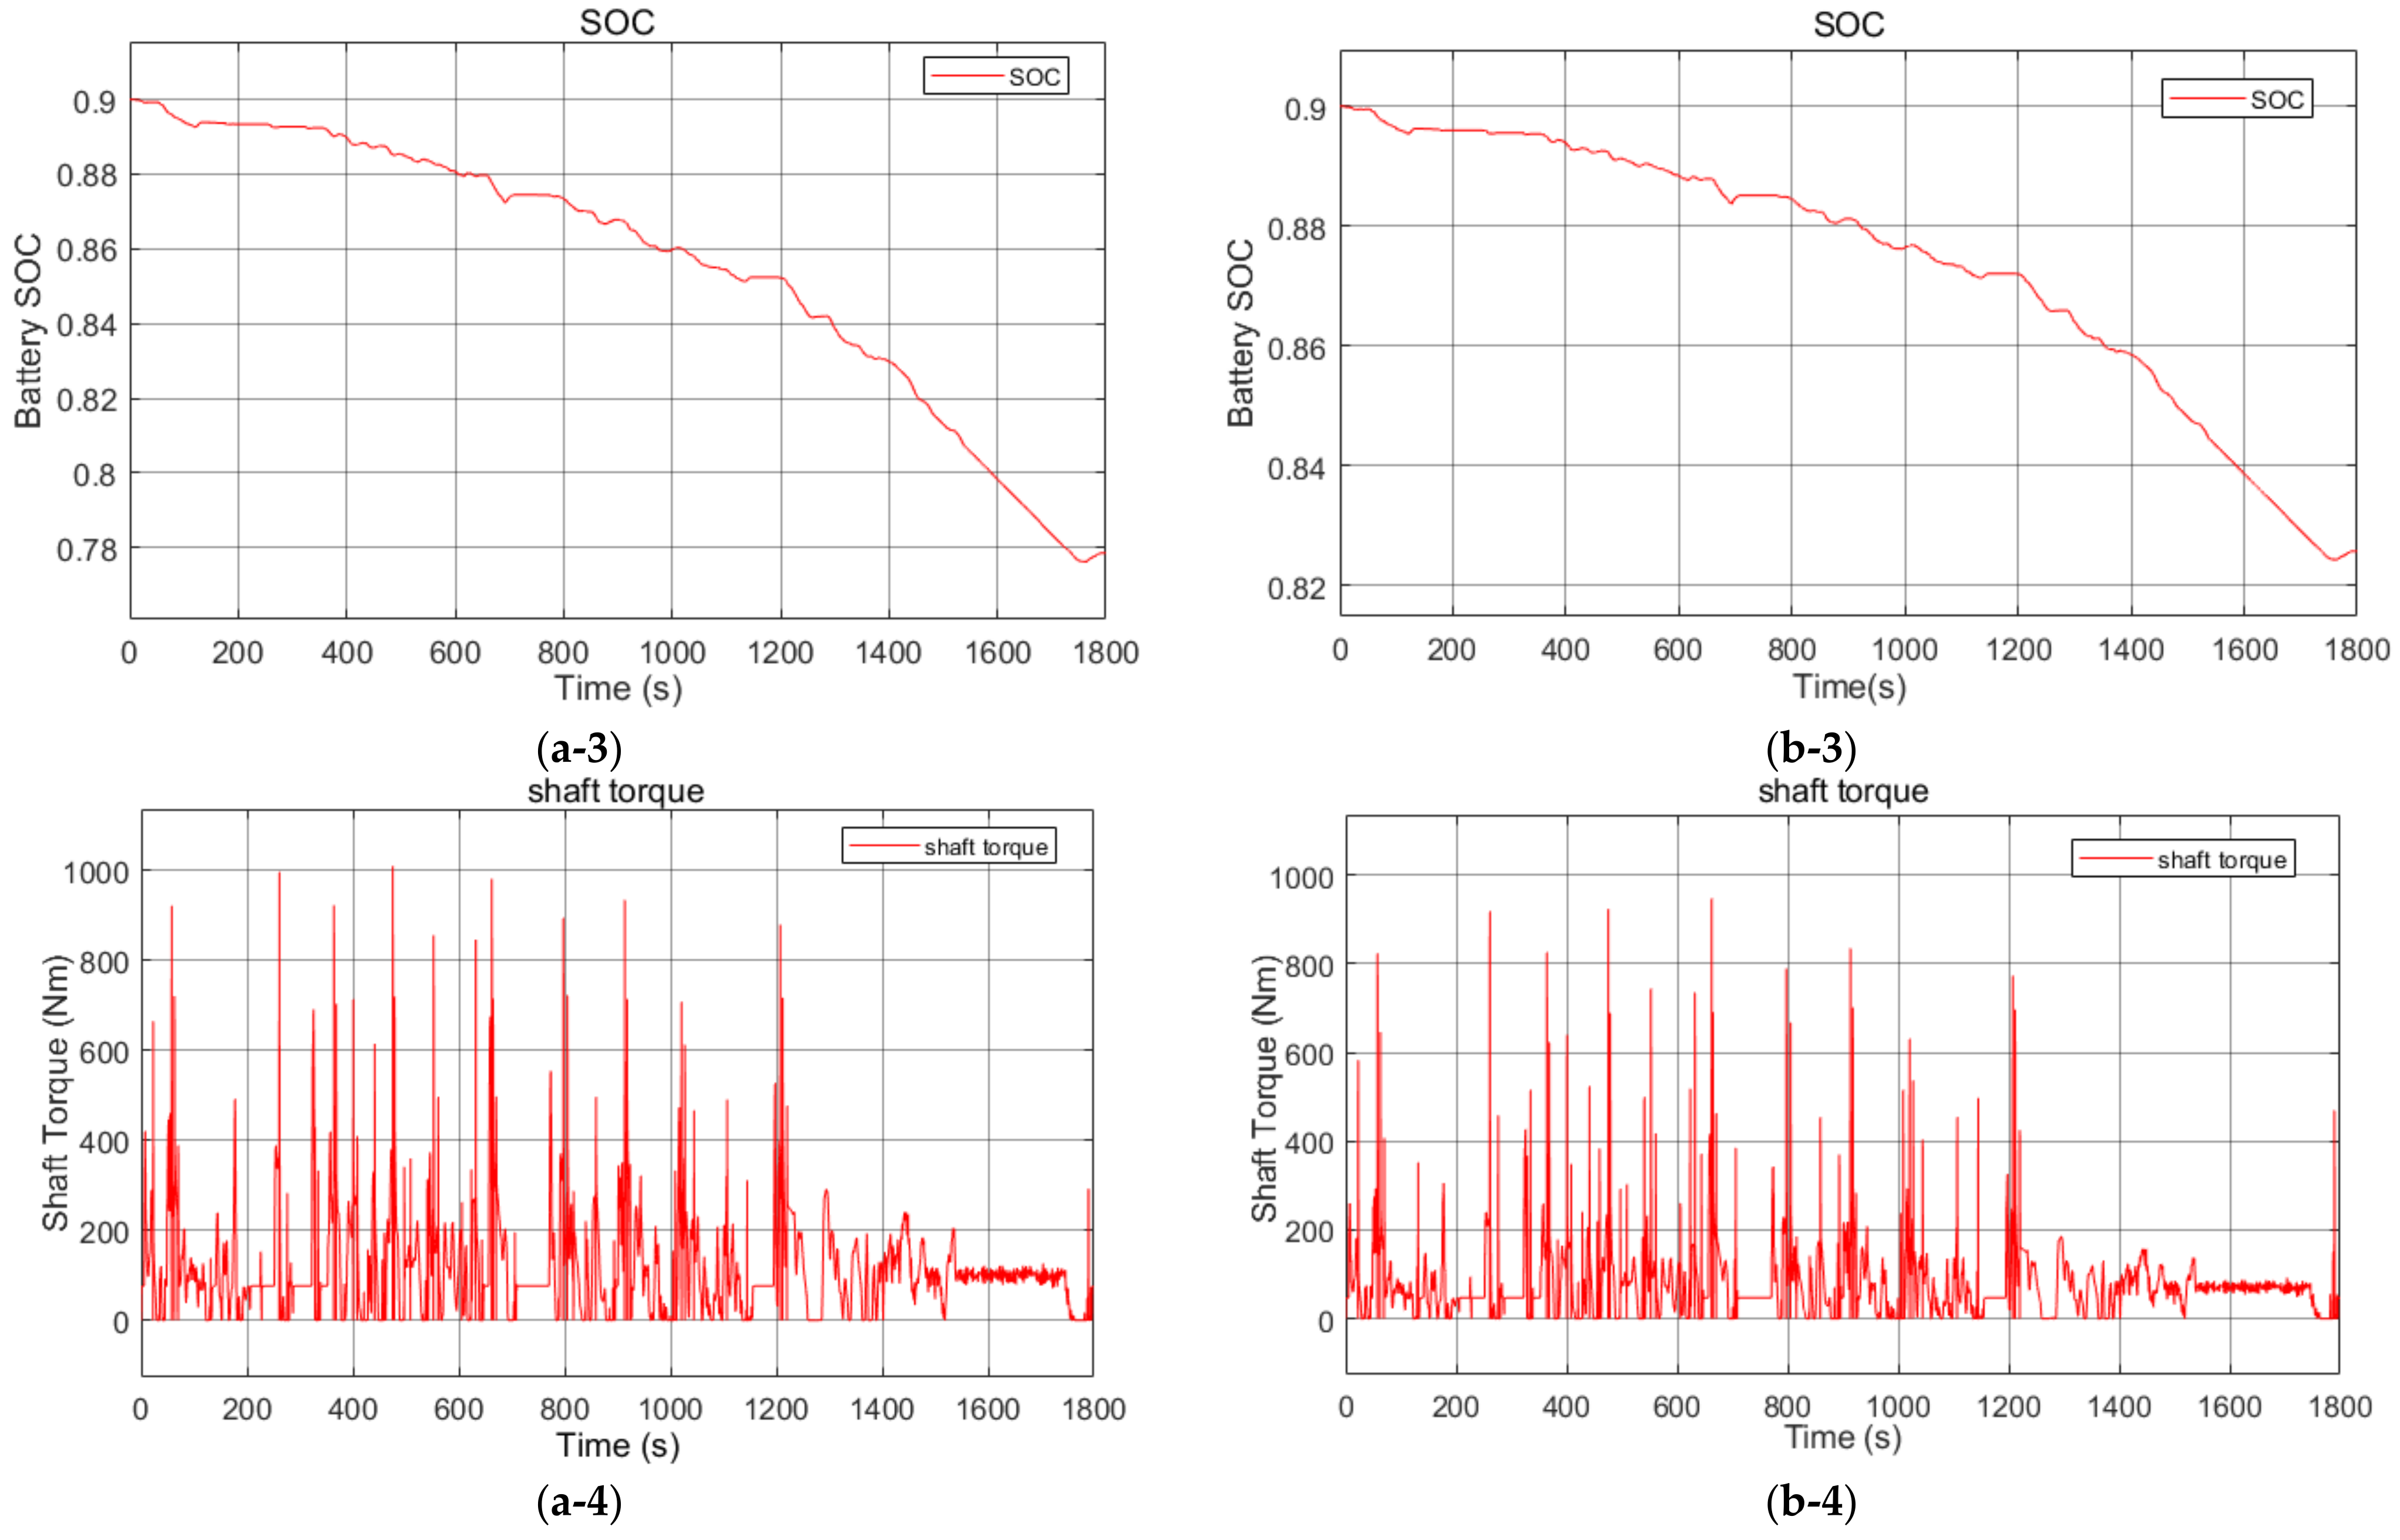
For the 4-speed transmission with synchronizers, the SOC showed a decrease from 90% to 78.15% with 2500 kg payload and 90% to 82.57% without payload, indicating a less significant decrease compared to the conventional pneumatic 4-speed AMT, as shown in Figure 25(a-3,b-3). Moreover, over the 1800 s of driving, the average fuel efficiency was 1.69 km/kWh with 2500 kg payload and 2.697 km/kWh without payload, presenting improvements of approximately 22.6% and 25.8% in overall efficiency compared to the conventional pneumatic 4-speed AMT. Also, the RMS of the speed error relative to the target speed also decreased to 0.03716 with 2500 kg payload and 0.02644 without payload, indicating about 62% and 61% improvements compared to the pneumatic 4-speed AMT. Through simulation, it was confirmed that the newly developed 4-speed transmission with synchronizers improved in terms of efficiency regardless of vehicle load conditions (Table 10).

4. Discussion and Conclusions

The combination of the motor and transmission has the most significant impact on efficiency from the perspective of the vehicle system. Particularly in commercial vehicles, where high torque and efficiency are crucial, research on multi-speed transmissions is actively pursued. In this paper, we conducted a comparative verification through simulation between the existing pneumatic 4-speed AMT designed for internal combustion engines and a newly developed 4-speed transmission with synchronizers, both installed in the target vehicle. To achieve this, experiments were conducted on vehicles equipped with existing components, as well as on prototype components, allowing for the acquisition of comparative data and design information.
The 4-speed transmission with synchronizers demonstrated significantly shorter shifting times compared to the conventional pneumatic AMT designed for internal combustion engines. The designed gear ratio tailored to the electric motor’s operating range contributed to an overall improvement in efficiency from a system perspective, as validated through simulations. Notably, it was observed that the gear ratio, designed in accordance with the motor’s operating range, influences overall system efficiency, irrespective of the shifting time.
The simulations discussed in this paper did not cover the efficiency of the inverter or transmission. However, it is anticipated that conducting efficiency tests on the inverter and transmission in the future would lead to more accurate simulations. Furthermore, when the efficiency of these components is considered, although the overall efficiency of the vehicle may decrease slightly compared to the current results, it is expected that the overall efficiency of the vehicle with the new transmission will be better than the existing transmission due to shorter shifting times and optimized gear ratios.
Through such a simulation verification environment, we can gain insights into the suitability of gear ratios and design goals for newly developed transmissions from a system perspective. Future research can delve into the dynamic behavior and control logic modeling of transmission components (synchronizers, gear teeth, shafts, etc.) to obtain more detailed data.
Additionally, the newly developed 4-speed transmission with synchronizers will be installed in the target vehicle to validate the performance of the transmission map. In this case, the performance of the transmission will be verified through real vehicle testing in terms of efficiency and performance aspects, using completed transmission, TCU and synchronizer engagement control logic, and motor rev-matching control, which were not applied in the simulation.

Author Contributions

Conceptualization, J.K.; methodology, J.K.; software, J.K.; validation, J.K.; formal analysis, J.K.; investigation, J.K.; resources, S.P.; data curation, J.K., Y.L. and S.P.; writing—original draft preparation, J.K.; writing—review and editing, H.J., S.P., S.-H.H.; visualization, J.K. and Y.L.; supervision, S.-H.H.; project administration, S.P.; funding acquisition, H.J and S.P. All authors have read and agreed to the published version of the manuscript.

Funding

This research was funded by the Ministry of Trade, Industry and Energy (MOTIE, Republic of Korea), grant P0018567.

Data Availability Statement

Data are contained within the article.

Conflicts of Interest

The authors declare no conflicts of interest.

References

  1. Kumar, M.S.; Revankar, S.T. Development scheme and key technology of an electric vehicle: An overview. Renew. Sustain. Energy Rev. 2017, 70, 1266–1285. [Google Scholar] [CrossRef]
  2. Zhang, W.; Fang, X.; Sun, C. The alternative path for fossil oil: Electric vehicles or hydrogen fuel cell vehicles? J. Environ. Manag. 2023, 341, 118019. [Google Scholar] [CrossRef]
  3. Nair, S.; Viri, R.; Mäkinen, J.; Pöllänen, M.; Liimatainen, H.; O’Hern, S. Effect of Policies to Accelerate the Adoption of Battery Electric Vehicles in Finland—A delphi Study. Future Transp. 2024, 4, 67–91. [Google Scholar] [CrossRef]
  4. Yun, S.; Yun, J.; Han, J. Development of a 470-Horsepower Fuel Cell–Battery Hybrid Xcient Dynamic Model Using SimscapeTM. Energies 2023, 16, 8092. [Google Scholar] [CrossRef]
  5. Martinez-Boggio, S.; Monsalve-Serrano, J.; García, A.; Curto-Risso, P. High Degree of Electrification in Heavy-Duty Vehicles. Energies 2023, 16, 3565. [Google Scholar] [CrossRef]
  6. Balazadeh Meresht, N.; Moghadasi, S.; Munshi, S.; Shahbakhti, M.; McTaggart-Cowan, G. Advances in Vehicle and Powertrain Efficiency of Long-Haul Commercial Vehicles: A Review. Energies 2023, 16, 6809. [Google Scholar] [CrossRef]
  7. Xin, W.; Zhang, Y.; Fu, Y.; Yang, W.; Zheng, H. A multi-objective optimization design approach of large mining planetary gear reducer. Sci. Rep. 2023, 13, 18640. [Google Scholar] [CrossRef] [PubMed]
  8. Yang, C.; Zha, M.; Wang, W.; Liu, K.; Xiang, C. Efficient energy management strategy for hybrid electric vehicles/plug-in hybrid electric vehicles: Review and recent advances under intelligent transportation system. IET Intell. Transp. Syst. 2020, 14, 702–711. [Google Scholar] [CrossRef]
  9. Konovalov, D.; Tolstorebrov, I.; Eikevik, T.M.; Kobalava, H.; Radchenko, M.; Hafner, A.; Radchenko, A. Recent Developments in Cooling Systems and Cooling Management for Electric Motors. Energies 2023, 16, 7006. [Google Scholar] [CrossRef]
  10. Poorfakhraei, A.; Narimani, M.; Emadi, A. A Review of Multilevel Inverter Topologies in Electric Vehicles: Current Status and Future Trends. IEEE Open J. Power Electron. 2021, 2, 155–170. [Google Scholar] [CrossRef]
  11. Mikhaylov, Y.; Aboelhassan, A.; Buticchi, G.; Galea, M. Considerations on the Development of High-Power Density Inverters for Highly Integrated Motor Drives. Electronics 2024, 13, 355. [Google Scholar] [CrossRef]
  12. Tian, S.; Wang, Y.; Wu, L. Parameters Matching and Effects of Different Powertrain on Vehicle: Performance for Pure Electric City Bus; SAE Technical Paper 2015-01-2799; SAE International: Pittsburgh, PA, USA, 2015. [Google Scholar]
  13. Fei, L.; Jian, S.; Shengnan, F.; Haijun, S.; Nguyen, T.S. Dynamic characteristics of a three-speed uninterrupted powertrain AMT. J. Tsinghua Univ. 2020, 61, 1–10. [Google Scholar]
  14. Ahssan, M.; Ektesabi, M.; Gorji, S. Electric Vehicle with Multi-Speed Transmission: A Review on Performances and Complexities. SAE Int. J. Altern. Powertrains 2018, 7, 169–181. [Google Scholar] [CrossRef]
  15. Vehviläinen, M.; Rahkola, P.; Keränen, J.; Pippuri-Mäkeläinen, J.; Paakkinen, M.; Pellinen, J.; Tammi, K.; Belahcen, A. Simulation-Based Comparative Assessment of a Multi-Speed Transmission for an E-Retrofitted Heavy-Duty Truck. Energies 2022, 15, 2407. [Google Scholar] [CrossRef]
  16. Shin, J.W.; Kim, J.O.; Choi, J.Y.; Oh, S.H. Design of 2-Speed Transmission For Electric Commercial Vehicle. IJAT 2014, 15, 145–150. [Google Scholar] [CrossRef]
  17. Gao, B.; Liang, Q.; Xiang, Y.; Guo, L.; Chen, H. Gear ratio optimization and shift control of 2-speed I-AMT in electric vehicle. Mech. Syst. Signal Process. 2015, 50, 615–632. [Google Scholar] [CrossRef]
  18. Walker, P.D.; Abdul Rahman, S.; Zhu, B.; Zhang, N. Modeling, Simulations, and Optimization of Electric Vehicle for Analysis of Transmission Ratio Selection. Sage journals. Adv. Mech. Eng. 2013, 5, 340435. [Google Scholar] [CrossRef]
  19. Wang, H.; Wang, B.; Pi, D.; Wang, E.; Wang, X. Two-Layer Structure Control of an Automatic Mechanical Transmission Clutch During Hill Start for Heavy-Duty Vehicles. IEEE Access 2020, 8, 49617–49628. [Google Scholar] [CrossRef]
  20. Mali, V.; Mache, A.; Mulik, R.; Ramdasi, S. Desing Methodology for Gear Shift Map of Automated Manual Transmission. IConAMMA 2017, 5, 23899–23907. [Google Scholar]
  21. Ngo, V.D.; Hofman, T.; Steinbuch, M.; Serrarens, A. Gear shift map design methodology for automotive transmission. J. Automob. Eng. 2014, 228, 50–72. [Google Scholar] [CrossRef]
  22. Hong, S.; Son, H.; Lee, S.; Park, J.; Kim, K.; Kim, H. Shift control of a dry-type two-speed dual-clutch transmission for an electric vehicle. J. Automob. Eng. 2016, 230, 308–321. [Google Scholar] [CrossRef]
  23. Han, J.H.; Jeong, H.U.; Hwang, S.H. Design of Gear Shift Map for Automatic Transmission considering Transmission Efficiency. Trans. Korean Soc. Automot. Eng. 2019, 27, 611–617. [Google Scholar] [CrossRef]
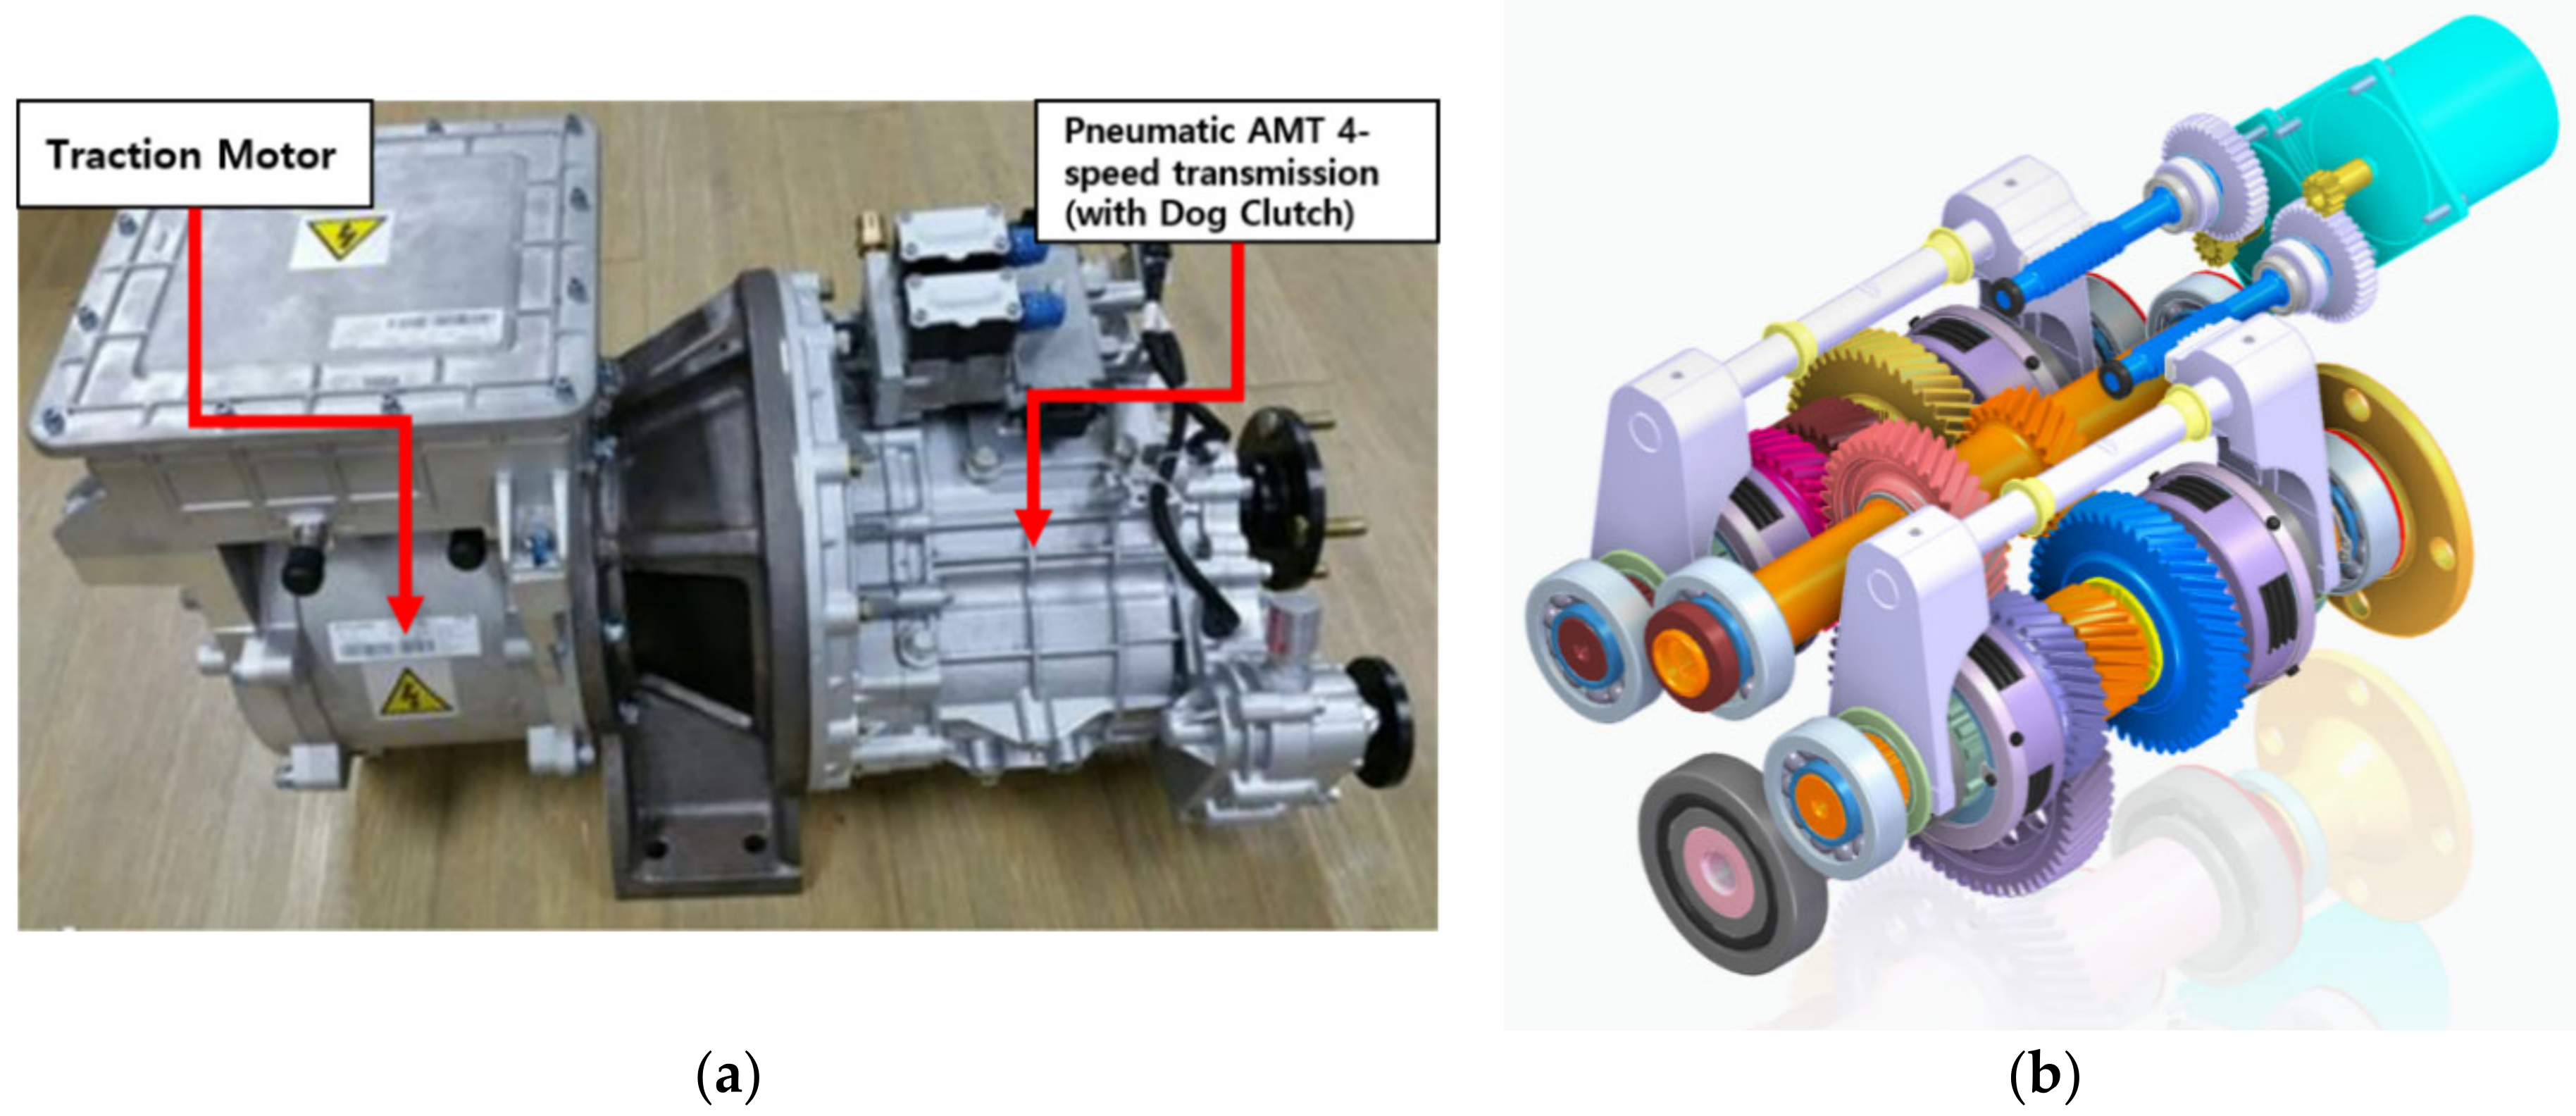
Figure 1. Each transmission system. (a) Pneumatic 4-speed automated manual transmission for internal combustion engines. (b) Newly developed 4-speed transmission with synchronizer.
Energies 17 01038 g001
Figure 2. Compact electric truck by MPS Korea.
Energies 17 01038 g002
Figure 3. Configuration of sensors for coast down test.
Energies 17 01038 g003
Figure 4. Test result: road load of target vehicle.
Energies 17 01038 g004
Figure 5. Configuration of vehicle test environment.
Energies 17 01038 g005
Figure 6. Measurement results of drive axle torque.
Energies 17 01038 g006
Figure 7. Measurement results of vehicle speed and gear status.
Energies 17 01038 g007
Figure 8. Configuration of 4-speed transmission with synchronizer test environment.
Energies 17 01038 g008
Figure 9. Unit characteristics test data of 4-speed transmission with synchronizer.
Energies 17 01038 g009
Figure 10. Free-body diagram of vehicle longitudinal dynamics.
Energies 17 01038 g010
Figure 11. T-N curve and efficiency map of drive motor.
Energies 17 01038 g011
Figure 12. Control strategy diagram for brake torque decision.
Energies 17 01038 g012
Figure 13. Motor torque output curve based on APS.
Energies 17 01038 g013
Figure 14. Speed profile of WHVC.
Energies 17 01038 g014
Figure 15. Control strategy diagram for APS and BPS distribution.
Energies 17 01038 g015
Figure 16. Strategy for developing shift map for 4-speed transmission with synchronizer.
Energies 17 01038 g016
Figure 17. Shift map for 4-speed transmission with synchronizer.
Energies 17 01038 g017
Figure 18. Configuration of simulation with MATLAB/Simulink.
Energies 17 01038 g018
Figure 19. Shift logic modeling diagram of pneumatic 4-speed AMT.
Energies 17 01038 g019
Figure 20. Shift logic modeling diagram of 4-speed transmission with synchronizer.
Energies 17 01038 g020
Figure 21. Simulation results with APS 60% input. (a) Vehicle speed and gear status of simulation results with pneumatic 4-speed AMT; (b) Vehicle speed and gear status of simulation results with 4-speed transmission with synchronizer.
Energies 17 01038 g021
Figure 22. Simulation results with speed profile input of WHVC. (a) Vehicle speed and gear status of simulation results with pneumatic 4-speed AMT; (b) vehicle speed and gear status of simulation results with 4-speed transmission with synchronizer.
Energies 17 01038 g022
Figure 23. Simulation results—pneumatic 4-speed AMT with 1.5 s shift delay. (a-x) With 2500 kg payload; (b-x) without payload; (x-1) vehicle speed vs. ref. speed; (x-2) current gear status; (x-3) battery SOC; (x-4) shaft driving torque.
Energies 17 01038 g023aEnergies 17 01038 g023b
Figure 24. Simulation results—pneumatic 4-speed AMT with 0.3 s shift delay. (a-x) With 2500 kg payload; (b-x) without payload; (x-1) vehicle speed vs. ref. speed; (x-2) current gear status; (x-3) battery SOC; (x-4) shaft driving torque.
Energies 17 01038 g024aEnergies 17 01038 g024b
Figure 25. Simulation results—4-speed transmission with synchronizers with 0.3 s shift delay. (a-x) With 2500 kg payload; (b-x) without payload; (x-1) vehicle speed vs. ref. speed; (x-2) current gear status; (x-3) battery SOC; (x-4) shaft driving torque.
Energies 17 01038 g025aEnergies 17 01038 g025b
Table 1. Specifications of each transmission.
SpecificationPneumatic 4-Speed AMT4-Speed Transmission with Synchronizers
Locking mechanismDog clutchTwo synchronizers
1st Gear ratio4.01:15.655:1
2nd Gear ratio2.33:13.7925:1
3rd Gear ratio1.51:12.552:1
4th Gear ratio1:11.739:1
Final drive ratio6.14:1
Table 2. Compact electric truck specifications.
Vehicle Spec.Data
C.V.W4000 kg
G.V.W6500 kg
Payload capacity2500 kg
Size(b) 2080 mm (h) 2345 mm (L) 5370 mm
Table 3. Coast down test condition.
Test Condition
Vehicle weight 4100 kg (Included person and test equipment)
Coast down velocity75 kph to 15 kph
Test locationS.M PG (proving ground)
Temperature11.5 °C
Maximum wind velocity9.5 km/h
Average wind velocity4.1 km/h
Table 4. Coast down test results.
DataResult
Driving resistance equation m v e h a = A + B v + C v 2
A468.271 N
B−0.95447 N/kph
C0.1820732 N/ k p h 2
Table 5. Test conditions to acquire shift map and shift delay time.
Test ConditionAPSRoad Gradient
From 10 kph, full accel.From 10 kph—100%0%
From 30 kph, full accel.From 30 kph—100%0%
From 50 kph, full accel.From 50 kph—100%0%
Ramp100%6%
Ramp100%12%
Real road drivingVariationVariation
Table 6. List of sensors and signals for test to shift map and shifting time.
Sensor TypeLocationSignal
Torque sensorShaft axleTorque of axle (Nm)
IMU sensorMass center of vehicleXYZ Accel. (g), XYZ angular rate (rad/s)
Strain gaugeShaft axleStrain (V)
TachometerShaft axleRotation speed (RPM)
GPSTop of vehicle capVehicle speed (m/s), vehicle position (m)
Table 7. Vehicle dynamic constants.
ConstantsDescriptionData
M v e h Vehicle massC.V.W: 4000 kg
G.V.W: 6500 kg
G f i n a l Final drive ratio6.14
R t i r e Effective rolling radius0.368 m
C d Drag of coefficient0.3
ρAir density1.16 k g / m 3
A F Front projection area3.902 m 2
f r o l l Coefficient of rolling resistance0.02
Table 8. High-voltage battery specification.
Battery Spec.Data
Battery cellLi-ion 21700
Battery configuration96S 72P
Nominal voltage350 V
Battery capacity360 Ah
V o c Number of cells × Li-ion cell voltage
R b a t 0.5 Ω
Q b a t 100 kWh
Table 9. Specifications of drive motor.
Motor Spec.Data
Maximum torque320 Nm @300 RPM
Nominal torque157 Nm @300 RPM
Maximum power100.4 kW @3600 RPM
Nominal power60 kW @12,000 RPM
Table 10. Simulation results comparison of pneumatic ATM and transmission with synchronizers.
Simulation
Results
Pneumatic 4-Speed AMT
(with 1.5 s Shift Delay)
Pneumatic 4-Speed AMT
(with 0.3 s Shift Delay)
4-Speed Transmission with Synchronizers
With 2500 kg payload
Average fuel efficiency
(km/kWh)
1.3781.5331.69
Battery SOC (%)90% > 75.46%90% > 76.93%90% > 78.15%
Speed error, RMS0.098410.048240.03716
Without payload
Average fuel efficiency
(km/kWh)
2.1432.5332.697
Battery SOC,(%)90% > 80.65%90% > 82.09%90% > 82.57%
Speed error, RMS0.069180.032030.02644
Disclaimer/Publisher’s Note: The statements, opinions and data contained in all publications are solely those of the individual author(s) and contributor(s) and not of MDPI and/or the editor(s). MDPI and/or the editor(s) disclaim responsibility for any injury to people or property resulting from any ideas, methods, instructions or products referred to in the content.